ARTICLE   Open Access    

De novo assembly of the sweet pitaya (Stenocereus thurberi) fruit peel transcriptome and identification of cuticle biosynthesis genes

More Information
  • Stenocereus thurberi is a cactus endemic to the Sonoran desert (Mexico), which produces a fruit named sweet pitaya. One trait that allows the cactus to survive in desert ecosystems is its cuticle, which limits water loss in dry conditions. Nevertheless, the mechanism of cuticle biosynthesis has yet to be described for cactus fruits. Also, transcripts from S. thurberi published in the databases are scarce. This study reports the de novo assembly of the sweet pitaya peel transcriptome. The assembly includes 174,449 transcripts with an N50 value of 2,110 bp. Out of the total transcripts, 43,391 were classified as long non-coding RNA. Functional categorization analysis suggests that mechanisms of response to stress and cuticle biosynthesis are carried out in fruit pitaya peel. The transcripts coding for a cytochrome p450 77A (StCYP77A), Gly-Asp-Ser-Leu motif lipase/esterase 1 (StGDSL1), and ATP binding cassette G 11 (StABCG11), which carried out the synthesis, polymerization, and transport of cuticle components, respectively, were identified. Expression analysis during fruit development suggests an active cuticle biosynthesis at the early stages and the ripe stages, carried out by StCYP77A, StGDSL1, and StABCG11. The dataset generated here will help to improve the elucidation of the molecular mechanism of cuticle biosynthesis in S. thurberi and other cactus fruits.
  • Sweet cherries (Prunus avium L.) are a major focus of agriculture in the Okanagan region of British Columbia (BC), Canada. A large portion of the cherries grown in BC are exported and undergo up to four weeks of storage during transportation before delivery and consumption[1]. In 2022, sweet cherries accounted for 11.6% of the revenue of exported fruit from Canada and have an export value of nearly CAD$130 million[2]. As such, sweet cherry is an important fruit with high commercial importance for Canada. Although the application of cold storage is a necessary postharvest tool to maintain fruit quality up to consumption, there are preharvest factors that impact quality after longer-term storage. The work of Serrano et al.[3] noted that the maturity stage at harvest determined the fruit quality of sweet cherries after storage. For this reason, producers use several parameters to establish the optimum time for harvesting. Producers have long used colour as a marker for maturity, yet the concept of fruit dry matter (DM) at harvest affecting post-storage quality has advanced[46]. In fact, Toivonen et al.[6] developed a predictive model for 'Lapins' sweet cherry DM content using a visible/near-infrared spectrometer and noted its potential application to other cultivars to provide a rapid and non-destructive means of determining DM linked to cherry fruit quality. If sweet cherries are harvested at the wrong time or stored improperly during transit the quality of the cherries at their final destination does not compare to that at the time of harvest. Therefore, it is of the utmost importance to harvest cherries at their optimal time to ensure quality retention. Cherry fruits have minimal reserve carbohydrates so respiration relies primarily upon organic acids[7]. Additionally, cherries have a high susceptibility to physical damage making them highly perishable, so it is imperative to store them properly to maintain their flavour profile and overall quality[811]. Lower respiration rates help to maintain higher titratable acidity (TA) levels, thereby retaining flavour quality[11,12]. Decreased respiration rates are achieved through low-temperature storage and shipping.

    Previous research linking cherry fruit maturity to flavour quality indicated early-harvested cherries with low soluble solids (SS) levels showed low consumer acceptance due to perceived low sweetness, while late-harvested cherries showed low consumer acceptance due to poor texture[13,14]. This information underscores the challenge growers face when determining picking date. Additionally, once cherries are harvested, quality changes occur which include changes in the balance of SS to TA levels. Previous work has shown that SS levels remain relatively constant while malic acid levels (the predominant acid in sweet cherries) decreased by 20% when stored for 4 d at 20 °C[8,14]. Further, SS, TA, and the SS/TA ratio are key parameters in defining flavour quality[15] and consumer acceptance[14] as SS and TA have been reported to be measures of the cherry fruit attributes of sweetness, and sourness, respectively. Additionally, the SS/TA ratio is regarded as an overall taste attribute determining sweet cherry acceptability[14,16,17].

    Depending on cultivar and growing location, SS values for sweet cherries have been reported to range from 12.3 to 23.7 °Brix[14]. Rootstock and storage conditions have also been reported to affect SS, TA, and SS/TA values[18]. Depending on rootstock, for 'Regina' sweet cherries, harvest SS values ranged from 14.8 to 16.6 °Brix and TA values ranged from 5.7 to 7.4 g·L−1, while SS values after storage ranged from 14.6 to 18.2 °Brix and TA values ranged from 4.4 to 6.0 g·L−1. The harvest SS/TA ratio ranged from 2.0 to 2.91 and the SS/TA ratio after storage ranged from 2.47 to 3.77 depending on rootstock. Based on sensory studies using various cherry cultivars and breeding selections to gauge flavour quality and consumer acceptance, the optimal SS/TA ratio was reported to be between 1.5 and 2.0, with SS values ranging between 17 and 19 °Brix[19].

    Unfortunately, members of British Columbia's sweet cherry industry have noted that while their cherries arrive at their export locations with good condition in terms of appearance (i.e. firm, shiny, with green stems), issues have been reported concerning flavour. Poor flavour has been associated with lower levels of TA and lower oxygen in the storage atmosphere. Our previous work noted that BC cherry growers tend to pick their cherries at lighter colours in an attempt to harvest the crop as soon as possible to avoid any weather or pest issues and achieve the highest yield possible[1]. Staccato (SC) is a late maturing economically important cultivar with little research data available. It has been reported that SC cherries have a respiration rate that is negatively correlated with colour when collected between a 2 to 6 colour level as determined with CTFIL (Centre Technique Interprofessionnel des Fruit et Legumes, Paris, France) colour chips[1], which have been typically used as a marker of maturity. For SC cultivars, data showed the lowest respiration levels with cherries harvested at CTFIL colour standards 4-5, and may potentially have better flavour quality retention due to these lower respiration rates[1]. The aim of the work was to: 1) examine indicators of maturity/readiness for harvest (colour, SS, DM, TA, and the ratio of soluble solids to titratable acidity (SS/TA)); and 2) determine whether colour at harvest or other parameters (SS, TA, SS/TA, and DM) better predict flavour quality retention after storage.

    Sweetheart (SH), Staccato (SC), and Sentennial (SL) sweet cherries were sourced from research plots located at the Summerland Research and Development Center (SuRDC, Summerland, BC, Canada) in the Okanagan Valley region of British Columbia over three growing seasons (2018, 2019, and 2021). In the 2018 growing season, two cherry cultivars (SH and SC were collected, in the 2019 growing season, in response to BC Cherry Association interest, three cherry cultivars (SH, SC, and SL) were collected. Due to COVID, data was not collected during the 2020 growing season. In the 2021 growing season, full data (SS, TA, DM, and respiration rate) was only collected on the SC cherry cultivar, while DM and respiration values at harvest were also collected for SH and SL cultivars.

    To collect fruit at different maturity levels, cherry fruits were collected at three different color levels using the CTFIL (Centre Technique Interprofessionnel des Fruit et Legumes, Paris, France) colour standard series at three harvest dates for each cultivar which corresponded to the 3-4, 4-5, and 5-6 colour levels.

    To collect environmental data, two trees were chosen in each orchard block and Onset HOBO (Bourne, MA, USA) temperature and humidity loggers were mounted in these trees as described by Ross et al.[1] and captured data at 10 min intervals. The temperature and humidity data were used to calculate average temperature (AT), average high temperature (AHT), average low temperature (ALT), and average relative humidity (ARH) for 28 d preceding the cherry harvest date.

    Cherries were generally harvested before 11:00 h on each harvest day. Harvested cherries were transported back to the lab for sorting, sampling, and storage. Upon arrival, cherries were placed into a walk-in cooler at 0.5 °C to mimic rapid hydro-cooling capabilities that the industry uses. In the afternoon of each harvest day, cherries were removed from the cooler and sorted following British Columbia Tree Fruits Company protocol: (i) size was greater than 25.4 mm (< 10.5 row size); (ii) stemless cherries were removed; and (iii) cherries with defects such as blemishes, splits, pitting, disease (rot, fungi), hail damage and insect damage were removed. Again, the colour of the cherries was assessed using the CTFIL colour standard series. Based on the harvest period, cherries were separated into different colour levels: 3-4, 4-5, and 5-6. For each colour category, quality assessments (DM, SS, TA, SS/TA ratio, firmness, size, stem pull force, stem shrivel, stem browning, pitting, and pebbling) were performed before and after storage.

    Maintaining the quality of sweet cherries undergoing long distance ocean container shipment (up to 28 d/4 weeks) is important for securing a successful export market for Canadian sweet cherries and for ensuring that current market demand is met[1]. For cherries to be marketable after storage, they must pass several quality attributes. Attributes of firmness, size, stem pull force, stem shrivel, stem browning, pitting, and pebbling were assessed using previously described methods[1,20] to assess fruit quality at harvest and after storage for 28 d at 0.5 °C, ideal refrigerated storage temperature, for all cherry cultivars, and also storage for 28 d at 3 °C, non-ideal refrigerated storage temperature, for SC cherries. The values of these parameters are provided in Supplementary Tables S1S6. As the focus of this work was to examine how maturity level at harvest influenced the flavour quality of SC, SH, and SL sweet cherry cultivars, SS, DM, TA, and respiration rate values were the focus for discussion. Respiration analysis was performed using methods described by Ross et al. on freshly harvested cherries[1]. Rates of CO2 production were expressed as mg CO2 kg−1·h−1.

    DM of the cherries was determined using a Felix F750 handheld spectrometer (Felix Instruments, Inc., Camas, WA, USA) loaded with a valid model developed at the Summerland Research and Development Centre for cherries[6]. DM was measured on 25 fruits that were randomly selected from each sample replicate (i.e. 50 cherries). For SS and TA analyses, the methods of Ross et al.[1,20] were used to test 25 fruits that were randomly selected from each sample replicate (i.e. 50 cherries). Briefly, de-stemmed cherries were transferred into a 15.2 cm × 22.9 cm polyethylene Ziplock bag. The bag was left partially open, and the cherries were pressed by hand to obtain juice. The juice was strained and collected into 60 mL polypropylene screw cap containers. The resulting filtrate was tested for SS (°Brix), and TA (g·L−1 malic acid). For SS determination, the refractive indices of the solutions were observed in °Brix temperature-corrected mode on a digital refractometer (Mettler-Toledo, Refracto 30PX, 13/02, LXC13237, Japan). An automated titrator (Metrohm 848 Tritrino Plus; Mississauga, ON, Canada) was used to measure the TA of 10 mL of the juice with 65 mL distilled water to an endpoint of 8.1 with 0.1 mol·L−1 NaOH.

    At each colour level (3-4, 4-5, or 5-6) 10 kg of cherry samples were cooled to either 0.5 or 3 °C (for SC in 2021) and then packed into cardboard boxes with a polyethylene liner, an absorbent pad, and an iButton (Thermodata, Whitewater, WI, USA), which measured temperatures experienced by the cherries in the cardboard boxes during storage. After 28 d, the same quality assessment tests were performed to see if values varied throughout storage time at each temperature.

    Statistical analysis was conducted using SAS Institute Inc. software version 9.3 (SAS Institute, Cary, NC, USA). Data were subjected to a four-way analysis of variance (ANOVA) using the SAS PROC GLM procedure. The four factors tested were colour level (3-4, 4-5, and 5-6), cultivar (SH, SC, and SL), growing year (2018, 2019, and 2021), and time (harvest or storage (0.5 °C)). The significance of the main effects and interaction of the four factors was determined using Type III sum of squares via the ANOVA test. Additionally, ANOVA using the SAS PROC GLM procedure was performed on data collected for SC cultivar in the 2021 growing year to assess the influence on storage temperature (0.5 and 3 °C) on quality parameters. Statistical significance was determined by least significant difference (LSD) Fisher's test at 5% significance level. Principal Component Analysis (PCA) was performed using SAS version 9.3 PROC PRINCOMP (SAS Institute Inc., Cary, NC, USA) on data collected from the three cultivars over the tested growing years at three colour levels (i.e., up to nine samples per cultivar) and 10 variables for each investigation. Variables included: AT, AHT, ALT, ARH, colour at harvest (ColourH), SS at harvest (SSH), SS after 28 d of storage at 0.5 °C (SS05), TA at harvest (TAH), TA after 28 d of storage at 0.5 °C (TA05), and DM of cherry fruit at harvest (DMH). Microsoft Excel was used to generate PCA plots from the data provided by SAS. Only data available for every growing year were included in the PCA. Correlation coefficients were determined using Pearson's correlation coefficient statistical function in Excel (version 2306, Microsoft, Redmond, WA, USA). Histograms and frequency data were generated using the statistical function in Excel (version 2306, Microsoft, Redmond, WA, USA). Dry matter bin sizes of 1.5% increments were used to present and analyze the histogram and frequency data.

    Tables 14 present data on flavour attributes via values of soluble solids (SS), titratable acidity (TA), SS/TA ratio, and dry matter (DM) as affected by cultivar, growing year, storage and colour level at harvest and after storage, respectively. The most influential parameters in sweet cherry flavour have been found to be SS, TA, and the SS/TA ratio[15]. Additionally, SS and TA values have been found to be related to DM values in kiwis[2124], apples[25], and cherries[6,26]. DM is a measure of solids which includes both soluble sugars and acids along with insoluble structural carbohydrates and starch. Crisosto et al.[4] proposed using DM as an additional quality parameter as DM was determined not to change during cold storage[22]. Toivonen et al.[6] have performed research linking dry matter measurements with sweet cherry quality. As cold storage is also used to maintain cherry quality, assessing DM at harvest and upon storage was of relevance, and a key aspect of this work was to examine how DM values relate to sweet cherry respiration rates and cherry quality parameters.

    Table 1.  Soluble solids values as affected by cultivar, growing year, storage, and colour level at harvest.
    Cultivar Colour level Soluble solids (SS, °Brix)
    2018 2019 2021
    Harvest Storage (0.5 °C) Harvest Storage (0.5 °C) Harvest Storage (0.5 °C) [3 °C]
    Sweetheart 3-4 18.1aA1 17.7aA1 18.1aA1 18.2aA1
    4-5 20.0bA1 19.8bA1 19.4bA1 18.8bA1
    5-6 21.9cA1* 21.1cA1* 19.9bA1* 19.6cA1*
    Staccato 3-4 17.2aA2 17.2aA1 17.1aA2 17.2aA1 18.8aA* 18.9aA*
    18.4a
    4-5 17.8aA2 17.9aA2 18.3bA23 18.1bA1 19.9bA* 18.6aB
    18.9ab
    5-6 20.2bA2 17.9aB2* 20.2cA1 20.3cA13 20.1bA 19.5aA
    19.7b
    Sentennial 3-4 18.1aA1 18.1aA1
    4-5 18.9bA13 18.5aA1
    5-6 20.8cA2 20.6bA23
    Main effects Significance F-value Degrees of freedom
    Cultivar p < 0.0001 36.90 2
    Colour level p < 0.0001 125.76 2
    Year p < 0.0001 9.26 2
    Time (harvest or storage at 0.5 °C) p = 0.0002 13.68 1
    Colour differences: within common time and cultivar, values followed by different lower case letters indicate significant differences (p ≤ 0.05); Cultivar differences: within common colour level and time, values followed by different numbers indicate significant differences (p ≤ 0.05); Growing year differences: within common time, colour level and cultivar, values followed by * indicate significant differences (p ≤ 0.05); Storage differences (Harvest versus 0.5 °C storage): within common cultivar, colour level and growing year, values followed by different uppercase letter indicate significant differences (p ≤ 0.05); Temperature differences: within Staccato cultivar at 28 d storage and at common colour level, bolded values indicate significant differences (p ≤ 0.05) between storage temperatures (0.5 °C vs 3 °C). (N.B. no bolded values appear in this table).
     | Show Table
    DownLoad: CSV
    Table 2.  Titratable acidity values as affected by cultivar, growing year, storage and colour level at harvest.
    Cultivar Colour level Titratable acidity (TA, g·L−1 malic acid)
    2018 2019 2021
    Harvest Storage (0.5 °C) Harvest Storage (0.5 °C) Harvest Storage (0.5 °C) [3 °C]
    Sweetheart 3-4 8.99aA1* 7.11aB1* 7.31aA1* 6.31aB1*
    4-5 9.55bA1* 7.57bB1* 7.14aA1* 6.13aB1*
    5-6 10.56cA1* 8.57cB1* 7.56aA1* 6.50aB1*
    Staccato 3-4 8.53aA2* 6.65aB2* 6.96aA1* 5.51aB2* 12.0aA* 10.5aB*
    9.7a
    4-5 8.87abA2* 7.04bB2* 7.30aA1* 6.21bB1* 12.8aA* 10.2aB*
    9.3a
    5-6 8.91bA2* 6.91abB2 7.18aA1* 6.46bB1 10.6bA* 9.5b*
    8.5b
    Sentennial 3-4 9.21acA2 7.60aB3
    4-5 9.33aA2 7.89aB2
    5-6 8.79bcA2 7.66aB2
    Main effects Significance F-value Degrees of freedom
    Cultivar p < 0.0001 193.58 2
    Colour level p = 0.0023 5.49 2
    Year p < 0.0001 1,007.20 2
    Time (harvest or storage at 0.5 °C) p < 0.0001 474.18 1
    Colour differences: within common time and cultivar, values followed by different lower case letters indicate significant differences (p ≤ 0.05); Cultivar differences: within common colour level and time, values followed by different numbers indicate significant differences (p ≤ 0.05); Growing year differences: within common time, colour level and cultivar, values followed by * indicate significant differences (p ≤ 0.05); Storage differences (Harvest versus 0.5 °C storage): within common cultivar, colour level and growing year, values followed by different uppercase letter indicate significant differences (p ≤ 0.05); Temperature differences: within Staccato cultivar at 28 d storage and at common colour level, bolded values indicate significant differences (p ≤ 0.05) between storage temperatures (0.5 °C vs 3 °C).
     | Show Table
    DownLoad: CSV
    Table 3.  Soluble solids to titratable acidity ratio values as affected by cultivar, growing year, storage and colour level at harvest.
    Cultivar Colour level Soluble solids to titratable acidity ratio (SS/TA)
    2018 2019 2021
    Harvest Storage (0.5 °C) Harvest Storage (0.5 °C) Harvest Storage (0.5 °C) [3 °C]
    Sweetheart 3-4 2.02a1A* 2.49a1B* 2.49a1A* 2.78a1B*
    4-5 2.09a1A* 2.61a1B* 2.71b1A* 3.06b1B*
    5-6 2.07a1A* 2.46a1B* 2.63b1A* 3.02b1B*
    Staccato 3-4 2.01a1A* 2.58a1B* 2.46a1A* 3.11a2B* 1.57aA* 1.79aB*
    1.89a
    4-5 2.0a1A* 2.54a1B* 2.51a2A* 2.91b1B* 1.55aA* 1.83aB*
    2.04a
    5-6 2.27b2A* 2.58a1B* 2.81b1A* 3.14a1B* 1.89bA* 2.06bB*
    2.32b
    Sentennial 3-4 1.97a2A 2.38a3B
    4-5 2.02a3A 2.34a2B
    5-6 2.37b2A 2.69b2B
    Main effects Significance F-value Degrees of freedom
    Cultivar p < 0.0001 94.79 2
    Colour level p < 0.0001 22.04 2
    Year p < 0.0001 361.13 2
    Time (harvest or storage at 0.5 °C) p < 0.0001 134.15 1
    Colour differences: within common time and cultivar, values followed by different lower case letters indicate significant differences (p ≤ 0.05); Cultivar differences: within common colour level and time, values followed by different numbers indicate significant differences (p ≤ 0.05); Growing year differences: within common time, colour level and cultivar, values followed by * indicate significant differences (p ≤ 0.05); Storage differences (Harvest versus 0.5 °C storage): within common cultivar, colour level and growing year, values followed by different uppercase letter indicate significant differences (p ≤ 0.05); Temperature differences: within Staccato cultivar at 28 d storage and at common colour level, bolded values indicate significant differences (p ≤ 0.05) between storage temperatures (0.5 °C vs 3 °C).
     | Show Table
    DownLoad: CSV
    Table 4.  Dry matter values as affected by cultivar, growing year, storage and colour level at harvest.
    Cultivar Colour level Dry matter (DM, %)
    2018 2019 2021
    Harvest Storage (0.5 °C) Harvest Storage (0.5 °C) Harvest Storage (0.5 °C) [3 °C]
    Sweetheart 3-4 20.9aA1* 20.6aA1* 18.6aA1* 18.6aA1* 22.1aA1*
    4-5 21.9bA1 22.0bA1* 19.9bA1* 19.8acA1* 22.5bA1
    5-6 25.2cA1* 23.5cB1* 21.1cA1* 20.6bcA1* 23.6cA1*
    Staccato 3-4 20.2aA1* 19.5aA2* 18.4aA2* 18.1aA23* 21.0aA2* 20.6aA*
    19.8a
    4-5 20.4aA2* 20.8bA2* 19.1aA1* 18.8aA2* 22.0bA2* 21.6bA*
    21.9b
    5-6 22.4bA2 22.3cA2 22.9bA2* 21.6bA23 23.0cA2 22.2bA
    22.4b
    Sentennial 3-4 18.2aA2 18.4aA13 20.5aA2*
    4-5 19.3bA1 18.8bA2 22.6bA12*
    5-6 22.9cA2 20.9bA13 23.5cA12
    Main effects Significance F-value Degrees of freedom
    Cultivar p < 0.0001 11.36 2
    Colour level p < 0.0001 130.99 2
    Year p < 0.0001 56.64 2
    Time (harvest or storage at 0.5 °C) Not significant, p = 0.0922 2.97 1
    Colour differences: within common time and cultivar, values followed by different lower case letters indicate significant differences (p ≤ 0.05); Cultivar differences: within common colour level and time, values followed by different numbers indicate significant differences (p ≤ 0.05); Growing year differences: within common time, colour level and cultivar, values followed by * indicate significant differences (p ≤ 0.05); Storage differences (Harvest versus 0.5 °C storage): within common cultivar, colour level and growing year, values followed by different uppercase letter indicate significant differences (p ≤ 0.05); Temperature differences: within Staccato cultivar at 28 d storage and at common colour level, bolded values indicate significant differences (p ≤ 0.05) between storage temperatures (0.5 °C vs 3 °C). (N.B. no bolded values appear in this table).
     | Show Table
    DownLoad: CSV

    Data in Table 1 shows the SS levels at each colour level for each sweet cherry cultivar. Overall, SH cherries at harvest had ranges of 18.1%−21.9% over the 2018 and 2019 growing seasons. SC cherries at harvest had levels between 17.1%−20.2% over the three growing years (2018, 2019, and 2021), while SL cherries at harvest had levels of 18.1%−20.8% in 2019. Statistical analysis showed that the main effects of Cultivar (p < 0.0001; F-value = 36.90; degrees of freedom (df) = 2), Colour (p < 0.0001; F-value = 125.76, df = 2), Time (p = 0.0007; F-value = 13.68; df = 1), and Year (p < 0.0001; F-value = 9.26; df = 2) were all significant. Additionally, the interactions of Cultivar * Year (p < 0.0001, F-value = 26.37; df = 1), Colour * Year (p < 0.0069; F-value = 4.19; df = 4), Cultivar * Colour * Year (p < 0.0003; F-value = 10.28; df = 2) and Colour * Time * Year (p < 0.0131; F-value = 3.67; df = 4) were all significant.

    With respect to growing year differences, in 2018, SS levels in SH were greater than those of SC at all colour levels. In 2019, again at the 3-4 colour level SC, cherries exhibited lower SS levels than SH and SL cherries. At the 4-5 colour level, SH cherries again showed higher SS levels compared to SC cherries. At the 5-6 colour level, SL cherries showed higher SS levels compared to SC and SH, while SC and SH cherries showed comparable SS levels at the 5-6 colour level. The SS values of SC cherries at 3-4 and 4-5 colour levels from the 2021 growing year were higher than values observed at the same colour levels in 2018 and 2019 growing year samples. There was no difference observed in SS levels of SC cherries at the 5-6 colour level between growing years. The data shows that colour level, cultivar, and growing year all affected SS levels.

    Within cultivars, for SH in the 2018 growing season, as colour level increased, SS level increased. An increase in SS as colour at harvest increased for SH cultivar was reported by Puniran et al.[27]. In the 2019 growing year for SH cherries and in the 2021 growing year for SC cherries, SS levels plateaued at the 4-5 colour level. For SC (2018 and 2019 growing year) and SL cherries (2019 growing year) as colour level increased, SS level increased. Ross et al.[1] reported this same trend for SC cultivar on data collected from 2015, 2016, and 2017 growing years. This data demonstrates the influence of growing conditions on SS levels.

    In general the SS levels at each colour level for each sweet cherry cultivar did not change over the 28 d storage at 0.5 °C. It should be noted that SC cherries from the 2018 growing year at the 5-6 colour level and SC cherries from the 2021 growing year at the 4-5 colour level did show a significant (p ≤ 0.05) decrease in soluble solids after 28 d of storage at 0.5 °C. SS values for 2018 SC cherries at the 5-6 colour level harvest was 20.2 °Brix, while SS values after 28 day storage at 0.5 °C was 17.9 °Brix. SS values for 2021 SC cherries at the 4-5 colour level harvest was 19.9 °Brix, while SS values after 28 d of storage at 0.5 °C was 18.6 °Brix. In 2021 the effect of storage temperature (0.5 °C vs 3 °C) was investigated. SS levels in the SC cherries at the different colour levels were not affected by the different storage temperatures. This result was consistent with other findings[1,8,14], which suggested that under typical low temperature storage conditions and proper shipping conditions, the change in flavour profiles were likely not due to major changes in SS levels. It is important to note that Alique et al.[8] found that while SS values were consistent, the levels of glucose and fructose decreased by 13% and 10%, respectively, after 4 d under ambient conditions. It may be worth investigating if under a lower temperature environment, the levels of key monosaccharides would remain constant or change.

    This moves the focus of flavour retention to TA values. Table 2 shows the TA levels at each colour level for each sweet cherry cultivar. Statistical analysis showed that the main effects of Cultivar (p < 0.0001; F-value = 193.58; df = 2), Colour (p = 0.0023; F-value = 5.49, df = 2), Time (p < 0.0001; F-value = 474.18; df = 1), and Year (p < 0.0001; F-value = 1007.20; df = 2) were all significant. The interactions of Cultivar * Colour (p < 0.001; F-value = 5.81; df = 4); Cultivar * Year (p < 0.0001; F-value = 19.9; df = 1); Colour * Time (p = 0.0431; F-value = 3.44; df = 2); Colour * Year (p < 0.0001; F-value = 18.01; df = 4); Time * Year (p < 0.0001; F-value = 17.21; df = 2); Cultivar * Colour * Year (p = 0.0009; F-value = 8.63; df = 2); Colour * Time * Year (p = 0.0127; F-value = 3.70; df = 4) were all significant.

    SH cherries at harvest had TA value ranges of 8.99−10.56 g·L−1 in 2018, and 7.31−7.56 g·L−1 in 2019. In 2018, the highest TA value was at the 5-6 colour level for SH cherries, while for the 2019 SH cherries there was no difference between colour levels for the TA values. After storage SH cherries at the various colour levels showed TA levels of 7.11−8.57 g·L−1 and 6.31−6.50 g·L−1 for 2018 and 2019, respectively. Again the stored 2018 SH cherries at the 5-6 colour level showed the highest TA values, while the TA values for the stored 2019 SH cherries were not affected by colour level. SC cherries at harvest showed TA value ranges of 8.53−8.91 g·L−1 in 2018, 6.96−7.18 g·L−1 in 2019, and 10.6−12.8 g·L−1 in 2021. After storage SC cherries had lower TA values at all colour levels for all growing years. In 2018, 2019, and 2021, TA values for SC cherries after storage ranged from 6.65–7.04 g·L−1, 5.51−6.46 g·L−1 and 8.5−10.5 g·L−1, respectively. In 2021, for the SC cherries, the higher storage temperature (3 °C) resulted in a greater loss of TA values for all colour levels compared to the lower temperature of 0.5 °C. SL cherries at harvest had TA levels of 8.79−9.33 g·L−1 in 2019 and after storage at 0.5 C, TA values ranged from 7.60−7.89 g·L−1, with the highest value of TA at the 4-5 colour level. Therefore for all cultivars over all growing years, TA values decreased upon storage, which was expected. The data from Table 2 shows the magnitude of the decrease in TA values after storage varied by growing year. Additionally, trends for differences of TA magnitude change with respect to cultivar and colour level were not obvious. The magnitude of the decrease in TA values between harvest and storage was higher for the SC cherries stored at 3 °C compared to those stored at 0.5 °C.

    Comparing the effect of colour level on TA level within cultivar for SH cherries, TA values increased as colour level at harvest increased in 2018, but the trend did not continue in 2019, possibly due to different growing conditions such as orchard temperature and relative humidity values, which will be further discussed. For SC cherries, TA values peaked at the 4-5 colour level for 2018 and 2021 growing years, but were not significantly different between colour levels in 2019 (p ≤ 0.05). In the 2019 growing year, SL cherries also had the highest TA values at the 4-5 colour level. Comparing the effect of cultivar on TA level within comparable colour level, 2018 harvest SH cherries showed higher TA values than SC cherries. In the 2018 growing year, upon storage and at comparable colour level, SH cherries again showed higher TA values than SC cherries. In the 2019 harvest, SC cherries exhibited the same TA values as SH cherries, while SL cherries had higher TA values than SC and SH. In the 2019 growing year SL cherries harvested at the 3-4 colour level showed greater TA values after storage compared to SH and SC cherries; SC cherries had the lowest TA values at this colour level. When harvested at the 4-5 and 5-6 colour levels, SL cherries had higher TA values upon storage compared to SH and SC cherries.

    The data suggests that different cultivars tend to peak TA values, which may be affected by growing conditions/growing year and maturity level/colour level. This is further supported by the work of Miloševic & Miloševic[28] that indicated TA levels of sour cherries are affected by level of ripeness. Puniran et al.[27] also indicted that finding where peak TA values occur at harvest can help negate the decrease in values that occurs during storage and therefore promote flavour quality retention.

    In 2021 the effect of storage temperature (0.5 °C vs 3 °C) was investigated as 0.5 °C represents ideal storage temperature while 3 °C represents a storage temperature where quality deterioration would be promoted, and may be a more realistic temperature experienced during overseas/export shipping (personal communication, Dr. Peter Toivonen, May, 2021). TA levels in the SC cherries harvested at the different colour levels were affected by the different storage temperature as seen in Table 2. At common colour level, SC cherries from the 2021 growing season stored at 3 °C showed lower TA values than samples stored at 0.5 °C. The SC cherries at the 5-6 colour level stored at 3 °C showed the lowest TA values upon storage. As higher TA values are associated with flavour quality[11,12], the SC cherries harvested at the 5-6 colour level and stored at 3 °C would show poorer flavour quality.

    Table 3 shows the SS/TA ratio values as affected by cultivar, growing year, storage and colour level at harvest. Statistical analysis showed that the main effects of Cultivar (p = 0.0001; F-value = 94.79; df = 2), Colour (p < 0.0001; F-value = 22.04; df = 2), Time (p < 0.0001; F-value = 134.15; df = 1), and Year (p < 0.0001; F-value = 361.13; df = 2) were all significant. The interactions of Cultivar * Colour (p = 0.0009; F-value = 5.91; df = 4) and Time * Year (p = 0.0059; F-value = 5.95; df = 2) were significant. The SS/TA ratio values over all cultivars, colour levels and growing years ranged from 1.55 to 2.81 at harvest and 1.79 to 3.14 after storage at 0.5 °C for 28 d. SC cherries in the 2021 growing year were tested to determine the effect of storage temperature (0.5 or 3 °C) on flavour quality. The SS/TA ratio for the 2021 SC cherries stored at 0.5 °C for 28 d ranged from 1.79 to 2.06 while the SS/TA ratio for the 2021 SC cherries stored at 3 °C for 28 d ranged from 1.89 to 2.32. SS/TA ratios for the 3 °C stored cherries at the 4-5 and 5-6 colour levels were significantly higher (p ≤ 0.05) compared to corresponding SS/TA ratios for the 0.5 °C stored cherries at the 4-5 and 5-6 colour levels. Higher SS/TA ratio are due to lower TA values (data in Table 3) and impact flavour quality and therefore lower storage temperatures are preferable, which was expected.

    Comparing between growing years, for SH and SC cherries, the SS/TA ratio at harvest was higher in the 2019 growing year compared to the 2018 growing year. SC cherries from the 2021 growing year showed the lowest at harvest SS/TA ratio. Within cultivar, the SH cherries from the 2018 growing year showed no difference in harvest SS/TA ratio at the different colour levels. SH cherries from the 2019 growing year showed higher harvest SS/TA ratios at the 4-5 and 5-6 colour levels compared to the 3-4 colour level. The SC cherries at all growing years showed highest harvest SS/TA ratio levels at the 5-6 colour level and comparable harvest SS/TA ratio levels at the 3-4 and 4-5 colour levels. SL cherries also showed the highest harvest SS/TA ratio at the 5-6 colour level and comparable harvest SS/TA ratios at the 3-4 and 4-5 colour levels.

    Comparing cultivars at common colour level, in 2018 growing year SC cherries at the 5-6 colour level showed a higher harvest SS/TA ratio compared to SH cherries at the corresponding colour level. In the 2019 growing year SH and SC cherries showed higher harvest SS/TA ratios at the 3-4 colour level compared to SL cherries. At the 4-5 colour level, SH cherries showed the highest harvest SS/TA ratio value and SL cherries showed the lowest harvest SS/TA ratio value. At the 5-6 colour level, SH and SC cherries showed comparable SS/TA ratios while SL cherries showed the lowest SS/TA ratio.

    Overall, this data indicates that ensuring cherry flavour quality is complex as SS/TA ratio varied by growing year, colour level and cultivar. Comparing SS/TA ratio data for all cultivars over all growing years did not show an observable trend between colour level and SS/TA ratio. As such, colour is not a reliable indicator of flavor quality.

    Table 4 shows the DM values as affected by cultivar, growing year, storage and colour level at harvest. Statistical analysis showed that the main effects of Cultivar (p = 0.0001; F-value = 11.36; df = 2), Colour (p < 0.0001; F-value = 130.99; df = 2), and Year (p < 0.0001; F-value = 56.64; df = 2) were all significant. Notably, the main effect of Time (harvest vs stored) was not significant (p = 0.0922). The interactions of Cultivar * Year (p = 0.001; F-value = 6.45; df = 3); Colour * Year (p = 0.0004; F-value = 6.38; df = 4); Cultivar * Colour * Year (p = 0.0018; F-value = 4.64; df = 5) were all significant. Although SS and TA values were not obtained for all three cultivars in 2021, DM values at harvest were obtained for all three cultivars in 2021. Data in Table 4 show, in general, DM levels did not change over 28-d storage, which was expected. Additionally, data in Table 4 shows that in most cases, at common cultivar and colour level, DM values measured in 2021 were greater than DM values measured in 2018 and 2019 for all cultivars (SH, SC, and SL).

    Within each cultivar, over all growing years, the harvest DM values were significantly different (p < 0.05) at each colour level, except for SC cherries in the 2018 and 2019 growing years. 2018 and 2019 DM values were not significantly different from colour level 3-4 to colour level 4-5. At the 5-6 colour level, over all growing years, SH cherries showed higher DM values compared to dry matter values observed for SC cherries (p < 0.05). At the 3-4 colour level, over all growing seasons, the DM values for SL and SC cherries were not significantly different (p < 0.05). At the 4-5 colour level, over all growing seasons, the DM values for SL were not significantly different than the DM values exhibited by SH and SC cherries (p < 0.05). In 2021 the effect of storage temperature (0.5 °C vs 3 °C) was investigated. DM levels in the SC cherries at the different colour levels were not affected by the different storage temperature. Overall, DM levels ranged from 18.1 to 25.2 depending on cultivar, colour level, growing year, and storage.

    Figure 1ac shows the distribution of the three cherry cultivars relative to DM value ranges over all three growing years via histograms. Cherries at the same colour level did not all have the same DM; this was observed both within and between cultivars (Fig. 1ac). DM data, compiled over all available growing years, for each cultivar in the 3-4, 4-5, and 5-6 colour levels had considerable overlap. However, it is noted there is consistent shift to a higher DM at the 5-6 colour level.

    Figure 1.  Histogram representing distribution of dry matter data for: (a) Sweetheart (SH) cherries over the 2018, 2019, and 2021 growing years; (b) Staccato (SC) cherries over the 2018, 2019, and 2021 growing years; and (c) Sentennial (SL) cherries over the 2019 and 2021 growing years. For all parts, the 3-4 colour level is solid black, the 4-5 level is black stripes, and the 5-6 level is solid grey. On the horizontal axis different dry matter value (DM) ranges are shown via bins and on the vertical axis the frequency or proportion (%) of cherries within the DM bins/ranges are shown. Data was generated from two replicates of samples of 25 cherries (i.e. 50 cherries) from all available growing years.

    Over all growing years, DM values for SH cherries ranged from 14%−27%, 14%−28.5%, and 16.5%−33%, at the 3-4, 4-5, and 5-6 colour levels, respectively (Fig. 1a). SH cherries at the 3-4 and 4-5 colour levels showed the highest proportion (26% and 26%, respectively) of cherries resided in the 22.5 and 22.5% DM bins indicating the highest percentage of SH cherries in these colour levels exhibited a DM of 21% to 22.5%, while the highest proportion (21%) of cherries at the 5-6 colour level resided in the 24% DM bin indicating the highest percentage of SH cherries at this colour level exhibited a DM of 22.5% to 24% (Fig. 1a).

    For SC cherries over all growing years, DM values ranged from 14%−25.5%, 14%−30%, and 16.5%−30%, at the 3-4, 4-5, and 5-6 colour levels, respectively (Fig. 1b). SC cherries at the 3-4 colour level showed the highest proportion of cherries (27%) resided in the 19.5% DM bin which indicated the highest percentage of SC cherries at this colour level exhibited a DM of 18 to 19.5%. SC cherries at the 4-5 colour level showed the highest proportion of cherries (25%) resided in the in the 21% DM bin which indicated the highest percentage of SC cherries at this colour level exhibited a DM of 19.5% to 21 %. At the 5-6 colour level, the highest proportion (35%) of SC cherries resided in the 22.5% DM bin which indicated the highest percentage of SC cherries exhibited a DM of 21%−22.5% (Fig. 1b).

    Over the 2019 and 2021 growing years, SL cherries DM values ranged from 15%−25.5%, 15%−28.5%, and 16.5%−33% at the 3-4, 4-5 and 5-6 colour levels, respectively (Fig. 1c). SL cherries at the 3-4 colour level showed the highest proportion of cherries (36%) resided in the 21% DM bin which indicated the highest percentage of SL cherries at this colour level exhibited a DM of 19.5% to 21%. SL cherries at the 4-5 colour level showed the highest proportion of cherries (28%) resided in the in the 21% DM bin which indicated the highest percentage of SL cherries at this colour level exhibited a DM of 19.5% to 21 %. At the 5-6 colour level, the highest proportion (26%) of SC cherries resided in the 22.5% DM bin which indicated the highest percentage of SL cherries exhibited a DM of 21%−22.5% (Fig. 1c).

    In all, the data in Tables 14 and Fig. 1 indicate that colour is not a reliable indicator of maturity or flavor quality. Cherries of the same colour may differ in DM, SS, TA, and SS/TA ratio due to cultivar and growing conditions. The implication of these results are discussed in subsequent sections.

    Temperature, relative humidity and harvest date for the 2018, 2019, and 2021 growing years are detailed in Table 5. Environmental variations between years impacted colour development, which resulted in yearly variations in our harvest dates as cherry picks were based on cherry colour levels: 2018, July 16 to August 9; 2019, July 18 to August 6; and 2021, July 5 to July 27, nearly two weeks earlier than in previous years (Table 5). In terms of environmental data, the average temperature (AT), average high temperature (AHT), and average low temperature (ALT) values measured in 2021 were greater than the values determined in 2018 and 2019, while the average relative humidity (ARH) values determined in 2021 were lower than the values measured in 2018 and 2019 (Table 5). Depending on growing year and harvest date, average temperature values ranged from 17.17 to 24.28 °C, average high temperature values ranged from 28.59 to 50.68 °C, average low temperatures ranged from 7.17 to 10.68 °C, and average relative humidity values ranged from 40.68% to 66.16% (Table 5).

    Table 5.  Temperature and relative humidity environmental data for 2018, 2019, and 2021 growing years.
    Growing year Colour level Harvest date Average
    temperature
    (AT) (°C)
    Average relative humidity (ARH) Average low temperature (ALT) (°C) Average high temperature (AHT) (°C)
    2018 Sweetheart 3-4 July 16 18.96 61.5% 7.17 32.14
    4-5 July 23 18.85 59.8% 7.17 32.13
    5-6 July 30 20.45 56.85% 7.49 32.05
    Staccato 3-4 July 30 19.74 59.17% 7.42 32.04
    4-5 August 9 21.14 54.46% 7.42 32.77
    5-6 August 9 21.14 54.49% 7.42 32.77
    2018 overall average 20.05 57.71% 7.35 32.32
    2019 Sweetheart 3-4 July 18 17.86 66.04% 7.22 28.79
    4-5 July 24 18.39 66.1% 7.22 28.59
    5-6 July 24 18.39 66.1% 7.22 28.59
    Staccato 3-4 July 22 18.03 66.16% 7.22 28.59
    4-5 July 29 19.19 62.92% 8.67 29.39
    5-6 July 31 19.19 62.92% 8.67 29.39
    Sentennial 3-4 July 22 18.03 66.16% 7.22 28.59
    4-5 July 29 18.99 63.77% 8.67 29.39
    5-6 August 6 19.79 59.94% 8.67 29.39
    2019 overall average 18.87 63.65% 8.19 28.96
    2021 Sweetheart 3-4 July 5 24.01 40.68% 8.51 50.68
    4-5 July 12 24.28 40.68% 10.68 49.23
    5-6 July 20 24.10 40.68% 9.66 47.47
    Staccato 3-4 July 13 24.01 40.68% 8.51 50.68
    4-5 July 21 24.28 40.68% 10.68 49.23
    5-6 July 27 24.10 40.68% 9.66 47.47
    Sentennial 3-4 July 12 24.01 40.68% 8.51 50.68
    4-5 July 19 24.28 40.68% 10.68 49.23
    5-6 July 26 24.10 40.68% 9.66 47.47
    2021 overall average 24.12 40.68% 9.62 49.13
     | Show Table
    DownLoad: CSV

    Principal component analysis (PCA) was performed on all cultivars over all growing seasons to best resolve cultivar specific relationships between variables affecting flavour quality parameters: colour, DM, SS and TA (Fig. 2).

    Figure 2.  Principal component analysis (PCA) plot for: Sweetheart (SH) cherries with data from 2018 and 2019 growing years at the 3-4, 4-5, and 5-6 colours levels (SH34-2018, SH45-2018, SH56-2018, SH34-2019, SH45-2019, and SH56-2019; Staccato (SC) cherries with data from 2018, 2019 and 2021 growing years at the 3-4, 4-5, and 5-6 colour levels (SC34-2018, SC45-2018, SC56-2018, SC34-2019, SC45-2019, SC56-2019, SC34-2021, SC45-2021, and SC56-2021); and Sentennial (SL) cherries with data from 2019 growing year (SL34-2019, SL45-2019, and SL56-2019). PC1 and PC2 accounted for 84.75% variation. The variables include: average temperature (AT), average high temperature (AHT), average low temperature (ALT), average relative humidity (ARH), colour at harvest (ColourH), SS at harvest (SSH), SS after 28 d of storage at 0.5 °C (SS05), titratable acidity at harvest (TAH), titratable acidity after 28 d of storage at 0.5 °C (TA05) and dry matter of cherry fruit at harvest (DMH). Orchard growing factors, flavour quality attributes (loading factors), along with sweet cherry cultivars from each growing season (component scores) were presented as lines with arrows, lines with circles, and squares, respectively. Variables close to each other with small angles between them are strongly positively correlated; variables at right angles are likely not correlated; variables at large angles (close to 180°) are strongly negatively correlated.

    Figure 2 shows that principal components 1 and 2 described most of the variation (84.75%) in the model. SS at harvest (SSH) and SS at 28-d storage at 0.5 °C (SS05) along with DM at harvest (DMH) were positively correlated with colour at harvest (ColourH). TA at harvest (TAH) and TA at 28-d storage at 0.5 °C (TA05) were positively correlated with average high temperature (ATH). AHT, average low temperature (ALT) and average temperature (AT). DMH was more strongly correlated with TAH and TA05 compared to ColourH. TAH and TA05 were positively correlated, yet negatively correlated with average relative humidity (ARH). The 2021 SC samples at the 3-4, 4-5, and 5-6 colour levels (SC34-2021, SC45-2021, and SC56-2021) were clustered with TAH, TA05, ALT, AHT, and AT variables and located in a quadrant opposite of ARH. In late June 2021 a heatwave of unprecedented magnitude impacted the Pacific Northwest region of Canada and the United States; the Canadian national temperature record was broken with a new record temperature of 49.6 °C[29]. Also, the relative humidity levels during this period were also extremely low[30]. As the location of this study was impacted by this heatwave, the data shown in Table 6 shows higher temperatures and lower relative humidity values for the 2021 growing year. The TA values measured in the 2021 growing year were nearly two times the levels measured in the 2018 and 2019 growing years (Table 2). This shows an impact of growing conditions on flavor quality; both the negative correlation between ARH and TA and positive correlations of AT, AHT, and ALT with TA are notable. However, it is noted that correlation does not mean causation. The SH and SC cultivars from the 2018 growing year at the 5-6 colour level were clustered together, and were located in the same quadrant as ColourH, SSH, SS05, and DMH variables (Fig. 2). This indicates these samples were characterized by high values of SSH, SS05, and DMH. All cultivars at the 3-4 colour level from the 2018 (SH and SC), and 2019 (SH, SC, and SL) growing years along with all cultivars at the 4-5 colour level from the 2019 (SH, SC, and SL) growing year were clustered in quadrants opposite of the SSH, SS05, DMH, ColourH, TAH, and TA05 variables while near the ARH variable. The clustering of the samples indicates similarity and lower levels of SSH, SS05, DMH, TAH, and TA05.

    Table 6.  Average colour level and respiration rate of sweet cherries at harvest.
    Growing year Colour
    level
    Average colour measured at harvest
    [average dry matter at harvest]
    Dry matter bin (%), highest
    proportions of cherries
    Respiration rate (mg CO2 kg−1·h−1)
    assessed at 0.5, 5 or 10 °C
    0.5 °C 5 °C 10 °C
    2018 Sweetheart 3-4 3.74a1 [20.9%] 21, 38% 2.87a1 * 5.99a1* 9.75a1*
    4-5 4.66b1 [21.9%] 22.5, 38% 3.57b1* 5.53b1* 9.06a1*
    5-6 5.54c1 [25.2%] 25.5, 26% 3.50b1* 5.18b1* 9.58a1*
    Staccato 3-4 3.58a1 [20.2%] 19.5, 44% 4.43a2* 7.08a2* 9.90a1*
    4-5 4.62b1 [20.4%] 21, 36% 4.58a2* 8.05b2* 11.22b2*
    5-6 5.64c1 [22.4%] 22.5, 50% 4.12b2* 6.43c2* 9.78a1*
    2019 Sweetheart 3-4 3.76a1 [18.6%] 18, 26%; 19.5, 26% Nd 6.04 13.7
    4-5 4.42b1 [19.9%] 21, 32% Nd Nd 8.3
    5-6 5.42c1 [21.1%] 22.5, 28% Nd 6.95 13.5
    Staccato 3-4 3.46a1 [18.4%] 19.5, 32% Nd 5.8 12.47
    4-5 4.40b12 [19.1%] 19.5, 40% Nd 6.14 Nd
    5-6 5.40c1 [22.9%] 22.5, 26% Nd Nd Nd
    Sentennial 3-4 3.62a1 [18.2%] 18, 28% Nd 6.5 12.80
    4-5 4.22b2 [19.3%] 21, 40% Nd 3.76 Nd
    5-6 5.20c2 [22.9%] 22.5, 24% Nd Nd Nd
    2021 Sweetheart 3-4 Nd [22.1%] 22.5, 40% 3.18a1* 5.86a1* 8.8a1*
    4-5 Nd [22.5%] 22.5, 28% 2.78a1* 5.08b1* 8.1a1*
    5-6 Nd [23.6%] 24, 30% 2.65a1* 4.32c1* 9.19a1*
    Staccato 3-4 3.50a1 [21.0%] 19.5, 28% 2.72a1 4.65ab2 10.94a2*
    4-5 4.80b1 [22.0%] 21, 24%; 22.5, 20% 3.27a1* 4.38a2* 8.22b1*
    5-6 5.60c1 [23.0%] 24, 30% 3.05a1* 5.07b2* 9.57ab1*
    Sentennial 3-4 Nd [20.5%] 21, 48% 2.71a1* 4.77a2* 7.84a1*
    4-5 Nd [22.6%] 22.5, 28%; 24, 24% 2.78a1* 4.81a12* 8.28ab1*
    5-6 Nd [23.5%] 22.5, 28%; 24, 24% 4.23b2 4.47a12 9.88b1*
    Within common cultivar and growing year, values followed by different letters indicate significant differences (p ≤ 0.05)-shows colour differences; Within common colour level and growing year, values followed by different numbers indicate significant differences (p ≤ 0.05)-shows cultivar differences; Within common cultivar, growing year and colour level, values followed by * indicate significant differences (p ≤ 0.05)-shows respiration rate differences at the different temperatures. Due to incomplete data, statistical analysis was not performed on 2019 data. Nd = Actual colour was not calculated for Sweetheart and Sentennial cherries in 2021 although cherries were collected 3-4, 4-5, 5-6 colour levels as in previous years and can be considered to have colour levels of approximately 3.5, 4.5, and 5.5, respectively.
     | Show Table
    DownLoad: CSV

    High respiration rates have long been associated with rapid fruit quality deterioration[11]. Lower respiration rates help to maintain higher TA levels, thereby retaining flavour quality[11,12]. This work aimed to provide information on assessing whether rapid and non-invasive dry matter measurements can serve as a surrogate for respiration rate measurements and/or TA measurements to predict fruit quality as this information is essential for developing recommendations to optimize cherry quality retention upon long distance transport. Although it is well known that quality deteriorates more quickly in fruit with higher respiration rates, the respiration rate data for the SH, SC, and SL cherries was collected and analyzed with respect to the different colour levels and corresponding DM values to investigate a link between respiration rate and DM value. Examining the data with this perspective is very novel and additionally very little information on respiration rates is available for SC and SL sweet cherries cultivars in the literature.

    Table 6 shows the respiration rates for a) SH and b) SC cherries at different colour levels for the 2018 growing year and how they were affected by respiration rate assessment temperature (0.5, 5, and 10 °C). Table 6 also shows the respiration rates for a) SH, b) SC, and c) SL cherries at different colour levels for the 2021 growing year and how they are affected by respiration rate assessment temperature. Please note respiration data is incomplete for the 2019 growing year because of data constraints due to equipment difficulties and therefore no statistical analysis was performed on the available 2019 respiration data. As little information exists in the literature for SC and SL cherries, we have included the incomplete respiration data. Table 6 also shows average color data and average DM data for the cherries collected at the different colour levels. Additionally, Table 6 shows data on the DM (%) bins containing the highest proportion of cherries for each cultivar in each growing year at each colour level (histograms for each cultivar for individual growing year not shown).

    Table 6 shows the average colour measured for the cherries harvested at the 3-4, 4-5, and 5-6 colour levels all varied slightly depending on growing year and cultivar. In both the 2018 and 2019 growing years there was no difference in color levels between SH and SC at harvest. In the 2019 growing year, the SL cherries showed lower average colour values at the 4-5 and 5-6 colour levels compared to the average colour levels of SH and SC cherries at the same level. Nevertheless, results indicated the cherries were harvested and sorted to the desired colour levels. In 2021, average colour was not calculated for SH and SL cherries, although cherries were collected at the 3-4, 4-5, and 5-6 colour levels, as in previous years, and can be considered to have been within range. The average colour level was calculated for SC cherries in 2021, as SC cultivar received comprehensive study over all growing years (2018, 2019 and 2021). The calculated colour level values for SC cherries in the 2021 growing year at the 3-4, 4-5, and 5-6 colour levels were 3.5, 4.8, and 5.6, respectively.

    Table 6 shows the lower the respiration rate assessment temperature, the lower the respiration rate, which was expected as cherries are recommended to be stored at 0.5 °C to ensure quality retention due to this fact[1]. In 2018, SH respiration rate values were consistently lower than SC cherries at 0.5 and 5 °C. However, at 10 °C the respiration rate values become comparable between cultivars (Table 6). Comparing between colour level, SH at colour level 3-4 showed the lowest respiration rate at 0.5 °C but had the highest respiration rate when assessed at 5 °C (Table 6). While SC 5-6 cherries at the 5 °C respiration rate assessment temperature showed a significantly lower respiration rate compared to respiration rates measured for SC 3-4 and SC 4-5 cherries at 5 °C (Table 6).

    In 2021, SH and SC respiration rates were more comparable at 0.5 and 10 °C, but at 5 °C, SH respiration rates were higher than SC at the 3-4 and 4-5 colour levels while SC cherries showed a higher respiration rate when assessed at 5 °C compared to the SH cherries at the 5-6 colour level (Table 6). SH respiration rates in 2021 were consistent at 0.5 and 10 °C for all colour levels (Table 6). However, at 5 °C SH cherries at the 5-6 colour level had the lowest respiration rate for all three of the colour levels and the SH cherries at the 3-4 colour level showed the highest respiration rate. This occurred in both 2018 and 2021 (Table 6). The respiration rates of SC cherries were not affected by colour level when assessed at 0.5 °C, but at the 5 °C respiration rate assessment temperature, 2018 SC cherries at 5-6 colour level had lower respiration values (Table 6), while 2021 SC cherries at the 4-5 colour level showed a lower respiration rate value (Table 6). Comparing colour levels, SL cherries at the 5-6 colour level had the highest respiration rates at 0.5 and 10 °C (Table 6). However, at 5 °C, all SL colour levels had comparable respiration values (Table 6). Further, in 2021, all cultivars at 0.5 °C assessment temperature showed respiration rates that were comparable between all colour levels except for SL 5-6. This respiration rate value was significantly higher than the respiration rates measured for the SL 3-4 and 4-5 colour levels and was also higher than the respiration rates determined for SH and SC at the 5-6 colour level. Interestingly, the respiration rate assessed at 0.5 °C for SL at the 5-6 colour level was not significantly different than the respiration rate assessed at 5 °C for SL at the 5-6 colour level (Table 6).

    To further discuss the results presented above, a main source of decreasing TA values in cherries is high respiratory activity[11]. Therefore, linking flavour quality, which is affected by TA levels, to differences in respiration rates is reasonable. Higher respiration rate assessment temperatures were related to higher respiration rates of cherries as seen in Table 6, which was not unexpected and again points to the importance of keeping temperature near 0.5 °C during storage. Additionally, the temperature cherries experience during a growing season affects the respiration rate of the harvested fruit, as Ross et al.[1] found the average temperature and the average high temperature measured in an orchard was positively correlated with the cherry respiration rate at both 5 and 10 °C. Therefore, understanding factors that impact respiration rate, and ensuring cherries are harvested under conditions that ensure a low respiration rate is of significant importance. Table 6 (2021 data) suggests the colour level with the lowest respiration rates for SC cherries is 4-5, which is supported by previous work[1]. While Table 6 (2018 data) suggests the 5-6 colour level gives the lowest respiration rates for SC cherries. When this information is combined with the TA value data, the peak TA values for SC cherries occurs at the 4-5 level and 5-6 colour levels. SH cherries showed that for respiration rate assessed at 0.5 °C, the colour level with the consistently lowest respiration rate was 3-4, but at the 5 °C respiration rate assessment temperature, which is a more abusive temperature, the 5-6 colour level showed the lowest respiration rate in both 2018 and 2021. The highest TA values were seen at the 5-6 colour level for SH cherries. SL cherries show highest TA values at the 3-4 and 4-5 colour level in the 2019 growing year, but insufficient respiration rate data is available in 2019 to comment further. However, the data in Tables 14 indicate that colour is not a reliable indicator of maturity and/or flavor quality. Cherries of the same colour may differ in DM, SS and TA due to cultivar and growing conditions. Figure 1 shows that not all cherries at the same colour level are at the same DM both within and between cultivars. There is a range of DM values for each cultivar in the 3-4, 4-5, and 5-6 colour ranges. However, it is noted the distribution of DM shifted to the right (higher levels) in the 5-6 colour cherries. The work of Palmer et al.[25] and Toivonen et al.[6] have indicated the importance of DM as a fruit quality metric. The implications of colour, DM, and respiration rate results on flavour quality and DM standards are discussed below.

    Associations between colour and DM at harvest with sweet cherry flavour quality attributes and respiration rates were statistically examined using Pearson's correlation coefficient from all available data over all growing years to investigate whether there may be colour/DM levels that are associated with lower respiration rates (Table 7) and could be indicative of when harvest should be performed (i.e. maturity). It was found that colour at harvest was positively correlated with SS at harvest and SS after storage (r = 0.845, p ≤ 0.0005, and r = 0.684, p ≤ 0.005, respectively). Colour at harvest was also positively correlated with DM at harvest (r = 0.768, p ≤ 0.0005). This was expected as darker cherries of a certain cultivar are generally more developed or mature; sugar content (main contributor to DM) and TA increases upon fruit development[1,6,22]. Neither colour or DM at harvest were correlated with SS/TA ratio at harvest or after storage (Table 7). Over all cultivars, no correlation was seen between respiration rate at any assessment temperature and colour level (Table 7). No significant correlations were found between respiration rate assessed at 0.5 and 10 °C and DM (Table 7). A significant negative correlation (r = −0.514, p ≤ 0.025) was found between respiration rate at 5 °C and DM. It was speculated that a correlation between respiration rate and DM was not observed when assessed at 0.5 °C, as this temperature is very low and effectively slows metabolic activity regardless of physiological status of the cherry. No observed correlation between respiration rate assessed at 10 °C and DM was speculated to be due to 10 °C being such an abusive temperature that even physiologically healthy cherries show elevated respiration rates when stored at 10 °C, and likely experienced increased flavour quality deterioration, which could be tested by measuring SS and TA values. Over all cultivars at 5 °C, cherries with lower DM tended to have higher respiration rates, and may be susceptible to more rapid quality deterioration at non-ideal temperatures such as 3−5 °C, which can be encountered in the cherry industry, particularly during export shipping (personal communication, Dr. Peter Toivonen, May, 2021). This points to the importance of good temperature control during storage and diverting lower DM cherries to the domestic and/or rapid consumption market vs export market. Colour was not correlated with TA, while DM at harvest was positively correlated with TA at harvest and upon storage (Table 7), which is relevant for flavour quality. These results indicate that DM has a greater influence on flavour quality attributes than cherry colour.

    Table 7.  Correlations between colour and dry matter at harvest with sweet cherry flavour quality attributes and respiration rate.
    Relationship assessed for Sweetheart*,
    Staccato, and Sentennial**
    cultivars over 2018, 2019,
    and 2021 growing seasons
    Pearson's
    correlation
    coefficient
    Significance
    level
    (p value)
    Colour correlated with
    Soluble solids at harvest r = +0.845 p ≤ 0.0005
    Soluble solids at 28-d storage r = +0.684 p ≤ 0.005
    Dry matter at harvest r = +0.768 p ≤ 0.0005
    Dry matter correlated with
    Soluble solids at harvest r = +0.871 p ≤ 0.0005
    Soluble solids at 28-d storage r = +0.776 p ≤ 0.0005
    Colour at harvest r = +0.769 p ≤ 0.0005
    Titratable acidity at harvest r = +0.439 p ≤ 0.05
    Titratable acidity at 28 d storage r = +0.398 p ≤ 0.10
    Respiration rate at 5 °C r = −0.514 p ≤ 0.025
    Insignificant correlations
    Colour and titratable acidity at harvest r = +0.099 p = 0.696
    Colour and titratable acidity at 28 d storage r = +0.100 p = 0.692
    Colour and soluble solids to titratable
    acidity ratio at harvest
    r = +0.218 p = 0.383
    Colour and soluble solids to titratable
    acidity ratio at 28 d storage
    r = +0.073 p = 0.774
    Colour and respiration rate at 0.5 °C r = +0.252 p = 0.364
    Colour and respiration rate at 5 °C r = −0.206 p = 0.462
    Colour and respiration rate at 10 °C r = +0.084 p = 0.766
    Dry matter and soluble solids to titratable
    acidity ratio at harvest
    r = −0.135 p = 0.595
    Dry matter and soluble solids to titratable
    acidity ratio at 28 d storage
    r = −0.227 p = 0.365
    Dry matter and respiration rate at 0.5 °C r =−0.125 p = 0.657
    Dry matter and respiration rate at 10 °C r = −0.181 p = 0.519
    *Only 2018 and 2019 growing season data available; **only 2019 growing season data available.
     | Show Table
    DownLoad: CSV

    Further, specific cultivar respiration rate and DM relationships were also examined (data not shown). For SH cherries, a negative correlation was determined between respiration rate assessed at 5 °C and DM (p ≤ 0.1), yet this correlation was not seen for SL cherries. Based on statistical parameters SC cherries only showed a negative correlation between respiration rate assessed at 5 °C and DM if a higher p value > 0.1 was used which signifies evidence is not strong enough to suggest a relationship exists. Nevertheless, the statistically significant negative correlation between respiration rate assessed at 5 °C and DM over all cultivars was identified (Table 7).

    Although colour was positively correlated with DM (Table 7), a higher colour may not necessarily indicate a low respiration rate as no significant correlation was observed between colour and respiration rate at any assessment temperature when examined over all cultivars over the growing years tested. Although this highlights the importance of DM in overall quality rather than colour, the data presented thus far suggests certain cultivars achieve different optimal DM values or ranges at maturity that are related to quality retention. In general, higher DM is positive, but is there an upper limit/threshold in terms of higher respiration rate. The lack of correlation between respiration rate assessed at 5 °C and DM for SC and SL cherries seems to indicate a lower optimal DM level for these cultivars compared to SH cherries, as a negative correlation between respiration rate assessed at 5 °C and DM was observed for SH cherries. Again, non-ideal temperatures such as 3−5 °C, can be encountered in the cherry industry, particularly during export shipping, which makes these results extremely relevant to help ensure cherry growers deliver high quality fruit for the export market.

    In 2018, the respiration rate at 5 °C was lowest at the 4-5 and 5-6 colour levels for SH cherries, and the average DM values were ~22% and 25%, respectively. Information from Table 6 shows that 38% of SH fruit were in the 22.5% DM bin indicating the highest percentage of SH cherries at the 4-5 colour level had a DM of 21% to 22.5% while 26% of SH cherries at the 5-6 colour level resided in the 25.5% DM bin indicating the highest percentage of cherries at this colour level had a DM of 24% to 25.5%. For SH cherries in 2021, the lowest respiration rate at 5 °C was at the 5-6 colour level and average DM value was ~23.6%. Information from Table 6 shows that 30% of SH at the 5-6 colour level resided in 24% DM bin indicating the highest percentage of SH cherries at this colour level had a dry mater of 22.5% to 24%. For 2018 SH cherries, titratable acidity, which is important for flavour quality, was highest at the 5-6 colour level where respiration rate assessed at 5 °C was lower. These results imply, that at maturity, cherries tend to a certain DM value or range that corresponds to reduced respiratory activity and promotes quality retention, and would therefore be considered optimal. Based on this data (lower respiration rate (2018 and 2021) and peak TA (2018)), an optimal DM range for SH may be between 22.5%−25% DM or around 23% DM. This optimal DM corresponded to cherries in the 4-5 colour level (21.9%) in 2018, and in the 5-6 colour level (25.2%, 23.6% respectively) in 2018 and 2021.

    2018 respiration rate (assessed at 5 °C) was lowest at the 5-6 colour level for SC cherries and the average DM value was ~22%, respectively. Information from Table 6 shows that 50% of SC cherries resided in the 22.5% DM bin indicating the highest percentage of SC cherries at the 5-6 colour level had a DM of 21% to 22.5% The 2021 respiration rate (assessed at 5 °C) was lowest for SC cherries at the 4-5 colour level and average DM value was ~22% while the highest respiration rate was measured at the 5-6 colour level and the average DM value was ~23.0%. Information from Table 6 shows that 24% and 20% of SC cherries resided in each the 21% and 22.5% DM bins, respectively, indicating the highest percentage of SC cherries at the 4-5 colour level had a DM of 19.5% to 22.5%. For 2021 SC cherries, TA was higher at the 4-5 colour levels, where respiration rate assessed at 5 °C was lowest. Again, these results imply that at maturity cherries tends to a certain DM value or range (optimal) that corresponds to reduced respiratory activity and promotes quality retention. Based on this data (lower respiration rate (2018 and 2021) and peak TA (2018 and 2021)) an optimal DM range for SC may be between 19.5%−22.5% DM or around 22% DM. This optimal DM corresponded to cherries in the 4-5 colour level (22.0%) in 2021, and in the 5-6 colour level (22.4%) in 2018. The data also shows the optimal DM range for SH cherries is higher than the optimal DM range for SC cherries.

    In 2021, for the SL cherries, all colour levels showed the same respiration rate (assessed at 5 °C) and average DM values were 20.5%, 22.6% and 23.5% for the 3-4, 4-5 and 5-6 colour levels, respectively. Information from Table 6 shows that SL cherries at both the 4-5 and 5-6 colour levels, 28% and 24% of the cherries resided in the 22.5% and 24% DM bins indicting the highest percentage of cherries at these colour stages ranged from 21% to 24% DM. For SL, based on the one year of respiration data (2021), determining optimum DM was not as clear. At lower storage temperature (0.5 °C), lower average DM (20.5%−22.6% vs 23.5%) maintained lower respiration rates, but at higher storage temperature (5 and 10 °C) respiration rate did not appear to be affected by DM level. These lower DM values occurred at the 3-4 and 4-5 colour levels.

    Available DM, TA and respiration rate data as discussed suggests the optimal DM range for SH may be between 22.5%−25% DM or around 23% and an optimal dry matter range for SC may be between 19.5%−22.5% DM or around 22% DM, The histogram data over all growing years does further strengthen the justification for suggesting different optimal DM values for different cultivars (Fig. 1). The data over all growing years shows higher proportions of cherries in the 24 % DM bin for SH cherries at the 5-6 colour level which indicated highest proportion of cherries with a DM of 22.5% to 24%. The SC cherries at the 5-6 colour level showed the highest proportion of cherries in the 22.5% DM bin, which indicates the highest percentage of cherries have a DM of 21% to 22.5%; again these DM ranges have been suggested as optimal DM values based on previously discussed respiration data.

    In psychology self-actualization is a concept regarding the process by which an individual reaches their full potential[31]. The data suggests that sweet cherries self-actualize, with the majority of cherries reaching maturity with a DM range that promotes quality retention during storage when growing conditions are favourable. This optimal DM range is different for different cultivars, and growing conditions would be expected to influence the rate and/or ability of this 'self-actualization', as this work and our previous research has shown that environmental factors are correlated with these important quality characteristics[1]. Placing highest importance on distribution of DM levels at the 5-6 colour levels (Fig. 1) is justified as the cherries are the most physiologically mature and will likely exhibit the highest proportion of cherries with optimal DM; however, the optimal DM can occur at other colour ranges and should be used as the primary indicator of maturity. Maturity at harvest is the most important factor that determines storage-life and final fruit quality assweet cherries produce very small quantities of ethylene and do not respond to ethylene treatment; they need to be picked when fully ripe to ensure good flavour quality[32]. It is noted the CTFIL colour standard series goes up to colour level 7, yet a balance needs to be reached between flavour quality optimization vs other quality parameters such as firmness and stem pull force. Supplementary Tables S1S6 provide values of the quality parameters of firmness, stem pull force, stem shrivel, stem browning, pebbling and pitting levels at harvest and after storage for the SH, SC and SL cherries. All of these cherry cultivars exhibited good quality attributes at the 5-6 colour level, as well as lighter colour ranges.

    It is noted that the development of DM standards for different cultivars is a novel concept. This work was positioned as field work that collected cherry data for three cultivars over three growing years in adjacent orchards using the same management practices. Equipment constraints limited respiration rate data collection. As such absolute optimal DM values and/or ranges could not be determined nor was the goal of this study. The goal of this work was to further the concept that different cultivars may reach maturity at different DM levels, which would result in lower respiration rates and higher TA levels at harvest, and after storage, achieving enhanced quality retention. In this regard, absolute optimal DM would be the DM achievable by a cherry cultivar that maximizes flavour attributes and minimizes respiration under ideal conditions. In reality, the absolute optimal DM may or may not be reached during a growing season depending on environmental conditions and orchard management practices; however, cherry cultivars will reach a DM that will be optimal for the growing conditions at harvest maturity, as the present research demonstrates. Developing definitive DM standards to determine optimal harvest points for different cultivars under different environmental conditions should be a direction of research to be further pursued to ensure cherry quality, particularly for cherries subjected to longer term storage and/or cherries destined for the overseas export market.

    The present work is not the first to point to the importance of DM and cherry flavour retention, as an anecdotal report[33] indicated that SH cherries should be harvested at a DM of no higher than 20% or the fruit will lose both sugar and acidity more rapidly during shipping storage. Although this DM value is lower than the DM recommended for SH in the current work, it indicates the importance of DM level and flavour quality in relation to a specific cultivar. The differences between optimal DM for flavour retention in our work and the anecdotal report signifies the complexity of determining DM standards and the impact of growing year/environmental conditions and orchard management practices on optimal DM. Growers will continue to face these complex issues but the present work provides valuable information to growers regarding DM standards for three cultivars.

    It must be noted again that development of absolute DM standards for different cherry cultivars requires more study under rigorous controlled environmental conditions. Additionally, given the impact of environmental conditions on optimal DM, cultivars of interest must be studied over many growing years and orchard conditions to collect a robust data set. Nevertheless, the present research indicates that SH, SC, and SL cultivars have different dry matter values at maturity. The data also shows the DM range for SH cherries at maturity is higher than the DM range for SC cherries at maturity and that for SL, lower DM levels maintained lower respiration rates at lower temperatures, potentially improving ability to maintain quality after harvest.

    Overall, this research showed that DM was a better indicator of flavour quality than colour, as DM was related to both sugars and TA, while colour was only related to sugar. Therefore, this work identified that colour may not be a reliable indicator of maturity and/or flavor quality. This work indicated that cherries of the same colour may differ in DM, SS, and TA due to cultivar type and growing conditions as influenced by growing year. Relative humidity encountered by cherries during the growing season was negatively correlated with TA and higher growing temperatures were positively correlated with TA. This work discovered that sweet cherries may self-actualize, in that when growing conditions are favourable, DM levels may tend towards a certain level at maturity (optimal DM) resulting in superior flavour quality attributes and lower respiration, allowing cherries to reach their full quality potential and ensure quality retention in storage. Therefore, optimal DM can be reached at maturity despite colour. Remaining challenges include development of DM standards for various sweet cherry cultivars and further understanding the impact of growing conditions to better allow for self-actualization and prediction of the optimal DM under those conditions to optimize timing of harvest from year-to-year. Nevertheless, this research based on field work for three sweet cherry cultivars over three growing years, indicated an optimal DM range for SH between 22.5%−25% DM and an optimal DM range for SC between 19.5%−22.5% DM. Interestingly, under the same field conditions, the optimal DM range for SH cherries was higher than the optimal DM range for SC cherries. More analysis is required for determining optimal DM for SL, but the initial data indicates DM in the range of 20.5% to 22.6% maintained lower respiration rates at lower temperature potentially improving ability to maintain quality after harvest.

    The authors confirm contribution to the paper as follows: study conception and design: Ross KA, DeLury NC, Fukumoto L; data collection: Ross KA, DeLury NC, Fukumoto L; analysis and interpretation of results: Ross KA, DeLury NC, Fukumoto L; draft manuscript preparation: Ross KA, DeLury N, Fukumoto L, Forsyth JA. All authors reviewed the results and approved the final version of the manuscript.

    The datasets generated during and/or analysed during the current study are available from the corresponding author on reasonable request.

    We are grateful to the BC Cherry Association for financial support of this research project. We acknowledge Manon Gentes, Gillian Beaudry, and Duncan Robinson for their technical assistance. We are grateful to Brenda Lannard for providing her expertise on using the Felix F750 handheld spectrometer (Felix Instruments, Inc.) to obtain dry matter values and obtaining respiration data. Kelly A. Ross would like to thank and acknowledge Dr. Peter Toivonen for his mentorship, valuable scientific discussions and consistently kind support.

  • The authors declare that they have no conflict of interest.

  • Supplementary File 1 Nucleotide a nd p redicted a mino a cid s equences o f t he cuticle biosynthesis-related transcripts.
    Supplementary Table S1 Summary of homology search for sweet pitaya (Stenocereus thurberi) transcripts in different databases. Homologous sequences were predicted by an alignment through BLAST21 to the protein databases listed in the table with an E value threshold of < 1 × 10−10 for the nr-NCBI database and an E value threshold of < 1 × 10⁵ for the others.
    Supplementary Table S2 Homology search for sweet pitaya (Stenocereus thurberi) transcripts in commercial fruits and other cactus. Homologous sequences were predicted by an alignment through BLAST21 to the protein databases listed in the table with an E value threshold of < 1 × 10⁻⁵.
    Supplementary Table S3 Nucleotide and amino acid sequences of characterized cuticle biosynthesis genes from model plants.
    Supplementary Table S4 List of proteins from Arabidopsis (subject) homologous to sweet pitaya transcripts (query). BLASTx alignment against the TAIR database with an E value < 1×10⁻⁵. Only the results of the thirteen bi-directional homologous transcripts here analyzed are shown.
    Supplementary Table S5 List of proteins from tomato (subject) homologous to sweet pitaya transcripts (query). BLASTx alignment against the ITAG database with an E value < 1 × 10⁻⁵. Only the results of the thirteen bi-directional homologous transcripts here analyzed are shown.
    Supplementary Table S6 List of predicted proteins from sweet pitaya (subject) homologous to cuticle biosynthesis genes from model plants (query). BLASTx alignment against the sweet pitaya predicted proteins with an E value < 1 × 10⁻⁵.
    Supplementary Table S7 List of predicted proteins from sweet pitaya (subject) homologous to cuticle biosynthesis proteins from model plants (query). BLASTp alignment against the sweet pitaya predicted proteins with an E value < 1 × 10⁻⁵.
    Supplementary Table S8 List of transcripts from sweet pitaya (subject) homologous to cuticle biosynthesis proteins from model plants (query). tBLASTn alignment against the sweet pitaya transcriptome with an E value < 1×10⁻⁵.
    Supplementary Table S9 List of transcription factors homologous to sweet pitaya transcripts. BLASTx alignment against the PlantTFDB with a E value < 1 × 10⁻⁵.
    Supplementary Table S10 List of protein kinases homologous to sweet pitaya transcripts. BLASTx alignment with a E value < 1 × 10⁻⁵.
    Supplementary Table S11 List of transcriptional regulators homologous to sweet pitaya transcripts. BLASTx alignment with a E value < 1 × 10⁻⁵.
    Supplementary Table S12 Gene Ontology (GO) terms and Enzyme Codes (EC) assigned to the sweet pitaya peel transcripts.
    Supplementary Table S13 Top20 of Gene Ontology (GO) terms assigned to the sweet pitaya peel transcripts.
    Supplementary Table S14 Metabolic pathways from the KEGG database assigned to the sweet pitaya peel transcripts.
    Supplementary Table S15 Length of coding and long non-coding transcripts from sweet pitaya peel.
    Supplementary Table S16 Abundance of coding and long non-coding transcripts from sweet pitaya peel.
    Supplementary Table S17 Differential expression analysis results between M1 and M2 libraries. FC: Fold Change, CPM: Counts per million of reads, FDR: False Discovery Rate.
    Supplementary Table S18 Differential expression analysis results between M1 and M3 libraries. FC: Fold Change, CPM: Counts per million of reads, FDR: False Discovery Rate.
    Supplementary Table S19 Differential expression analysis results between M1 and M4 libraries. FC: Fold Change, CPM: Counts per million of reads, FDR: False Discovery Rate.
    Supplementary Table S20    Expression data of the not differentially expressed transcripts (log2FC < 1, FDR < 0.05).
    Supplementary Table S21 Expression data of the 27 tentative reference genes with the lowest coefficient of variation (< 0.113).
    Supplementary Table S22 Expression data and coefficient of variation of the 14 sweet pitaya transcripts homologous to reference genes from other cactus fruits.
    Supplementary Table S23 Homology of the candidate reference genes and the cuticle biosynthesis-related transcripts from Stenocereus thurberi. The homologous search was carried out through BLAST alignment of the S. thurberi transcriptome to Hylocereus polyrhizus transcripts, TAIR, ITAG, and SwissProt database using a maximal E value of 1×10⁻⁵. Abbreviations: Actin 7  (StACT7), alpha-tubulin (StTUA), elongation factor 1-alpha (StEF1a), COP1-interactive protein 1 (StCIP1), plasma membrane ATPase 4 (StPMA4), BEL1-like homeodomain protein 1 (StBLH1), polyubiquitin 3 (StUBQ3), plastidic ATP/ADP-transporter (StTLC1), cytochrome p450 family 77 subfamily A (StCYP77A), Gly-Asp-Ser-Leu motif lipase/esterase 1 (StGDSL1), and ATP binding cassette transporter family G member 11 (StABCG11). S. thurberi transcripts identified in this study were designated with the prefix "St" and the name of their best homologous match from other plant species.
    Supplementary Table S24 Oligonucleotide sequences designed to amplify the candidate reference genes and transcripts involved in cuticle biosynthesis. Primers were designed with the PrimerQuest, OligoAnalyzer, and UNAFold tools from Integrated DNA Technologies (www.idtdna.com). Abbreviations: Primer melting temperature (Tm), base pairs (bp), plastidic ATP/ADPtransporter (StTLC1), plasma membrane ATPase 4 (StPMA4), polyubiquitin 3 (StUBQ3), alpha-tubulin (StTUA), actin 7 (StACT7), elongation factor 1-alpha (StEF1a), COP1-interactive protein 1 (StCIP1), ATP binding cassette transporter family G member 11 (StABCG11), BEL1-like homeodomain protein 1 (StBLH1), Gly-Asp-Ser-Leu motif lipase/esterase 1 (StGDSL1), and cytochrome p450 family 77 subfamily A (StCYP77A). S. thurberi transcripts identified in this study were designated with the prefix "St" and the name of their best homologous match from other plant species.
    Supplementary Table S25 Nucleotide sequences of the candidate reference genes.
    Supplementary Table S26 Cycle threshold (Ct) values of the tentative reference genes during sweet pitaya fruit development.
    Supplementary Table S27 Stability analysis of the candidate reference genes during sweet pitaya fruit development. The values were calculated by the algorithms geNorm (M value), NormFinder (stability value), BestKeeper (standard deviation +/− crossing point value), the deltaCt method (average of standard deviation), and RefFinder (geometric mean of ranking values) from the cycle threshold (Ct) data. The lowest values indicate the most stable genes. The Ct data was recorded by qRT-PCR in a QIAquant 96 5 plex (QIAGEN) following the manufacturer's protocol. Abbreviations: Actin 7 (StACT7), alpha-tubulin (StTUA), elongation factor 1-alpha (StEF1a), COP1-interactive protein 1 (StCIP1), plasma membrane ATPase 4 (StPMA4), BEL1-like homeodomain protein 1 (StBLH1), polyubiquitin 3 (StUBQ3), and plastidic ATP/ADP-transporter (StTLC1). S. thurberi transcripts identified in this study were designated with the prefix "St" and the name of their best homologous match from other plant species.
    Supplementary Table S28 Expression of cutin biosynthesis-related transcripts during sweet pitaya fruit development normalized with four normalization strategies. Relative expression (RE) was calculated through the 2−ΔΔCt method using elongation factor 1-alpha (StEF1a), alpha-tubulin (StTUA), polyubiquitin 3 (StUBQ3), and StEF1a+StTUA as normalizing genes using the 10 DAF (days after flowering) stage as calibrator. Data represent the mean ± standard error (SE) of each developmental stage (n = 4−6). Different letters denote significant differences (Tukey HSD test, p < 0.05) between developmental stages in DAF. Statistical analysis was carried out through stats packages in R Studio. The Ct data for the analysis was recorded by qRT-PCR in a QIAquant 96 5 plex (QIAGEN) according to the manufacturer's protocol. Abbreviations: Cytochrome p450 family 77 subfamily A (StCYP77A), Gly-Asp-Ser-Leu motif lipase/esterase 1 (StGDSL1), and ATP binding cassette transporter family G member 11 (StABCG11). S. thurberi transcripts identified in this study were designated with the prefix "St" and the name of their best homologous match from other plant species.
    Supplementary Fig. S1 Sweet pitaya fruit developmental stages. The numbers in the picture indicate the days after flowering (DAF). A longitudinal cut of sweet pitaya fruit at 40 DAF is showed. White bar = 1.0 cm.
    Supplementary Fig. S2 Homology analysis of assembled transcripts. E value distribution (a, b) and identity distribution (c, d) of the matches in the Swiss-Prot (a, c) and RefSeq (b, d) databases. (a,b) The number inside the pie chart indicates the number of transcripts recorded using that E value. Alignment by BLASTx with an E value threshold of 1 × 10⁻⁵.
    Supplementary Fig. S3 Amplification specificity of the candidate reference genes. Melting curve analysis of the candidate reference genes Actin 7 (StACT7), (a) alpha-tubulin (StTUA), (b) elongation factor 1-alpha (StEF1a), (c) COP1-interactive protein 1 (StCIP1), (d) plasma membrane ATPase 4 (StPMA4), (e) BEL1-like homeodomain protein 1 (StBLH1), (f) polyubiquitin 3 (StUBQ3), (g) and plastidic ATP/ADP-transporter (StTLC1), (h) Transcript quantification and melting curve were recorded in a QIAquant 96 5 plex (QIAGEN) following the manufacturer's protocol.
    Supplementary Fig. S4 Analysis of the predicted protein StCYP77A from Stenocereus thurberi. (a) Phylogenetic tree of StCYP77A and related proteins of the subfamily CYP77A (CYP77A2, CYP77A4, and CYP77A6) from Solanum lycopersicum (Sl), Solanum melongena (Sm), Nicotiana attenuata (Na), Beta vulgaris (Bv), Carnegiea gigantean (Cg), Arabidopsis thaliana (At), Isatis tinctoria (It), and Hirschfeldia incana (Hi). The database accession number is included next to the protein name. The scale bar of 0.05 represented a sequence divergence of 5%. The number in the branches is the percentage bootstrap value of 1,000 replicates. The highest percentages represent more significant results. The black square shows AtCYP77A4 and AtCYP77A6 from A. thaliana. The black diamond shows the homologous SmCYP77A2 from S. melongena. The red circle and red triangle show StCYP77A from S. thurberi and a protein from the closest related species C. gigantean, respectively. Neighbor-joining (NJ) phylogenetic tree constructed by MEGA11 software. (b) The predicted membranespanning region of StCYP77A. The probability of membrane insertion (Y-axis) and transmembrane region represented by purple color was determined by TMHMM software. (c) Predicted protein domains contained in StCYP77A amino acid sequences determined by InterProScan.
    Supplementary Fig. S5 Analysis of the predicted protein StGDSL1 from Stenocereus thurberi. (a, b) Signal peptide and topology of StGDSL1 amino acid sequence. (a) The amino acid sequence corresponding to the signal peptide (red, orange, and yellow) and the cleavage site (CS; green dashed line) were determined by Signal P 6.0 software. (b) The signal peptide (orange) and outside (blue) region of the protein sequence were determined by deepTMHMM software. (c) Predicted protein domains contained in StGDSL1 amino acid sequences were determined by InterProScan.
    Supplementary Fig. S6 Analysis of the predicted protein StABCG11 from Stenocereus thurberi. (a) Phylogenetic tree of StABCG11 and related proteins of the classes ABCG11, ABCG12, and ABCG13 from Arabidopsis thaliana (At), Gossypium arboreum (Ga), Citrus sinensis (Cs), Medicago truncatula (Mt), Solanum lycopersicum (Sl), Eutrema halophilum (Eh), Carnegiea gigantean (Cg), Beta vulgaris (Bv), and Spinacia oleracea (So). The database accession number next to the protein name is shown. The scale bar of 0.10 represented a sequence divergence of 10%. The number in the branches is the percentage bootstrap value of 1,000 replicates. The highest percentages represent higher significant results. The black square beside the protein name shows AtABCG11, AtABCG12, and AtABCG13 from A. thaliana. The red circle and red triangle next to the protein name show StABCG11 from S. thurberi and a protein from the closest related species, C. gigantean, respectively. Neighbor-joining (NJ) phylogenetic tree constructed by MEGA11 software. (b) The predicted transmembrane helices of StABCG11. The probability of membrane insertion (Y-axis) and transmembrane region represented by purple color was determined by TMHMM software. (c) Multiple sequence alignment of StABCG11 and its homologous from A. thaliana (AT1G17840), S. lycopersicum (Solyc03g019760), and C. gigantean (KAJ8441854). Amino acids are colored according to the chemistry classification of their side-chain. The darkest blue bars below the protein sequences indicate 100% conservation. Black rectangles show the conserved sequence of the Walker A and B motif and the ABC signature, named below the rectangles. Black width lines below the sequence show the predicted transmembrane helices of StABCG11. Alignment was carried out by MUSCLE in MEGA11 and drawn by ggmsa in R Studio.
  • [1]

    Hultine KR, Hernández-Hernández T, Williams DG, Albeke SE, Tran N, et al. 2023. Global change impacts on cacti (Cactaceae): current threats, challenges and conservation solutions. Annals of Botany 132:671−83

    doi: 10.1093/aob/mcad040

    CrossRef   Google Scholar

    [2]

    Liu L, Wang X, Chang C. 2022. Toward a smart skin: harnessing cuticle biosynthesis for crop adaptation to drought, salinity, temperature, and ultraviolet stress. Frontiers in Plant Science 13:961829

    doi: 10.3389/fpls.2022.961829

    CrossRef   Google Scholar

    [3]

    García-Coronado H, Tafolla-Arellano JC, Hernández-Oñate MÁ, Burgara-Estrella AJ, Robles-Parra JM, et al. 2022. Molecular biology, composition and physiological functions of cuticle lipids in fleshy fruits. Plants 11:1133

    doi: 10.3390/plants11091133

    CrossRef   Google Scholar

    [4]

    Matas AJ, Yeats TH, Buda GJ, Zheng Y, Chatterjee S, et al. 2011. Tissue- and cell-type specific transcriptome profiling of expanding tomato fruit provides insights into metabolic and regulatory specialization and cuticle formation. The Plant Cell 23:3893−910

    doi: 10.1105/tpc.111.091173

    CrossRef   Google Scholar

    [5]

    Albert Z, Ivanics B, Molnár A, Miskó A, Tóth M, et al. 2013. Candidate genes of cuticle formation show characteristic expression in the fruit skin of apple. Plant Growth Regulation 70:71−78

    doi: 10.1007/s10725-012-9779-y

    CrossRef   Google Scholar

    [6]

    Alkio M, Jonas U, Declercq M, Van Nocker S, Knoche M. 2014. Transcriptional dynamics of the developing sweet cherry (Prunus avium L.) fruit: sequencing, annotation and expression profiling of exocarp-associated genes. Horticulture Research 1:11

    doi: 10.1038/hortres.2014.11

    CrossRef   Google Scholar

    [7]

    Tafolla-Arellano JC, Zheng Y, Sun H, Jiao C, Ruiz-May E, et al. 2017. Transcriptome analysis of mango (Mangifera indica L.) fruit epidermal peel to identify putative cuticle-associated genes. Scientific Reports 7:46163

    doi: 10.1038/srep46163

    CrossRef   Google Scholar

    [8]

    Wu X, Shi X, Bai M, Chen Y, Li X, et al. 2019. Transcriptomic and gas chromatography–mass spectrometry metabolomic profiling analysis of the epidermis provides insights into cuticular wax regulation in developing 'Yuluxiang' pear fruit. Journal of Agricultural and Food Chemistry 67:8319−31

    doi: 10.1021/acs.jafc.9b01899

    CrossRef   Google Scholar

    [9]

    Xiao F, Mark Goodwin S, Xiao Y, Sun Z, Baker D, et al. 2004. Arabidopsis CYP86A2 represses Pseudomonas syringae type III genes and is required for cuticle development. The EMBO Journal 23:2903−13

    doi: 10.1038/sj.emboj.7600290

    CrossRef   Google Scholar

    [10]

    Li-Beisson Y, Pollard M, Sauveplane V, Pinot F, Ohlrogge J, et al. 2009. Nanoridges that characterize the surface morphology of flowers require the synthesis of cutin polyester. Proceedings of the National Academy of Sciences of the United States of America 106:22008−13

    doi: 10.1073/pnas.0909090106

    CrossRef   Google Scholar

    [11]

    Sauveplane V, Kandel S, Kastner PE, Ehlting J, Compagnon V, et al. 2009. Arabidopsis thaliana CYP77A4 is the first cytochrome P450 able to catalyze the epoxidation of free fatty acids in plants. The FEBS Journal 276:719−35

    doi: 10.1111/j.1742-4658.2008.06819.x

    CrossRef   Google Scholar

    [12]

    Grausem B, Widemann E, Verdier G, Nosbüsch D, Aubert Y, et al. 2014. CYP77A19 and CYP77A20 characterized from Solanum tuberosum oxidize fatty acids in vitro and partially restore the wild phenotype in an Arabidopsis thaliana cutin mutant. Plant, Cell & Environment 37:2102−15

    doi: 10.1111/pce.12298

    CrossRef   Google Scholar

    [13]

    Yang L, Shi C, Mu X, Liu C, Shi K, et al. 2015. Cloning and expression of a wild eggplant cytochrome P450 gene, StoCYP77A2, involved in plant resistance to Verticillium dahliae. Plant Biotechnology Reports 9:167−77

    doi: 10.1007/s11816-015-0355-6

    CrossRef   Google Scholar

    [14]

    Ge S, Qin K, Ding S, Yang J, Jiang L, et al. 2022. Gas chromatography–mass spectrometry metabolite analysis combined with transcriptomic and proteomic provide new insights into revealing cuticle formation during pepper development. Journal of Agricultural and Food Chemistry 70:12383−97

    doi: 10.1021/acs.jafc.2c04522

    CrossRef   Google Scholar

    [15]

    Luo B, Xue XY, Hu WL, Wang LJ, Chen XY. 2007. An ABC transporter gene of Arabidopsis thaliana, AtWBC11, is involved in cuticle development and prevention of organ fusion. Plant and Cell Physiology 48:1790−802

    doi: 10.1093/pcp/pcm152

    CrossRef   Google Scholar

    [16]

    Bird D, Beisson F, Brigham A, Shin J, Greer S, et al. 2007. Characterization of Arabidopsis ABCG11/WBC11, an ATP binding cassette (ABC) transporter that is required for cuticular lipid secretion. The Plant Journal 52:485−98

    doi: 10.1111/j.1365-313X.2007.03252.x

    CrossRef   Google Scholar

    [17]

    McFarlane HE, Shin JJH, Bird DA, Samuels AL. 2010. Arabidopsis ABCG transporters, which are required for export of diverse cuticular lipids, dimerize in different combinations. The Plant Cell 22:3066−75

    doi: 10.1105/tpc.110.077974

    CrossRef   Google Scholar

    [18]

    Panikashvili D, Shi JX, Schreiber L, Aharoni A. 2011. The Arabidopsis ABCG13 transporter is required for flower cuticle secretion and patterning of the petal epidermis. New Phytologist 190:113−24

    doi: 10.1111/j.1469-8137.2010.03608.x

    CrossRef   Google Scholar

    [19]

    Chen N, Song B, Tang S, He J, Zhou Y, et al. 2018. Overexpression of the ABC transporter gene TsABCG11 increases cuticle lipids and abiotic stress tolerance in Arabidopsis. Plant Biotechnology Reports 12:303−13

    doi: 10.1007/s11816-018-0495-6

    CrossRef   Google Scholar

    [20]

    Yeats TH, Martin LBB, Viart HMF, Isaacson T, He Y, et al. 2012. The identification of cutin synthase: formation of the plant polyester cutin. Nature Chemical Biology 8:609−11

    doi: 10.1038/nchembio.960

    CrossRef   Google Scholar

    [21]

    Girard AL, Mounet F, Lemaire-Chamley M, Gaillard C, Elmorjani K, et al. 2012. Tomato GDSL1 is required for cutin deposition in the fruit cuticle. The Plant Cell 24:3119−34

    doi: 10.1105/tpc.112.101055

    CrossRef   Google Scholar

    [22]

    Lashbrooke J, Adato A, Lotan O, Alkan N, Tsimbalist T, et al. 2015. The tomato MIXTA-like transcription factor coordinates fruit epidermis conical cell development and cuticular lipid biosynthesis and assembly. Plant Physiology 169:2553−71

    doi: 10.1104/pp.15.01145

    CrossRef   Google Scholar

    [23]

    Castro-Enríquez DD, Montaño-Leyva B, Del Toro-Sánchez CL, Juárez-Onofre JE, Carvajal-Millán E, et al. 2020. Effect of ultrafiltration of Pitaya extract (Stenocereus thurberi) on its phytochemical content, antioxidant capacity, and UPLC-DAD-MS profile. Molecules 25:281

    doi: 10.3390/molecules25020281

    CrossRef   Google Scholar

    [24]

    Haas BJ, Papanicolaou A, Yassour M, Grabherr M, Blood PD, et al. 2013. De novo transcript sequence reconstruction from RNA-seq using the Trinity platform for reference generation and analysis. Nature Protocols 8:1494−512

    doi: 10.1038/nprot.2013.084

    CrossRef   Google Scholar

    [25]

    Patra GK, Gupta D, Rout GR, Panda SK. 2023. Role of long non coding RNA in plants under abiotic and biotic stresses. Plant Physiology and Biochemistry 194:96−110

    doi: 10.1016/j.plaphy.2022.10.030

    CrossRef   Google Scholar

    [26]

    Zhu B, Yang Y, Li R, Fu D, Wen L, et al. 2015. RNA sequencing and functional analysis implicate the regulatory role of long non-coding RNAs in tomato fruit ripening. Journal of Experimental Botany 66:4483−95

    doi: 10.1093/jxb/erv203

    CrossRef   Google Scholar

    [27]

    Ou L, Liu Z, Zhang Z, Wei G, Zhang Y, et al. 2017. Noncoding and coding transcriptome analysis reveals the regulation roles of long noncoding RNAs in fruit development of hot pepper (Capsicum annuum L.). Plant Growth Regulation 83:141−56

    doi: 10.1007/s10725-017-0290-3

    CrossRef   Google Scholar

    [28]

    Tian Y, Bai S, Dang Z, Hao J, Zhang J, Hasi A, et al. 2019. Genome-wide identification and characterization of long non-coding RNAs involved in fruit ripening and the climacteric in Cucumis melo. BMC Plant Biology 19:369

    doi: 10.1186/s12870-019-1942-4

    CrossRef   Google Scholar

    [29]

    Zhou H, Ren F, Wang X, Qiu K, Sheng Y, et al. 2022. Genome-wide identification and characterization of long noncoding RNAs during peach (Prunus persica) fruit development and ripening. Scientific Reports 12:11044

    doi: 10.1038/s41598-022-15330-3

    CrossRef   Google Scholar

    [30]

    Wan CY, Wilkins TA. 1994. A modified hot borate method significantly enhances the yield of high-quality RNA from cotton (Gossypium hirsutum L.). Analytical Biochemistry 223:7−12

    doi: 10.1006/abio.1994.1538

    CrossRef   Google Scholar

    [31]

    Bairoch A, Apweiler R. 2000. The SWISS-PROT protein sequence database and its supplement TrEMBL in 2000. Nucleic Acids Research 28:45−48

    doi: 10.1093/nar/28.1.45

    CrossRef   Google Scholar

    [32]

    Lamesch P, Berardini TZ, Li D, Swarbreck D, Wilks C, et al. 2012. The Arabidopsis Information Resource (TAIR): improved gene annotation and new tools. Nucleic Acids Research 40:D1202−D1210

    doi: 10.1093/nar/gkr1090

    CrossRef   Google Scholar

    [33]

    O'Leary NA, Wright MW, Brister JR, Ciufo S, Haddad D, et al. 2016. Reference sequence (RefSeq) database at NCBI: current status, taxonomic expansion, and functional annotation. Nucleic Acids Research 44:D733−D745

    doi: 10.1093/nar/gkv1189

    CrossRef   Google Scholar

    [34]

    Jin J, Tian F, Yang DC, Meng YQ, Kong L, et al. 2017. PlantTFDB 4.0: toward a central hub for transcription factors and regulatory interactions in plants. Nucleic Acids Research 45:D1040–D1045

    doi: 10.1093/nar/gkw982

    CrossRef   Google Scholar

    [35]

    Conesa A, Götz S. 2008. Blast2GO: a comprehensive suite for functional analysis in plant genomics. International Journal of Plant Genomics 2008:619832

    doi: 10.1155/2008/619832

    CrossRef   Google Scholar

    [36]

    Wang Y, Zhao Y, Wu Y, Zhao X, Hao Z, et al. 2022. Transcriptional profiling of long non-coding RNAs regulating fruit cracking in Punica granatum L. under bagging. Frontiers in Plant Science 13:943547

    doi: 10.3389/fpls.2022.943547

    CrossRef   Google Scholar

    [37]

    Kalvari I, Nawrocki EP, Argasinska J, Quinones-Olvera N, Finn RD, et al. 2018. Non-coding RNA analysis using the Rfam database. Current Protocols in Bioinformatics 62:e51

    doi: 10.1002/cpbi.51

    CrossRef   Google Scholar

    [38]

    Kong L, Zhang Y, Ye ZQ, Liu XQ, Zhao SQ, et al. 2007. CPC: assess the protein-coding potential of transcripts using sequence features and support vector machine. Nucleic Acids Research 35:W345−W349

    doi: 10.1093/nar/gkm391

    CrossRef   Google Scholar

    [39]

    Kang YJ, Yang DC, Kong L, Hou M, Meng YQ, et al. 2017. CPC2: a fast and accurate coding potential calculator based on sequence intrinsic features. Nucleic Acids Research 45:W12−W16

    doi: 10.1093/nar/gkx428

    CrossRef   Google Scholar

    [40]

    Robinson MD, McCarthy DJ, Smyth GK. 2010. edgeR: a Bioconductor package for differential expression analysis of digital gene expression data. Bioinformatics 26:139−40

    doi: 10.1093/bioinformatics/btp616

    CrossRef   Google Scholar

    [41]

    Chen C, Wu J, Hua Q, Tel-Zur N, Xie F, et al. 2019. Identification of reliable reference genes for quantitative real-time PCR normalization in pitaya. Plant Methods 15:70

    doi: 10.1186/s13007-019-0455-3

    CrossRef   Google Scholar

    [42]

    Nong Q, Yang Y, Zhang M, Zhang M, Chen J, et al. 2019. RNA-seq-based selection of reference genes for RT-qPCR analysis of pitaya. FEBS Open Bio 9:1403−12

    doi: 10.1002/2211-5463.12678

    CrossRef   Google Scholar

    [43]

    Zheng Q, Wang X, Qi Y, Ma Y. 2021. Selection and validation of reference genes for qRT-PCR analysis during fruit ripening of red pitaya (Hylocereus polyrhizus). FEBS Open Bio 11:3142−52

    doi: 10.1002/2211-5463.13053

    CrossRef   Google Scholar

    [44]

    González-Agüero M, García-Rojas M, Di Genova A, Correa J, Maass A, et al. 2013. Identification of two putative reference genes from grapevine suitable for gene expression analysis in berry and related tissues derived from RNA-Seq data. BMC Genomics 14:878

    doi: 10.1186/1471-2164-14-878

    CrossRef   Google Scholar

    [45]

    Thornton B, Basu C. 2015. Rapid and simple method of qPCR primer design. In PCR Primer Design, ed. Basu C. New York, NY: Humana Press. pp. 173–79. doi:10.1007/978-1-4939-2365-6_13

    [46]

    Xie F, Wang J, Zhang B. 2023. RefFinder: a web-based tool for comprehensively analyzing and identifying reference genes. Functional & Integrative Genomics 23:125

    doi: 10.1007/s10142-023-01055-7

    CrossRef   Google Scholar

    [47]

    Vandesompele J, De Preter K, Pattyn F, Poppe B, Van Roy N, et al. 2002. Accurate normalization of real-time quantitative RT-PCR data by geometric averaging of multiple internal control genes. Genome Biology 3:research0034.1

    doi: 10.1186/gb-2002-3-7-research0034

    CrossRef   Google Scholar

    [48]

    Edgar RC. 2004. MUSCLE: a multiple sequence alignment method with reduced time and space complexity. BMC Bioinformatics 5:113

    doi: 10.1186/1471-2105-5-113

    CrossRef   Google Scholar

    [49]

    Tamura K, Stecher G, Kumar S. 2021. MEGA11: Molecular Evolutionary Genetics Analysis Version 11. Molecular Biology and Evolution 38:3022−27

    doi: 10.1093/molbev/msab120

    CrossRef   Google Scholar

    [50]

    Livak KJ, Schmittgen TD. 2001. Analysis of relative gene expression data using real-time quantitative PCR and the 2−ΔΔCᴛ method. Methods 25:402−08

    doi: 10.1006/meth.2001.1262

    CrossRef   Google Scholar

    [51]

    Silver N, Best S, Jiang J, Thein SL. 2006. Selection of housekeeping genes for gene expression studies in human reticulocytes using real-time PCR. BMC Molecular Biology 7:33

    doi: 10.1186/1471-2199-7-33

    CrossRef   Google Scholar

    [52]

    Raghavan V, Kraft L, Mesny F, Rigerte L. 2022. A simple guide to de novo transcriptome assembly and annotation. Briefings in Bioinformatics 23:bbab563

    doi: 10.1093/bib/bbab563

    CrossRef   Google Scholar

    [53]

    Leebens-Mack JH, Barker MS, Carpenter EJ, Deyholos MK, Gitzendanner MA, et al. 2019. One thousand plant transcriptomes and the phylogenomics of green plants. Nature 574:679−85

    doi: 10.1038/s41586-019-1693-2

    CrossRef   Google Scholar

    [54]

    Xi X, Zong Y, Li S, Cao D, Sun X, et al. 2019. Transcriptome analysis clarified genes involved in betalain biosynthesis in the fruit of red pitayas (Hylocereus costaricensis). Molecules 24:445

    doi: 10.3390/molecules24030445

    CrossRef   Google Scholar

    [55]

    Erpen L, Devi HS, Grosser JW, Dutt M. 2018. Potential use of the DREB/ERF, MYB, NAC and WRKY transcription factors to improve abiotic and biotic stress in transgenic plants. Plant Cell, Tissue and Organ Culture (PCTOC) 132:1−25

    doi: 10.1007/s11240-017-1320-6

    CrossRef   Google Scholar

    [56]

    Hu Y, Chen X, Shen X. 2022. Regulatory network established by transcription factors transmits drought stress signals in plant. Stress Biology 2:26

    doi: 10.1007/s44154-022-00048-z

    CrossRef   Google Scholar

    [57]

    Jiang B, Liu R, Fang X, Tong C, Chen H, et al. 2022. Effects of salicylic acid treatment on fruit quality and wax composition of blueberry (Vaccinium virgatum Ait). Food Chemistry 368:130757

    doi: 10.1016/j.foodchem.2021.130757

    CrossRef   Google Scholar

    [58]

    Baillo EH, Kimotho RN, Zhang Z, Xu P. 2019. Transcription factors associated with abiotic and biotic stress tolerance and their potential for crops improvement. Genes 10:771

    doi: 10.3390/genes10100771

    CrossRef   Google Scholar

    [59]

    Zhang JY, Broeckling CD, Sumner LW, Wang ZY. 2007. Heterologous expression of two Medicago truncatula putative ERF transcription factor genes, WXP1 and WXP2, in Arabidopsis led to increased leaf wax accumulation and improved drought tolerance, but differential response in freezing tolerance. Plant Molecular Biology 64:265−78

    doi: 10.1007/s11103-007-9150-2

    CrossRef   Google Scholar

    [60]

    Liu W, Cheng C, Lin Y, XuHan X, Lai Z. 2018. Genome-wide identification and characterization of mRNAs and lncRNAs involved in cold stress in the wild banana (Musa itinerans). PLoS One 13:e0200002

    doi: 10.1371/journal.pone.0200002

    CrossRef   Google Scholar

    [61]

    Zhu X, Tai X, Ren Y, Chen J, Bo T. 2019. Genome-wide analysis of coding and long non-coding RNAs involved in cuticular wax biosynthesis in cabbage (Brassica oleracea L. var. capitata). International Journal of Molecular Sciences 20:2820

    doi: 10.3390/ijms20112820

    CrossRef   Google Scholar

    [62]

    Corona-Gomez JA, Coss-Navarrete EL, Garcia-Lopez IJ, Klapproth C, Pérez-Patiño JA, et al. 2022. Transcriptome-guided annotation and functional classification of long non-coding RNAs in Arabidopsis thaliana. Scientific Reports 12:14063

    doi: 10.1038/s41598-022-18254-0

    CrossRef   Google Scholar

    [63]

    Lim PK, Zheng X, Goh JC, Mutwil M. 2022. Exploiting plant transcriptomic databases: resources, tools, and approaches. Plant Communications 3:100323

    doi: 10.1016/j.xplc.2022.100323

    CrossRef   Google Scholar

    [64]

    Wang Y, Dai M, Cai D, Shi Z. 2019. Screening for quantitative real-time PCR reference genes with high stable expression using the mRNA-sequencing data for pear. Tree Genetics & Genomes 15:54

    doi: 10.1007/s11295-019-1361-6

    CrossRef   Google Scholar

    [65]

    He F, Gui L, Zhang Y, Zhu B, Zhang X, et al. 2022. Validation of reference genes for gene expression analysis in fruit development of Vaccinium bracteatum Thunb. using quantitative real-time PCR. Scientific Reports 12:16946

    doi: 10.1038/s41598-022-20864-7

    CrossRef   Google Scholar

    [66]

    Liu J, Huang S, Niu X, Chen D, Chen Q, et al. 2018. Genome-wide identification and validation of new reference genes for transcript normalization in developmental and post-harvested fruits of Actinidia chinensis. Gene 645:1−6

    doi: 10.1016/j.gene.2017.12.012

    CrossRef   Google Scholar

    [67]

    Kou X, Zhang L, Yang S, Li G, Ye J. 2017. Selection and validation of reference genes for quantitative RT-PCR analysis in peach fruit under different experimental conditions. Scientia Horticulturae 225:195−203

    doi: 10.1016/j.scienta.2017.07.004

    CrossRef   Google Scholar

    [68]

    Zhu L, Yang C, You Y, Liang W, Wang N, et al. 2019. Validation of reference genes for qRT-PCR analysis in peel and flesh of six apple cultivars (Malus domestica) at diverse stages of fruit development. Scientia Horticulturae 244:165−71

    doi: 10.1016/j.scienta.2018.09.033

    CrossRef   Google Scholar

    [69]

    Berumen-Varela G, Palomino-Hermosillo YA, Bautista-Rosales PU, Peña-Sandoval GR, López-Gúzman GG, et al. 2020. Identification of reference genes for quantitative real-time PCR in different developmental stages and under refrigeration conditions in soursop fruits (Annona muricata L.). Scientia Horticulturae 260:108893

    doi: 10.1016/j.scienta.2019.108893

    CrossRef   Google Scholar

    [70]

    Cheng Y, Pang X, Wan H, Ahammed GJ, Yu J, et al. 2017. Identification of optimal reference genes for normalization of qPCR analysis during pepper fruit development. Frontiers in Plant Science 8:1128

    doi: 10.3389/fpls.2017.01128

    CrossRef   Google Scholar

    [71]

    McCartney AW, Dyer JM, Dhanoa PK, Kim PK, Andrews DW, et al. 2004. Membrane-bound fatty acid desaturases are inserted co-translationally into the ER and contain different ER retrieval motifs at their carboxy termini. The Plant Journal 37:156−73

    doi: 10.1111/j.1365-313X.2004.01949.x

    CrossRef   Google Scholar

    [72]

    Pineau E, Sauveplane V, Grienenberger E, Bassard JE, Beisson F, et al. 2021. CYP77B1 a fatty acid epoxygenase specific to flowering plants. Plant Science 307:110905

    doi: 10.1016/j.plantsci.2021.110905

    CrossRef   Google Scholar

    [73]

    Ding LN, Guo XJ, Li M, Fu ZL, Yan SZ, et al. 2019. Improving seed germination and oil contents by regulating the GDSL transcriptional level in Brassica napus. Plant Cell Reports 38:243−53

    doi: 10.1007/s00299-018-2365-7

    CrossRef   Google Scholar

    [74]

    Yeats TH, Howe KJ, Matas AJ, Buda GJ, Thannhauser TW, et al. 2010. Mining the surface proteome of tomato (Solanum lycopersicum) fruit for proteins associated with cuticle biogenesis. Journal of Experimental Botany 61:3759−71

    doi: 10.1093/jxb/erq194

    CrossRef   Google Scholar

    [75]

    Panikashvili D, Savaldi-Goldstein S, Mandel T, Yifhar T, Franke RB, et al. 2007. The Arabidopsis DESPERADO/AtWBC11 transporter is required for cutin and wax secretion. Plant Physiology 145:1345−60

    doi: 10.1104/pp.107.105676

    CrossRef   Google Scholar

    [76]

    Alkio M, Jonas U, Sprink T, van Nocker S, Knoche M. 2012. Identification of putative candidate genes involved in cuticle formation in Prunus avium (sweet cherry) fruit. Annals of Botany 110:101−12

    doi: 10.1093/aob/mcs087

    CrossRef   Google Scholar

  • Cite this article

    García-Coronado H, Hernández-Oñate MÁ, Tafolla-Arellano JC, Burgara-Estrella AJ, Tiznado-Hernández ME. 2024. De novo assembly of the sweet pitaya (Stenocereus thurberi) fruit peel transcriptome and identification of cuticle biosynthesis genes. Vegetable Research 4: e032 doi: 10.48130/vegres-0024-0031
    García-Coronado H, Hernández-Oñate MÁ, Tafolla-Arellano JC, Burgara-Estrella AJ, Tiznado-Hernández ME. 2024. De novo assembly of the sweet pitaya (Stenocereus thurberi) fruit peel transcriptome and identification of cuticle biosynthesis genes. Vegetable Research 4: e032 doi: 10.48130/vegres-0024-0031

Figures(7)  /  Tables(1)

Article Metrics

Article views(1695) PDF downloads(352)

ARTICLE   Open Access    

De novo assembly of the sweet pitaya (Stenocereus thurberi) fruit peel transcriptome and identification of cuticle biosynthesis genes

Vegetable Research  4 Article number: e032  (2024)  |  Cite this article

Abstract: Stenocereus thurberi is a cactus endemic to the Sonoran desert (Mexico), which produces a fruit named sweet pitaya. One trait that allows the cactus to survive in desert ecosystems is its cuticle, which limits water loss in dry conditions. Nevertheless, the mechanism of cuticle biosynthesis has yet to be described for cactus fruits. Also, transcripts from S. thurberi published in the databases are scarce. This study reports the de novo assembly of the sweet pitaya peel transcriptome. The assembly includes 174,449 transcripts with an N50 value of 2,110 bp. Out of the total transcripts, 43,391 were classified as long non-coding RNA. Functional categorization analysis suggests that mechanisms of response to stress and cuticle biosynthesis are carried out in fruit pitaya peel. The transcripts coding for a cytochrome p450 77A (StCYP77A), Gly-Asp-Ser-Leu motif lipase/esterase 1 (StGDSL1), and ATP binding cassette G 11 (StABCG11), which carried out the synthesis, polymerization, and transport of cuticle components, respectively, were identified. Expression analysis during fruit development suggests an active cuticle biosynthesis at the early stages and the ripe stages, carried out by StCYP77A, StGDSL1, and StABCG11. The dataset generated here will help to improve the elucidation of the molecular mechanism of cuticle biosynthesis in S. thurberi and other cactus fruits.

    • Columnar cacti are plants of the Cactaceae family distributed across arid and semi-arid regions of America, with ecological, economic, and cultural value[1]. One trait that makes it possible for the columnar cactus to survive in the desert ecosystem is its thick epidermis covered by a hydrophobic cuticle, which limits water loss in dry conditions[1]. The cuticle is the external layer that covers the non-woody aerial organs of land plants. The careful control of cuticle biosynthesis could produce drought stress tolerance in relevant crop plants[2]. In fleshy fruits, the cuticle maintains adequate water content during fruit development on the plant and reduces water loss in fruit during postharvest[3]. Efforts to elucidate the molecular pathway of cuticle biosynthesis have been carried out for fleshy fruits such as tomato (Solanum lycopersicum)[4], apple (Malus domestica)[5], sweet cherry (Prunus avium)[6], mango (Mangifera indica)[7], and pear (Pyrus 'Yuluxiang')[8].

      The plant cuticle is formed by the two main layers cutin and cuticular waxes[3]. Cutin is composed mainly of oxygenated long-chain (LC) fatty acids (FA), which are synthesized by cytochrome p450 (CYP) enzymes. CYP family 86 subfamily A (CYP86A) enzymes carry out the terminal (ω) oxidation of LC-FA[9]. Then, CYP77A carries out the mid-chain oxidation to synthesize the main cutin monomers. In Arabidopsis, AtCYP77A4 and AtCYP77A6 carry out the synthesis of mid-chain epoxy and mid-chain dihydroxy LC-FA, respectively[10,11]. AtCYP77A6 is required for the cutin biosynthesis and the correct formation of floral surfaces[10]. The expression of CYP77A19 (KF410855) and CYP77A20 (KF410856) from potato (Solanum tuberosum) restored the petal cuticular impermeability in Arabidopsis null mutant cyp77a6-1, tentatively by the synthesis of cutin monomers[12]. In eggplant (Solanum torvum), the over-expression of StoCYP77A2 leads to resistance to Verticillium dahlia infection in tobacco plants[13]. Although the function of CYP77A2 in cutin biosynthesis has not yet been tested, gene expression analysis suggests that CaCYP77A2 (A0A1U8GYB0) could play a role in cutin biosynthesis during pepper fruit development[14].

      It has been hypothesized that the export of cuticle precursors is carried out by ATP binding cassette subfamily G (ABCG) transporters. ABCG11/WBC11, ABCG12, and ABCG13 are required for the load of cuticle lipids in Arabidopsis[1517], but ABCG13 function appears to be specific to the flower epidermis[18]. The overexpression of TsABCG11 (JQ389853) from Thellungiella salsugineum increases cuticle amounts and promotes tolerance to different abiotic stresses in Arabidopsis[19].

      Once exported, the cutin monomers are polymerized on the surface of epidermal cells. CD1 code for a Gly-Asp-Ser-Leu motif lipase/esterase (GDSL) from tomato required for the cutin formation through 2-mono(10,16-dihydroxyhexadecanoyl)glycerol esterification[20]. GDSL1 from tomato carries out the ester bond cross-links of cutin monomers located at the cuticle layers and is required for cuticle deposition in tomato fruits[21]. It has been shown that the transcription factor MIXTA-like reduces water loss in tomato fruits through the positive regulation of the expression of CYP77A2, ABCG11, and GDSL1[22]. Despite the relevant role of cuticles in maintaining cactus homeostasis in desert environments[1], the molecular mechanism of cuticle biosynthesis has yet to be described for cactus fruits.

      Stenocereus thurberi is a columnar cactus endemic from the Sonoran desert (Mexico), which produces an ovoid-globose fleshy fruit named sweet pitaya[23]. In its mature state, the pulp of sweet pitaya contains around 86% water with a high content of antioxidants and natural pigments such as betalains and phenolic compounds, which have nutraceutical and industrial relevance[23]. Due to the arid environment in which pitaya fruit grows, studying its molecular mechanism of cuticle biosynthesis can generate new insights into understanding species' adaptation mechanisms to arid environments. Nevertheless, sequences of transcripts from S. thurberi in public databases are scarce.

      RNA-sequencing technology (RNA-seq) allows the massive generation of almost all the transcripts from non-model plants, even if no complete assembled genome is available[24]. Recent advances in bioinformatic tools has improved our capacity to identify long non-coding RNA (lncRNA), which have been showed to play regulatory roles in relevant biological processes, such as the regulation of drought stress tolerance in plants[25], fruit development, and ripening[2629].

      In this study, RNA-seq data were obtained for the de novo assembly and characterization of the S. thurberi fruit peel transcriptome. As a first approach, three transcripts, StCYP77A, StABCG11, and StGDSL1, tentatively involved in cuticle biosynthesis, were identified and quantified during sweet pitaya fruit development. Due to no gene expression analysis having been carried out yet for S. thurberi, stably expressed constitutive genes were identified for the first time.

    • Sweet pitaya fruits (S. thurberi) without physical damage were hand harvested from plants in a native conditions field located at Carbó, Sonora, México. They were collocated in a cooler containing dry ice and transported immediately to the laboratory. The superficial part of the peels (~1 mm deep) was removed carefully from the fruits using a scalpel. Peel samples from three fruits were pooled according to their tentative stage of development defined by their visual characteristics, frozen in liquid nitrogen, and pulverized to create a single biological replicate. Four samples belonging to four different plants were analyzed. All fruits harvested were close to the ripening stage. Samples named M1 and M2 were turning from green to ripe [~35−40 Days After Flowering (DAF)], whereas samples M3 and M4 were turning from ripe to overripe (~40−45 DAF).

      Total RNA was isolated from the peels through the Hot Borate method[30]. The concentration and purity of RNA were determined in a spectrophotometer Nanodrop 2000 (Thermo Fisher) by measuring the 260/280 and 260/230 absorbance ratios. RNA integrity was evaluated through electrophoresis in agarose gel 1% and a Bioanalyzer 2100 (Agilent). Pure RNA was sequenced in the paired-end mode in an Illumina NextSeq 500 platform at the University of Arizona Genetics Core Facility. Four RNA-seq libraries, each of them from each sample, were obtained, which include a total of 288,199,704 short reads with a length of 150 base pairs (bp). The resulting sequence data can be accessed at the Sequence Read Archive (SRA) repository of the NCBI through the BioProject ID PRJNA1030439. Libraries are named corresponding to the names of samples M1, M2, M3, and M4.

    • FastQC software (www.bioinformatics.babraham.ac.uk/projects/fastqc) was used for short reads quality analysis. Short reads with poor quality were trimmed or eliminated by Trimmomatic (www.usadellab.org/cms/?page=trimmomatic) with a trailing and leading of 25, a sliding window of 4:25, and a minimum read length of 80 bp. A total of 243,194,888 reads with at least a 25 quality score on the Phred scale were used to carry out the de novo assembly by Trinity (https://github.com/trinityrnaseq/trinityrnaseq/wiki) with the following parameters: minimal k-mer coverage of 1, normalization of 50, and minimal transcript length of 200 bp.

      Removal of contaminating sequences and ribosomal RNA (rRNA) was carried out through SeqClean. To remove redundancy, transcripts with equal or more than 90% of identity were merged through CD-hit (www.bioinformatics.org/cd-hit/). Alignment and quantification in terms of transcripts per million (TPM) were carried out through Bowtie (https://bowtie-bio.sourceforge.net/index.shtml) and RSEM (https://github.com/deweylab/RSEM), respectively. Transcripts showing a low expression (TPM < 0.01) were discarded. Assembly quality was evaluated by calculating the parameters N50 value, mean transcript length, TransRate score, and completeness. The statistics of the transcriptome were determined by TrinityStats and TransRate (https://hibberdlab.com/transrate/). The transcriptome completeness was determined through a BLASTn alignment (E value < 1 × 10⁻³) by BUSCO (https://busco.ezlab.org/) against the database of conserved orthologous genes from Embryophyte.

    • To predict the proteins tentatively coded in the S. thurberi transcriptome, the best homology match of the assembled transcripts was found by alignment to the Swiss-Prot, RefSeq, nr-NCBI, PlantTFDB, iTAK, TAIR, and ITAG databases using the BLAST algorithm with an E value threshold of 1 × 10⁻¹⁰ for the nr-NCBI database and of 1 × 10⁻⁵ for the others[3134]. An additional alignment was carried out to the protein databases of commercial fruits Persea americana, Prunus persica, Fragaria vesca, Citrus cinensis, and Vitis vinifera to proteins of the cactus Opuntia streptacantha, and the transcriptomes of the cactus Hylocereus polyrhizus, Pachycereus pringlei, and Selenicereus undatus. The list of all databases and the database websites of commercial fruits and cactus are provided in Supplementary Tables S1 & S2. The open reading frame (ORF) of the transcripts and the protein sequences tentative coded from the sweet pitaya transcriptome was predicted by TransDecoder (https://github.com/TransDecoder/TransDecoder/wiki), considering a minimal ORF length of 75 amino acids (aa). The search for protein domains was carried out by the InterPro database (www.ebi.ac.uk/interpro). Functional categorization was carried out by Blast2GO based on GO terms and KEGG metabolic pathways[35].

    • LncRNA were identified based on the methods reported in previous studies[25,29,36]. Transcripts without homology to any protein from Swiss-Prot, RefSeq, nr-NCBI, PlantTFDB, iTAK, TAIR, ITAG, P. americana, P. persica, F. vesca, C. cinensis, V. vinifera, and O. streptacantha databases, without a predicted ORF longer than 75 aa, and without protein domains in the InterPro database were selected to identify tentative lncRNA.

      Transcripts coding for signal peptide or transmembrane helices were identified by SignalP (https://services.healthtech.dtu.dk/services/SignalP-6.0/) and TMHMM (https://services.healthtech.dtu.dk/services/TMHMM-2.0/), respectively, and discarded. Further, transcripts corresponding to other non-coding RNAs (ribosomal RNA and transfer RNA) were identified through Infernal by using the Rfam database[37] and discarded. The remaining transcripts were analyzed by CPC[38], and CPC2[39] to calculate their coding potential. Transcripts with a coding potential score lower than −1 for CPC and a coding probability lower than 0.1 for CPC2 were considered lncRNA. To characterize the identified lncRNA, the length and abundance of coding and lncRNA were calculated. Bowtie and RSEM were used to align and quantify raw counts, respectively. The edgeR package[40] was used to normalize raw count data in terms of counts per million (CPM) for both coding and lncRNA.

    • To obtain the transcript's expression, the aligning of short reads and quantifying of transcripts were carried out through Bowtie and RSEM software, respectively. A differential expression analysis was carried out between the four libraries by edgeR package in R Studio. Only the transcripts with a count equal to or higher than 0.5 in at least one sample were retained for the analysis. Transcripts with log2 Fold Change (log2FC) between +1 and −1 and with a False Discovery Rate (FDR) lower than 0.05 were taken as not differentially expressed (NDE).

      For the identification of the tentative reference genes two strategies were carried out as described below: i) The NDE transcripts were aligned by BLASTn (E value < 1 × 10⁻⁵) to 43 constitutive genes previously reported in fruits from the cactus H. polyrhizus, S. monacanthus, and S. undatus[4143] to identify possible homologous constitutive genes in S. thurberi. Then, the homologous transcripts with the minimal coefficient of variation (CV) were selected; ii) For all the NDE transcripts, the percentile 95 value of the mean CPM and the percentile 5 value of the CV were used as filters to recover the most stably expressed transcripts, based on previous studies[44]. Finally, transcripts to be tested by quantitative reverse transcription polymerase chain reaction (qRT-PCR) were selected based on their homology and tentative biological function.

    • The fruit harvesting was carried out as described above. Sweet pitaya fruit takes about 43 d to ripen, therefore, open flowers were tagged, and fruits with 10, 20, 30, 35, and 40 DAF were collected to cover the pitaya fruit development process (Supplementary Fig. S1). The superficial part of the peels (~1 mm deep) was removed carefully from the fruits using a scalpel. Peel samples from three fruits were pooled according to their stage of development defined by their DAF, frozen in liquid nitrogen, and pulverized to create a single biological replicate. One biological replicate consisted of peels from three fruits belonging to the same plant. Two to three biological replicates were evaluated for each developmental stage. Two technical replicates were analyzed for each biological replicate. RNA extraction, quantification, RNA purity, and RNA integrity analysis were carried out as described above.

      cDNA was synthesized from 100 ng of RNA by QuantiTect Reverse Transcription Kit (QIAGEN). Primers were designed using the PrimerQuest™, UNAFold, and OligoAnalyzer™ tools from Integrated DNA Technologies (www.idtdna.com/pages) and following the method proposed by Thornton & Basu[45]. Transcripts quantification was carried out in a QIAquant 96 5 plex according to the PowerUp™ SYBR™ Green Master Mix protocol (Applied Biosystems), with a first denaturation step for 2 min at 95 °C, followed by 40 cycles of denaturation step at 95 °C for 15 s, annealing and extension steps for 30 s at 60 °C.

      The Cycle threshold (Ct) values obtained from the qRT-PCR were analyzed through the algorithms BestKeeper, geNorm, NormFinder, and the delta Ct method[46]. RefFinder (www.ciidirsinaloa.com.mx/RefFinder-master/) was used to integrate the stability results and to find the most stable expressed transcripts in sweet pitaya fruit peel during development. The pairwise variation value (Vn/Vn + 1) was calculated through the geNorm algorithm in R Studio software[47].

    • An alignment of 17 reported cuticle biosynthesis genes from model plants were carried out by BLASTx against the predicted proteins from sweet pitaya. Two additional alignments of 17 charaterized cuticle biosynthesis proteins from model plants against the transcripts and predicted proteins of sweet pitaya were carried out by tBLASTn and BLASTp, respectively. An E value threshold of 1 × 10⁻⁵ was used, and the unique best hits were recovered for all three alignments. The sequences of the 17 characterized cuticle biosynthesis genes and proteins from model plants are showed in Supplementary Table S3. The specific parameters and the unique best hits for all the alignments carried out are shown in Supplementary Tables S4S8.

      Cuticle biosynthesis-related transcripts tentatively coding for a cytochrome p450 family 77 subfamily A (CYP77A), a Gly-Asp-Ser-Leu motif lipase/esterase 1 (GDSL1), and an ATP binding cassette transporter subfamily G member 11 (ABCG11) were identified by best bi-directional hit according to the functional annotation described above. Protein-conserved domains, signal peptide, and transmembrane helix were predicted through InterProScan, SignalP 6.0, and TMHMM, respectively. Alignment of the protein sequences to tentative orthologous of other plant species was carried out by the MUSCLE algorithm[48]. A neighbor-joining (NJ) phylogenetic tree with a bootstrap of 1,000 replications was constructed by MEGA11[49].

      Fruit sampling, primer design, RNA extraction, cDNA synthesis, and transcript quantification were performed as described above. Relative expression was calculated according to the 2−ΔΔCᴛ method[50]. The sample corresponding to 10 DAF was used as the calibrator. The transcripts StEF1a, StTUA, StUBQ3, and StEF1a + StTUA were used as normalizer genes.

    • Normality was assessed according to the Shapiro-Wilk test. Significant differences in the expression of the cuticle biosynthesis-related transcripts between fruit developmental stages were determined by one-way ANOVA based on a completely randomized sampling design and a Tukey honestly significant difference (HSD) test, considering a p-value < 0.05 as significant. Statistical analysis was carried out through the stats package in R Studio.

    • RNA was extracted from the peels of ripe sweet pitaya fruits (S. thurberi) from plants located in the Sonoran Desert, Mexico. Four cDNA libraries were sequenced in an Illumina NextSeq 500 platform at the University of Arizona Genetics Core Facility. A total of 288,199,704 reads with 150 base pairs (bp) in length were sequenced in paired-end mode. After trimming, 243,194,888 (84.38%) cleaned short reads with at least 29 mean quality scores per read in the Phred scale and between 80 to 150 bp in length were obtained to carry out the assembly. After removing contaminating sequences, redundancy, and low-expressed transcripts, the assembly included 174,449 transcripts with an N50 value of 2,110 bp. Table 1 shows the different quality variables of the S. thurberi fruit peel transcriptome. BUSCO score showed that 85.4% are completed transcripts, although out of these, 37.2% were found to be duplicated. The resulting sequence data can be accessed at the SRA repository of the NCBI through the BioProject ID PRJNA1030439.

      Table 1.  Quality metrics of the Stenocereus thurberi fruit peel transcriptome.

      Metric Data
      Total transcripts 174,449
      N50 2,110
      Smallest transcript length (bp) 200
      Largest transcript length (bp) 19,114
      Mean transcript length (bp) 1,198.69
      GC (%) 41.33
      Total assembled bases 209,110,524
      TransRate score 0.05
      BUSCO score (%) C: 85.38 (S:48.22, D:37.16),
      F: 10.69, M: 3.93.
      Values were calculated through the TrinityStats function of Trinity and TransRate software. Completeness analysis was carried out through BUSCO by aligning the transcriptome to the Embryophyte database through BLAST with an E value threshold of 1 × 10⁻³. Complete (C), single (S), duplicated (D), fragmented (F), missing (M).
    • A summary of the homology search in the main public protein database for the S. thurberi transcriptome is shown in Supplementary Table S1. From these databases, the higher homologous transcripts were found in RefSeq with 93,993 (53.87 %). Based on the E value distribution, for 41,685 (44%) and 68,853 (49%) of the hits, it was found a strong homology (E value lower than 1 × 10−50) to proteins in the Swiss-Prot and RefSeq databases, respectively (Supplementary Fig. S2a & b). On the other hand, 56,539 (52.34%) and 99,599 (71.11%) of the matches showed a percentage of identity higher than 60% in the Swiss-Prot and RefSeq databases, respectively (Supplementary Fig. S2c & d).

      Figure 1 shows the homology between transcripts from S. thurberi and proteins of commercial fruits, as well as proteins and transcripts of cacti. Transcripts from S. thurberi homologous to proteins from fruits of commercial interest avocado (P. americana), peach (P. persica), strawberry (F. vesca), orange (C. sinensis), and grapefruit (V. vinifera) ranged from 77,285 (44.30%) to 85,421 (48.96%), with 70,802 transcripts homologous to all the five fruit protein databases (Fig. 1a).

      Transcripts homologous to transcripts or proteins from the cactus dragon fruit (H. polyrhizus), prickly pear cactus (O. streptacantha), Mexican giant cardon (P. pringlei), and pitahaya (S. undatus) ranged from 76,238 (43.70%) to 114,933 (65.88%), with 64,009 transcripts homologous to all the four cactus databases (Fig. 1b). Further, out of the total of transcripts, 44,040 transcripts (25.25%) showed homology only to sequences from cactus, but not for model plants Arabidopsis, tomato, or the commercial fruits included in this study (Fig. 1c).
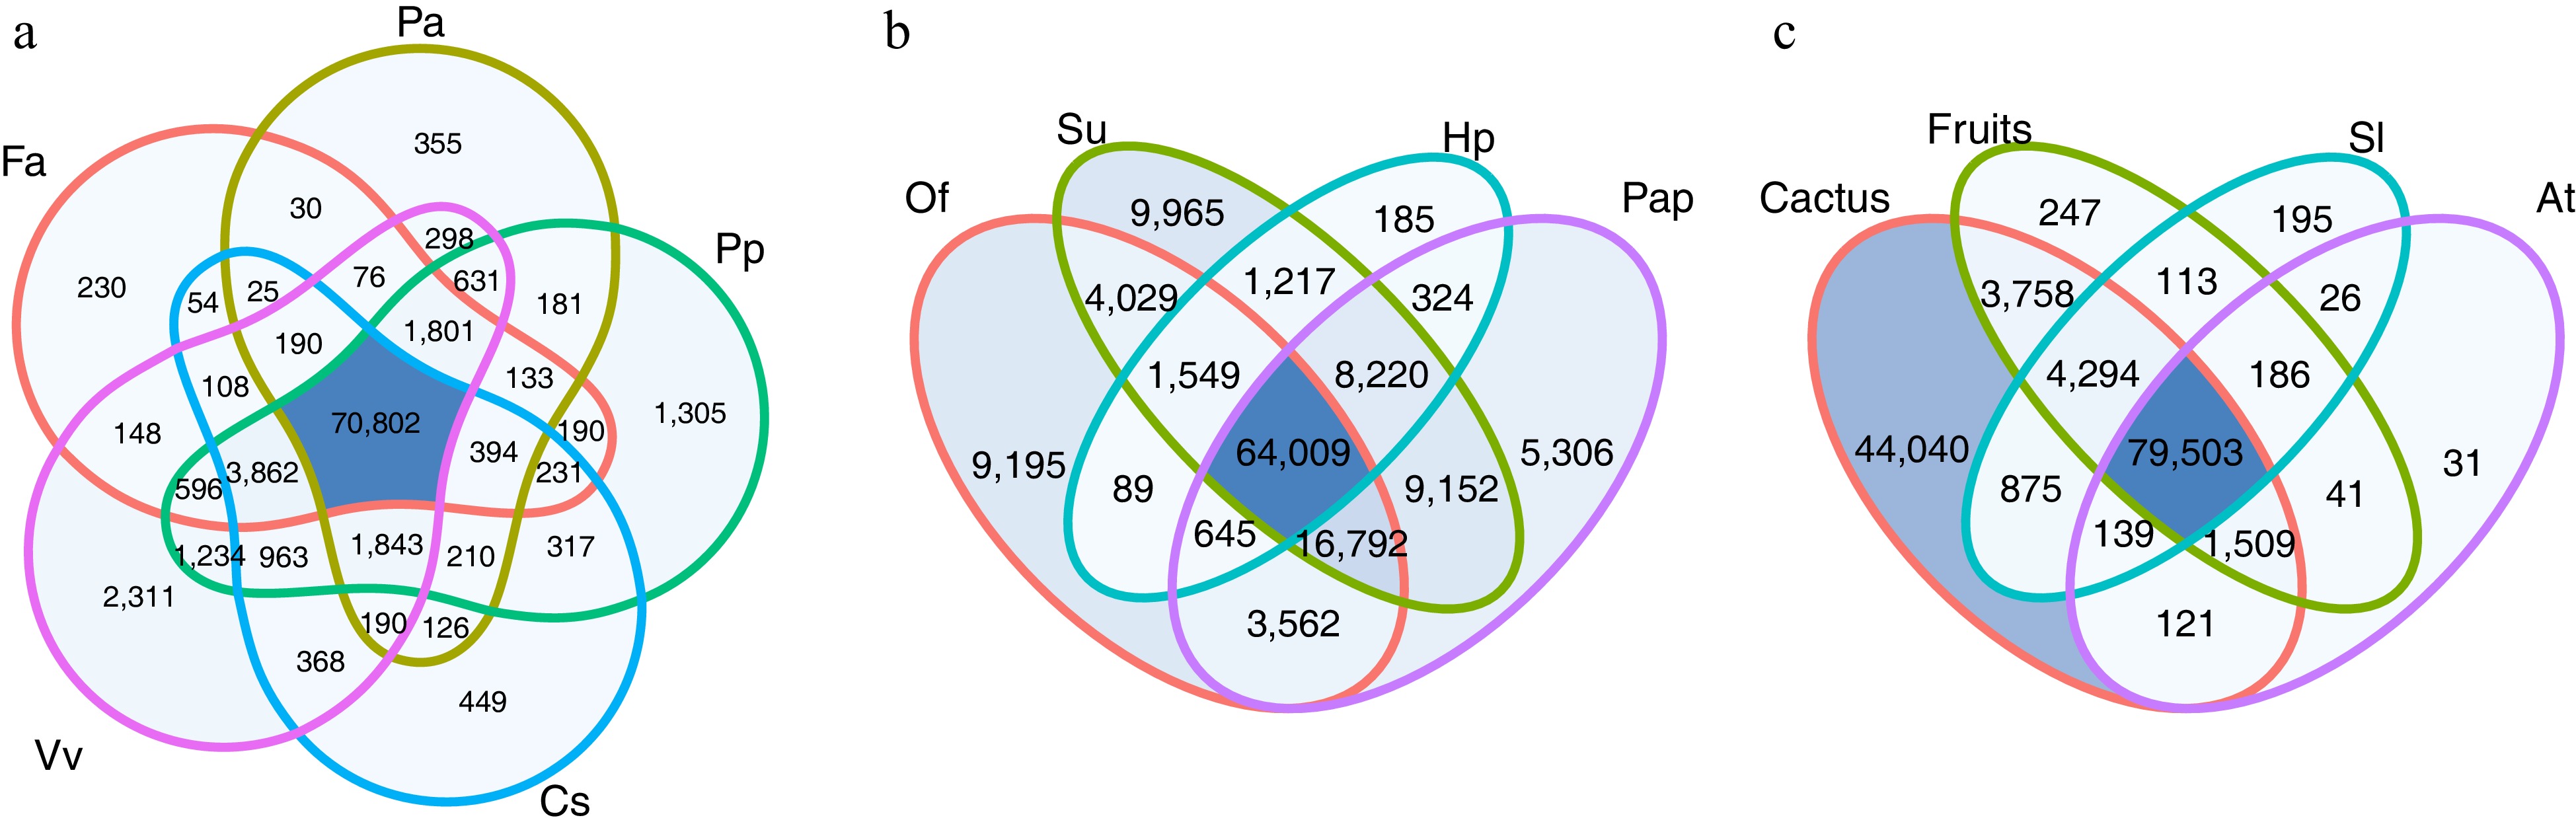
      Figure 1. 

      Venn diagram of the homology search results against model plants databases, commercial fruits, and cactus. The number in the diagram corresponds to the number of transcripts from S. thurberi homologous to sequences from that plant species. (a) Homologous to sequences from Fragaria vesca (Fa), Persea americana (Pa), Prunus persica (Pp), Vitis vinifera (Vv), and Citrus sinensis (Cs). (b) Homologous to sequences from Opuntia streptacantha (Of), Selenicereus undatus (Su), Hylocereus polyrhizus (Hp), and Pachycereus pringlei (Pap). (c) Homologous to sequences from Solanum lycopersicum (Sl), Arabidopsis thaliana (At), from the commercial fruits (Fa, Pa, Pp, Vv, and Cs), or the cactus included in this study (Of, Su, Hp, and Pap). Homologous searching was carried out by BLAST alignment (E value < 1 × 10⁻⁵). The Venn diagrams were drawn by ggVennDiagram in R Studio.

      A total of 45,970 (26.35%), 58,704 (33.65%), and 48,186 (27.65%) transcripts showed homology to transcription factors, transcriptional regulators, and protein kinases in the PlantTFDB, iTAK-TR, and iTAK-PK databases, respectively (Supplementary Tables S1, S9S11). For the PlantTFDB, the homologous transcripts belong to 57 transcriptional factors (TF) families (Fig. 2 & Supplementary Table S9), from which, the most frequent were the basic-helix-loop-helix (bHLH), myeloblastosis-related (MYB-related), NAM, ATAF, and CUC (NAC), ethylene responsive factor (ERF), and the WRKY domain families (WRKY) (Fig. 2).
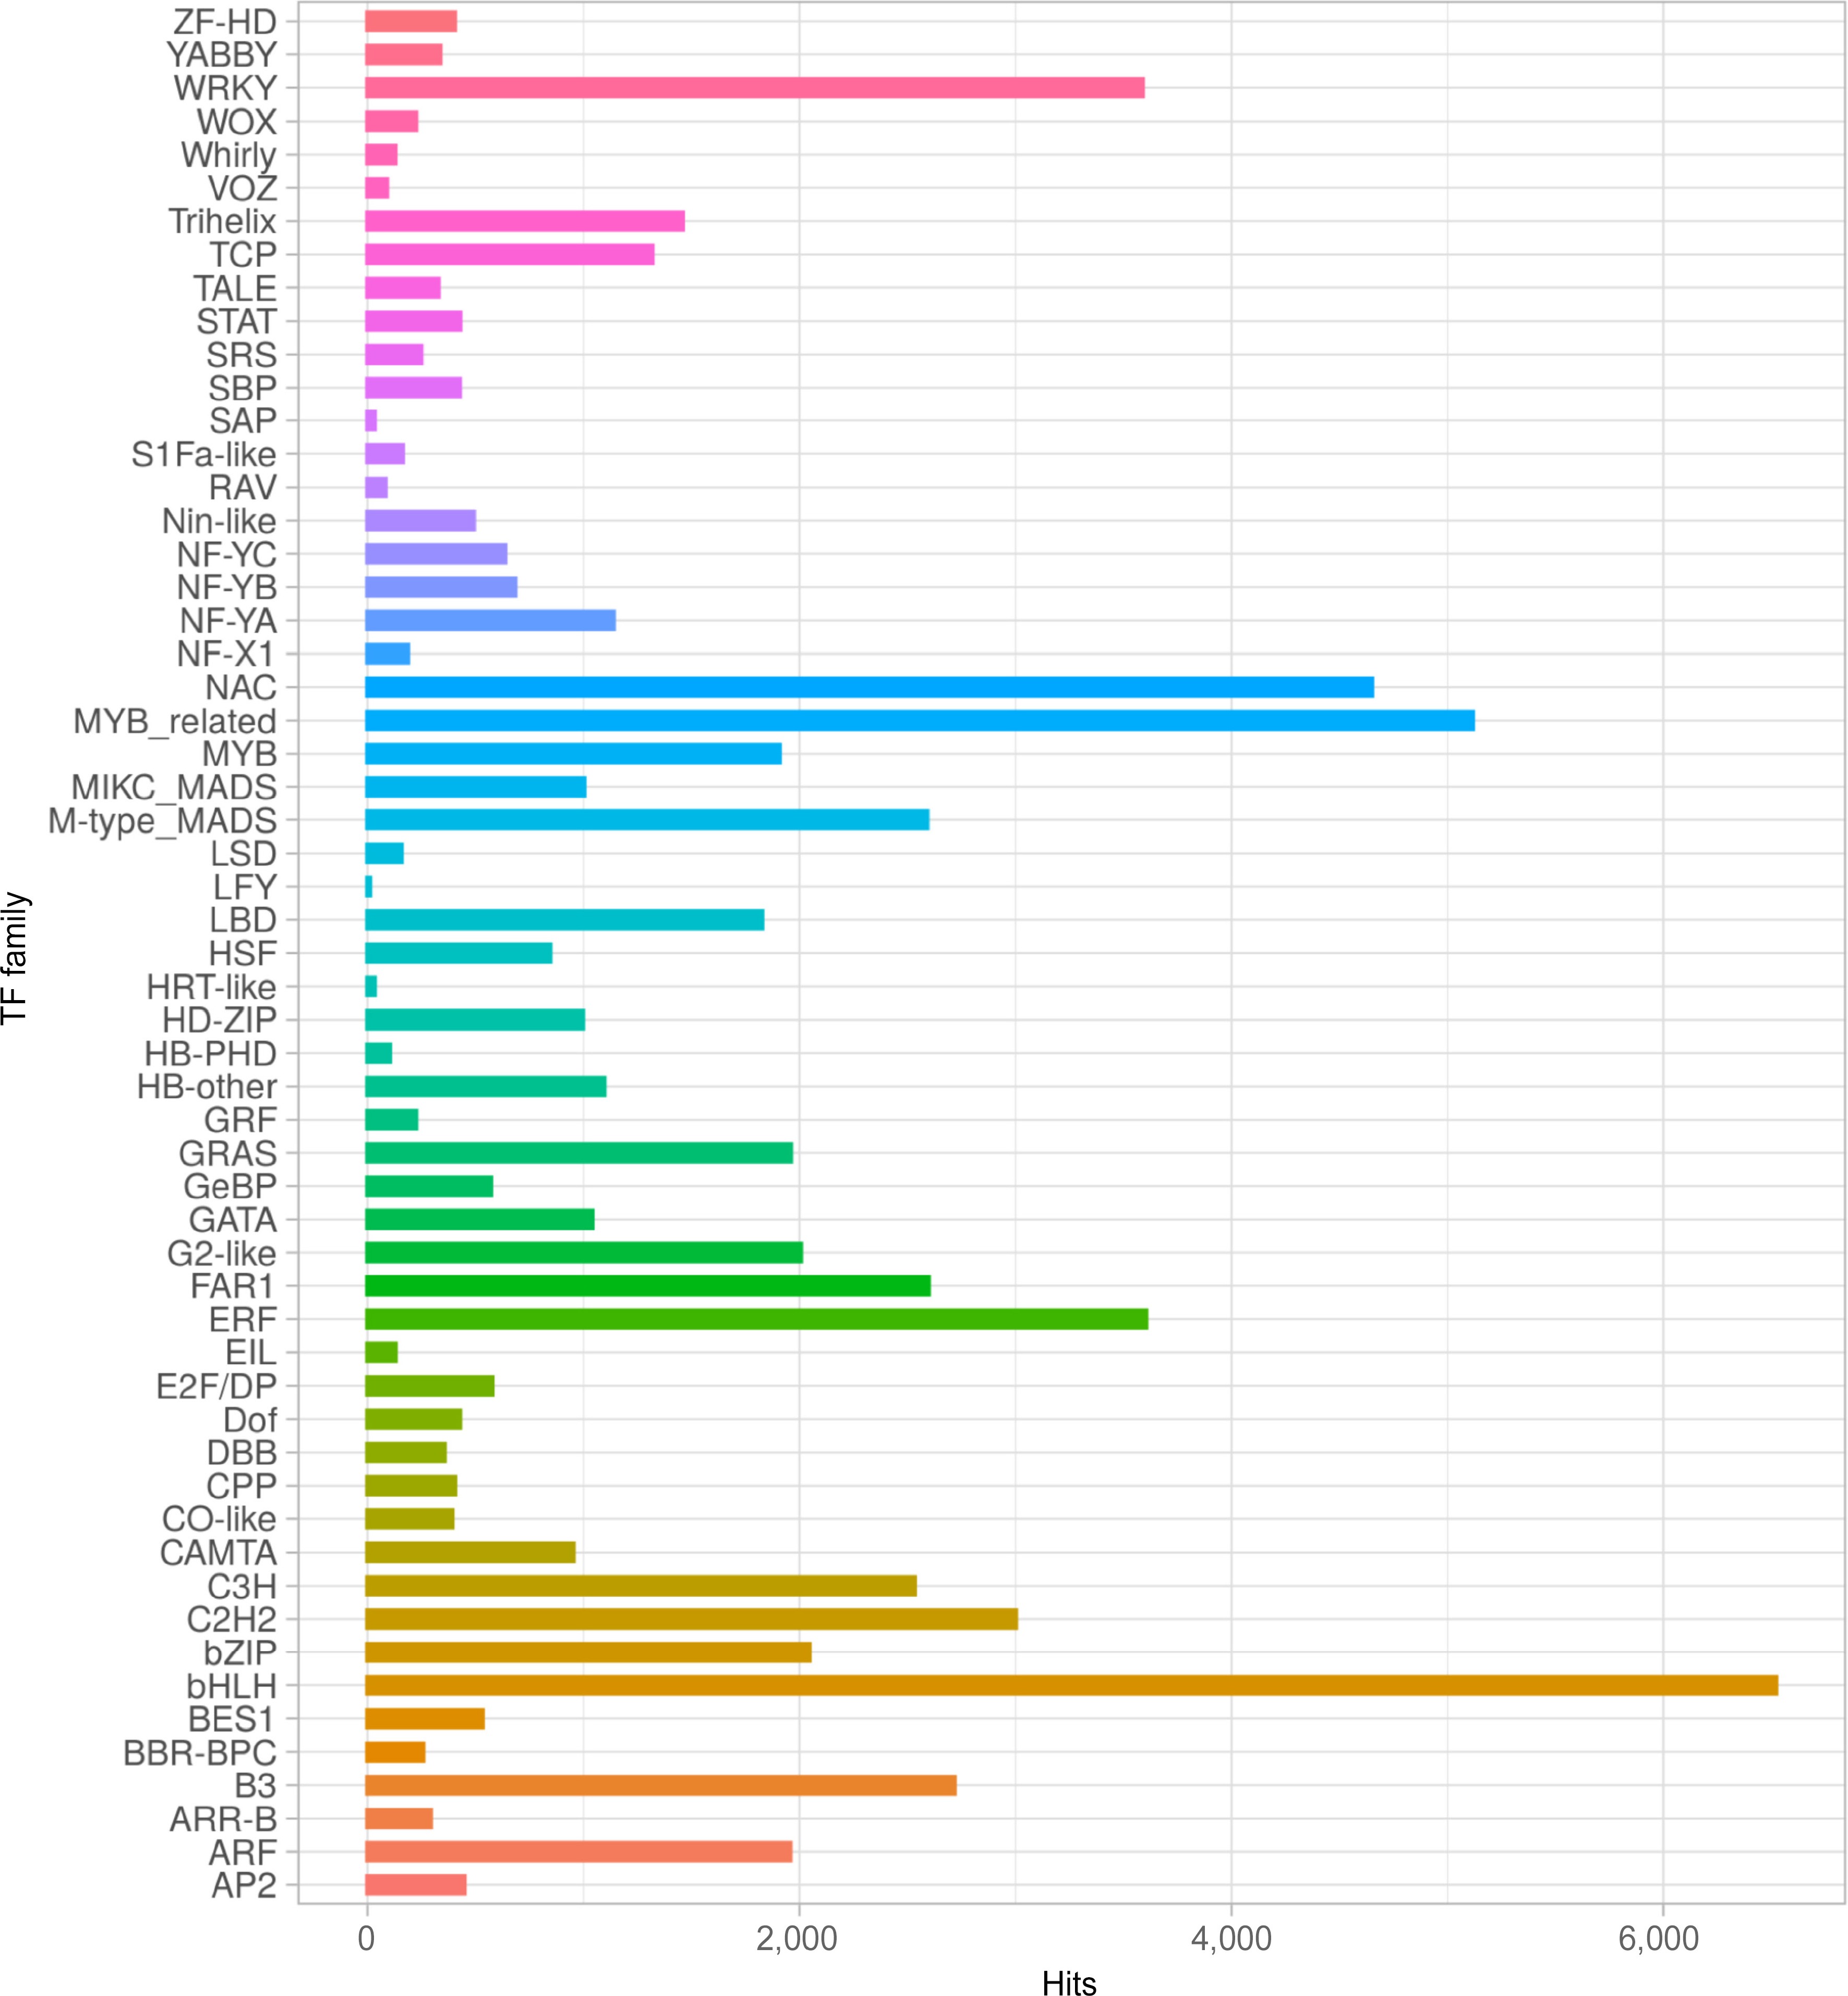
      Figure 2. 

      Transcription factor (TF) families distribution of S. thurberi fruit peel transcriptome. The X-axis indicates the number of transcripts with hits to each TF family. Alignment to the PlantTFDB database by BLASTx was carried out with an E value threshold of 1 × 10⁻⁵. The bar graph was drawn by ggplot2 in R Studio.

    • Based on the homology found and the functional domain searches, gene ontology terms (GO) were assigned to 68,559 transcripts (Supplementary Table S12). Figure 3 shows the top 20 GO terms assigned to the S. thurberi transcriptome, corresponding to the Biological Processes (BP) and Molecular Function (MF) categories. For BP, organic substance metabolic processes, primary metabolic processes, and cellular metabolic processes showed a higher number of transcripts (Supplementary Table S13). Further, for MF, organic cyclic compound binding, heterocyclic compound binding, and ion binding were the processes with the higher number of transcripts. S. thurberi transcripts were classified into 142 metabolic pathways from the KEGG database (Supplementary Table S14). The pathways with the higher number of transcripts recorded were pyruvate metabolism, glycerophospholipid metabolism, glycolysis/gluconeogenesis, and citrate cycle. Further, among the top 20 KEEG pathways, the cutin, suberin, and wax biosynthesis include more than 30 transcripts (Fig. 4).
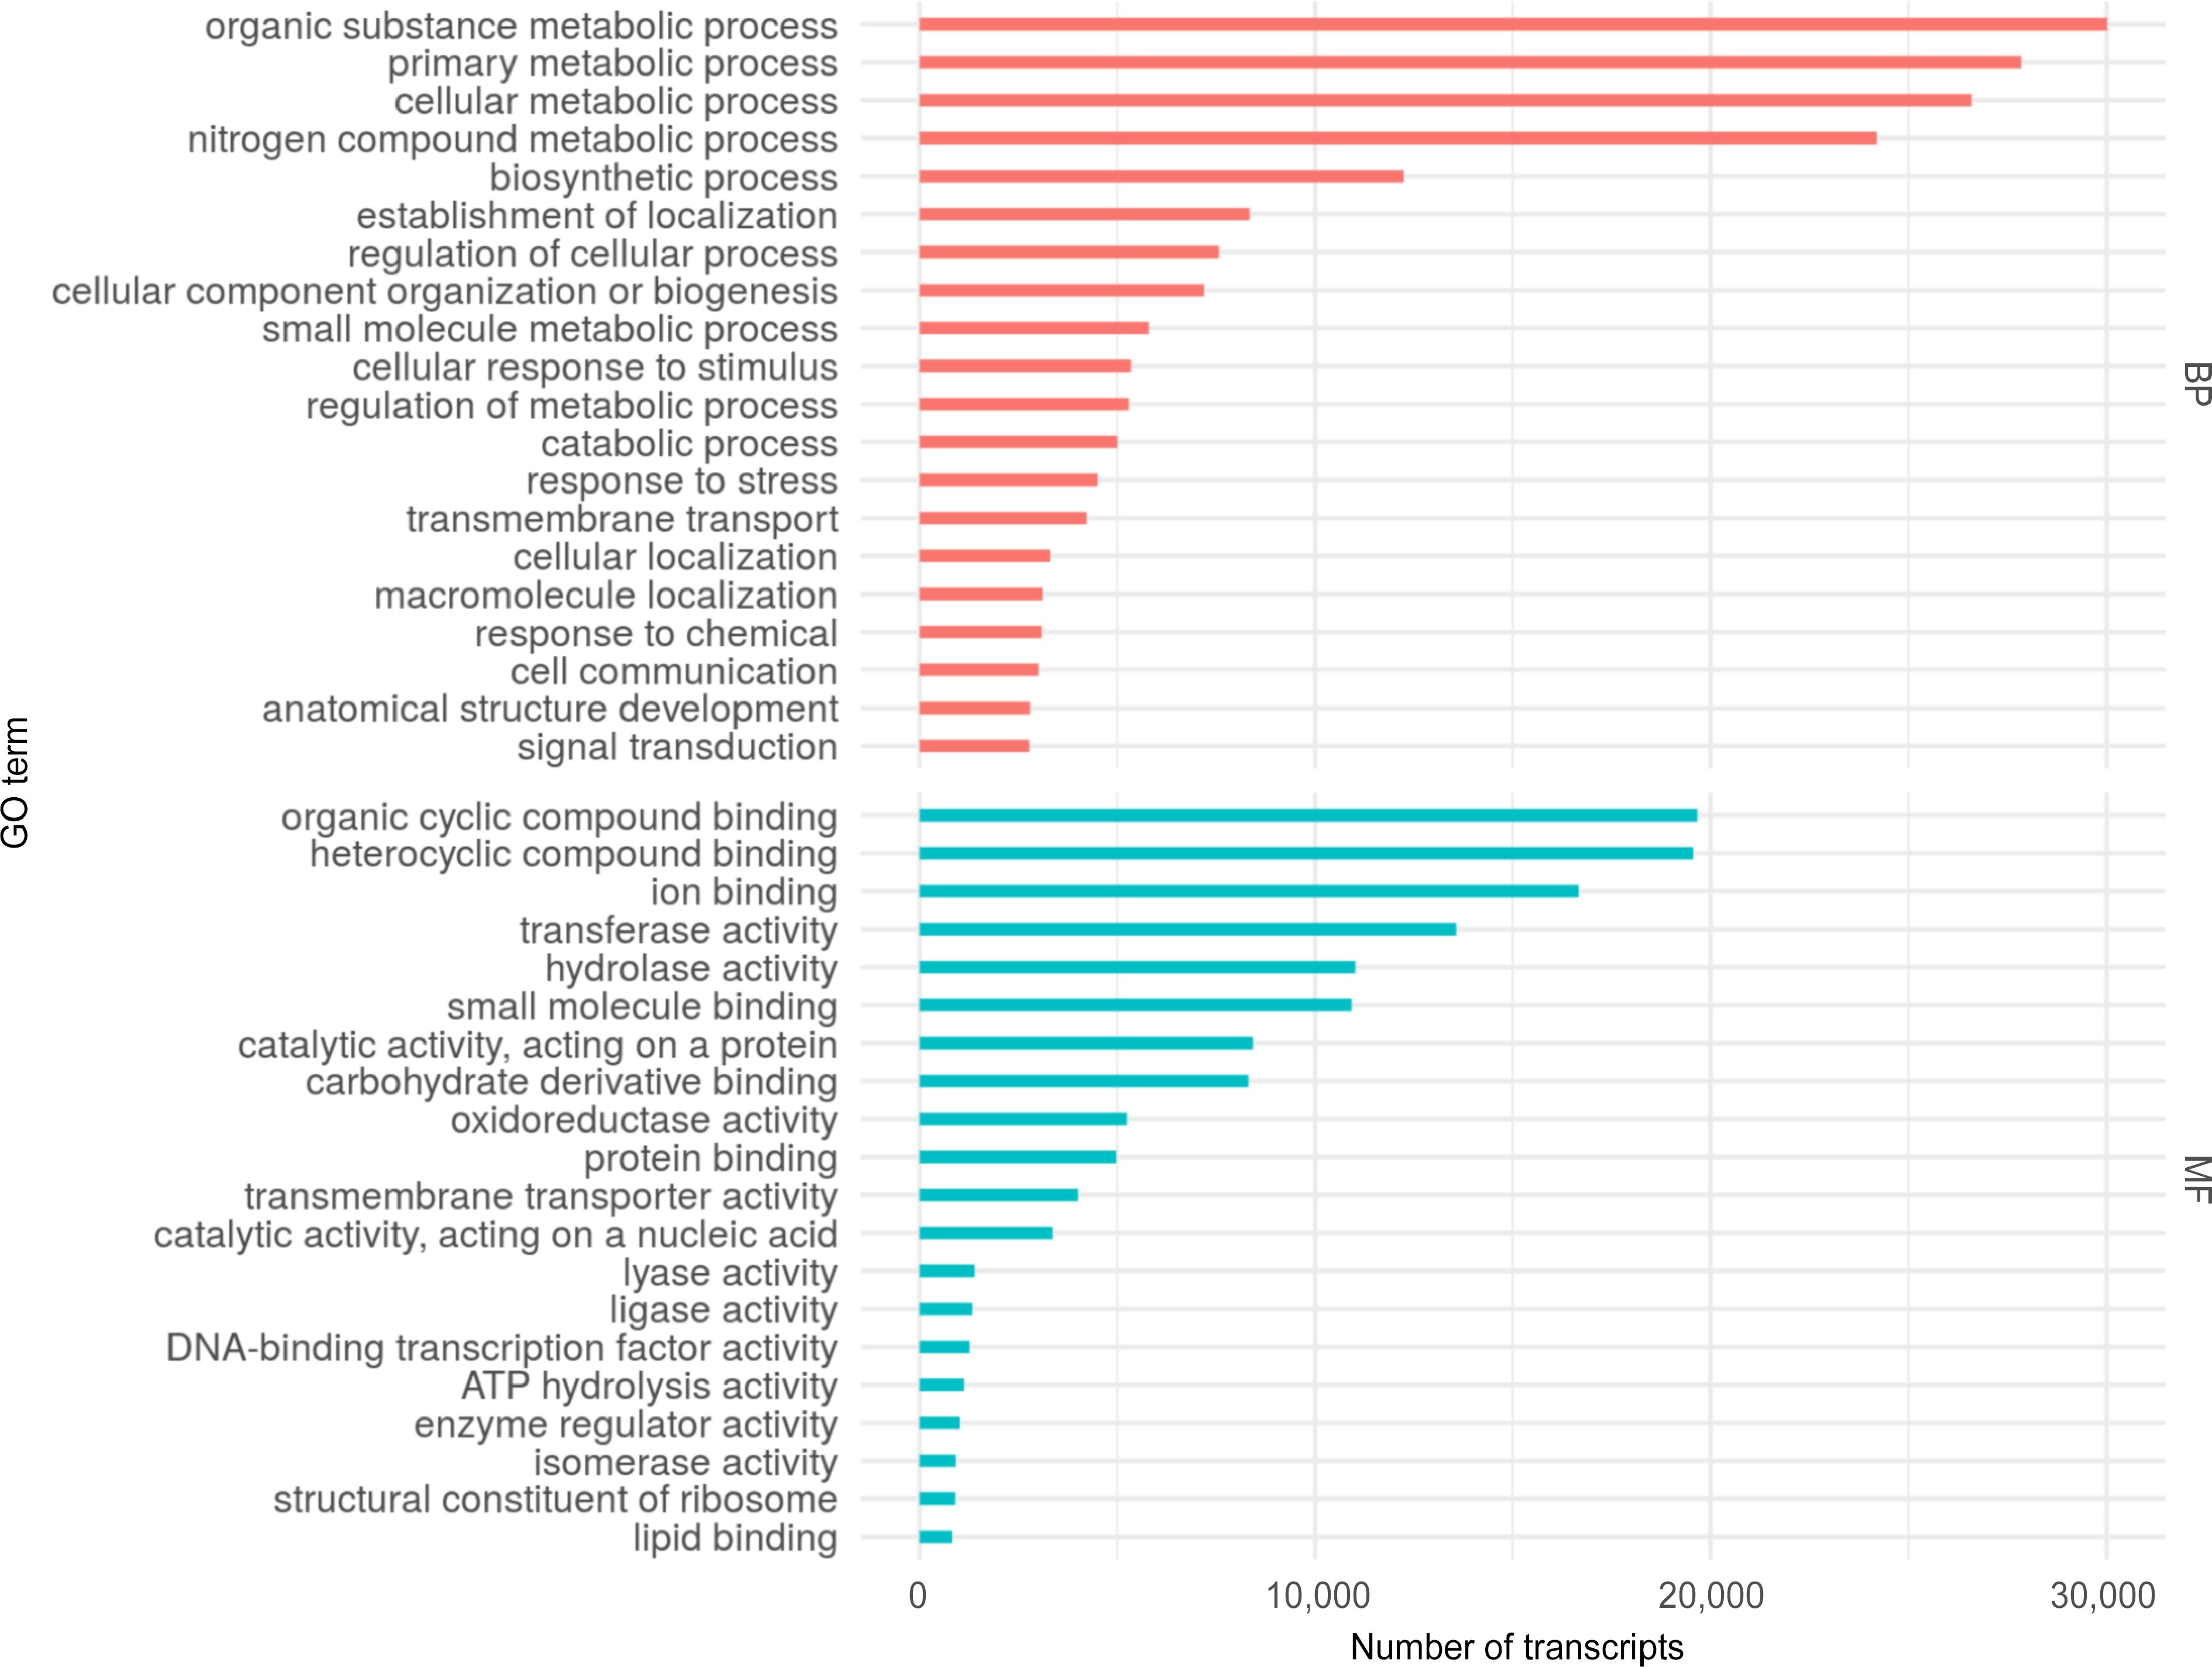
      Figure 3. 

      Top 20 Gene Ontology (GO) terms assigned to the S. thurberi fruit peel transcriptome. Bars indicate the number of transcripts assigned to each GO term. Assignment of GO terms was carried out by Blast2GO with default parameters. BP and MF mean Biological Processes and Molecular Functions GO categories, respectively. The graph was drawn by ggplot2 in R Studio.
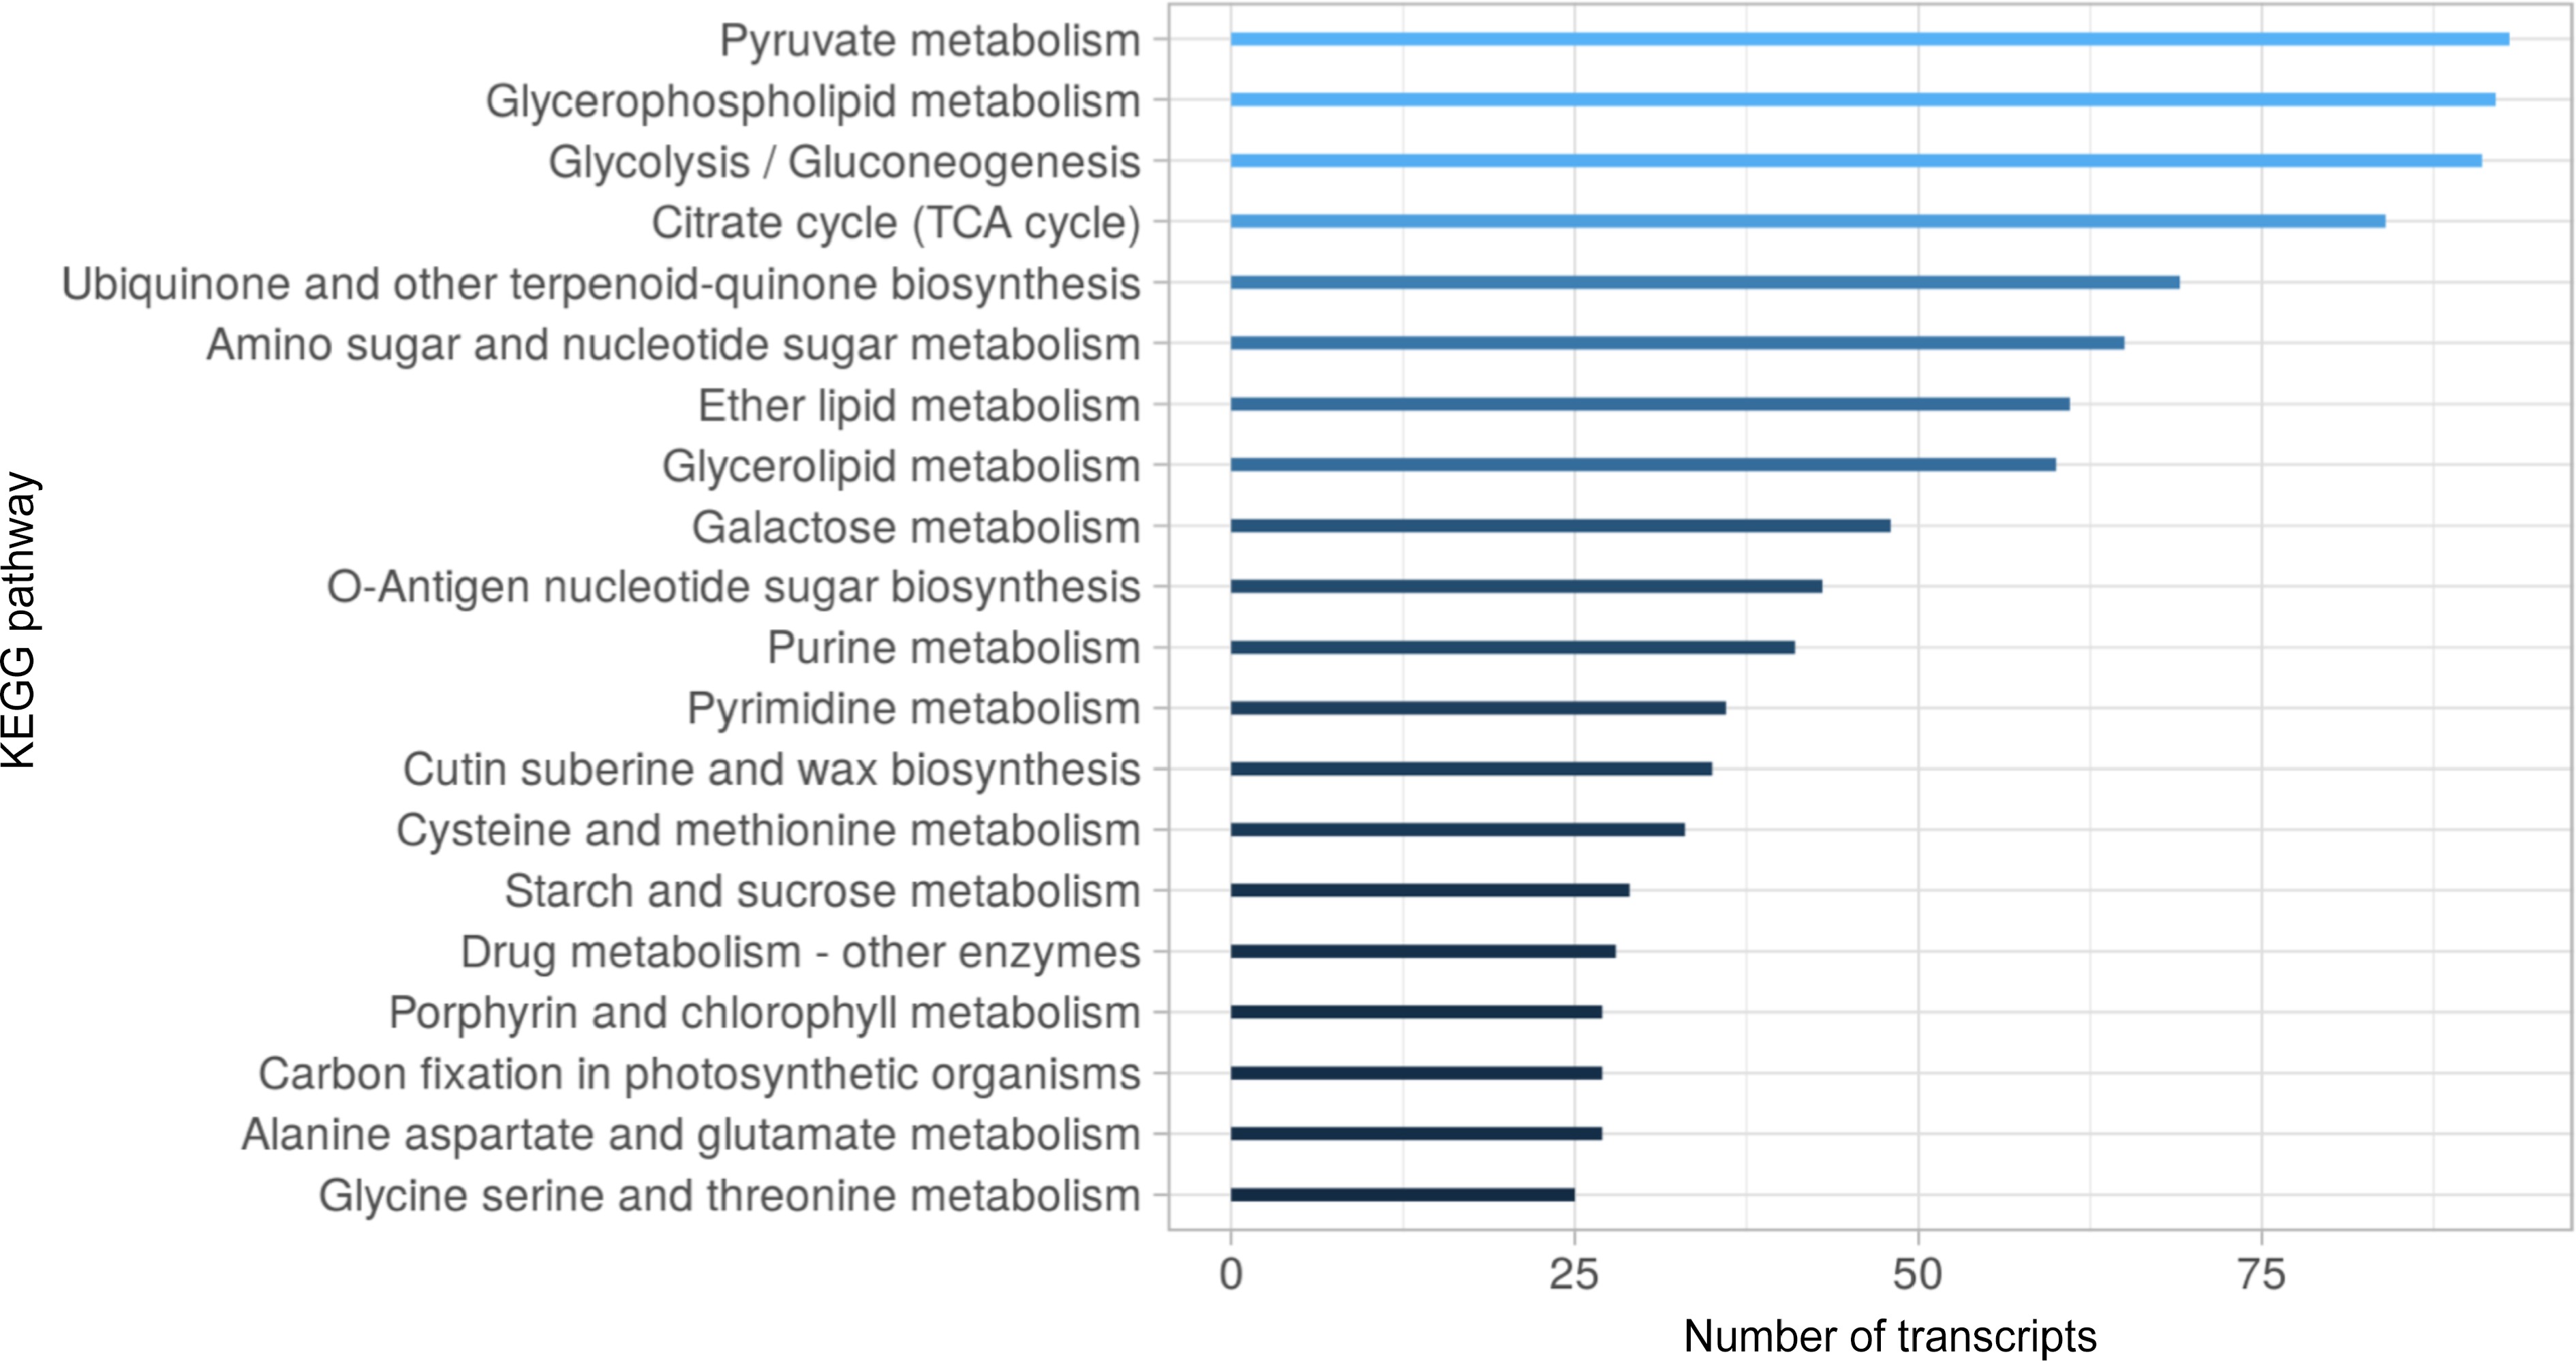
      Figure 4. 

      Top 20 KEGG metabolic pathways distribution in the S. thurberi fruit peel transcriptome. Bars indicate the number of transcripts assigned to each KEGG pathway. Assignment of KEGG pathways was carried out in the Blast2GO suite. The bar graph was drawn by ggplot2 in R Studio.

    • Out of the total of transcripts, 43,391 (24.87%) were classified as lncRNA (Supplementary Tables S15 & S16). Figure 5 shows a comparison of the length (Fig. 5a) and expression (Fig. 5b) of lncRNA and coding RNA. Both length and expression values were higher in coding RNA than in lncRNA. In general, coding RNA ranged from 201 to 18,629 bp with a mean length of 1,507.18, whereas lncRNA ranged from 200 to 5,198 bp with a mean length of 481.51 (Fig. 5a). The higher expression values recorded from coding RNA and lncRNA were 12.83 and 9.45 log2(CPM), respectively (Fig. 5b).
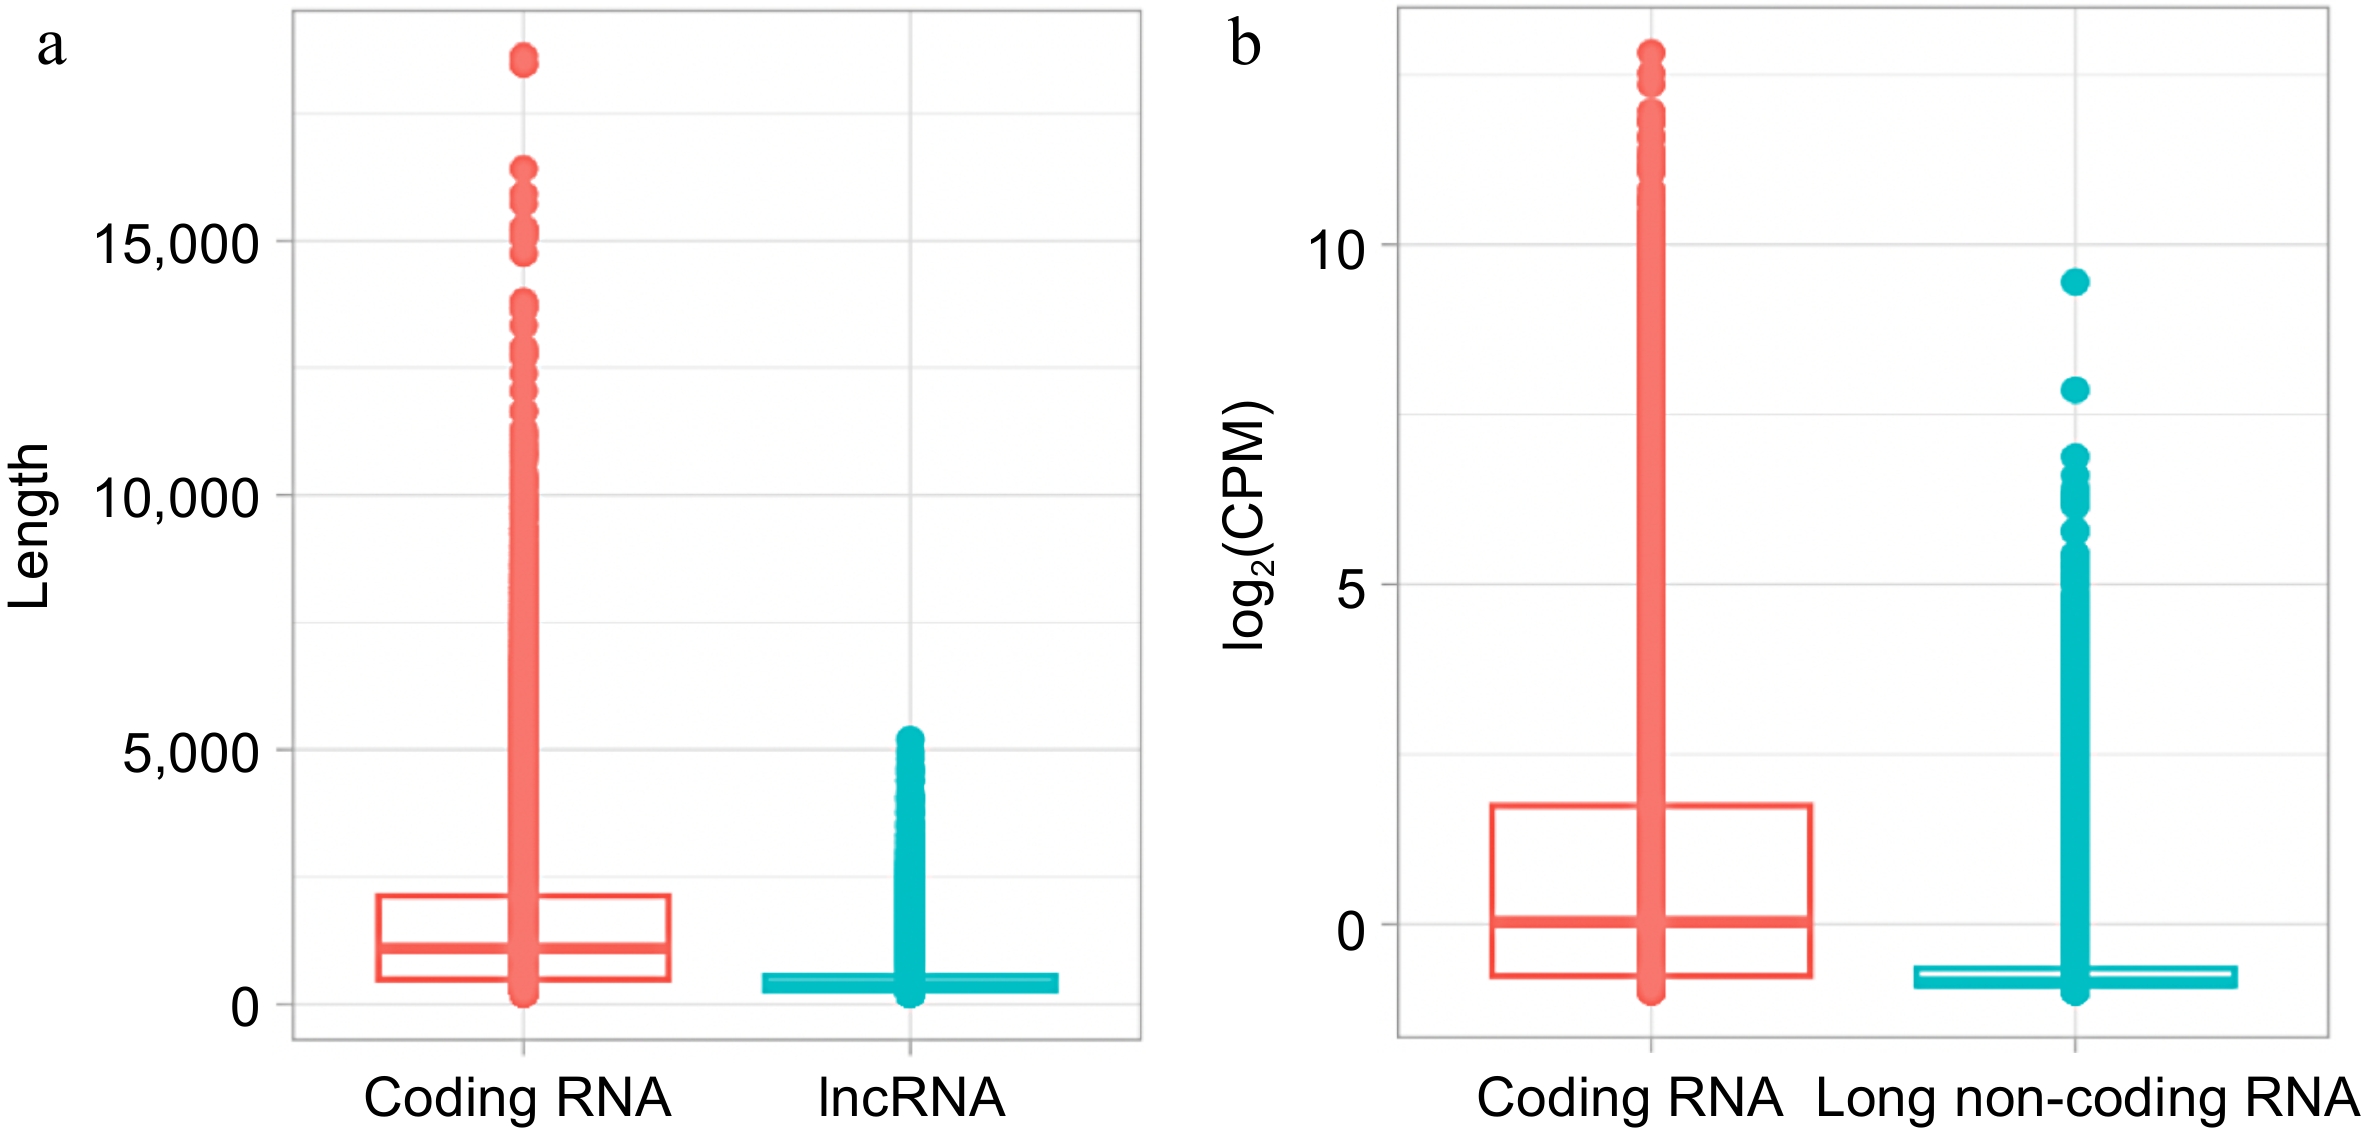
      Figure 5. 

      Comparison of coding RNA and long non-coding RNA (lncRNA) from S. thurberi transcriptome. (a) Box plot of transcript length distribution. The Y-axis indicates the length of each transcript in base pairs. (b) Box plot of expression levels. The Y-axis indicates the log2 of the count per million of reads (log2(CPM)) recorded for each transcript. Expression levels were calculated by the edgeR package in R studio. (a), (b) The lines inside the boxes indicate the median. The higher and lower box limits represent the 75th and 25th percentiles, respectively. The box plots were drawn by ggplot2 in R Studio.

    • To identify the transcripts without significant changes in expression between the four RNA-seq libraries, a differential expression analysis was carried out. Of the total of transcripts, 4,980 were not differentially expressed (NDE) at least in one paired comparison between the libraries (Supplementary Tables S17S20). Mean counts per million of reads (CPM) and coefficient of variation (CV)[44] were calculated for these NDE transcripts. Transcripts with a CV value lower than 0.113, corresponding with the percentile 5 of the CV, and a mean CPM higher than 1,138.06, corresponding with the percentile 95 of the mean CPM were used as filters to identify the most stably expressed transcripts (Supplementary Table S21). Based on its homology and its tentative biological function, five transcripts were selected to be tested as tentative reference genes. Besides, three NDE transcripts homologous to previously identified stable expressed reference genes in other species of cactus fruit[4143] were selected (Supplementary Table S22). Homology metrics for the eight tentative reference genes selected are shown in Supplementary Table S23. The primer sequences used to amplify the transcripts by qRT-PCR and their nucleotide sequence are shown in Supplementary Tables S24 & S25, respectively.

    • The amplification specificity of the eight candidate reference genes determined by melting curves analysis is shown in Supplementary Fig. S3. For the eight tentative reference transcripts selected, the cycle threshold (Ct) values were recorded during sweet pitaya fruit development by qRT-PCR (Supplementary Table S26). The Ct values obtained ranged from 16.85 to 30.26 (Fig. 6a). Plastidic ATP/ADP-transporter (StTLC1) showed the highest Ct values with a mean of 27.34 (Supplementary Table S26). Polyubiquitin 3 (StUBQ3) showed the lowest Ct values in all five sweet pitaya fruit developmental stages (Fig. 6a).
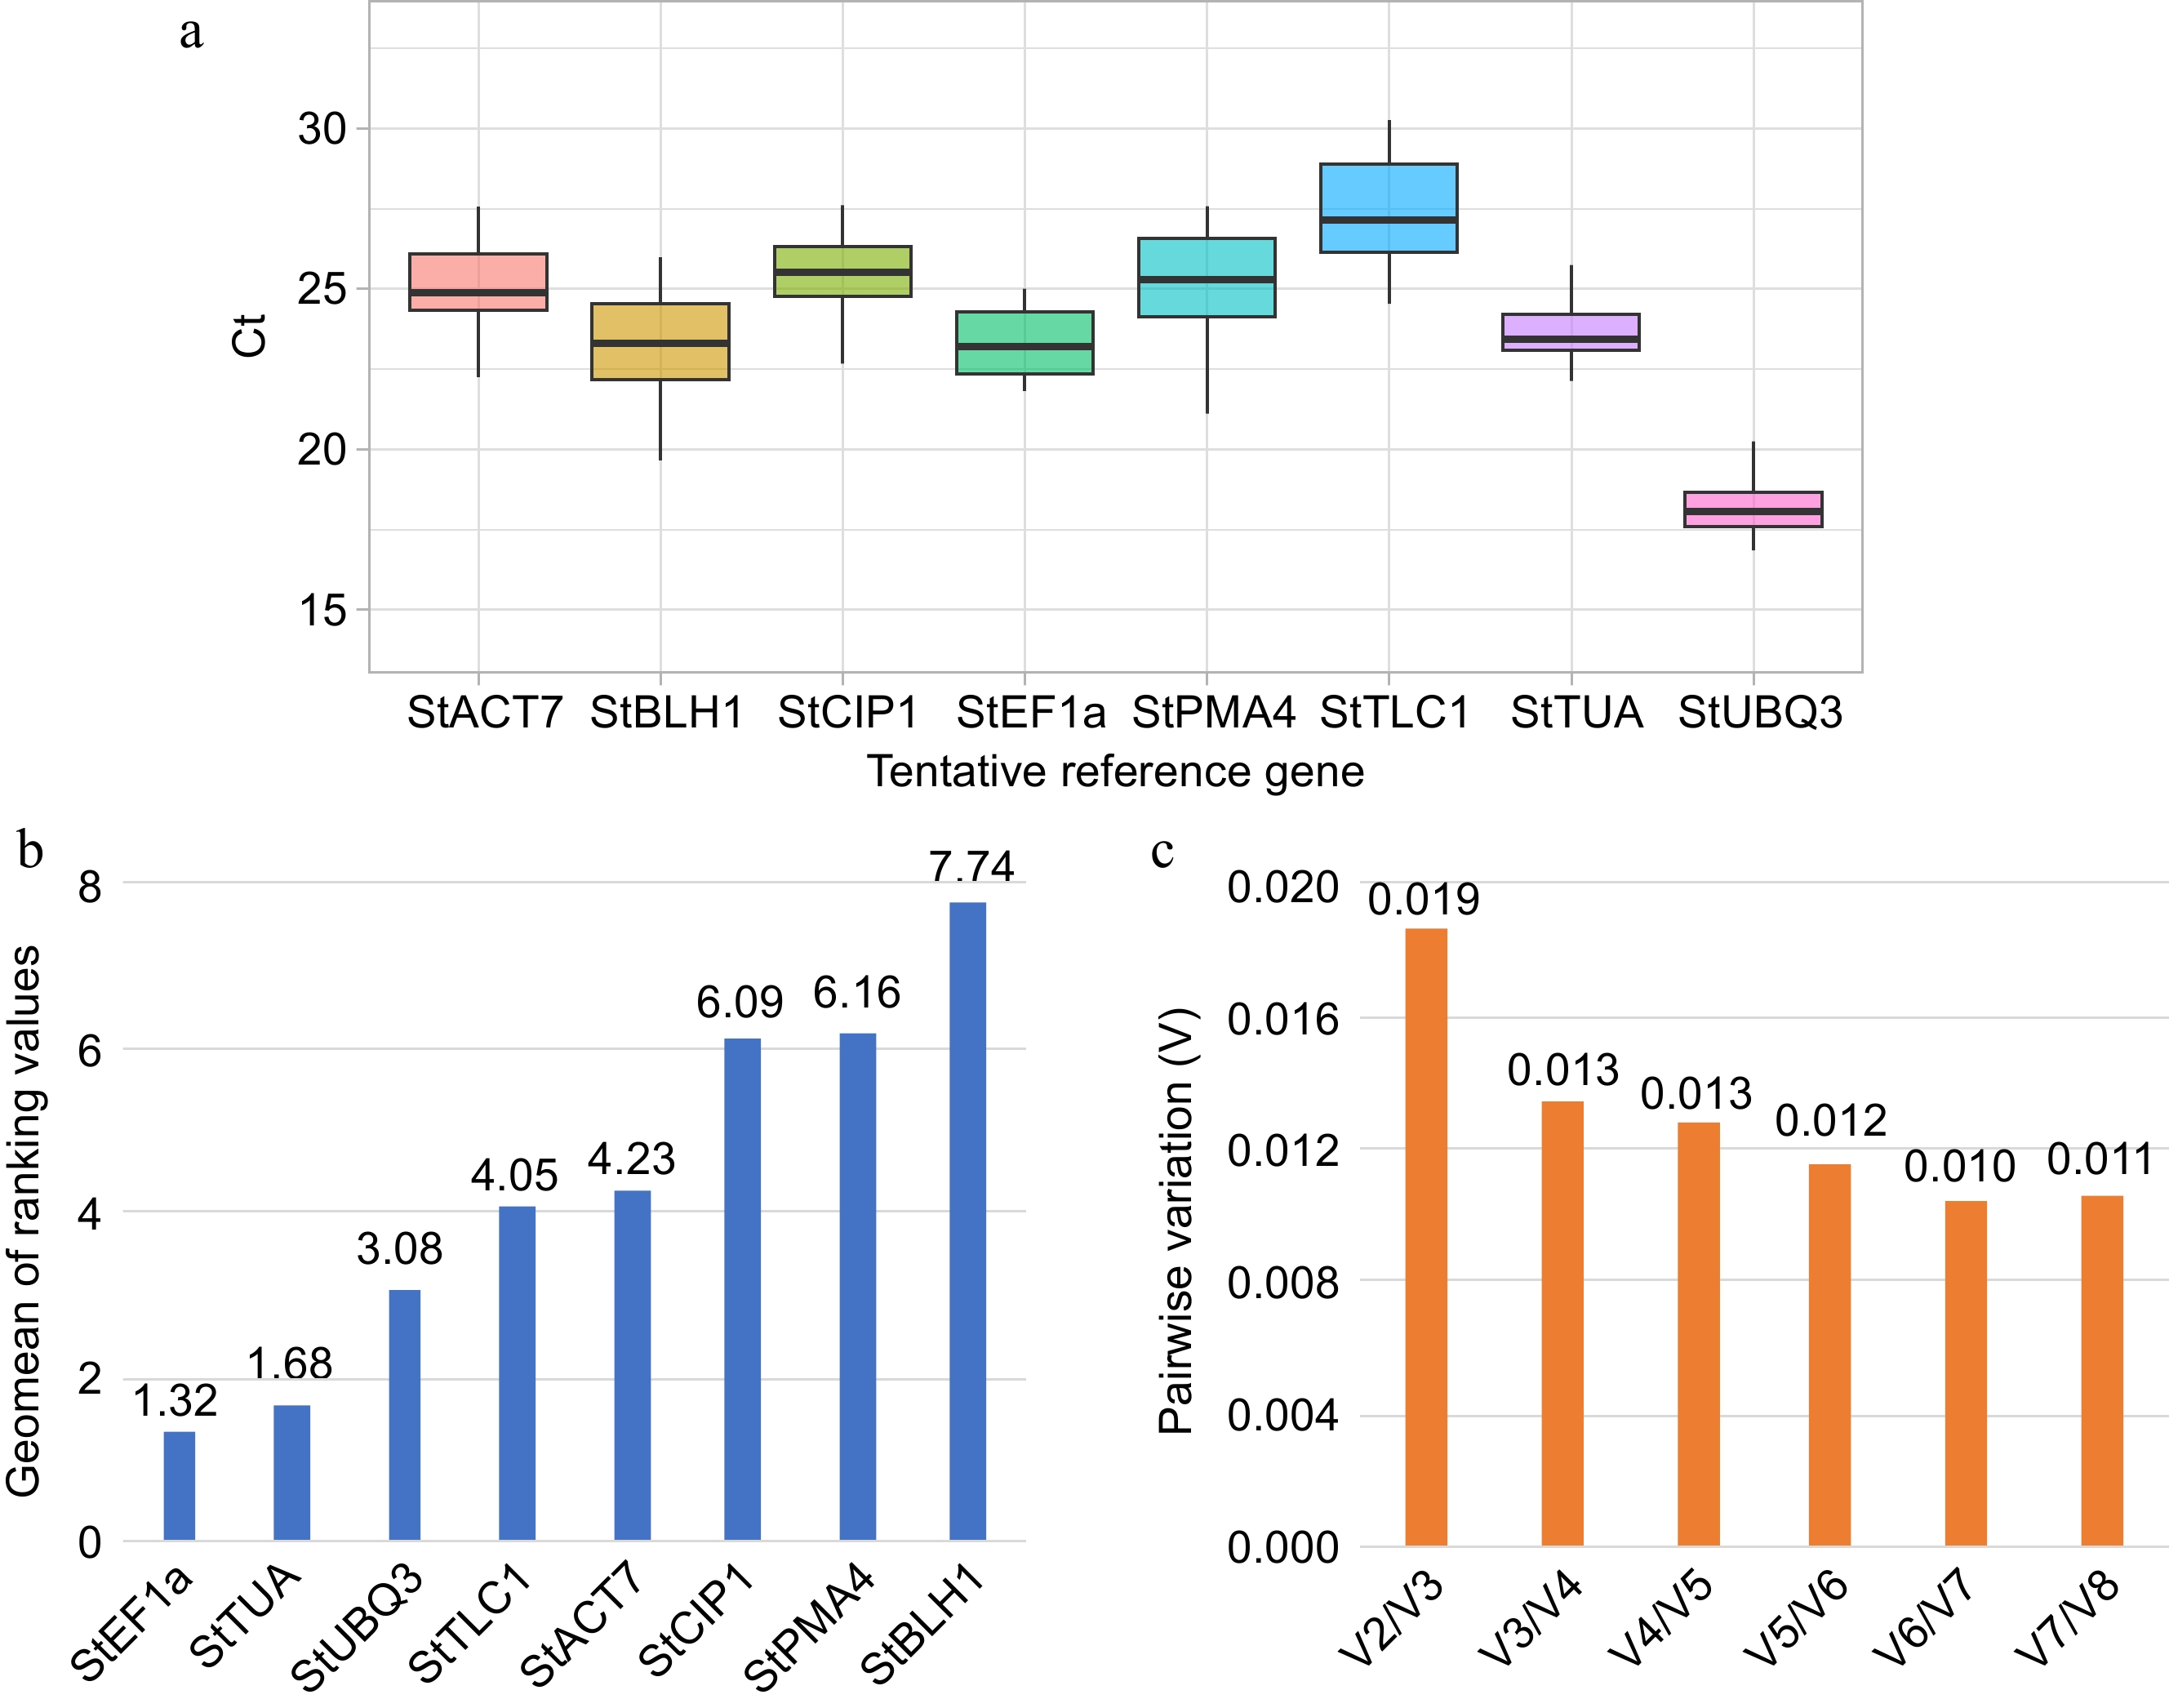
      Figure 6. 

      Expression stability analysis of tentative reference genes. (a) Box plot of cycle threshold (Ct) distribution of candidate reference genes during sweet pitaya fruit development (10, 20, 30, 35, and 40 d after flowering). The black line inside the box indicates the median. The higher and lower box limits represent the 75th and 25th percentiles, respectively. (b) Bar chart of the geometric mean (geomean) of ranking values calculated by RefFinder for each tentative reference gene (X-axis). The lowest values indicate the best reference genes. (c) Bar chart of the pairwise variation analysis and determination of the optimal number of reference genes by the geNorm algorithm. A pairwise variation value lower than 0.15 indicates that the use of Vn/Vn + 1 reference genes is reliable for the accurate normalization of qRT-PCR data. The Ct data used in the analysis were calculated by qRT-PCR in a QIAquant 96 5 plex (QIAGEN) according to the manufacturer's protocol. The box plot and the bar graphs were drawn by ggplot2 and Excel programs, respectively. Abbreviations: Actin 7 (StACT7), alpha-tubulin (StTUA), elongation factor 1-alpha (StEF1a), COP1-interactive protein 1 (StCIP1), plasma membrane ATPase 4 (StPMA4), BEL1-like homeodomain protein 1 (StBLH1), polyubiquitin 3 (StUBQ3), and plastidic ATP/ADP-transporter (StTLC1).

      The best stability values calculated by NormFinder were 0.45, 0.51, 0.97, and 0.99, corresponding to the transcripts elongation factor 1-alpha (StEF1a), alpha-tubulin (StTUA), plastidic ATP/ADP-transporter (StTLC1), and actin 7 (StACT7), respectively (Supplementary Table S27). For BestKeeper, the most stable expressed transcripts were StUBQ3, StTUA, and StEF1a, with values of 0.72, 0.75, and 0.87, respectively. In the case of the delta Ct method[51], the transcripts StEF1a, StTUA, and StTLC1 showed the best stability.

      According to geNorm analysis, the most stable expressed transcripts were StTUA, StEF1a, StUBQ3, and StACT7, with values of 0.74, 0.74, 0.82, and 0.96, respectively. All the pairwise variation values (Vn/Vn + 1) were lower than 0.15, ranging from 0.019 for V2/V3 to 0.01 for V6/V7 (Fig. 6c). The V value of 0.019 obtained for V2/V3 indicates that the use of the best two reference genes StTUA and StEF1a is reliable enough for the accurate normalization of qRT-PCR data, therefore no third reference gene is required[47]. Except for BestKeeper analysis, StEF1a and StTUA were the most stable transcripts for all of the methods carried out in this study (Supplementary Table S27). The comprehensive ranking analysis indicates that StEF1a, followed by StTUA and StUBQ3, are the most stable expressed genes and are stable enough to be used as reference genes in qRT-PCR analysis during sweet pitaya fruit development (Fig. 6b).

    • Three cuticle biosynthesis-related transcripts TRINITY_DN17030_c0_g1_i2, TRINITY_DN15394_c0_g1_i1, and TRINITY_DN23528_c1_g1_i1 tentatively coding for the enzymes cytochrome p450 family 77 subfamily A (CYP77A), Gly-Asp-Ser-Leu motif lipase/esterase 1 (GDSL1), and an ATP binding cassette transporter subfamily G member 11 (ABCG11/WBC11), respectively, were identified and quantified. The nucleotide sequence and predicted amino acid sequences of the three transcripts are shown in Supplementary File 1. The best homology match for StCYP77A (TRINITY_DN17030_c0_g1_i2) was for AtCYP77A4 (AT5G04660) from Arabidopsis and SmCYP77A2 (P37124) from eggplant (Solanum melongena) in the TAIR and Swiss-Prot databases, respectively (Supplementary Table S23).

      TransDecoder, InterPro, and TMHMM analysis showed that StCYP77A codes a polypeptide of 518 amino acids (aa) in length that comprises a cytochrome P450 E-class domain (IPR002401) and a transmembrane region (residues 10 to 32). The phylogenetic tree constructed showed that StCYP77A is grouped in a cluster with all the CYP77A2 proteins included in this analysis, being closer to CYP77A2 (XP_010694692) from B. vulgaris and Cgig2_012892 (KAJ8441854) from Carnegiea gigantean (Supplementary Fig. S4).

      StGDSL1 (TRINITY_DN15394_c0_g1_i1) alignment showed that it is homologous to a GDSL esterase/lipase from Arabidopsis (Q9LU14) and tomato (Solyc03g121180) (Supplementary Table S23). TransDecoder, InterPro, and SignalP analysis showed that StGDSL1 codes a polypeptide of 354 aa in length that comprises a GDSL lipase/esterase domain IPR001087 and a signal peptide with a cleavage site between position 25 and 26 (Supplementary Fig. S5).

      Supplementary Figure S6 shows the analysis carried out on the predicted amino acid sequence of StABCG11 (TRINITY_DN23528_c1_g1_i1). The phylogenetic tree constructed shows three clades corresponding to the ABCG13, ABCG12, and ABCG11 protein classes with bootstrap support ranging from 40% to 100% (Supplementary Fig. S6a). StABCG11 is grouped with all the ABCG11 transporters included in this study in a well-separated clade, being closely related to its tentative ortholog from C. gigantean Cgig2_004465 (KAJ8441854). InterPro and TMHMM results showed that the StABCG11 sequence contains an ABC-2 type transporter transmembrane domain (IPR013525; PF01061.27) with six transmembrane helices (Supplementary Fig. S6b).

      The predicted protein sequence of StABCG11 is 710 aa in length, holding the ATP binding domain (IPR003439; PF00005.30) and the P-loop containing nucleoside triphosphate hydrolase domain (IPR043926; PF19055.3) of the ABC transporters of the G family. Multiple sequence alignment shows that the Walker A and B motif sequence and the ABC signature[15] are conserved between the ABCG11 transporters from Arabidopsis, tomato, S. thurberi, and C. gigantean (Supplementary Fig. S6c).

    • According to the results of the expression stability analysis (Fig. 6), four normalization strategies were tested to quantify the three cuticle biosynthesis-related transcripts during sweet pitaya fruit development. The four strategies consist of normalizing by StEF1a, StTUA, StUBQ3, or StEF1a+StTUA. Primer sequences used to quantify the transcripts StCYP77A (TRINITY_DN17030_c0_g1_i2), StGDSL1 (TRINITY_DN15394_c0_g1_i1), and StABCG11 (TRINITY_DN23528_c1_g1_i1) by qRT-PCR during sweet pitaya fruit development are shown in Supplementary Table S24.

      The three cuticle biosynthesis-related transcripts showed differences in expression during sweet pitaya fruit development (Supplementary Table S28). The same expression pattern was recorded for the three cuticle biosynthesis transcripts when normalization was carried out by StEF1a, StTUA, StUBQ3, or StEF1a + StTUA (Fig. 7). A higher expression of StCYP77A and StGDSL1 are shown at the 10 and 20 DAF, showing a decrease at 30, 35, and 40 DAF. StABCG11 showed a similar behavior, with a higher expression at 10 and 20 DAF and a reduction at 30 and 35 DAF. Nevertheless, unlike StCYP77A and StGDSL1, a significant increase at 40 DAF, reaching the same expression as compared with 10 DAF, is shown for StABCG11 (Fig. 7).
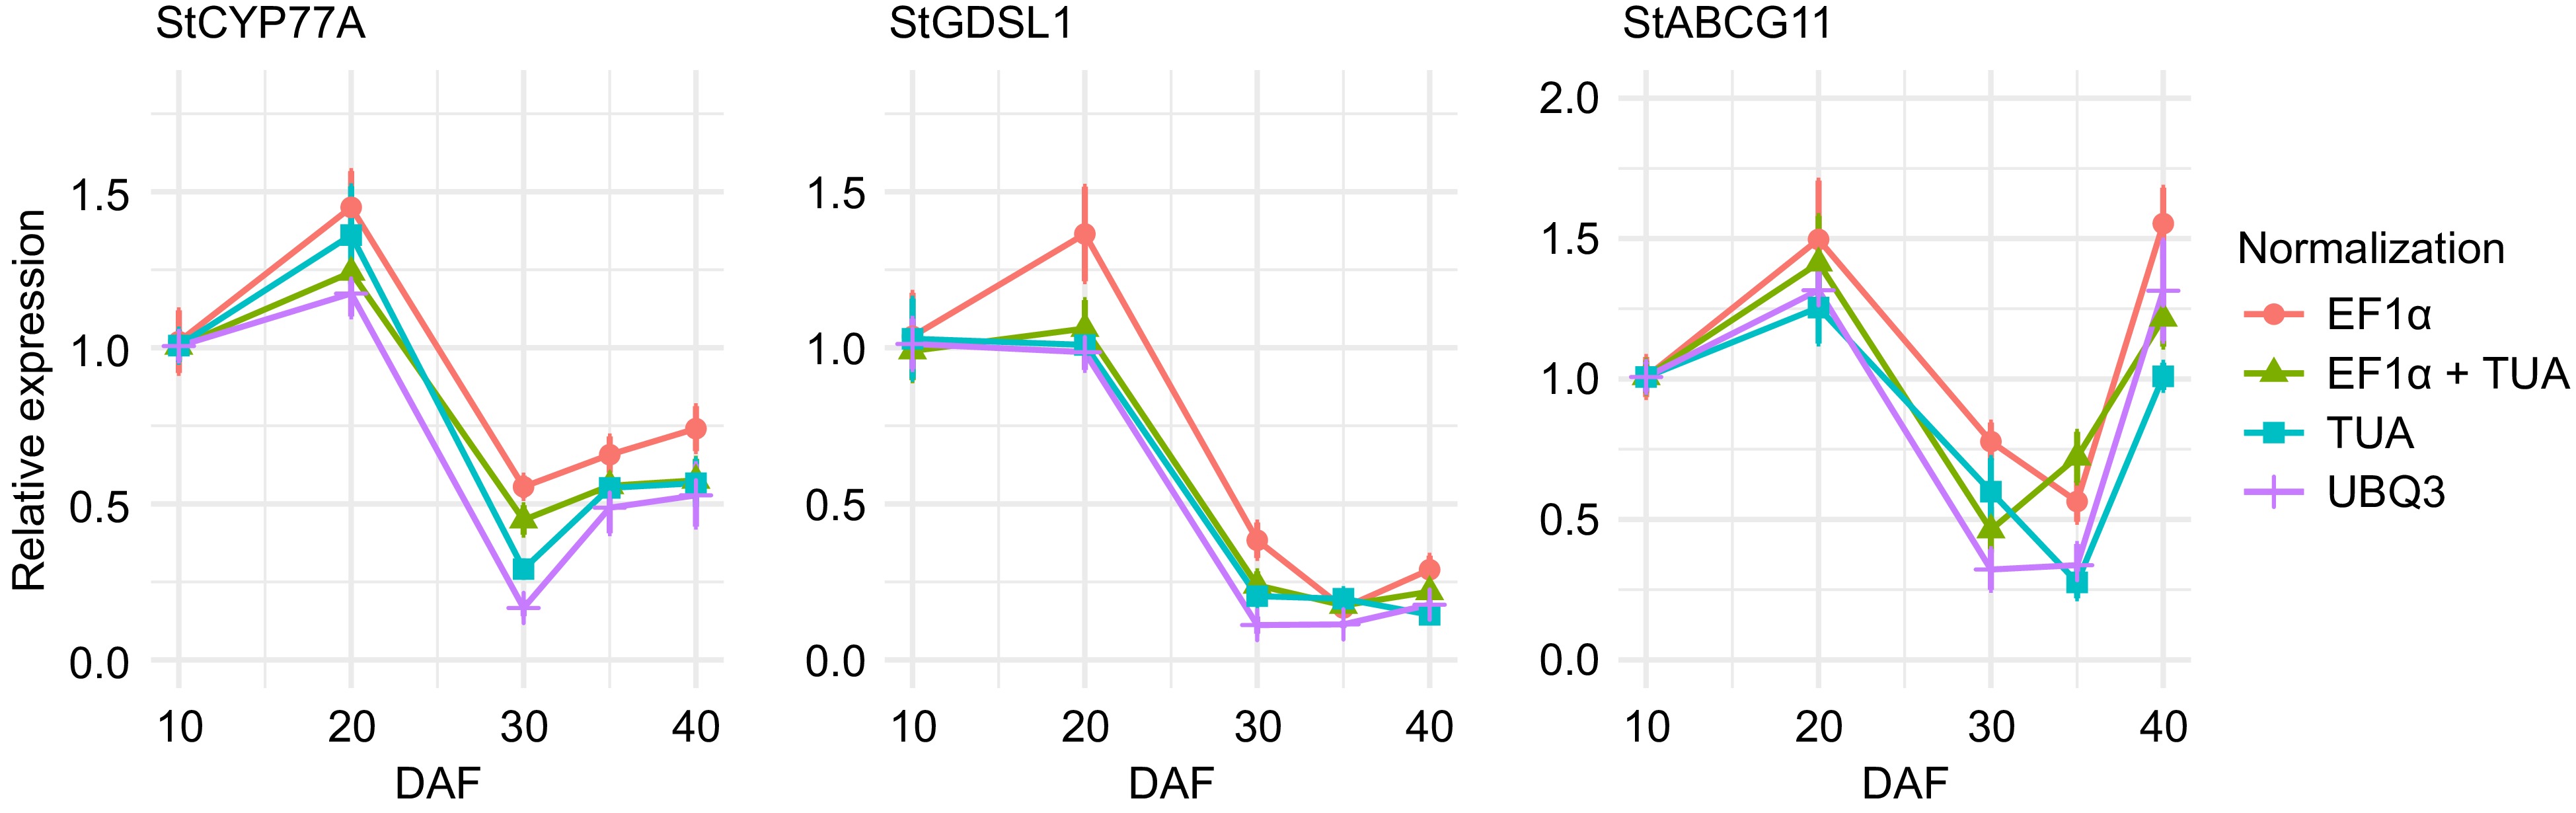
      Figure 7. 

      Expression analysis of cuticle biosynthesis-related transcripts StCYP77A, StGDSL1, and StABCG11 during sweet pitaya (Stenocereus thurberi) fruit development. Relative expression was calculated through the 2−ΔΔCᴛ method using elongation factor 1-alpha (StEF1a), alpha-tubulin (StTUA), polyubiquitin 3 (StUBQ3), or StEF1a + StTUA as normalizing genes at 10, 20, 30, 35, and 40 d after flowering (DAF). The Y-axis and error bars represent the mean of the relative expression ± standard error (n = 4−6) for each developmental stage in DAF. The Ct data for the analysis was recorded by qRT-PCR in a QIAquant 96 5 plex (QIAGEN) according to the manufacturer's protocol. The graph line was drawn by ggplot2 in R Studio. Abbreviations: cytochrome p450 family 77 subfamily A (StCYP77A), Gly-Asp-Ser-Leu motif lipase/esterase 1 (StGDSL1), and ATP binding cassette transporter subfamily G member 11 (StABCG11).

    • Characteristics of a well-assembled transcriptome include an N50 value closer to 2,000 bp, a high percentage of conserved transcripts completely assembled (> 80%), and a high proportion of reads mapping back to the assembled transcripts[52]. In the present study, the first collection of 174,449 transcripts from S. thurberi fruit peel are reported. The generated transcriptome showed an N50 value of 2,110 bp, a TransRate score of 0.05, and a GC percentage of 41.33 (Table 1), similar to that reported for other de novo plant transcriptome assemblies[53]. According to BUSCO, 85.4% of the orthologous genes from the Embryophyta databases completely matched the S. thurberi transcriptome, and only 3.9% were missing (Table 1). These results show that the S. thurberi transcriptome generated is not fragmented, and it is helpful in predicting the sequence of almost all the transcripts expressed in sweet pitaya fruit peel[24].

    • The percentage of transcripts homologous found, E values, and identity distribution (Supplementary Tables S1 & S2; Supplementary Fig. S2) were similar to that reported in the de novo transcriptome assembly for non-model plants and other cactus fruits[4143,54] and further suggests that the transcriptome assembled of S. thurberi peel is robust[52]. Of the total of transcripts, 70,802 were common to all the five commercial fruit protein databases included in this study, which is helpful for the search for conserved orthologous involved in fruit development and ripening (Fig. 2a). A total of 34,513 transcripts (20%) show homology only to sequences in the cactus's databases, but not in the others (Supplementary Tables S1 & S2; Fig. 1c). This could suggest that a significant conservation of sequences among plants of the Cactaceae family exists which most likely are to have a function in this species adaptation to desert ecosystems.

    • To infer the biological functionality represented by the S. thurberi fruit peel transcriptome, gene ontology (GO) terms and KEGG pathways were assigned. Of the main metabolic pathways assigned, 'glycerolipid metabolism' and 'cutin, suberine, and wax biosynthesis' suggests an active cuticle biosynthesis in pitaya fruit peel (Fig. 4). In agreement with the above, the main GO terms assigned for the molecular function (MF) category were 'organic cyclic compound binding', 'transmembrane transporter activity', and 'lipid binding' (Fig. 3). For the biological processes (BP) category, the critical GO terms for the present research are 'cellular response to stimulus', 'response to stress', 'anatomical structure development', and 'transmembrane transport', which could suggest the active development of the fruit epidermis and cuticle biosynthesis for protection to stress.

      The most frequent transcription factors (TF) families found in S. thurberi transcriptome were NAC, WRKY, bHLH, ERF, and MYB-related (Fig. 2), which had been reported to play a function in the tolerance to abiotic stress in plants[55,56]. Although the role of NAC, WRKY, bHLH, ERF, and MYB TF in improving drought tolerance in relevant crop plants has been widely documented[57,58], their contribution to the adaptation of cactus to arid ecosystems has not yet been elucidated and further experimental pieces of evidence are needed.

      It has been reported that the heterologous expression of ERF TF from Medicago truncatula induces drought tolerance and cuticle wax biosynthesis in Arabidopsis leaf[59]. In tomato fruits, the gene SlMIXTA-like which encodes a MYB transcription factor avoids water loss through the positive regulation of genes related to the biosynthesis and transport of cuticle compounds[22]. Despite the relevant role of cuticles in maintaining cactus physiology in desert environments, experimental evidence showing the role of the different TF-inducing cuticle biosynthesis has yet to be reported for cactus fruits.

    • Out of the transcripts, 43,391 were classified as lncRNA (Supplementary Tables S15 & S16). This is the first report of lncRNA identification for the species S. thurberi. In fruits, 3,679 lncRNA has been identified from tomato[26], 3,330 from peach (P. persica)[29], 3,857 from melon (Cucumis melo)[28], 2,505 from hot pepper (Capsicum annuum)[27], and 3,194 from pomegranate (Punica granatum)[36]. Despite the stringent criteria to classify the lncRNA of sweet pitaya fruit (S. thurberi), a higher number of lncRNAs are shown when compared with previous reports. This finding is most likely due to the higher level of redundancy found during the transcriptome analysis. To reduce this redundancy, further efforts to achieve the complete genome assembly of S. thurberi are needed.

      Previous studies showed that lncRNA is shorter and has lower expression levels than coding RNA[6062]. In agreement with those findings, both the length and expression values of lncRNA from S. thurberi were lower than coding RNA (Fig. 5). It has been suggested that lncRNA could be involved in the biosynthesis of cuticle components in cabbage[61] and pomegranate[36] and that they could be involved in the tolerance to water deficit through the regulation of cuticle biosynthesis in wild banana[60]. Nevertheless, the molecular mechanism by which lncRNA may regulate the cuticle biosynthesis in S. thurberi fruits has not yet been elucidated.

    • A relatively constant level of expression characterizes housekeeping genes because they are involved in essential cellular functions. These genes are not induced under specific conditions such as biotic or abiotic stress. Because of this, they are very useful as internal reference genes for qRT-PCR data normalization[63]. Nevertheless, their expression could change depending on plant species, developmental stages, and experimental conditions[64]. Reliable reference genes for a specific experiment in a given species must be identified to carry out an accurate qRT-PCR data normalization[63]. An initial screening of the transcript expression pattern through RNA-seq improves the identification of stably expressed transcripts by qRT-PCR[44,64].

      Identification of stable expressed reference transcripts during fruit development has been carried out in blueberry (Vaccinium bracteatum)[65], kiwifruit (Actinidia chinensis)[66], peach (P. persica)[67], apple (Malus domestica)[68], and soursop (Annona muricata)[69]. These studies include the expression stability analysis through geNorm, NormFinder, and BestKeeper algorithms[68,69], some of which are supported in RNA-seq data[65,66]. Improvement of expression stability analysis by RNA-seq had led to the identification of non-previously reported reference genes with a more stable expression during fruit development than commonly known housekeeping genes in grapevine (V. vinifera)[44], pear (Pyrus pyrifolia and P. calleryana)[64], and pepper (C. annuum)[70].

      For fruits of the Cactaceae family, only a few studies identifying reliable reference genes have been reported[4143]. Mainly because gene expression analysis has not been carried out previously for sweet pitaya (S. thurberi), the RNA-seq data generated in this work along with geNorm, NormFinder, BestKeeper, and RefFinder algorithms were used to identify reliable reference genes. The comprehensive ranking analysis showed that out of the eight candidate genes tested, StEF1a followed by StTUA and StUBQ3 were the most stable (Fig. 6b). All the pairwise variation values (Vn/Vn + 1) were lower than 0.15 (Fig. 6c), which indicates that StEF1a, StTUA, and StUBQ3 alone or the use of StEF1a and StTUA together are reliable enough to normalize the gene expression data generated by qRT-PCR.

      The genes StEF1a, StTUA, and StUBQ3 are homologous to transcripts found in the cactus species known as dragonfruit (Hylocereus monacanthus and H. undatus)[41], which have been tested as tentative reference genes during fruit development. EF1a has been proposed as a reliable reference gene in the analysis of changes in gene expression of dragon fruit (H. monacanthus and H. undatus)[41], peach (P. persica)[67], apple (M. domestica)[68], and soursop (A. muricata)[69]. According to the expression stability analysis carried out in the present study (Fig. 6) four normalization strategies were designed. The same gene expression pattern was recorded for the three target transcripts evaluated when normalization was carried out by the genes StEF1a, StTUA, StUBQ3, or StEF1a + StTUA (Fig. 7). Further, these data indicates that these reference genes are reliable enough to be used in qRT-PCR experiments during fruit development of S. thurberi.

    • The plant cuticle is formed by two main layers: the cutin, composed mainly of mid-chain oxygenated LC fatty acids, and the cuticular wax, composed mainly of very long-chain (VLC) fatty acids, and their derivates VLC alkanes, VLC primary alcohols, VLC ketones, VLC aldehydes, and VLC esters[3]. In Arabidopsis CYP77A4 and CYP77A6 catalyze the synthesis of midchain epoxy and hydroxy ω-OH long-chain fatty acids, respectively[10,11], which are the main components of fleshy fruit cuticle[3].

      The functional domain search carried out in the present study showed that StCYP77A comprises a cytochrome P450 E-class domain (IPR002401) and a membrane-spanning region from residues 10 to 32 (Supplementary Fig. S4). This membrane-spanning region has been previously characterized in CYP77A enzymes from A. thaliana and Brassica napus[11,71]. It suggests that the protein coded by StCYP77A could catalyze the oxidation of fatty acids embedded in the endoplasmic reticulum membrane of the epidermal cells of S. thurberi fruit. Phylogenetic analysis showed that StCYP77A was closer to proteins from its phylogenetic-related species B. vulgaris (BvCYP772; XP_010694692) and C. gigantea (Cgig2_012892) (Supplementary Fig. S4). StCYP77A, BvCYP77A2, and Cgig2_012892 were closer to SlCYP77A2 and SmCYP77A2 than to CYP77A4 and CYP77A6 proteins, suggesting that StCYP77A (TRINITY_DN17030_c0_g1_i2) could correspond to a CYP77A2 protein.

      Five CYP77A are present in the Arabidopsis genome, named CYP77A4, CYP77A5, CYP77A6, CYP77A7, and CYP77A9, but their role in cuticle biosynthesis has only been reported for CYP77A4 and CYP77A6[72]. It has been suggested that CYP77A2 from eggplant (S. torvum) could contribute to the defense against fungal phytopathogen infection by the synthesis of specific compounds[13]. In pepper fruit (C. annuum), the expression pattern of CYP77A2 (A0A1U8GYB0) and ABCG11 (LOC107862760) suggests a role of CYP77A2 and ABCG11 in cutin biosynthesis at the early stages of pepper fruit development[14].

      In the case of the protein encoded by StGDSL1 (354 aa), the length found in this work is similar to the length of its homologous from Arabidopsis (AT3G16370) and tomato (Solyc03g121180) (Supplementary Fig. S5). A GDSL1 protein named CD1 polymerizes midchain oxygenated ω-OH long-chain fatty acids to form the cutin polyester in the extracellular space of tomato fruit peel[20,21]. It has been suggested that the 25-amino acid N-signal peptide found in StGDSL1 (Supplementary Fig. S5), previously reported in GDSL1 from Arabidopsis, B. napus, and tomato, plays a role during the protein exportation to the extracellular space[21,73].

      A higher expression of StCYP77A, StGDSL1, and StABCG11 is shown at the 10 and 20 DAF of sweet pitaya fruit development (Fig. 7), suggesting the active cuticle biosynthesis at the early stages of sweet pitaya fruit development. In agreement with that, two genes coding for GDSL lipase/hydrolases from tomato named SGN-U583101 and SGN-U579520 are highly expressed in the early stages and during the expansion stages of tomato fruit development, but their expression decreases in later stages[74]. It has been shown that the expression of GDSL genes, like CD1 from tomato, is higher in growing fruit[20,21]. Like tomato, the increase in expression of StCYP77A and StGDSL1 shown in pitaya fruit development could be due to an increase in cuticle deposition during the expansion of the fruit epidermis[20].

    • The phylogenetic analysis, the functional domains, and the six transmembrane helices found in the StABCG11 predicted protein (Supplementary Fig. S6), suggests that it is an ABCG plasma membrane transporter of sweet pitaya[15]. Indeed, an increased expression of StABCG11 at 40 DAF was recorded in the present study (Fig. 7). Further, this data strongly suggests that it could be playing a relevant role in the transport of cuticle components at the beginning and during sweet pitaya fruit ripening.

      In Arabidopsis, ABCG11 (WBC11) exports cuticular wax and cutin compounds from the plasma membrane[15,75]. It has been reported that a high expression of the ABC plasma membrane transporter from mango MiWBC11 correlates with a higher cuticle deposition during fruit development[7]. The expression pattern for StABCG11, StCYP77A, and StGDSL1 suggests a role of StABCG11 as a cutin compound transporter in the earlier stages of sweet pitaya fruit development (Fig. 7). Further, its increase at 40 DAF suggests that it could be transporting cuticle compounds other than oxygenated long-chain fatty acids, or long-chain fatty acids that are not synthesized by StCYP77A and StGDSL1 in the later stages of fruit development.

      Like sweet pitaya, during sweet cherry fruit (Prunus avium) development, the expression of PaWCB11, homologous to AtABCG11 (AT1G17840), increases at the earlier stages of fruit development decreases at the intermediate stages, and increases again at the later stages[76]. PaWCB11 expression correlated with cuticle membrane deposition at the earlier and intermediate stages of sweet cherry fruit development but not at the later[76]. The increased expression of StABCG11 found in the present study could be due to the increased transport of cuticular wax compounds, such as VLC fatty acids and their derivates, in the later stages of sweet pitaya development[15,75].

      Cuticular waxes make up the smallest amount of the fruit cuticle. Even so, they mainly contribute to the impermeability of the fruit's epidermis[3]. An increase in the transport of cuticular waxes at the beginning of the ripening stage carried out by ABCG transporters could be due to a greater need to avoid water loss and to maintain an adequate amount of water during the ripening of the sweet pitaya fruit. Nevertheless, further expression analysis of cuticular wax biosynthesis-related genes, complemented with chemical composition analysis of cuticles could contribute to elucidating the molecular mechanism of cuticle biosynthesis in cacti and their physiological contribution during fruit development.

    • In this study, the transcriptome of the sweet pitaya (S. thurberi) fruit peel was assembled for the first time. The reference genes found here are a helpful tool for further gene expression analysis in sweet pitaya fruit. Transcripts tentatively involved in cuticle compound biosynthesis and transport are reported for the first time in sweet pitaya. The results suggest a relevant role of cuticle compound biosynthesis and transport at the early and later stages of fruit development. The information generated will help to improve the elucidation of the molecular mechanism of cuticle biosynthesis in S. thurberi and other cactus species in the future. Understanding the cuticle's physiological function in the adaptation of the Cactaceae family to harsh environmental conditions could help design strategies to increase the resistance of other species to face the increase in water scarcity for agricultural production predicted for the following years.

    • The authors confirm contribution to the paper as follows: study conception and design: Tiznado-Hernández ME, Tafolla-Arellano JC, García-Coronado H, Hernández-Oñate MÁ; data collection: Tiznado-Hernández ME, Tafolla-Arellano JC, García-Coronado H, Hernández-Oñate MÁ; analysis and interpretation of results: Tiznado-Hernández ME, García-Coronado H, Hernández-Oñate MÁ, Burgara-Estrella AJ; draft manuscript preparation: Tiznado-Hernández ME, García-Coronado H. All authors reviewed the results and approved the final version of the manuscript.

    • All data generated or analyzed during this study are included in this published article and its supplementary information files. The sequence data can be accessed at the Sequence Read Archive (SRA) repository of the NCBI through the BioProject ID PRJNA1030439.

      • The authors wish to acknowledge the financial support of Consejo Nacional de Humanidades, Ciencias y Tecnologías de México (CONAHCYT) through project number 579: Elucidación del Mecanismo Molecular de Biosíntesis de Cutícula Utilizando como Modelo Frutas Tropicales. We appreciate the University of Arizona Genetics Core and Illumina for providing reagents and equipment for library sequencing. The author, Heriberto García-Coronado (CVU 490952), thanks the CONAHCYT (acronym in Spanish) for the Ph.D. scholarship assigned (749341). The author, Heriberto García-Coronado, thanks Dr. Edmundo Domínguez-Rosas for the technical support in bioinformatics for identifying long non-coding RNA.

      • The authors declare that they have no conflict of interest.

      • Supplementary File 1 Nucleotide a nd p redicted a mino a cid s equences o f t he cuticle biosynthesis-related transcripts.
      • Supplementary Table S1 Summary of homology search for sweet pitaya (Stenocereus thurberi) transcripts in different databases. Homologous sequences were predicted by an alignment through BLAST21 to the protein databases listed in the table with an E value threshold of < 1 × 10−10 for the nr-NCBI database and an E value threshold of < 1 × 10⁵ for the others.
      • Supplementary Table S2 Homology search for sweet pitaya (Stenocereus thurberi) transcripts in commercial fruits and other cactus. Homologous sequences were predicted by an alignment through BLAST21 to the protein databases listed in the table with an E value threshold of < 1 × 10⁻⁵.
      • Supplementary Table S3 Nucleotide and amino acid sequences of characterized cuticle biosynthesis genes from model plants.
      • Supplementary Table S4 List of proteins from Arabidopsis (subject) homologous to sweet pitaya transcripts (query). BLASTx alignment against the TAIR database with an E value < 1×10⁻⁵. Only the results of the thirteen bi-directional homologous transcripts here analyzed are shown.
      • Supplementary Table S5 List of proteins from tomato (subject) homologous to sweet pitaya transcripts (query). BLASTx alignment against the ITAG database with an E value < 1 × 10⁻⁵. Only the results of the thirteen bi-directional homologous transcripts here analyzed are shown.
      • Supplementary Table S6 List of predicted proteins from sweet pitaya (subject) homologous to cuticle biosynthesis genes from model plants (query). BLASTx alignment against the sweet pitaya predicted proteins with an E value < 1 × 10⁻⁵.
      • Supplementary Table S7 List of predicted proteins from sweet pitaya (subject) homologous to cuticle biosynthesis proteins from model plants (query). BLASTp alignment against the sweet pitaya predicted proteins with an E value < 1 × 10⁻⁵.
      • Supplementary Table S8 List of transcripts from sweet pitaya (subject) homologous to cuticle biosynthesis proteins from model plants (query). tBLASTn alignment against the sweet pitaya transcriptome with an E value < 1×10⁻⁵.
      • Supplementary Table S9 List of transcription factors homologous to sweet pitaya transcripts. BLASTx alignment against the PlantTFDB with a E value < 1 × 10⁻⁵.
      • Supplementary Table S10 List of protein kinases homologous to sweet pitaya transcripts. BLASTx alignment with a E value < 1 × 10⁻⁵.
      • Supplementary Table S11 List of transcriptional regulators homologous to sweet pitaya transcripts. BLASTx alignment with a E value < 1 × 10⁻⁵.
      • Supplementary Table S12 Gene Ontology (GO) terms and Enzyme Codes (EC) assigned to the sweet pitaya peel transcripts.
      • Supplementary Table S13 Top20 of Gene Ontology (GO) terms assigned to the sweet pitaya peel transcripts.
      • Supplementary Table S14 Metabolic pathways from the KEGG database assigned to the sweet pitaya peel transcripts.
      • Supplementary Table S15 Length of coding and long non-coding transcripts from sweet pitaya peel.
      • Supplementary Table S16 Abundance of coding and long non-coding transcripts from sweet pitaya peel.
      • Supplementary Table S17 Differential expression analysis results between M1 and M2 libraries. FC: Fold Change, CPM: Counts per million of reads, FDR: False Discovery Rate.
      • Supplementary Table S18 Differential expression analysis results between M1 and M3 libraries. FC: Fold Change, CPM: Counts per million of reads, FDR: False Discovery Rate.
      • Supplementary Table S19 Differential expression analysis results between M1 and M4 libraries. FC: Fold Change, CPM: Counts per million of reads, FDR: False Discovery Rate.
      • Supplementary Table S20    Expression data of the not differentially expressed transcripts (log2FC < 1, FDR < 0.05).
      • Supplementary Table S21 Expression data of the 27 tentative reference genes with the lowest coefficient of variation (< 0.113).
      • Supplementary Table S22 Expression data and coefficient of variation of the 14 sweet pitaya transcripts homologous to reference genes from other cactus fruits.
      • Supplementary Table S23 Homology of the candidate reference genes and the cuticle biosynthesis-related transcripts from Stenocereus thurberi. The homologous search was carried out through BLAST alignment of the S. thurberi transcriptome to Hylocereus polyrhizus transcripts, TAIR, ITAG, and SwissProt database using a maximal E value of 1×10⁻⁵. Abbreviations: Actin 7  (StACT7), alpha-tubulin (StTUA), elongation factor 1-alpha (StEF1a), COP1-interactive protein 1 (StCIP1), plasma membrane ATPase 4 (StPMA4), BEL1-like homeodomain protein 1 (StBLH1), polyubiquitin 3 (StUBQ3), plastidic ATP/ADP-transporter (StTLC1), cytochrome p450 family 77 subfamily A (StCYP77A), Gly-Asp-Ser-Leu motif lipase/esterase 1 (StGDSL1), and ATP binding cassette transporter family G member 11 (StABCG11). S. thurberi transcripts identified in this study were designated with the prefix "St" and the name of their best homologous match from other plant species.
      • Supplementary Table S24 Oligonucleotide sequences designed to amplify the candidate reference genes and transcripts involved in cuticle biosynthesis. Primers were designed with the PrimerQuest, OligoAnalyzer, and UNAFold tools from Integrated DNA Technologies (www.idtdna.com). Abbreviations: Primer melting temperature (Tm), base pairs (bp), plastidic ATP/ADPtransporter (StTLC1), plasma membrane ATPase 4 (StPMA4), polyubiquitin 3 (StUBQ3), alpha-tubulin (StTUA), actin 7 (StACT7), elongation factor 1-alpha (StEF1a), COP1-interactive protein 1 (StCIP1), ATP binding cassette transporter family G member 11 (StABCG11), BEL1-like homeodomain protein 1 (StBLH1), Gly-Asp-Ser-Leu motif lipase/esterase 1 (StGDSL1), and cytochrome p450 family 77 subfamily A (StCYP77A). S. thurberi transcripts identified in this study were designated with the prefix "St" and the name of their best homologous match from other plant species.
      • Supplementary Table S25 Nucleotide sequences of the candidate reference genes.
      • Supplementary Table S26 Cycle threshold (Ct) values of the tentative reference genes during sweet pitaya fruit development.
      • Supplementary Table S27 Stability analysis of the candidate reference genes during sweet pitaya fruit development. The values were calculated by the algorithms geNorm (M value), NormFinder (stability value), BestKeeper (standard deviation +/− crossing point value), the deltaCt method (average of standard deviation), and RefFinder (geometric mean of ranking values) from the cycle threshold (Ct) data. The lowest values indicate the most stable genes. The Ct data was recorded by qRT-PCR in a QIAquant 96 5 plex (QIAGEN) following the manufacturer's protocol. Abbreviations: Actin 7 (StACT7), alpha-tubulin (StTUA), elongation factor 1-alpha (StEF1a), COP1-interactive protein 1 (StCIP1), plasma membrane ATPase 4 (StPMA4), BEL1-like homeodomain protein 1 (StBLH1), polyubiquitin 3 (StUBQ3), and plastidic ATP/ADP-transporter (StTLC1). S. thurberi transcripts identified in this study were designated with the prefix "St" and the name of their best homologous match from other plant species.
      • Supplementary Table S28 Expression of cutin biosynthesis-related transcripts during sweet pitaya fruit development normalized with four normalization strategies. Relative expression (RE) was calculated through the 2−ΔΔCt method using elongation factor 1-alpha (StEF1a), alpha-tubulin (StTUA), polyubiquitin 3 (StUBQ3), and StEF1a+StTUA as normalizing genes using the 10 DAF (days after flowering) stage as calibrator. Data represent the mean ± standard error (SE) of each developmental stage (n = 4−6). Different letters denote significant differences (Tukey HSD test, p < 0.05) between developmental stages in DAF. Statistical analysis was carried out through stats packages in R Studio. The Ct data for the analysis was recorded by qRT-PCR in a QIAquant 96 5 plex (QIAGEN) according to the manufacturer's protocol. Abbreviations: Cytochrome p450 family 77 subfamily A (StCYP77A), Gly-Asp-Ser-Leu motif lipase/esterase 1 (StGDSL1), and ATP binding cassette transporter family G member 11 (StABCG11). S. thurberi transcripts identified in this study were designated with the prefix "St" and the name of their best homologous match from other plant species.
      • Supplementary Fig. S1 Sweet pitaya fruit developmental stages. The numbers in the picture indicate the days after flowering (DAF). A longitudinal cut of sweet pitaya fruit at 40 DAF is showed. White bar = 1.0 cm.
      • Supplementary Fig. S2 Homology analysis of assembled transcripts. E value distribution (a, b) and identity distribution (c, d) of the matches in the Swiss-Prot (a, c) and RefSeq (b, d) databases. (a,b) The number inside the pie chart indicates the number of transcripts recorded using that E value. Alignment by BLASTx with an E value threshold of 1 × 10⁻⁵.
      • Supplementary Fig. S3 Amplification specificity of the candidate reference genes. Melting curve analysis of the candidate reference genes Actin 7 (StACT7), (a) alpha-tubulin (StTUA), (b) elongation factor 1-alpha (StEF1a), (c) COP1-interactive protein 1 (StCIP1), (d) plasma membrane ATPase 4 (StPMA4), (e) BEL1-like homeodomain protein 1 (StBLH1), (f) polyubiquitin 3 (StUBQ3), (g) and plastidic ATP/ADP-transporter (StTLC1), (h) Transcript quantification and melting curve were recorded in a QIAquant 96 5 plex (QIAGEN) following the manufacturer's protocol.
      • Supplementary Fig. S4 Analysis of the predicted protein StCYP77A from Stenocereus thurberi. (a) Phylogenetic tree of StCYP77A and related proteins of the subfamily CYP77A (CYP77A2, CYP77A4, and CYP77A6) from Solanum lycopersicum (Sl), Solanum melongena (Sm), Nicotiana attenuata (Na), Beta vulgaris (Bv), Carnegiea gigantean (Cg), Arabidopsis thaliana (At), Isatis tinctoria (It), and Hirschfeldia incana (Hi). The database accession number is included next to the protein name. The scale bar of 0.05 represented a sequence divergence of 5%. The number in the branches is the percentage bootstrap value of 1,000 replicates. The highest percentages represent more significant results. The black square shows AtCYP77A4 and AtCYP77A6 from A. thaliana. The black diamond shows the homologous SmCYP77A2 from S. melongena. The red circle and red triangle show StCYP77A from S. thurberi and a protein from the closest related species C. gigantean, respectively. Neighbor-joining (NJ) phylogenetic tree constructed by MEGA11 software. (b) The predicted membranespanning region of StCYP77A. The probability of membrane insertion (Y-axis) and transmembrane region represented by purple color was determined by TMHMM software. (c) Predicted protein domains contained in StCYP77A amino acid sequences determined by InterProScan.
      • Supplementary Fig. S5 Analysis of the predicted protein StGDSL1 from Stenocereus thurberi. (a, b) Signal peptide and topology of StGDSL1 amino acid sequence. (a) The amino acid sequence corresponding to the signal peptide (red, orange, and yellow) and the cleavage site (CS; green dashed line) were determined by Signal P 6.0 software. (b) The signal peptide (orange) and outside (blue) region of the protein sequence were determined by deepTMHMM software. (c) Predicted protein domains contained in StGDSL1 amino acid sequences were determined by InterProScan.
      • Supplementary Fig. S6 Analysis of the predicted protein StABCG11 from Stenocereus thurberi. (a) Phylogenetic tree of StABCG11 and related proteins of the classes ABCG11, ABCG12, and ABCG13 from Arabidopsis thaliana (At), Gossypium arboreum (Ga), Citrus sinensis (Cs), Medicago truncatula (Mt), Solanum lycopersicum (Sl), Eutrema halophilum (Eh), Carnegiea gigantean (Cg), Beta vulgaris (Bv), and Spinacia oleracea (So). The database accession number next to the protein name is shown. The scale bar of 0.10 represented a sequence divergence of 10%. The number in the branches is the percentage bootstrap value of 1,000 replicates. The highest percentages represent higher significant results. The black square beside the protein name shows AtABCG11, AtABCG12, and AtABCG13 from A. thaliana. The red circle and red triangle next to the protein name show StABCG11 from S. thurberi and a protein from the closest related species, C. gigantean, respectively. Neighbor-joining (NJ) phylogenetic tree constructed by MEGA11 software. (b) The predicted transmembrane helices of StABCG11. The probability of membrane insertion (Y-axis) and transmembrane region represented by purple color was determined by TMHMM software. (c) Multiple sequence alignment of StABCG11 and its homologous from A. thaliana (AT1G17840), S. lycopersicum (Solyc03g019760), and C. gigantean (KAJ8441854). Amino acids are colored according to the chemistry classification of their side-chain. The darkest blue bars below the protein sequences indicate 100% conservation. Black rectangles show the conserved sequence of the Walker A and B motif and the ABC signature, named below the rectangles. Black width lines below the sequence show the predicted transmembrane helices of StABCG11. Alignment was carried out by MUSCLE in MEGA11 and drawn by ggmsa in R Studio.
      • Copyright: © 2024 by the author(s). Published by Maximum Academic Press, Fayetteville, GA. This article is an open access article distributed under Creative Commons Attribution License (CC BY 4.0), visit https://creativecommons.org/licenses/by/4.0/.
    Figure (7)  Table (1) References (76)
  • About this article
    Cite this article
    García-Coronado H, Hernández-Oñate MÁ, Tafolla-Arellano JC, Burgara-Estrella AJ, Tiznado-Hernández ME. 2024. De novo assembly of the sweet pitaya (Stenocereus thurberi) fruit peel transcriptome and identification of cuticle biosynthesis genes. Vegetable Research 4: e032 doi: 10.48130/vegres-0024-0031
    García-Coronado H, Hernández-Oñate MÁ, Tafolla-Arellano JC, Burgara-Estrella AJ, Tiznado-Hernández ME. 2024. De novo assembly of the sweet pitaya (Stenocereus thurberi) fruit peel transcriptome and identification of cuticle biosynthesis genes. Vegetable Research 4: e032 doi: 10.48130/vegres-0024-0031

Catalog

  • About this article

/

DownLoad:  Full-Size Img  PowerPoint
Return
Return