


-
The cucumber is a globally important vegetable crop originating from Nepal, near the southern foothills of the Himalayas[1]. It plays a vital role in China's agricultural landscape, contributing to approximately 10% of the nation's vegetable cultivation area[2]. Optimal growth and development of cucumber require particular environmental conditions, such as diurnal temperatures of 28 °C during the day and 18 °C at night, along with light intensities ranging from 300 to 800 μmol·m−2·s−1[3]. However, especially in protected cultivation systems during winter and spring, light intensity often drops below 100 μmol·m−2·s−1, leading to low-light stress. This stress significantly affects cucumber physiology, causing reduced photosynthetic capacity[4], delayed flower bud differentiation and female flower development[5], and increased fruit abortion and susceptibility to diseases[6]. Ultimately, this results in compromised yield and quality, posing a considerable obstacle to cucumber production[7].
Flowering time is a critical determinant of early maturity and high yield in cucumbers, with a well-documented complex relationship between light conditions and flower formation in protected vegetable cultivation[8]. Under low-light stress, flower development is severely impaired, leading to delayed flowering, poor floret formation, and deteriorated pollen quality[9,10]. These issues collectively result in lower fruit set rates and reduced yield per plant. Therefore, developing cucumber varieties with early maturity and resistance to low-light stress has become a key strategy for addressing the challenges faced in protected cultivation environments.
The genetic architecture underlying quantitative traits in plants is notably complex, involving both major genes with large effects and multiple minor genes[11]. This complexity is reflected in trait grouping in segregating generations and the phenomenon of fuzzy boundaries between groups[12]. To unravel this intricate genetic control, researchers have developed sophisticated analytical frameworks to separate major genes from polygenes in quantitative trait inheritance, and have been well applied[13,14]. These approaches have yielded valuable insights into gene interactions, enhancing our understanding of the genetic basis of target traits.
Quantitative Trait Loci (QTL) analysis has revolutionized the ability to identify genomic locations of genes controlling target traits[15]. This powerful tool supports the development of molecular markers for marker-assisted breeding, a strategy successfully used to study various cucumber traits, including internode length[16], flower characteristics[17,18], fruit traits[19,20], and leaf size[21]. Complementary to QTL analysis, Specific Length Amplified Fragment sequencing (SLAF-seq) has emerged as a high-resolution, efficient approach for large-scale genotyping[22]. This technique combines high-throughput and reduced representation library sequencing and has been widely used for Single nucleotide polymorphisms (SNPs) marker development and gene localization in numerous horticultural crops such as cucumber[23], pepper[24], melons[25], apples[26], and eggplants[27].
The regulation of flowering time in plants is extraordinarily complex, involving numerous genes that interact with external environmental factors[28]. In cucumbers, several flowering-related genes have been identified, beginning with the FT gene, which was isolated from cucumber using homologous cloning technology in 2009[29]. Over the past decade, additional flowering-related genes and QTLs have been identified, for example, QTLs such as FFT1.1 and FFT6.1 were mapped from recombinant inbred line populations[30], while others (FT1.1, FT5.1, and FT6.2) were detected in populations developed from crossing primitive landraces[31]. Studies demonstrated that the major effect QTL, FT1.1, is crucial for regulating flowering time in cultivated cucumbers, while the minor effect QTL, FT6.3, influences photoperiod sensitive flowering during domestication[32].
In addition to the FT gene, other important genes that regulate flowering time include TFL1[33], LFY[34], FLC[35], and SOC1[36]. Despite the significant insights gleaned from these studies, substantial gaps remain in our understanding of the genetics underlying flowering and associated genes under low-light stress conditions. To address this gap, our study employs a novel approach that integrates a main gene-polygene genetic analysis model with QTL mapping, aiming to advance the breeding of cucumber varieties resilient to low-light environments.
-
The flowering times of cucumber parental lines with varying low-light tolerance showed significant variations when exposed to low-light stress. The low-light-tolerant line WI demonstrated robust growth and flowered normally, while the light-sensitive line M14 exhibited slender growth and delayed flowering (Fig. 1).
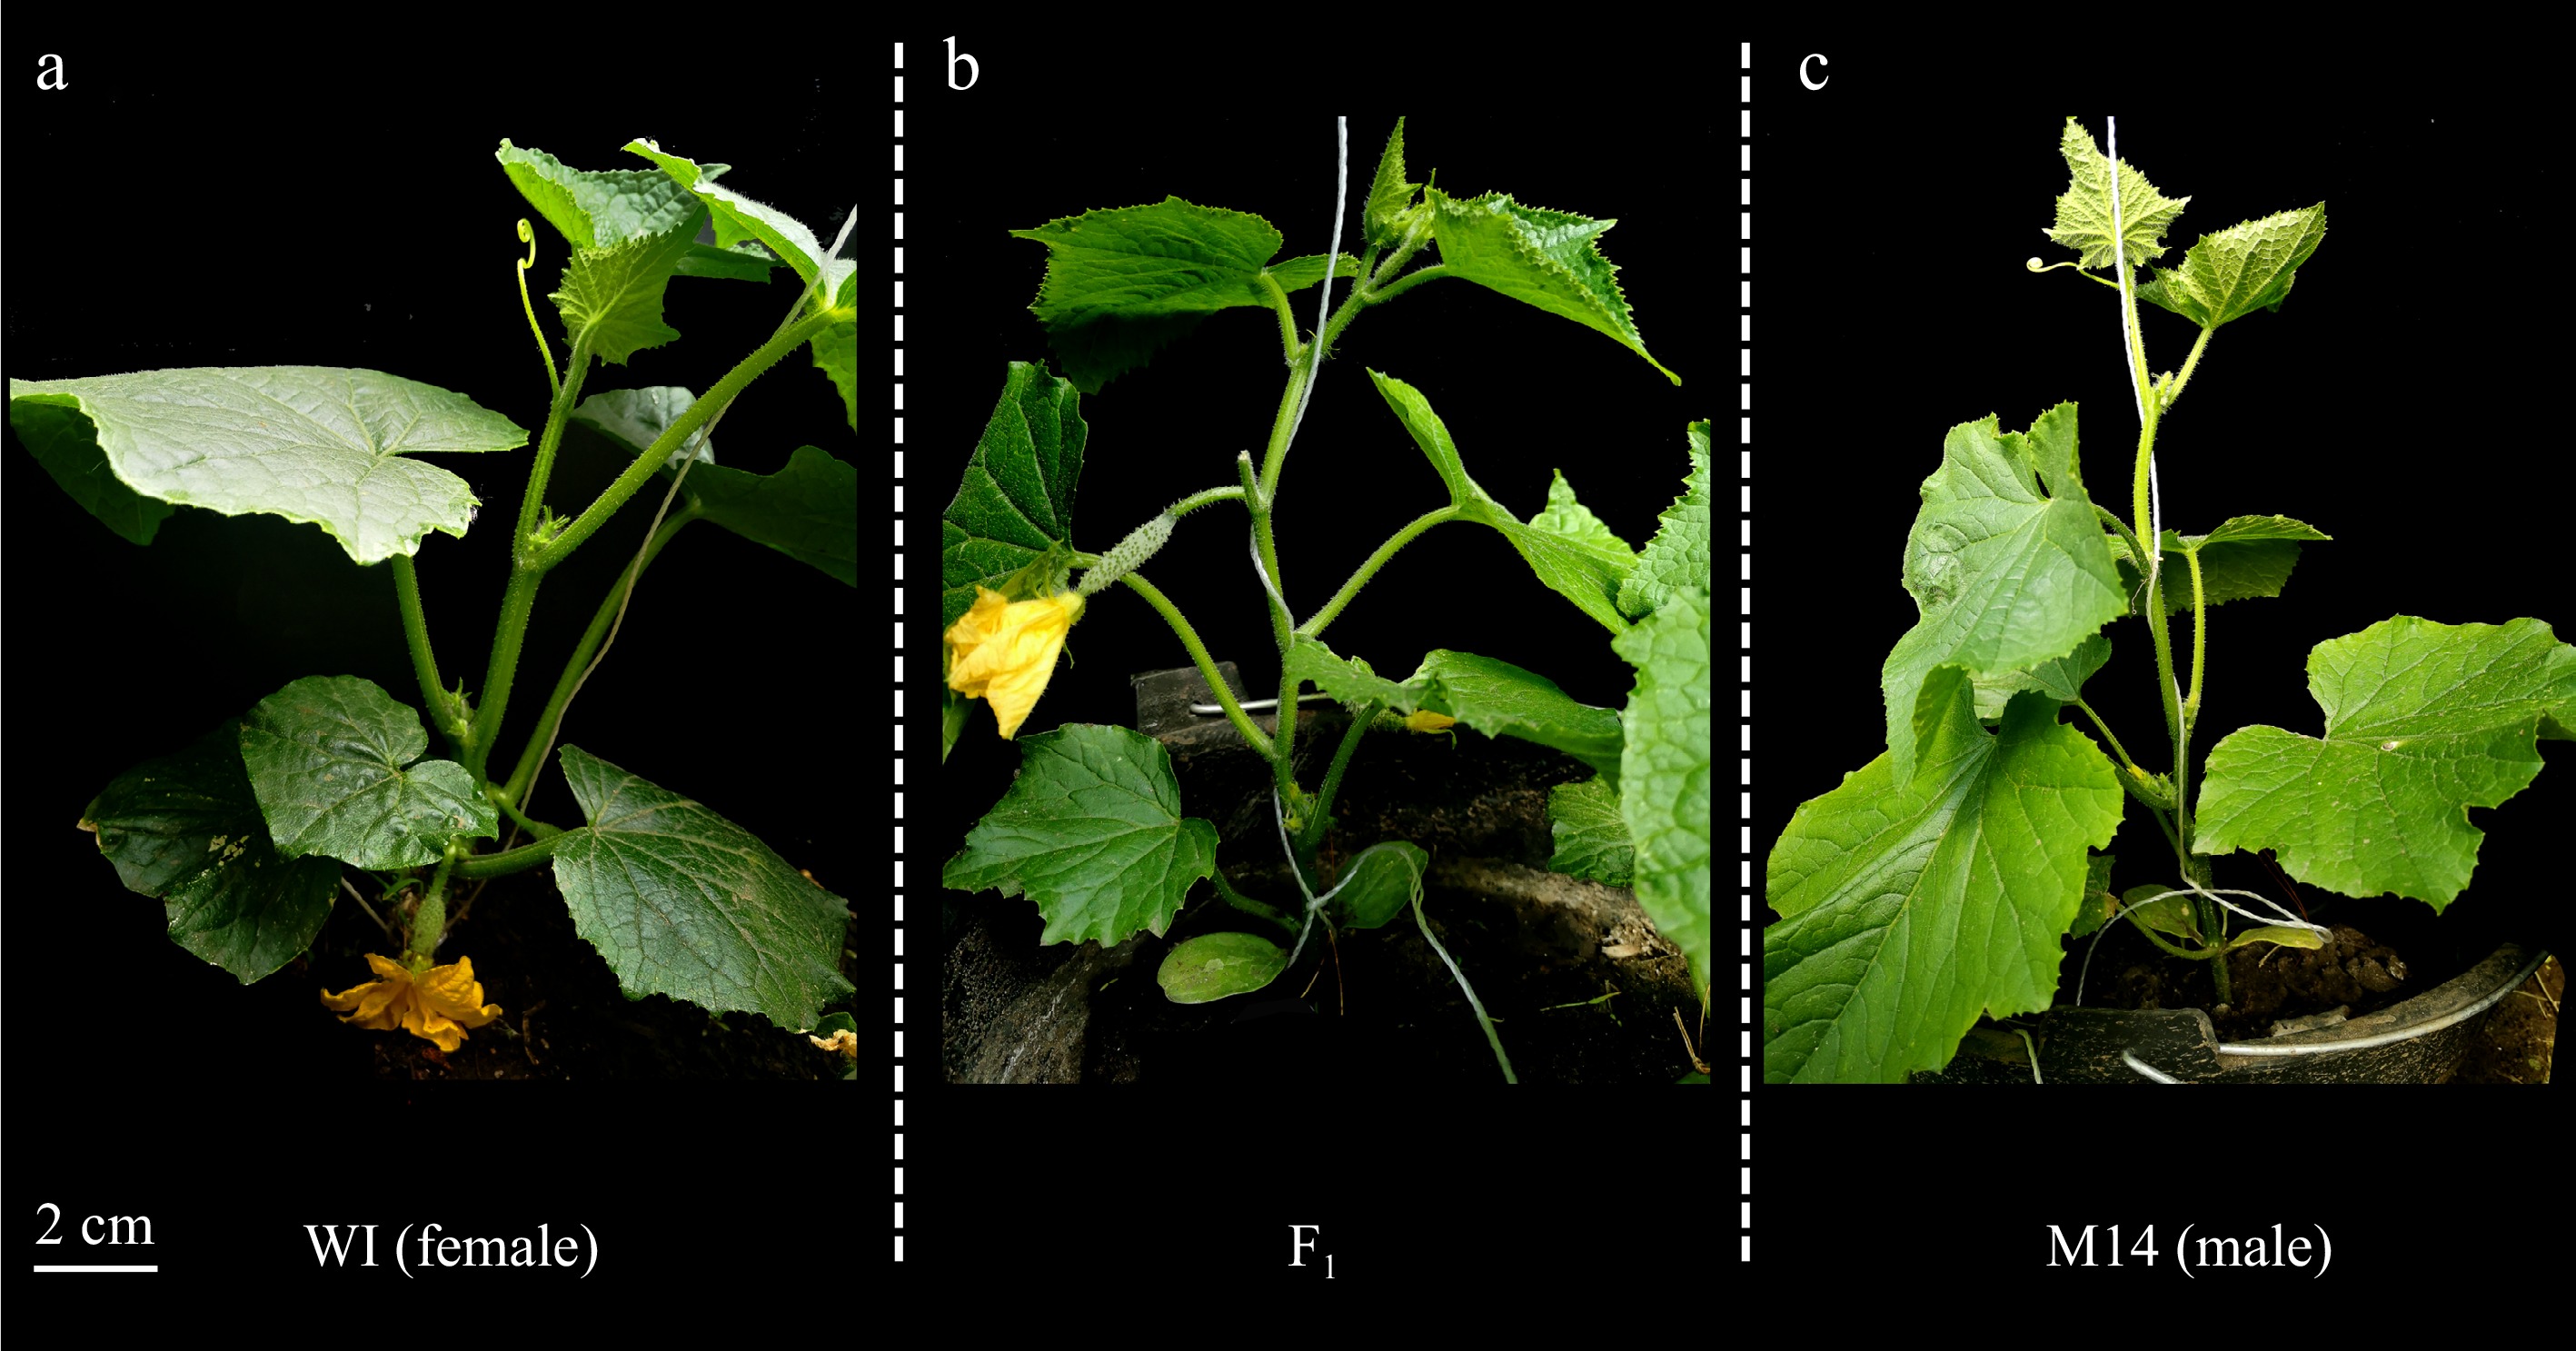
Figure 1.
Flowering phenotype of parents and their F1 plant under low-light stress.
Specifically, the first female and male flowering times (FFT and FMT) for the tolerant parent WI were 55 d and 46 d, respectively. In contrast, the intolerant parent M14 had FFT and FMT of 68 d and 61 d, respectively. The F1 hybrids demonstrated intermediate flowering times of 60 d for FFT and 54 d for FMT (Table 1).
Table 1. The flowering phenotype of different low-light tolerance cucumber lines under low-light stress.
Traits WI (P1) M14 (P2) F1 FFT (d) 55.0 ± 1.12c 68.0 ± 1.12a 60.0 ± 5.10b FMT (d) 46.0 ± 2.11c 61.0 ± 3.24a 54.0 ± 10.08b FFT: the first female flowering time; FMT: the first male flowering time; P1: parental line1; P2: parental line2. Phenotypic analysis and frequency distribution of flowering time in the F2 population
-
In the F2 generation, the FFT among individual plants ranged from 49 to 90 d (Table 2). The distribution of FFT exhibited a kurtosis (SEK) of 3.186, indicating a marked peakedness, and a skewness (SES) of 1.171, which suggests a rightward skewed distribution. The coefficient of variation (CV) for FFT was computed at 13.166, reflecting a significant variability relative to the mean. Conversely, FMT ranged from 44 to 70 d, with a kurtosis of 0.521 and skewness of 0.413, indicative of a more symmetric distribution. The CV for FMT was slightly lower at 11.285, denoting moderate variation (Table 2).
Table 2. Phenotype and variation analysis of cucumber flowering in the F2 population.
Traits Range Mean (d) SD Kurtosis
(SEK)Skewness
(SES)CV FFT 49~90 60.1 ± 7.081 7.913 3.186 1.171 13.166 FMT 44~70 55.1 ± 6.005 6.213 0.521 0.413 11.285 SD: Standard deviation; CV, The coefficient of variation. CV = SD/Mean. The frequency distribution of FFT in the F2 population displayed a unimodal pattern, with a prominent peak observed between 55 d and 60 d, accounting for 40% of the population (Fig. 2a). This peak closely corresponds to the FFT of the F2 hybrid plants, suggesting consistent inheritance patterns from the parental lines. Notably, a substantial portion of F2 plants exhibited later FFTs, skewing the distribution towards the late-flowering parent, M14, at 68 d.
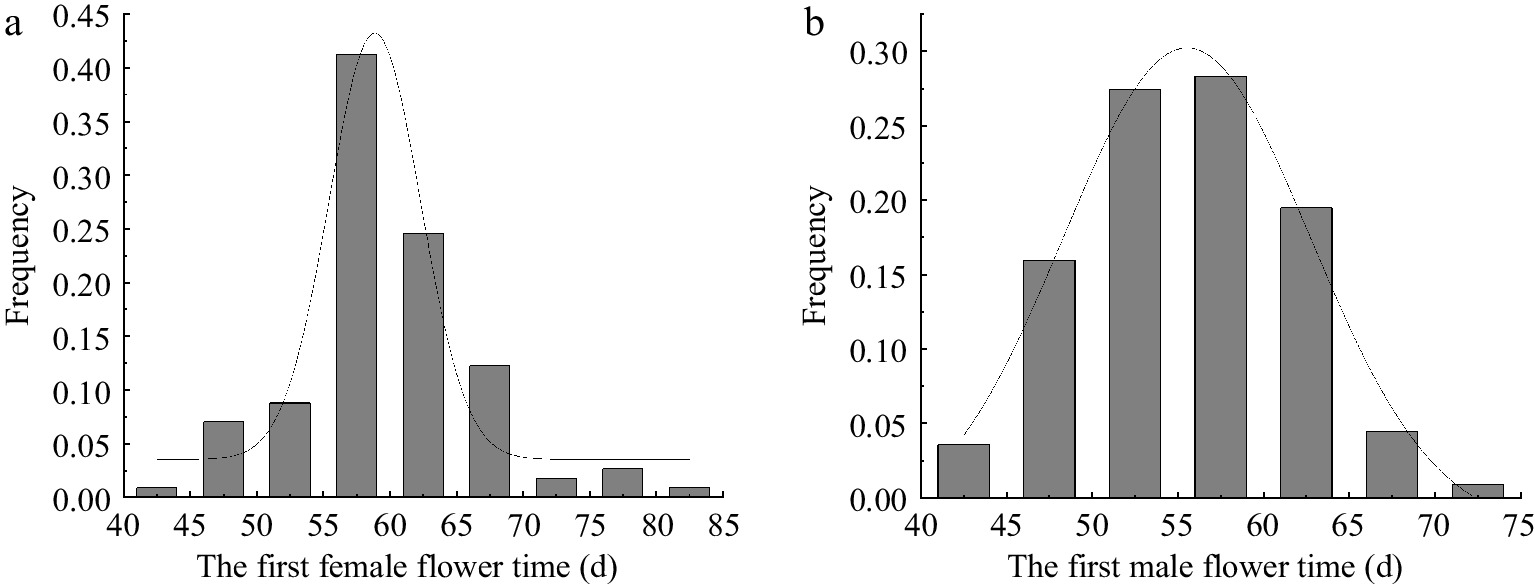
Figure 2.
Frequency distribution of (a) FFT and (b) FMT in the F2 population.
In contrast, the distribution of FMT appeared to follow a roughly normal pattern with a peak between 50 and 60 d, representing about 27.50% of the population (Fig. 2b). The majority of FMT values were skewed towards the later-flowering parent M14 (61 d), indicating a dominant influence of the M14 genotype on FMT under low-light conditions. Distinctive distribution patterns emerged for both FFT and FMT traits under low-light stress. The unimodal distribution of FFT suggests the involvement of multiple major genes, whereas the more normal distribution of FMT implies stable genetic control, likely governed by fewer major genes and polygenic factors.
Genetic analysis of FFT and FMT under low-light stress
-
The flowering time of cucumbers under low-light stress was analyzed across three pedigrees, (P1, P2, F1, and F2) utilizing a major gene plus polygene mixed genetic model. For each model, the maximum logarithmic likelihood (MLV) and the Akaike Information Criterion (AIC) values were calculated (Supplementary Table S1). Based on the AIC values, the three models with the lowest AIC scores were selected as alternative models for further consideration.
For the FFT, the models with the lowest AIC values were E-1 (AIC = 1,014.977), C-0 (AIC = 1,016.069), and D-0 (AIC = 1,018.376). These models were recognized as potential candidates for elucidating the genetic control of FFT. In parallel, for FMT, the models exhibiting the lowest AIC values were E-5 (AIC = 941.995), E-0 (AIC = 944.543), and E-1 (AIC = 946.043) (Supplementary Table S1).
To evaluate the robustness of these models, we conducted equal distribution tests (U12, U22, U32), the Smirnov test (nW2), and the Kolmogorov test (Dn) on the six selected models. The results yielded statistical indicators (U12, U22, U32, nW2, and Dn) to assess the significance of observed differences (Supplementary Table S2). For FFT, two out of the three alternative models demonstrated significant results according to these statistical indicators. Thus, adhering to the principle of selecting the model with the minimum AIC value, the E-1 model (MX2-ADI-AD)—which represents two pairs of additive dominant epistatic major genes alongside additive dominant multiple genes—was identified as the optimal genetic model for FFT under low-light stress.
For FMT, only the U32 value in the E-5 model (MX2-ADE-AD) reached the significance threshold (3.514, p = 0.032*), while the other two models did not show significance (Supplementary Table S3). Consequently, the E-5 model—which represents two pairs of completely dominant major genes in conjunction with additive dominant multiple genes—was considered the optimal genetic model for FMT under low-light stress.
Genetic parameter estimations
-
Using the least squares method, we estimated the first order (1st order) and second order (2nd order) genetic parameters for the optimal models of FFT and FMT. In the E-1 model for FFT, the dominant effect values, ha and hb, were 5.113 and 9.001, respectively, both exhibiting positive effects. The values for additive × additive (i), additive × dominant (jab), and dominant × dominant (l) interactions were −5.113, 4.160, and −9.099, respectively, which indicated significant interactions between the major genes which significantly affect FFT. The additive effect [d] and dominant effect [h] values were 9.529 and −6.797, respectively. The dominant potential energy ratio [h]/[d] was −0.713. The second-order parameters for phenotypic variance (σ2p), major gene variance (σ2mg), and polygenic main gene variance (σ2pg) were 34.741, 20.678, and 0, respectively. The heritability of the major genes (h2mg) was 59.52%, while the polygenic heritability (h2pg) was 0% (Table 3).
Table 3. Estimates of the first- and second-order genetic parameters of flowering time.
1st order
parametersEstimate 2nd order
parametersEstimate FFT FMT FFT FMT da 0.000 −13.063 σ2p 34.741 35.429 db 0.000 −10.178 σ2mg 20.678 10.090 ha 5.113 / σ2pg 0.000 20.661 hb 9.001 / h2mg (%) 59.5 2 28.48 i −5.113 / h2pg (%) 00.0 0 58.33 jab 4.160 / jba 0.000 / l −9.099 / [d] 9.529 26.828 [h] −6.797 13.262 [h]/[d] −0.713 0.450 da: Additive effect of the first pair of main genes; db: Additive effect of the second pair of main genes; ha: Dominant effect of the first pair of main genes; hb: Dominant effect of the second pair on the main gene; [d]: Polygenic additive effectivity; [h]: Multigene dominant effector value; [h]/[d]: Dominant potential-energy ratio; σ2p: Phenotypic variance; σ2mg: Main gene variance; σ2pg: Polygenic variance; h2mg (%): Main gene heritability rate; h2pg (%): polygenic inheritance rate. For the E-5 model, identified as the optimal genetic model for FMT, the additive effects da and db of the major FMT genes were −13.063 and −10.178, respectively, indicating negative genetic effects. The values for [d] and [h] were 26.828 and 13.262, respectively, with a dominant potential energy ratio [h]/[d] of 0.450. The second-order parameters for σ2p, σ2mg, and σ2pg were 35.429, 10.090, and 20.661, respectively. The heritability of the major genes (h2mg) was 28.48%, and the polygenic heritability (h2pg) was 58.33%.
QTL analysis of flowering time based on SLAF
-
Under low-light stress conditions, significant quantitative trait loci (QTLs) associated with flowering-related traits were identified through QTL mapping, specifically located on Chr.1 and Chr.6. The maximum logarithm of the odds (LOD) values for these significant marker-trait associations were recorded at 3.825 and 3.320, with the proportion of phenotypic variation explained (PVE) by the respective markers calculated at 10.22% and 12.61% (Table 4).
Table 4. QTLs effect analysis and the number of candidate genes of FFT and FMT in cucumber under low-light stress.
QTLs Chr. Marker no. Start position (bp) End position (bp) Peak position (cM) Max LOD ADD DOM PVE (%) Gene no. QFFT1.1 1 4 4,094,997 4,101,608 27.658 3.825 9.087 −4.383 10.22 1 QFFT6.1 6 1 / / 41.620 3.817 −4.473 −9.388 10.03 / QFMT6.1 6 5 2,045,652 2,525,003 13.103 3.320 −2.123 −2.036 12.61 42 QTL, quantitative trait loci; LOD, Limit of detection; Chr., Chromosome; Max LOD, Maximum limit of detection; ADD, additive effect; DOM, dominance effect; PVE, the contribution rate. The QTL designated as QFFT1.1 on Chr.1 exhibited an additive effect (ADD) of 9.087 and a dominance effect (DOM) of −4.383. This locus was mapped to a genomic region that extends from Marker 19157 (27.658 cM) to Marker 19195 (27.658 cM), covering a genomic span of 6.61 kb, from positions 4,094,997 bp to 4,101,608 bp. Notably, this region includes one candidate gene (Table 4). The peak position of QFFT1.1 is at 27.658 cM with the max LOD value and the proportion of phenotypic variation explained (PVE) of 3.825% and 10.22% (Supplementary Table S3). Moreover, the LOD values across the entire region exceeded 3.0, indicating a significant genetic influence on flowering time. The other peak of FFT(QFFT6.1) in Fig. 3 is not summarized in the final result, that is only one marker is located in the location interval of Chr.6, which is generally considered to be a false positive result (Table 4 ; Fig. 3).
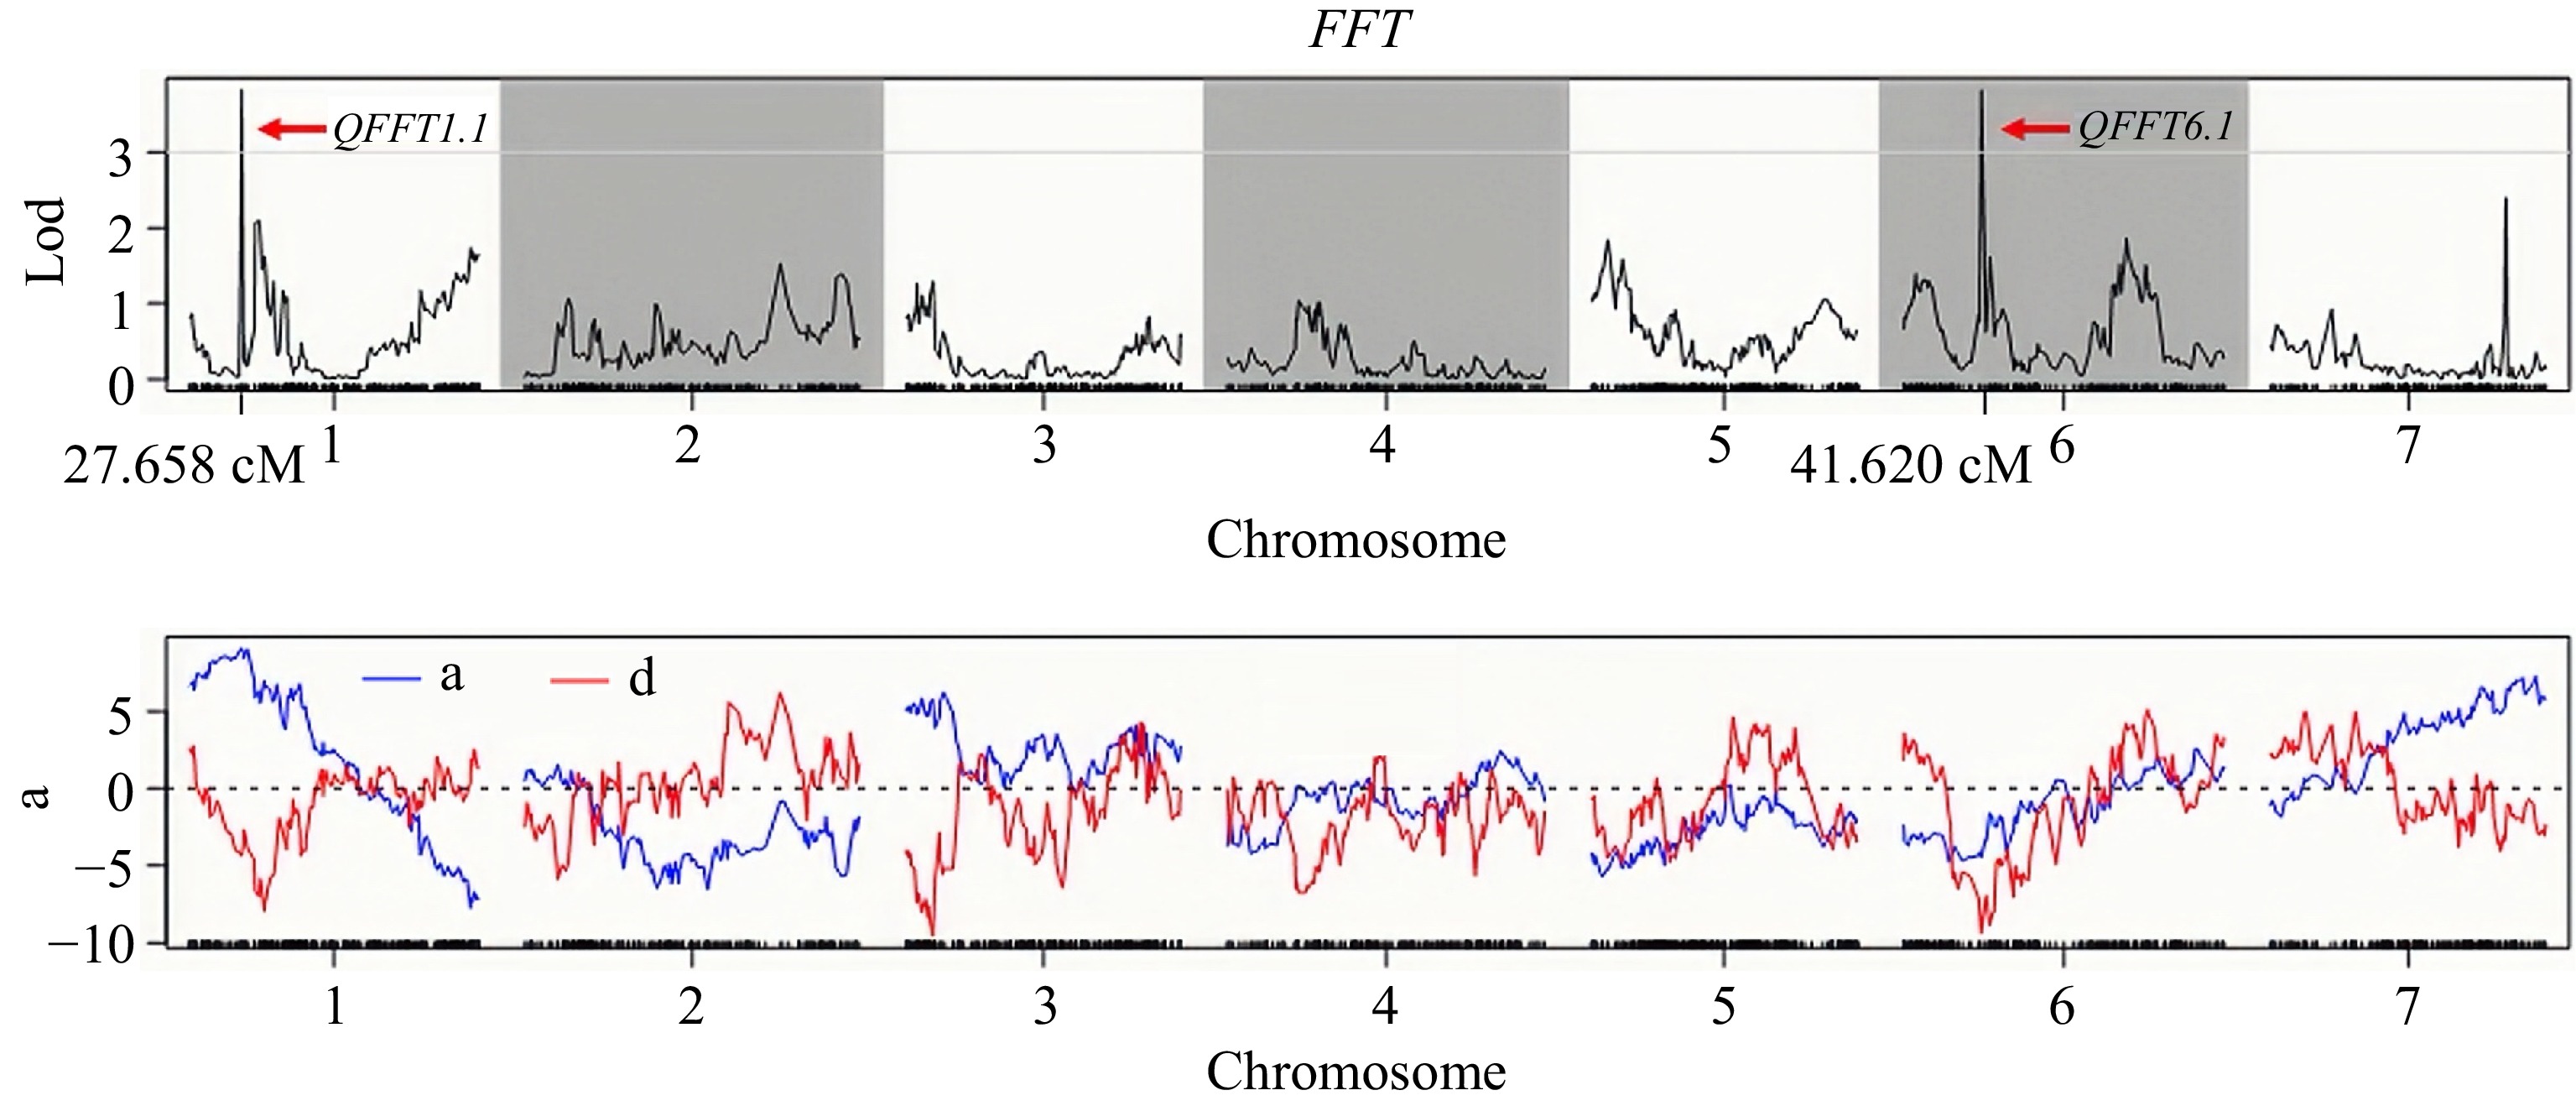
Figure 3.
The LOD value distribution of QTL loci for the FFT in the F2 population.
Similarly, the QTL QFMT6.1 on Chr.6 was located between Marker 45568 (12.661 cM) and Marker 45794 (13.103 cM). This QTL was associated with a contribution rate of 6.887%, a maximum LOD value of 3.320, an additive effect (ADD) of −2.123, and a dominance effect (DOM) of −2.036 (Supplementary Table S4). The candidate region for QFMT6.1 spanned a genomic interval from 2,045,652 to 2,525,003 bp, encompassing 479 kb and containing a total of 42 candidate genes (Table 4; Fig. 4; Supplementary Table S5).
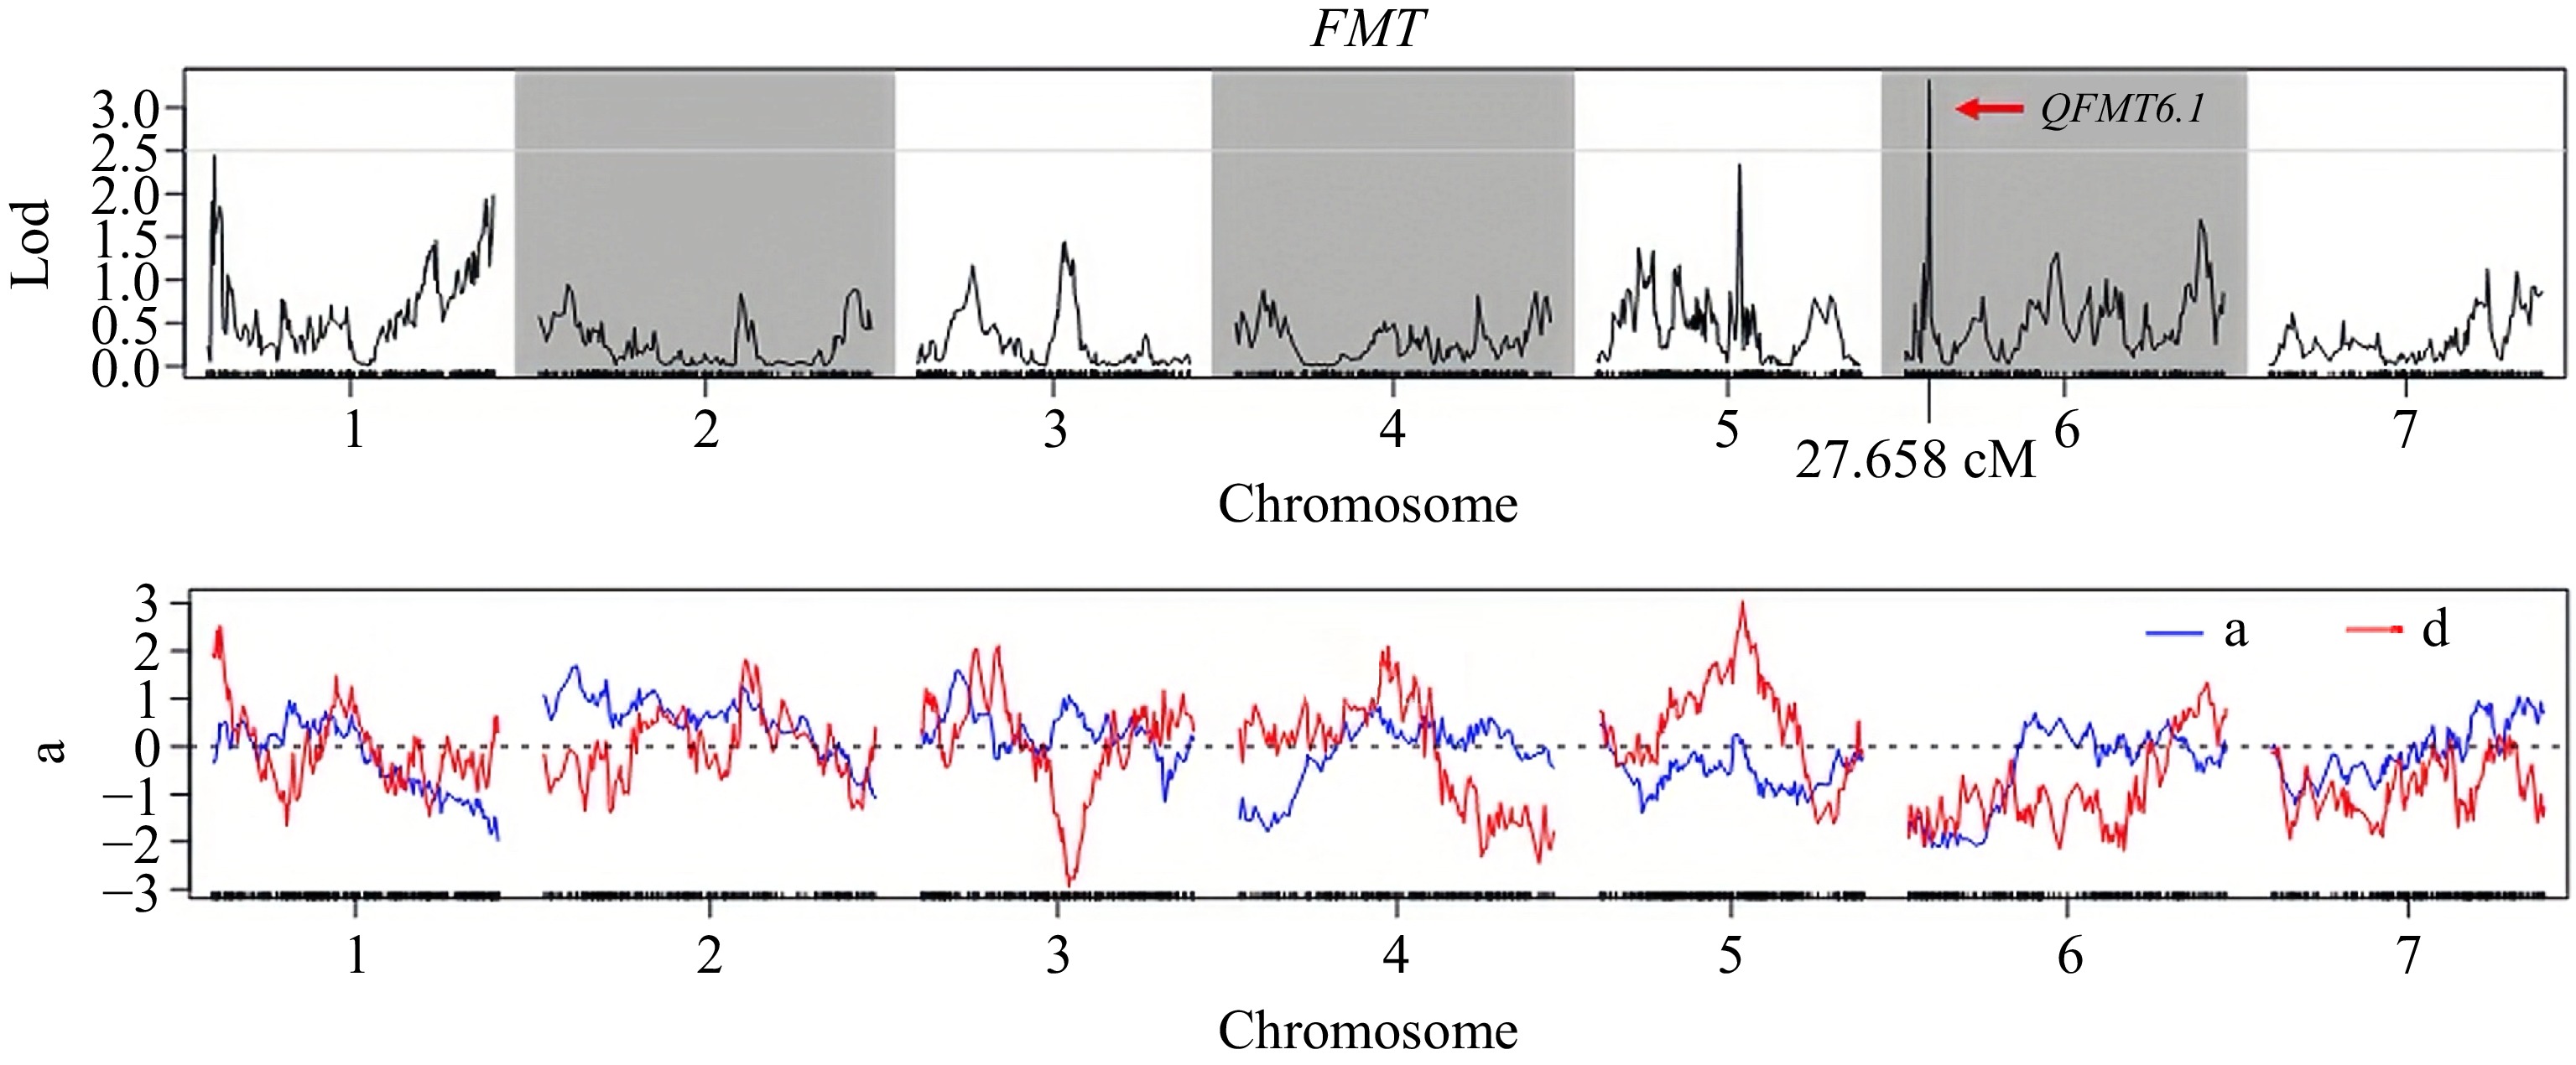
Figure 4.
The LOD value distribution curve of QTL site of the FMT in the F2 population.
Fine mapping of QFFT1.1 on Chr.1
-
Based on the SLAF-seq results (Fig. 3), we selected 50 pairs of SSR markers with polymorphisms between the parental lines near the initial localization interval on Chr.1. A total of 680 F2:3 populations and 12 pairs of SSR markers were utilized to refine the QTL loci for QFFT1.1 (Supplementary Table S6). Consequently, a genetic map for Chr.1 was constructed, presenting a total length of 89.2 cM with an average marker distance of 5.82 cM (Fig. 5a, b).
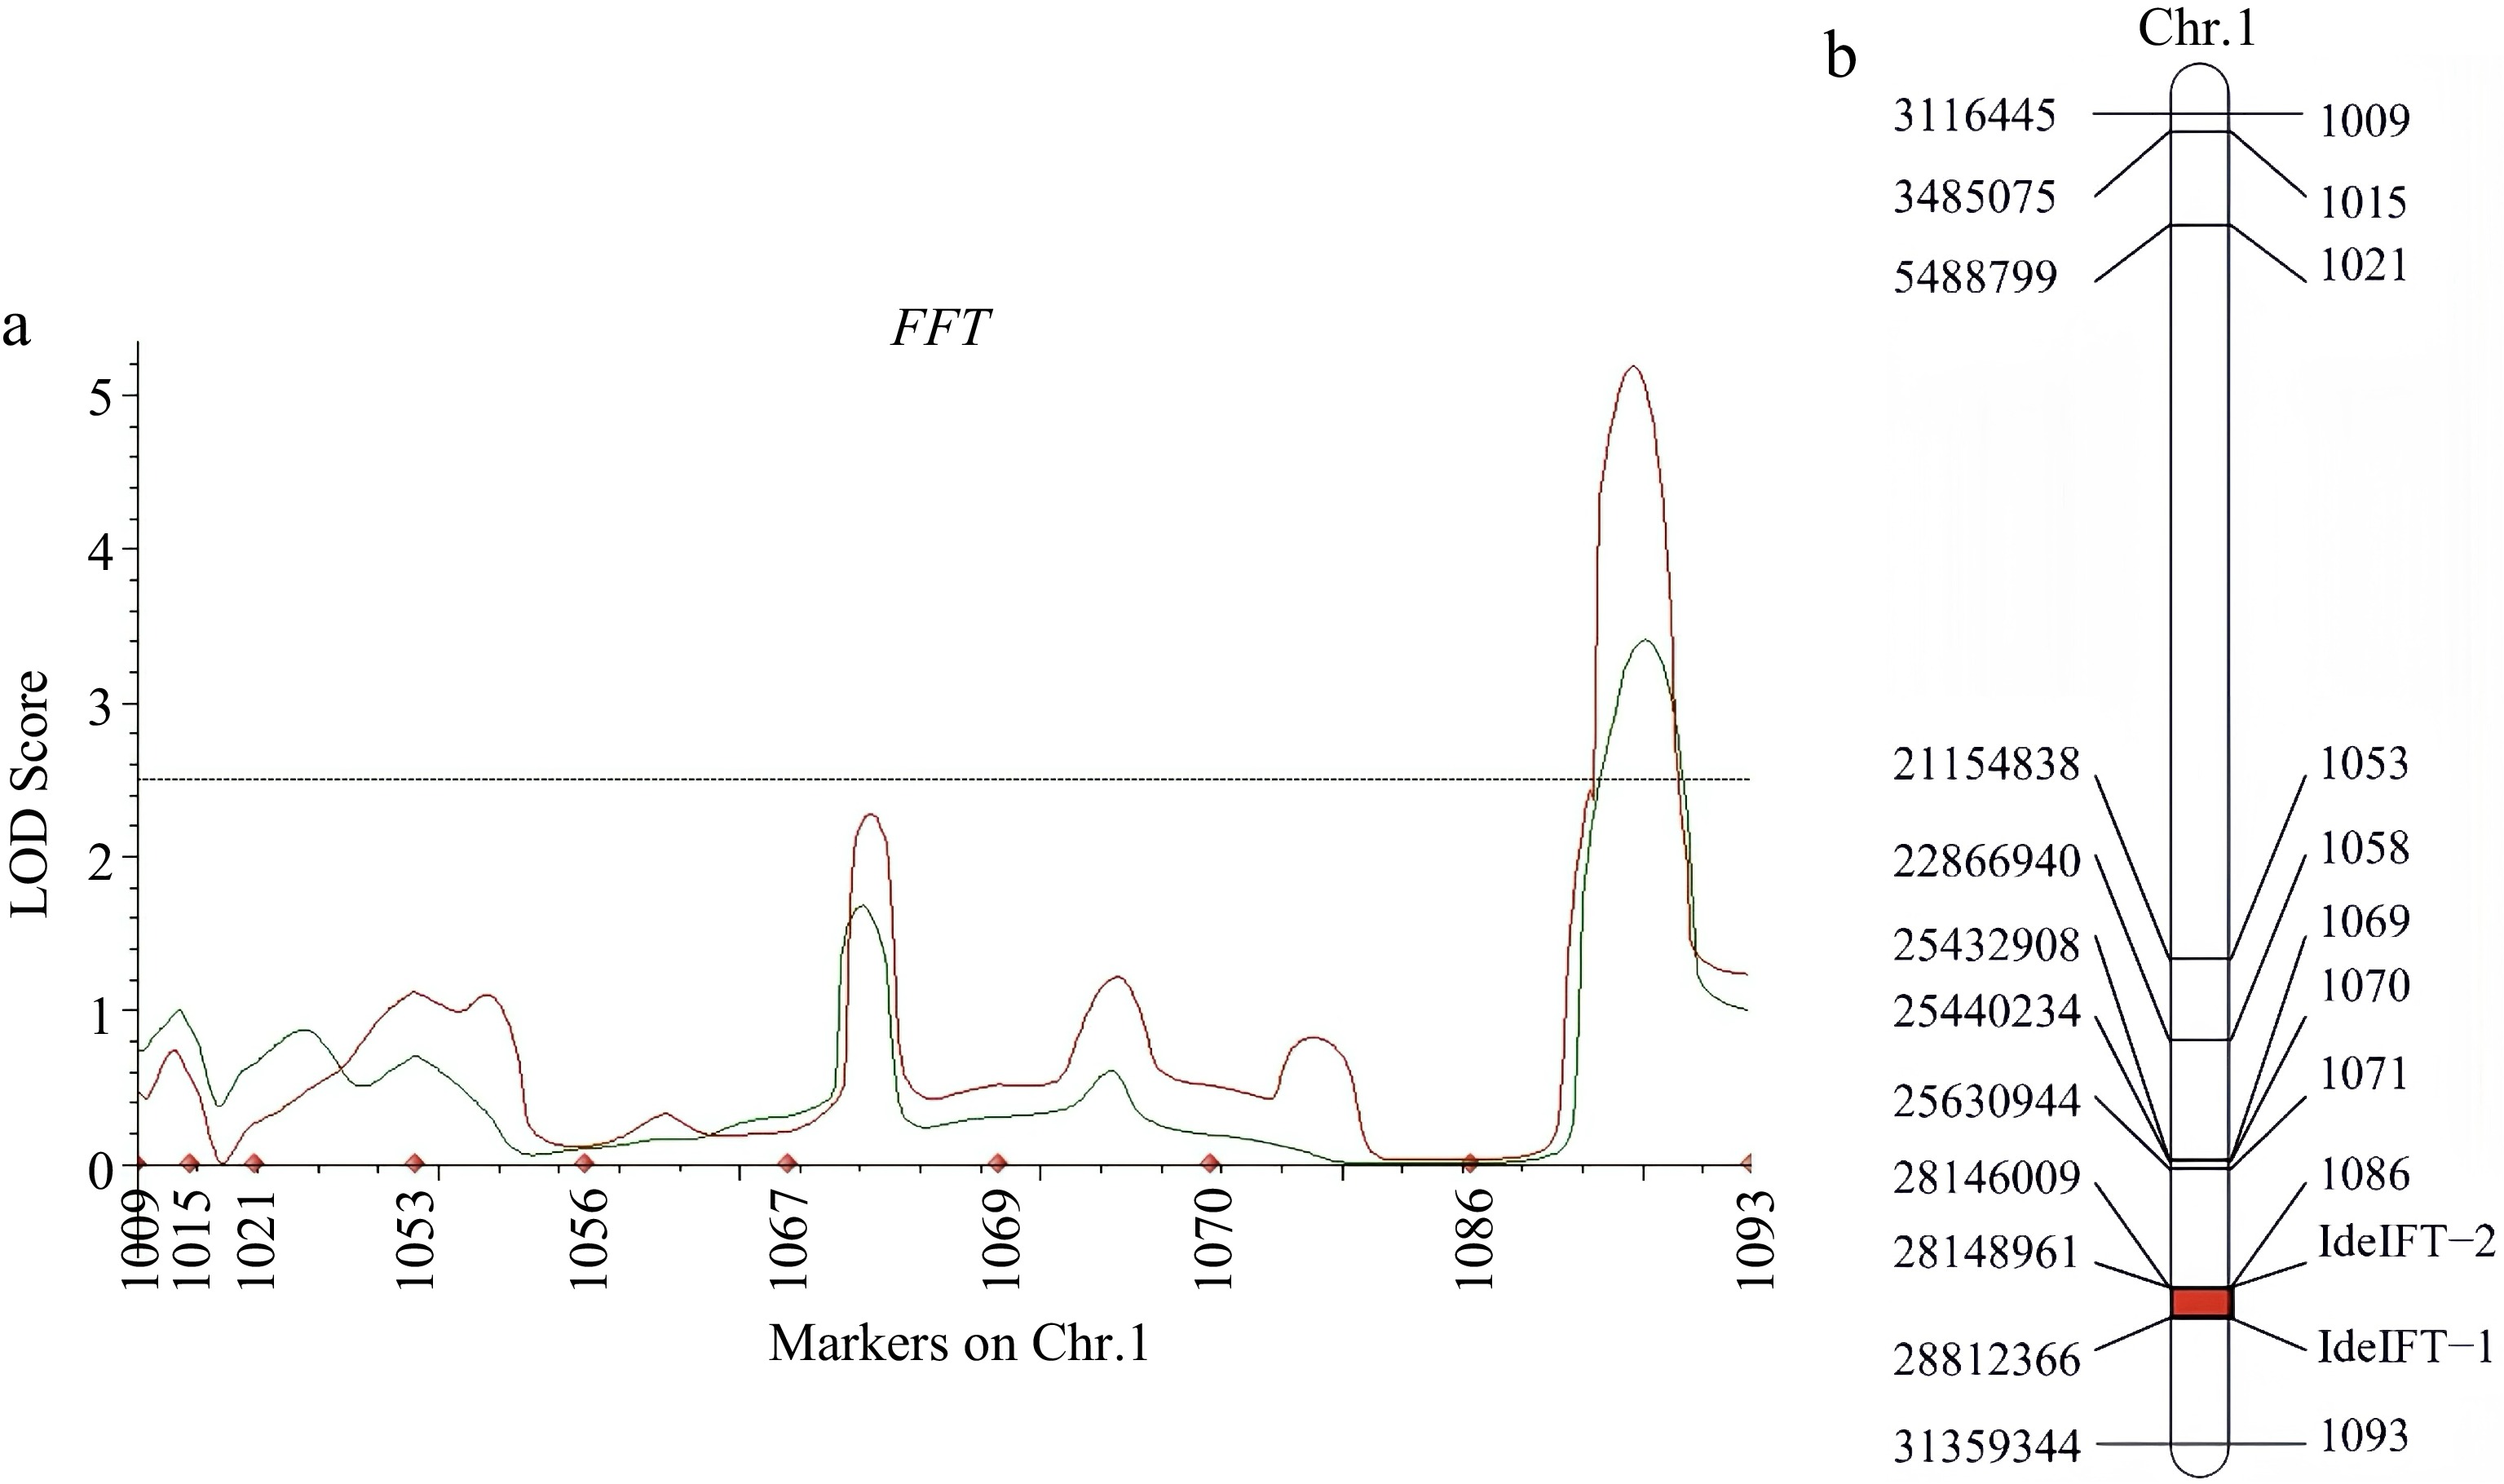
Figure 5.
(a) Quantitative trait loci curve for cucumber FFT in F2:3 populations (green) and F2 (red). The filtering threshold was set as logarithm of the odds > 2.5. (b) Linkage map of Chr.1 the final FFT mapping interval in cucumber genome based on F2:3 family populations.
In the F2:3 population, the LOD value for QFFT1.1 was measured at 2.7, with the proportion of phenotypic variation explained (PVE) calculated to be 11.36%. The QTL loci for FFT were precisely positioned between the interval of 28,149,195 to 28,812,565, within this interval, we identified a total of 52 candidate genes, including several genes that are associated with flowering regulation and photoperiod sensitivity (Supplementary Table S7).
Candidate genes of the FFT
-
A total of 15 candidate genes associated with the FFT were identified, including genes that potentially influence the morphological development of female flowers by participating in plant growth (CsGy1G030020, CsGy1G030120) and cell wall metabolism (CsGy1G030160, CsGy1G030170, and CsGy1G030300). Five candidate genes, including CsGy1G030030, belong to the Cytochrome P450 enzyme gene family, which plays an important role in plant metabolism and may indirectly affect female flower development. Another eight genes are involved in a process crucial for female flower development. Eight additional genes are involved in processes critical to female flower development. These include genes associated with DNA methylation (CsGy1G030260, and CsGy1G030350), plant differentiation (CsGy1G030220, and CsGy1G030290), and signal transduction (CsGy1G030210 and CsGy1G030290). Finally, a heat stress transcription factor gene (CsGy1G030360) was identified, which may contribute to plant responses to environmental changes, indirectly impacting female flower development (Table 5).
Table 5. Functional annotation of candidate genes of FFT.
FFT Gene ID Function annotation 1. CsGy1G030020 F-box protein 2. CsGy1G030030 Tyrosine N-monooxygenase 3. CsGy1G030040 Isoleucine N-monooxygenase 1-like 4. CsGy1G030050 Isoleucine N-monooxygenase 1-like 5. CsGy1G030060 Isoleucine N-monooxygenase 1-like 6. CsGy1G030070 Isoleucine N-monooxygenase 1-like 7. CsGy1G030120 Regulator of chromosome condensation (RCC1) family with FYVE zinc finger domain-containing protein 8. CsGy1G030160 Pectin lyase-like superfamily protein 9. CsGy1G030170 Polygalacturonase 10. CsGy1G030260 AT-hook motif nuclear-localized protein 11. CsGy1G030270 non-specific phospholipase C2 12. CsGy1G030290 Telomerase-binding protein EST1A 13. CsGy1G030300 Rho GTPase-activating protein 7 14. CsGy1G030350 Histone deacetylase 15. CsGy1G030360 Heat stress transcription factor B-4b-like Genes were blast in cucumber (Gy14) genome V2.1 ( http://cucurbitgenomics.org/v2 ).Candidate genes of the FMT
-
A total of 11 candidate genes associated with FMT were identified within the target region on Chr.6. Among these, CsGy6G002770, CsGy6G002980, and CsGy6G002910 are likely involved in the reproductive development of cucumber plants under low-light stress. The functions of CsGy6G002990 and CsGy6G002920 are associated with photosynthesis and energy production, which may indirectly influence male flower development. Similarly, CsGy6G002930 is implicated in DNA repair, signal transduction, and gene expression regulation, processes that contribute to maintaining gene stability during male flower development or positive regulation of long-day photoperiodism, flowering. Additionally, CsGy6G003020 and CsGy6G003060 are involved in metabolic pathways, immune responses, and general plant developmental processes, all of which may indirectly impact male flower development in cucumber plants (Table 6).
Table 6. Functional annotation of candidate genes of FMT.
FMT Gene ID Function annotation 1. CsGy6G002770 Somatic embryogenesis receptor kinase 1(SERK1) 2. CsGy6G002910 Protein PRD1 isoform X1 3. CsGy6G002920 Protein TIC 22-like, chloroplastic isoform X1 4. CsGy6G002930 Histone-lysine N-methyltransferase 5. CsGy6G002980 MACPF domain-containing protein 6. CsGy6G002990 Chloroplastic 7. CsGy6G003000 Sn1-specific diacylglycerol lipase beta isoform X4 8. CsGy6G003020 Vesicle transport protein 9. CsGy6G003040 WW domain-containing protein 10. CsGy6G003050 Clathrin interactor EPSIN 3-like isoform X2 11. CsGy6G003060 STRUBBELIG-receptor family 5 Genes were blast in cucumber (Gy14) genome V2.1 ( http://cucurbitgenomics.org/v2 ).Identification of SNPs and non-synonymous mutations in FFT and FMT genes
-
We conducted an in-depth analysis of the differential loci and allelic diversity within the FFT and FMT candidate genes in the WI and M14 cucumber lines. Our investigation revealed multiple SNPs resulting in missense mutations in the exons and promoters of the FFT-related genes CsGy1G030350 and CsGy1G030020, as well as non-synonymous mutations and deletions in the exons and promoters of the FMT-related genes CsGy6G002770 and CsGy6G002920. Furthermore, by integrating variation data from 388 cucumber germplasm accessions, we observed that the mutation frequency of CsGy1G030350 was notably higher, exceeding 38%, suggesting that this mutation is relatively prevalent within the population. In contrast, mutations in the FMT-related genes CsGy6G002770 and CsGy6G002920 were found to be less common (Table 7).
Table 7. Analysis of parental variation sites and natural population gene diversity of four candidate genes.
Gene ID Chr. Position WI M14 Effect type ALT proportion CsGy1G030350 Gy14Chr.1 28614154 C G Promoter 40.25% Gy14Chr.1 28615565 C T Promoter 40.00% Gy14Chr.1 28631912 G T Splice region variant and intron variant 38.00% Gy14Chr.1 28634739 T G Missense variant 38.00% Gy14Chr.1 28634748 G T Missense variant 40.00% CsGy1G030020 Gy14Chr.1 28181730 T C Splice region variant and intron variant 14.04% CsGy6G002770 Gy14Chr.6 2129884 CACATAG C Indel 10.75% Gy14Chr.6 2122291 A G Promoter 10.12% Gy14Chr.6 2129636 A G Splice region variant and intron variant 10.50% CsGy6G002920 Gy14Chr.6 2261766 G A Promoter 12.38% -
Flowering time is a complex quantitative trait in crops, commonly evaluated using indicators such as the first flowering time[31,32], and the first flower node[36]. These traits are critical for achieving early maturity in agricultural species. Understanding the genetic basis of flowering time and identifying low-light-related genes that affect flowering time is helpful for breeding early maturing and low light stress-resistant varieties.
The development of genetic linkage maps has significantly advanced the identification of quantitative trait loci (QTL) associated with flowering time and related morphological traits in horticultural crops. Numerous QTLs and genes linked to flowering traits have been reported in cucumber[29−31], melon[37], and other species. For example, the Ffn2.1 and Ffn2.2 loci are closely associated with the first flower node in pepper[24]. This study focused on the genetic analysis and QTL mapping of flowering time in cucumber plants under low-light stress, aiming to mine early flowering genes under low-light stress conditions.
Research on flowering traits in other Cucurbitaceae species has revealed complex inheritance patterns. For instance, strong female inheritance in pumpkin is regulated by either a pair of recessive genes or a combination of a major positive gene and several minor genes, as demonstrated through major gene polygene model analyses[38]. Consistent with these findings, the FFT of cucumber individuals in the F2 population displayed either a skewed normal or normal distribution under low-light stress, which distribution confirms that flowering time is a quantitative trait significantly influenced by environmental factors. Our studies highlight the importance of identifying and characterizing QTLs related to flowering time, particularly under low-light stress, to provide a reference for identifying low-light tolerance genes and breeding early-maturing, high-yielding varieties adapted to suboptimal lighting conditions.
Despite numerous studies on flowering traits, few have focused on flowering sites under low-light stress. In this study, we identified 15 and 11 candidate genes within the QTL intervals associated with the female and male flowering time in cucumber. These genes were linked to morphological development, plant metabolism, and responses to abiotic stress. Among them, FFT-related gene CsGy1G030350 is the preferred female flowering-related gene, for the higher variation in cucumber natural population. According to Gy14v2 of the cucumber genome, the CsGy1G030350 gene is functionally annotated as histone deacetylase, which plays an important role in plant flowering time regulation. Previous studies have shown that in the model plant Arabidopsis thaliana, both the histone deacetylase HDA6 and its homologous protein HDA19 can affect flowering time, HDA6 mutation leads to upregulation of FLC expression and delayed flowering[39,40]. In addition, histone deacetylases (HDACs) and their binding proteins play an important role in the regulation of plant flowering time through epigenetic regulatory mechanisms, and HDACs may indirectly regulate the expression of CO (CONSTANS) and FT affects photoperiod-dependent flowering time[41]. Furthermore, the FMT-related gene CsGy6G002770.1, encoding somatic embryogenesis receptor kinase 1 (SERK1), was identified which belongs to the second subfamily of the leucine-rich repeat receptor-like kinase (LRR-RLK) family, is highly conserved in evolution and plays a role in somatic embryogenesis, which may indirectly affect the development of male flowers[42]. CsGy6G002920 is annotated as protein TIC 22-like and chloroplastic isoform X1, are probably linked to stress adaptation (e.g., light stress, oxidative stress), which also was reported to be involved in the regulation of flowering gene expression[43]. In all, our target mapping genes are closely related to flowering, which is valuable for future functional research.
Genetic analysis indicates that flowering time is governed by a combination of major genes and polygenes, and is significantly influenced by environmental factors. The innovative aspect of this study lies in the screening of major and minor effect genes associated with flowering under low-light stress conditions. This approach aims to elucidate the impact of low-light stress on the genetic characteristics of flowering time and to predict candidate genes involved in this regulatory process. The integration of endogenous and environmental signals ensured that cucumber plants could choose the right time to flower under low-light stress, so further fine mapping of flowering time under low-light stress, combined with an increased population size, is essential for pinpointing candidate genes. The in-depth analysis of its molecular mechanism would provide a theoretical basis for molecular breeding and flowering regulation of cucumber.
-
Our findings revealed that the inheritance of FFT in cucumber is governed by two pairs of additive-dominant-epistatic major genes along with additive-dominant multiple genes. The trait is primarily controlled by a positive dominant major gene, whose effect is stronger than the additive effect. Additionally, the inheritance of FMT is regulated by two completely dominant major genes and additive-dominant multiple genes, with the additive effect of the main gene being negative. Under low-light stress, the QTLs for FFT were mapped on Chr.1 and Chr.6 of cucumber, respectively, including genes involved in reproductive development, metabolic processes, immune responses, chloroplast development, and the long-day flowering-related pathway. Finally, two candidate genes related to FFT and two genes related to FMT were identified through Go functional annotation and allelic diversity analysis.
-
This study utilized cucumber homozygous inbred lines with differing tolerances to low light: WI (P1) and M14 (P2), along with their offspring populations, including F1, F2 (N = 122), and F2:3 (N = 680). The cucumber seeds used in this experiment were provided by the cucumber research group at Heilongjiang Bayi Agricultural University (Daqing, Heilongjiang Province, China).
Planting and low-light treatment
-
Cucumber seeds were sown in a substrate mixture of peat (70%), perlite (25%), and decomposed organic fertilizer (5%) in the phytotron at Heilongjiang Bayi Agricultural University (Daqing, Heilongjiang Province, China; 125°03' E, 46°58' N) during the spring of 2022 and 2023. Standard fertilizer and irrigation practices were applied during plant cultivation.
Low-light treatment commenced at the one-leaf stage, conducted in an artificial climate chamber. The light intensity for the treatment group was set at 80 μmol·m−2·s−1, while the control group received an average daily light intensity of 500 μmol·m−2·s−1. Other environmental conditions were maintained consistently, with a day/night temperature of 28/18 °C, a 16-h photoperiod, and 80% relative humidity.
Experimental design and phenotypic investigation
-
The parental and F1 materials were grown with three replicates, each replicate containing three plants, resulting in nine phenotypic data points for each parent or F1 line. Phenotypic data from individual F2 plants over two years were analyzed to assess population-level genetic variation.
Phenotypic traits, including the FFT and the FMT, were recorded after 15 d of low-light treatment. Healthy, young leaves were collected and stored at −80 °C for subsequent DNA extraction and SLAF-seq analysis.
The FFT and FMT were measured based on the timing of the first visible flowering, using the following formulas:
FFT = The first female flowering time − Sowing time + 1;
FMT = The first male flowering time − Seeding time + 1.
DNA extraction and SLAF-seq
-
Genotyping was performed on 113 F2 plants along with the parental lines using specific locus amplified fragment sequencing (SLAF-seq). Genomic DNA was extracted from leaf tissues using the cetyltrimethylammonium bromide (CTAB) method[44]. The extracted DNA was diluted to a concentration of 50–100 ng/μL and quantified using an ND-2000 spectrophotometer (NanoDrop, Wilmington, DE, USA). The OD260/OD280 ratio was approximately 1.8, indicating high DNA purity suitable for sequencing. The SLAF-seq library was constructed and sequenced using the Illumina HiSeq 2500 platform (Illumina, Inc., San Diego, CA, USA) by Biomark, Inc. (China). The paired end sequencing read length for the library was 125 bp (PE125). The sequencing reads were aligned to the cucumber reference genome using SOAP software[45]. SLAF markers were identified by clustering sequences from each sample based on sequence similarity. Polymorphic SLAF markers were then determined by comparing sequencing data among the samples, facilitating downstream genetic analyses.
Genetic analysis and QTL mapping
-
The SEA-G4F2 six-generation major gene plus polygene mixed genetic model[46] was employed to analyze the phenotypic data for FFT and FMT. The optimal genetic model was selected using the Akaike Information Criterion (AIC) and validated through equal distribution tests (U12, U22, U32), the Smirnov test (nW²), and the Kolmogorov test (Dn).
Heritability was calculated using the following formulas:
$ \mathrm{h}^{ \mathrm{2}}_{ \mathrm{mg}}\; {({\text{%}})=\sigma }^{ \mathrm{2}}_{ \mathrm{mg}} \mathrm{/\sigma }^{ \mathrm{2}}_{ \mathrm{p}} $ $ \mathrm{h}^{ \mathrm{2}}_{ \mathrm{pg}}\; {({\text{%}} )=\sigma }^{ \mathrm{2}}_{ \mathrm{pg}} \mathrm{/\sigma }^{ \mathrm{2}}_{ \mathrm{p}} $ QTL mapping for traits of interest was performed using the Map QTL software. A logarithm of odds (LOD) threshold of 3.0 was used to identify significant QTLs. Each QTL was named following the format: trait abbreviation + chromosome number + site serial number.
Data analysis
-
Data analysis was conducted using Microsoft Excel and Origin 2021. Duncan's multiple range test was employed to evaluate significant differences in flowering time among cucumber lines. Genotypic variation and genotype-by-environment interactions were analyzed using SAS v9.4 (SAS Institute Inc., Cary, NC, USA). The normality of phenotypic data distribution was assessed using the Kolmogorov Smirnov, Lilliefors, and Shapiro Wilk tests to ensure the suitability of the data for further statistical analysis.
This research was funded by the National Natural Science Foundation of China (Grant No. 32002043). The authors would like to thank Heilongjiang Bayi Agricultural University for supporting this study and some of the work of Yanzhao Zhang.
-
The authors confirm their contribution to the paper as follows: study conception and design: conceptualization: Li D, Hu K; data curation: Hu K, Lin Y, Linghu S; formal analysis: Hu K; funding acquisition: Li D; investigation: Hu K, Lin Y; methodology: Zhang F; project administration: Sheng Y, Liu H; supervision and validation, Li D; visualization: Hu K, Linghu S; writing original draft: Hu K, Lin Y; writing review and editing: Li D, Liu H. All authors reviewed the results and approved the final version of the manuscript.
-
All data generated or analyzed during this study are included in this published article and its supplementary information files.
-
The authors declare that they have no conflict of interest.
-
# Authors contributed equally: Kaihong Hu, Yu Lin
- Supplementary Table S1 Great log-likelihood and AIC values of each genetic model of cucumber the first flowering time.
- Supplementary Table S2 Suitability tests for alternative models.
- Supplementary Table S3 The Peak information of QFFT.
- Supplementary Table S4 The Peak information of QFMT6.1.
- Supplementary Table S5 42 FMT candidate genes and their functions.
- Supplementary Table S6 SSR markers were utilized to narrow the QTL loci for QFFT1.1.
- Supplementary Table S7 52 FFT candidate genes and their functions.
- Copyright: © 2025 by the author(s). Published by Maximum Academic Press, Fayetteville, GA. This article is an open access article distributed under Creative Commons Attribution License (CC BY 4.0), visit https://creativecommons.org/licenses/by/4.0/.
-
About this article
Cite this article
Hu K, Lin Y, Linghu S, Zhang F, Sheng Y, et al. 2025. Genetic analysis and candidate gene mining of flowering time in cucumber under low-light stress. Vegetable Research 5: e017 doi: 10.48130/vegres-0025-0008 

Genetic analysis and candidate gene mining of flowering time in cucumber under low-light stress
- Received: 01 January 2025
- Revised: 20 February 2025
- Accepted: 05 March 2025
- Published online: 28 May 2025
Abstract: Low-light stress significantly impacts the growth and yield of cucumber (Cucumis sativus L.), making it essential to comprehensively understand the genetic mechanisms governing flowering time adaptation. In this study, the genetic characteristics were analyzed using a mixed model encompassing major genes and polygenes and quantitative trait loci (QTL) mapping was performed via specific length amplified fragment sequencing (SLAF-seq), followed by precise QTL mapping with SSR markers. For the first female flowering time (FFT), the optimal model, E-1 (MX2-ADI-AD), includes two pairs of additive dominant epistatic major genes plus addictive-dominant polygenes, with an additive × dominant interaction (jab) of 4.16 and a major gene heritability (h2mg) of 59.52%. For the first male flowering time (FMT), the optimal model was E-5 (MX2-ADE-AD), controlled by two pairs of completely dominant major genes and additive-dominant polygenes, with h2mg and polygene heritability (h2pg) of 28.48% and 58.33%, respectively. QTL analysis identified QFFT1.1 on chromosome 1 (Chr.1) for FFT, explaining 11.77% of phenotypic variation (Max LOD = 3.825, additive effect (ADD) = 9.087, dominant effect (DOM) = −4.383) and comprising 52 candidate genes. For FMT, QFMT6.1 on Chr.6 accounted for 6.89% of phenotypic variation (LOD = 3.320, additive effect = −2.123, dominance effect = −2.036), covering 479 kb and including 42 candidate genes. A total of two FFT-related genes and two FMT-related genes were identified, respectively through GO functional annotation and allelic diversity analysis. These findings provide a theoretical basis for further research into cucumber genes conferring low light.
-
Key words:
- Cucumber /
- Low-light stress /
- Flowering time /
- Genetic characteristics /
- Candidate genes