


-
Vegetable quality primarily comprises commercial, nutritional, storage and processing, and flavor quality [ 1] . Flavor substances are key determinants of palatability, and contribute significantly to distinct flavor profiles in fruits and vegetables. Among them, volatile flavor compounds play a vital role in imparting characteristic aromas, which can range from delicate and fragrant, to pungent. A diverse array of volatile compounds has been identified across various types of produce. For instance, 67 aroma compounds have been reported to contribute to the unique flavor of grapes [ 2] , while the distinctive scent of celery is mainly attributed to phenolic compounds such as (Z)-3-butylidenephthalide, 3-butyl-4,5-dihydrophthalide, and α-thujene [ 3] . Similarly, Guo et al. identified 41 volatile compounds in soybeans using HS-SPME-GC-MS, with key flavor contributors being 1-octen-3-ol, hexanal, (Z)-2-heptenal, 2-octene, nonanal, (Z)-2-decenal, and 3,5-octadien-2-one [ 4] . Research on volatile compounds in Brassicaceae vegetables has identified numerous flavor components, including 364 in broccoli sprouts [ 5] . Wei et al. identified 75 volatiles (e.g., aldehydes, isothiocyanates) across cabbage cultivars [ 6] . A 2022 study of six Brassica vegetables identified 190 volatiles, among which aldehydes and ketones were established as key odorants [ 7] . Critically, although numerous volatile components have been identified in Brassica vegetables, only a subset possess intrinsic aromatic properties. The characteristic flavor arises from the complex, synergistic interactions of these compounds as a whole.
Metabolomics, defined as the comprehensive study of small-molecule metabolites, deciphers the biochemical information encoded within the plant genome [ 8] . This approach is widely applied to analyze the aroma profiles of fruits and vegetables [ 9, 10] . For instance, Park et al. employed solid phase microextraction combined with gas chromatography-mass spectrometry (SPME-GC-MS) alongside chemometric analysis to identify volatile sulfur compounds (VSCs) in 58 vegetable samples, establishing a reliable method for VSCs profiling using cabbage juice as a model matrix [ 11] . Similarly, a previous study analyzed two cultivars of non-heading Chinese cabbage ( Brassica campestris ssp. chinensis, NHCC) using SPME-GC-MS. The analysis identified 34 volatile compounds, primarily alcohols and esters [ 12] . Furthermore, metabolomic and SPME-GC-MS techniques have been extensively used for in-depth flavor research in various produce, including apples [ 13] , grapes [ 14] , winter bamboo shoots [ 15] , peppers [ 16] , and radishes [ 17] . Despite the extensive application of these techniques in fruits and vegetables, the aroma profile of NHCC, particularly its distinctive local varieties, remains relatively unexplored.
NHCC is a primary crop in southern China, and a traditional vegetable in the Suzhou area, where it has a long cultivation history, and a distinctive flavor [ 18] . NHCC comprises many subspecies, each with a unique aroma. The widely cultivated varieties of Xiangqingcai (XQC) in Suzhou include black-leaved XQC (FB), yellow-leaved XQC (FH), and Xiuhuajin XQC (FX). The most distinctive feature of XQC, setting it apart from other NHCC varieties, is its unique aroma, which is reminiscent of steamed rice. This aroma is a crucial factor in consumer sensory experience. However, its characteristics and underlying release mechanism remain unclear. While some progress has been made in flavor research on headed Chinese cabbage [ 19] , studies on NHCC are lacking, and the differences in volatile compounds between 'XQC' and other NHCC varieties have not been reported.
To address this gap, volatile compounds from NHCC were extracted and identified using headspace solid phase microextraction technology, coupled with gas chromatography-mass spectrometry (HS-SPME-GC-MS). This study aims to analyze the main volatile components, and identify the characteristic aroma components in different varieties, thereby elucidating the source of NHCC's special flavor. The findings will provide a basis for the comprehensive evaluation of its volatile flavor quality. Additionally, RNA sequencing (RNA-Seq) was employed to profile the expression of genes associated with aroma metabolism across the varieties. This study is crucial for the conservation, development, and utilization of high-quality NHCC germplasm resources, and will facilitate the breeding of cultivars with improved flavor and quality.
-
The leaves of four NHCC cultivars ('FB', 'FH', 'FX', and 'SZQ' as the control) were used as test materials ( Table 1). The experiment was conducted at the Wujiang Taihu Oasis Vegetable Base (Suzhou, China). Seeds were sown on September 30, 2020, with a randomized complete block design. Following the transplantation of 30-day-old NHCC seedlings at a spacing of 25 cm × 25 cm, leaf samples were collected 50 d later for volatile compounds and RNA-Seq analysis. Immediately after collection, the samples were frozen in liquid nitrogen and stored at −80 °C. For metabolomic profiling, six biological replicates were established per cultivar, with each replicate consisting of a pooled sample of leaves from five individual plants (totaling 30 plants per cultivar). For transcriptomic analysis, three biological replicates were prepared per cultivar, each comprising a composite of leaves from five individual plants (totaling 15 plants per cultivar).
Table 1. Information on the plant cultivars used in this study.
No. Sample information Sample name Source of cultivar Sampling site 1 Brassica chinensis L. cv. Black leave XQC FB Suzhou Academy of Agricultural Sciences Suzhou Taihu Oasis 2 Brassica chinensis L. cv. Yellow leave XQC FH Suzhou Academy of Agricultural Sciences Suzhou Taihu Oasis 3 Brassica chinensis L. cv. Xiuhuajin (XHJ) FX Suzhou Academy of Agricultural Sciences Suzhou Taihu Oasis 4 Brassica chinensis L. cv. Suzhouqing SZQ Suzhou Academy of Agricultural Sciences Suzhou Taihu Oasis HS-SPME extraction and GC-MS analysis conditions
-
Volatile compounds were analyzed by headspace solid-phase microextraction, coupled with gas chromatography-mass spectrometry (HS-SPME-GC-MS). Approximately 2.0 g of ground leaf sample was weighed into a 20 mL headspace vial. Analysis was performed on an Agilent 7890B GC system coupled to a 5977B MSD, equipped with a PAL RSI 120 autosampler. A 50/30 μm DVB/CAR/PDMS fiber was used for extraction. Prior to analysis, the fiber was conditioned at 250 °C for 2 h. The sample was incubated at 60 °C for 15 min with agitation (450 rpm, with a 5 s on/2 s off cycle), followed by volatile extraction at 45 °C for 35 min. The adsorbed volatiles were then thermally desorbed in the GC inlet at 250 °C for 3 min in splitless mode.
Chromatographic separation was performed on an HP-5MS capillary column (30 m × 0.25 mm × 0.25 μm, Agilent J&W Scientific, Folsom, CA, USA) using high-purity helium as the carrier gas at a constant flow of 1.0 mL/min. The injection port temperature was 250 °C in splitless mode. The GC oven temperature was programmed as follows: initial hold at 35 °C for 3 min, ramped to 45 °C at 8 °C/min, then to 140 °C at 6°C/min, further to 230 °C at 10°C/min, and a final hold at 230 °C for 6 min. The mass spectrometer was operated in the electron ionization (EI) mode at 70 eV. The ion source and quadrupole temperatures were maintained at 230 and 150 °C, respectively. Data acquisition was performed in full scan mode, covering a mass-to-charge (m/z) range of 30−500.
RNA isolation and library preparation
-
Total RNA was extracted using TRIzol reagent. RNA concentration and purity were determined using a NanoDrop 2000 spectrophotometer (Thermo Scientific, USA), while RNA integrity was evaluated using an Agilent 2100 Bioanalyzer (Agilent Technologies, Santa Clara, CA, USA). Sequencing libraries were constructed from the qualified RNA samples using the TruSeq Stranded mRNA LT Sample Prep Kit (Illumina, San Diego, CA, USA), according to the manufacturer's instructions. Finally, transcriptome sequencing and primary bioinformatic analysis were outsourced to OE Biotech Co., Ltd. (Shanghai, China).
RNA sequencing and differentially expressed genes (DEGs) analysis
-
Paired-end sequencing (150 bp) was performed on an Illumina HiSeq X Ten platform, yielding approximately 44.34 million raw reads per sample. The raw reads were quality-filtered using Trimmomatic [ 20] to obtain clean reads, and approximately 43.26 million clean reads per sample were retained for subsequent analysis.
The clean reads were aligned to the NHCC reference genome [ 21] , using HISAT2 [ 22] . Gene expression levels were quantified as FPKM (Fragments Per Kilobase of transcript per million mapped fragments) with Cufflinks [ 23, 24] , and raw read counts were generated using HTSeq [ 25] . Differential expression analysis was performed using the DESeq R package [ 26] , with genes satisfying an adjusted p < 0.05, and an absolute log 2 fold change (|log 2FC| > l) considered as differentially expressed genes (DEGs). DEGs were analyzed using hierarchical clustering to visualize their expression patterns across samples. Functional enrichment analysis for Gene Ontology (GO) terms, and Kyoto Encyclopedia of Genes and Genomes (KEGG) pathways was performed based on the hypergeometric distribution [ 27] . Additionally, transcriptome assembly was carried out using String Tie [ 28] , and novel transcripts were identified by comparing assembled transcripts to the reference annotation using Cuff compare [ 29] .
Statistical analysis
-
Unsupervised principal component analysis (PCA) was performed using the prcomp function in R. Differential metabolites between groups were identified by combining multidimensional and univariate analyses. The relative levels of these differential metabolites were then compared between groups using Duncan's multiple range test, with a significance level set at p < 0.05. Statistical significance of the differences was assessed using Duncan's multiple range test at a significance level of p < 0.05. All statistical analyses and data visualization were conducted using R and Microsoft Excel.
-
The four NHCC cultivars exhibited distinct morphological variations in plant architecture, leaf color, and leaf morphology ( Fig. 1). Cultivar 'SZQ' displayed a compact, upright rosette habit with smooth, grayish-green leaves, and entire margins. In contrast, 'FB' showed a semi-upright, looser rosette characterized by darker green leaves with slight blistering and entire margins. The other two cultivars, 'FH' and 'FX', both exhibited semi-upright and loose plant architectures with yellowish-green leaves and slight blistering. However, they were distinguished by their leaf margins: 'FH' had wavy margins, whereas 'FX' had serrated margins with prominent venation.
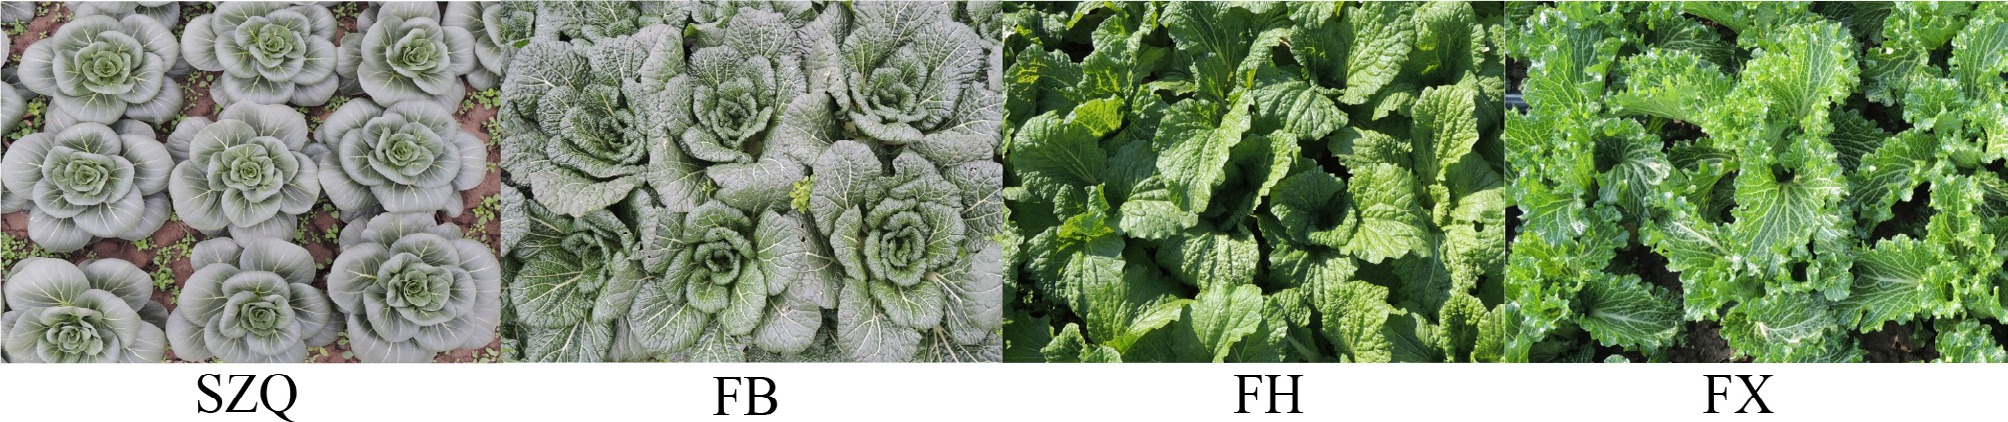
Figure 1.
Morphological diversity of NHCC cultivars.
Total ion chromatogram (TIC), and experimental sample quality control
-
The quality of the metabolomic data was assessed by total ion chromatograms (TIC), and quality control (QC) samples. The TIC profiles obtained in this experiment showed well-resolved peaks, indicating effective separation ( Supplementary Fig. S1a).
To monitor analytical variability, a quality control (QC) sample was prepared by pooling equal aliquots of all experimental samples. This QC sample was analyzed at regular intervals throughout the measurement sequence. The overlaid total ion chromatograms (TICs) of the QC replicates demonstrated high consistency in both retention times and peak intensities ( Supplementary Fig. S1b), indicating excellent instrumental stability, and minimal technical variation during the entire analytical process.
Principal component analysis (PCA)
-
The principal component analysis (PCA) model revealed distinct metabolic profiles among the four NHCC cultivars ( Fig. 2). The score plot showed tight clustering of the six biological replicates for each cultivar, demonstrating high experimental reproducibility and minimal intra-cultivar variation. Within the 95% confidence interval, cultivars FB and FX clustered closely, suggesting a similar metabolic composition, while FH and SZQ were clearly separated. Furthermore, the QC samples formed a tight cluster in the center of the plot, indicating excellent instrumental stability throughout the analysis.
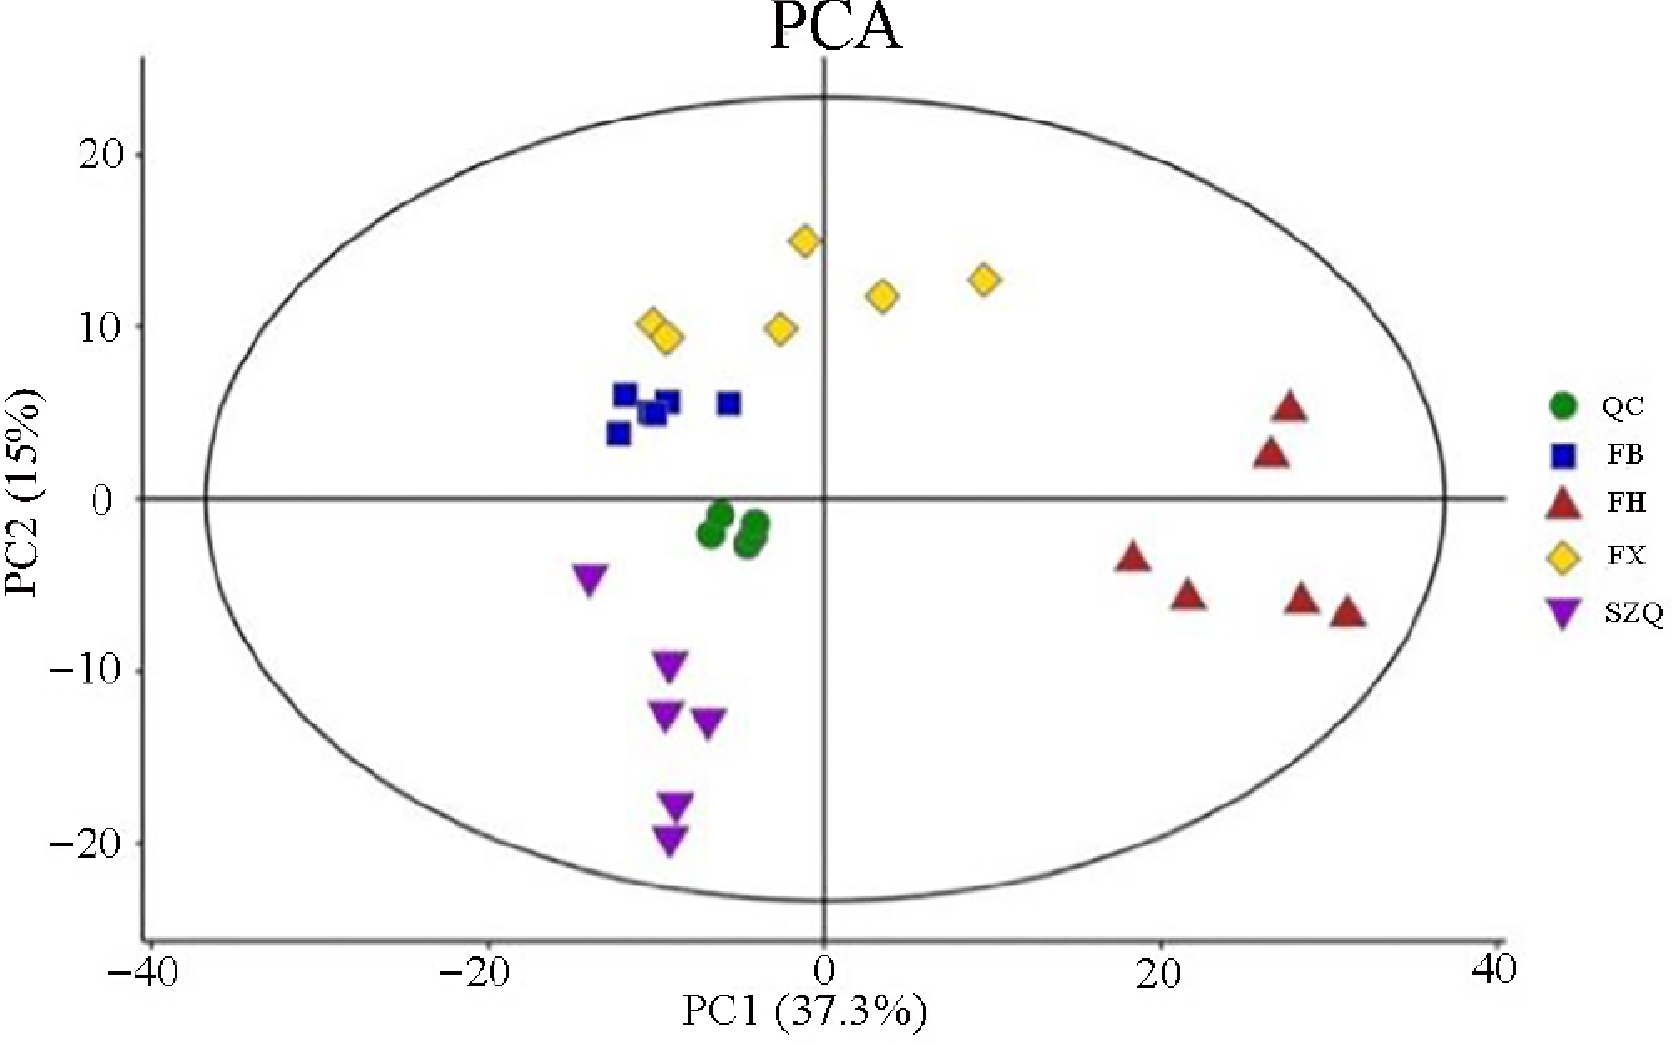
Figure 2.
PCA score plot of metabolic profiles in the four NHCC cultivars. Principal component analysis (PCA) score plot derived from the metabolomic data of four non-heading Chinese cabbage (NHCC) cultivars: FB (blue squares), FH (red triangles), FX (yellow diamonds), and SZQ (purple inverted triangles). Quality control (QC) samples (green circles) are included.
To further investigate the differences, supervised multivariate models were constructed. The parameters for these models are summarized in Table 2. The R2X values for the PCA, PLS, and O-PLS models ranged from 0.63 to 0.7, indicating good representation of the original data. The PLS and O-PLS models showed high cumulative goodness-of-fit (R2Y [cum]), and predictive ability (Q2 [cum]) values (close to 1). The high R2Y (cum), and Q2 (cum) values indicate that the O-PLS models possessed good discriminatory ability for the samples in this study ( Table 2).
Table 2. Model parameters of multivariate statistical analysis for FB, FH, and FX vs. SZQ.
Group Type PRE ORT N R2X (cum) R2Y (cum) Q2 (cum) R2 Q2 FB vs. SZQ PCA 3 0 12 0.637 − − − − PLS 3 0 12 0.633 1 0.986 − − O-PLS 1 2 12 0.633 1 0.969 0.973 −0.127 FH vs. SZQ PCA 3 0 12 0.732 − − − − PLS 3 0 12 0.712 1 0.991 − − O-PLS 1 2 12 0.712 1 0.978 0.978 −0.186 FX vs. SZQ PCA 3 0 12 0.73 − − − − PLS 3 0 12 0.645 1 0.98 − − O-PLS 1 2 12 0.645 1 0.974 0.978 −0.217 Component analysis of volatile flavor compounds
-
Comparative analysis of volatile compounds revealed substantial differences between each test cultivar (FB, FH, FX), and the control cultivar (SZQ) ( Fig. 3a). A total of 510 volatile substances were detected across all comparisons. Specifically, 156 volatile substances were identified in FB vs. SZQ, accounting for 30.59% of the total; 193 in FH vs. SZQ (37.84%); and 161 in FX vs. SZQ (31.57%) ( Fig. 3a, b). Among these, 56 volatile compounds were consistently differentially abundant across all three comparison groups. These shared differential compounds are likely the primary contributors to the characteristic aroma of the XQC cultivars ( Fig. 3b).
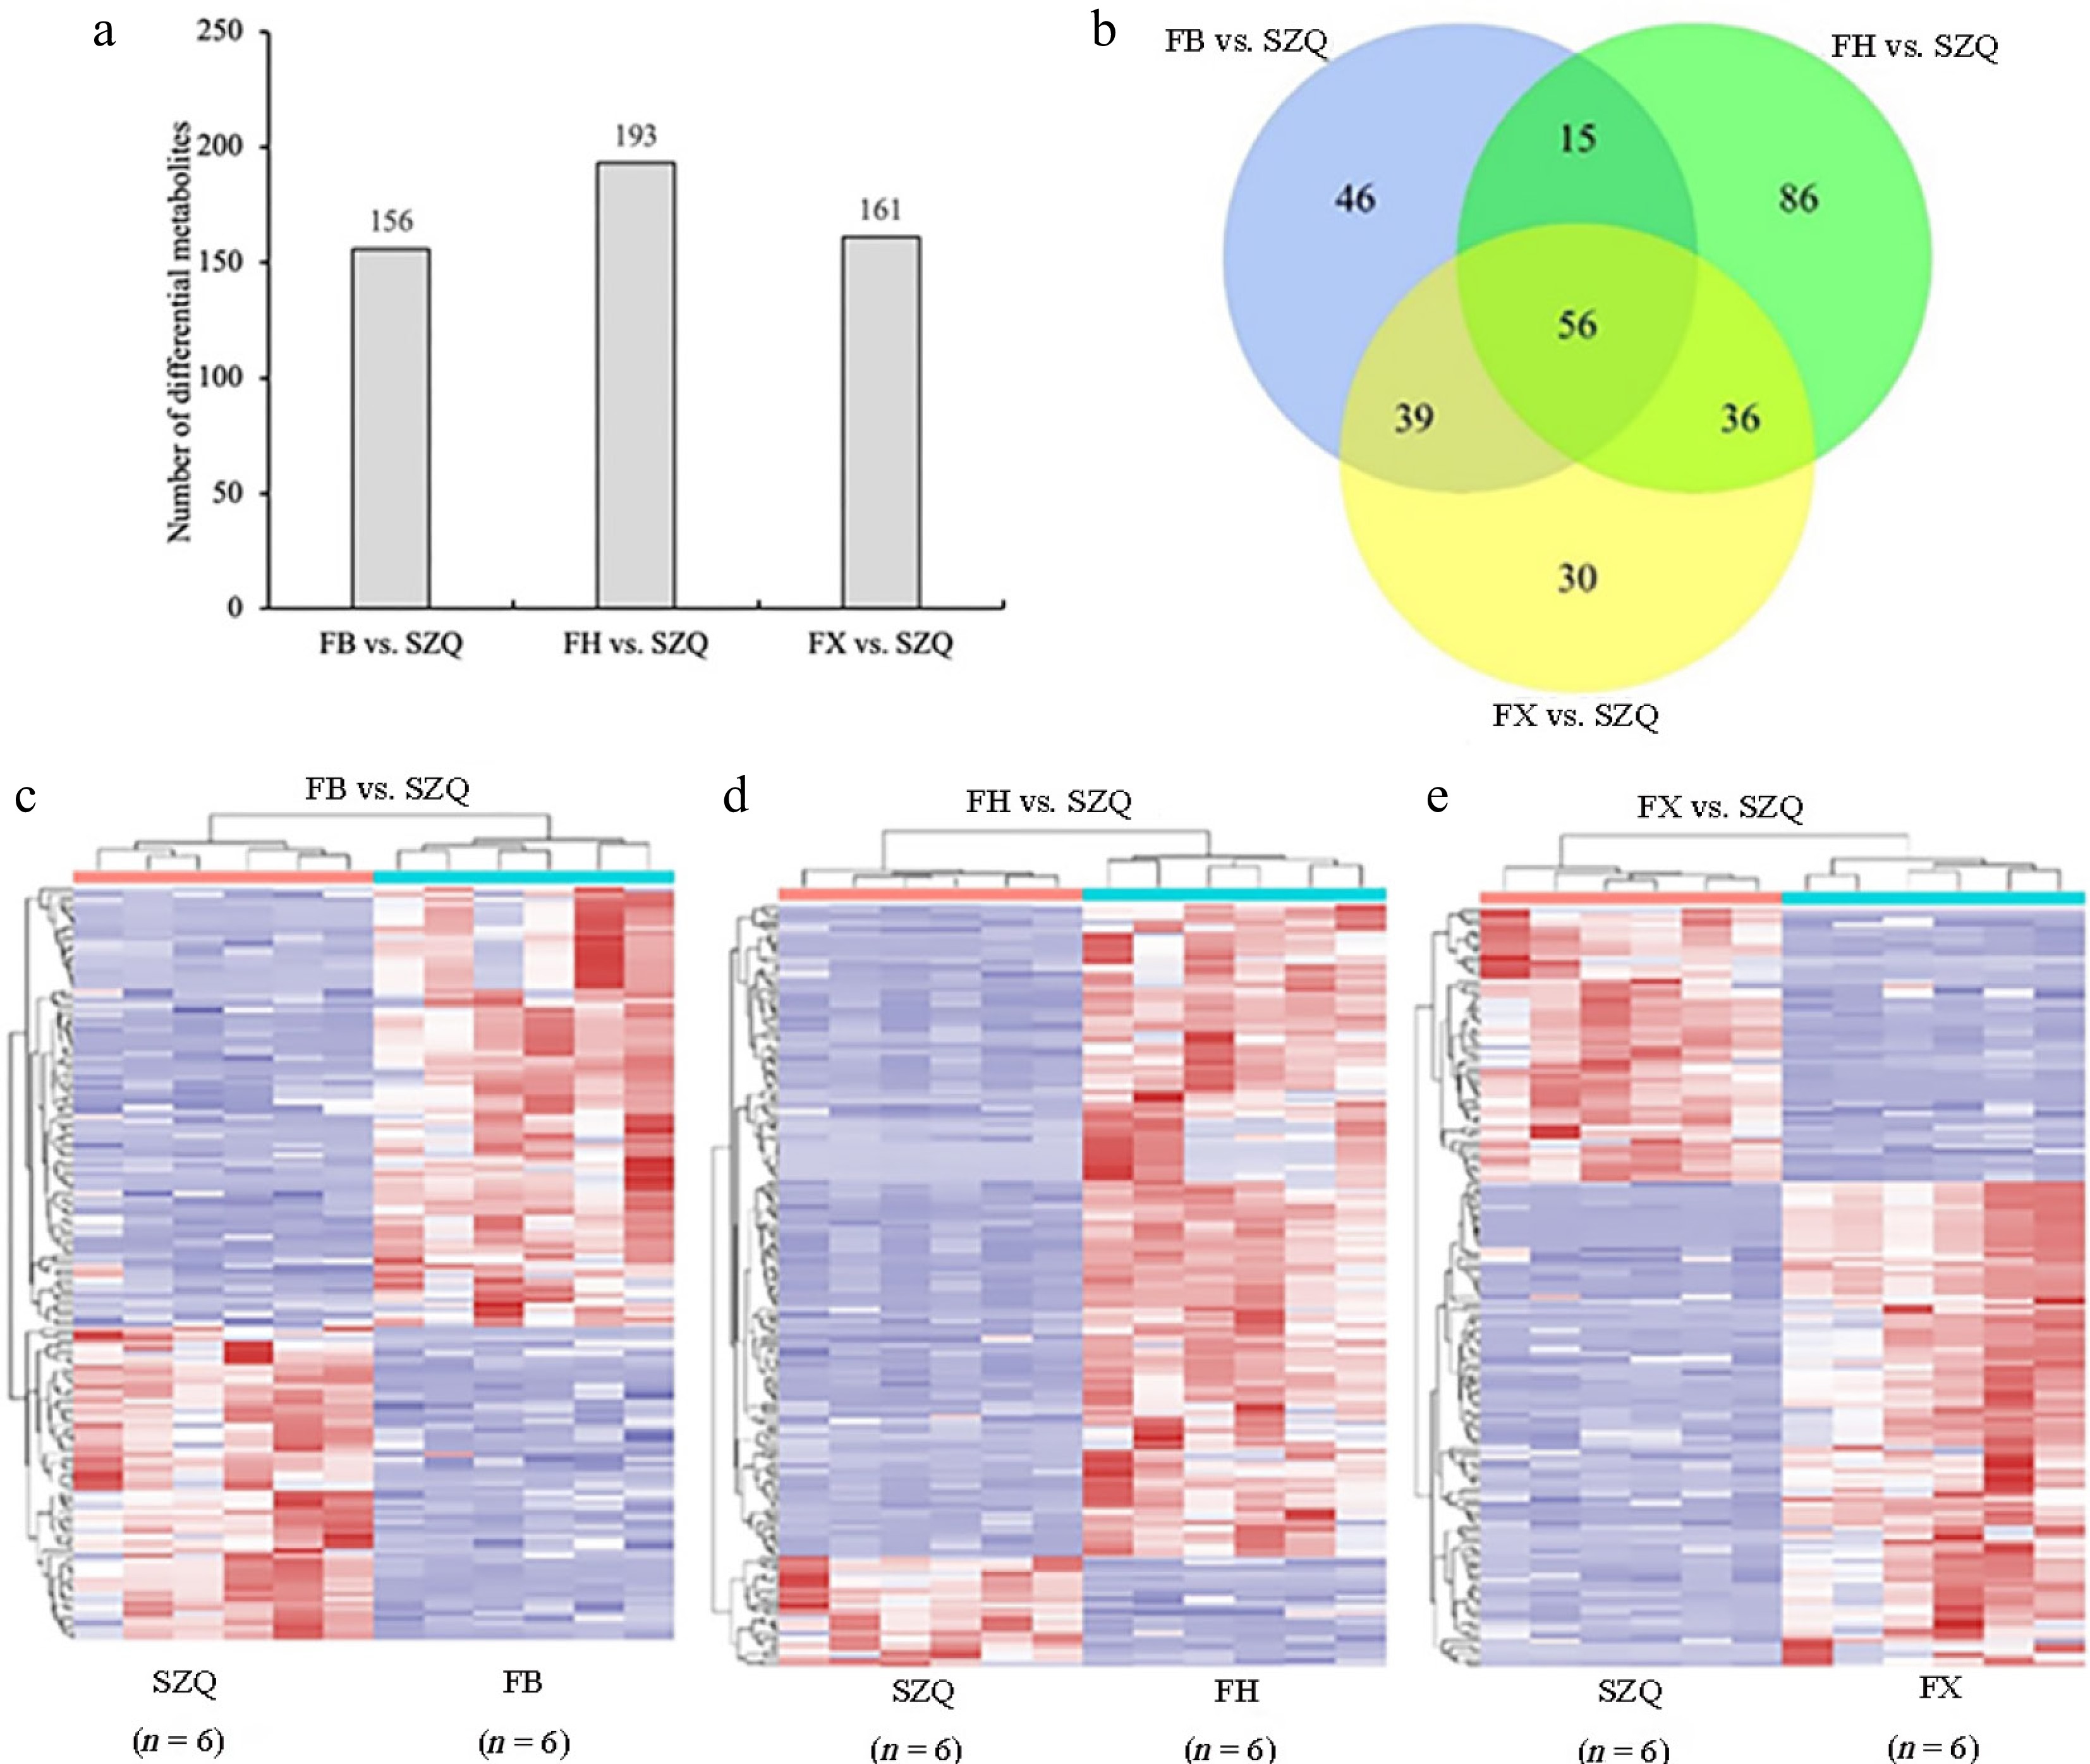
Figure 3.
Differential metabolites of FB vs. SZQ, FH vs. SZQ, and FX vs. SZQ. (a) The bar chart shows the number of differential metabolites among the cultivar comparison. (b) Venn diagram illustrating the overlap of differential volatile compounds among the comparison groups. (c) Heatmap of differential metabolites in FB vs. SZQ ( n = 6). (d) Heatmap of differential metabolites in FH vs. SZQ ( n = 6). (e) Heatmap of differential metabolites in FX vs. SZQ ( n = 6).
Chemical classification of these shared compounds showed that they comprised 15 aromatic hydrocarbons, eight alkenes, six alcohols, three lipids, five ketones, three nitriles, one terpene, 11 heterocyclic compounds, and nine other compounds ( Supplementary Table S1). Given that aromatic hydrocarbons and alkenes were the most abundant classes, they are proposed as major contributors to the characteristic aroma profiles of the FB, FH, and FX cultivars.
Analysis of differential metabolites
-
Differential metabolites were screened by combining multivariate and univariate analyses, with a variable importance in projection (VIP) ≥ 1 and a p ≤ 0.05 as selection criteria. From the 56 shared volatiles, 13 significant differential metabolites were identified, comprising one nitrile, one terpene, two alkenes, five aromatic hydrocarbons, one ester, one ketone, one alcohol, and one heterocyclic alkane ( Fig. 4, Supplementary Table S2). Notably, the relative abundances of these metabolites were significantly higher in cultivars FB, FH, and FX than in SZQ ( Fig. 4). For instance, the sesquiterpene caryophyllene was substantially more abundant in FB (24.26%), FH (41.77%), and FX (13.09%), compared to SZQ (0.44%). Similarly, the aromatic hydrocarbon benzene, (1-ethylpropyl)- exhibited a gradient of FX (2.29%) > FB (1.08%) > FH (1.02%) > SZQ (0.12%). These results indicate that nitriles, terpenoids, alkenes, and aromatic hydrocarbons are major contributors to the distinct aroma profiles of the XQC cultivars, with the 13 identified metabolites serving as key aroma determinants ( Fig. 4).
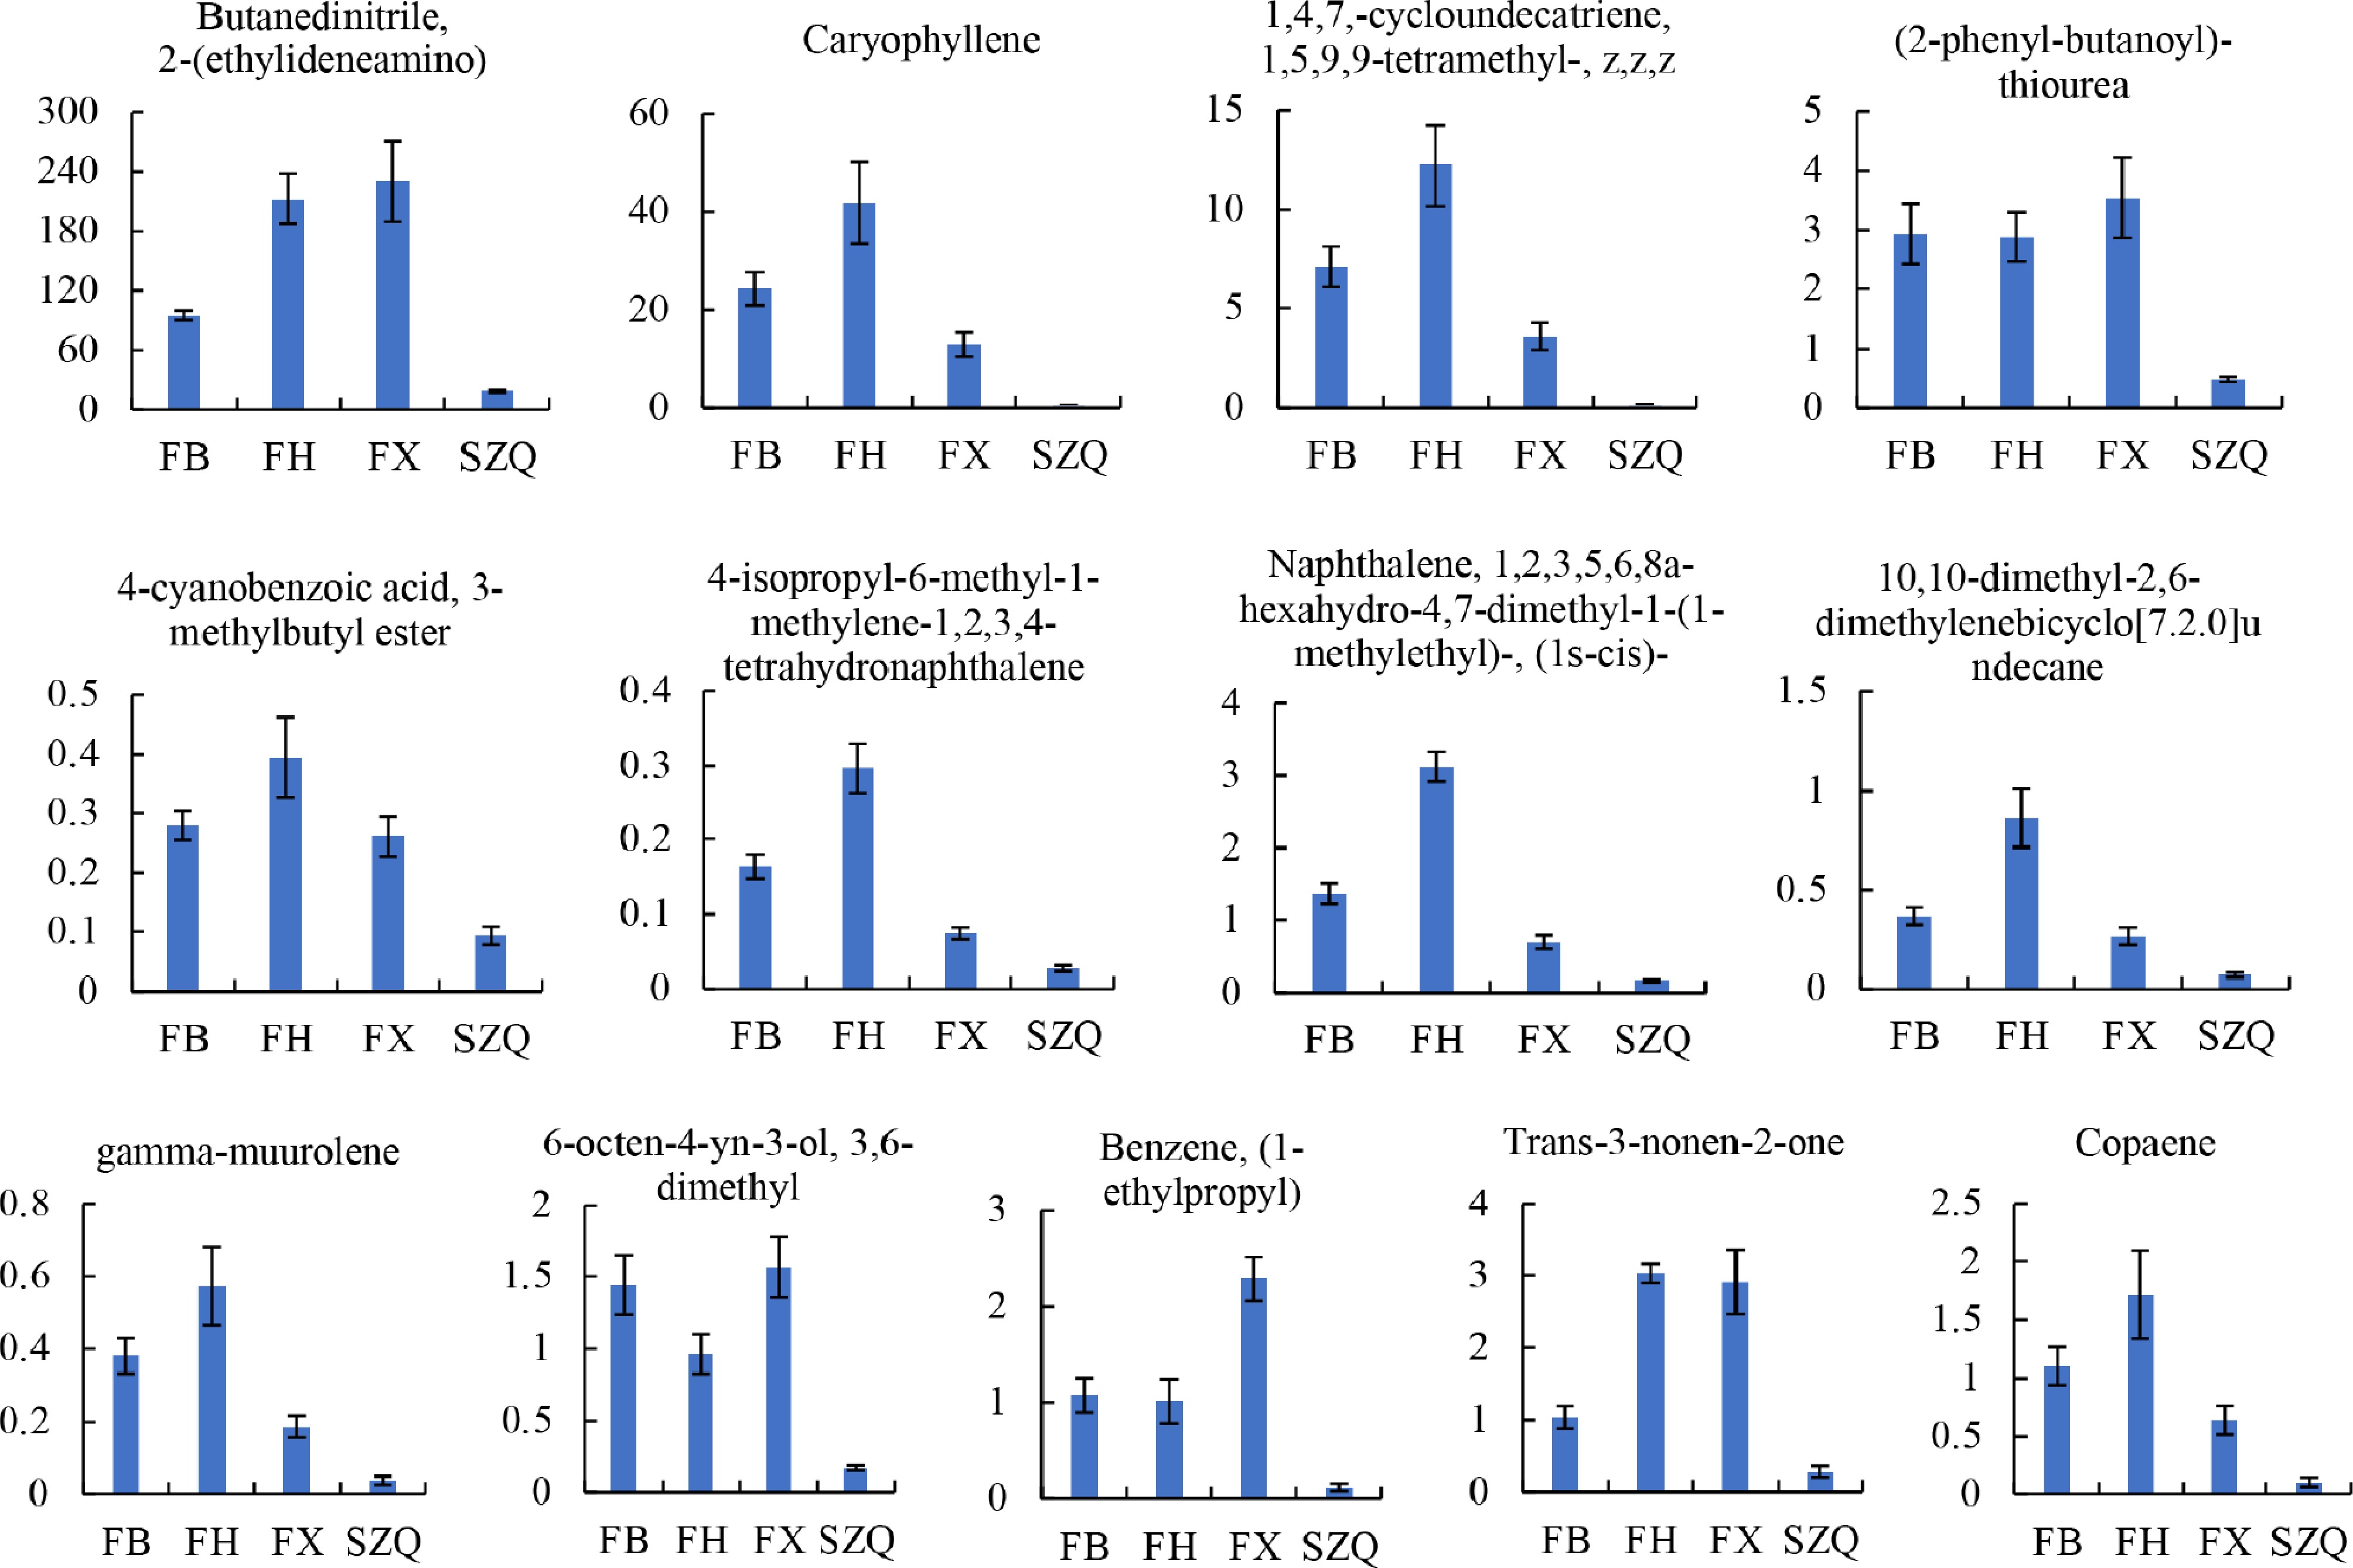
Figure 4.
The contents of 13 volatile compounds were identified as being significantly different in comparison with the SZQ cultivar. The Y-axis represents the expression level (abundance) of each differential metabolite. Values are presented as mean ± SE ( n = 6).
To further elucidate the functional implications of the differential volatiles, KEGG pathway enrichment analysis was performed on the metabolites identified from the FB vs. SZQ, FH vs. SZQ, and FX vs. SZQ comparisons. The analysis revealed that the enriched metabolites spanned several chemical classes, including alkenes, alcohols, ketones, benzenes, acids, monoterpenes, and aromatic heterocycles, indicating their involvement in diverse biosynthetic pathways.
In the FB vs. SZQ comparison, the up-regulated metabolites included thiophene, mesitylene, cyanuric acid, copaene, P-cymene, acetophenone, and caryophyllene, whereas sulfuric acid and benzaldehyde were down-regulated ( Fig. 5a). For FH vs. SZQ, 15 metabolites were enriched in KEGG pathways, nearly all of which were upregulated; phenethyl alcohol was the sole compound observed to be down-regulated ( Fig. 5b). In the FX vs. SZQ comparison, 10 metabolites were enriched, comprising two alkenes (caryophyllene and copaene), two alcohols (eucalyptol and phenylethyl alcohol), two ketones (acetophenone and isophorone), 1 benzene (mesitylene), one monoterpene (P-cymene), one acid (sulfuric acid), and one aromatic heterocyclic compound (thiophene). Among these, sulfuric acid and phenylethyl alcohol were downregulated ( Fig. 5c).
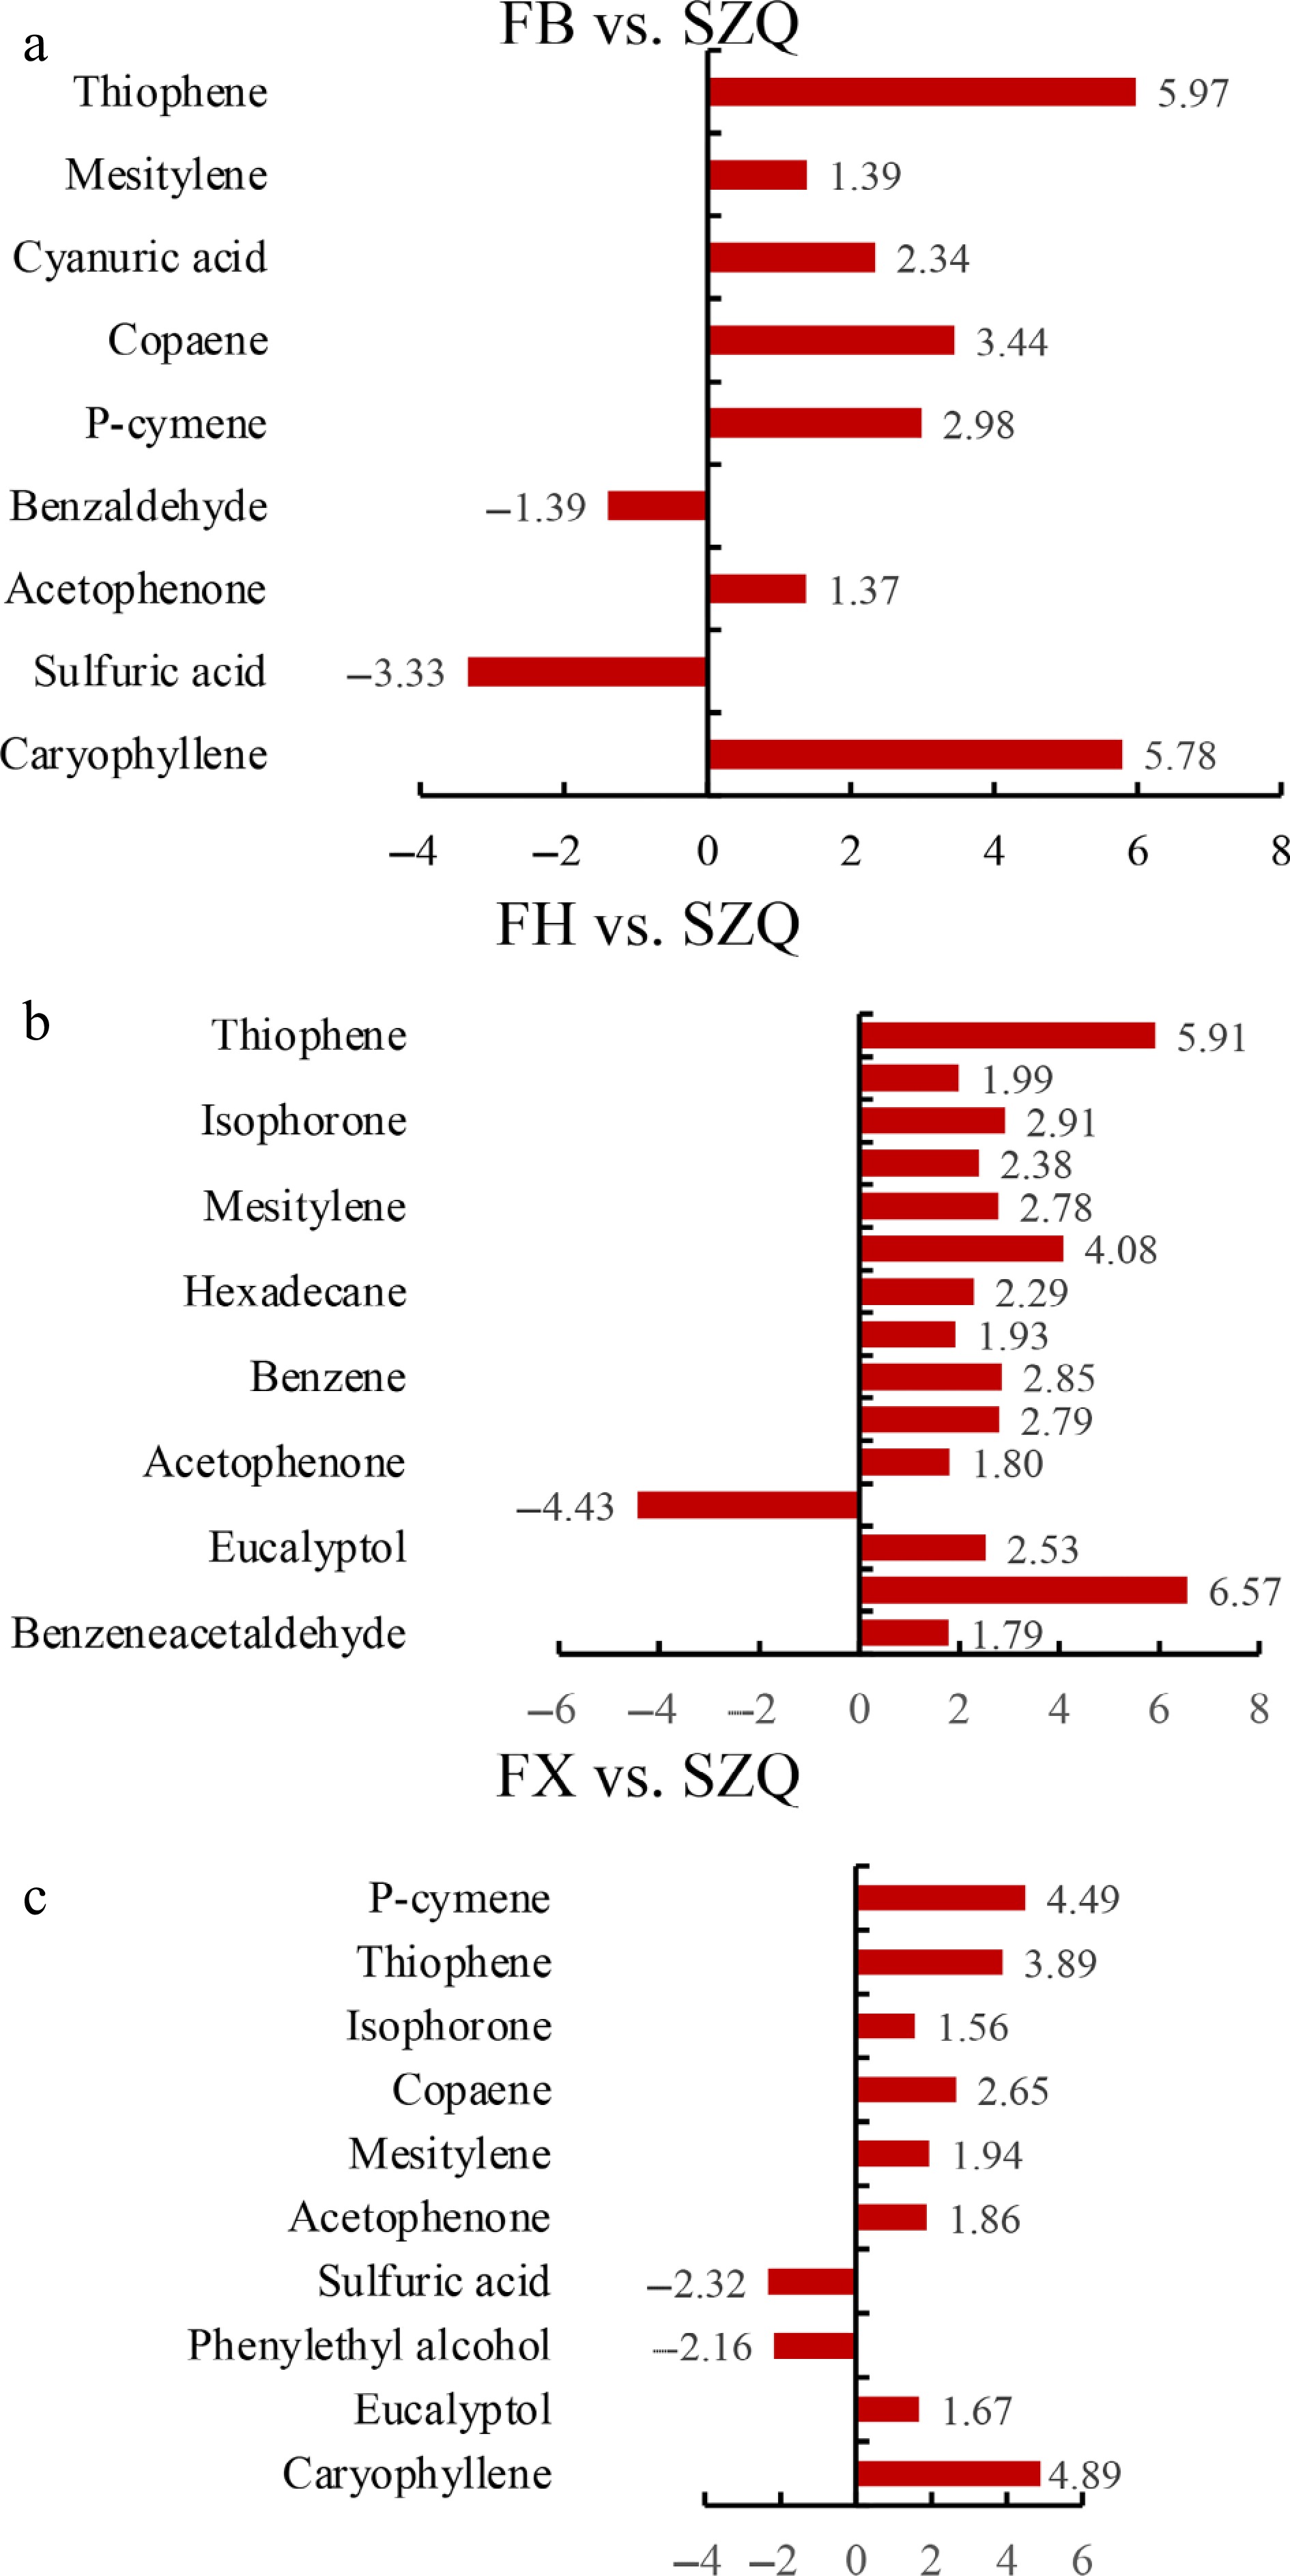
Figure 5.
Enrichment analysis of differential volatile metabolites. The horizontal bar charts display metabolites significantly enriched in (a) FB vs. SZQ, (b) FH vs. SZQ, and (c) FX vs. SZQ, with bar length representing the log 2 fold change (Log 2FC) value.
Identification of differentially expressed genes (DEGs), and the KEGG enrichment analysis of DEGs
-
In the comparison of FB vs. SZQ, 7,843 DEGs were identified, comprising 3,808 up-regulated, and 4,035 down-regulated genes. For FH vs. SZQ, 8,680 DEGs were found (4,387 up-regulated, and 4,293 down-regulated). The FX vs. SZQ comparison yielded the highest number, with 10,558 (5,485 up-regulated, and 5,073 down-regulated) ( Fig. 6a).
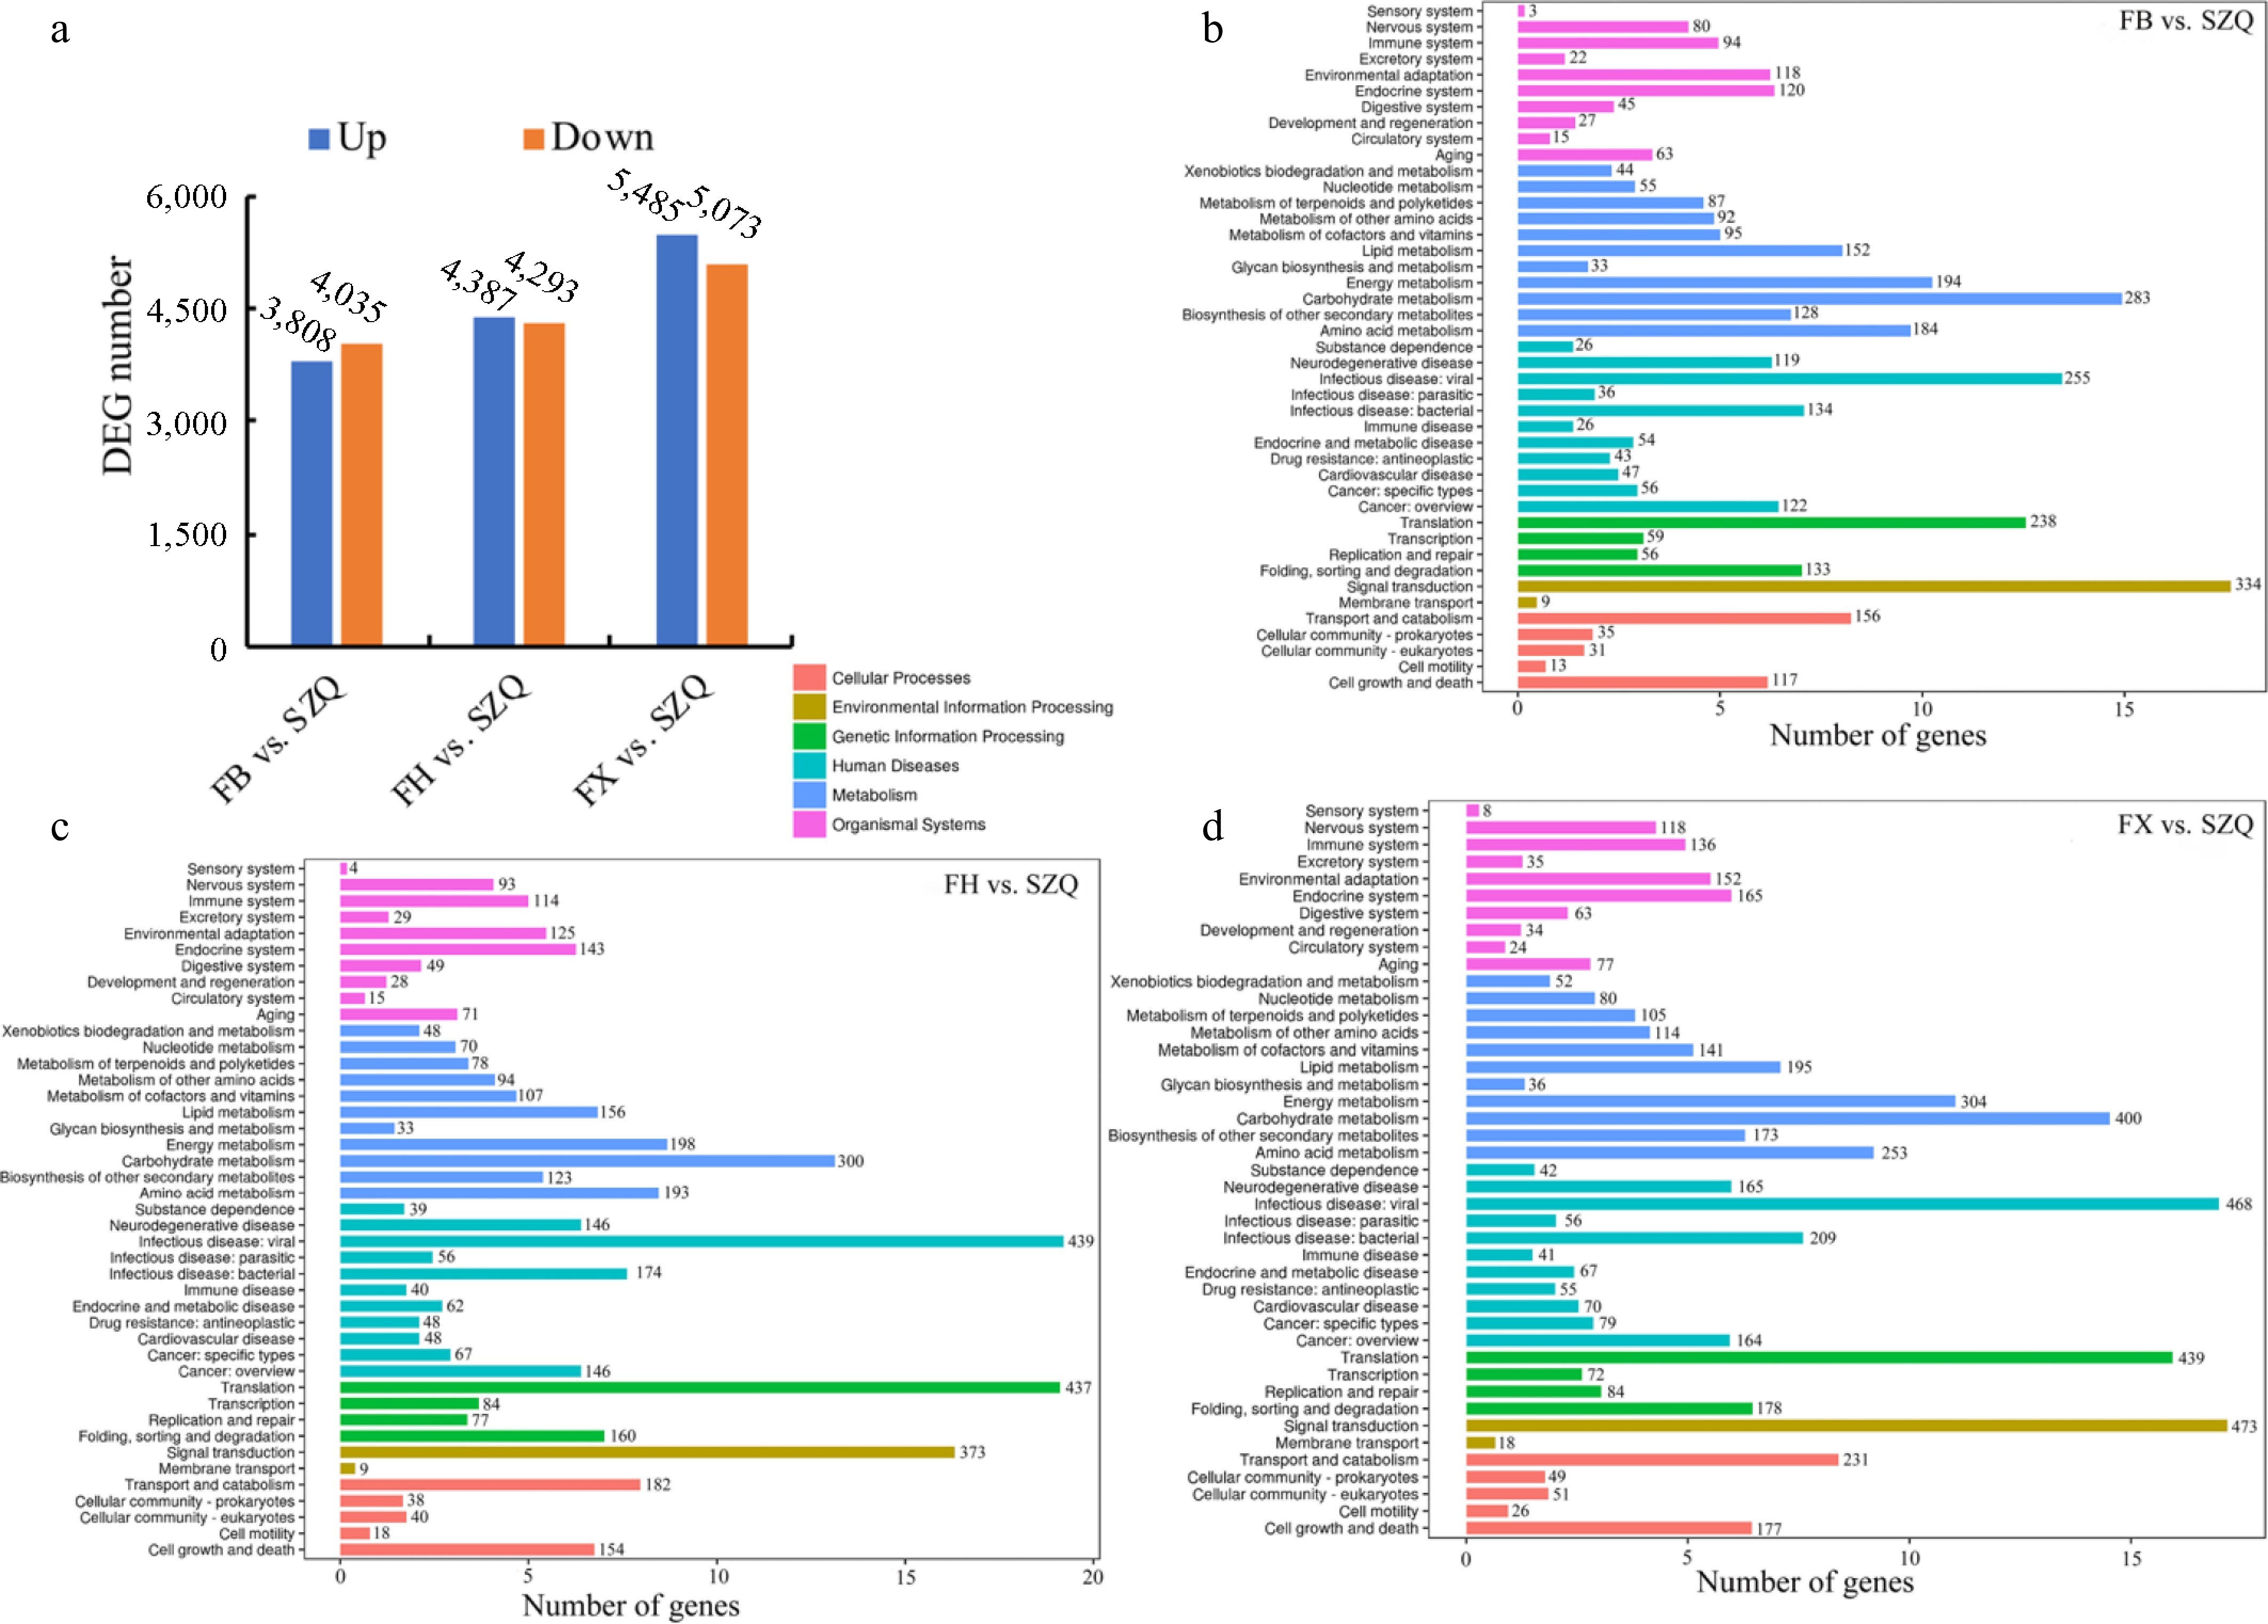
Figure 6.
(a) The number of up-regulated (blue), and down-regulated (orange) DEGs (adjusted p < 0.05 and |log 2FC| > 1) for the three indicated comparisons. (b) KEGG enrichment analysis of DEGs in FB vs. SZQ. (c) KEGG enrichment analysis of DEGs in FH vs. SZQ. (d) KEGG enrichment analysis of DEGs in FX vs. SZQ. The X-axis of B, C, and D represent the number of DEGs.
To identify the metabolic pathways associated with DEGs related to volatile metabolites, a KEGG enrichment analysis was conducted. DEGs from the three comparisons (FB, FH, and FX vs. SZQ) were significantly enriched in 17 distinct KEGG pathways. These pathways were categorized into six major classes, and subsequent analysis was focused on the 11 pathways directly involved in metabolism ( Fig. 6b− d).
Among these metabolic pathways, carbohydrate, energy, amino acid, and lipid metabolism exhibited the most significant enrichment of DEGs (|log 2FC| ≥ 1, FDR < 0.05; Fig. 7a). In the FB vs. SZQ comparison, DEGs accounted for 14.93%, 10.24%, 9.71%, and 8.02% of the genes assigned to these four pathways, respectively. Similar distributions were observed in the FH (13.13%, 8.67%, 8.45%, 6.83%), and FX (14.52%, 11.04%, 9.19%, 7.08%) comparisons. The marked enrichment of DEGs in these core metabolic pathways implies their pivotal role in the synthesis of secondary metabolites, which likely contributes to the distinct aroma profiles observed.
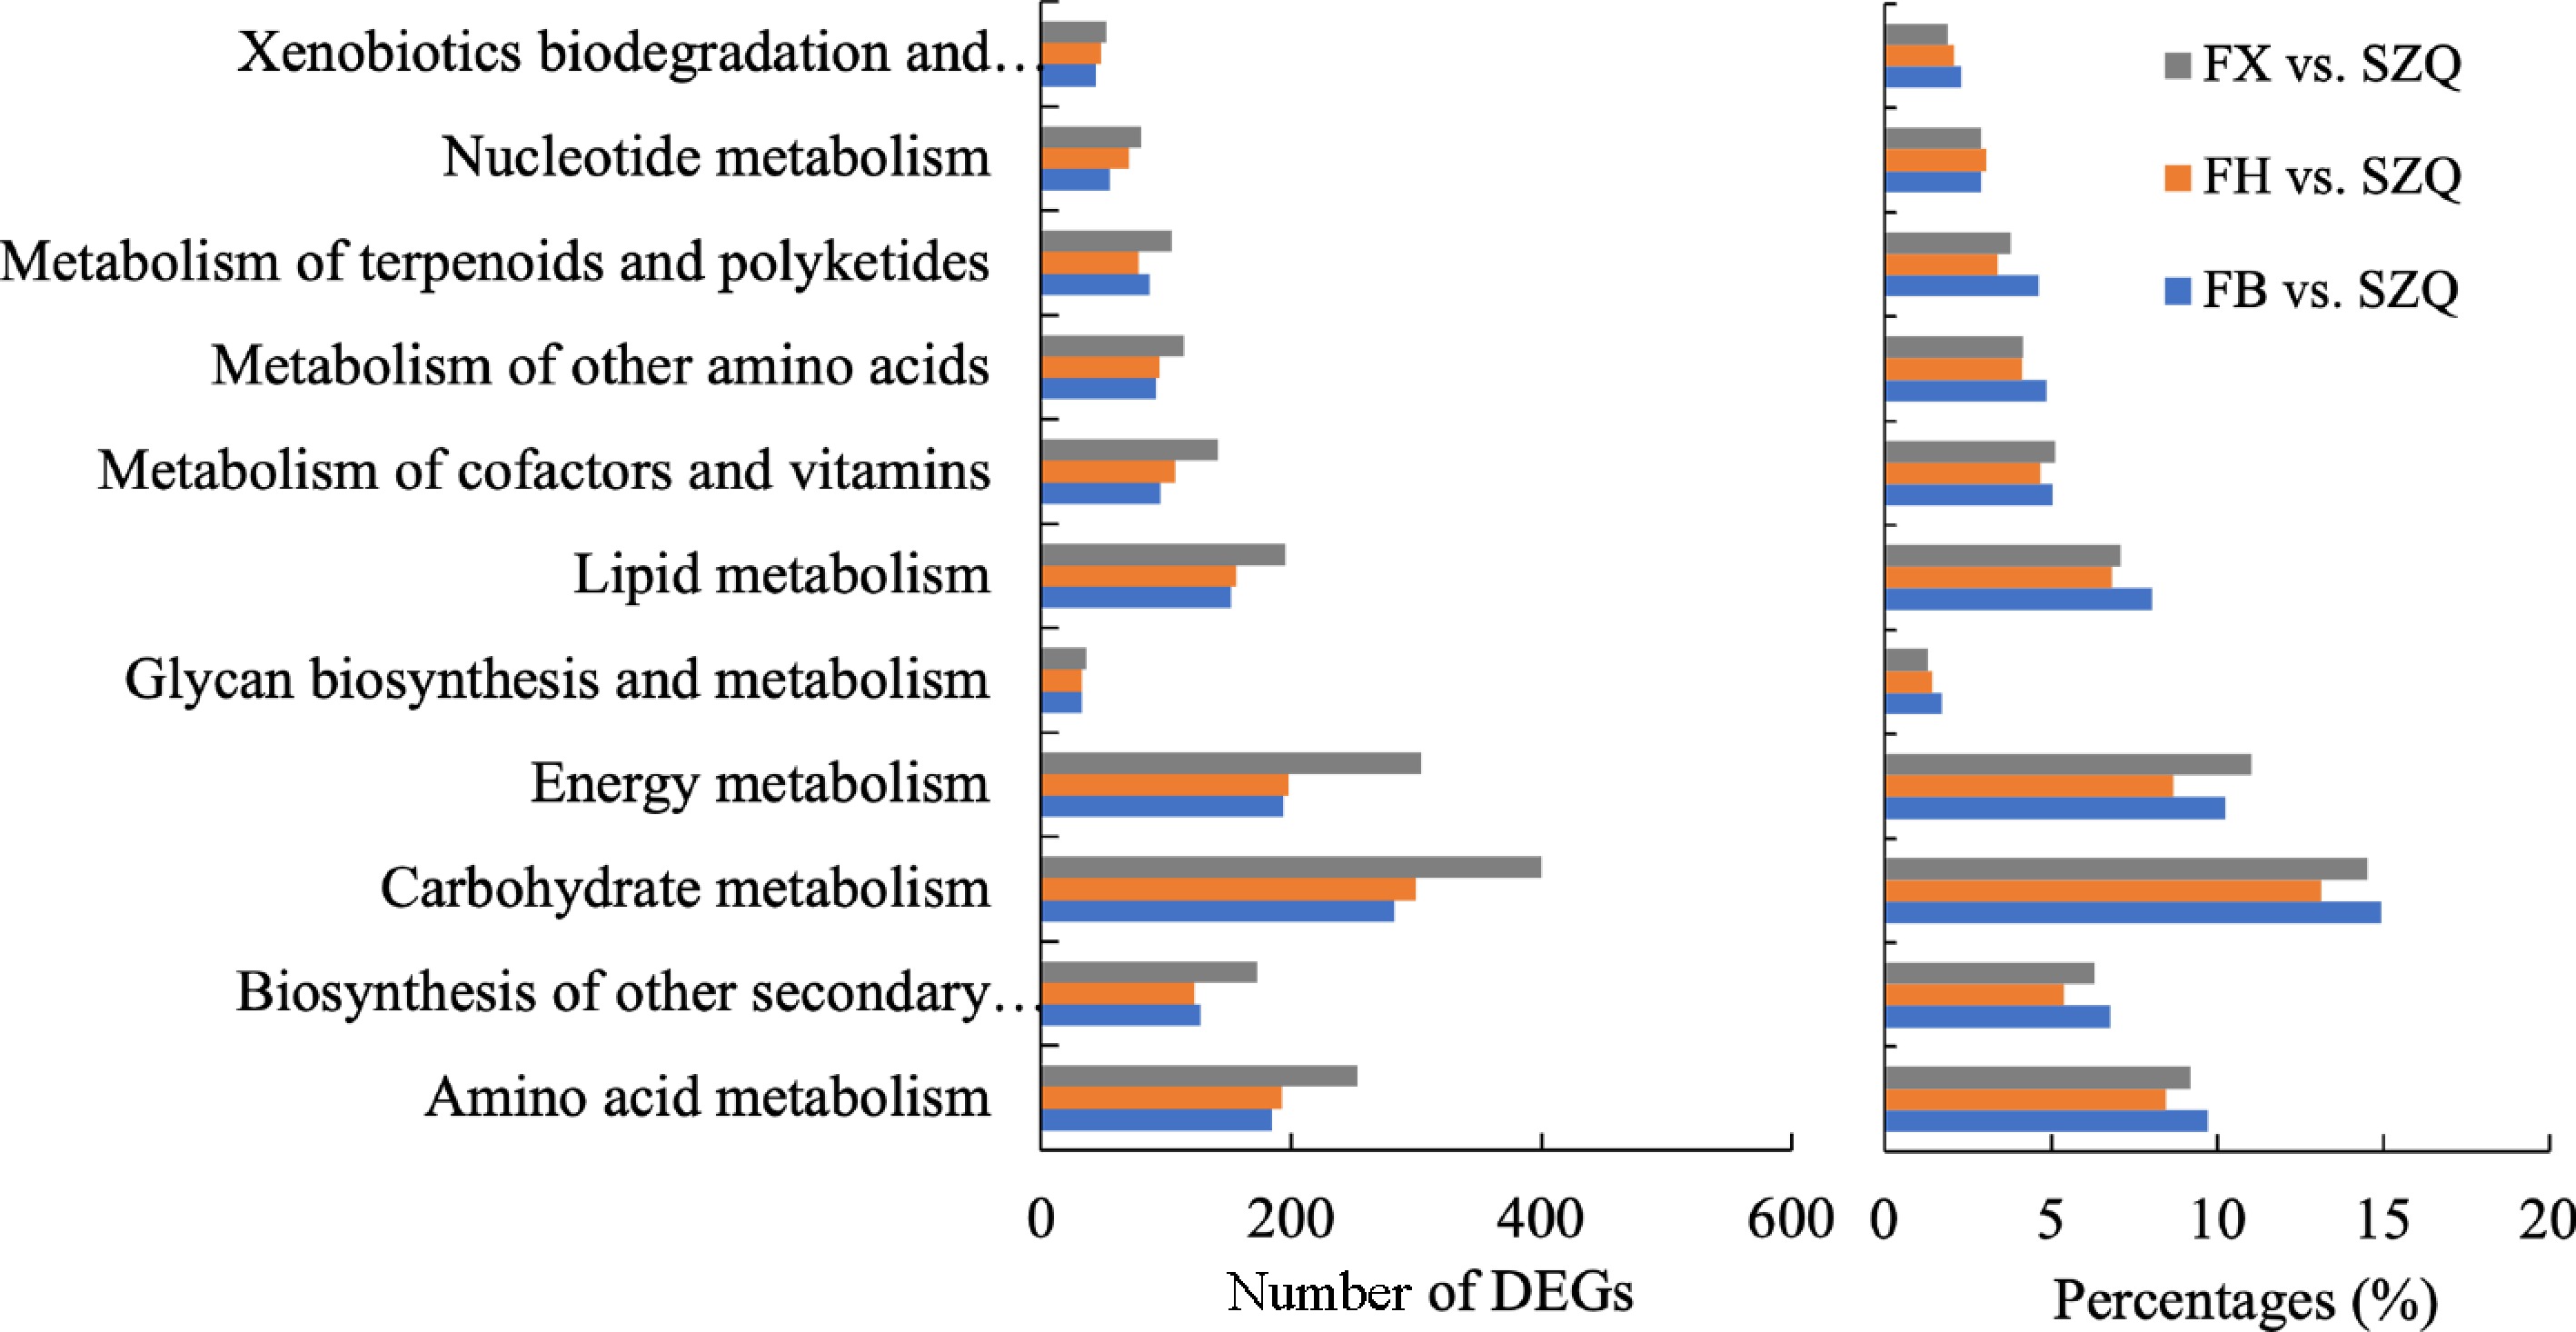
Figure 7.
The number of DEGs enriched in major KEGG metabolism pathways for the comparisons of FB vs. SZQ, FH vs. SZQ, and FX vs. SZQ
Analysis of DEGs expression patterns in key KEGG metabolic pathways
-
Further analysis identified several pathways that were uniquely enriched in specific comparisons. Sulfur metabolism (ko00920), cysteine, and methionine metabolism (ko00270) were uniquely significant in the FB vs. SZQ comparison ( Table 3). In the FX vs. SZQ comparison, eight pathways were uniquely enriched, including glyoxylate and dicarboxylate metabolism (ko00630), and linoleic acid metabolism (ko00591) ( Table 3). These distinct metabolic features may underlie the specific aromatic differences between SZQ and the other cultivars.
Table 3. Uniquely and significantly enriched KEGG pathways in each comparison.
Comparisons KEGG ID Term q-value Enrichment FB vs. SZQ ko00920 Sulfur metabolism 1.09E-04 2.25 ko00270 Cysteine and methionine metabolism 5.02E-03 1.58 FX vs. SZQ ko00591 Linoleic acid metabolism 6.03E-03 2.32 ko00250 Alanine, aspartate and glutamate metabolism 3.47E-02 1.49 ko00750 Vitamin B6 metabolism 3.21E-02 1.99 ko00630 Glyoxylate and dicarboxylate metabolism 1.30E-03 1.55 Comparative analysis with SZQ revealed 13 upregulated and 12 downregulated DEGs shared among FB, FH, and FX. The upregulated genes were primarily clustered in the first three branches of the phylogenetic tree, whereas the downregulated genes were concentrated in the fourth branch. Notably, BraC03g035060 and BraC06g036810 were significantly downregulated across all three cultivars. Additionally, BraC04g002800 and BraC04g002360 showed exclusive downregulated in FB ( Fig. 8a).
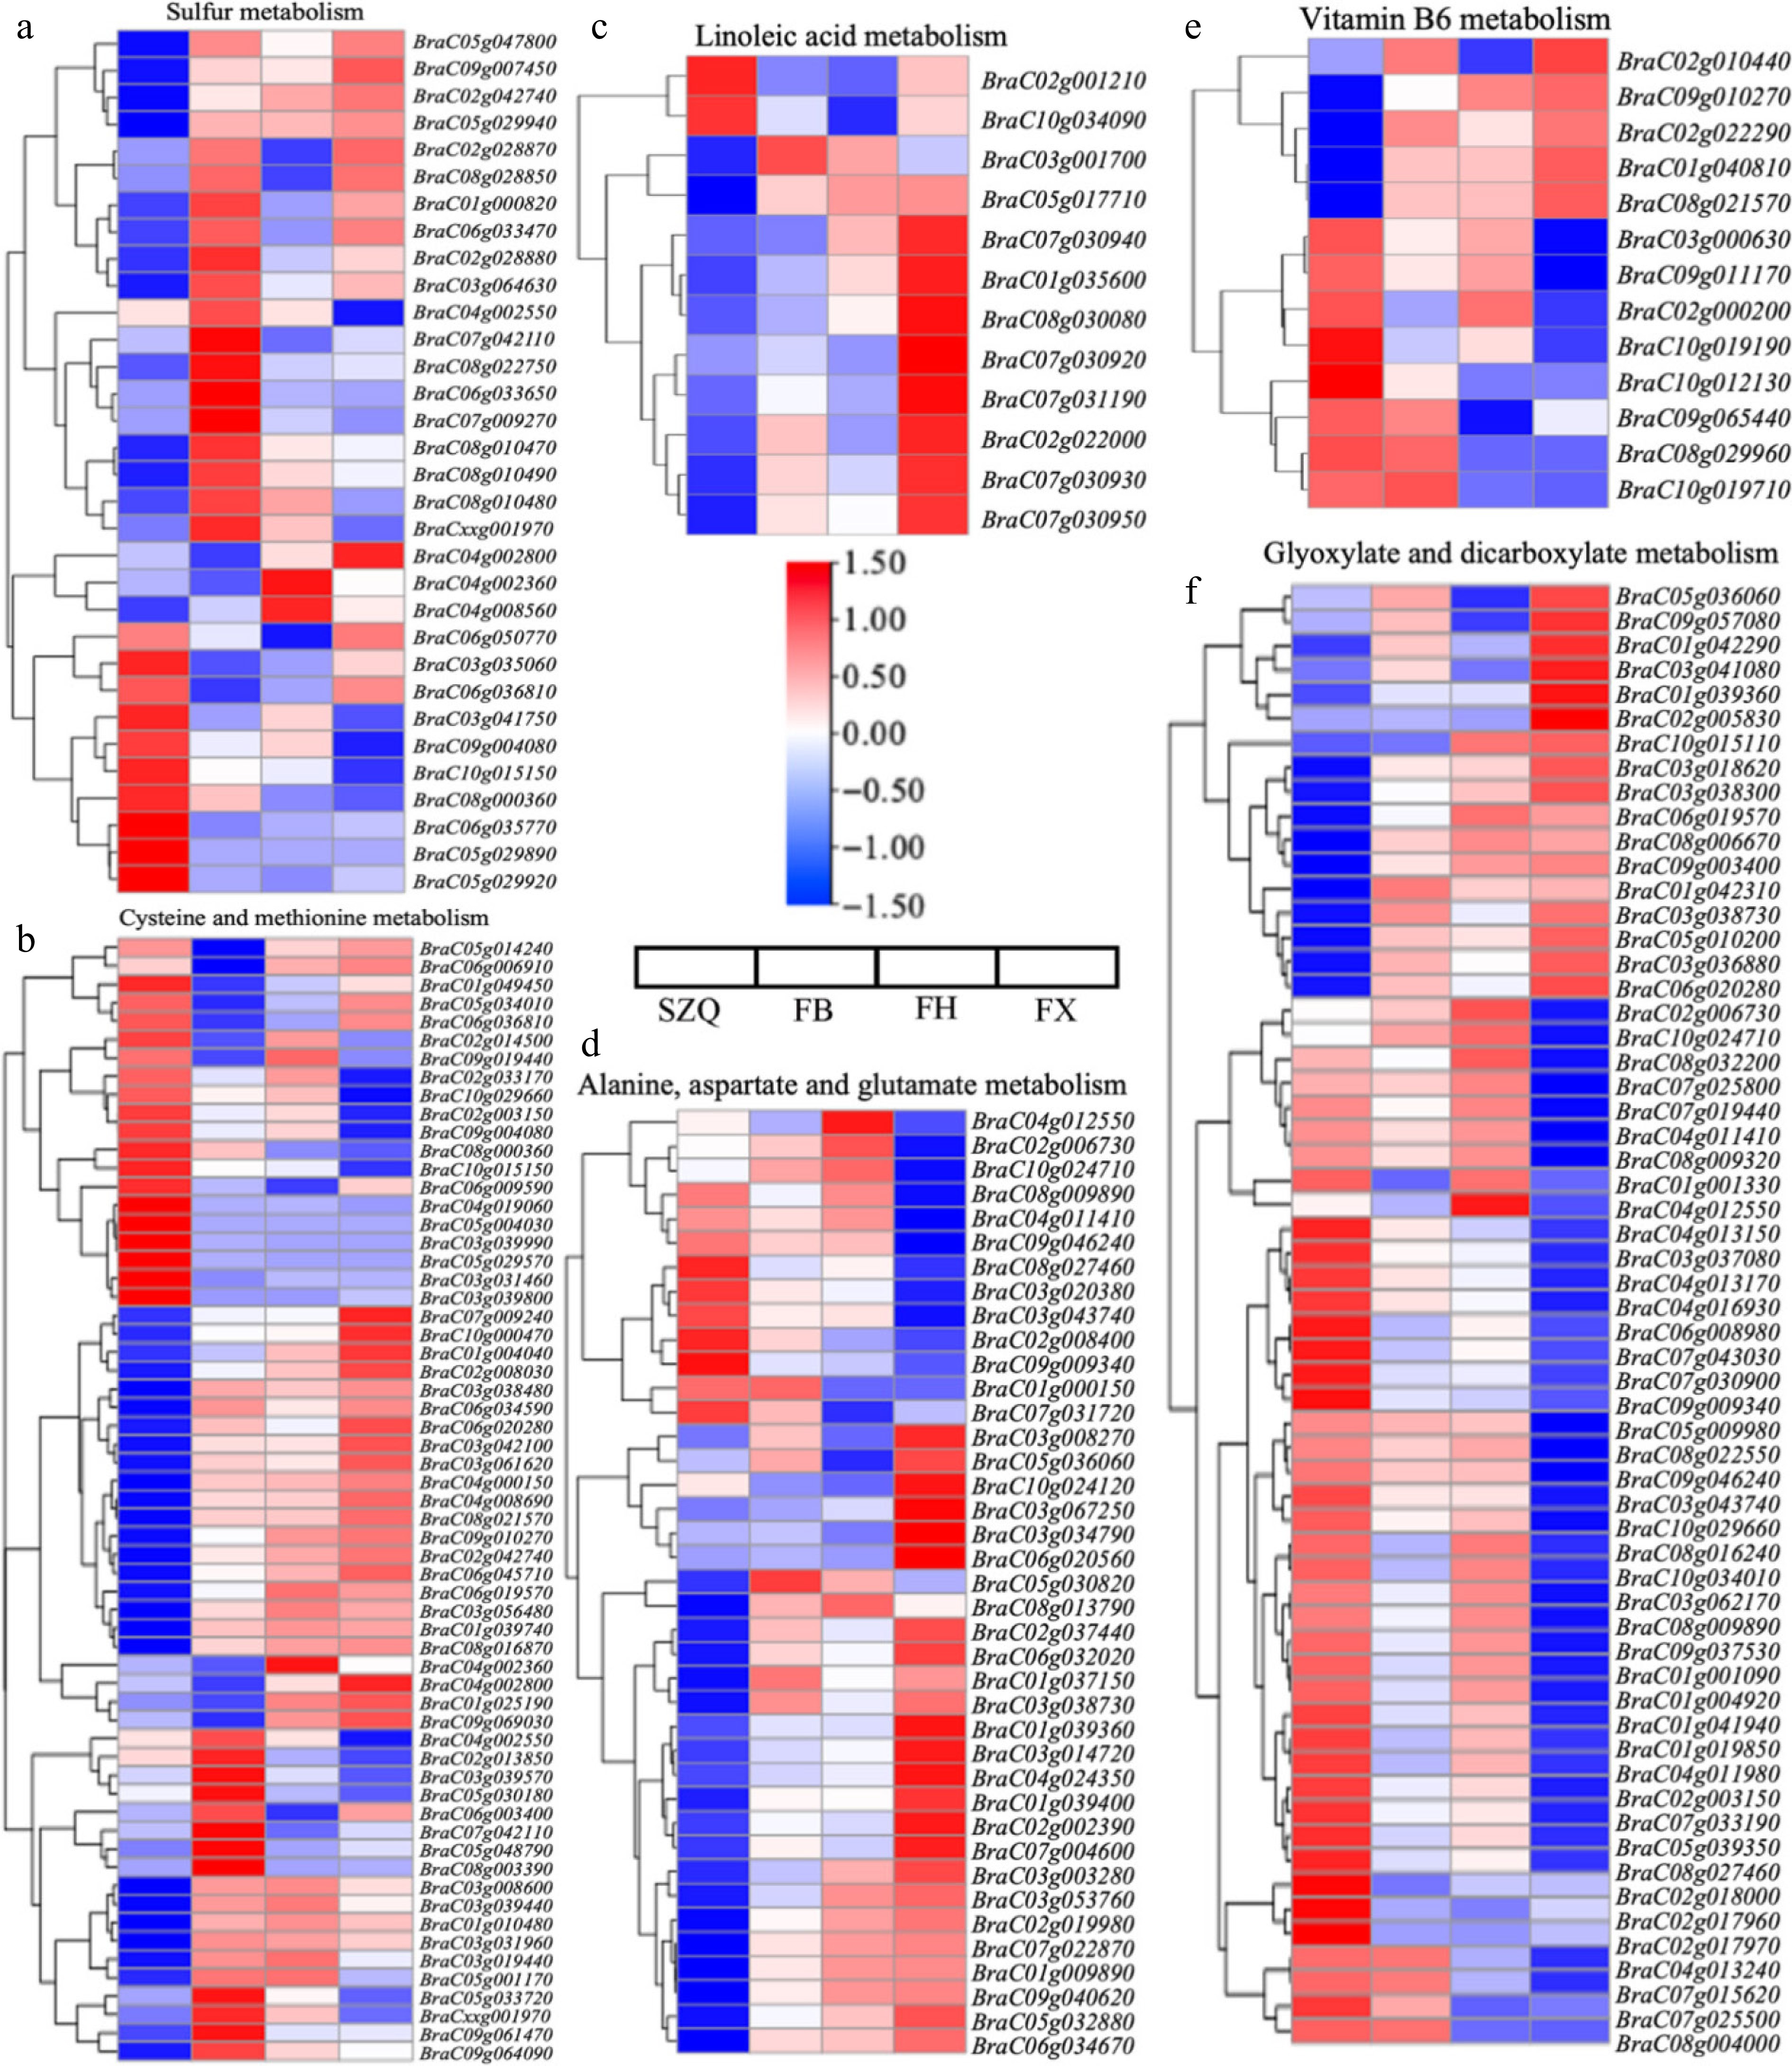
Figure 8.
Expression patterns of DEGs enriched in key KEGG metabolic pathways. (a) Sulfur metabolism (ko00920), (b) cysteine and methionine metabolism (ko00270), (c) linoleic acid metabolism (ko00591), (d) alanine, aspartate, and glutamate metabolism (ko00250), (e) vitamin B6 metabolism (ko00750), and (f) glyoxylate and dicarboxylate metabolism (ko00630). Heatmaps display the gene expression patterns (log 2 fold change) of significantly enriched DEGs in each pathway for the three comparisons (FB, FH, and FX vs. SZQ). Rows represent individual gene, columns represent sample groups. The color scale indicates up-regulated (red), and down-regulated (blue) genes relative to the control (SZQ).
In the cysteine and methionine metabolism pathway (ko00270), 12 genes were significantly upregulated, including two genes ( BraC05g030180 and BraC02g013850) uniquely upregulated in FB. Among the 24 down-regulated genes, seven showed significant suppression in FB, while five genes ( BraC04g002360, BraC04g002800, BraC01g025190, BraC09g069030, and BraC06g006910) were exclusively down-regulated in this cultivar ( Fig. 8b).
The linoleic acid metabolism pathway (ko00591) showed two significantly down-regulated genes ( BraC02g001210 and BraC10g034090), and ten up-regulated genes in FB, FH, and FX, compared to SZQ ( Fig. 8c).
As shown in Fig. 8d, phylogenetic analysis revealed two distinct expression patterns: one gene cluster showed significantly down-regulation in FX, while another cluster was significantly up-regulated across all three test cultivars (FB, FH, and FX) compared to SZQ.
In Vitamin B6 metabolism (ko00750), five genes ( BraC02g010440, BraC09g010270, BraC02g022290, BraC01g040810, and BraC08g021570) were significantly upregulated in FB, FH, and FX. One gene was down-regulated especially in FH, while eight genes showed exclusive down-regulated in FX. Additionally, eight genes were commonly downregulated across all three cultivars ( Fig. 8e).
In glyoxylate and dicarboxylate metabolism (ko00630) ( Fig. 8f), two contrasting expression patterns were observed: one gene cluster showed significant upregulation in FB, FH, and FX, while another cluster was consistently downregulated across all three cultivars compared to SZQ.
Integrated analysis identifies key genes and metabolites in aroma formation
-
Integrated in Table 4 are the KEGG enrichment results from the differentially abundant metabolites with those from their corresponding DEGs. Comparative analysis of FB, FH, and FX against SZQ based on KEGG pathway enrichment of differential metabolites revealed eight significantly enriched pathways. Among these, ath00909 was common to all three comparison groups (FB vs. SZQ, FH vs. SZQ, and FX vs. SZQ). Pathways ath00920, ath00261, ath00270, ath02010, and ath00230 were shared between FB vs. SZQ and FX vs. SZQ, whereas ath00360 and ath00902 were common to FH vs. SZQ and FX vs. SZQ. Analysis identified five key differential metabolites consistently present across the three groups. Among these, β-Caryophyllene, phenylacetaldehyde, and 1,8-cineole were upregulated, while sulfate and phenylethyl alcohol were down-regulated. Notably, sulfate was downregulated in multiple metabolic pathways. Integrated analysis of the KEGG enrichment results from both metabolites and DEGs showed that β-caryophyllene biosynthesis involved six regulatory genes in FB vs. SZQ, and 12 genes in FX vs. SZQ. Additionally, nine genes were implicated in the regulation of phenylacetaldehyde and phenylethyl alcohol in FH vs. SZQ.
Table 4. The DEGs involved in differential metabolites synthesis among the three comparisons.
Group ID annotation of metabolites Upregulated metabolites Downregulated metabolites ID of KEGG pathways DEGs FB vs. SZQ ath00230 Purine metabolism – Sulfate ko00230 BraC01g023360; BraC03g041750; BraC05g029890; BraC05g029920; BraC05g029940; BraC06g015080; BraC06g050770; BraC08g028850; ath00261 Monobactam biosynthesis – Sulfate ko00261 BraC01g023360; BraC03g041750; BraC05g029890; BraC05g029920; BraC05g029940; BraC06g015080; BraC06g050770; BraC08g028850 ath00270 Cysteine and methionine metabolism – Sulfate ko00270 – ath00909 Sesquiterpenoid and triterpenoid biosynthesis β-Caryophyllene – ko00909 BraC03g066260; BraC03g066350; BraC03g066530; BraC06g037780; BraC06g037940; BraCxxg006940 ath00920 Sulfur metabolism – Sulfate (sulfuric acid) ko00920 – ath02010 ABC transporters – – ko02010 – FH vs. SZQ ath00360 Phenylalanine metabolism Phenylacetaldehyde Phenylethyl alcohol ko00360 BraC01g022890; BraC02g029200; BraC03g022690; BraC03g067150; BraC03g067240; BraC04g032090; BraC07g010000; BraC08g010680; BraC08g010700 ath00902 Monoterpenoid biosynthesis 1,8-Cineole – ko00902 – ath00909 Sesquiterpenoid and triterpenoid biosynthesis β-Caryophyllene – ko00909 BraC03g066260; BraC03g066350; BraC03g066530; BraC06g037780; BraC06g037940; BraCxxg006940; FX vs. SZQ ath00230 Purine metabolism – Sulfate ko00230 BraC01g023360; BraC03g041750; BraC05g029890; BraC05g029920; BraC05g029940; BraC06g015080; BraC06g050770; BraC08g028850; ath00261 Monobactam biosynthesis – Sulfate ko00261 BraC01g023360; BraC03g041750; BraC05g029890; BraC05g029920; BraC05g029940; BraC06g015080; BraC06g050770; BraC08g028850 ath00270 Cysteine and methionine metabolism – Sulfate ko00270 – ath00360 Phenylalanine metabolism – Phenylethyl alcohol ko00360 BraC01g022890; BraC02g029200; BraC03g022690; BraC03g067150; BraC03g067240; BraC04g032090; BraC07g010000; BraC08g010680; BraC08g010700 ath00902 Monoterpenoid biosynthesis 1,8-Cineole – ko00902 – ath00909 Sesquiterpenoid and triterpenoid biosynthesis β-Caryophyllene – ko00909 BraC03g066260; BraC03g066350; BraC03g066530; BraC06g037780; BraC06g037940; BraCxxg006940; ath00920 Sulfur metabolism – Sulfate (extracellular) ko00920 BraC01g023360; BraC03g041750; BraC05g029890; BraC05g029920; BraC05g029940; BraC06g015080; BraC06g050770; BraC08g028850 ath02010 ABC transporters – Sulfate ko02010 – These results highlight β-caryophyllene, sulfate, phenylacetaldehyde, and 1,8-cineole as potentially critical volatile aromatic compounds in NHCC. The downregulation of sulfate across multiple pathways (purine metabolism, monobactam biosynthesis, cysteine, and methionine metabolism, sulfur metabolism, and ABC transporters) was particularly notable, and several DEGs associated with sulfate-related pathways were identified ( Table 4).
-
Xiangqingcai (XQC, Brassica chinensis L.) is a distinctive aromatic cultivar within the Brassica genus, characterized by a pronounced volatile organic compound profile that differentiates it from other non-aromatic subspecies. Aroma is a critical quality attribute in Brassica chinensis, with prior studies establishing that terpenoids constitute the primary aromatic components in these vegetables [ 10, 21] . Consistent with findings in related Brassica species, such as cabbage, brussels sprouts, kohlrabi, and broccoli, where sulfur compounds dominate the volatile profile [ 6, 7, 30− 33] , the present analysis identified a complex blend of aroma-active compounds in XQC cultivars. Using HS-SPME-GC-MS, 56 volatile compounds were detected across the FB, FH, and FX, cultivars compared to SZQ. KEGG enrichment analysis further classified these metabolites into several chemical classes, including olefins, alcohols, ketones, benzene, acids, monoterpenes, and aromatic heterocycles ( Fig. 5). These results not only align with previous reports emphasizing the importance of sulfur-containing compounds in Brassica aroma, but also expand the understanding of the metabolic diversity underlying the unique fragrance of XQC.
Integrating metabolomic and transcriptomic analyses provides a powerful approach for elucidating the biochemical and genetic basis of plant traits. While metabolomics identifies the types and abundance of aromatic compounds, combining it with transcriptomics enables the identification of genes encoding these metabolites. This integrated strategy has been widely applied to study diverse physiological processes in vegetables, including vernalization and disease resistance [ 34− 37] . Building on the completed genome sequence of Chinese cabbage [ 21, 38] , the focus was on the KEGG enrichment results of DEGs from three comparisons (FB, FH, and FX vs. SZQ), revealing 11 metabolism-related pathways ( Fig. 6). This finding is consistent with prior research on broccoli, which also reported enrichment in pathways such as glycolysis, pyruvate metabolism, fatty acid metabolism, and aromatic amino acid metabolism for aroma-related transcripts [ 39] .
Beyond confirming previously implicated pathways, the present analysis newly highlighted the involvement of sulfate across multiple metabolic processes, including purine metabolism, cysteine and methionine metabolism, monobactam biosynthesis, and sulfur metabolism. This suggests that sulfur compounds are a major aroma source in the studied XQC cultivars, corroborating findings in kale and broccoli regarding the importance of glucosinolates and sulfur-containing compounds [ 33, 40− 43] . Specific genes were further identified (e.g., BraC01g023360, BraC08g028850) potentially involved in these sulfur-related pathways. Functional annotation indicates that BraC01g023360 encodes a chloroplast ATP-sulfurylase 3, while BraC08g028850 encodes an ATP sulfurylase 2-like protein, linking both genes are involved in the initial step of sulfate activation in sulfur assimilation. ATP sulfurylase (ATPS) catalyzes the entry of sulfate into the reductive assimilation pathway, controlling the synthesis of key sulfur-containing precursors such as cysteine and glutathione (GSH) [ 44, 45] . The expression and activity of ATP sulfurylase (ATPS) are responsive to diverse environmental stimuli. For instance, in mustard ( B. juncea), its activity is enhanced by salicylic acid under salt stress, thereby promoting GSH synthesis [ 46] . Likewise, in Chinese cabbage, ATPS transcript levels rise under zinc stress, facilitating the production of sulfur-based defense compounds [ 47] . Therefore, as ATPS isoforms, BraC01g023360 and BraC08g028850 are likely to act as key regulatory nodes that modulate sulfur allocation between primary metabolism, and the biosynthesis of specialized volatile sulfur compounds that contribute to aroma in XQC cultivars. The precise functional roles and regulatory mechanisms of these two genes in aroma formation, however, await further investigation.
Additionally, DEGs involved in sesquiterpenoid and triterpenoid biosynthesis were identified (e.g., BraC03g066260, BraC03g066350, BraC03g066530, BraC06g037780, BraC06g037940, and BraCxxg006940), aligning with reports of caryophyllene synthase genes highly expressed in aromatic cultivars [ 48] . Key aromatic volatiles such as β-caryophyllene, phenylacetaldehyde, and 1,8-cineole, along with their encoding DEGs, were also pinpointed. In summary, sulfate, β-caryophyllene, phenylacetaldehyde, and 1,8-cineole are likely the primary contributors to the characteristic aroma of these XQC cultivars, with the present integrated analysis providing novel genetic insights to their biosynthesis. To fully understand the role of these candidate genes, more comprehensive studies are needed to delineate the molecular mechanisms underlying these candidates.
-
In summary, this study demonstrates that volatile organic compounds (VOCs) are key indicators of flavor quality in NHCC. The aroma profile was successfully characterized and the biosynthetic mechanisms of VOCs were uncovered, providing a scientific basis for flavor-oriented breeding. The combined application of HS-SPME-GC-MS and RNA-seq enabled the identification of four key volatile components (sulfides, β-caryophyllene, phenylacetaldehyde, and 1,8-cineole) that are enriched in eight KEGG pathways, as well as to pinpoint their associated candidate genes through integrated transcriptomic and metabolomic analysis. However, this study still has limitations. For instance, although the proposed aroma formation model is strongly supported by multi-omics correlations, it remains hypothetical until validated by functional experiments. The key candidate genes (e.g., BraC03g066260, BraC06g037780) and pathways (e.g., terpenoid backbone biosynthesis, sulfur assimilation) identified here, represent high-priority targets for future research. Follow-up work should include qPCR to validate gene expression patterns and functional characterization via genetic manipulation (such as gene overexpression or knockout) in model plants, ultimately elucidating their roles in the biosynthesis of key aromatic compounds.
-
The authors confirm their contributions to the paper as follows: study conception and design: Liu Z, Wang H, Wu P; performance of experiments and data acquisition: Liu Z, Wang H, Wang Y, Zhang Y, Han J; data analysis and interpretation: Liu Z, Wu P; draft manuscript preparation: Nie W, Liu Z; manuscript revision and editing to its present form: Liu Z, Wu P, Wang H, Nie W. All authors reviewed the results and approved the final version of the manuscript.
-
The datasets generated during and/or analyzed during the current study are available from the corresponding author upon reasonable request.
-
This work has been supported by the Provincial Germplasm Resources Bank Project of Jiangsu Province (JS-ZW-K18), Natural Science Foundation of Jiangsu Province (BK20220242).
-
The authors declare that they have no conflict of interest.
-
accompanies this paper online at: https://doi.org/10.48130/vegres-0026-0001
- Supplementary Fig. S1 Total Ion Chromatogram. (A) Total ion flow diagram of volatile components of tested varieties. (B) TIC superposition of QC sample.
- Supplementary Table S1 The composition and its relative content of main volatile substances in each genotype (%).
- Supplementary Table S2 The average expression levels of 13 major differentially expressed metabolites.
- Copyright: © 2026 by the author(s). Published by Maximum Academic Press, Fayetteville, GA. This article is an open access article distributed under Creative Commons Attribution License (CC BY 4.0), visit https://creativecommons.org/licenses/by/4.0/.
-
About this article
Cite this article
Liu Z, Wang Y, Zhang Y, Han J, Nie W, et al. 2026. Identification and molecular mechanism analysis of volatile compounds in three kinds of aromatic Brassica Chinensis. Vegetable Research 6: e008 doi: 10.48130/vegres-0026-0001 

Identification and molecular mechanism analysis of volatile compounds in three kinds of aromatic Brassica Chinensis
- Received: 04 September 2025
- Revised: 18 November 2025
- Accepted: 15 December 2025
- Published online: 13 March 2026
Abstract: The aromatic quality of non-heading Chinese cabbage ( Brassica chinensis L., NHCC) vars Xiangqingcai (XQC), is significantly enhanced when cultivated in China's Suzhou region. To investigate the chemical and molecular basis of this characteristic fragrance, an integrated analysis of volatile organic compounds (VOCs), and transcriptomes from three key Xiangqingcai (XQC) cultivars (black leaf [FB], yellow leaf [FH], and Xiuhuajin [FX]) were performed using headspace solid-phase microextraction/gas chromatography–mass spectrometry (HS-SPME-GC-MS) and RNA sequencing, with Suzhouqing (SZQ) as the control. Comparative analysis identified 56 VOCs with significantly different abundances between the XQC cultivars, and SZQ. Thirteen of these were identified as key aroma-active compounds, belonging to diverse chemical classes including nitriles, terpenes, alkenes, aromatic hydrocarbons, esters, ketones, alcohols, and heterocyclic alkanes. Enrichment analysis indicated that sesquiterpenoid and triterpenoid biosynthesis, phenylalanine metabolism, and sulfur-related metabolism were the primary pathways involved. Critical odorants such as β-caryophyllene, phenylacetaldehyde, and 1,8-cineole were identified as major contributors. Key genes encoding enzymes central to the biosynthesis of these aromatic compounds were also uncovered. This study provides a molecular foundation for understanding aroma regulation in NHCC and offers practical targets for breeding programs aimed at improving flavor quality.