


-
The measurement of visual evoked potentials (VEPs) is a non-invasive diagnostic method that enables an objective assessment of the bioelectrical function of the entire visual pathway, and of the optic nerve in particular. Visually evoked cortical responses were first recorded in 1934 by Adrian & Matthews in an animal model, marking the beginning of electrophysiological studies on the visual system[1]. VEPs are complex electrical potentials initiated by visual stimuli generated within the primary visual cortex (in the projection of the sulcus striae corresponding to Brodmann's area 17[2,3]. The visual stimulus can be a light stimulus of varying intensity and wavelength (flash VEP, fVEP) or an alternating checkerboard pattern with different angular sizes and pattern colors (pattern VEP, pVEP)[4,5]. In routine clinical practice, the fVEP protocol is often used for patients with a visual acuity equal to or below 0.1 on the decimal scale according to the Snellen chart[6], whereas the pVEP protocol is used for patients with a visual acuity above 0.1. Adequate visual acuity is important for reliable pattern-reversal VEPs. The pattern-onset VEP protocol may also be applied in selected clinical situations, particularly for patients with poor fixation, nystagmus, amblyopia, or reduced visual acuity, where pattern-reversal VEPs may be unreliable[7]. VEP is measured as the difference in potential between electrodes placed on the scalp at specific locations and reflects the functional integrity of the visual pathway from the retina through the optic nerve, optic chiasm, and optic radiations to the primary visual cortex. Differences in waveform components (e.g., N75, P100, and N145) correspond to the sequential activation of these structures, with the P100 component being primarily generated in the striate cortex (V1)[8].
VEP test results are presented as a curve with alternating positive (P) and negative (N) deflections, known as waves or potentials. When evaluating VEPs, the amplitude (i.e., height of the deflection) and the latency of the waves (i.e., the time that elapsed from the visual stimulus activation until the electrical impulse reached the visual cortex) are considered[9].
Being in the microvolt (µV) range, the amplitude of the VEP signal is much smaller than the background EEG activity[10]. Therefore, VEPs cannot be reliably distinguished in a single EEG recording and require signal averaging techniques for accurate extraction and analysis. Multiple repetitions of the same stimulus are used to improve the signal-to-noise ratio through averaging trials, with the degree of improvement being proportional to the square root of the number of repetitions (√n)[11].
The P100 potential is especially valuable in interpreting VEP test results. In healthy people, it appears about 100 ms after the stimulus (pattern). In clinical practice, the amplitude and latency of the N75 and N135 waves are also often analyzed. The wave name numbers indicate the approximate time (in ms) at which the wave appears on the VEP graph (Fig. 1)[9].
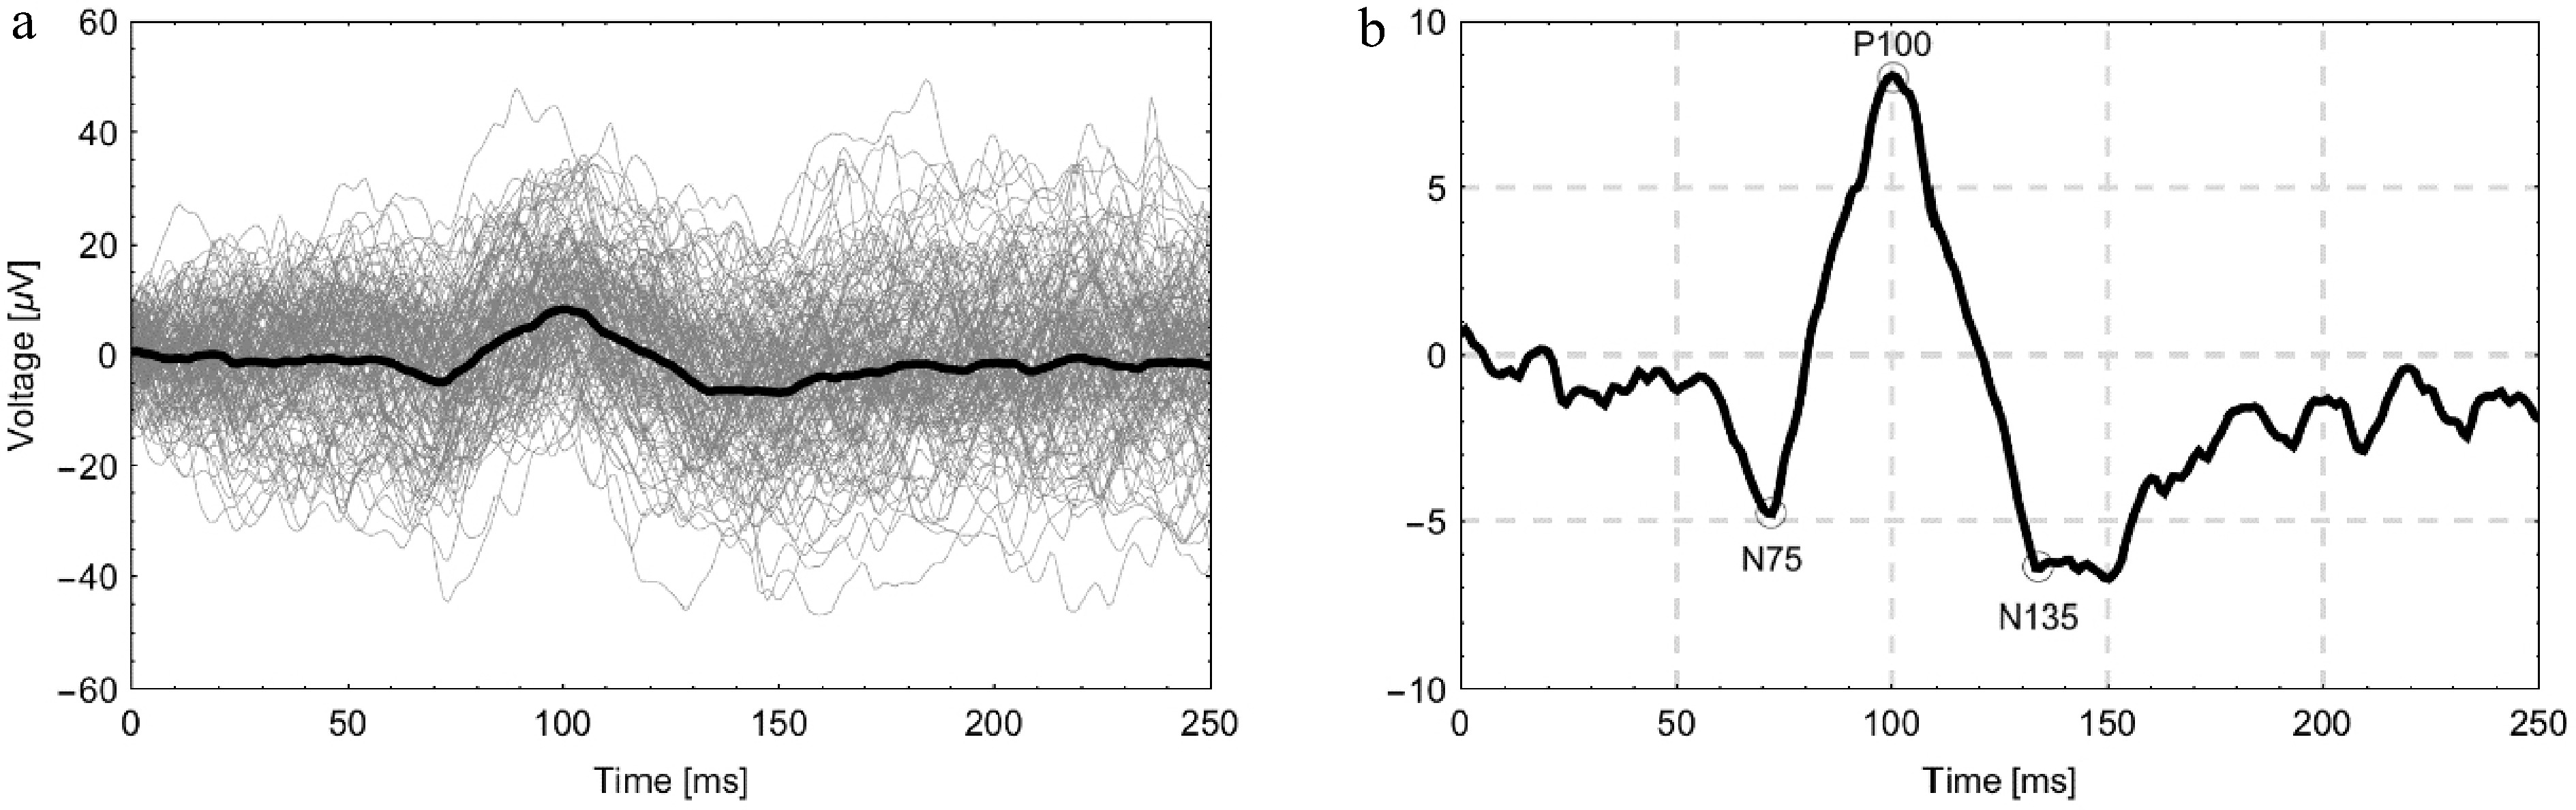
Figure 1.
(a) Illustrative graph of VEP signals from the right eye of a healthy male volunteer showing 80 individual trials (gray) along with the averaged signal (bold dark line). (b) The same averaged signal is shown on an enlarged scale with the characteristic components N75, P100, and N135 indicated.
The measurement of VEP enables the objective diagnosis and monitoring of many ophthalmological and neurological diseases and also allows the objective testing of visual acuity in children, people with mental disabilities, and people who simulate[12]. In clinical practice, VEPs are used to diagnose optic neuropathy of various etiologies and assess the higher levels of the visual pathway in inflammatory, neoplastic, vascular, and neurodegenerative diseases. Moreover, VEPs play a vital role in assessing optic nerve function after head injury and in qualifying patients for surgical decompression of the II nerve. VEPs are also used for patients with compression of the optic nerve who qualify for endoscopic orbital decompression[13,14]. During neurosurgical procedures performed near the optic pathway, surgeons monitor visual function with intraoperative VEP recording to avoid mechanical damage to the optic pathway structures[15,16]. VEP testing can also be performed simultaneously with magnetic resonance imaging[17,18].
VEP morphology is influenced by the individual characteristics and the technical testing conditions. The technical conditions affecting VEP wave morphology include the type of screen on which the stimulus is presented[19], the angular size and contrast of the pattern used[5,20,21], and the type and placement of the electrodes on the skin surface[9]. Changes in the VEP waveform also depend on biological factors such as age, sex, and genetic predisposition associated with ethnicity. Lifestyle, diet, prevalence of systemic diseases, adequacy of health care, and environmental factors may differ between populations, indirectly affecting the visual pathway function and recorded response characteristics[22−25]. Although these differences may be subtle, they are important when interpreting borderline results[26]. Therefore, normative data determined in other countries (e.g., India, Bulgaria, or Indonesia) are not always representative of the Polish population. Identifying ethnic differences and evaluating the influence of environmental factors requires population-level studies[22,27]. Thus, such studies allow the assessment of inter-population variability and the determination of its relevance to the response parameters recorded during VEP testing.
The International Society for Clinical Electrophysiology of Vision (ISCEV) recommends that every laboratory that assesses optic nerve function using VEPs should use standardized test protocols to eliminate the technical variables that may affect P100 wave morphology[9]. In clinical practice, especially in smaller centers, published normative data are often used as references. However, there is a lack of recent, methodologically transparent normative studies on VEPs in the Polish population, taking into account the current ISCEV guidelines.
The aim of this study was to determine the reference values of VEP parameters in the healthy Polish population. Normative data adapted to the local population are essential for validating newly implemented stimulation and recording systems—including new types of electrodes and display screens—especially considering the growing number of medical devices developed locally or adapted to the specific needs of clinical centers[28]. Establishing normative data for the Polish population, based on a clearly defined and reproducible methodology, may prove especially valuable in diagnostic practice. Moreover, normative data may contribute to the refinement of international standards for diagnostic procedures and VEP interpretation.
-
This study included 108 healthy volunteers (216 eyes) examined at the Ophthalmology Clinic between 2019 and 2024. Approved by the Bioethics Committee of Medical University of Bialystok (Resolution R-I-002/477/2019; 24 Oct 2019), with written informed consent from all participants. All participants had full corrected visual acuity of –1.0 and refraction within the range of –2.00 to +2.00 diopters, without any ophthalmological diseases. The median age of the whole cohort was 37.19 years (Q1–Q3: 24–48.25 years; range: 18–75 years). In males, the median age was 33.49 years (Q1–Q3: 23–42 years; range: 18–71 years), whereas in females it was 41 years (Q1–Q3: 25–53 years; range: 18–75 years). Participants underwent a complete ophthalmological examination, which included visual acuity testing on Snellen charts, color vision on Ishihara plates, intraocular pressure measurement, evaluation of the anterior segment of the eye by using a slit lamp, and fundus evaluation. The latter was performed by using a slit lamp both before and after pharmacological pupil dilation and a Volk wide-field lens by an experienced ophthalmologist with many years of clinical practice.
All healthy volunteers underwent a pattern-reversal VEP examination. Stimuli were presented on a 21-inch CRT (Cathode Ray Tube) monitor (Gateway 2000 Vivitron 21) at a refresh rate of 89.5 Hz. Stimulus presentation was controlled by the Espion E3 system. The test protocol was designed based on the ISCEV guidelines[9]. All tests were conducted in the same electrophysiology laboratory, under the same lighting conditions, and at the same time of the day (between 12 noon and 2 pm). The test was performed using gold-plated cup electrodes attached to the scalp after preparation. Prior to electrode placement, the skin was disinfected and gently prepared with abrasive paste. An impedance-conductive paste was applied to the electrodes to ensure stable contact. The active electrode was placed on the Oz point, located 3 cm above the Inion (the back of the head), which primarily provides information about the integrity of the visual pathway up to the optic chiasm. Placing additional active electrodes laterally at O1 and O2 allows for the assessment of post-chiasmatic visual pathways. Nevertheless, in routine ophthalmological practice, the method with a single active electrode at Oz remains the most commonly used approach[29]. The reference electrode was placed at the Fz point, which is located at 30% of the distance between the bridge of the nose (Nasion) and the Inion (area of the scalp). The ground electrode was placed halfway between the Nasion and the Inion (Cz) (Fig. 2). The impedance of the electrodes was kept below 5 kΩ throughout the entire test, and the difference between the electrodes did not exceed 1 kΩ to ensure the best possible signal quality.
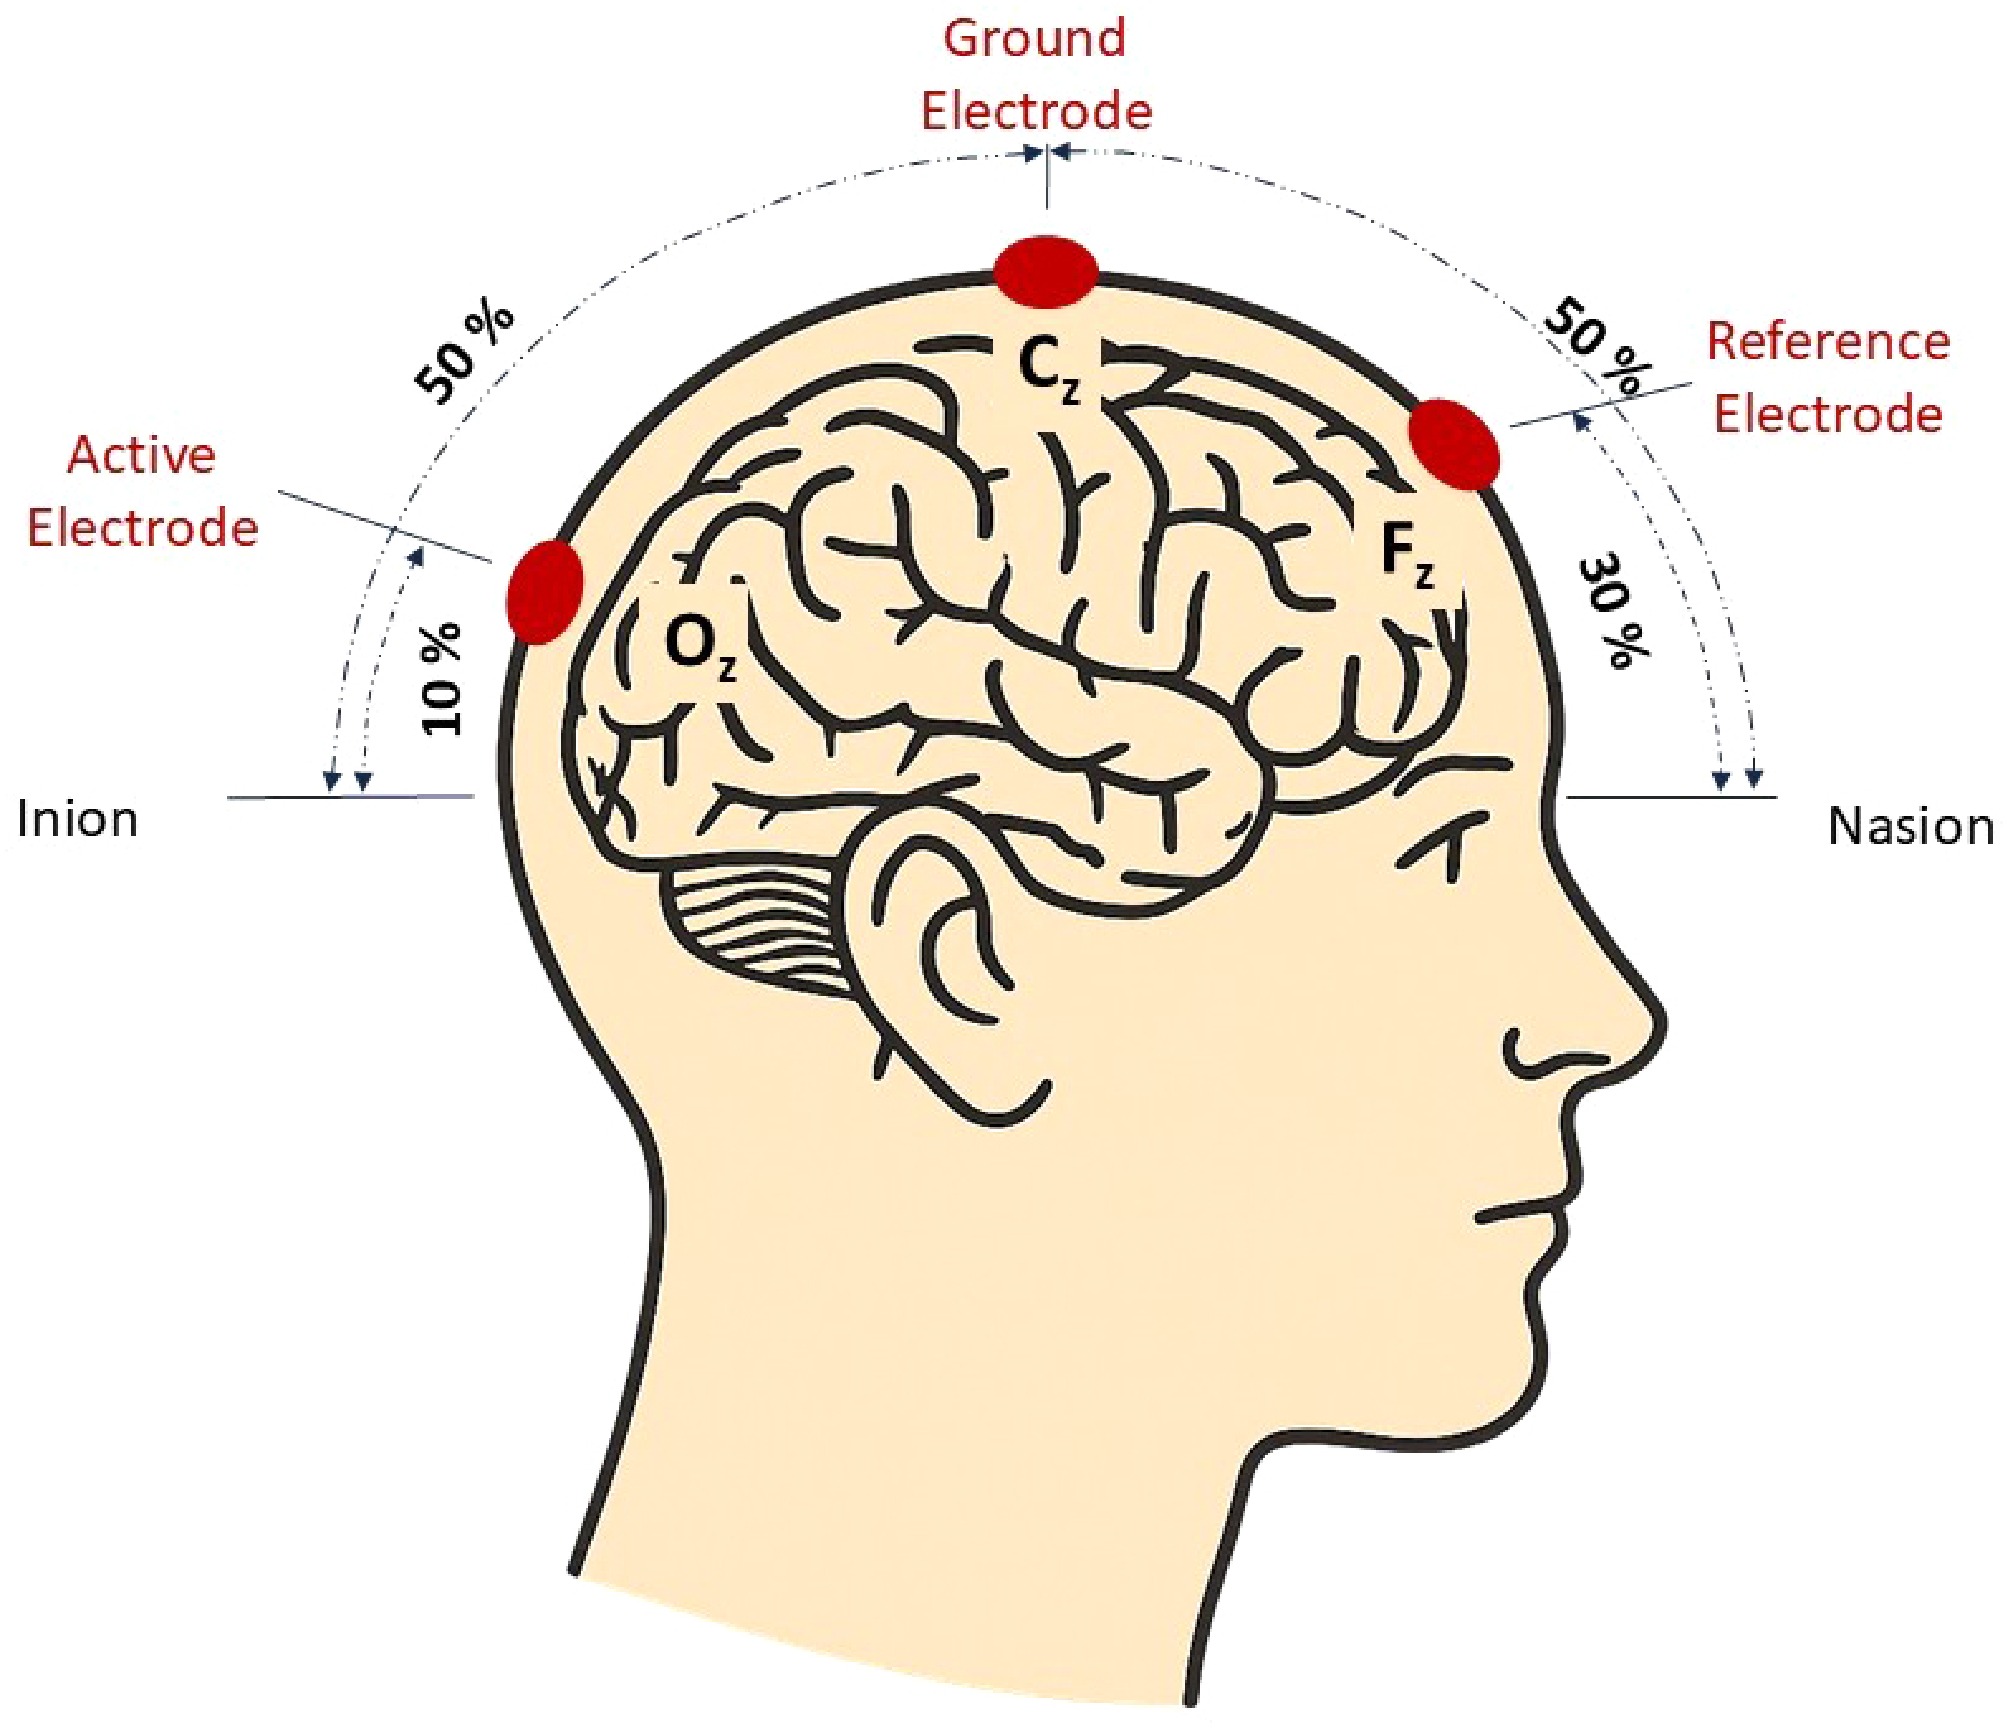
Figure 2.
Diagram of the electrode placement along the midline of the scalp used in visual evoked potential examination. (Original illustration by the authors).
Visual simulation was performed using a checkerboard pattern generated on a cathode-ray tube screen. The mean screen luminance was 100 cd/m2, and the Michelson contrast was 80%. The checkerboard pattern comprised black and white squares with the corners touching each other. Black-and-white checkerboard patterns with check sizes of 0.8° (measurement 1), and 0.25° (measurement 2) of visual angle were used, covering a visual field of approximately 14° (horizontal) × 10° (vertical), at a viewing distance of 150 cm. A central red fixation target (0.125°) was continuously visible. The pattern phase was reversed at a constant frequency of two reversals per second (1 Hz) with mean-luminance interleaves. Each eye was stimulated separately. The number of stimulus presentations (sweep) during one stimulation was 80 repetitions. For the test results to be as reliable as possible, at least two stimulations were performed during pVEP and used to calculate the average. The minimum analysis time for the stimulus was 250 ms.
The evoked potential results were analyzed to determine the VEP normative values in the studied population. The study determined the amplitude and latency values of the N75, P100, and N135 waves. The results were assessed for their relationship with age and sex, and correlations between parameters in the left and right eyes were also evaluated.
Statistical analysis
-
Statistical calculations were performed using R software (version 4.1.2). Continuous variables are presented as mean ± standard deviation or median (interquartile range), depending on the distribution. Distribution normality was verified using the Shapiro–Wilk test, skewness, and kurtosis. Assessment of data normality is provided in Supplementary Table S1. Dependencies between continuous variables and sex were assessed with the Student t-test or the Mann–Whitney U test. Relations between age and other continuous variables were verified using Spearman correlation. Due to multiple testing, Benjamini–Hochberg adjustment for the original p-values was used for both Mann–Whitney U tests and Spearman correlation outcomes. Differences in continuous variables between eyes were assessed with the Wilcoxon test. In addition, interocular correlations were assessed using the intraclass correlation coefficient (ICC) and 95% confidence interval (CI). Multivariate linear mixed-effects models were developed to assess relationships of the analyzed parameters with sex and age, considering interocular correlations. Independent variables included sex, age, and eye (left/right), and random effects for the correlation of two eyes were derived from the same volunteer. Outcomes with p < 0.05 were considered significant.
-
The demographic characteristics of the study group are presented in Table 1.
Table 1. Demographic characteristics of the study group.
Variable n (%) / M ± SD Me (IQR) Range N 108 (100.0) − − Sex Male 55 (50.9) − − Female 53 (49.1) − − Age (years) 37.19 ± 15.58 33.00 (24.00; 48.25) 18.00–75.00 Males (years*) 33.49 ± 13.94 31.00 (23.00; 42.00) 18.00–71.00 Females (years*) 41.04 ± 16.38 41.00 (25.00; 53.00) 18.00–75.00 Data are presented as n (%) for sex and mean ± SD for continuous variables. M, mean; SD, standard deviation; Me, median; IQR, interquartile range. * Only for males/females. Correlation between age and analyzed parameters
-
A low-strength positive correlation was confirmed between age and N75 [μV] in the left eye in measurement 1 (rho = 0.20, p = 0.043). The correlations between age and selected VEP parameters are illustrated in Fig. 3. Detailed scatterplots for these correlations are provided in Supplementary Fig. S1.
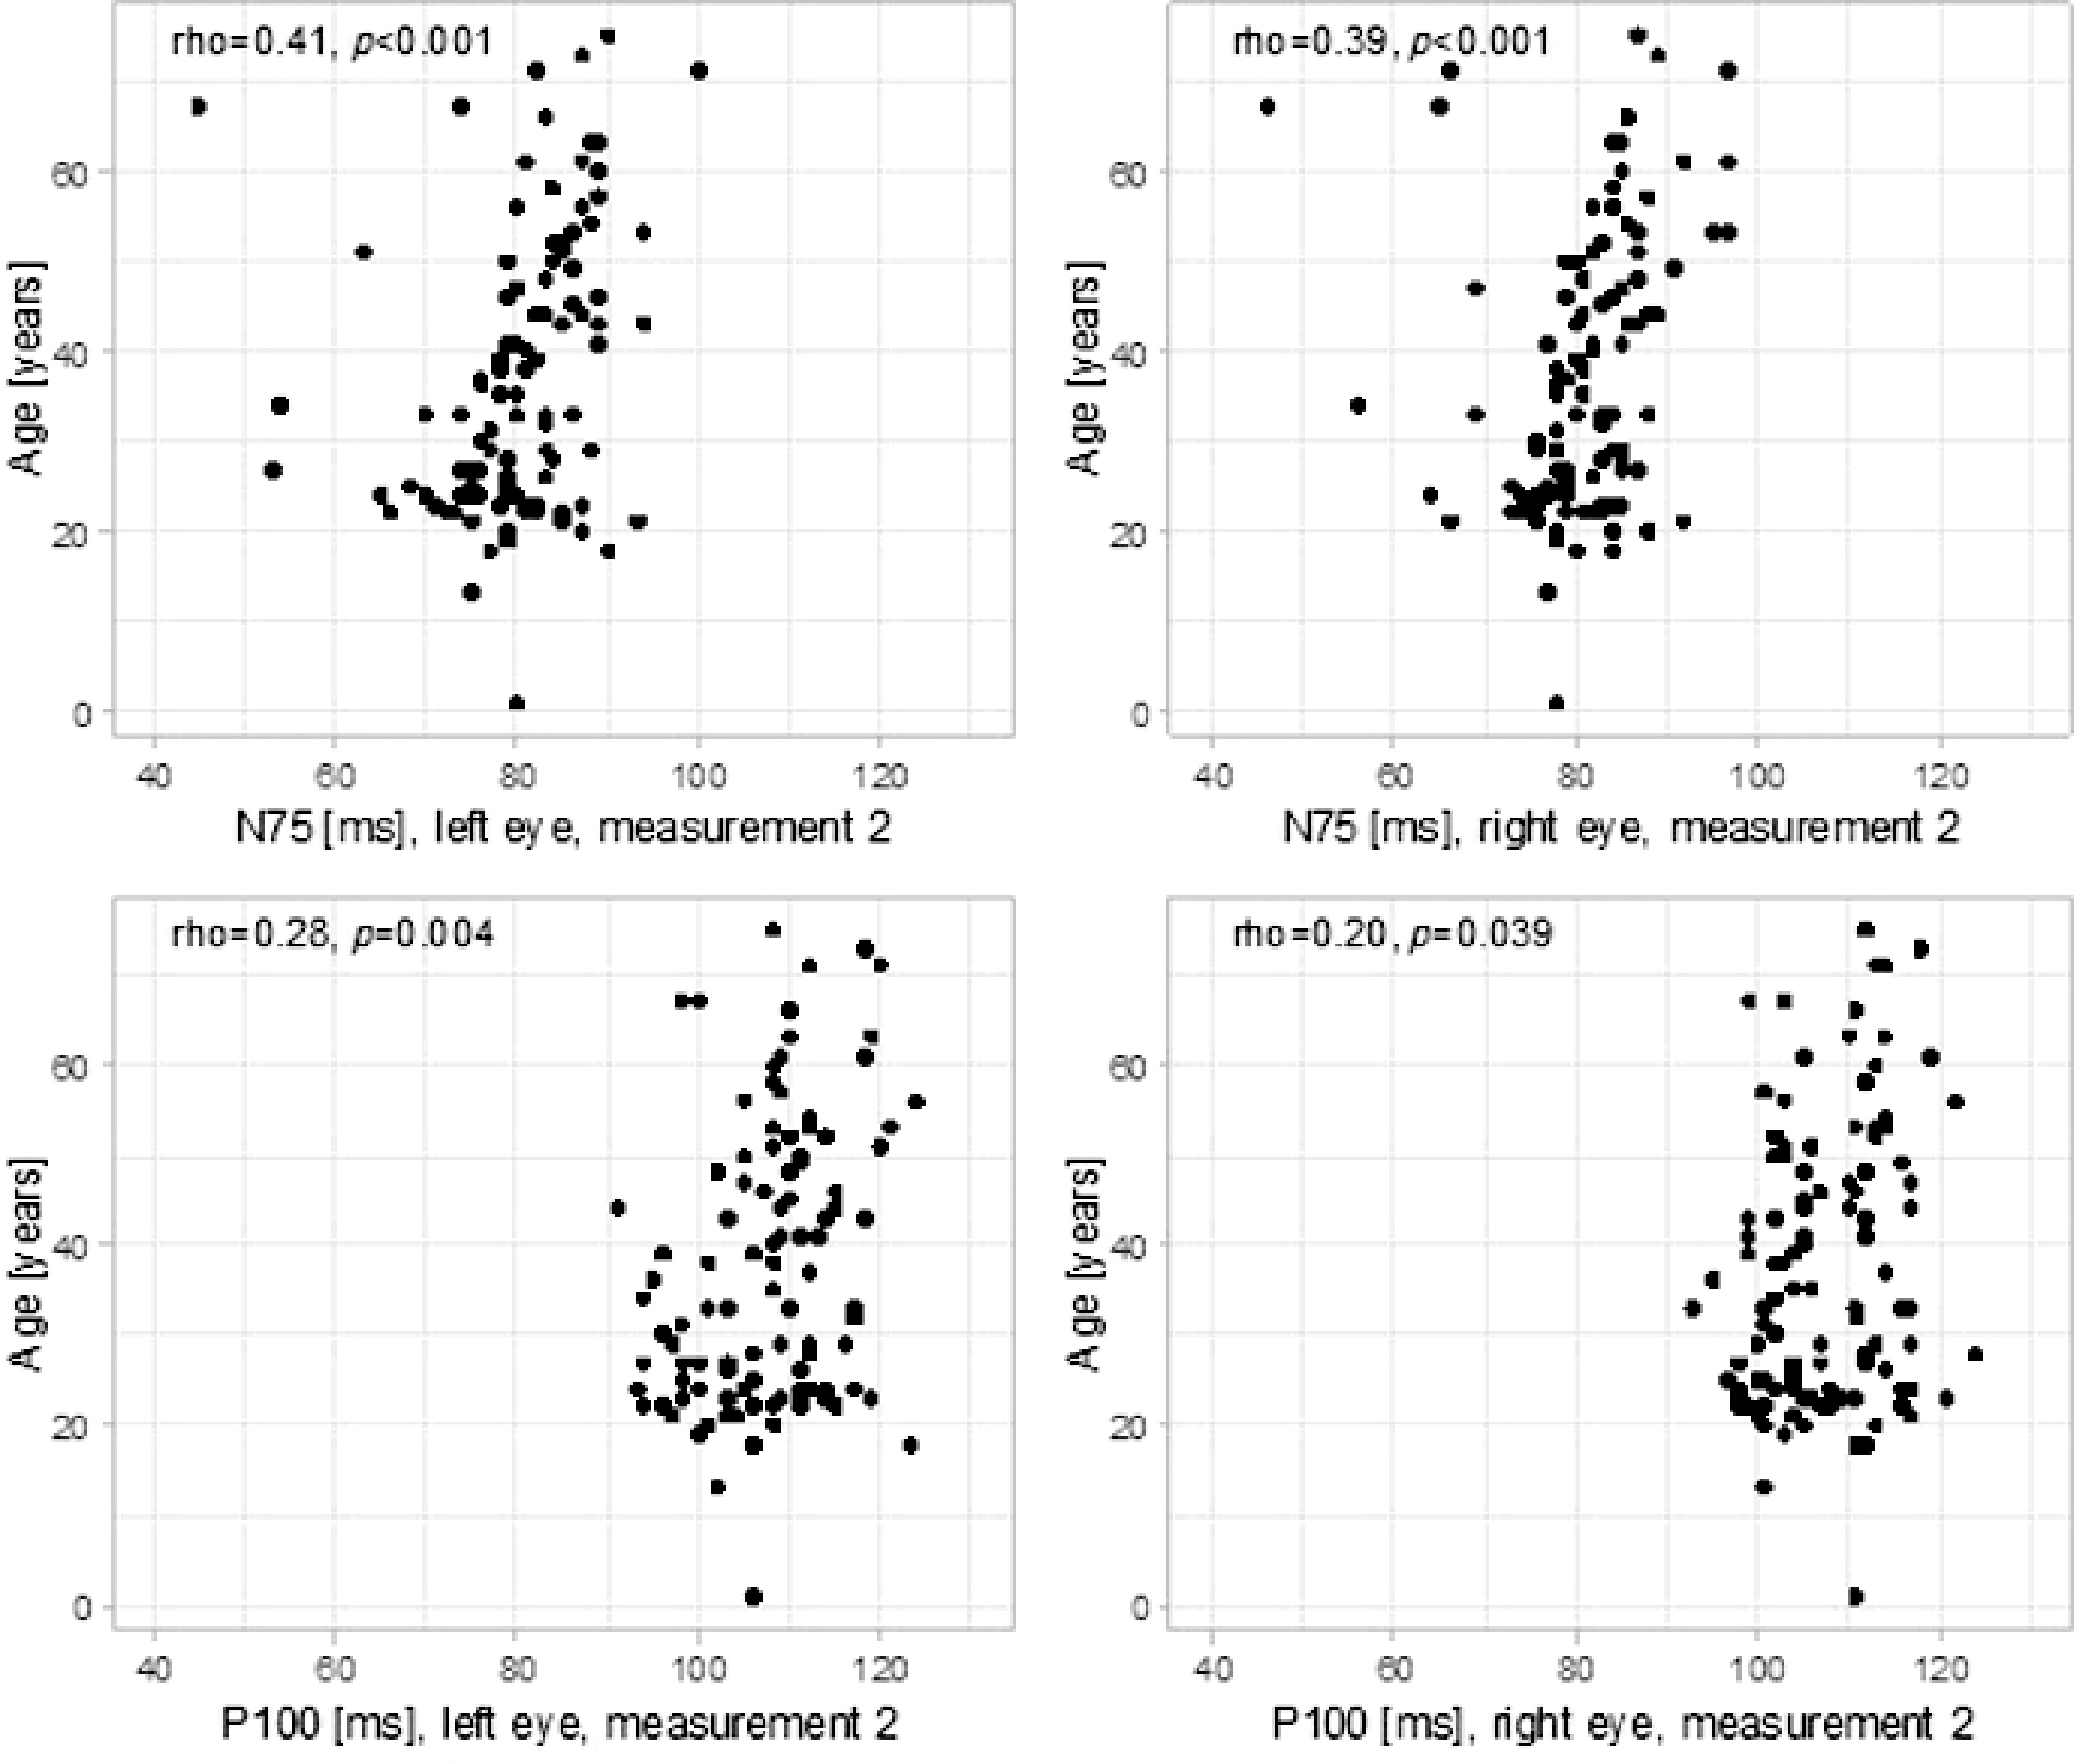
Figure 3.
Correlations between age and analyzed parameters.
A moderate-strength positive correlation was confirmed between age and N75 [ms] in both eyes in measurement 2 (left eye: rho = 0.41, p < 0.001, right eye: rho = 0.39, p < 0.001).
A low-strength positive correlation was confirmed between age and P100 [ms] in both eyes in measurement 2 (left eye: rho = 0.28, p = 0.004, right eye: rho = 0.20, p = 0.039) After correction for multiple comparisons, the correlations between age and N75 [ms] in both eyes in measurement 2, as well as between age and P100 [ms] in the left eye in measurement 2, remained statistically significant, while the correlation between age and P100 [ms] in the right eye in measurement 2 did not retain significance (Table 2).
Table 2. Correlation between age and analyzed parameters.
Variable Correlation between age and left-eye parameters Correlation between age and right-eye parameters Rho p p-adj Rho p p-adj N75 μV 1 0.20 0.043 0.208 0.06 0.542 0.867 N75 ms 1 0.16 0.101 0.304 0.06 0.538 0.867 P100 μV 1 −0.18 0.061 0.244 −0.16 0.101 0.304 P100 ms 1 −0.05 0.594 0.891 −0.03 0.743 0.892 N175 μV 1 −0.05 0.633 0.892 0.04 0.719 0.892 N135 ms 1 0.00 0.977 0.977 −0.10 0.327 0.654 N75 μV 2 0.10 0.302 0.654 0.07 0.483 0.867 N75 ms 2 0.41 < 0.001 < 0.001 0.39 < 0.001 < 0.001 P100 μV 2 0.10 0.300 0.654 0.00 0.975 0.977 P100 ms 2 0.28 0.004 0.029 0.20 0.039 0.208 N135 μV 2 −0.14 0.141 0.377 −0.02 0.819 0.936 N135 ms 2 0.02 0.864 0.943 0.04 0.678 0.892 Rho–Spearman correlation coefficient. p-adj are the p-values corrected with Benjamini–Hochberg adjustment for multiple comparisons. Confounding factors not considered. Bold values indicate statistically significant correlations after Benjamini–Hochberg correction for multiple comparisons (p-adj < 0.05). Dependency between sex and analyzed parameters
-
In measurement 2, the P100 [μV] in the right eye (MD = –3.07, 95% CI [–5.15; –0.44], p = 0.021) and that in the left eye (MD = –3.09, 95% CI [–4.81; –0.71], p = 0.008) were significantly lower among males compared to females. In addition, N135 [μV] in the left eye was significantly higher among males compared to females (MD = 4.02, 95% CI [0.32; 5.02], p = 0.028) (Table 3). Boxplots illustrating sex-related differences in selected parameters are shown in Supplementary Fig. S2.
Table 3. Comparison of analyzed parameters between males and females.
Variable Males Females MD (95% CI) p p-adj n M ± SD / Me (IQR) n M ± SD / Me (IQR) N75 OP μV 1 53 −2.03 (−3.49; −0.69) 53 −1.98 (−4.24; −0.95) −0.05 (−0.66; 1.09) 0.565 0.678 N75 OP ms 1 53 70.00 (66.00; 75.00) 53 71.00 (68.00; 74.00) −1.00 (−3.00; 2.00) 0.537 0.678 P100 OP μV 1 53 8.45 (6.21; 11.27) 53 10.58 (7.19; 13.46) −2.13 (−3.02;0.23) 0.083 0.284 P100 OP ms 1 53 101.26 ± 5.43 53 101.26 ± 6.55 0.00 (−2.32;2.32) > 0.9991 > 0.999 N135 OP μV 1 53 −9.40 (−12.44; −6.52) 53 −11.08 (−14.92; − 7.23) 1.68 (−0.29; 3.50) 0.102 0.307 N135 OP ms 1 53 141.53 ± 13.03 53 140.77 ± 12.98 0.75 (−4.25; 5.76) 0.7661 0.875 N75 OP μV 2 54 −4.34 (−5.61; −2.55) 53 −4.63 (−6.48; −2.51) 0.01 (−0.69; 1.60) 0.378 0.620 N75 OP ms 2 55 81.00 (78.00; 84.00) 53 82.00 (78.00; 87.00) −1.00 (−4.00; 1.00) 0.133 0.349 P100 OP μV 2 55 9.64 (6.00; 13.25) 53 12.71 (7.76; 18.02) −3.07 (−5.15; −0.44) 0.021 0.196 P100 OP ms 2 55 106.78 ± 6.46 53 108.19 ± 6.65 −1.41 (−3.91; 1.09) 0.2671 0.535 N135 OP μV 2 54 −10.02 (−16.12; −5.95) 53 −12.45 (−16.93; −8.82) 2.43 (−0.29; 4.91) 0.077 0.284 N135 OP ms 2 55 150.22 ± 12.78 53 154.83 ± 13.18 −4.61 (−9.57; 0.34) 0.0681 0.284 N75 OL μV 1 54 −2.39 (−3.91; −1.09) 53 −2.75 (−4.13; −1.40) 0.36 (−0.49; 1.18) 0.413 0.620 N75 OL ms 1 54 70.00 (65.00; 74.00) 53 71.00 (69.00; 74.00) −1.00 (−4.00; 1.00) 0.153 0.349 P100 OL μV 1 54 8.53 (5.95; 10.74) 53 10.42 (7.19; 13.52) −1.89 (−3.18; −0.11) 0.033 0.196 P100 OL ms 1 54 101.00 (98.00; 103.75) 53 101.00 (98.00; 104.00) 0.00 (−2.00; 2.00) 0.928 0.968 N135 OL μV 1 54 −9.19 (−12.46; −6.97) 53 −10.63 (−14.62; − 6.91) 1.44 (−0.57; 3.45) 0.160 0.349 N135 OL ms 1 54 141.98 ± 11.17 53 141.74 ± 13.97 0.25 (−4.60; 5.09) 0.9201 0.968 N75 OL μV 2 54 −3.77 (−5.74; −2.65) 53 −4.45 (−6.18; −2.40) 0.68 (−0.69; 1.58) 0.515 0.678 N75 OL ms 2 54 80.00 (76.00; 84.75) 53 82.00 (78.00; 85.00) −2.00 (−4.00; 2.00) 0.389 0.620 P100 OL μV 2 54 9.61 (6.44; 13.54) 53 12.70 (9.13; 15.34) −3.09 (−4.81; −0.71) 0.008 0.185 P100 OL ms 2 54 106.93 ± 7.24 53 108.08 ± 7.24 −1.15 (−3.93; 1.63) 0.4141 0.620 N135 OL μV 2 54 −9.76 (−14.40; −7.06) 53 −13.78 (−15.77; −9.49) 4.02 (0.32;5.02) 0.028 0.196 N135 OL ms 2 54 150.24 ± 11.93 53 151.89 ± 15.58 −1.65 (−6.96; 3.67) 0.5401 0.678 Groups were compared with the Student t-test or the Mann–Whitney U test, as appropriate. p-adj are the p-values corrected with Benjamini–Hochberg adjustment for multiple comparisons. Confounding factors not considered. M, mean; SD, standard deviation; Me, median; IQR, interquartile range; MD, mean or median difference (males vs females); CI, confidence interval. In measurement 1, the P100 [μV] in the left eye was significantly lower among males compared to females (MD = –1.89, 95% CI [–3.18; –0.11], p = 0.033). After correction for multiple comparisons, none of the associations remained significant.
Interocular correlations for analyzed parameters
-
ICC was used to analyze interocular correlations. Significant correlations were confirmed for all parameters. High agreement between parameter values in the left and right eyes were confirmed for P100 [μV] in both measurements (measurement 1: ICC = 0.864, 95% CI [0.806; 0.905], p < 0.001; measurement 2: ICC = 0.890, 95% CI [0.844; 0.924], p < 0.001) and N135 [μV] in both measurements (measurement 1: ICC = 0.891, 95% CI [0.844; 0.925], p < 0.001; measurement 2: ICC = 0.880, 95% CI [0.829; 0.917], p < 0.001). Moderate agreement between the two eyes was confirmed for the remaining parameters, except for N75 [ms] in measurement 1, for which poor agreement was confirmed (ICC = 0.431, 95% CI [0.262; 0.574], p < 0.001). For parameters with moderate agreement, ICC ranged from 0.613 (95% CI [0.480; 0.719], p < 0.001) corresponding to N75 [ms] in measurement 2 to 0.758 (95% CI [0.664; 0.829], p < 0.001) corresponding to N75 [μV] in measurement 2.
Based on the Wilcoxon paired test, no significant difference in parameter values between the left and right eye was confirmed (p > 0.05 for all parameters) (Table 4).
Table 4. Interocular correlations.
Variable n M ± SD, left eye M ± SD, right eye Me (IQR), left eye Me (IQR), right eye p (Wilcoxon) ICC 95% CI for ICC p (ICC) N75 μV 1 105 −2.81 ± 2.42 −2.47 ± 2.55 −2.53 (−4.00; −1.16) −2.01 (−3.99; −0.83) 0.102 0.676 0.558 to 0.768 < 0.001 N75 ms 1 105 70.27 ± 7.32 70.18 ± 7.02 70.00 (66.00; 74.00) 71.00 (68.00; 74.00) 0.861 0.431 0.262 to 0.574 < 0.001 P100 μV 1 105 9.75 ± 4.53 10.02 ± 4.70 8.97 (6.34; 11.61) 9.07 (7.04; 12.17) 0.193 0.864 0.806 to 0.905 < 0.001 P100 ms 1 105 100.69 ± 5.73 101.25 ± 6.01 101.00 (98.00; 104.00) 101.00 (98.00; 105.00) 0.404 0.632 0.501 to 0.734 < 0.001 N135 μV 1 105 −10.55 ± 5.65 −10.82 ± 5.52 −9.76 (−13.62; − 6.86) −10.22 (−13.39; −6.93) 0.326 0.891 0.844 to 0.925 < 0.001 N135 ms 1 105 141.70 ± 12.65 141.16 ± 13.01 141.00 (133.00; 148.00) 141.00 (134.00; 149.00) 0.845 0.699 0.587 to 0.785 < 0.001 N75 μV 2 106 −4.52 ± 3.17 −4.69 ± 3.71 −4.04 (−5.89; −2.42) −4.63 (−5.90; −2.55) 0.194 0.758 0.664 to 0.829 < 0.001 N75 ms 2 107 80.21 ± 8.19 80.85 ± 7.47 81.00 (76.50; 85.00) 81.00 (78.00; 85.00) 0.304 0.613 0.480 to 0.719 < 0.001 P100 μV 2 107 11.70 ± 5.95 11.96 ± 6.88 10.99 (7.56; 14.21) 10.95 (6.77; 15.61) 0.283 0.890 0.844 to 0.924 < 0.001 P100 ms 2 107 107.50 ± 7.23 107.38 ± 6.53 108.00 (103.00; 112.00) 106.00 (102.00; 112.00) 0.925 0.654 0.531 to 0.750 < 0.001 N135 μV 2 106 −12.11 ± 6.87 −12.25 ± 7.04 −11.12 (−15.67; −7.75) −11.48 (−16.76; −7.03) 0.794 0.880 0.829 to 0.917 < 0.001 N135 ms 2 107 151.06 ± 13.82 152.51 ± 13.18 151.00 (141.00; 162.00) 153.00 (143.50; 164.00) 0.496 0.629 0.499 to 0.731 < 0.001 Correlations between eyes were analyzed using the Wilcoxon test and ICC. M, mean; SD, standard deviation; Me, median; IQR, interquartile range; ICC, intraclass correlation coefficient; CI, confidence interval. Bold values indicate statistically significant intraclass correlation coefficients (p < 0.05) Relationships of analyzed parameters with sex and age based on a multivariate approach
-
Additional multivariate analysis was made to assess the relationships of the analyzed parameters with sex and age, accounting for interocular correlations. It was confirmed that age was significantly associated with N75 [µV] in measurement 1 with an impact of 0.03 µV for each year of age, p = 0.029. Both sex and age significantly impacted P100 [µV] in measurement 1. P100 [µV] in measurement 1 was lower by 2.27 µV in males compared to females (p = 0.009). P100 [µV] in measurement 1 was lower by 0.06 µV in patients with who were one year older (p = 0.044). Additionally, age was significantly associated with N75 [ms] in measurement, 2 with an additional 0.13 ms for each year (p = 0.003). Sex significantly impacted P100 [µV] in measurement 2. P100 [µV] in measurement 2 was lower by 2.50 µV in males compared to females (p = 0.043). Age was significantly associated with P100 [ms] in measurement 2, with an impact of 0.11 ms for each year of age (p = 0.006). Detailed results of the multivariate mixed-effects models are provided in Supplementary Table S2.
-
In this study, data on the average latency values and amplitudes of the N75, P100, and N135 waves were obtained in the pVEP recordings and were found to depend on the age and sex of participants. The results differed from the data published in other studies. In this group, the average latency of the P100 wave at a stimulation of 0.808° was 100.92 ± 5.70 ms and 101.12 ± 4.83 ms for women and men, respectively. When stimulated at 0.258°, the average latency of the P100 wave was 108.13 ± 6.22 ms and 106.95 ± 6.38 ms for women and men, respectively. Sharma et al.[30] studied a healthy Indian population and reported that the average P100 wave latency values were 88.78 ± 8.9 ms and 93.41 ± 0.6 ms for women and men, respectively. They performed the VEP examination with the pattern-reversal method using the RMS EMG EP Mark II system, an electrode placement according to ISCEV standards (Oz–Fz, Cz as ground), and an impedance maintained below 5 kΩ. Monocular stimulation was applied using a checkerboard pattern reversing at a frequency of 2/s at a 100-cm distance from the monitor with a recording length of 250 ms, averaging more than 100 responses to ensure reproducibility. Additionally, Mermekliev et al.[27] examined 94 eyes of 47 healthy individuals in the Bulgarian population. The examination protocol differed slightly from that used in this study in that it relied on a three-channel system to record the electrical potentials above the visual cortex (OZ, O1, and O2). The results obtained were nonetheless similar to this study's: the latency of the P100 wave at 0.250 and 10 stimulations was 99 ± 4.8 ms and 96 ± 4.6 ms, respectively. The authors, however, did not analyze the data by sex and age. The amplitude of the N75-P100 component had the lowest variability (V = 44.3%−49.7%), followed by the P100-N145 component (both P100 arms), while the N145-P200 component had the highest variability (V = 50.4%−77%). These findings confirm the stability of the amplitude of the P100 component and the variability of the P200 component. Furthermore, Mahjoob et al.[31] studied a young population in north-eastern Iran (n = 59 healthy participants with an average age of 22.55 ± 3.79 years). They reported higher values for the average latency of the P100 wave with 1° stimulation (104. 57 ± 7.95 ms) and 0.25° stimulation (111.78 ± 5.55). However, the authors did not analyze the results obtained by sex. The VEP recordings were performed using the Roland RETI system and a 22″ CRT monitor (contrast, 99%; mean luminance, 52 cd/m2; and refresh rate, 75 Hz). Pattern-reversal checkerboards of 15 and 60′ were presented at a reversal frequency of 1.535 Hz, with monocular and binocular stimulation at a fixation distance of 1 m. Gold-cup electrodes were placed according to the 10–20 system (Oz–Fpz and Cz ground) with impedance maintained below 5 kΩ, and each response was averaged from 64 sweeps. Finally, Ekayanti et al.[22] studied a group of 120 healthy Indonesian residents and reported an average P100 latency of 104.5 ± 3.7 ms for the left eye and 104.8 ± 3.6 ms for the right eye in men. In women, the average P100 latency was 103.8 ± 3.0 ms for the left eye and 103.5 ± 3.0 ms for the right eye. The average latency was 104.6 ± 3.4 ms and 104.1 ± 3.4 ms for the left and the right eye, respectively. The VEP recordings were obtained using a Dantec® system with stimulation presented on a 24″ LCD monitor (check size, 26 mm; contrast, 80%; and reversal rate, 2 Hz) at a distance of 1 m. Electrodes were positioned according to the 10–20 system (Oz active, Fz reference, and Cz ground), and signals were averaged from 200 responses over a 250-ms analysis time. Differences in the VEP component values between individual tests may result from different test protocols, equipment used, experimental conditions, and participant age. In addition, the existence of specific population characteristics cannot be ruled out.
Previous studies have analyzed the influence of age on VEP results using checkerboard elements of different sizes. Their results suggest that age affects the prolongation of latency and the reduction of the P100 wave amplitude[32−34]. The results confirmed a statistically significant correlation between age and prolonged N75 and P100 latencies. In addition, a positive correlation was found between age and the N75 wave amplitude in the left eye when stimulated with a pattern of 0.808° (rho = 0.20, p = 0.043). A positive correlation was also found between age and the latency of the N75 wave in both eyes when stimulated with a 0.258° pattern (left eye: rho = 0.41, p < 0.001; right eye: rho = 0.39, p < 0.001) as well as the latency of the P100 wave in both eyes when stimulated with a 0.258° pattern (left eye: rho = 0.28, p = 0.004; right eye: rho = 0.20, p = 0.039). This is consistent with the results of the studies performed by Mitchell et al.[35] and Allison et al.[36]. This effect was more noticeable when using a pattern with a smaller checkerboard field size, which is consistent with the results reported by Kurita-Tashima et al.[37]. Moreover, Sokol et al.[38] found a significant increase in the latency of the first positive VEP wave component when using checkerboard patterns of 0.2 and 0.8°. However, when using smaller checkerboard fields, the rate of increase in latency was almost twice as fast as that obtained during stimulation with a pattern of larger checkerboard fields. These studies indicate that age has a significant impact on the component results of the VEP wave and that the size of the checkerboard elements during stimulation can modulate these effects. Patient age and stimulation parameters should therefore be considered when interpreting VEP results.
According to the present analyses, the amplitude of the P100 wave tended to be higher in women than in men, which is consistent with the results of Sharma et al.[30], Fein & Brown[39], Gregori et al.[40], and Gupta et al.[41]. However, although several sex-related differences reached statistical significance before correction, they did not remain significant after applying the Benjamini–Hochberg adjustment (Table 3). The Benjamini-Hochberg procedure was used to adjust for multiple testing and to control the false discovery rate (FDR) at 5%. Because many of the tests are correlated (related VEP measures and paired left/right eye data), controlling the FDR is preferable to controlling the family-wise error rate: Bonferroni-type corrections tend to be overly conservative in this situation and can obscure potentially important effects by inflating type II error. The BH approach balances false positive control and statistical power. However, eye-specific significant results should be interpreted cautiously; thus, the present study reports BH-adjusted p-values together with effect sizes. In contrast, in the multivariate mixed-effects model that accounted for age and interocular correlations, sex remained a significant independent predictor of P100 amplitude (Supplementary Table S2). This suggests that biological sex may still play a role in shaping electrophysiological responses, even after statistical adjustment. Notably, a significant difference was not found between P100 latencies according to sex, and this distinguishes the results from those of Gregori et al.[40], Mitchell et al.[35], Gupta et al.[41], and Sharma et al.[30], who all reported longer latencies in men. Similar to the present findings, Ekayanti et al.[22] and Dotto et al.[42] observed differences in amplitude but not in latency depending on sex. Gregori et al.[40] suggested that the longer latency in men was due to the difference in head size between women and men, but this interpretation was not confirmed by Sharma et al.[30] and Thompson et al.[43]. Other authors have suggested that the differences in responses between the sexes may be due to the influence of hormone levels. In Marsh et al.[44] study comparing non-pregnant women and pregnant women, a reduction in the latency of the P100 response in pattern VEP was found in the latter. Tandon et al.[45] also confirmed a reduction in response latency in pregnant women but found no differences in amplitude. In contrast, in their study in the pediatric population, Thompson et al.[43] and Malcolm et al.[46] reported no differences in responses between the sexes, either in terms of amplitude or latency, which could indicate a significant influence of hormonal regulation on the differences observed in adults. In this study, it was noticed that sex differences were more pronounced in the responses of the left eye than in those of the right eye. The study also found a reduced amplitude of the N135 and P100 components in the left eye in men when using a smaller checkerboard, and a statistically significant difference in P100 amplitude between the sexes in the left eye compared to the right eye when using a larger checkerboard. The observed asymmetry in responses between the sexes in the left eye and the less statistically significant asymmetry in the right eye may result from the influence of hormonal factors and the functional asymmetry of the cerebral hemispheres between the sexes, as suggested by English et al.[47] and Hirstein et al.[48].
In this analysis, no significant differences were observed between the ocular components of the VEP waveform in the study participants (ICC > 0.75). This finding is consistent with the results reported by Ekayanti et al.[22], Mahjoona et al.[31], Doot et al.[42], and Kothari et al.[49], which confirms the stability of VEP responses in healthy adults and children and the technical robustness of the study. Meanwhile, other studies have suggested that the possible differences in VEP wave components between the right and left eyes can be influenced by factors such as loss of concentration, distractions during the test, and lack of fixation on the stimulator[50,51]. Accordingly, Mezer et al.[52] assessed the impact of fixation loss and distraction on pVEP wave recording. They found that deliberate defocusing of the image led to a reduction in the amplitude and an increase in the latency of the P100 wave in younger participants. In contrast, distraction through auditory tasks had no effect on the individual components of the VEP wave. Moreover, some studies included only one eye per participant in the statistical analysis, as the variability between the right and left eyes of the same participant is smaller than the variability observed between individuals[28].
This study has some limitations that should be addressed in future research. Anthropometric parameters, such as body mass index and head circumference, which can both affect VEP latency, were not recorded. Their inclusion is essential to create more accurate reference values. Furthermore, physiological parameters such as the general arterial blood pressure before the start of the test and the degree of the patient's rest, which can also affect the latency and amplitude values of the recorded potentials, were not evaluated[53,54]. In future studies, these conditions should be standardized to ensure that the physical and mental states of the participants are as comparable as possible. This will increase the repeatability and reliability of the results obtained. Furthermore, the absence of anatomical or neuroimaging assessment represents an additional limitation of this study, as potential structural determinants of VEP variability, such as skull thickness, cortical configuration, or optic nerve morphology, could not be analyzed[8].
-
This study's findings emphasize the need to consider demographic and technical factors when interpreting VEP recordings. Thus, each laboratory should have its own VEP reference values because the VEP signal is influenced by many factors such as stimulus duration, interstimulus interval, pupil size, age, sex, and refractive errors, visual acuity, size of the checkerboard elements, contrast, signal filtration, the position of the electrodes on the scalp, anatomical differences (such as the thickness of the skull bone), and the orientation of the occipital cortex in relation to the surface of the head. The study also provides important data for further electrophysiological research in the Polish population.
-
The study was conducted in accordance with the principles of the Declaration of Helsinki and Good Clinical Practice (GCP) guidelines. Ethical approval for the research was obtained from the Bioethics Committee of the Medical University of Bialystok, Poland (Resolution No. R-I-002/477/2019, dated 24 October 2019). All participants provided written informed consent prior to inclusion in the study.
-
The authors confirm contribution to the paper as follows: study conception and design: Lisowski Ł, Konopinska J; resources: Lisowski Ł, Sawicki M; investigation: Lisowski Ł, Lisowska J, Obuchowska I; methodology: Lisowska J, Obuchowska I; software, visualization: Błażowski J, Zarzecki M, Łabieniec Ł; validation: Błażowski J, Zarzecki M, Łabieniec Ł, Obuchowska I; project administration, supervision: Konopinska J; writing – original draft, writing – review & editing: Lisowski Ł, Lisowska J, Konopinska J. All authors reviewed the results and approved the final version of the manuscript.
-
The datasets generated and/or analyzed during the current study are available from the corresponding author on reasonable request.
-
None.
-
The authors declare that they have no conflict of interest.
- Supplementary Table S1 Normality assessment based on outcomes of Shapiro-Wilk test and statistics of skewness and kurtosis.
- Supplementary Table S2 Outcomes of multivariate mixed-effect models assessing impact of sex and age on analyzed parameters.
- Supplementary Fig. S1 Scatterplots representing correlations between age and selected parameters.
- Supplementary Fig. S2 Boxplots representing relations between sex and selected parameters.
- Copyright: © 2026 by the author(s). Published by Maximum Academic Press, Fayetteville, GA. This article is an open access article distributed under Creative Commons Attribution License (CC BY 4.0), visit https://creativecommons.org/licenses/by/4.0/.
-
About this article
Cite this article
Lisowski Ł, Lisowska J, Łabieniec Ł, Zarzecki M, Błażowski J, et al. 2026. Visual evoked potentials: normative values and sex differences in Polish Caucasian population. Visual Neuroscience 43: e006 doi: 10.48130/vns-0026-0005 

Visual evoked potentials: normative values and sex differences in Polish Caucasian population
- Received: 18 August 2025
- Revised: 25 November 2025
- Accepted: 03 December 2025
- Published online: 27 February 2026
Abstract: This study aimed to establish normative visual evoked potentials (VEPs) values in healthy Polish volunteers by examining 108 individuals (216 eyes). VEP results were analyzed for correlations with age, sex, and between eyes, and a linear mixed-effects model adjusting for age, sex, and laterality was used to account for interocular correlations. A positive correlation was found between age and N75 amplitude in the left eye when stimulated with a checkerboard pattern with a check size of 0.808°, while in the right eye, the correlation did not reach statistical significance. When using a larger checkerboard, sex-related differences in P100 amplitude were observed; however, they did not remain statistically significant after applying the Benjamini–Hochberg correction. In the multivariate model, sex remained an independent predictor of P100 amplitude. Given the myriad technical (e.g., stimulus parameters) and demographic (e.g., age, sex, and anatomical) influences on VEP morphology, these data emphasize the importance of adhering to standardized protocols for VEP examination, such as the International Society for Clinical Electrophysiology of Vision guidelines. The use of these standards harmonizes parameters across laboratories and enables wider comparison and application of normative data, ensuring assessment of visual pathway function and supporting further electrophysiological research in the Polish population.
-
Key words:
- Visual evoked potentials /
- Stimulus parameters /
- Normative data /
- Amplitude /
- Latency