


-
Amblyopia ("lazy eye") is a prevalent neurodevelopmental visual disorder stemming from abnormal visual experience early in life. Of the many visual deficits associated with amblyopia, impaired stereoacuity is among the most common, and it is functionally impactful and resistant to restoration with treatment[1−3]. Monocular deprivation (MD) via unilateral eyelid suture during the critical period is the predominant paradigm used to model and study amblyopia in animals[4,5]. MD elicits an ocular dominance (OD) shift in the primary visual cortex (V1), reflecting the loss of strength of the synaptic inputs from the deprived eye. Studies in cats and primates have shown that the primary locus of the underlying functional plasticity is the synaptic neuropil of V1 itself. To gain an understanding of the molecular mechanisms for such plasticity, work increasingly has focused on the mouse. The limitations of the mouse as a model to understand primate vision are numerous and include limited binocular vision, poor spatial acuity, and the absence of the columnar organization in V1 that is characteristic of carnivores and primates. Nevertheless, studies in mice have been instrumental in pinpointing changes at the molecular level that shift OD in V1 after MD. This work is directly relevant to the understanding of the most treatment-resistant form of amblyopia in humans, deprivation amblyopia, which arises from optical obstruction of the visual axis (e.g., by a cataract)[6].
Studies of MD in rodents have suggested novel treatment approaches to promote recovery from amblyopia after the critical period. These include environmental enrichment[7], dark exposure[8], pharmacologic retinal silencing[9,10], and ketamine[11,12]. Assays used to assess treatments' effectiveness typically include electrophysiological or optical measures of the visual responses in V1, and behavioral estimates of monocular spatial acuity. Reliable behavioral assays to study stereoscopic deficits in mice, however, are needed.
To test the stereoscopic depth perception of human infants, Gibson and Walk developed the visual cliff assay (VCA)[13]. The VCA comprises a glass plate atop a patterned floor with a sharp drop-off. Subjects with functional stereoscopic vision are inherently averse to the "cliff" side and tend to spend more time on the "safe" side. The VCA has been adapted for use in several animal species to assess the perception of stereoscopic depth[14−20]. The assay has been used in rats to study the development of depth perception and the role of early-life visual experience[14,15,19,20], including the effect of MD[20,21]. Although it was initially questioned whether mice are capable of visually perceiving depth[22], emerging evidence has demonstrated that mice are able to discriminate stereoscopic surfaces despite having a binocular visual field of only 40°[23−27]. The performance of mice in the VCA can be impaired by restricting vision to one eye, albeit modestly[28].
Recently, a modified version of the VCA has been described, called the pole descent cliff task (PDCT)[29]. In this task, mice descend a vertical pole to a conical platform which engages the upper visual field, where there is more binocular overlap in visual representations. The vertical pole is suspended over a glass plate divided into four quadrants; three of the four quadrants appear as a visual cliff using stereoscopic depth cues. Neurotypical mice, viewing with both eyes, will exit the pole onto the "safe" quadrant. Acutely closing one eye results in errors that increase as the apparent depth of the cliff quadrants increases. Although promising, its performance has not yet been shown to be sensitive to the disruption of stereopsis caused by deprivation amblyopia following long term MD (LTMD) in mice.
Robust and reliable behavioral assays of binocular vision are clearly needed to validate the functional outcomes observed in experimental treatment paradigms in mice. We therefore undertook the current study to test the utility of the VCA and PDCT to probe deficits in binocular vision in mice caused by LTMD.
-
All experimental procedures followed the guidelines of the National Institutes of Health and the Association for Assessment and Accreditation of Laboratory Animal Care International and adhered to protocols approved by the Committee on Animal Care at Massachusetts Institute of Technology (MIT) (No. 2403000639). Female and male C57BL/6 mice were housed in groups of two to five same-sex littermates beginning at postnatal Day 21 (P21) after being bred in the MIT animal colony. Mice had access to food and water ad libitum and were kept in a temperature-controlled room and maintained on a 12-hour light/dark cycle. Animals with any externally apparent congenital ocular abnormalities were excluded.
Eyelid suture
-
For the MD experiments, eyelid suture (or sham eyelid suture) occurred at P21. Mice were anesthetized via inhaled isoflurane (1%–3% in oxygen). Both eyes were inspected for abnormalities and kept lubricated using single-use artificial tears. The right eyelid was closed with two horizontal mattress sutures using 7-0 Prolene (Ethicon, polypropylene, 8648 G). The toenails on both forepaws and hind paws were trimmed. Littermate controls designated as the "sham" had their eyes re-opened immediately after being sutured shut. For reopening of the eye following LTMD, mice were anesthetized, and the sutures were removed from the deprived eye. Sham controls were kept under isoflurane for an equivalent amount of time. Mice whose eyelids were not fully shut at the time of eye reopening were excluded.
Visual cliff assay
-
The VCA was conducted in a quiet, temperature-controlled room during the 12-h light cycle. All mice had their whiskers trimmed 1 hour before performing the VCA to minimize the use of nonvisual cues during the test. The apparatus was modeled after that published by Han et al. and consisted of an open field behavioral box with acrylic black plexiglass walls and a transparent floor (42 cm × 42 cm × 30.5 cm), positioned on the edge of a laboratory bench with half the box on the table top (the "safe" side) and the other half extended over a floor 80 cm below (the "cliff" side)[30]. All walls were fully opaque, preventing the mice from obtaining monocular depth cues through the sides. A black and white striped cover was placed on the bench top and dropped down vertically to the floor to create the illusion of a cliff. At the start of each trial, the animals were placed on a Petri dish (1 cm in height) in the middle of the box facing the safe side, as illustrated in Fig. 1a. The Petri dish served to standardize the trial's initiation. A 1080P wide-angle ELP 100 fps USB camera with infrared capability was kept 52 cm above the plexiglass floor of the box and connected to a computer to record each session. The mice were brought to the same room as the apparatus and habituated for at least 30 min in their home cage before beginning each trial. All experiments were conducted under normal room lighting conditions during the light phase, except for a negative control performed in complete darkness. The trial began after the animal stepped off the Petri dish and ended 2 or 5 min later. The surface of the plexiglass chamber was cleaned with peroxigard between all trials. In all test–retest experiments, the chamber was rotated between trials for each animal to mitigate contributions by visual cues not related to the cliff.
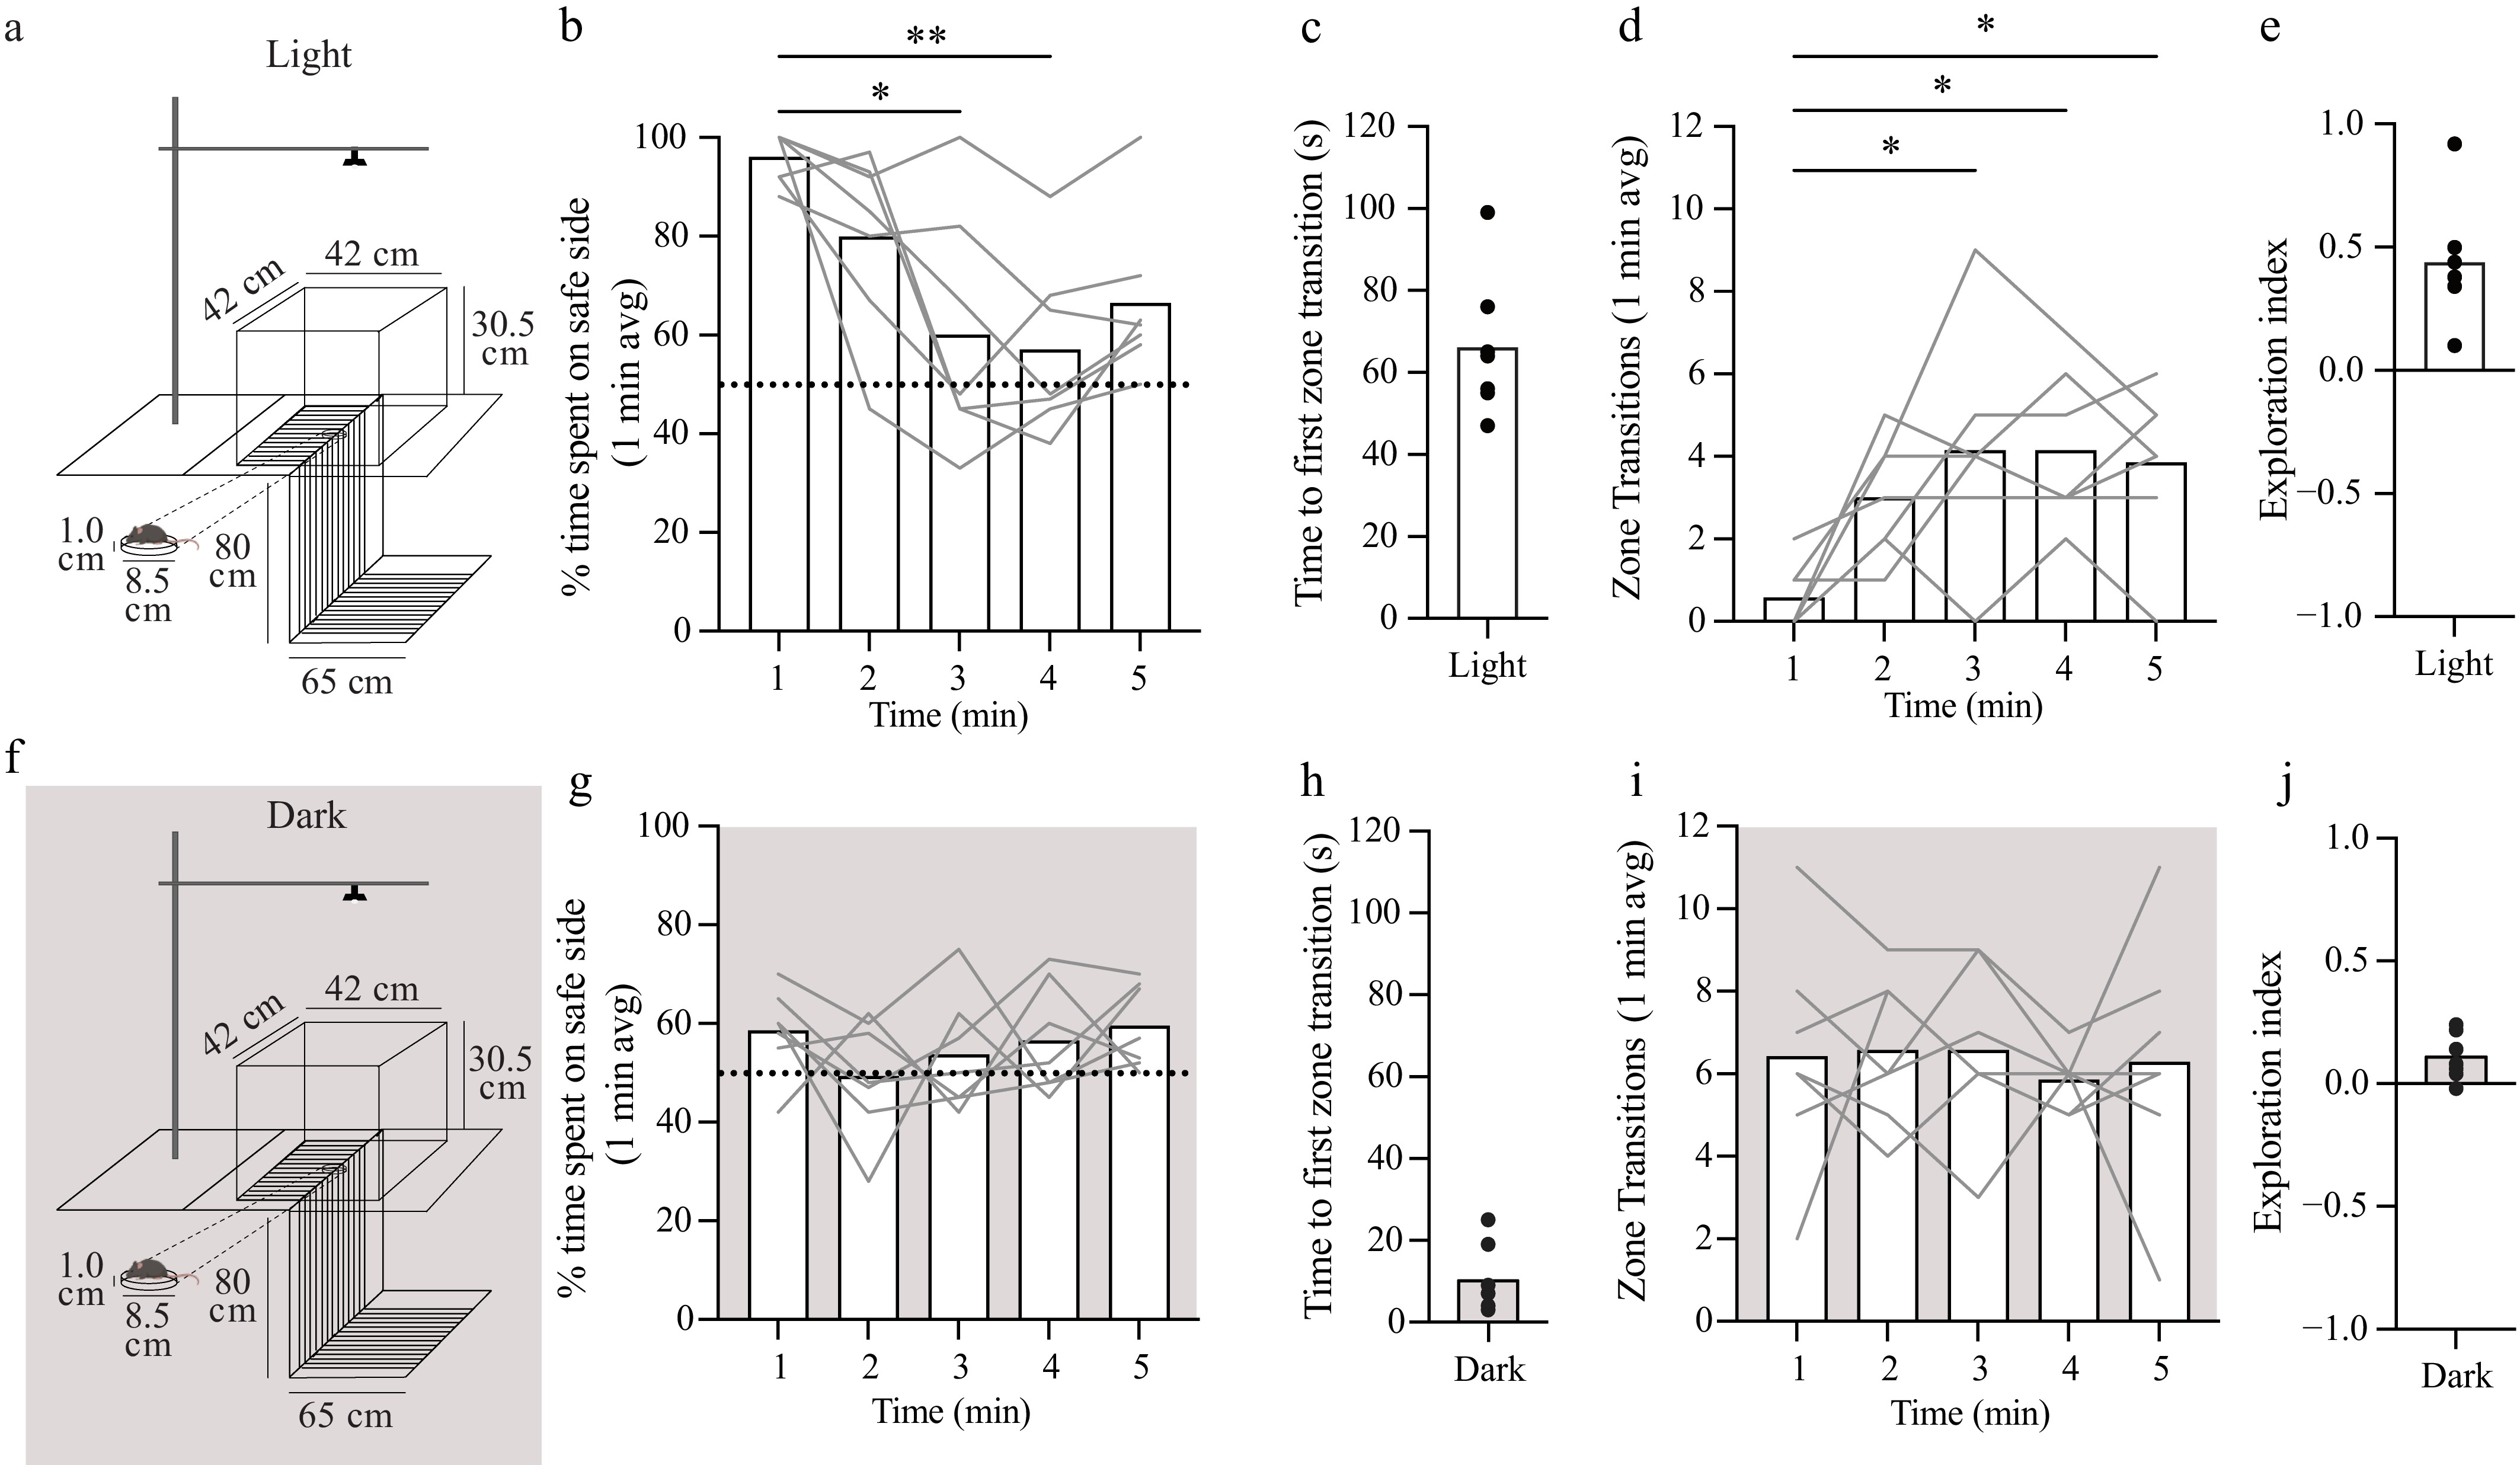
Figure 1.
VCA performance requires visual input. (a) Graphical design of the VCA with measurements of the box and table that were used. Animals were placed on a Petri dish (1 cm in height) in the middle of the platform facing the safe side and allowed to explore the arena for 5 min. (b) Percentage of time spent on the safe side (per minute) plotted as a function of test time. The dotted line (y = 50%) represents chance performance. (c) Time to the first zone transition from the safe to cliff side plotted as a function of test time. (d) The total number of transitions between zones plotted as a function of test time. (e) Exploration index ([Time on safe – Time on cliff] / Total time) over the 5-min test. (f) Graphical design of the VCA in the dark using a different cohort of animals. (g) Percentage of time spent on safe side in the dark (per min) plotted as a function of test time. Dotted line (y = 50%) represents chance performance. (h) Time to the first zone transition from the safe to cliff side in the dark plotted as a function of test time. (i) The total number of transitions between zones in the dark plotted as a function of test time. (j) Exploration index over the 5-min test in the dark. Mean values are represented as bars for each minute in each condition. Individual animals are represented as gray lines. Dunn's multiple comparison indicates statistical significance compared with the first minute in each condition: * < 0.05, ** < 0.01.
Visual cliff performance was scored manually using a stopwatch to calculate the percentage of time the mouse spent on the safe side, the number of zone transitions between sides, and the time of the first transition to the cliff side by an experimenter blinded to the mouse's condition. A zone transition was defined as all four limbs of the mouse crossing to the next zone. Manually scored metrics were confirmed using the open-source pose estimation software ezTrack (
https://eztrack.studio ), which was also used to measure the total distance traveled and locomotion for each animal. The exploration index (EI) was calculated as the difference in seconds between time on the safe and cliff sides divided by the total time in seconds, as previously described[31,32].Visual cliff assay – video processing and analysis
-
Video from mice performing the VCA was recorded using an ELP 2.0 megapixel USB camera (ELP-USBFHD05MT-KL170IR). Videos were trimmed prior to analysis to only show the time that the mouse spent performing the task. The criteria for video trimming consisted of setting the start of the modified video as the moment when the mouse was placed on the starting platform (the Petri dish lid) and running the video for the time allotted for the task (i.e., 5 min for the experiments in Fig. 1 and two min for the remainder of the experiments).
To visualize the mouse location data when performing the VCA, we relied on the open-source video analysis pipeline ezTrack (
https://github.com/denisecailab/ezTrack )[33]. Specifically, we used the LocationTracking_BatchProcess.ipynb (experiments in Fig. 2; test–retest) and LocationTracking_Individual.ipynb (experiments in Figs. 3 and 4) Python functions on a Jupyter Notebook. We followed the steps provided within the Jupyter Notebook to crop the video to specify the region that was included in the analysis. This step is important, since it removes the walls of the arena which might cause the ezTrack software to mistake the mouse for its reflections on the wall. Through the ezTrack functions, we manually selected two points at opposing edges of the box to obtain the distance (in pixels) and appropriately scale to its real-world value of 42 cm. In order to perform location tracking of the mice, we used the following values for the different parameters: loc_tresh = 99.9; method = dark. Other variables such as use_window, window_size, window_weight, rmv_wire, and wire_krn were not used for our analysis. The output data from running the location tracking algorithm was stored as a '.csv' file.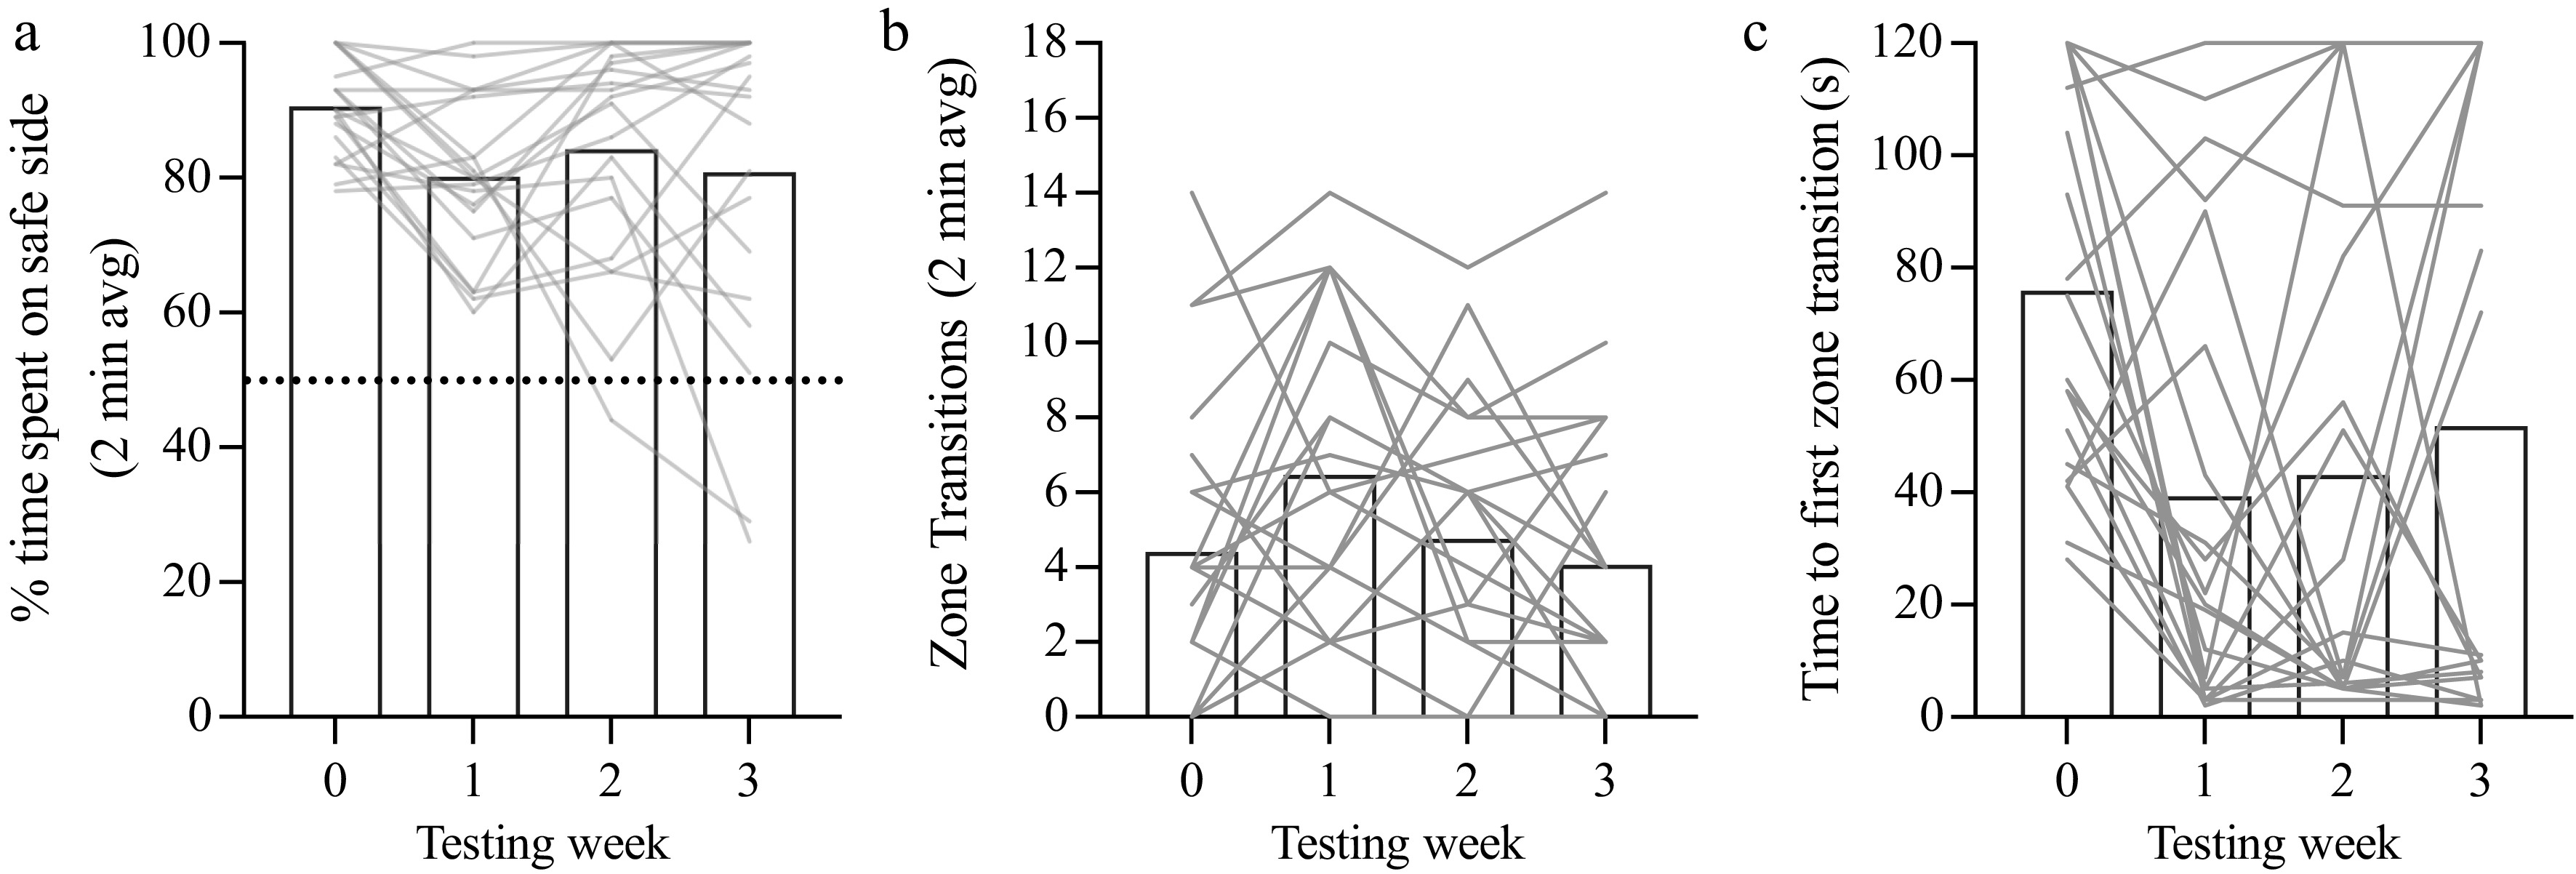
Figure 2.
Test–retest stability of VCA performance. (a) Percentage of time spent on the safe side (average over each 2-min trial) plotted as a function of testing week (1-week trial interval). The dotted line (y = 50%) represents chance performance. (b) Time to the first zone transition from the safe to cliff side plotted as a function of testing week. (c) The total number of transitions between zones plotted as a function of testing week. Mean values are represented as bars for each test week. Individual animals are represented as gray lines. Dunn's multiple comparison indicates statistical significance compared with Week 0: * < 0.05.
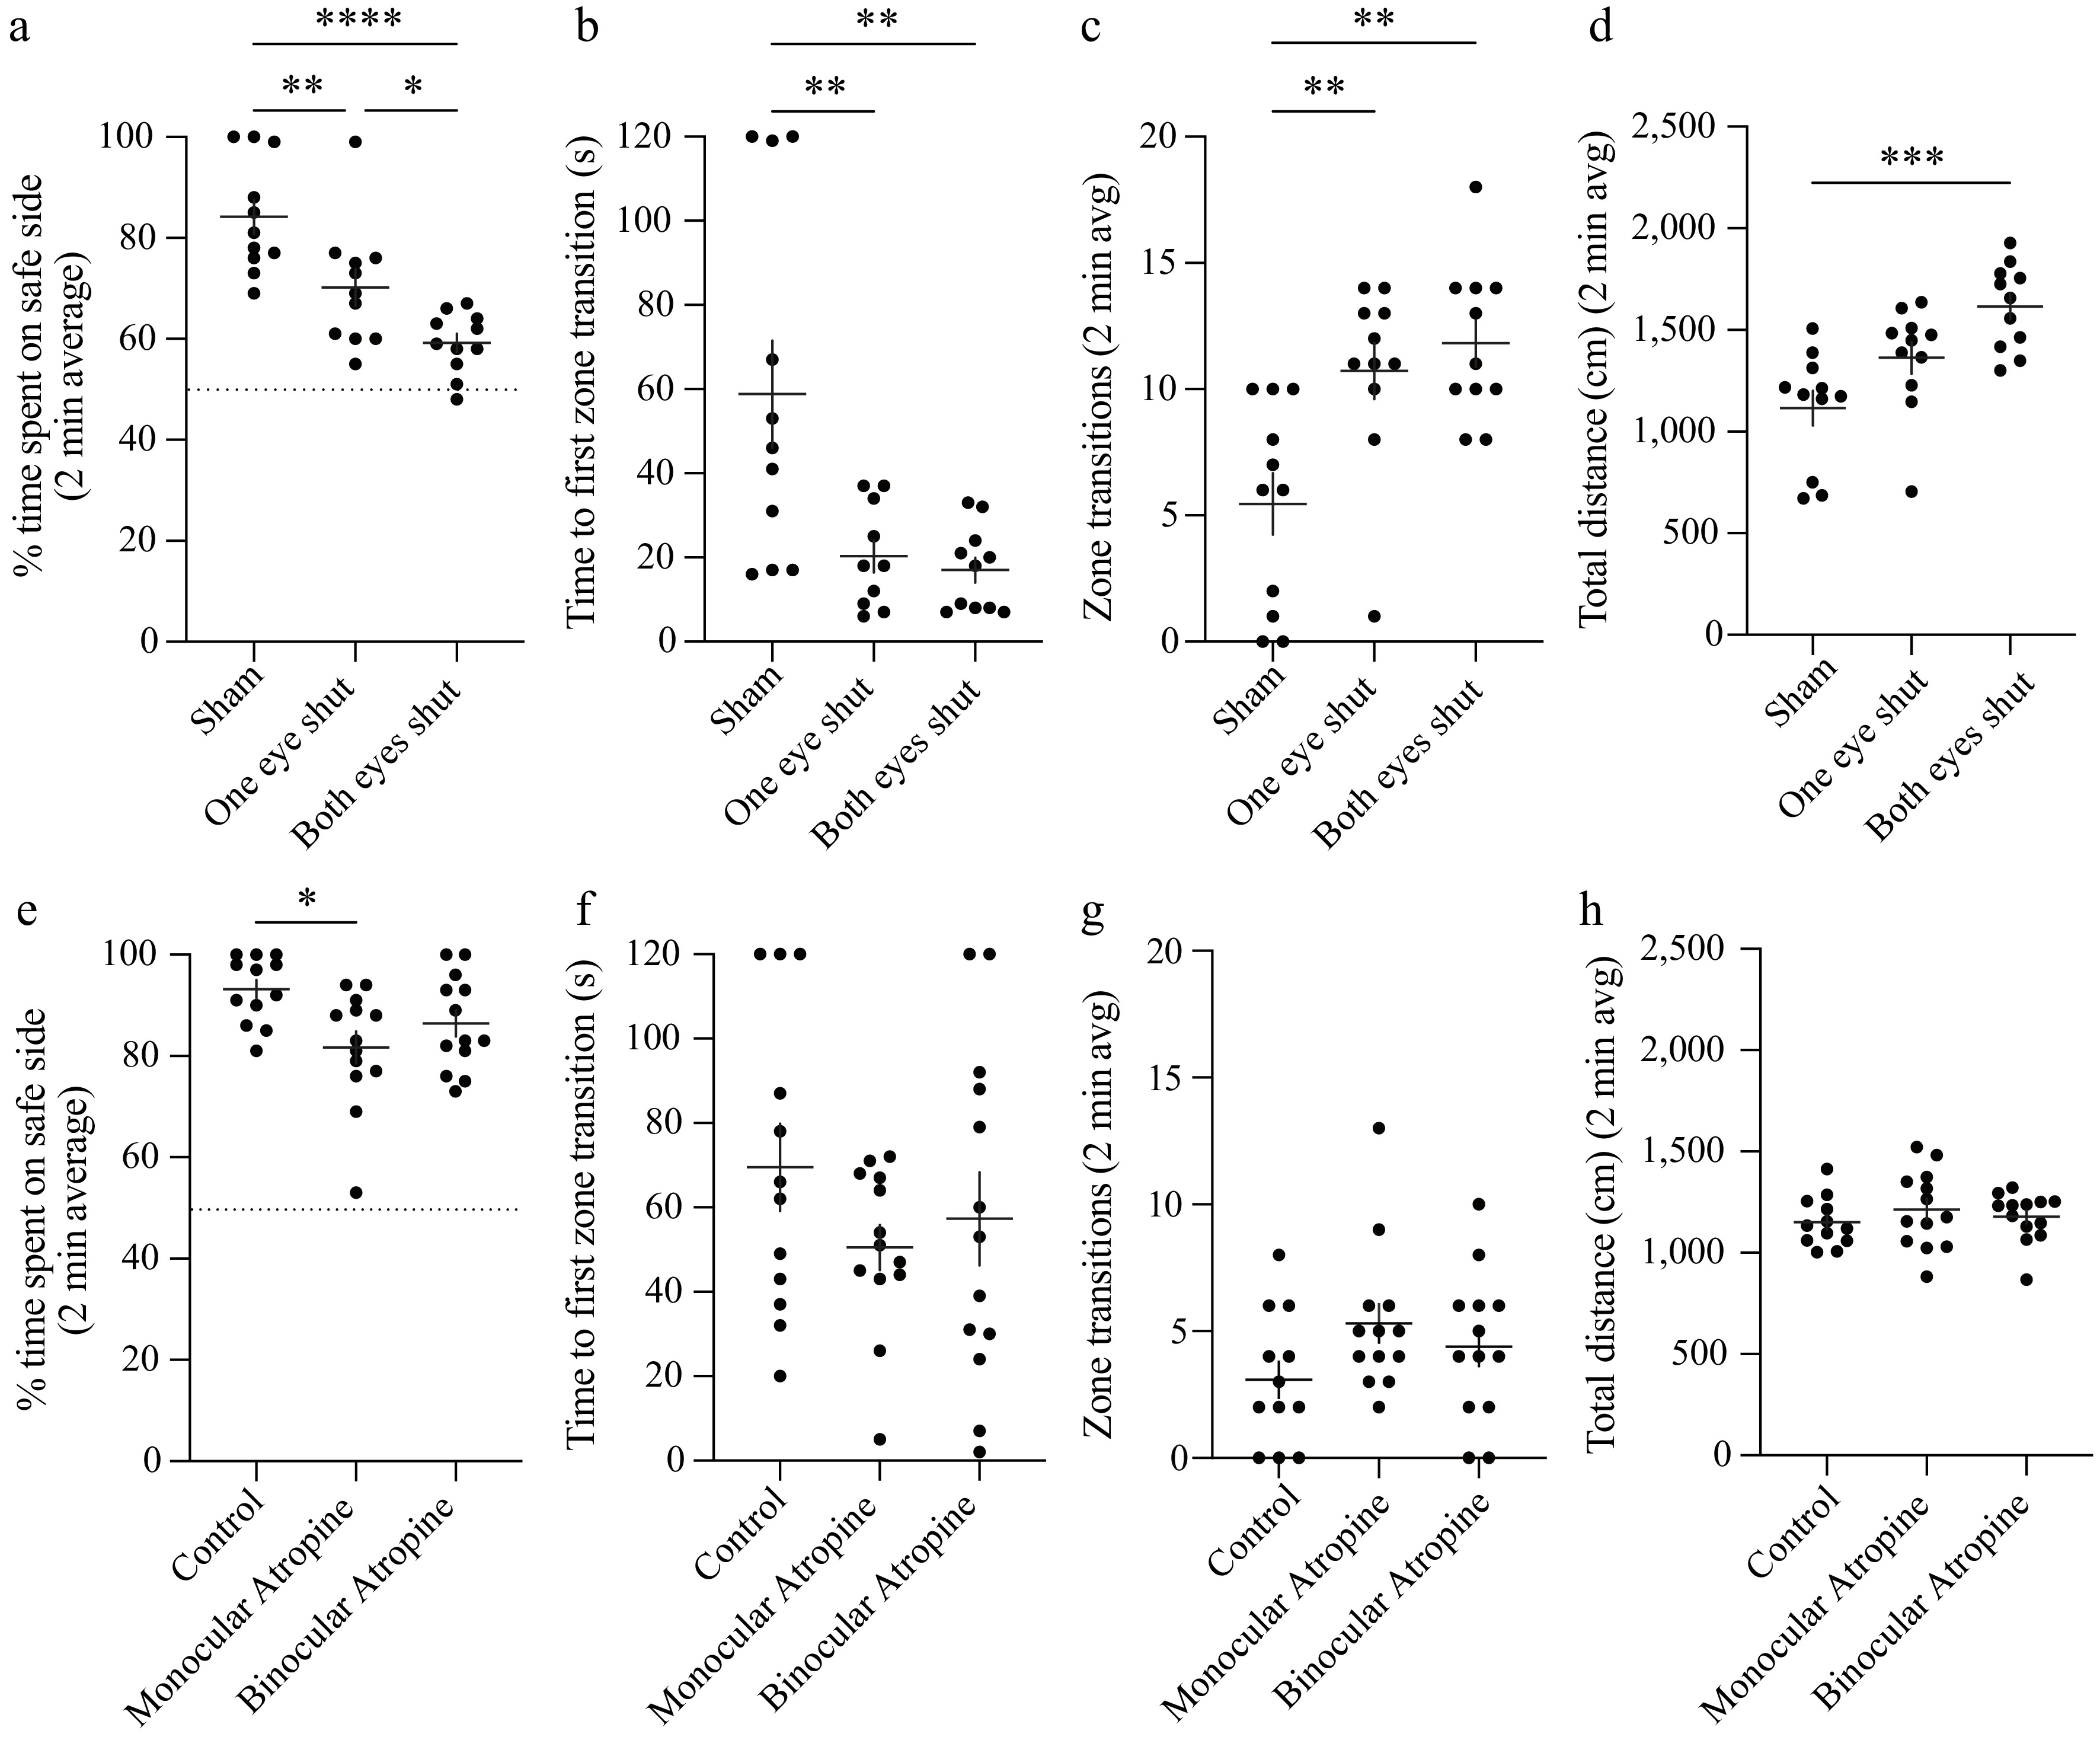
Figure 3.
Disruptions of binocularity impair VCA performance. (a)–(d) Animals performed the 2-min VCA with neither (sham), one, or both eyes sutured shut. (a) Percentage of time spent on the safe side plotted for each eye closure group. The dotted line (y = 50%) represents chance performance. (b) Time to the first zone transition from the safe to cliff side plotted for each eye closure group. (c) The total number of transitions between zones plotted for each eye closure group. (d) Total distance traveled during the test plotted for each eye closure group. (e)–(h) Animals performed the 2-min VCA after neither unilateral or bilateral pupillary dilation via administration of atropine eye drops. (e) Percentage of time spent on the safe side plotted for each atropine group. The dotted line (y = 50%) represents chance performance. (f) Time to the first zone transition from the safe to cliff side plotted for each atropine group. (g) The total number of transitions between zones plotted for each atropine group. (h) Total distance traveled during the test plotted for each atropine group. Individual animals are represented as circles, and the mean ± standard error of the mean (SEM) as black horizontal and vertical lines. Dunn's multiple comparison indicates statistical significance between groups: * < 0.05, ** < 0.01, *** < 0.001, **** < 0.0001.
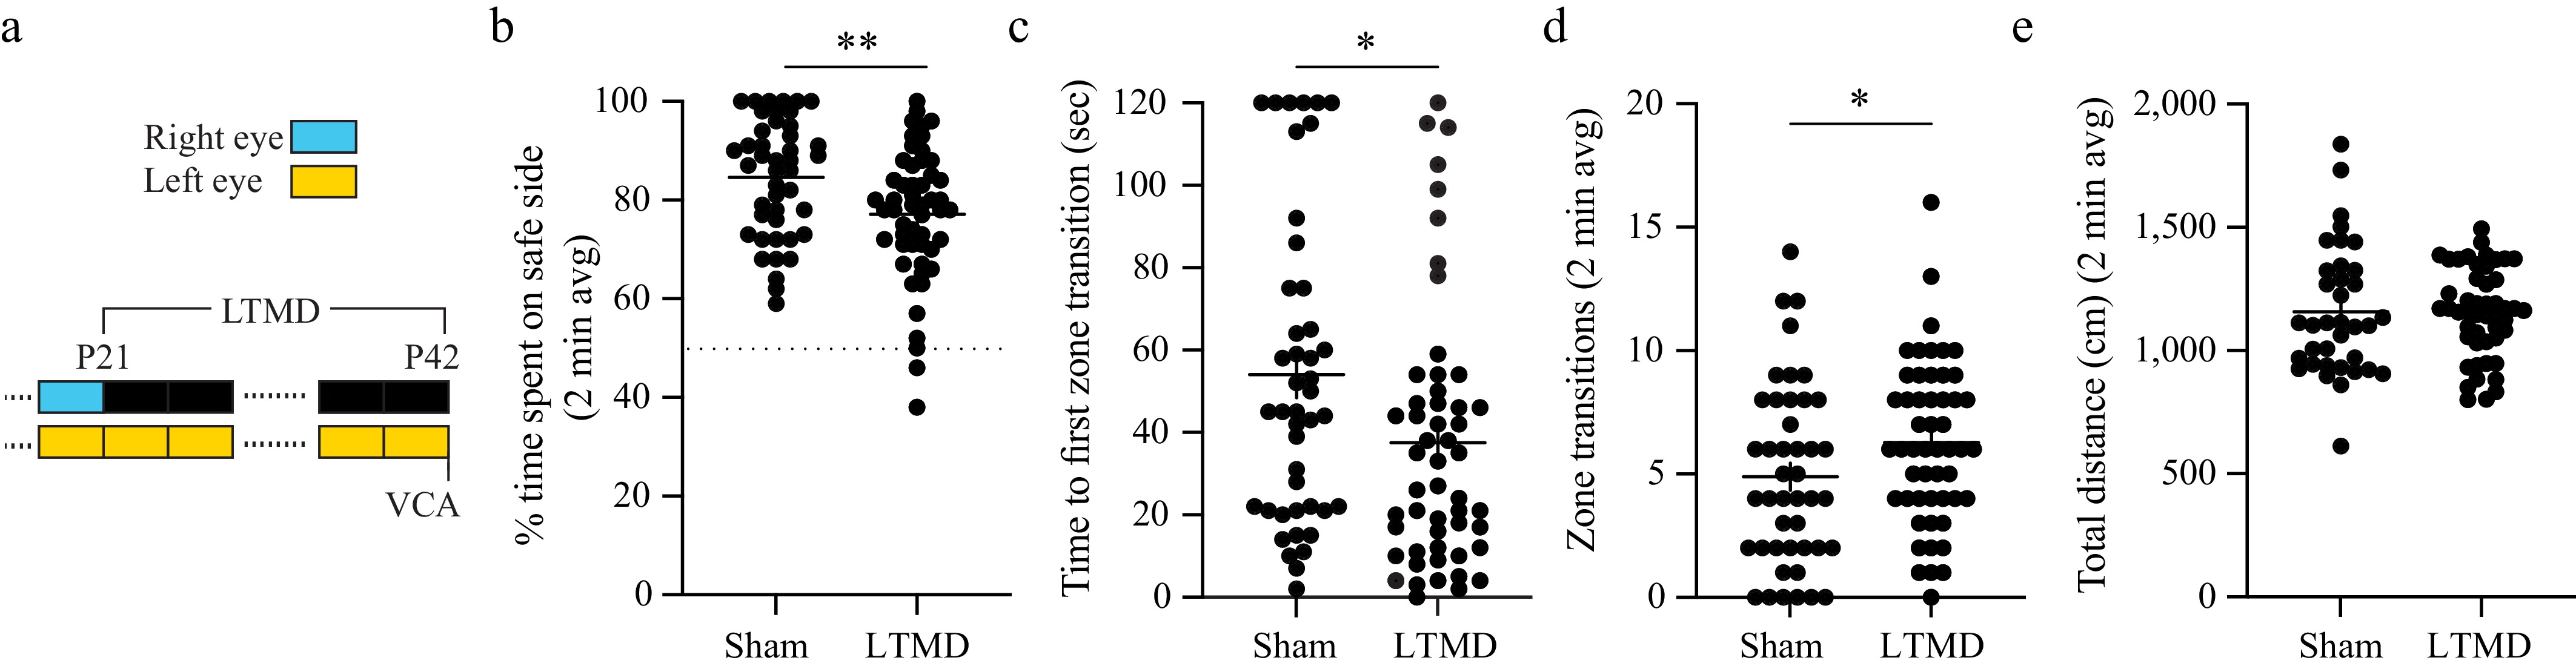
Figure 4.
LTMD causes stable binocular dysfunction in the VCA. (a) Experimental timeline showing LTMD (or sham closure) performed from P21 to P42. VCA was performed 1–3 h after eye opening (b)–(e). (b) Percentage of time spent on safe side plotted for each group. The dotted line (y = 50%) represents chance performance. (c) Time to the first zone transition from the safe to cliff side plotted for each group. (d) The total number of transitions between zones plotted for each group. (e) Total distance traveled during the test plotted for each group. Individual animals are represented as circles, and the mean ±SEM as black horizontal and vertical lines. Comparison representations of statistical significance between groups (Mann–Whitney) or between tests (paired Wilcoxon): * < 0.05, ** < 0.01.
The output data ('.csv') obtained from running the ezTrack software was imported into MATLAB (R2024b). Using custom scripts, we visualized individual mouse location trajectories to facilitate data curation and validation. To determine whether the sham and LTMD mice differed in their preferred routes through the arena, the behavioral chamber was divided into three predefined regions (14 cm × 42 cm per region). Zone transitions from the safe to cliff region were automatically detected and quantified using our custom analysis script. Representative location data and quantification can be found in Supplemental Fig. S1.
Pole descent cliff task
-
All PDCT experiments were conducted in a quiet, temperature-controlled room during the 12-h light cycle. The main apparatus (used in Fig. 5a) was modeled after Boone et al.[29] and consisted of an open field behavioral box with acrylic black plexiglass walls (42 cm × 42 cm × 30.5 cm) placed above museum glass. A round wooden dowel (pole) 3.5 cm in diameter was screwed into a 75-mL Erlenmeyer glass flask with a base 9 cm in diameter (a total combined height of 52 cm). The pole and flask were covered with antislip silicone sleeves, texturized with shelf and cabinet grip liner, and spray-painted white. The flask was weighted with sand, and a spacer was glued to the center bottom, allowing it to hover 1.5 cm above the museum glass. A platform covered with a 2.5 cm × 2.5 cm black and white checkerboard pattern was placed 23 cm below the glass. Another platform, covering one quadrant of the glass, was also covered in the same pattern and placed immediately beneath the glass (the safe quadrant). The pole was positioned in the center of the museum glass. A 1080P wide-angle ELP 100 fps USB camera with infrared capability was mounted 65 cm above the plexiglass floor of the box and connected to a computer to record each session.
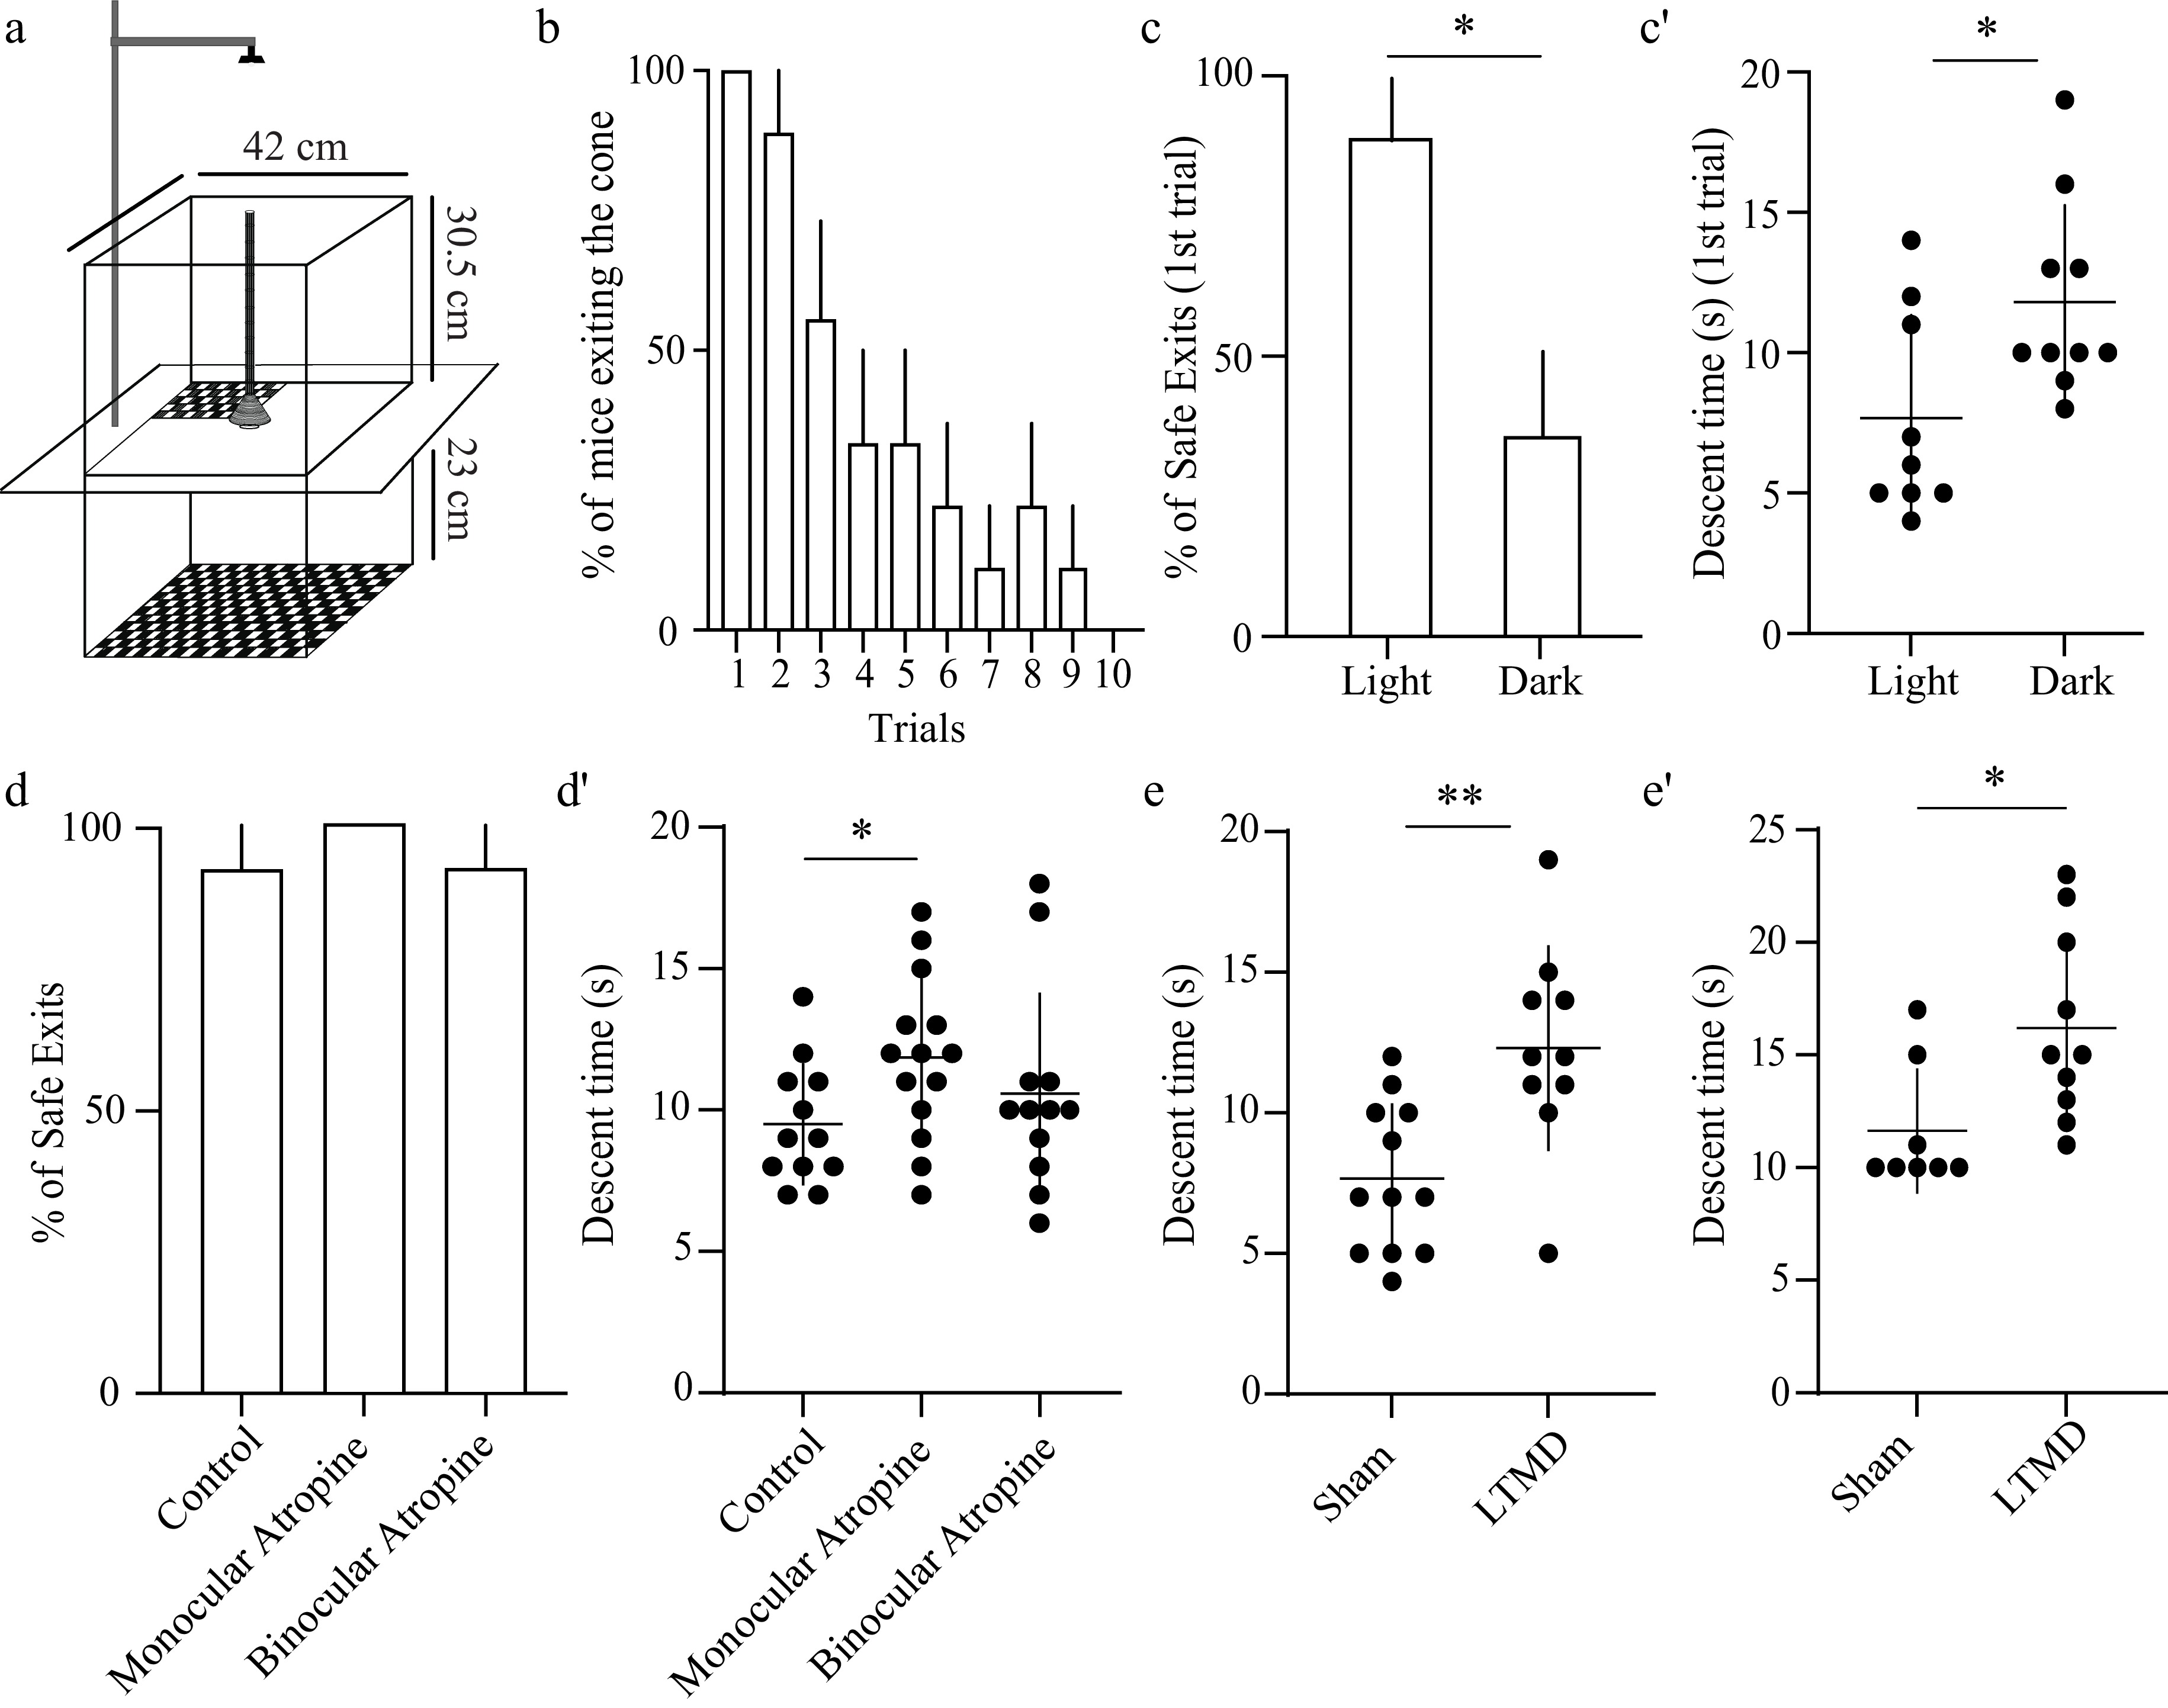
Figure 5.
Disruptions of binocularity and LTMD impair descent time in the PDCT. (a) Graphical design of the PDCT apparatus with measurements that were used. Mice descend a pole positioned above a cone (9 cm in diameter) placed on a glass plate. One quadrant is positioned 1.5 cm below the cone; the remaining three are 24.5 cm below the cone. All quadrants are covered with black and white checkerboard. (b) Percentage of mice that exit the pole and cone onto any quadrant across 10 interleaved trials, each lasting 3 min. Dunnett's multiple comparisons testing relative to Trial 1 revealed p < 0.05 or less for Trials 4–10. (c) Percentage of safe exits (exit to the quadrant 1.5 cm below the cone) under normal lighting conditions and in complete darkness. (c') Descent time (the time taken to descend the pole) under normal lighting conditions and in complete darkness. (d) Percentage of safe exits of animals after neither unilateral nor bilateral pupillary dilation via administration of atropine ointment. (d') Descent time plotted for each atropine group. (e) Descent time plotted for the sham and LTMD animals. (e') Independent replication of LTMD's effects on descent time using the modified configuration. Bar graphs: mean ± SEM; scatter plots: mean ± SD. Individual animals are represented as circles. Unpaired t-test between groups: * p < 0.05, ** p < 0.01.
In a separate set of experiments (Fig. 5e), the apparatus was modified to more closely match the specifications reported by Boone et al.[29]. A thinner round plastic dowel (1.2 cm in diameter) was inserted into a 25-mL Erlenmeyer glass flask with a 6-cm-diameter base (the total combined height remained 52 cm). The flask and pole were similarly covered with antislip silicone sleeves, textured with shelf and cabinet grip liner, and spray-painted white. The same open field behavioral box and platform arrangement were used as described previously, except the checkerboard pattern on the platforms measured 2 cm × 2 cm. In addition to the overhead camera, two lateral cameras were positioned on opposite sides of the box to focus on the safe platform. These side-view recordings provided improved visibility and confirmation of quadrant exits (safe vs. unsafe), facilitating more accurate scoring.
For both setups, the mice were individually handled for at least two days (5 min each day) prior to testing. On the day of testing, their whiskers were trimmed, and the mice were brought to the behavioral testing room for a minimum of 30 min of habituation in their home cage. For the main configuration only, the mice were additionally allowed to freely explore the open field box for 5 min before each trial, with the checkerboard platform positioned directly below the glass and the pole placed at the center. At the end of this session, each mouse was allowed to descend the pole once. During the actual trial, the lower platform was placed 23 cm beneath the glass, and the position of the safe quadrant was rotated every one or two mice to avoid side bias from external cues. Mice were placed on the top of the pole facing downward to motivate descent, and all behavior was recorded for later analysis. In all experiments, the mice were allowed to self-initiate descents without repositioning or manual intervention, resulting in one or two uninterrupted descents per mouse. Mice that did not self-initiate a descent were excluded from the analysis. Between animals, the apparatus was cleaned with peroxigard to eliminate odor cues. Cohorts of male mice were tested to completion before female cohorts.
For video analysis, manual scoring was performed to determine the quadrant (safe/unsafe) each mouse exited to, as well as the time taken to descend the pole. Descent time measurement began after the mouse had placed all four paws on the vertical surface of the pole and initiated a directed downward movement (i.e., exploratory or reorienting behavior at the top of the pole was not included) and ended when it exited the pole and cone with all four paws. Experimentation and analysis were conducted by an experimenter blinded to the group and intervention.
Experimental design and statistical tests
-
Pilot experiments were run for each study using three to five animals (not included in the final data), and the necessary sample sizes were calculated using G* power[34]. All other statistical testing was performed using GraphPad (Prism version 9.0 for Mac, GraphPad Software, San Diego, California USA). The normality of all datasets and groups was tested using the Shapiro–Wilk normality test. Datasets containing non-normally distributed data were tested using nonparametric tests (Kruskal–Wallis, Friedman, or Wilcoxon tests). Normally distributed data were analyzed by analysis of variance (ANOVA) or t-tests. Here, p < 0.05, adjusted for multiple comparisons, was considered statistically significant in all cases.
-
To characterize the VCA, we first quantified the inherent tendency of mice to stay on the safe side under normal lighting conditions. Female and male mice (P45–58, n = 7) were placed on the middle of the apparatus (Fig. 1a) facing the safe side and allowed to freely explore the arena for 5 min as previously described[28,30]. Sessions were video-recorded from above, and the behaviors were scored as the percentage of time spent on the safe side per minute (Fig. 1b), the time to the first zone transition (Fig. 1c), and the number of transitions between zones per minute (Fig. 1d). Performance did not differ between female and male mice, so data from both sexes were combined for all analyses. On average, animals spent 96.0% ± 4.8% (95% confidence interval [CI]) of the first minute on the safe side. A nonparametric repeated Friedman test showed the main effect of test time on the proportion of time spent on the safe side over the 5-min test (p = 0.0060). Pairwise comparisons revealed that time spent on the safe side decreased significantly to 60.0% ± 22.2% (∆ = 37.5%; p = 0.0162) and 57.0% ± 22.2% (∆ = 40.6%; p = 0.0021) during the third and fourth min, respectively (Fig. 1b). On average, animals made the first zone transition to the cliff side at 66.0 ± 15.9 s (Fig. 1c). The repeated Friedman test showed a main effect of test time on the number of zone transitions (p = 0.0088). We observed a significant increase in the number of zone transitions by the third (first min: 0.6 ± 0.7, third min: 4.1 ± 2.5; p = 0.0211), fourth (4.1 ± 1.7; p = 0.0162), and fifth min (3.9 ± 1.8; p = 0.0211) (Fig. 1d). The exploration index (EI), a standard single measure of VCA performance[31,32], was 0.44 ± 0.23 (Fig. 1e).
To evaluate the contribution of vision, we tested VCA performance in complete darkness in a separate cohort of animals (P45–58, n = 7) (Fig. 1f). On average, animals spent 58.6% ± 8.2% of the first minute on the safe side (Fig. 1g), significantly less than in the light (p = 0.0006; Mann–Whitney test). Repeated measures ANOVA showed no effect of test time on the proportion of time spent on the safe side (p = 0.3765) (Fig. 1g), which ranged between 49.3% and 59.6% over the 5-min test. On average, animals made the first zone transition to the cliff side at 10.1 ± 7.9 s (Fig. 1h), significantly sooner than in the light (p < 0.0001, unpaired t-test). Repeated measures ANOVA showed no effect of test time on the number of zone transitions (p = 0.8995) (Fig. 1i). The EI was significantly decreased in the dark (0.11 ± 0.09) compared with the light (p = 0.0006, unpaired t-test) (Fig. 1e vs j). Taken together, these data unambiguously indicate that vision is required for normal performance on the VCA in mice, and that visual cues deter zone transitions in the first 2 min of the test.
Test–retest stability of VCA performance
-
Recognizing that experiments involving a treatment or intervention may benefit from multiple runs of the VCA by the same animals, we next examined the test–retest reliability. We modified the assay to only test animals for 2 min to avoid habituation to the cliff side in the first trial (see Fig. 1). A new cohort of female and male mice (P48–68, n = 20) was run 4 times at 1-week intervals. The repeated measures Friedman test showed a borderline, but ultimately statistically nonsignificant, effect of trial number on the percentage of time spent on the safe side (p = 0.0589) (Fig. 2a). Given the marginal effect of trial number and our objective to assess repeatability over weeks, we examined pairwise comparisons. Between Week 0 and Week 1, there was no significant change in time spent on the safe side (p = 0.0825). There was a main effect of trial number on the time to the first zone transition (p = 0.0248) that was carried by a decrease between the first and second trial (Fig. 2b, p = 0.0212). There was a main effect of trial number on the number of zone transitions (p = 0.0218), with no pairwise differences with the first trial (Fig. 2c, p-values > 0.15). Thus, the VCA performance remained relatively stable over the weeks.
Acute disruptions of binocularity impair VCA performance
-
Knowing that VCA performance requires vision, we next tested the contribution of binocularity in the 2-min test. VCA performance has previously been shown to drop under monocular conditions (with one eye sutured closed) in both rats[20] and mice[28], so we began by attempting to replicate this result. Male and female mice (P42–60, n = 11 per group) had one or both eyes sutured closed under isoflurane anesthesia 1–3 h prior to VCA testing. Control (sham) animals underwent the same manipulations, but their eyes were immediately re-opened. Eye closure decreased performance in a dose-dependent manner across all metrics (Fig. 3a–d). ANOVA showed a main effect of eye closure on the percentage of time spent on the safe side (p < 0.0001). Time spent on the safe side decreased by 14.0% with one eye closed (p = 0.0082) and 29.7% with both eyes closed (p < 0.0001) (Fig. 3a). There was a main effect of eye closure on time to the first zone transition (p = 0.0013) with a decrease of 38.5 ± 8.8 s with one eye closed (p = 0.0068) and 11.2 ± 6.7 s with both eyes closed (p = 0.0025) (Fig. 3b). There was a main effect of eye closure on the number of zone transitions (p = 0.0006) (Fig. 3c), with an increase of 5.3 ± 2.5 with one eye closed (p = 0.0085) and 6.4 ± 2.1 with both eyes closed (p = 0.0019). The dose-dependence of eye closure on VCA performance corroborates the dependence of the VCA on vision (Fig. 1) and also suggests a contribution of binocular function. Considering that differences in movement may confound VCA performance comparisons between groups, we used open-source pose estimation software (ezTrack[35] to quantify the total distance traveled during the 2-min test. There was a main effect of eye closure on the total distance traveled (p = 0.0006) (Fig. 3d). Group comparisons revealed a significant increase of 501 cm (45%) in total distance traveled when both eyes were closed (p = 0.0009) but no significant change when only one eye was closed (248 cm; p = 0.0990). Therefore, we can at least partially attribute VCA performance deficits under monocular conditions to a lack of binocularity.
Monocular occlusion significantly narrows the visual field, particularly in mice, and could influence VCA performance, which is globally dependent on vision (Fig. 1). To better delineate whether VCA performance is dependent on balanced binocular inputs rather than a narrowing of the visual field, we next tested the influence of optical manipulations. Spherical aberration degrades spatial acuity and stereopsis, particularly with interocular disparity[36]. The optics of the murine eye impart significant susceptibility to optical aberration as a function of pupil size[37], likely owing to the relative sphericity of the lens. We applied atropine to dilate the pupil of one or both eyes and tested the animals for 2 min via the VCA ≥ 60 min later (P38–42, n = 12–13 per group, Fig. 3e–h). ANOVA showed a main effect of atropine on time spent on the safe side (p = 0.0160). Group comparisons revealed that monocular atropine decreased the percentage of time spent on the safe side by 11.5% (p = 0.0083) whereas binocular atropine imparted no significant change (p = 0.1464) (Fig. 3e). Atropine imparted no main effect on the time to the first zone transition (p = 0.3551) (Fig. 3f) or the number of zone transitions (p = 0.1826) (Fig. 3g). In contrast to eye closure, atropine imparted no change in total distance traveled during the test (p = 0.5630) (Fig. 3h). Therefore, the effect of atropine on time spent on the safe side can be attributed to binocular imbalance. These data demonstrate that disruption of optically matched binocular input is sufficient to impair VCA performance.
Amblyopic mice demonstrate binocular dysfunction in the VCA
-
We next tested the effects of amblyogenic rearing. Female and male mice underwent 3 weeks of LTMD or sham eyelid closure/opening from P21 to P42 and were tested on the VCA 1–3 h after eye opening (Fig. 4a). To ensure the study was adequately powered to detect meaningful group differences, an interim power analysis was performed after testing the first cohort of the sham control (n = 14) and LTMD (n = 14) animals. According to this analysis, with a Type I error rate set at 5% (two-sided) and a desired power of 80%, a sample size of 44 animals per group was determined. Amblyopic mice (sham control, n = 44; LTMD, n = 52) showed impaired performance across all VCA metrics (Fig. 4b–d). LTMD decreased time spent on the safe side by 7.5% compared with the control animals (p = 0.0070) (Fig. 4b). LTMD decreased the time to the first zone transition by 16.5 s (20.6%) (p = 0.0243) (Fig. 4c) and increased the number of zone transitions (p = 0.0393) (Fig. 4d), but there were no differences between sham and LTMD mice in the routes taken when transitioning from the safe to the cliff side (Supplementary Fig. S1). LTMD had no effect on total distance traveled (p = 0.6218) (Fig. 4e), suggesting that amblyopia does not increase ambulatory movement the way occlusion does. Together, these data demonstrate that LTMD imparts an amblyopic deficit in binocular function in mice, to which multiple VCA metrics are sensitive.
The PDCT reveals visual deficits following acute disruption of binocularity
-
Previous behavioral work has demonstrated that mice use binocular information in the PDCT to infer depth and exit the pole onto the safe quadrant[29]. We attempted to replicate these results and began by quantifying the overall tendency of mice to exit the pole. Female and male mice (P75–P110, n = 9) were placed on the pole facing downwards to motivate descent (Fig. 5a). Sessions were video-recorded from above, and behaviors were quantified as the percentage of exits. Performance did not differ between female and male mice, so data from both sexes were combined for all analyses. Repeated measures ANOVA revealed a significant effect of trial on the percentage of mice exiting the pole onto any of the four quadrants (p = 0.0003), with a marked reduction observed from Trial 4 onwards across the 10 interleaved 3-min trials (Fig. 5b). Although 100% of mice exited the pole on the first trial, only 33.3% ± 16.7% exited on the fifth trial and no mice exited on the tenth trial (Dunnett's multiple comparisons: Trial 1 vs. Trial 5, p = 0.0224; Trial 1 vs. Trial 10, p < 0.0001). These findings differ from published results obtained using the PDCT. Boone et al.[29] reported 10–15 exits per mouse by repeatedly repositioning the animals back onto the top of the pole whenever they failed to initiate a descent or engaged in nondescending behaviors. In the absence of such interventions, we found that the mice reliably self-initiated one or two descents. Because repeated trials could not be obtained under these minimally handled conditions, we adopted a single-trial PDCT paradigm. To evaluate the contribution of vision, as with the VCA, we next tested PDCT performance under normal lighting conditions and in complete darkness using two separate cohorts of animals (P65–P95, n = 9–10 per group) (Fig. 5c). On average, 88.9% ± 11.1% of animals exited the pole onto the safe quadrant under normal lighting conditions, whereas only 36.3% ± 16.1% of animals exited onto the safe quadrant in darkness (p = 0.015, unpaired t-test). These findings indicate that vision is required for performance in the PDCT. While observing the animals' behavior over the course of the assay, we noticed that animals tested in darkness took longer to descend the pole. The lack of visual cues in darkness prevents mice from using vision to gauge distances, which likely results in slower descent times. We quantified the descent time and found that animals tested in darkness took significantly longer to exit the pole (11.8 ± 3.6 s) than animals tested in the light (7.6 ± 3.7 s, p = 0.021, unpaired t-test). Taken together, these findings demonstrate that vision is required for descending and exiting the pole onto the safe quadrant in the PDCT.
We next tested whether binocularity is required for PDCT performance. Using the VCA, we had found that monocular atropine and eye suturing produce comparable deficits in performance, as measured by time spent on the safe side (Fig. 3). Because atropine is simple to apply, does not narrow the visual field, and may better approximate the effect of amblyopia, we focused on this manipulation in the PDCT. Atropine was applied to one or both eyes, and the animals were tested via the PDCT ~60 min later when pupil dilation was maximal (P55–65, n = 13–14 per group, Fig. 5d,d'). Though atropine imparted no main effect on mice exiting the pole onto the safe quadrant (control: 92.3% ± 0.7%, monocular atropine: 100%; binocular atropine: 92.8% ± 0.7%, p = 0.60, Fig. 5d), hypothesis-driven group comparisons revealed that monocular atropine significantly increased the descent time compared with controls (p = 0.02, unpaired t-test) and binocular atropine did not (p = 0.38, unpaired t-test, Fig. 5d'). These findings indicate that the PDCT metric "safe/unsafe exit" may not be sensitive enough to detect subtle imbalances in binocular vision. In contrast, disruption of optically matched binocular input is sufficient to impair pole descent time in the PDCT.
Amblyopic mice demonstrate binocular dysfunction in the PDCT
-
We next tested the effects of amblyogenic rearing via the PDCT. Female and male mice (n = 8–10 per group) underwent 3 weeks of LTMD or sham eyelid closure/opening from P21 to P42 and were tested on the PDCT 1–3 hours after eye opening, as shown in Fig. 4a. Similar to our previous experiment using atropine, we found that induction of amblyopia by LTMD had no effect on the success of mice exiting the pole onto the safe quadrant (sham: 100%, LTMD: 100%, data not shown). However, LTMD significantly increased the descent time compared with the sham controls (p = 0.008, unpaired t-test, Fig. 5e). These findings indicate that LTMD is sufficient to impair pole descent time in the PDCT.
Together, these experiments revealed that increased descent time rather than a decreased percentage of safe exits reports an imbalance in vision between the two eyes. To confirm this result in a separate set of experiments, mice that underwent 3 weeks of LTMD were tested using a second version of the PDCT apparatus that more closely resembled the configuration described in a previous study[29]. Although the physical dimensions of the apparatus differed from the first experiment (see Methods), the behavioral effects of LTMD were comparable. Again, LTMD had no effect on pole–platform exit choice but significantly increased the descent time compared with the sham controls (p = 0.017, unpaired t-test, Fig. 5e'), independently replicating the effect of amblyopia on the task and validating the modified configuration for future use.
-
We characterized the VCA and PDCT as methods to study binocular perceptual deficits in mice. Mice are the preferred species to study the experience-dependent neuroplasticity of visual processing despite their important differences from humans with respect to neuroanatomy and the circuitry of the visual system[38]. Mechanistic studies in mice are best validated through behavioral studies that demonstrate functional relevance. Here, we provide evidence that the VCA and PDCT rely on balanced binocular inputs for optimal performance in mice. Both assays have advantageous features, including relatively fast execution, no need for operant training, and readout through several simple metrics. However, the assays also have important limitations, as evidenced through our results, that should be weighed carefully when considering their use.
Impairments in binocular function are detected by the VCA, but effect sizes are modest
-
Monocular occlusion, pupillary dilation (and consequential optical aberration), and amblyopia all degraded performance in the VCA, supporting the conclusion that binocular sensory integration is required for the task. Monocular pupillary dilation significantly reduced the percentage of time spent on the safe side, whereas bilateral atropine did not (Fig. 3e), highlighting the need for balanced visual input in binocular integration. Monocular blur more significantly degrades stereopsis compared with binocular blur[39,40]. However, the manipulations that disrupted binocular function did not drive VCA performance to the levels we observed for animals in the dark (Fig. 1g–j) or with both eyes closed (Fig. 3a–c). One explanation could be that the manipulations of binocular function in our studies, such as unilateral pupillary dilation and amblyopia after LTMD, may only partially disrupt binocular function. However, this is unlikely to be the sole explanation for the difference, as the unambiguous loss of binocular function caused by closing one eye similarly did not reduce performance to the levels observed in darkness or with both eyes closed.
Another explanation is that VCA performance can be partially maintained using monocular cues. One mode by which animals can detect depth is by discerning changes in monocular cues with movement, called motion parallax[41,42], and this may account for the partial effects of the complete disruption of binocularity on VCA performance seen with monocular occlusion. Although we did not test acutely monocularly occluded animals (unilateral eyelid suture just prior to VCA testing in adulthood; Fig. 3a–c) directly alongside those who were rendered amblyopic (LTMD through the critical period; Fig. 4b–d), the apparently better performance by the latter cohorts supports a potential effect of adaptation to monocular conditions and learned reliance on monocular cues. The impact of monocular cues is an unavoidable potential confounder in the VCA.
The main limitation in using the VCA to detect deficits in binocular function in mice is the relatively small effect sizes (7%–14%), which we found consistently across experiments and VCA metrics. Our observations are consistent with those reported previously in mice[28], although that study reported a larger effect of MD (~20%) when tested in younger animals during the critical period. Modest effect sizes limit the utility of this assay to detect partial improvement after an experimental treatment. According to our observations in amblyopia caused by 3-week LTMD from P21 (Fig. 4), to achieve 80% power, hypothetical treatments restoring 100%, 75%, and 50% binocular function would require 42, 73, and 165 animals per group to statistically demonstrate an effect. We made multiple iterations of and adjustments to the VCA to address this limitation without success.
The PDCT is a recently developed approach to study deficits in binocular vision in amblyopic mice
-
While the VCA has a rich history of use in species from rodents to humans[13,20,43], only one prior study has described and applied the PDCT to evaluate binocular vision in depth perception in mice[29]. To our knowledge, we are the first to attempt to replicate their findings and use the assay to study the effect of amblyogenic rearing. Under normal lighting conditions, we found that animals preferentially exited the pole onto the safe quadrant, whereas animals tested in darkness did not (Fig. 5d). In agreement with Boone et al.[29], we thus found that vision is required for targeting the safe platform in the PDCT. We additionally found that animals tested in darkness require longer times to descend to the pole (Fig. 5d). The absence of light likely makes the descent more challenging and slower by preventing mice from using vision to gauge distances, detect obstacles, and maintain balance. Additionally, without visual input, mice may rely more on other senses, such as tactile input from the paws and nose (with the whiskers trimmed), which could be less effective for quick navigation compared with visual guidance in a well-lit environment. Our observed increase in descent time is thus not surprising.
In our experiments, we utilized pupillary dilation and amblyogenic rearing to test whether balanced binocular vision is required for the PDCT. Both paradigms degraded descent time performance in the PDCT but did not affect the tendency of mice to exit onto the safe platform (Fig. 5d, e). Thus, while we found the tendency of mice to exit onto the safe quadrant to be dependent on vision, only descent time was dependent on balanced binocular vision. These findings differ from published results obtained using the PDCT[29], where a lack of binocularity caused by acute monocular occlusion impaired the identification of the safe platform without affecting the descent time. These differences in behaviors may be attributed to how each assay engages visual processing and depth perception. Monocular occlusion eliminates binocular vision and substantially restricts the visual field. This absence of binocular function hinders the animal's ability to accurately judge distances between platforms and determine the safest quadrant. Despite this, mice with monocular vision can unambiguously detect contrast, light, and motion with normal acuity. As a result, monocular cues alone may provide sufficient information for spatial navigation, which may explain why descent time was unaffected in Boone et al.'s study[29]. Unlike occlusion, monocular pupillary dilation introduces optical aberration in one eye, bringing the inputs from the two eyes into rivalry or conflict (which is resolved when both eyes receive atropine). Optical mismatch through pupillary dilation is unlikely to completely eliminate the binocular fusion required for depth perception but diminishes it somewhat. Similarly, and even though amblyopia following LTMD drastically affects the development of normal binocular vision, visual input from the deprived (amblyopic) eye is not completely eliminated the way it is following acute monocular occlusion. Closer to the platform, both monocular and binocular cues are larger and likely sufficient to enable mice to accurately identify and target the safe platform. These cues are more subtle (and smaller in the case of interocular angular disparity) when the animal initiates their descent higher on the pole. Less apparent monocular cues further from the platform increases reliance on binocular cues. This may explain why we found the metric of descent time to be more sensitive to manipulations of binocular vision such as monocular pupillary dilation and LTMD, and likely accounts for the discrepancies between our findings and those of Boone et al.[29].
A key methodological difference between our implementation of the PDCT and that of Boone et al.[29] concerns the degree of handling during the assay. In our paradigm, the mice were allowed to self-initiate descents without repositioning. By contrast, Boone et al.[29] reported 10–15 trials per mouse, which were obtained through repeated manual repositioning. These two approaches focus on distinct behavioral readouts: Uninterrupted, self-initiated trials allow the assessment of naturalistic descent behaviors, whereas repeated repositioning supports quantification of fractional platform choice. Both studies provide strong evidence for an essential role of binocular vision for task performance. Future work examining subtle animal behavior along the pole and cone may reveal decision points indicative of distinct depth perception strategies.
Though we could not detect subtle imbalances in binocular vision caused by the application of atropine or LTMD using the metric "safe/unsafe exit", we found pole descent time to be sensitive enough to detect these subtle imbalances. As LTMD in mice has been the standard model used to study the pathophysiology and novel treatment approaches of amblyopia, our findings strongly support the use of descent time in the PDCT to study stereoscopic deficits in mice. The major advantage of using descent time in the PDCT is its relatively large effect size (37%–61%), which we found when utilizing atropine or LTMD to disrupt binocular vision (Fig. 5d, e). This necessitated the use of <15 animals to make reliable comparisons, even when binocular vision is only partially disrupted.
While the effect of LTMD was maintained, the values of descent times showed variability across experiments that differed only by a slight change in the apparatus (Fig. 5e, e'). In addition to the effect of altering the apparatus, different absolute measures likely reflect subtle cohort effects as well as differences in handling and the nature of manual scoring. Though our scoring methodology offers behavioral specificity, it is inherently subject to variation between experimenters and across sessions. Future studies that incorporate additional camera views and automated analysis will not only reduce variability but also allow the identification of decision points earlier in the descent, which could reveal how binocular cues are integrated over space and time and provide important insights into the depth perception strategies that guide this behavior. Nevertheless, we found that although exact descent times varied when the videos were scored by two independent, blinded observers, relative group differences were consistently observed. This underscores the importance of running interleaved controls—i.e., testing LTMD and control animals side by side under matched conditions—and having a consistent, group-blinded rater (ideally, more than one) for video scoring when evaluating descent time as a behavioral readout. This approach is critical for avoiding confounding batch-specific or experimenter-related effects and accurately measuring the effect size of LTMD or treatment interventions. Taken together, the strengths of our study include the systematic approach used to characterize VCA performance, replicate the PDCT, and determine their dependencies on binocular vision in mice. Our primary experiments are well-powered and thus provide a guide for future experiments to use these assays. The pattern of behavior was consistent across experiments in our study, in which manipulations that reduced binocular function decreased the time spent on the safe side in the VCA and increased descent time in the PDCT.
-
Application of both the VCA and PDCT in mice can detect binocular dysfunction, which has high clinical relevance. However, the small effect sizes across the VCA metrics limit the power and utility of this assay to detect partial effects. In contrast, the PDCT allows the use of a smaller sample size to detect binocular vision deficits, making it the assay of choice when studying stereoscopic depth perception in mice and deficits that result from deprivation amblyopia.
This research was supported by the National Eye Institute (R01 EY029245 to MFB and K08 EY030164 to EDG), the Research to Prevent Blindness (#42894 to MFB), the Picower Institute (MFB); and the Neurological Disorder Research Fund (MFB).
-
All procedures were reviewed and preapproved by the Committee on Animal Care (the Institutional Animal Care and Use Committee of MIT, identification number: 2403000639, approval date: July 1, 2024). The research followed the "replacement, reduction, and refinement" principles to minimize harm to animals. This article provides details on the housing conditions, care, and pain management for the animals, ensuring that the impact on the animals was minimized during the experiment.
-
The authors confirm their contributions to the paper as follows. study conception and design: De Jesús-Cortés H, Cramer T, Bear MF; data collection: De Jesús-Cortés H, Cramer T, Bowen DA, Lu S; analysis and interpretation of results: De Jesús-Cortés H, Cramer T, Reilly-Andújar F, Lu S; draft manuscript preparation: De Jesús-Cortés H, Cramer T. All authors reviewed the results and approved the final version of the manuscript.
-
The datasets generated during and/or analyzed during the current study are available from the corresponding authors on reasonable request.
-
The authors declare that they have no conflict of interest.
-
Authors contributed equally: Héctor De Jesús-Cortés, Teresa L. M. Cramer
- Supplemental Fig. S1 Preferred route for safe to cliff transitions in the VCA did not differ for sham vs LTMD animals. The arena was subdivided into three equal-width regions of equal size to assess whether experimental groups differ in their preferred transition routes.
- Copyright: © 2026 by the author(s). Published by Maximum Academic Press, Fayetteville, GA. This article is an open access article distributed under Creative Commons Attribution License (CC BY 4.0), visit https://creativecommons.org/licenses/by/4.0/.
-
About this article
Cite this article
De Jesús-Cortés H, Cramer TLM, Bowen DA, Reilly-Andújar F, Lu S, et al. 2026. Using the visual cliff and pole descent assays to detect binocular disruption in mice. Visual Neuroscience 43: e007 doi: 10.48130/vns-0026-0007 

Using the visual cliff and pole descent assays to detect binocular disruption in mice
- Received: 30 August 2025
- Revised: 22 December 2025
- Accepted: 29 December 2025
- Published online: 28 February 2026
Abstract: Amblyopia, a neurodevelopmental binocular visual disorder, is commonly modeled in animals using monocular deprivation (MD) during the critical period of visual development. Despite extensive research at synaptic, cellular and circuit levels, reliable behavioral assays to study stereoscopic deficits in mice are limited. This study aimed to characterize the visual cliff assay (VCA) and the pole descent cliff task (PDCT), and to evaluate their utility in detecting binocular dysfunction in mice. By using manipulations of binocular vision, including monocular occlusion, pupillary dilation, and amblyopia (by prior MD), we show that optimal performance in both the VCA and PDCT requires matched binocular input. However, deficits after MD in the VCA exhibited relatively small effect sizes (7%–14%), requiring large sample sizes. By comparison, the PDCT demonstrated larger effect sizes (43%–61%), allowing for reliable detection of binocular dysfunction with fewer animals. Following validation through multiple monocular manipulations that are relevant to clinical paradigms, the PDCT emerged as the preferred assay for detecting deficits in stereoscopic depth perception in mice. These findings provide a robust framework for using the VCA and PDCT in mechanistic and therapeutic studies in mice that will offer insights into the neural mechanisms of binocular vision and potential interventions for amblyopia.
-
Key words:
- Visual cliff assay /
- Pole descent cliff task /
- Stereopsis /
- Binocular vision /
- Amblyopia