


-
Optic neuritis (ON) represents an inflammatory affliction of the optic nerve, precipitating the potential for profound and irreversible visual impairment[1−3]. Our comprehension of ON has grown tremendously owing to clinical investigations[4] and the discovery of pathogenic antibodies, e.g., neuromyelitis optica spectrum disorders (NMOSD), myelin oligodendrocyte glycoprotein antibody (MOG-Ab)-associated diseases (MOGAD), and idiopathic ON (IDON)[5,6]. ON tends to affect young adults, with an onset age of < 50 years being defined as early-onset ON (EO-ON); ≥ 50 years as late-onset ON (LO-ON)[7−9], and ≥ 70 years as very LO-ON (VLO-ON)[10].
The diagnosis and management of LO-ON present formidable challenges, fostering instances of misdiagnosis, overlooked diagnoses, and treatment delays[11−13]. The exact prevalence of LO-ON is not clear. LO-ON is often misdiagnosed as other more common conditions in the elderly, such as tumor-related optic neuropathy and nonarterial ischemic optic neuropathy (NAION). Compared with early-onset ON (EO-ON), studies on LO-ON are scarce. Several studies have compared LO- and EO-NMOSD-ON, but only focused on central visual acuity (VA)[8], without considering the visual field (VF) and optical coherence tomography (OCT). Enhancing the treatment of ON can be advanced through further measurements of visual outcomes[14]. As far as our awareness extends, no studies have hitherto explored the area of LO-MOG-ON or LO-IDON.
Therefore, this study reviewed a series of different types of LO-ON patients with long-term follow-up period of at least 6 months. All clinical features, including radiological, immunological characteristics, visual function (VA and VF), and OCT, were compared with those of EO-ON and compared among LO-NMOSD-ON, LO-MOG-ON, and LO-IDON.
-
This is an observational, retrospective, single-center study. In total, 332 adult patients were diagnosed with acute ON from January 2016 to January 2022 at the Neuro-Ophthalmology Clinic of Zhongshan Ophthalmic Center. Their medical records were retrospectively reviewed. The study was approved by the ethics committee of the Zhongshan Ophthalmology Center of Sun Yat-sen University (2022KYPJ232) and was conducted in accordance with the Declaration of Helsinki[15]. Written informed consent was obtained from all patients included in the study.
Grouping design
-
Criteria for inclusion: (1) Diagnosed with the first episode of acute ON, as defined by acute visual loss accompanied by compatible clinical findings (e.g., pain on eye movement, relative afferent pupillary defect, or optic disc edema); (2) initiated evaluation at our neuro-ophthalmology clinic within 14 d of the symptoms' onset; (3) a comprehensive follow-up examination at 6 months (+ 3 months) after onset, including best-corrected visual acuity (BCVA), VF, and spectral-domain OCT (SD-OCT) scans; (4) missing essential baseline or follow-up data that precluded accurate classification or an analysis of the outcomes; (5) age ≥ 18 years old.
Diagnostic criteria: (1) NMOSD-ON was diagnosed on the basis of the international consensus diagnostic criteria for NMOSD (2015), with at least one episode of ON[16]; (2) MOG-ON was diagnosed on the basis of the diagnostic criteria for MOG-IgG-associated disorders (2018)[17,18], with at least one episode of ON; (3) MS-ON was diagnosed on the basis of the 2017 McDonald diagnostic criteria[19], with at least one episode of ON; (4) IDON was diagnosed on the basis of the optic neuritis treatment trial (ONTT) criteria, without any known autoimmune antibodies such as the aquaporin-4 antibodies (AQP4-Ab), MOG-Ab, and glial fibrillary acidic protein antibodies (GFAP-Ab).
Criteria for exclusion: (1) ON relapsed within 6 months (+ 3 months) of follow-up; (2) complicated with other optic neuropathy or ocular diseases, such as retinal detachment, retinal vein/artery obstruction, glaucoma, high myopia, or severe cataracts; (3) an alternative established cause for optic neuropathy (e.g., compressive, ischemic, infectious, or infiltrative); (4) incomplete medical records and examination results.
The age at the first episode of optic neuritis was chosen as the onset age for statistical analysis. An onset age of ≥ 50 years was defined as LO-ON, and cases were subdivided into LO-NMOSD-ON, LO-MOG-ON, LO-MS-ON, and LO-IDON. An onset age of < 50 years was classed as EO-ON, and cases were subdivided into EO-NMOSD-ON, EO-MOG-ON, EO-MS-ON, and EO-IDON. The study flowchart is shown in Fig. 1.
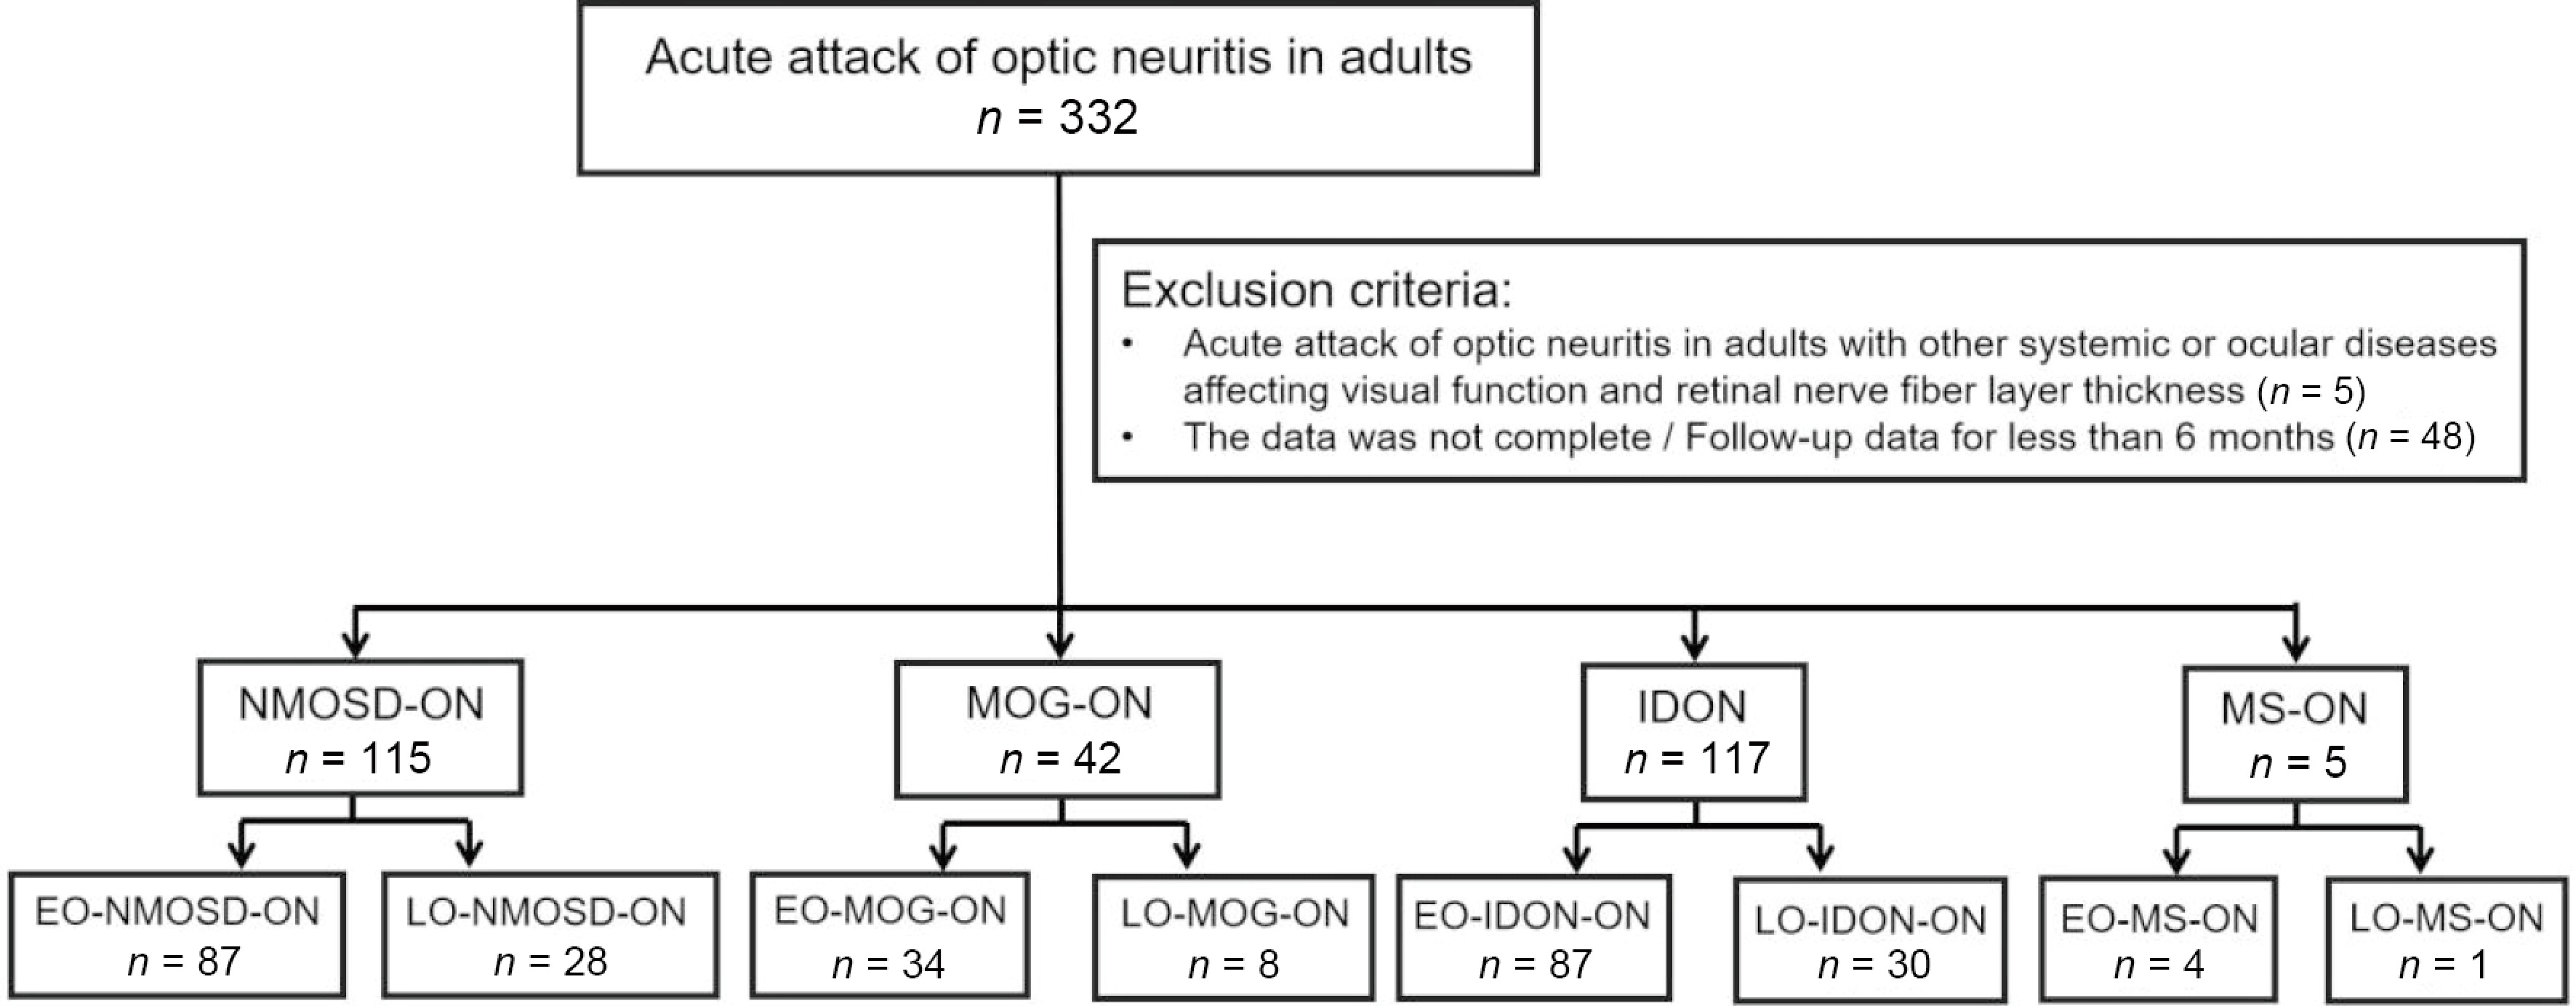
Figure 1.
Flowchart of the patient groupings according to the ON subtype and age. Abbreviations: ON, optic neuritis; NMOSD-ON, neuromyelitis optica spectrum disorder-related optic neuritis; MOG-ON, myelin oligodendrocyte glycoprotein antibody-related optic neuritis; IDON, idiopathic optic neuritis; MS-ON, multiple sclerosis-related optic neuritis; LO, late onset, ≥ 50 years of age at the onset of ON; EO, early onset, < 50 years of age at the onset of ON.
Data acquisition and analysis
-
The following data were collected: Gender, age at ON onset, ON follow-up interval, non-ON demyelinating events (prior to or concurrent with the onset of ON), the presence of autoimmune antibodies, concurrent autoimmune diseases, clinical characteristics at the onset of ON and each follow-up (i.e., laterality, the presence of pain and other precursory symptoms, the presence of optic disc edema, BCVA, mean deviation [MD] of VF defects, laboratory tests, slit lamp biomicroscopy, fundus examination, color vision, contrast sensitivity, VF, visual evoked potential, magnetic resonance imaging [MRI], and OCT).
The BCVA was recorded using Snellen charts and transformed into the logarithm of the minimum angle of resolution (logMAR) using the formula logMAR = −logBCVA. Finger counting, hand motion, light perception, and no light perception were converted to 1.85, 2.0, 2.7, and 3.0, respectively[20]. For categorical analysis, BCVA was dichotomized on the basis of its prognostic value. BCVA ≤ 20/200 was defined as 'poor vision', indicating severe visual impairment and poor prognosis, whereas BCVA > 20/200 was defined as 'good vision'.
VF was assessed using the central 30-2 SITA program on a Humphrey vision analyzer (Carl Zeiss Meditec, Dublin, CA). If the false positive or false negative rate was > 15% or the visual loss was > 33%, the VF was repeated until the required quality was met.
The segment and measurement for the peripapillary nerve fiber layer (pRNFL) and the ganglion cell layer–inner plexiform layer (GCIPL) were performed using a Cirrus SD-OCT machine (Carl Zeiss Meditec, Dublin, CA, USA). The optic disc cube extended over an area of 6 mm × 6 mm, covering the optic disc and the peripapillary retina. A built-in algorithm automatically detected the optic disc's center and positioned a calculation circle with a diameter of 3.46 mm (256 A-scans) around the optic disc on the pRNFL thickness map. The macular cube scan comprised 512 A-scans derived from 128 B-scans that covered a 6 mm × 6 mm area centered at the fovea. Macular GCIPL thickness at each pixel was measured, and the GCIPL thickness map was generated. Average macular GCIPL thickness was measured within an annulus with inner vertical and horizontal diameters of 1 and 1.2 mm, respectively, and outer vertical and horizontal diameters of 4 and 4.8 mm, respectively. Only images with a signal strength of 7 or more were included. The acquisition parameters are reported according to the active participation in optical scan technology edition of literature (APOSTEL) guidelines and an experienced technician reviewed all scans following the optical scan coherence analysis and reporting for individual bio-samples (OSCAR-IB) criteria.
Serum AQP4-Ab, MOG-Ab, and GFAP-Ab were tested within 1 month after onset via cell-based assays, and the following autoimmune antibodies were examined at baseline: Anti-thyroglobulin antibody (TGAb), anti-thyroid peroxidase antibody (TPOAb), anti-nuclear antibody, anti-dsDNA antibody, anti-nucleosome antibody, anti-histone antibody, anti-U1RNP antibody, anti-SM antibody, anti-SSA antibody (SSA), anti-SSB antibody (SSB), anti-HLA B27 antibody (HLA-B27), anticardiolipin antibody, and rheumatoid factor.
MRI scans of the orbit, brain, and spine were obtained using a 3.0-T scanner with contrast enhancement (MAGNETOM Trio, A Tim System, Siemens). All patients showed foci on the optic nerve.
Treatment strategy
-
All ON patients who were in the acute attack period received methylprednisolone at a dose of 1 g for 3 d, 0.5 g for 3 d, 0.25 g for 3 d, and 120 mg for 3 d, which wasgradually tapered. When the patient was refractory to high-dose glucocorticoid pulse therapy at the acute stage, second-line therapy including plasma exchange, immunoadsorption, intravenous immunoglobulin (IVIG), and cyclophosphamide was used. For preventing any long-term relapse, mycophenolate mofetil (MMF) was used for NMOSD-ON patients for and indefinite time. A 3-month prednisone taper was adapted. If high levels of MOG-Ab titers persisted, prednisone was maintained for up to 6 months. If recovery was poor, steroid dependence existed, or the patient had a relapse of MOG-ON, MMF was used. For IDON, no relapse prevention was given.
Statistical analyses
-
All statistical analyses were performed using SPSS Statistics 26 for Windows (IBM Company, Chicago, IL). Continuous variables were tested for normality using the Shapiro–Wilk test. Normally distributed data are summarized as the mean ± standard deviation (SD), and non-normally distributed data as the median and interquartile range (IQR). Categorical variables are presented as counts and percentages (n, %).
To compare characteristics between two independent groups (e.g., LO-ON vs EO-ON, or LO-NMOSD-ON vs EO-NMOSD-ON), the following tests were applied. Independent t-tests were used for normally distributed continuous variables; the Mann–Whitney U test was used for non-normally distributed continuous variables; Pearson's χ2 test or Fisher's exact test was used for categorical variables. Fisher's exact test was used when the expected cell count was less than five. A p-value of 1.000 from Fisher's exact test indicates identical distribution of the categorical outcome between the compared groups (e.g., 0% incidence in both groups).
For comparisons among three independent groups (i.e., LO-NMOSD-ON, LO-MOG-ON, and LO-IDON), the Kruskal–Wallis H-test was used for continuous variables. For categorical variables, Pearson's χ2 test was used when the assumptions were met (i.e., less than 20% of expected counts < 5 and no expected count < 1); otherwise, the Fisher–Freeman–Halton exact test was used. If the overall test across the three groups was significant (p < 0.05), post hoc pairwise comparisons were conducted with Bonferroni correction to control for Type I error inflation. The specific p-values for these pairwise comparisons (NMOSD-ON vs MOG-ON, NMOSD-ON vs IDON, and MOG-ON vs IDON) are reported accordingly.
In the analysis of visual outcomes, to avoid bias from the inter-relationship between two eyes in patients with bilateral neuritis, data from only the more severely affected eye (according to their baseline BCVA) were included for all group comparisons. All reported p-values are two-tailed, and a p < 0.05 was considered statistically significant.
-
In total, 279 patients who had complete clinical data and follow-up data for 6 months (+ 3 months) were included in the study, of whom 66 had LO-ON and 205 had EO-ON. Among these patients, 115 (41.22%) had NMOSD-ON (112 and 3 were AQP4-Ab seropositive and seronegative, respectively), 42 (15.05%) had MOG-ON, 117 (41.94%) had IDON, and 5 (1.79%) had MS-ON (Fig. 1). All patients were of Asian ethnicity (100% Han). Since the sample sizes of MS-ON (n = 5) and NMOSD-ON with seronegative AQP4-Ab (n = 3) were too small for statistical analysis, they were not included in the analysis.
Overall comparison: LO- vs EO-ON
-
LO-ON accounted for 24.4% of ON cases, with a female-to-male ratio of 2.8:1 (Table 1). No significant differences were found between the LO-ON and EO-ON groups in all indexes at onset. Six months after onset, LO-ON was significantly worse than EO-ON: BCVA (median difference = 0.20 logMAR, 95% confidence interval [CI]: 0.05–0.30, p = 0.003) and VF MD (median difference = −10.00 dB, 95% CI: −15.00 to −4.00, p = 0.001). No statistically significant differences were found in pRNFL, GCIPL, or other indicators such as unilateral or bilateral involvement, recurrence rate, prodrome, combined abnormal autoimmune antibody, and MRI-detected brain and spinal cord lesions (p > 0.05).
Table 1. Clinical outcomes of LO- and EO-ON in all adult patients.
All ON EO-ON LO-ON Statistical approach p-value Number of cases, n (%) 205 (75.6) 66 (24.4) Female-to-male ratio 137:68 (2:1) 49:17 (2.8:1) χ2 test 0.356 Age, years, median (IQR) 34 (27–41) 56 (53–61.25) Age, years, range 18–49 50–83 Bilateral-to-unilateral ratio (bilateral %) 39:166 (20.6%) 18:48 (27.3%) χ2 test 0.153 Monophasic-to-relapsing ratio (relapsing %) 82:123 (60%) 32:34 (51.5%) χ2 test 0.225 Autoantibodies 55 (26.8%) 17 (25.8%) χ2 test 0.864 ANA (+) 31 (15.1%) 7 (10.6%) χ2 test 0.358 SSA (+) 12 (5.6%) 5 (7.6%) Fisher's exact test 0.616 SSB (+) 3 (1.5%) 2 (3.0%) Fisher's exact test 0.598 HLA-B27 (+) 6 (2.9%) 1 (1.5%) Fisher's exact test 0.855 TPOAb (+), TGAb (+) 3 (1.5%) 2 (3.0%) Fisher's exact test 0.598 Other central nervous system lesions (MRI) Brain 29 (14.1%) 16 (24.2%) χ2 test 0.055 Spinal 16 (7.8%) 3 (4.5%) Fisher's exact test 0.532 Clinical manifestations Headache 30 (14.6%) 9 (13.6%) χ2 test 0.841 Ophthalmodynia 79 (38.5%) 17 (25.8%) χ2 test 0.059 Vomiting hiccups 11 (5.4%) 0 (0%) Fisher's exact test 0.071 Acroanesthesia 26 (12.7%) 5 (7.6%) Fisher's exact test 0.257 Optic disc edema 81 (39.5%) 24 (36.4%) χ2 test 0.648 BCVA, logMAR, median (IQR) Onset 1.60 (0.60–1.85) 1.85 (0.70–2.00) Mann–Whitney U-test 0.078 ≤ 20/200 (n) 148 51 χ2 test 0.417 Final 0.40 (0.097–1.30) 0.60 (0.30–1.52) Mann–Whitney U-test 0.003** ≤ 20/200 (n) 72 27 χ2 test 0.396 VF MD, dB, median (IQR) Onset −25.69 (−33.48 to −15.26) −26.58 (−33.78 to −18.4) Mann–Whitney U-test 0.591 Final −5.90 (−13.21 to −1.86) −16.35 (−29.48 to −4.59) Mann–Whitney U-test 0.001** Final pRNFL, mm, median (IQR) 66.00 (58.00–80.00) 65.00 (55.50–75.50) Mann–Whitney U-test 0.245 Final GCIPL, mm, median (IQR) 56.00 (52.00–63.50) 56.00 (51.00–66.00) Mann–Whitney U-test 0.711 ON, optic neuritis; LO, late onset, ≥ 50 years of age at the onset of ON; EO, early onset, < 50 years of age at the onset of ON; BCVA, best-corrected visual acuity; VF, visual field; MD, mean deviation; pRNFL, peripapillary retinal nerve fiber layer; GCIPL, ganglion cell layer–inner plexiform layer. *: < 0.05, **: < 0.01, ***: < 0.001. Subtype-specific comparisons: LO-ON vs EO-ON within etiological groups
-
LO-NMOSD-ON accounted for 25% of the all patients with NMOSD (Table 2). Except for the age at first ON attack, no significant differences in any indexes were found between the LO and EO groups (p > 0.05).
Table 2. Clinical outcomes of LO-NMOSD-ON and EO-NMOSD-ON.
NMOSD-ON EO-NMOSD-ON LO-NMOSD-ON Statistical approach p-value Number of cases, n (%) 84 (75.00%) 28 (25.00) Female-to-male ratio 69:15 (4.6:1) 26:2 (13:1) Fisher's exact test 0.29 Age, years, median (IQR) 35.00 (27.00–41.75) 54.50 (52.00–61.75) Age, years, range 18–49 50–83 Bilateral-to-unilateral ratio (bilateral %) 5:79 (5.95%) 5:23 (17.86%) Fisher's exact test 0.117 Monophasic-to-relapsing ratio (relapsing %) 14:70 (83.33%) 7:21 (75%) χ2 test 0.328 Autoantibodies 40 (47.62%) 11 (39.29%) χ2 test 0.443 ANA (+) 22 (26.19%) 4 (14.29%) Fisher's exact test 0.301 SSA (+) 12 (14.29%) 3 (10.71%) Fisher's exact test 0.873 SSB (+) 3 (3.57%) 2 (7.14%) Fisher's exact test 0.597 HLA-B27(+) 2 (2.38%) 0 (0.00%) Fisher's exact test 1.0 TPOAb (+), TGAb (+) 1 (1.19%) 2 (7.14%) Fisher's exact test 0.154 Other central nervous system lesions (MRI) Brain 10 (11.90%) 3 (10.71%) Fisher's exact test 1.0 Spinal 6 (7.14%) 1 (3.57%) Fisher's exact test 0.822 Clinical manifestations Headache 15 (17.86%) 4 (14.29%) Fisher's exact test 0.884 Ophthalmodynia 40 (47.62%) 9 (32.14%) χ2 test 0.153 Vomiting hiccups 9 (10.71%) 0 (0%) Fisher's exact test 0.109 Acroanesthesia 21 (25.00%) 2 (7.14%) Fisher's exact test 0.079 Optic disc edema 28 (33.33%) 9 (32.14%) χ2 test 0.908 BCVA, logMAR, median (IQR) Onset 1.85 (1.07–2.00) 1.85 (1.00–2.00) Mann–Whitney U-test 0.346 ≤ 20/200 (n) 70 (83.33%) 23 (82.14%) χ2 test 0.884 Final 0.69 (0.20–1.60) 0.80 (0.42–1.79) Mann–Whitney U-test 0.791 ≤ 20/200 (n) 39 (46.4%) 14 (50%) χ2 test 0.743 VF MD, dB, median (IQR) Onset −32.11 (−34.00 to −16.76) −31.80 (−34.00 to −18.46) Mann–Whitney U-test 0.264 Final −15.54 (−28.15 to −5.99) −18.94 (−33.90 to −5.88) Mann–Whitney U-test 0.847 Final pRNFL, mm, median (IQR) 62.00 (56.00–71.00) 64.00 (54.00–74.00) Mann–Whitney U-test 0.744 Final GCIPL, mm, median (IQR) 55.00 (50.00,58.50) 52.00 (47.00–58.75) Mann–Whitney U-test 0.939 ON, optic neuritis; NMOSD-ON, neuromyelitis optica spectrum disorder-related ON; LO, late onset, age at ON onset ≥ 50 years; EO, early onset, age at ON onset < 50 years; BCVA, best-corrected visual acuity; MD, mean deviation; pRNFL, peripapillary retinal nerve fiber layer; GCIPL, ganglion cell layer–inner plexiform layer. *: < 0.05, **: < 0.01, ***: < 0.001. The LO-MOG-ON group had significantly worse visual acuity at onset than the EO-MOG-ON group (median difference = 0.55 logMAR, 95% CI: 0.10–1.10, p = 0.008; Table 3). BCVA ≤ 20/200, a criterion indicative of poor visual prognosis, was as high as 87.5% in the LO-MOG-ON group, but no statistically significant difference was found compared with the EO-MOG-ON group (67.6%; p > 0.05). The final BCVA in the LO-MOG-ON group was significantly worse than that in the EO-MOG-ON group (median difference = 0.20 logMAR, 95% CI: 0.00–0.50, p = 0.042). No significant differences in other indicators were found between the two groups (p > 0.05).
Table 3. Clinical outcomes of LO-MOG-ON and EO-MOG-ON.
MOG-ON EO-MOG-ON LO-MOG-ON Statistical approach p-value Number of cases, n (%) 34 (81%) 8 (19%) Female-to-male ratio 19:15 (1.26:1) 6:2 (3:1) Fisher's exact test 0.206 Age, years, median (IQR) 31.5 (27.00–37.25) 53.5 (52.00–61.75) Age, years, range 22–49 51–67 Bilateral-to-unilateral ratio (bilateral %) 8:26 (23.52%) 2:6 (25%) Fisher's exact test 1.0 Monophasic-to-relapsing ratio (relapsing %) 9:25 (74%) 3:5 (62.5%) Fisher's exact test 0.852 Autoantibodies 3 (8.82%) 1 (12.5%) Fisher's exact test 0.352 ANA (+) 1 (3.1%) 0 (0%) Fisher's exact test 1.0 SSA (+) 0 (0%) 0 (0%) Fisher's exact test 1.0 SSB (+) 0 (0%) 0 (0%) Fisher's exact test 1.0 HLA-B27 (+) 0 (0%) 1 (14.3%) Fisher's exact test 0.179 TPOAb (+), TGAb (+) 2 (6.2%) 0 (0%) Fisher's exact test 1.0 Other central nervous system lesions (MRI) Brain 2 (6.2%) 0 (0%) Fisher's exact test 1.0 Spinal 1 (3.1%) 0 (0%) Fisher's exact test 1.0 Clinical manifestations Headache 7 (21.9%) 2 (28.6%) Fisher's exact test 1.0 Ophthalmodynia 17 (50%) 5 (71.4%) Fisher's exact test 1.0 Vomiting hiccups 1 (3.1%) 0 (0%) Fisher's exact test 1.0 Acroanesthesia 1 (3.1%) 0 (0%) Fisher's exact test 1.0 Optic disc edema 17 (50%) 4 (57.1%) Fisher's exact test 1.0 BCVA, logMAR, median (IQR) Onset 1.3 (0.30–1.70) 1.85 (1.05–2.50) Mann–Whitney U-test 0.008** ≤ 20/200 (n) 23 (67.6%) 7 (87.5%) Fisher's exact test 0.494 Final 0.10 (0.00–0.30) 0.25 (0.15–0.52) Mann–Whitney U-test 0.041* ≤ 20/200 (n) 3 (8.8%) 0 (0.00%) Fisher's exact test 1.0 VF MD, dB, median (IQR) Onset −23.37 (−33.10 to −6.42) −24.3 (−32.26 to −17.26) Mann–Whitney U-test 0.109 Final −3.62 (−6.08 to −1.57) −2.94 (−6.13 to −2.77) Mann–Whitney U-test 0.749 Final pRNFL, mm, median (IQR) 74.00 (63.00–83.50) 71.00 (66.50–85.50) Mann–Whitney U-test 0.689 Final GCIPL, mm, median (IQR) 59.00 (54.00–66.25) 58.00 (54.00–72.00) Mann–Whitney U-test 0.336 ON, optic neuritis; MOG-ON, myelin oligodendrocyte glycoprotein antibody-related ON; LO, late onset, ≥ 50 years of age at the onset of ON; EO, early onset, < 50 years of age at the onset of ON; BCVA, best-corrected visual acuity; VF, visual field; MD, mean deviation; pRNFL, peripapillary retinal nerve fiber layer; GCIPL, ganglion cell layer–inner plexiform layer. *: < 0.05, **: < 0.01, ***: < 0.001. No significant differences in BCVA and VF at ON onset were found between LO-IDON and EO-IODN (Table 4). However, the final BCVA and VF MD in the LO-IDON group were significantly worse than that of the EO-IDON group (BCVA: median difference = 0.20 logMAR, 95% CI: 0.05–0.40, p = 0.012; VF MD: median difference = −12.00 dB, 95% CI: −18.00 to −6.00, p = 0.0004). No statistically significant differences were found in pRNFL and GCIPL between the two groups at ON onset and final follow-up (p > 0.05). Brain involvement revealed by MRI was significantly higher in the LO-IDON group than in the EO-IDON group (43.3% vs 19.5%, p = 0.01).
Table 4. Clinical outcomes of LO-IDON and EO-IDON.
IDON EO-IDON LO-IDON Statistical approach p-value Number of cases, n (%) 87 (74.4%) 30 (25.6%) Female-to-male ratio 49:38 (1.3:1) 17:13 (1.3:1) χ2 test 0.974 Age, years, median (IQR) 34.00 (27.00–41.00) 57.50 (54.00–61.5) Age, years, range 19–49 51–77 Bilateral-to-unilateral (bilateral %) 26:61 (29.9%) 11:19 (36.7%) χ2 test 0.491 Monophasic-to-relapsing (relapsing %) 59:28 (32.2%) 22:8 (26.7%) χ2 test 0.572 Autoantibodies 12 (13.8%) 5 (16.7%) Fisher's exact test 0.7 ANA (+) 8 (9.2%) 3 (10%) Fisher's exact test 1.0 SSA (+) 0 (0%) 2 (6.67%) Fisher's exact test 0.064 SSB (+) 0 (0%) 0 (0%) Fisher's exact test 1.0 HLA-B27 (+) 4 (4.6%) 0 (0%) Fisher's exact test 0.571 TPOAb (+), TGAb (+) 0 (0%) 0 (0%) Fisher's exact test 1.0 Other central nervous system lesions (MRI) Brain 17 (19.5%) 13 (43.3%) χ2 test 0.01* Spinal 9 (10.3%) 2 (6.67%) Fisher's exact test 0.816 Clinical manifestations Headache 8 (9.2%) 3 (10%) Fisher's exact test 1.0 Ophthalmodynia 14 (16.1%) 3 (10%) Fisher's exact test 0.606 Vomiting hiccups 1 (1.15%) 0 (0%) Fisher's exact test 1.0 Acroanesthesia 4 (4.6%) 3 (10%) Fisher's exact test 0.37 Optic disc edema 36 (41.3%) 11 (36.7%) χ2 test 0.65 BCVA, logMAR, median (IQR) Onset 1.52 (0.60–1.85) 1.70 (0.60–2.00) Mann–Whitney U-test 0.363 ≤ 20/200 (n) 55 (63.2%) 21 (70%) χ2 test 0.502 Final 0.20 (0.00–0.50) 0.40 (0.20–1.00) Mann–Whitney U-test 0.012* ≤ 20/200 (n) 30 (34.5%) 13 (43.3%) χ2 test 0.386 VF MD, dB, median (IQR) Onset −22.31 (−31.66 to −13.23) −24.96 (−31.45 to −17.4) Mann–Whitney U-test 0.345 Final −5.90 (−13.21 to −1.68) −19.73 (−30.78 to −9.84) Mann–Whitney U-test 0.0004*** Final pRNFL, mm, median (IQR) 70.00 (57.50–82.50) 64.00 (55–79) Mann–Whitney U-test 0.191 Final GCIPL, mm, median (IQR) 58.00 (53.75–64.50) 58.50 (51.70–75) Mann–Whitney U-test 0.714 Abbreviations: ON, optic neuritis; IDON, idiopathic ON; LO, late onset, ≥ 50 years of age at the onset of ON; EO, early onset, < 50 years of age at the onset of ON; BCVA, best-corrected visual acuity; VF, visual field; MD, mean deviation; pRNFL, peripapillary retinal nerve fiber layer; GCIPL, ganglion cell layer–inner plexiform layer. *: < 0.05, **: < 0.01, ***: < 0.001 Comparative analysis among the three late-Onset ON subtypes
-
LO-ON accounted for 24.4% of all ON, of which LO-NMOSD-ON, LO-MOG-ON, and LO-IDON accounted for 25%, 19%, and 25.6%, respectively (Table 5). The female-to-male ratio was highest in the LO-NMOSD-ON group (13:1), which was significantly higher than in the LO-IDON group (1.3:1; p = 0.009). No significant gender composition difference was found between the MOG and IDON groups (p = 0.592). No statistically significant differences at onset were found among the LO-ON groups. LO-MOG-ON had significantly better final BCVA and VF than LO-NMOSD-ON (p value for visual acuity [PVA] = 0.02, p value for mean deviation [PMD] = 0.003) and LO-IDON (PVA = 0.004, PMD = 0.005). The GCIPL of the NMOSD-ON group was significantly thinner than that in the LO-IDON group (p = 0.031). The relapse rate of LO-NMOSD-ON group (75%) and MOG-ON group (62.5%) were significantly higher than that of the IDON group (26.7%; p = 0.001). No significant difference in relapse rate was found between the NMOSD and MOG groups (p > 0.05). The LO-IDON group showed the highest rate of brain involvement revealed by MRI (43.3%; LO-IDON vs LO-NMOSD, p = 0.024; LO-IDON vs LO-MOG, p = 0.034). No significant difference was found between the NMOSD (10.7%) and MOG groups (0%; p > 0.05). No statistically significant differences in spinal cord involvement were found among the three groups (p > 0.05). The prevalence of eye pain in the LO-MOG (71.4%) and LO-NMOSD groups (32.1%) was significantly higher than in the LO-IDON group (10%; p = 0.005).
Table 5. Comparison of clinical information among the patients with LO-NMOSD-ON, LO-MOG-ON, and LO-IDON.
LO-ON p-value NMOSD MOG IDON Statistical approach p0 p1† p2† p3† Number of cases, n (%) 28 (25%) 8 (19%) 30 (25.6%) χ2 test 0.68 0.437 0.911 0.39 Female-to-male ratio 26:2 (13:1) 6:2 (3:1) 17:13 (1.3:1) Fisher–Freeman–Halton exact test 0.005** 0.207 0.009** 0.592 Age, years, median (IQR) 54.50 (52.00–61.75) 53.5 (52.00–61.75) 57.50 (54.00–61.5) Kruskal–Wallis H-test 0.186 0.3 0.185 0.088 Age, years, range 50–83 51–67 51–77 Bilateral-to-unilateral ratio (bilateral %) 5:23 (16%) 2:6 (25%) 11:19 (36.7%) Fisher–Freeman–Halton exact test 0.267 1.0 0.109 0.843 Monophasic-to-relapsing ratio (relapsing %) 7:21 (75%) 3:5 (62.5%) 22:8 (26.7%) Fisher–Freeman–Halton exact test 0.001** 0.804 0.001** 0.108 Autoantibodies 11 (39.3%) 1 (12.5%) 5 (16.7%) Fisher–Freeman–Halton exact test 0.108 0.321 0.054 1.0 ANA (+) 4 (14.3%) 0 (0%) 3 (10%) Fisher–Freeman–Halton exact test 0.748 0.548 0.689 1.0 SSA (+) 3 (10.7%) 0 (0%) 2 (6.67%) Fisher–Freeman–Halton exact test 0.828 1.0 0.65 1.0 SSB (+) 2 (7.1%) 0 (0%) 0 (0%) Fisher–Freeman–Halton exact test 0.406 1.0 0.202 1.0 HLA-B27(+) 0 1 (14.3%) 0 (0%) Fisher–Freeman–Halton exact test 0.121 0.233 1.0 1.0 TPOAb (+), TGAb (+) 2 (7.1%) 0 (0%) 0 (0%) Fisher–Freeman–Halton exact test 0.406 1.0 1.0 1.0 Other central nervous system lesions (MRI) Brain 3 (10.7%) 0 (0%) 13 (43.3%) Fisher–Freeman–Halton exact test 0.005** 1.0 0.024* 0.034* Spinal 1 (3.6%) 0 (0%) 2 (6.67%) Fisher–Freeman–Halton exact test 1.0 1.0 1.0 1.0 Clinical manifestations Headache 4 (14.3%) 2 (28.6%) 3 (10%) Fisher–Freeman–Halton exact test 0.472 0.565 0.813 0.279 Ophthalmodynia 9 (32.1%) 5 (71.4%) 3 (10%) Fisher–Freeman–Halton exact test 0.007** 0.204 0.02* 0.005** Vomiting hiccups 0 0 (0%) 0 (0%) Fisher–Freeman–Halton exact test 1.0 1.0 1.0 1.0 Acroanesthesia 2 (7.1%) 0 (0%) 3 (10%) Fisher–Freeman–Halton exact test 1.0 1.0 1.0 1.0 Optic disc edema 9 (32.1%) 4 (57.1%) 11 (36.7%) Fisher–Freeman–Halton exact test 0.677 0.666 0.959 0.687 BCVA, logMAR, median (IQR) Onset 1.85 (1.00–2.00) 1.85 (1.05–2.50) 1.7 (0.6–2.0) Kruskal–Wallis H-test 0.588 0.553 0.301 0.422 ≤ 20/200 (n) 23 (82.14%) 7 (87.5%) 21 (70%) Fisher–Freeman–Halton exact test 0.501 1.0 0.28 0.584 Final 0.80 (0.42–1.79) 0.25 (0.15–0.52) 0.40 (0.20–1.00) Kruskal–Wallis H-test 0.05* 0.02* 0.356 0.004** ≤ 20/200 (n) 14 (50%) 0 (0.00%) 13 (43.3%) Fisher–Freeman–Halton exact test 0.032* 0.013* 0.611 0.034* VF MD, dB, median (IQR) Onset −31.80
(−34.00 to −18.46)−24.3
(−32.26, −17.26)−24.96
(−31.45, −17.4)Kruskal–Wallis H-test 0.366 0.427 0.162 0.917 Final −18.94
(−33.90 to −5.88)−2.94
(−6.13, −2.77)−19.73
(−30.78, −9.84)Kruskal–Wallis H-test 0.006** 0.003** 0.327 0.005** Final pRNFL, mm, median (IQR) 64.00 (54.00–74.00) 71.00 (66.50–85.50) 64.00 (55.00–79.00) Kruskal–Wallis H-test 0.192 0.061 0.691 0.137 Final GCIPL, mm, median (IQR) 52.00 (47.00–58.75) 58 (54.00–72.00) 58.5 (51.70–75) Kruskal–Wallis H-test 0.066 0.096 0.031* 0.947 Abbreviations: ON, optic neuritis; NMOSD-ON, neuromyelitis optica spectrum disorder-related ON; MOG-ON, myelin oligodendrocyte glycoprotein antibody-related ON; IDON, idiopathic ON; LO, late onset, ≥ 50 years of age at the onset of ON; BCVA, best-corrected visual acuity; MD, mean deviation; pRNFL, peripapillary retinal nerve fiber layer; GCIPL, ganglion cell layer–inner plexiform layer; p0, comparison among the three groups (NMOSD-ON, MOG-ON, and IDON); p1, the NMOSD-ON group compared with the MOG-ON group; p2, the NMOSD-ON group compared with the IDON group; p3, the MOG-ON group compared with the IDON group. † Bonferroni correction was applied for multiple comparisons in p1, p2, and p3. *: < 0.05, **: < 0.01, ***: < 0.001. -
Our study provides a critical refinement of our understanding of ON in older adults by demonstrating that the effect of age on prognosis is not uniform but is profoundly influenced by the underlying serological subtype. To the best of our knowledge, this study is the first to systematically compare the clinical characteristics, visual function, and structural outcomes of LO-ON and EO-ON across different etiological types. It is particularly innovative in the analysis of the LO subtypes of MOG-ON and IDON. As in methodology, this study had multiple dimensional indicators such as vision, visual field, OCT, MRI, etc., enhancing the reliability of the results.
No previous studies have reported the overall incidence rate of LO-ON, and only one case series study on LO-NMOSD-ON was conducted in Thailand, which showed that LO-NMOSD-ON accounted for 29.8% (13/47) of the total NMOSD-ON cases. From the perspective of the overall incidence of the disease entity rather than the related ON, the proportion of LO-NMOSD in the reported total of patients with NMOSD varied significantly, ranging from 17.98% to 41.5%[7,21−24]. The proportion of LO-MOG accounted for approximately 17.26% of MOGAD cases[24,25]. In this study, the proportion of patients with LO-ON accounted for 24.4% of all patients with ON, of which LO-NMOSD-ON, LO-MOG-ON, and LO-IDON accounted for 25%, 19%, and 25.6%, respectively.
In terms of visual function, this is the first LO-ON study that reports not only central visual acuity results but also VF-related evidence. At present, there is a dispute about whether patients with LO-ON have more severe visual impairment and worse prognosis, as some studies have indicated that the age of onset has no effect on this[26,27], and one study found that the visual acuity at the onset of LO-ON in patients aged ≥ 65 years old was worse than that in middle-aged people (< 65 years old), but the final visual acuity was not worse. However, only eight patients had LO-ON in that study[28]. Another multicenter retrospective study of 531 ON cases showed that the onset age was related to vision. The older the onset age, the worse the vision, both at the onset and final follow-up[3]. On the whole, no significant difference was found between LO-ON and EO-ON in terms of disease severity at onset. In terms of final visual function, BCVA and VF were significantly worse in the LO-ON group than in the EO-ON group. However, that study did not classify ON into specific types. As ON is not a disease entity, if the etiology of ON is not classified, the conclusions would be of poor clinical significance.
As far as we know, this study is the first study to identify differences between LO-ON and EO-ON in terms of damage to the optic nerve tissue by pRNFL and GCIPL. However, no significant differences were found in the overall comparison of LO-ON and EO-ON, nor in the comparison of LO-ON and EO-ON in each subgroup. In a previous study on ON with a dividing point of 44 or 40 years, also no significant difference in pRNFL was found[26,29]. This shows that pRNFL and GCIPL is not an age-sensitive index compared with visual function indexes.
NMOSD-ON had high prevalence in the elderly. It involves the elderly most widely compared with the other ON types[30−32]. This suggests that the possibility of NMOSD-ON should be considered, which can be included in the differential diagnosis of VLO-ON. Older patients with NMOSD have been reported to be associated with worse prognosis, a higher mortality rate, and a greater disability rate[22]. Compared with EO-NMOSD, LO-NMOSD has been found to have significantly higher incidence rates of sensory and motor disorders, and bladder and rectal sphincter dysfunctions, but less ON involvement[10,21,23,33]. At present, no immediate conclusion has been made about the impact of age on the visual prognosis of NMOSD-ON. Some studies have found no statistically significant differences between LO-NMOSD and EO-NMOSD in terms of the severe visual impairment rate (BCVA < 20/200)[7]. However, two studies also showed that a later onset of NMOSD was associated with a worse final visual outcome[25,34]. Another study found that patients with an older onset age of NMOSD-ON episodes had a worse visual prognosis[34]. At present, only one retrospective study has compared EO-ON and LO-ON (onset age of ≥ 50 years) in patients with NMOSD and found that the nadir vision at ON onset and the final vision in 14 LO-ON cases were worse than in 33 EO-ON cases[8]. However, this study found that LO-NMOSD-ON and EO-NMOSD-ON had no significant differences in all aspects (eyes, autoantibodies, MRI results, etc.), especially in visual function (vision and VF) and degree of optic atrophy (pRNFL and GCIPL). We also compared the incidence of severe visual impairment between the two (BCVA < 20/200) and found no significant difference. However, our LO-ON group (≥ 50 years) encompasses a wide age range and may not fully represent the 'very elderly' (e.g., ≥ 70 years) where age-related effects might be more pronounced. Therefore, within the age range studied (≥ 50 years), LO-NMOSD-ON may not be considered as having a more severe disease or worse visual outcomes than EO-NMOSD-ON. It remains possible that a significant effect of age would be observed in a cohort of VLO-NMOSD-ON (e.g., ≥ 70 years), and this warrants further investigation in larger, multicenter studies.
Research on LO-MOG-ON is scarce. This study might be the first to comprehensively examine the clinical characteristics of LO-MOG-ON and compare them with those of EO-ON. In this study, compared with patients with EO-MOG-ON, those with LO-MOG-ON had poorer central vision both at onset and final follow-up. However, no significant differences were found in VF damage and optical nerve structure indices (pRNFL and GCIPL). In a study with Chinese patients with MOG-ON, the proportion of patients with a visual acuity of ≤ 0.01 at onset and after recovery was higher among those aged ≥ 46 years than among the young patients (18–46 years old) and children (≤ 18 years old), but no statistically significant difference was found between pRNFL and GCIPL, similar to our research results[35]. Another retrospective multicenter study found that the onset age of MOG-ON was related to final vision, and the older the onset age, the worse the vision[36]. That is, LO-MOG-ON may be more serious than EO-MOG-ON at onset and final follow-up. In addition, our results suggest that the age has an impact on the prognosis of central vision in MOG-ON but has no significant impact on VF and optic nerve structure. A potential explanation could be that the range of nerve fibers corresponding to central vision is located temporally to the optic disc. The temporal side of the pRNFL in LO-MOG-ON might be more susceptible than that in EO-MOG-ON. As the sample size of patients with LO-MOG-ON in this study was small, the results need further verification.
This study found that the severity of visual function in LO-IDON and EO-IDON is comparable at onset, but the prognosis of LO-IDON was indeed worse than that of EO-IDON, both in terms of the final BCVA and VF. This indicates that age does not impact the severity of visual dysfunction during IDON's onset, but it does influence the process of recovery.
Our findings that both LO-MOG-ON and LO-IDON were associated with poorer visual outcomes compared with their EO counterparts raise the crucial question of the underlying mechanisms. First, the aged central nervous system exhibits a significantly diminished capacity for axonal regeneration and remyelination. This stems from reduced activity in the intrinsic neural repair pathways, impaired mitochondrial energy production, and the declining function of oligodendrocyte precursor cells (OPCs). Second, underlying vascular risk factors (e.g., hypertension, diabetes) that are more common in the elderly could exacerbate ischemic injury within the inflamed optic nerve, hindering recovery. Furthermore, immunosenescence may contribute to a more dysregulated inflammatory response and a weaker transition to pro-repair immune responses, hindering effective recovery. Specifically, in LO-MOG-ON, the severe initial axonal damage (87.5% of LO-MOG-ON patients had BCVA ≤ 20/200) implies very severe initial axonal damage. Given the already limited repair capacity of the elderly brain, it is even more difficult to achieve complete functional reversal of such severe damage. For LO-IDON, the high rate of brain involvement (43.3%) suggests that a large part of it may be the first manifestation of multiple sclerosis (MS) or MS-like disease in old age. The MS of the elderly itself may have different and more destructive pathophysiological and biological characteristics. Furthermore, a higher burden of brain lesions reflects broader and more active central nervous system inflammation, which may indicate poorer overall neural repair capacity.
IDON usually has similar characteristics to MS-ON but does not meet the diagnosis criteria for MS. Approximately 50% of patients with unilateral IDON in the ONTT were diagnosed with definite MS after 15 years of follow-up. However, in Asians and other ethnic groups, the proportions were lower, ranging from 10% to 29%[37,38]. There are few studies on the effects of age on the brain involvement of ON. In the ONTT, 59.7% of patients were found to have MRI-detected brain lesions. In another retrospective study, no significant differences in the frequency of MRI-detected brain lesions were found between 8 patients aged ≥ 65 years and 68 patients aged < 65 years who had ON[28]. This is the first study that used 50 years as the age dividing point for LO-ON and to find that the proportion of brain lesions in the LO-IDON cases was as high as 43.3%, significantly higher than that in the EO-IDON cases. The mechanism of this situation is unknown. Whether it is caused by the weaker blood–brain barrier in the elderly[39] needs further study.
The ONTT showed that patients with IDON who have brain lesions at onset have a 51% and 72% probability of developing MS within 5 and 15 years, respectively[40,41]. This study found that LO-IDON was also more likely to be associated with MRI-deected intracranial lesions than other types of LO-ON, which may indicate that IDON is indeed highly correlated with MS and more likely to affect the brain.
The three categories of LO-ON had a similar severity at onset, but prognosis was different, with LO-MOG-ON being the best and LO-NMOSD-ON the worst. LO-MOG-ON had the best BCVA and VF prognosis, consistent with studies on EO-ON[32,42,43]. The GCIPL of the LO-NMOSD group was more severely injured than that of the LO-IDON group. However, no significant differences in pRNFL and GCIPL were found between the other groups. The recurrence rates in the NMOSD-ON and MOG-ON groups were higher than that in the IDON group[42]. Thus, this might have an impact when comparing visual function (BCVA and VF) and visual structure (pRNFL and GCIPL) among the three LO-ON categories. The proportion of recurrent ON in the LO-NMOSD and LO-MOG groups was relatively high (75% and 62.5%, respectively), and therefore their visual function and visual structure were expected to be worse. Indeed, in the NMOSD group, the final visual function was indeed the worst, but the final visual function of the MOG group was still the best. This further indicated that MOG-ON had good prognosis. Interestingly, the LO-IDON group showed no significant difference in visual prognosis compared with the LO-NMOSD group despite a much lower proportion of recurrent ON (26.7%). This seemed to be different from the finding that IDON has a better visual function prognosis than NMOSD in EO-ON[3]. The immune antibody-positive rate was highest in the LO-NMOSD group, even though it was not statistically significantly higher than the other LO-ON groups and was not higher than in EO-NMOSD-ON. Autoimmune disorders still play a role in LO-NMOSD-ON but might not be a unique ON-inducing factor in the elderly. These findings offer direct clinical guidance for the management of LO-ON. First, LO-IDON exhibited the highest rate of brain involvement (43.3%). This suggests that a diagnosis of IDON in an older adult should not be considered benign and strongly warrants performing a brain MRI. The presence of asymptomatic demyelinating lesions may indicate a higher risk of progressing to MS or another defined neuroinflammatory disorder, necessitating closer neurological monitoring and follow-up. Second, LO-MOG-ON, while often presenting with severe initial visual acuity loss, demonstrated the best final visual outcomes among the LO-ON subtypes. This underscores that an aggressive approach to acute treatment (e.g., high-dose corticosteroids, potentially intravenous immunoglobulin (IVIG) or plasma exchange in severe cases) is fully justified in this demographic, as the potential for excellent functional recovery remains high. Lastly, LO-NMOSD-ON was characterized by an extremely high relapse rate (75%). This finding emphasizes the absolute necessity of initiating long-term immunosuppressive therapy (e.g., mycophenolate mofetil, rituximab) immediately after the first attack to prevent future debilitating relapses and cumulative disability, which is a critical management strategy in this subgroup.
Pain with eye movement is significantly more frequent when orbital segment of the optic nerve is inflamed[44]. In this study, the incidence of ocular pain in the LO-MOG-ON group was indeed the highest among the three groups, which was consistent with EO-MOG-ON[3], indicating that the orbital segment was more frequently involved. All these findings indicated that the clinical profile of LO-ON was similar to that of EO[3,32,42].
This study has several limitations. It is a single-center, retrospective case series, and prospective studies are needed for validation. The modest sample size, particularly in the LO-MOG-ON subgroup (n = 8), limited the use of multivariable regression models to adjust for confounders such as age and sex. Similarly, for binary outcomes like brain involvement, the sample size constrained the application of multivariate analyses (e.g., logistic regression); therefore, only univariate comparisons are reported. Although baseline characteristics did not differ significantly between the main LO-ON and EO-ON groups, residual or unmeasured confounding cannot be ruled out. Pediatric patients were not included, and comparisons across extreme age groups might offer further mechanistic insights. Other potential confounders, including treatment regimens and time to treatment initiation, were not controlled for.
-
In terms of visual function, BCVA and VF of LO-NMOSD-ON were similar to EO-NMOSD-ON compared with EO-ON. LO-MOG-ON patients only showed a worse BCVA at disease onset and final, whereas LO-IDON-ON patients had a worse final BCVA and VF. In the optic structure of the pRNFL and GCIPL, the degree of structural damage in the optic nerve was similar between EO-ON and LO-ON for the three etiological types. LO-NMOSD-ON had the worst and LO-MOG-ON had the best prognosis. LO-IDON was most likely to have brain involvement.
-
This retrospective and observational study conformed to the principles outlined by the Declaration of Helsinki and was approved by the ethics committee of the Zhongshan Ophthalmology Center of Sun Yat-sen University (approval number 2022KYPJ232; date of approval: November 30, 2022). Written informed consent was obtained from all patients included in the study.
-
The authors confirm their contributions to the paper as follows: conceptualization, methodology, validation, formal analysis, and writing − original draft: Zhang Y; data curation, visualization, and validation: Chen S; methodology, validation, and formal analysis: Xu Z; data curation, software, and visualization: Li X; data curation, methodology: Guo T; resources, validation, and supervision: Xu X; formal analysis, resources: Liu X; validation, supervision: Fu Y; data curation: Qiu Y; conceptualization, validation, investigation, writing − review and editing, and supervision: Yang H. All authors reviewed the results and approved the final version of the manuscript.
-
The data that support the findings of this study are not publicly available because they contain information that could compromise the privacy of research participants. However, the data are available from the corresponding author, Hui Yang, upon reasonable request. Please contact yanghui9@hotmail.com for further inquiries.
-
This clinical research was supported by grants from the National Natural Science Foundation of China to H.Y. (Grant No. 81870656) and the Natural Science Foundation of Guangdong Province of China (Grant No. 2017A030313610).
-
The authors declare that they have no conflict of interest.
-
Authors contributed equally: Yurong Zhang, Siqi Chen, Ziyan Xu
- Copyright: © 2026 by the author(s). Published by Maximum Academic Press, Fayetteville, GA. This article is an open access article distributed under Creative Commons Attribution License (CC BY 4.0), visit https://creativecommons.org/licenses/by/4.0/.
-
About this article
Cite this article
Zhang Y, Chen S, Xu Z, Li X, Guo T, et al. 2026. Comparison of the clinical characteristics and visual outcomes of early- and late-onset optic neuritis. Visual Neuroscience 43: e014 doi: 10.48130/vns-0026-0008 

Comparison of the clinical characteristics and visual outcomes of early- and late-onset optic neuritis
- Received: 10 July 2025
- Revised: 25 December 2025
- Accepted: 13 January 2026
- Published online: 08 April 2026
Abstract: This retrospective single-center study (January 2016 to January 2022) compared the clinical characteristics and visual outcomes between late-onset optic neuritis (LO-ON, onset age ≥ 50 years, n = 66) and early-onset optic neuritis (EO-ON, onset age < 50 years, n = 205) across different etiological subtypes, including neuromyelitis optica spectrum disorder-related optic neuritis (ON) (NMOSD-ON, n = 112), myelin oligodendrocyte glycoprotein antibody-associated ON (MOG-ON, n = 42), and idiopathic ON (IDON, n = 117). All participants were of Asian (Han) ethnicity, with a female-to-male ratio of 2.2:1 and a mean age of 39.9 years (range: 18.0–83.0). Overall, LO-ON accounted for 24.4% of all ON patients and had worse final outcomes than EO-ON in terms of best-corrected visual acuity (BCVA; a median difference = logarithm of the minimum angle of resolution [logMAR] of 0.20, 95% confidence interval [CI]: 0.05 to 0.30, p = 0.003) and visual field mean deviation (VF MD; median difference = −10.00 dB, 95% CI: −15.00 to −4.00, p = 0.001). LO-MOG-ON had a worse BCVA than EO-MOG-ON both at onset (median difference = 0.55 logMAR, 95% CI: 0.10–1.10, p = 0.008) and final follow-up (median difference = 0.20 logMAR, 95% CI: 0.00–0.50, p = 0.042). LO-IDON had a worse final BCVA (median difference = 0.20 logMAR, 95% CI: 0.05–0.40, p = 0.012) and VF MD (median difference = −12.00 dB, 95% CI: −18.00 to −6.00, p = 0.0004) than EO-IDON. No differences existed between LO- and EO-NMOSD-ON. Among LO-ON subtypes, severity at onset was similar. LO-MOG-ON had the best final recovery; LO-NMOSD-ON had the worst VF, the thinnest ganglion cell layer, and the highest relapse rate (75%); LO-IDON had the highest rate of brain demyelinating lesions revealed by magnetic resonance imaging (MRI) (43.3%). Structural damage of the optic nerve was similar between EO-ON and LO-ON across subtypes. LO-MOG-ON and LO-IDON had a poorer final prognosis than their early-onset counterparts.