


-
Type 2 diabetes (T2D) is one of the most serious and widespread long-term diseases, affecting the economy and millions of individuals' health worldwide. According to one investigation[1], the global diabetes prevalence in 2019 was estimated to be 9.3% (463 million people), predicted to rise to 10.2% (578 million) by 2030 and 10.9% (700 million) by 2045[1]. Diabetes is known for its widespread prevalence and high mortality rate. In 2019, diabetes was estimated to contribute to 4.2 million deaths among adults aged 20–79, accounting for 11.3% of global deaths, with 46.2% of these occurring in individuals under 60 years old[2]. However, the IDF (International Diabetes Federation) Diabetes Atlas reported in 2021 that almost half (44.7%) of global diabetes patients were undiagnosed. In the process of preventing and treating diabetes, improving early screening and diagnosis is a crucial issue that cannot be overlooked.
The early symptoms of diabetes are not obvious, and current screening methods are complex and require multiple tests, making early diagnosis difficult[3]. Existing screening methods for diabetes are invasive and often have low patient acceptance. Therefore, it is important to focus on the prevention of T2D and to discover new biomarkers for accurate assessment and monitoring throughout the entire progression of T2D.
The eye is susceptible to metabolic disturbances, and there is increasing evidence of the association between blood glucose levels and retinal thickness. For example, Chua et al.[4] found slightly thinner photoreceptor thickness in participants with higher glycated hemoglobin (HbA1c) within the normal range, whereas the retinal sublayer and overall macular thickness were significantly thinner in patients with diabetes, including undiagnosed diabetes. The study by Tavares Ferreira et al.[5] found that diabetic patients without diabetic retinopathy had a thicker choroid and thinner retina (especially the inner layer) after one year of follow-up. Numerous studies have shown that retinal neurodegeneration is an early manifestation in diabetic patients, even before clinical symptoms appear[6,7]. These findings may offer new insights for diagnosing the disease through ophthalmic imaging examinations. With advancements in retinal imaging technology, the thickness of each retinal layer can be measured using spectral-domain optical coherence tomography (SD-OCT). This technology visualizes the clear hierarchical structure and quantifies the thickness of each sublayer, enabling noninvasive assessment and early management of T2D[8].
The objectives of this study were (1) to analyze the cross-sectional differences in retinal sublayer thickness across clinical stages of T2D; (2) to explore significant changes in retinal sublayer thickness between each two T2D stages; (3) to investigate the prospective association between retinal sublayer thickness and the risk of developing T2D.
-
The UK Biobank (UKB) study[9] is a European multicenter prospective cohort study that recruited 502,565 community citizens aged 40 to 70 years between 2006 and 2010. The participants were assessed at 22 centers across Europe, and extensive phenotypic and genetic data were collected, including questionnaires, physical measurements, biospecimen measurements, multimodal imaging, genome-wide genotyping, and longitudinal follow-up of various health-related outcomes.
Details of the overall research program (
www.ukbiobank.ac.uk/resources ) and individual test programs (https://biobank.ndph.ox.ac.uk/showcase ) are available. The participants completed extensive touch-screen questionnaires covering demographic, socioeconomic, provincial capital, and general and ocular health information. This study was conducted under application number #86091 of the UKB resource, and received ethical approval from the the North West–Haydock Research Ethics Committee (No. 21/NW/0157).Our study included participants from the UKB who had blood glucose or diagnostic information. Subjects with Type 1 diabetes, low vision caused by severe trauma, other serious eye diseases (including glaucoma, retinal detachment and high myopia), or recent ophthalmic surgery and individuals with Alzheimer's disease, Parkinson's disease, or dementia, were excluded, as these conditions could significantly impact retinal thickness measurements. Subjects with hyperopia were not excluded from the primary analysis. Subjects with low signal intensity (Q < 45) and P images exhibiting poor segmentation or focus (defined as falling within the worst 20% of the respective quality metric scores provided by the OCT software) were also excluded[10]. The focus assessment was indicated by the QC-image quality scores (UKB data fields 28,552 and 28,553). The Q < 45 metric refers to the signal intensity score (UKB data fields 28,542 and 28,543), a crucial indicator for overall image quality and effective focus. Image stability metrics such as QC-Min motion correlation and QC-Max motion factor (UKB data fields 28,546–28,551) also indirectly contributed to assessments of focus, as motion artifacts can degrade focus. Segmentation accuracy was evaluated by the OCT instrument's automated quality assessment system, with exclusions based on the worst 20% of the overall segmentation quality score. Although specific segmentation metrics were not individually reported, parameters like the QC-ILM indicator (UKB Data fields 28542 & 28543) and alignment indicators were considered by the software's internal quality scoring. These exclusion criteria ensured the use of high-quality, well-segmented, and well-focused images for reliable retinal thickness analysis[11] (Supplementary Fig. S1).
Ophthalmic examination and image acquisition
-
Retinal SD-OCT imaging in the UKB was performed with high resolution in a closed darkroom. The Topcon 3D OCT-1000 Mk2 scanner (Topcon Inc, Oakland, NJ, USA) was used to capture images and assess retinal sublayer thickness. The system uses a three-dimensional (3D) 6-mm × 6-mm macular volume scanning mode with an axial resolution of 6 μm. The retina was subjected to 512 A-scans and 128 B-scans[12] in 3.6 s. This volumetric acquisition ensures comprehensive data coverage of the macula. Retinal thickness measurements were computed from these 3D volume scans. Topcon's advanced boundary segmentation algorithm version 1.6.1.1 (Topcon, Inc) automatically segmented the retinal sublayers. The foveal center was automatically identified by the OCT instrument's segmentation software based on anatomical landmarks such as the foveal pit and the integrity of the retinal pigment epithelium (RPE) layer. Thickness measurements for each sublayer were then computed within this automatically defined central foveal region, specifically within the central 1-mm Early Treatment Diabetic Retinopathy Study (ETDRS) subfield, a standard region for macular analysis, as defined by the UKB's OCT image analysis pipeline. In our study, the metrics of retinal sublayer thickness included the retinal nerve fiber layer (RNFL), the ganglion cell layer–inner plexiform layer (GCL-IPL), the inner nuclear layer (INL), the inner-segment outer-segment to retinal pigment epithelium (ISOS-RPE), the external limiting membrane (ELM), inner-segment outer-segment (ISOS), the RPE, overall macular thickness, and total macular volume. For all analyses, measurements from one eye per participant (the right eye, unless unavailable/low quality, in which case, the left eye was used) were used to mitigate intereye correlation.
Definition of T2D severity stages
-
The definition and classification of T2D stages and the outcomes of T2D in the UKB study were established using hospital inpatient records and biochemical test data, captured using the Hospital Episode Statistics database, Scottish morbidity records, and the Patient Episode Database. For hospital admission data, the codes of the International Classification of Diseases (ICD), self-reported diabetes, self-reported use of antidiabetic drugs and insulin, and previous diagnoses of T2D by a physician were used to identify the diseases. Diabetes staging was based on objective hospital records and biochemical data, thus blinding was not applicable for assessing the outcomes.
In our study, the entire progression of T2D was divided into five stages: Healthy individuals, prediabetic individuals, T2D patients without any complications, diabetes patients with only microvascular complications, and diabetes patients with both microvascular and macrovascular complications. Although the analyses across these stages are cross-sectional, we conceptualize the observed patterns as a population-level trajectory reflecting structural differences associated with increasing disease severity, rather than true longitudinal within-person progression. Prediabetic individuals were defined as those who have not been diagnosed with T2D but have HbA1c levels between 39 and 48 mmol/mol. Patients with T2D but without any complications are defined as individuals who have been diagnosed with diabetes by a doctor or have HbA1c levels greater than 48 mmol/mol, but do not have any diabetes-related complications. In diabetic patients, microvascular complications refer to the presence of diabetic retinopathy, diabetic nephropathy, or diabetic peripheral neuropathy, either individually or in combination. Macrovascular complications included cardiovascular and cerebrovascular diseases, such as myocardial infarction and stroke. According to the American College of Cardiology, T2D was defined as documented hospitalization or death with an ICD-10 code of E11; T2D with macrovascular complications was defined by ICD-10 codes I20-I25, I50, and I60–I64[13]; and T2D with microvascular complications was defined by codes H36.0, H28.0, E13.3, E10.3, E11.2, E11.3, E11.4, N08.3, G59.0, and G63.2[14].
Covariates
-
Age, sex, education, ethnicity, smoking status, drinking status, health status, physical activity level, Townsend deprivation index, body mass index (BMI), hypertension, hyperlipidemia, blood calcium, and uric acid were included as covariates. Age, sex, education, ethnicity (White vs. non-White), and education level (college vs. no college) were self-reported. Participants completed a detailed questionnaire on a touch-screen computer about their lifestyle, including smoking, drinking, and health status. The Townsend deprivation index is based on employment status, home and car ownership, and household status, with a higher index indicating more deprivation. BMI was defined as weight divided by the square of height. Hypertension and hyperlipidemia were determined on the basis of the population's blood pressure and blood lipid levels. Blood calcium was measured by Arsenazo III analysis on a Beckman Coulter AU5800 system. Blood uric acid was measured by uricase PAP analysis on Beckman Coulter AU5800 equipment.
Statistical analysis
-
Analyses were performed using means (standard deviations [SD]) for continuous variables and numbers (percentages) for categorical variables to describe the baseline characteristics of the participants. Continuous variables were analyzed using t-tests, and categorical variables were analyzed using χ2 tests. In the first part, multiple ordered logistic regression was used to analyze trends of retinal sublayer thickness using the mean for each diabetes stage, and binary logistic regression was used to analyze the differences in retinal thickness between different stages of T2D. Model 1 was adjusted for age and gender. Model 2 was adjusted for age, gender, education level, ethnicity, smoking status, drinking status, health status, physical activity level, Townsend deprivation index, BMI, hypertension, hyperlipidemia, blood calcium, and blood uric acid. In order to evaluate the incremental clinical utility of retinal biomarkers, we performed receiver operating characteristic (ROC) curve analyses. We compared the area under the curve (AUC) of a base model (age, sex, BMI) against models sequentially adding glycemic markers (HbA1c) and OCT-derived retinal thickness metrics.
To ensure the robustness of our findings against potential confounders, we performed several sensitivity analyses. First, we examined the association between retinal sublayer thickness and the entire progression of T2D by excluding individuals with diabetic retinopathy. We also adjusted for spherical equivalent (as a proxy for axial length), polygenic risk score (PRS), dietary composition score, and OCT signal quality (Q-score) in a subset of participants with available data. To address potential bias from self-reported diagnoses, we repeated the primary analyses after excluding participants whose diabetes status was ascertained solely via self-report. Furthermore, whereas ordered logistic regression was used to analyze trends across disease stages, we also used multiple linear regression treating retinal thickness as the dependent variable to confirm these associations.
In the longitudinal analysis, hazard ratios (HR) for the association between baseline retinal sublayer thickness and progression to T2D were analyzed using Cox's proportional hazard models. We first adjusted the models for age and sex (Model 1). Model 2 was adjusted for age, sex, education, ethnicity, smoking status, drinking status, health status, physical activity level, Townsend deprivation index, BMI, hypertension, hyperlipidemia, blood calcium, and uric acid.
All statistical analyses were performed using Stata, version 17.0 (Stata Corporation, College Station, TX, USA), and R (3.4.1, R Project for Statistical Computing, Vienna, Austria). Given the analysis of multiple retinal sublayers and their associations with T2D progression and risk, we performed false discovery rate (FDR) correction to account for multiple comparisons. Specifically, the Benjamini–Hochberg (BH) procedure was applied to the p-values derived from the primary regression analyses (logistic and Cox proportional hazard models). Two-tailed adjusted p-values (q-values) < 0.05 were considered statistically significant.
-
In the cross-sectional study, a total of 502,411 UKB participants were assessed at baseline. After excluding individuals with factors affecting retinal thickness (n = 23,816), missing OCT data (n = 441,601), or missing diabetes data (n = 13,612), 23,062 individuals (18,173 [52.6%] female) aged 40–70 years (mean age: 55.1, SD = 8.2) were included in this part (Supplementary Fig. S1). As diabetes stages progressed, individuals were more likely to be older, male, White, smokers, and nondrinkers, and have lower education levels, worse health status, lower International Physical Activity Questionnaire (IPAQC) scores, higher BMI, hypertension, hyperlipidemia, and higher blood calcium and urate levels (Table 1).
Table 1. Baseline characteristics of participants according to the progression of T2D.
Healthy Pre-T2D T2D without any complications T2D and microvascular complications T2D and macrovascular and microvascular
complicationsp-Value n = 18,019 n = 3,415 n = 1,043 n = 283 n = 302 Age 54.0 (47.0–61.0) 60.0 (54.0–64.0) 60.0 (54.0–64.0) 63.0 (56.0–66.0) 62.5 (58.2–66.0) < 0.001 Sex < 0.001 Female 9,968 (55.3%) 1,899 (55.6%) 444 (42.6%) 121 (42.8%) 75 (24.8%) Male 8,051 (44.7%) 1,516 (44.4%) 599 (57.4%) 162 (57.2%) 227 (75.2%) Education level < 0.001 College/university 7,047 (39.1%) 1,046 (30.6%) 296 (28.4%) 58 (20.5%) 60 (19.9%) Other 10,972 (60.9%) 2,369 (69.4%) 747 (71.6%) 225 (79.5%) 242 (80.1%) Race < 0.001 Other 1,233 (6.84%) 581 (17.0%) 196 (18.8%) 54 (19.1%) 51 (16.9%) White 16,786 (93.2%) 2,834 (83.0%) 847 (81.2%) 229 (80.9%) 251 (83.1%) Smoking status < 0.001 Never 10,419 (58.1%) 1,807 (53.4%) 507 (49.0%) 129 (46.4%) 100 (33.1%) Previous/current 7,502 (41.9%) 1,575 (46.6%) 527 (51.0%) 149 (53.6%) 202 (66.9%) Drinking status < 0.001 Never 664 (3.70%) 232 (6.84%) 73 (7.03%) 32 (11.4%) 33 (10.9%) Previous/current 17,293 (96.3%) 3,158 (93.2%) 966 (93.0%) 249 (88.6%) 269 (89.1%) Health status < 0.001 Worse 14,716 (82.1%) 2,390 (70.9%) 531 (51.4%) 105 (37.4%) 94 (31.1%) Better 3,209 (17.9%) 981 (29.1%) 503 (48.6%) 176 (62.6%) 208 (68.9%) Physical activity level < 0.001 High 6,663 (37.0%) 1,104 (32.3%) 281 (26.9%) 62 (21.9%) 85 (28.1%) Low 2,272 (12.6%) 520 (15.2%) 190 (18.2%) 66 (23.3%) 63 (20.9%) Moderate 6,160 (34.2%) 1,084 (31.7%) 361 (34.6%) 89 (31.4%) 90 (29.8%) Townsend index −1.80 (−3.41 to 0.71) −1.56 (−3.30 to 1.25) −1.04 (−3.23 to 1.80) −0.55 (−2.79 to 2.22) −1.08 (−3.16 to 2.37) < 0.001 BMI 25.8 (23.4–28.5) 28.0 (25.2–31.4) 29.6 (26.8–33.7) 31.4 (28.1–36.0) 30.4 (27.5–33.7) 0.000 Hypertension history < 0.001 No 6,634 (36.8%) 665 (19.5%) 123 (11.8%) 24 (8.48%) 39 (12.9%) Yes 11,385 (63.2%) 2,750 (80.5%) 920 (88.2%) 259 (91.5%) 263 (87.1%) Hyperlipidemia history < 0.001 No 12,107 (67.2%) 1,569 (45.9%) 351 (33.7%) 65 (23.0%) 25 (8.28%) Yes 5,912 (32.8%) 1,846 (54.1%) 692 (66.3%) 218 (77.0%) 277 (91.7%) Calcium 2.38 (2.33–2.44) 2.39 (2.33–2.45) 2.40 (2.34–2.46) 2.39 (2.34–2.48) 2.39 (2.33–2.46) < 0.001 Urate 289 (240–344) 317 (267–372) 322 (267–376) 351 (301–412) 331 (286–390) < 0.001 Data are the mean ± standard deviation, or numbers (%). Analysis of variance was used to test the difference of continuous variables across subgroups of T2D and χ2 for categorical variables. In our longitudinal study, after excluding individuals with factors affecting retinal thickness (n = 21,243), missing OCT data (n = 441,601), or missing diabetes data (n =17,941), 21,626 individuals (9,423 [44.5%] female) aged 40–70 years (mean age: 54.8, SD = 8.1) were included in the longitudinal part. The mean follow-up time was 11.42 years, during which 435 participants were diagnosed with diabetes according to hospital inpatient records (Supplementary Fig. S1). Compared with the healthy group, individuals with incident T2D at baseline were more likely to be older, male, non-White, and smokers, and have lower education levels, worse health status, higher Townsend deprivation index scores, lower IPAQC scores, higher BMI, hypertension, hyperlipidemia, and higher blood urate levels (Supplementary Table S1).
Retinal sublayer thickness across T2D stages
-
We examined differences in retinal sublayer thickness across advancing stages of diabetes at the cross-sectional level. In Model 1, after adjusting for age and gender, the results showed that across more advanced stages of diabetes, the RNFL (OR = 0.967; 95% confidence interval [CI] = 0.960–0.974), GCL-IPL (OR = 0.986; 95% CI = 0.980–0.991, ISOS-RPE (OR = 0.960; 95% CI = 0.952–0.968), ELM-ISOS (OR = 0.917; 95% CI = 0.896–0.939), and overall macular thickness (OR = 0.983; 95% CI = 0.981–0.986) became thinner, whereas the total macular volume became smaller (OR = 0.682; 95% CI = 0.585–0.795), and the pigment epithelial layer (OR = 1.021; 95% CI = 1.010–1.034) became thicker (all FDR-adjusted p < 0.05). After adjusting for covariates in Model 2, the RNFL (OR = 0.982; 95% CI = 0.973–0.992), GCL-IPL (OR = 0.992; 95% CI = 0.985–1.000), ISOS-RPE (OR = 0.980; 95% CI = 0.969–0.990) and overall macular thickness (OR = 0.992; 95% CI = 0.989–0.995) remained significant (all FDR-adjusted p < 0.05). (Table 2, Fig. 1a).
Table 2. Changes in retinal sublayer thickness with T2D progression.
Model 1 Model 2 OR 95% CI p-Value FDR-adjusted p-Value OR 95% CI p-Value FDR-adjusted p-Value RNFL (μm) 0.967 0.960–0.974 < 0.001 0.001 0.982 0.973–0.992 < 0.001 0.003 GCL-IPL (μm) 0.986 0.980–0.991 < 0.001 0.001 0.992 0.985–1.000 0.041 0.082 INL (μm) 0.985 0.971–1.000 0.044 0.044 0.984 0.967–1.002 0.089 0.133 ISOS-RPE (μm) 0.960 0.952–0.968 < 0.001 0.001 0.980 0.969–0.990 < 0.001 0.003 ELM-ISOS (μm) 0.917 0.896–0.939 < 0.001 0.001 0.976 0.948–1.005 0.1 0.133 RPE (μm) 1.021 1.010–1.034 < 0.001 0.001 1.005 0.990–1.020 0.51 0.510 Overall macular thickness (μm) 0.983 0.981–0.986 < 0.001 0.001 0.992 0.989–0.995 < 0.001 0.003 Macular volume (mm3) 0.682 0.585–0.795 < 0.001 0.001 0.889 0.738–1.071 0.216 0.247 Model 1 was adjusted for age and gender. Model 2 was adjusted for age, gender, education level, ethnicity, smoking status, drinking status, health status, physical activity level, Townsend index, BMI, hypertension, hyperlipidemia, blood calcium, and blood uric acid. FDR-adjusted p-value: False discovery rate-adjusted p-value calculated using the Benjamini–Hochberg procedure. Bold values indicate statistical significance (p < 0.05). 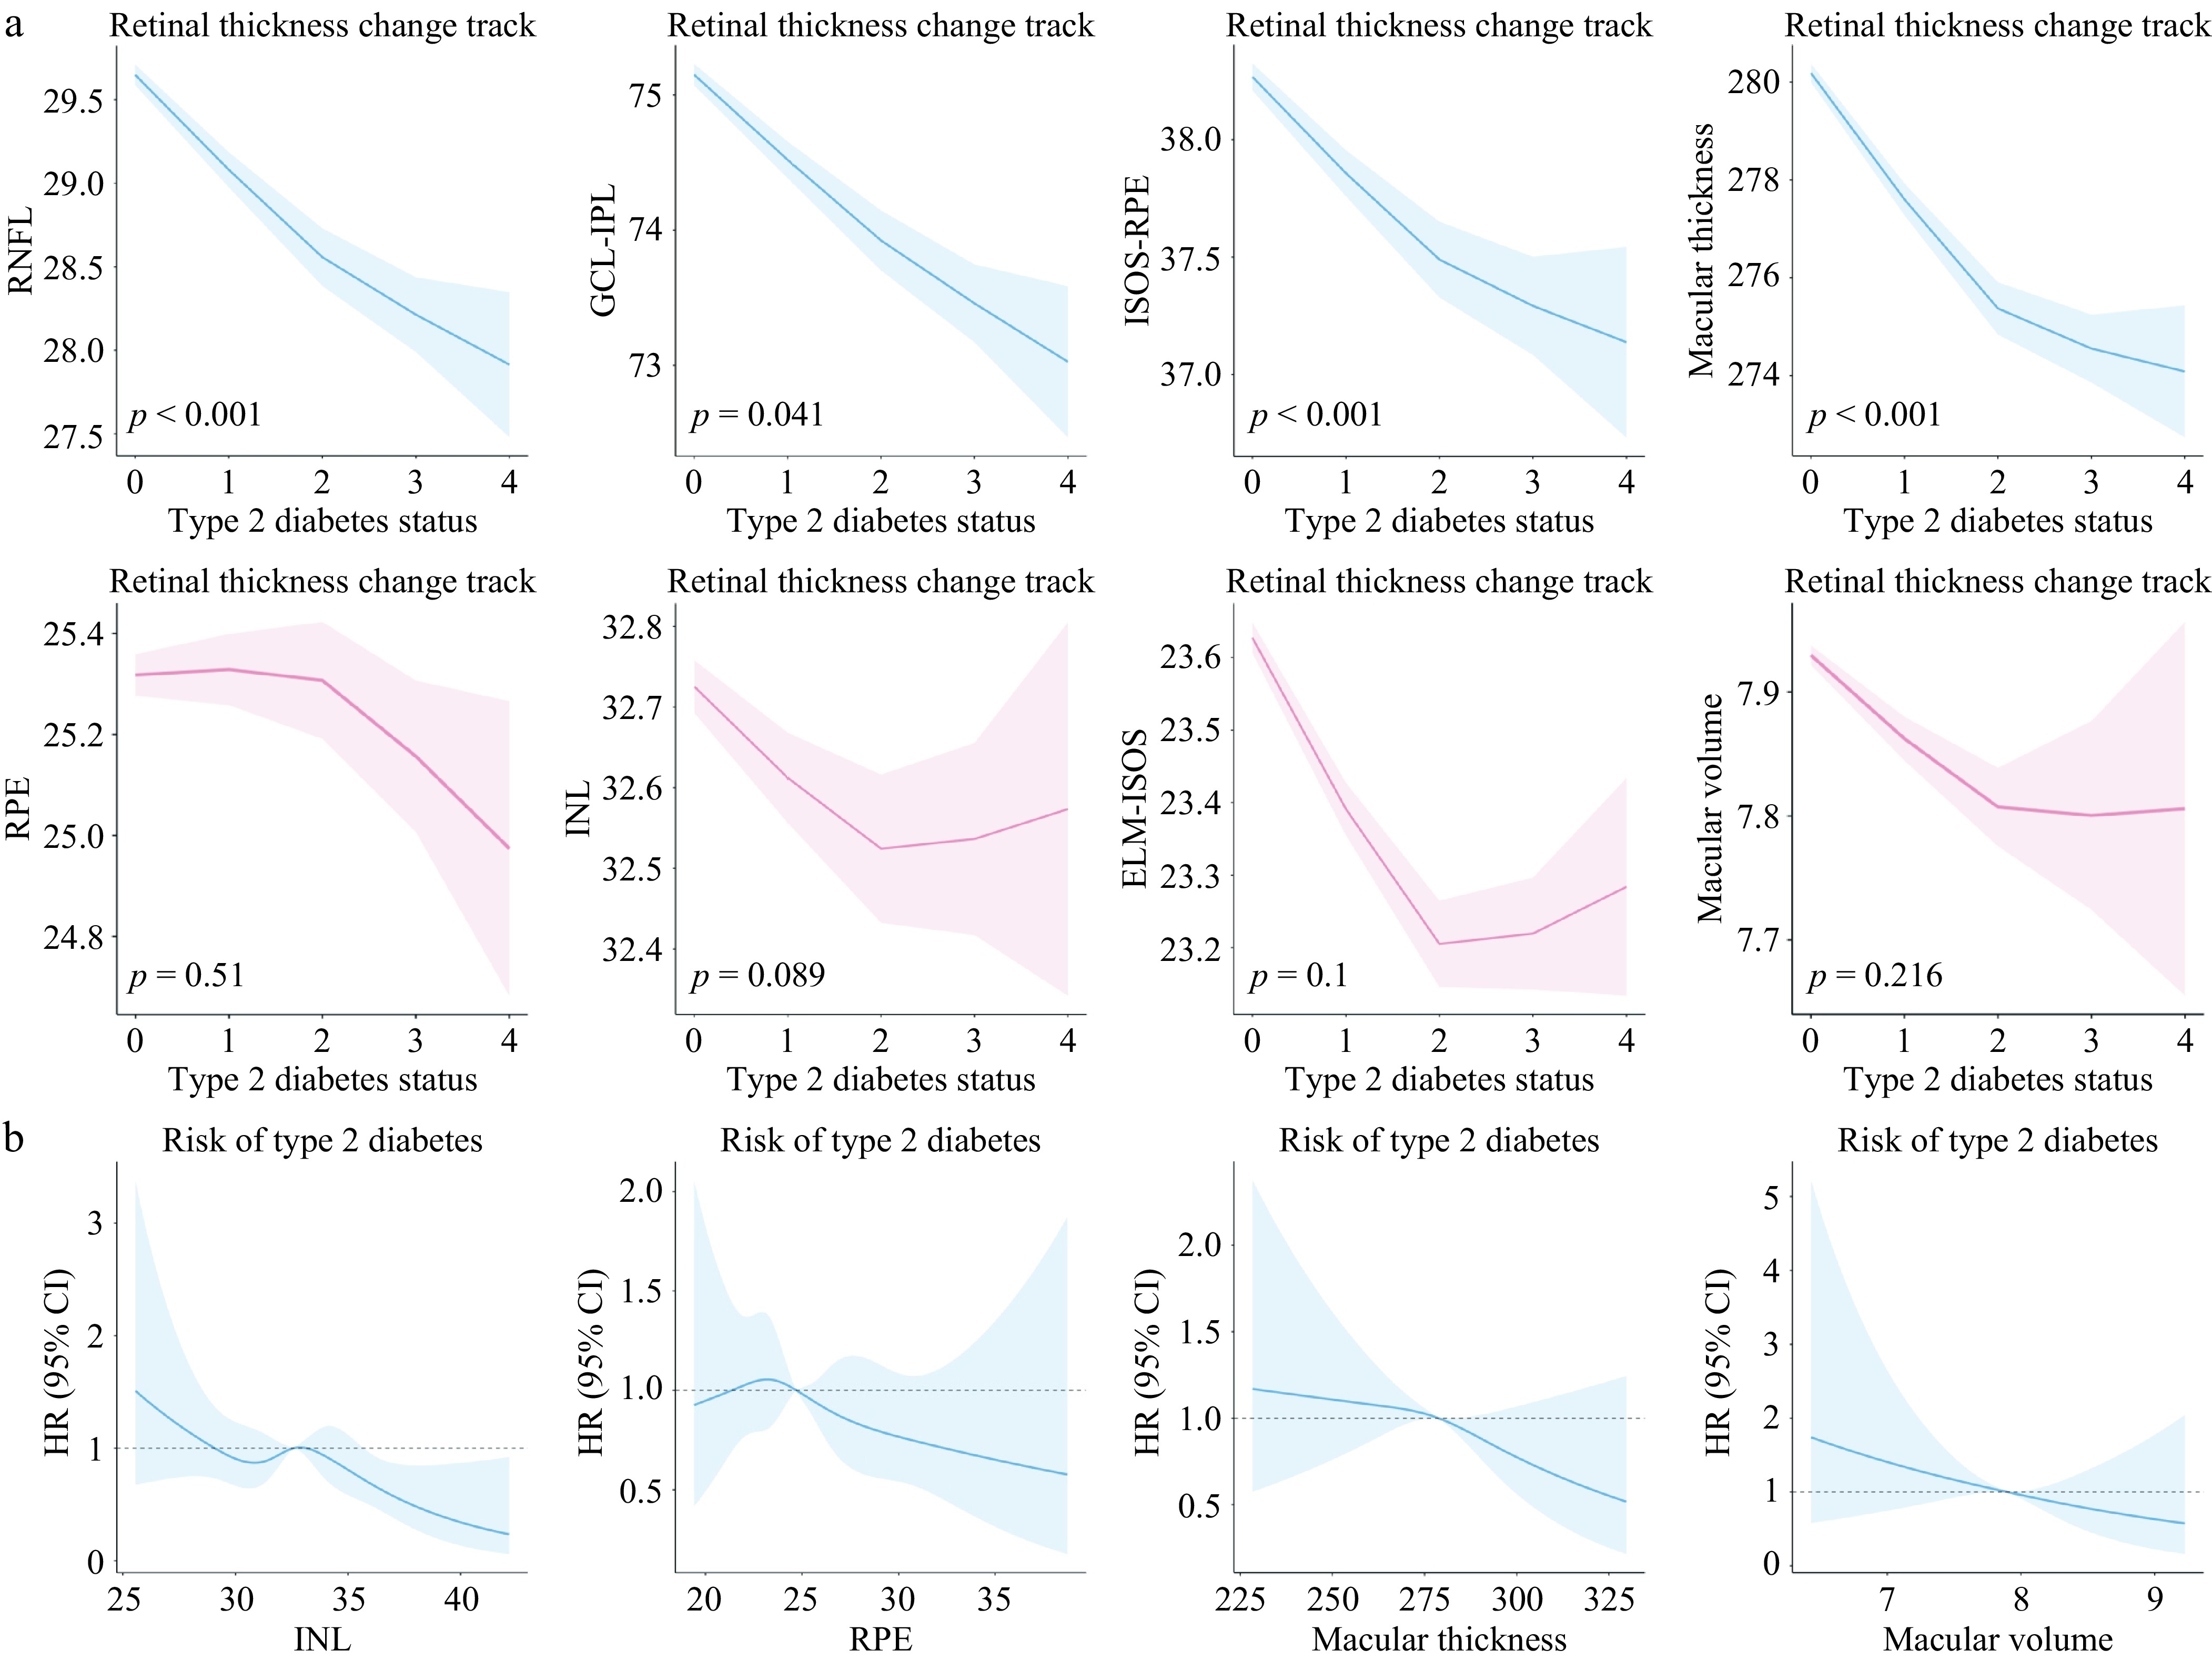
Figure 1.
Nonlinear curve of changes in retinal sublayer thickness with T2D progression and risk. (a) Changes in retinal sublayer thickness with the development of diabetic over time based on restricted cubic spline (RCS). (b) Risk of T2D along with the change in retinal thickness, based on the RCS curve.
Retinal sublayer thickness among different T2D stages
-
The entire progression of T2D was divided into five stages: Healthy individuals, prediabetic individuals, T2D patients without any complication, diabetes patients with only microvascular complications, and diabetes patients with both microvascular and macrovascular complications. Among all groups, we analyzed the differences in retinal sublayer thickness at a cross-sectional level (Table 3).
Table 3. Comparison of retinal sublayer thickness results between different T2D stages.
Model 1 Model 2 OR 95% CI p-Value FDR-adjusted p-Value OR 95% CI p-Value FDR-adjusted p-Value Healthy vs. Pre-T2D RNFL (μm) 0.980 0.997–0.990 < 0.001 0.001 0.990 0.980–0.998 0.045 0.120 GCL-IPL (μm) 0.996 0.990–1.003 0.266 0.266 1.001 0.993–1.010 0.782 0.791 INL (μm) 0.993 0.980–1.010 0.432 0.432 0.997 0.976–1.018 0.791 0.791 ISOS-RPE (μm) 0.970 0.966–0.983 < 0.001 0.001 0.991 0.979–1.003 0.134 0.268 ELM-ISOS (μm) 0.917 0.891–0.943 < 0.001 0.001 0.961 0.930–0.994 0.020 0.080 RPE (μm) 1.026 1.012–1.040 < 0.001 0.001 1.009 0.992–1.026 0.28 0.448 Overall macular thickness (μm) 0.989 0.986–0.992 < 0.001 0.001 0.996 0.992–0.999 0.016 0.080 Macular volume (mm3) 0.721 0.616–0.844 < 0.001 0.001 0.916 0.756–1.110 0.37 0.493 Pre-T2D vs. T2D without any complications RNFL (μm) 0.955 0.941–0.970 < 0.001 0.001 0.972 0.952–0.992 0.005 0.019 GCL-IPL (μm) 0.973 0.963–0.985 < 0.001 0.001 0.979 0.965–0.994 0.007 0.019 INL (μm) 0.970 0.944–0.998 0.036 0.048 0.955 0.920–0.991 0.015 0.024 ISOS-RPE (μm) 0.951 0.938–0.965 < 0.001 0.001 0.975 0.955–0.995 0.013 0.024 ELM-ISOS (μm) 0.918 0.875–0.962 < 0.001 0.001 0.960 0.906–1.018 0.173 0.198 RPE (μm) 1.024 1.001–1.048 0.038 0.048 1.008 0.978–1.039 0.588 0.588 Overall macular thickness (μm) 0.976 0.972–0.981 < 0.001 0.001 0.984 0.978–0.990 < 0.001 0.008 Macular volume (mm3) 0.358 0.197–0.651 0.001 0.002 0.451 0.219–0.931 0.031 0.041 T2D without any complications vs. T2D with microvascular complications RNFL (μm) 0.949 0.922–0.977 < 0.001 0.001 0.963 0.938–1.051 0.057 0.080 GCL-IPL (μm) 0.962 0.942–0.983 < 0.001 0.001 0.961 0.960–0.963 0.007 0.016 INL (μm) 0.969 0.919–1.022 0.255 0.340 0.992 0.928–1.137 0.031 0.054 ISOS-RPE (μm) 0.928 0.907–0.949 < 0.001 0.001 0.929 0.899–0.985 < 0.001 0.004 ELM-ISOS (μm) 0.915 0.837–0.999 0.048 0.096 1.004 0.799–1.085 0.936 0.936 RPE (μm) 1.012 0.968–1.058 0.599 0.599 0.997 0.868–1.038 0.919 0.936 Overall macular thickness (μm) 0.969 0.960–0.977 < 0.001 0.001 0.970 0.956–0.990 < 0.001 0.004 Macular volume (mm3) 0.145 0.021–1.025 0.053 0.096 NA – – – T2D with microvascular complications vs. T2D with microvascular and macrovascular complications RNFL (μm) 0.932 0.907–0.959 < 0.001 0.001 0.970 0.933–1.009 0.128 0.205 GCL-IPL (μm) 0.966 0.946–0.985 0.001 0.002 0.970 0.943–0.998 0.035 0.093 INL (μm) 0.982 0.933–1.034 0.480 0.48 0.943 0.878–1.012 0.104 0.205 ISOS-RPE (μm) 0.946 0.923–0.970 < 0.001 0.001 0.955 0.918–0.994 0.025 0.093 ELM-ISOS (μm) 0.901 0.826–0.982 0.017 0.023 0.976 0.872–1.093 0.676 0.676 RPE (μm) 0.969 0.926–1.013 0.19 0.217 0.982 0.922–1.047 0.585 0.669 overall macular thickness (μm) 0.973 0.965–0.982 < 0.001 0.001 0.982 0.970–0.995 0.005 0.040 Macular volume (mm3)l 0.592 0.179–1.953 0.389 0.389 0.654 0.150–2.841 0.571 0.669 Model 1 was adjusted for age and gender. Model 2 was adjusted for age, gender, education level, ethnicity, smoking status, drinking status, health status, physical activity level, townsend index, BMI, hypertension, hyperlipidemia, blood calcium, and blood uric acid. FDR-adjusted p-value: False discovery rate-adjusted p-value calculated using the Benjamini–Hochberg procedure. Bold values indicate statistical significance (p < 0.05). For healthy individuals and pre-T2D patients in Model 1, RNFL, ISOS-RPE, ELM-ISOS, RPE, overall macular thickness, and total macular volume showed significant differences. However, after full adjustment in Model 2, none of these associations remained significant (all FDR-adjusted p > 0.05).
For pre-T2D patients and T2D patients without any complications, Model 1 showed significant differences in RNFL, GCL-IPL, INL, ISOS-RPE, ELM-ISOS, RPE, overall macular thickness, and total macular volume (all FDR-adjusted p < 0.05). After full adjustment in Model 2, the associations remained significant for RNFL (OR = 0.972; 95% CI: 0.952–0.992), GCL-IPL (OR = 0.979; 95% CI: 0.965–0.994), INL (OR = 0.955; 95% CI: 0.920–0.991), ISOS-RPE (OR = 0.975; 95% CI: 0.955–0.995), overall macular thickness (OR = 0.984; 95% CI: 0.978–0.990), and total macular volume (OR = 0.451; 95% CI: 0.219–0.931) (all FDR-adjusted p < 0.05).
For T2D patients without any complications and those with microvascular complications of T2D, in Model 1, RNFL, GCL-IPL, ISOS-RPE, ELM-ISOS, and overall macular thickness showed significant differences. After adjustment in Model 2, GCL-IPL (OR = 0.961; 95% CI: 0.960–0.963), ISOS-RPE (OR = 0.929; 95% CI: 0.899–0.985), and overall macular thickness (OR = 0.970; 95% CI: 0.956–0.990) remained significant (all FDR-adjusted p < 0.05), whereas RNFL did not survive multiple comparison correction (FDR-adjusted p = 0.080).
For patients with microvascular complications and macrovascular complications, in Model 1, RNFL, GCL-IPL, ISOS-RPE, ELM-ISOS, and overall macular thickness showed significant differences. After adjustment in Model 2, only overall macular thickness remained significant (OR = 0.982; 95% CI: 0.970–0.995; FDR-adjusted p = 0.040).
Incremental predictive value of retinal thickness
-
To comprehensively evaluate whether retinal neuro-structural metrics provide predictive utility beyond established systemic risk factors, we performed hierarchical ROC analyses across varying thresholds of T2D severity (Table 4).
Table 4. Incremental predictive value of retinal sublayer thickness added to clinical models for discriminating the progression of T2D stages.
Outcome cutoff
Stage thresholdModel 1 (baseline) Model 2 (+ glucose) Model 3 (+ glucose + retinal sublayer thickness metrics including RNFL, ISOS-RPE, and overall macular thickness) AUC (95% CI) AUC (95% CI) p-Value (vs. Model 1) AUC (95% CI) p-Value (vs. Model 2) Stage ≥ 1 0.739 (0.731–0.748) 0.771 (0.763–0.779) < 0.001 0.776 (0.768–0.784) < 0.001 Stage ≥ 2 0.783 (0.770–0.796) 0.853 (0.840–0.866) < 0.001 0.859 (0.847–0.871) < 0.001 Stage ≥ 3 0.831 (0.815–0.847) 0.866 (0.851–0.881) < 0.001 0.872 (0.858–0.887) 0.006 Stage ≥ 4 0.835 (0.814–0.856) 0.860 (0.840–0.880) < 0.001 0.864 (0.844–0.884) 0.105 Model 1 (baseline): Adjusted for age, sex, and BMI. Model 2 (clinical): Model 1 + blood glucose levels. Model 3 (combined): Model 2 + OCT-derived retinal sublayer thickness metrics (RNFL, ISOS-RPE, and overall macular thickness) Outcome definitions: The outcome cutoffs represent binary classification tasks at progressively severe thresholds: Stage ≥ 1 distinguishes individuals with any glucose abnormality (Stages 1–4) from healthy controls (Stage 0). Stage ≥ 2 distinguishes individuals with diagnosed T2D (Stages 2–4) from nondiabetic individuals (Stages 0–1). Stage ≥ 3 distinguishes T2D patients with complications (Stages 3–4) from those without complications or diabetes (Stages 0–2). Stage ≥ 4 distinguishes T2D patients with macrovascular events (Stage 4) from all other groups (Stages 0–3). p-values compare the predictive performance between models using the DeLong test for correlated ROC curves. p-values (vs. Model 1) indicate the improvement achieved by adding glucose to the base model; p-values (vs. Model 2) indicates the incremental value of adding OCT metrics to the clinical model. Bold values indicate statistical significance (p < 0.05). We first assessed the discrimination of individuals with any glucose abnormality (Stage ≥ 1, including prediabetes) from healthy controls. The baseline model comprising age, sex, and BMI yielded an AUC of 0.739 (95% CI: 0.731–0.748). The addition of blood glucose significantly improved the AUC to 0.771 (95% CI: 0.763–0.779, p < 0.001). Notably, the further inclusion of retinal sublayer thickness metrics (specifically RNFL and overall macular thickness) resulted in a statistically significant improvement in discriminative performance (AUC = 0.776, 95% CI: 0.768–0.784; p < 0.001 vs. Model 2).
This pattern of incremental value persisted in identifying overt T2D (Stage ≥ 2). The addition of OCT metrics to the glucose-enhanced clinical model significantly increased the AUC from 0.853 to 0.859 (p < 0.001). Furthermore, for identifying patients with microvascular complications (Stage ≥ 3), OCT metrics continued to provide independent predictive value (the AUC improved from 0.866 to 0.872, p = 0.006). However, for the most advanced stage of macrovascular complications (Stage ≥ 4), the incremental benefit was not statistically significant (p = 0.105), likely reflecting the dominant role of systemic vascular risk factors in this group.
Retinal sublayer thickness and incident T2D
-
The Cox regression model showed that after adjusting for age and gender, lower baseline thickness of the RNFL (HR per 1-μm increase = 0.969; 95% CI: 0.947–0.991), ISOS-RPE (HR per 1-μm increase = 0.966; 95% CI: 0.945–0.987), ELM-ISOS (HR per 1-μm increase = 0.921; 95% CI: 0.858–0.988), overall macular thickness (HR per 1-μm increase = 0.983; 95% CI: 0.975–0.990), and total macular volume (HR per 1-mm3 increase = 0.417; 95% CI: 0.279–0.624) was significantly associated with an increased risk of developing T2D in the future (all FDR-adjusted p < 0.05). After fully adjusting for the covariates in Model 2, the protective effect of greater thickness remained significant for the INL (HR per 1-μm increase = 0.927; 95% CI: 0.880–0.977), overall macular thickness (HR per 1-μm increase = 0.988; 95% CI: 0.979–0.997), and total macular volume (HR per 1-mm3 increase = 0.538; 95% CI: 0.336–0.860) (all FDR-adjusted p < 0.05). (Supplementary Table S2, Fig. 1b).
Sensitivity analysis
-
To verify the robustness of our findings and explore the potential role of early neurodegeneration independent of vascular pathology, we performed a comprehensive series of sensitivity analyses (Supplementary Tables S3–S6).
First, we examined whether the observed retinal thinning was driven by the presence of clinically visible diabetic retinopathy (DR). We repeated the analysis after excluding all participants diagnosed with DR (Supplementary Table S3). The results were remarkably consistent with the full cohort analysis: Significant thinning was observed in the RNFL (OR = 0.983; 95% CI: 0.973–0.993), ISOS-RPE (OR = 0.982; 95% CI: 0.972–0.993), and overall macular thickness (OR = 0.992; 95% CI: 0.989–0.995) (all FDR-adjusted p < 0.05). This finding strongly supports the hypothesis that neuro-retinal structural changes occur early in the diabetic process, potentially preceding overt microvascular signs.
Second, to address potential misclassification bias, we excluded participants whose diabetes status was ascertained solely via self-reports. The associations remained robust, with RNFL, ISOS-RPE, and overall macular thickness maintaining high statistical significance (FDR-adjusted p < 0.05) in the fully adjusted models (Supplementary Table S4).
Third, we expanded our adjustment model to include ocular and systemic confounders not in the primary analysis: Spherical equivalent (a proxy for axial length), PRS for T2D, dietary composition, and OCT signal quality. Even after these rigorous adjustments, the thinning of the RNFL (FDR-adjusted p < 0.05), ISOS-RPE (FDR-adjusted p < 0.05), and overall macular thickness (FDR-adjusted p < 0.05) remained statistically significant. However, associations for GCL-IPL and INL were attenuated to nonsignificance in this fully adjusted model (Supplementary Table S5), suggesting that these layers may be more sensitive to ocular biometrics.
Finally, to confirm statistical model independence, we used multiple linear regression. The results paralleled the logistic regression's findings, showing significant inverse associations for RNFL, ISOS-RPE, and overall macular thickness (FDR-adjusted p < 0.05). Notably, in the linear model, GCL-IPL thinning also retained statistical significance (OR = 0.997, FDR-adjusted P = 0.026) (Supplementary Table S6).
-
In this large, multicenter study, we investigated the stage-related differences in retinal sublayer thickness across the clinical spectrum of T2D and explored the association between retinal sublayer thickness and the risk of incident T2D in a longitudinal cohort. We confirmed previous findings from several cohorts that people with diabetes have a thinner RNFL and overall macular thickness than those without diabetes[4,6,7,15]. Notably, in our study, we focus on a more comprehensive progression of T2D, not just between healthy individuals and T2D patients. We found that RNFL, GCL, ISOS, and overall macular thickness were lower in more advanced stages of diabetes. Furthermore, we investigated the relationship between retinal sublayer thickness and the risk of the development of T2D in a longitudinal cohort. The results showed that the thinning of the INL and RPE, overall macular thickness, and smaller total macular volume occurred before the development of glucose abnormalities and could serve as biomarkers for the prediction of future diabetes in the healthy population.
Although our findings demonstrate a robust statistical association, the clinical application of these findings requires careful contextualization. The absolute differences in retinal thickness observed between stages (often < 2 µm) are within the range of measurement variability for individual clinical OCT devices. Therefore, these metrics should not currently be viewed as standalone diagnostic tools replacing HbA1c or fasting glucose. However, we must address the clinical significance of the modest absolute improvements in discrimination. For instance, the addition of OCT metrics to the glucose-enhanced clinical model significantly increased the AUC from 0.853 to 0.859 (p < 0.001) for identifying overt T2D. Although an absolute increase of ~0.006 is numerically small, it must be interpreted within the context of highly predictive baseline models. When a base model incorporating strong systemic markers (like age, BMI, and glucose) already exhibits high discriminative power, achieving large absolute increases in AUC is mathematically constrained. In this context, the statistically significant incremental value demonstrates that retinal metrics capture unique variance related to microvascular and neuro-retinal health that standard systemic metabolic markers cannot detect. Therefore, while a 0.006 increase does not justify replacing the current diagnostic paradigms, on a population screening level, this refined risk stratification could aid in identifying specific "neuro-susceptible" subgroups who may benefit from earlier, targeted neuroprotective interventions.
Our findings are consistent with and extend the growing body of evidence on early retinal neurodegeneration in diabetes. The study by van Dijk et al. was pivotal in demonstrating selective thinning of the inner retinal layers in T2D patients with minimal diabetic retinopathy, highlighting neurodegeneration as an early component of the disease[16]. More recently, Shah et al. provided further evidence of individual macular layer thinning in diabetic eyes, reinforcing this concept[17]. Our study builds upon these important works by demonstrating, in a large-scale population, that this thinning does not occur in isolation but follows a progressive trajectory across the entire clinical spectrum of T2D—from pre-diabetes to advanced complications. Although these prior studies established the principle of early neurodegeneration, our data systematically quantify the changes across multiple sublayers and stages, and further establish the predictive value of specific layers, such as the INL, for future disease onset in a longitudinal setting.
It is important to note the characteristics of the final stage defined in our study: Diabetes with both microvascular and macrovascular complications. As highlighted by our findings, the most pronounced retinal sublayer thinning was observed in this advanced group. Although systemic macrovascular disease (such as cardiovascular or cerebrovascular conditions) may contribute to overall ischemic changes, we must acknowledge that the severe retinal structural alterations in this stage are likely primarily driven by, or heavily compounded by, the concurrent microvascular damage (e.g., diabetic retinopathy)[18,19]. Microvascular complications have a direct, well-established impact on retinal neurovascular integrity. Therefore, the trajectory of retinal thinning observed in this final stage represents the synergistic and overlapping burden of both microvascular and macrovascular deterioration, rather than the isolated effect of macrovascular complications[7].
A number of previous studies have explored the association between diabetes and retinal thickness, but the results have been inconsistent. A cross-sectional study of 128 individuals[15] found that the thickness of the RNFL sublayer was significantly smaller in diabetic patients before the development of DR than in controls, indicating that the thickness of the inner retina in T2D patients became thinner before the vascular signs of DR appeared. The study by Chua et al.[4] found slightly thinner photoreceptor thickness in participants with higher HbA1c within the normal range, whereas retinal sublayer and total overall macular thickness were significantly thinner in diabetic patients, including those with undiagnosed diabetes and higher HbA1c levels. Consistent with these clinical findings, Wang et al. demonstrated, in an animal model, that retinal thickness was significantly reduced in diabetic rats compared with a sham group[20]. These studies are consistent with our research conclusions; however, the sample sizes are relatively small, and HbA1c values do not accurately reflect the severity of diabetes, which may undermine the reliability of the research findings. However, in a longitudinal study of 125 diabetic patients without DR after 1 year of follow-up, Tavares et al. found that the ganglion cell layer, inner plexiform layer, inner nuclear layer, outer plexiform layer, and overall retinal thickness were reduced in diabetic patients without DR compared with healthy individuals[5]. Differences in these sublayers were not observed in our study. In the study by Chhablani[15], it was concluded that GC-IPL and RNFL thickness were not related to the duration of diabetes. The study by Schroder[21] did not find differences in retinal thickness between early diabetic patients and healthy controls. These findings contrast with our study, which found that the RNFL sublayer, ganglion cell layer, photoreceptor layer, and overall macular thickness were progressively thinner with increasing duration of T2D. In addition, our study had a longer follow-up period, further revealing the correlation between the thickness and volume of the inner nuclear layer and the RPE layer, and the risk of developing diabetes.
The mechanism by which diabetes affects retinal thickness is still not fully understood. A large number of studies have confirmed that the hyperglycemic environment of diabetic patients can lead to a series of biochemical and metabolic abnormalities. Hyperglycemia can promote oxidative stress, activate protein kinase C, lead to the accumulation of sorbitol and advanced glycation end products (AGEs), promote the inflammatory response, activate the renin–angiotensin system, and increase the expression of vascular endothelial growth factor (VEGF)[22]. These biochemical and pathological changes can cause damage to the retinal nerves and blood vessels. It leads to tissue ischemia and nerve degeneration. The RNFL is an important structure of the optic nerve, mainly composed of retinal ganglion cell axons, glial cells, and astrocytes. Many studies have found that retinal ischemia leads to the thinning of the RNFL. Some patients with ischemic diseases, such as sickle cell disease or Behcet's disease[23], or those who have used the vasoconstrictor cocaine[24], can have thinning of the RNFL[25]. However, previous studies have found that pathological changes such as retinal cell apoptosis and glial cell activation have been found in diabetic patients without retinal vascular changes[26]. Therefore, the mechanism of retinal damage caused by hyperglycemia may be through direct action on the nerve cells, rather than vascular damage leading to nerve degeneration.
The GCL-IPL layer is mainly composed of retinal ganglion cells (RGCs). The damage to RGCs' function and structure is thought to be caused by a variety of mechanisms, among which the mechanisms related to diabetes include retinal vascular damage and abnormal blood flow, neurotrophin-factor deficiency, and hyperglycemia causing blood–retinal barrier damage and oxidative stress[27]. Oxidative stress generates reactive oxygen species (ROS), which can induce the release of inflammatory cytokines and initiate RGC apoptosis[28]. It has also been shown that the ERK2/1-Drp77-ROS axis involved in ROS can also induce mitochondrial dysfunction and apoptosis in RGCs[29]. This may be the pathophysiological mechanism of diabetic ganglion cell layer thinning.
A study found that compared with the control group, the blood–retinal barrier in diabetic rats induced by streptozotocin for 8 days was significantly damaged. The permeability of the inner nuclear layer to fluorescein was about 10 times that of the photoreceptor layer, indicating that the inner nuclear layer is more prone to damage during the progression of diabetes[30]. In our study, we found that the thickness of the inner nuclear layer is a more sensitive biomarker for predicting T2D in healthy individuals. Those with thinner inner nuclear layers in the retina are at a higher risk of developing diabetes in the future. Previous investigations have already confirmed that the depolarization of the mitochondrial membrane was more pronounced in the neurons of the inner nuclear layer of diabetic rats. The physiological changes in the mitochondria were observed as early as 9 weeks after the induction of diabetes[31]. However, no significant changes in the inner nuclear layer were observed throughout the entire progression of T2D, suggesting that damage to the inner nuclear layer in diabetic patients primarily occurs in the early stages of the disease.
In several studies of age-related macular disease (AMD), inner and outer overall macular thickness, and overall macular thickness and volume have been found to decrease with the progression of AMD, which may be caused by thinning of the RNFL and the inner retina in the macular region[32]. Oxidative stress is the main cause of pathological changes in the macular area associated with AMD[33]. Several studies have found that the risk of AMD is related to multiple links of oxidative stress[34]. Extracellular accumulation of lipid peroxide has been observed in Bruch's membrane of patients with maculopathy, and the use of antioxidants and zinc in the diet can reduce the risk of AMD[35]. Studies have shown that serum oxidative stress markers and total oxidative stress (TOS) were significantly increased in patients with maculopathy compared with healthy individuals. Therefore, we suggest that elevated oxidative stress is a common mechanism of overall macular thickness thinning in diabetic and AMD patients.
This study has several strengths. First, it included a large sample population from multiple centers in Europe for analysis. The UKB database contains a wide range of detailed disease conditions and health factors, and a large sample with complete follow-up for more than 10 years, which ensures the stability of the results to a certain extent. Second, most of the previous studies were simple cross-sectional studies. Based on the cross-sectional results, this study also conducted a longitudinal cohort study and found that RNFL, ISOS-RPE, and overall macular thinning are some of the risk factors for the development of T2D. However, in the whole course of diabetes, the prediabetic state is one of the important stages in the progression of diabetes. We studied the whole course of diabetes and included both prediabetic patients and diabetic patients with microvascular and macrovascular complications. We found the continuity of changes in retinal sublayer thickness over the whole course of diabetes. Although OCT-derived measures do not currently alter standard clinical management or treatment pathways, our findings support their potential role as adjunctive biomarkers for refined risk stratification and early identification of diabetes-related neuro-retinal changes, particularly among individuals with similar glycemic profiles but differing neuro-retinal status.
This study has several limitations. First, some patients in the UKB data lacked diagnostic data in their initial hospital records, so their diagnoses were based on questionnaire reports or biochemical thresholds without direct clinical confirmation, which may have led to classification bias. To address this concern, we conducted a sensitivity analysis excluding participants with self-reported diabetes only. The associations between retinal thickness measures and T2D progression remained largely consistent, suggesting that our findings are robust to this potential source of misclassification. Second, the observed trajectory in cross-sectional analysis reflects group-level stage differences and should not be interpreted as direct temporal change within individuals. Longitudinal studies are needed to validate these findings. Third, strict OCT quality control measures may lead to selection bias, and the UKB participants are predominantly of White European ancestry, which may limit the generalizability of our findings to other ethnic groups. Finally, although we adjusted for an extensive range of covariates and conducted multiple sensitivity analyses, including additional adjustment for refractive error, dietary composition, genetic predisposition to T2D, OCT signal strength, and exclusion of self-reported diabetes cases, residual confounding from unmeasured or imperfectly measured factors cannot be entirely excluded. It is worth noting that the average thickness of the retinal sublayers included in this study was used, but the response of the retina to metabolism may be different in different subregions, and further research on the thickness of the retinal sublayers in different subregions is necessary in the future.
-
In conclusion, certain retinal sublayer thicknesses can serve as sensitive indicators and biomarkers reflecting the development of T2D. Changes in retinal sublayer thickness occur during the preclinical stage of diabetes, showing a graded association with the severity of the disease, and are significantly correlated with the risk of diabetes onset. Future research needs to explore the underlying mechanisms related to changes in retinal thickness in diabetic patients, which could provide a new basis for the early prevention and treatment of T2D.
-
This study was approved by the North West–Haydock Research Ethics Committee (reference 21/NW/0157; approval date 29 June 2021). Data were obtained from UKB, application number 86091. All participants provided written informed consent prior to data collection. This study was performed in accordance with the Declaration of Helsinki.
-
The authors confirm their contributions to the paper as follows: conception and design: Li Q, He J, Lai C; data collection, analysis and/or interpretation: Li Q, Li L, Kong H, Su T, Cao J, Du Z, Wang S, Fang Y; drafting the article: Li Q; final approval of the version to be published: Yu H. All authors reviewed the results and approved the final version of the manuscript.
-
The data that support the findings of this study are available in the UK Biobank repository. These data are available to bona fide researchers through application to the database at www.ukbiobank.ac.uk.
-
This study was funded by the National Natural Science Foundation of China (82171075), the Supporting Fund for NSFC Young Scientists Seed Projects of Guangdong Provincial People's Hospital (KY012026082), and the Postdoctoral Research Funding of Guangdong Provincial People's Hospital (BY012025033).
-
The authors declare that they have no conflict of interest.
-
Authors contributed equally: Qinyi Li, Jiayue He, Chunran Lai
- Supplementary Fig. S1 Flowchart of population selection from the UK Biobank.
- Supplementary Table S1 Baseline characteristics of participants according to incidence of T2D.
- Supplementary Table S2 Association between retinal sub-layer thickness and T2D risk.
- Supplementary Tables S3 Sensitivity analysis of participants with or without diabetic retinopathy.
- Supplementary Table S4 Comparison of retinal sub-layer thickness results across the entire progression of T2D (excluding self-reported cases).
- Supplementary Table S5 Comparison of retinal sub-layer thickness results across the entire progression of T2D (adjusted for additional covariates).
- Supplementary Tables S6 Linear model–based comparison of retinal sub-layer thickness across the entire progression of T2D (adjusted for additional covariates).
- Copyright: © 2026 by the author(s). Published by Maximum Academic Press, Fayetteville, GA. This article is an open access article distributed under Creative Commons Attribution License (CC BY 4.0), visit https://creativecommons.org/licenses/by/4.0/.
-
About this article
Cite this article
Li Q, He J, Lai C, Li L, Kong H, et al. 2026. Stage-related differences in retinal sublayer thickness across the full course of type 2 diabetes. Visual Neuroscience 43: e015 doi: 10.48130/vns-0026-0014 

Stage-related differences in retinal sublayer thickness across the full course of type 2 diabetes
- Received: 02 March 2026
- Revised: 09 March 2026
- Accepted: 16 March 2026
- Published online: 15 April 2026
Abstract: Retinal neurodegeneration is emerging as an early indicator of Type 2 diabetes (T2D). However, large-scale cohort studies evaluating differences in retinal structure across all stages of T2D and their predictive value for incident risk remain limited. In this prospective UK Biobank study, we explored stage-related differences in retinal sublayers' thickness across five categories of T2D severity (healthy, prediabetes, T2D without any complication, T2D with only microvascular complications, and T2D with both micro- and macrovascular complications). Through use of spectral-domain optical coherence tomography imaging and ordinal logistic regression analyses, the relationships between autosegmented retinal fovea thicknesses and disease stages were evaluated. Across increasingly advanced stages of T2D, significant thinning was observed in overall macular thickness (odds ratio [OR] = 0.983, 95% confidence interval [C]I: 0.981–0.986), the retinal nerve fiber layer (OR = 0.967, 95% CI: 0.960–0.974), and the photoreceptor layer (OR = 0.960, 95% CI: 0.952–0.968). Over a median 11.42-year follow-up, 435 of 21,626 initially healthy individuals developed T2D. Cox proportional hazards models, adjusted for sociodemographic factors, lifestyle, body mass index, and metabolic comorbidities, revealed that lower baseline overall macular thickness (hazard ratio [HR] = 0.988, 95% CI: 0.979–0.997), inner nuclear layer thickness (HR = 0.927, 95% CI: 0.880–0.977), and total macular volume (HR = 0.538, 95% CI: 0.336–0.860) were significantly associated with an increased risk of incident T2D. In conclusion, reduced overall macular thickness is a consistent marker of T2D severity and an independent risk factor for incident T2D, highlighting the value of noninvasive retinal measurements for risk prediction and disease monitoring.