ARTICLE   Open Access    

Transcriptomic analysis of grapevine in response to ABA application reveals its diverse regulations during cold acclimation and deacclimation

More Information
  • Abscisic acid (ABA) plays crucial regulatory roles in cold acclimation and deacclimation of grapevine, making it a potential tool to be utilized in vineyards for the acquisition of preferred phenotypes in winter and spring. To understand the function of ABA, we conducted experiments during cold acclimation and deacclimation and evaluated the impact of exogenous ABA on the grapevine transcriptome. RNA-seq data were collected periodically hours or days after ABA treatment. Transcriptomic data were analyzed using principal component analysis (PCA), hierarchical clustering, unsupervised weighed gene co-expression network analysis (WGCNA), contrast-based differentially expressed genes (DEGs) identification and pre-ranked gene set enrichment analysis (GSEA). Our results suggest that ABA functions differently during cold acclimation and deacclimation by selectively regulating key pathways including auxin/indole acetic acid (IAA) metabolism, galactose metabolism and ribosome biogenesis. We also identified the activation of several apparent negative feedback systems that regulated ABA-induced transcriptomic changes, suggesting the existence of a balancing system in response to excessive ABA. This balancing systems potentially eliminates the long-term negative effect on grapevine growing from using ABA in the field. These findings advance our understanding about the regulation of grapevine physiology during dormancy and supports the potential of applying ABA as a cultural practice to mitigate cold injury in winter and spring.
  • The tea plant (Camellia sinensis) was first discovered and utilized in China, where its tender leaves were processed into tea. Tea has become the second most popular beverage after water worldwide. Tea contains tea polyphenols, amino acids, vitamins, lipopolysaccharides and other nutrients, as well as potassium, calcium, magnesium, iron, fluorine and other trace elements, which have antioxidant, lipid-lowering, hypoglycaemic, anti-caries, enhance the body's immunity and other physiological regulatory functions[1]. Among them, fluorine is an element widely found in the earth's crust, mainly in the form of fluoride in the environment, is one of the essential trace elements for human beings, and is vital to the growth and development of human bones and teeth[2]. When the human body takes in an appropriate amount of fluorine, it can effectively prevent the formation of dental caries, enhance the absorption of calcium, phosphorus and other elements of the human body. Excessive intake of fluorine however will lead to chronic cumulative poisoning, damaged bone tissue, affect the function of various tissues and organs in the body, and cause harm to health[3]. Tea plants can absorb and accumulate fluoride from air, water and soil, mainly concentrated in the leaves, most of the fluoride in the leaves can be released into the tea soup and be absorbed by the human body, so the fluoride content in tea is closely related to human health[4]. Generally speaking, green tea, black tea, white tea, oolong tea and yellow tea are made from the young buds and shoots of the tea plant, and their fluorine content is low. Some dark tea made from leaves with lower maturity has lower fluorine content. However, the dark tea made from leaves with higher maturity has a high fluorine content, and therefore poses a risk of excessive fluorine[5]. Long-term drinking of dark tea with excessive fluorine content is a cause of tea-drinking fluorosis[6].

    Dark tea, with its smooth taste and digestive benefits, became an indispensable drink in the lives of the Chinese herders, who were mainly meat eaters[7]. Dark tea has also gained popularity in the wider population because of its important health-promoting effects, such as prevention of cardiovascular and cerebrovascular diseases, lowering blood pressure, and promoting weight loss and fat reduction[8]. Long-term consumption of dark tea is likely to cause fluorosis for two reasons: 1) Chinese border ethnic minorities generally use the boiling method to brew dark tea, which increases the leaching rate of fluoride[9] and leads to high fluoride levels in the human body; 2) most of the fresh tea leaves utilized to make dark tea are older and more mature leaves, which contain higher levels of fluoride than younger leaves[10]. The mature leaves of tea plants accumulate a large amount of fluoride, but can grow normally without fluoride poisoning, indicating that tea plants are able to accumulate and tolerate fluoride. Due to the problem of tea-drinking fluorosis, the excessive accumulation of fluoride in tea plants has attracted widespread attention[10]. It is important to investigate the mechanisms related to fluoride absorption, transportation, enrichment, and tolerance in tea plants to develop effective and practical management and control programs to reduce the fluoride content in tea and ensure its safety. Recent research on defluorination measures for tea has included preliminary screening of tea germplasm resources, management measures during tea plant cultivation, processing technologies, and tea brewing methods. In this review, we summarize the results of studies on how fluoride moves from the environment into tea plants and the factors affecting this process, how fluoride is transported in tea plants, the mechanisms of fluoride tolerance in tea plants, and current measures to reduce the fluoride content in tea.

    Tea plants are fluoride-accumulators with the ability to absorb and accumulate fluoride from the surrounding environment. The fluoride content in tea plants is significantly higher than that of other plants under similar growth conditions[11]. After fluoride is absorbed by the roots of tea plants, it is transferred to the above-ground parts, and is also transferred from the leaves downward (Fig. 1), but not from the above-ground parts to the below-ground parts (Fig. 2). External factors such as atmospheric, soil, and water conditions around the tea plant and internal factors can affect the fluoride content in different plant tissues.

    Figure 1.  Fluoride absorption by tea plants. Tea plants absorb fluoride from the atmosphere, soil, and water. Fluoride in the atmosphere is absorbed through the stomata or cuticle of the leaf epidermis. Fluoride ions and fluoride–aluminum complexes in soil and water are absorbed by the roots.
    Figure 2.  Fluoride transportation in tea plants. Fluoride absorbed by the leaves is transferred to the leaf tips and edges, chelates with metal ions, and the complexes are deposited in the leaves. Fluoride can be transferred from old leaves to new tips. Fluoride from soil and water can form complexes with organic acids and aluminum, which are stored in the leaves of tea plants. Fluoride from soil and water can also be individually absorbed and transported for storage in the leaves.

    Fluoride occurs in many forms in nature. Fluoride in the atmosphere mainly exists in the form of hydrogen fluoride, and that in the soil mainly exists in three forms: insoluble, exchangeable, and water-soluble fluoride. Atmospheric fluoride is mainly absorbed through the stomata of tea plant leaves or the cuticle of the epidermis, and its concentration is relatively low[12]. Insoluble fluoride and exchangeable fluoride in the soil cannot be absorbed by tea plants. Water-soluble fluoride is the main form absorbed by the root system of tea plants[13]. Several studies have detected a significant positive correlation between the fluoride content in tea and the water-soluble fluoride content in soil[14,15]. Water-soluble fluoride mainly refers to the fluoride ion (F) or fluoride complexes in soil and water solutions, including free F and fluoride complexed with ions. The water-soluble state has the strongest activity and the highest biological availability, so it is conducive to the migration of fluoride in the environment[16].

    The root system is the main organ responsible for fluoride absorption in tea plants. Water-soluble fluoride can enter the root system by passive or active absorption, depending on its concentration. Fluoride at lower concentrations in solution (0.1–10 mg/L) is mainly absorbed and enriched in the root system of tea plants via active absorption, with a kinetic curve following the Michalis–Menten kinetic model. At higher concentrations (50–100 mg/L), water-soluble fluoride is absorbed at a rate that increases with increasing concentration, and this is achieved via passive absorption[17]. Many studies have shown that the water-soluble fluoride content in soils in most tea-producing regions in China is below the threshold for passive absorption[1820], indicating that fluoride mainly enters tea plants via active absorption by the roots.

    The active uptake of fluoride by tea roots is mediated by ion pump carrier proteins and ABC transporter proteins. Ion pump carrier proteins can transport the substrate across the cell membrane against the electrochemical gradient, and use the energy of ATP hydrolysis to participate in the process of active transport of substances, mainly including proton pump H+-ATPase and calcium ion pump Ca2+-ATPase. ABC transporter proteins can transport ions or heavy metals to vesicles as chelated peptide complexes, thereby reducing toxicity to the cell and improving plant resistance to abiotic stress. Passive fluoride absorption by the root system of tea plants involves water channels and ion channels. Studies on the effects of applying external anion channel inhibitors, cation channel inhibitors, and water channel inhibitors showed that inhibition of external anion channels significantly reduced the absorption of fluoride by roots. This indicated that anion channels are an important pathway for the uptake and trans-membrane transport of fluoride in the root system of tea plants[17,21,22]. The homeostatic flow of ions through channels diffusing along a trans-membrane concentration gradient or potential gradient involves ion channel proteins[23]. Two phylogenetically independent ion channel proteins have recently been identified in tea plants: CLCF-type F/H+ reverse transporter proteins and the FEX (Fluoride export gene) family of small membrane proteins[24]. CLC proteins are involved in the transport of a variety of anions such as chlorine (Cl) and F into and out of the cell. The FEX proteins in tea plants are involved in fluoride absorption via thermodynamic passive electro-diffusion through transmembrane channels[25,26].

    After fluoride is absorbed, it is transported within the tea plant by several different pathways. These include transport after leaf absorption, transport after root absorption, and transfer inside tea plant cells. The fluoride absorbed by leaves can be transferred along the conduit to the leaf tips and edges, accumulating in the top and ipsilateral leaves, but not in the roots. Fluoride in the soil and water environment is taken up by the root system and transported to the xylem via intracellular and intercellular transport. It is then transported upwards via transpiration and eventually accumulates in the leaves[27,28]. Two transport mechanisms have been proposed for the translocation of fluoride via the xylem. One proposed mechanism is that it is translocated in the form of fluoride-aluminum complexes[29]. The other proposed mechanism is that aluminum and fluoride are transported separately and accumulate after reaching the leaves[30].

    The roots are the main organ responsible for fluoride absorption in tea plants. Therefore, most studies have focused on the transport process in roots, especially the transport of fluoride by fluoride-related transporters. It has been found that under acidic conditions, F preferentially forms complexes with Al3+ and these complexes are then absorbed by roots and transported upward in the same state[29,31]. Studies have shown that, compared with F, aluminum-fluoride complexes are more easily absorbed and transported to the new shoots by the root system. This may be related to the elimination of the separate toxic effects of F and Al3+ [29]. Fluoride can also be transported in tea plants by binding to aluminum-organic acid complexes, and then accumulate in the leaves[29]. Both tea plant fluoride transporter proteins, CsFEX1 and CsFEX2, are involved in fluoride transport, but their encoding genes can be differentially expressed among different varieties and depending on the concentration of fluoride. In one study, the expression level of CsFEX1 was consistent among different varieties, while the expression of CsFEX2 was induced under fluoride stress to increase fluoride efflux from tea plants, thereby reducing its accumulation in low-fluoride varieties[32]. In addition, the A–G subfamily of ABC transporters plays a carrier role in the transmembrane transport of F- and Cl- in tea plants[33]. It was found that the expression of the ABC transporter protein CsCL667 was up-regulated in response to fluoride treatment, and its ability to transport fluoride was enhanced, suggesting that CsCL667 functions in fluoride efflux[34]. Another study demonstrated that CsABCB9 localizes in chloroplasts and functions as a fluoride efflux transporter to reduce fluoride-induced damage in leaves and enhance chloroplast activity[35].

    Several factors affect the absorption and transport of fluoride in tea plants, including the absorbable fluoride concentration, soil pH, the presence of other ions, and the activity of ion channels[3638]. Fluoride in nature is present in the atmosphere and soil, and its concentration is the main factor affecting the fluoride content in tea plants. Under normal conditions, tea plants generally absorb fluoride from the soil through the roots, but when the hydrogen fluoride content in the atmosphere is high, tea plants can absorb it through the leaves. The fluoride content in tea plants growing in the same geographical area is similar, mainly because of the soil properties in that area. Tea plants grow in acidic environments, and fluoride in acidic soils is more easily absorbed. During the growth of tea plants, the roots secrete organic acids such as oxalic acid, citric acid, and malic acid, which promote the absorption of fluoride by the roots and its transport to above-ground parts[39]. Other ions such as Ca2+ and Mg2+ combine with F to form precipitates, resulting in lower concentrations of water-soluble fluoride in the soil, which also affects its absorption by tea plant roots[40]. Exogenously applied calcium at low concentrations can change the cell wall structure and membrane permeability in tea plant roots, ultimately leading to reduced fluoride content in tea leaves[36,41,42]. Meanwhile, Al3+ treatment can trigger Ca2+ signaling in tea plant roots, which in turn activates calmodulin and promotes fluoride absorption[43]. The H+ gradient generated by the plasma membrane H+-ATPase can also promote Ca2+ signaling in plants to regulate the transmembrane transport of ions, which affects fluoride absorption[43]. The abundance and activity of H+-ATPase in the plasma membrane of tea plant roots have been found to increase significantly under fluoride stress, and these increases result in improved absorption of fluoride, although this is also affected by the fluoride concentration and temperature[33]. Sodium fluoride was found to induce the expression of genes encoding ABC transporter proteins, resulting in the transmembrane absorption of large amounts of fluoride ions into cells[34]. ABC transporters also transport ions alone or in the form of chelated peptide complexes directly out of the cellular membrane, which improves cellular tolerance to these ions[44]. Some anions with the same valence state also affect the F content in tea plants. For example, the ion channel protein encoded by CLCF is more sensitive to F, more selective for F than for Cl, and functions to export F from the cytoplasm to protect against fluorosis[4547].

    It can be seen that reducing the absorption of fluorine by tea plants and changing the mechanism of fluorine transportation in tea plants can reduce the content of fluorine in different parts of the tea plants. From the mechanism of fluorine absorption, the most effective way is to directly change the form of soil fluorine to reduce the absorption of water-soluble fluorine by roots. On this basis, it is possible to further change the active absorption process of fluorine mediated by ion pump carrier protein and ABC transporter protein in tea roots by molecular techniques. From the perspective of fluorine transport mechanism, the toxic effect of fluorine on tea plants can be reduced mainly by promoting the function of transporter proteins to exclude fluorine from the cell or transport it to the vesicle. The comprehensive application of the above methods to limit fluorine absorption and promote fluorine transport in tea plants can limit the accumulation of fluorine in tea plants.

    The fluoride enrichment characteristics of tea plants are related to various factors, including the tea variety, the organ, and the season. Among different varieties of tea, differences in leaf structure and other physiological characteristics can lead to variations in fluoride absorption and enrichment[48]. Some studies have concluded that the variety is one of the main determinants of the fluoride content in tea leaves[10], and the differences in fluoride content among most varieties reached highly significant levels (Table 1), which can be divided into low-enriched, medium-enriched, and high-enriched germplasm[49]. Various organs of tea plants also show differences in fluoride accumulation. The fluoride content is much higher in leaves than in roots and stems, and significantly higher in old leaves than in new shoots[10,50,51]. The fluoride content can differ widely among tea plants at different developmental stages. In spring, the new leaves begin to accumulate fluoride from the environment, and the fluoride content increases as the leaves age. When the growth rate of tea leaves is slower, they absorb and accumulate more fluoride from the soil and air. When the temperature in summer and autumn is high, the growth rate of tea leaves is fast and the growth period is short, so less fluoride is absorbed and accumulated from the soil and air. This explains why the fluoride content in fresh tea leaves was higher in spring and relatively lower in summer and autumn[4]. Another study found that, in China, the fluoride content in tea leaves was higher in summer than in spring. This may have been related to the maturity level of the tea leaves at harvest and different patterns of fluoride transport[4].

    Table 1.  Fluoride content difference of different tea cultivars.
    Cultivars Province Parts Treatment Years Content (mg/kg) Ref.
    Liannandaye Sichuan Old leaves Drying at 80 °C and boiling water extraction 2006−2007 1,150.79 ± 4.86 [107]
    Mature leaves Drying at 70 °C and hydrochloric acid extraction 2006 1,296.66 ± 12.84 [110]
    Yuenandaye Old leaves Drying at 80 °C and boiling water extraction 2006−2007 1,352.89 ± 12.69 [107]
    Mature leaves Drying at 70 °C and hydrochloric acid extraction 2006 1,560.36 ± 27.10 [110]
    Chenxi NO.4 Old leaves Drying at 80 °C and boiling water extraction 2006−2007 1,865.61 ± 7.46 [107]
    Mature leaves Drying at 70 °C and hydrochloric acid extraction 2006 1,954.93 ± 10.96 [110]
    Meizhan Old leaves Drying at 80 °C and boiling water extraction 2006−2007 2,180.13 ± 14.42 [107]
    Mature leaves Drying at 70 °C and hydrochloric acid extraction 2006 1,732.2 ± 41.2 [110]
    Zhejiang Mature leaves Drying at 80 °C and nitric acid extraction 2002 2,015.48 ± 29.99 [106]
    Fudingdabai Sichuan Old leaves Drying at 80 °C and boiling water extraction 2006−2007 249.64 ± 24.3 [107]
    Guizhou One bud and
    five leaves
    Drying at 80 °C and hydrochloric acid extraction 2010 1,612.3 ± 43.1 [109]
    Fudingdabai Zhejiang Mature leaves Drying at 80 °C and nitric acid extraction 2002 137.1 ± 2.1 [106]
    Fujian Old leaves Drying at 80 °C and hydrochloric acid extraction 2010 282.1 [111]
    Hunan One bud and
    five leaves
    Steaming and boiling water extraction 2011 2,232.05 ± 85.52 [51]
    Zhuyeqi Ya'an and
    surroundings
    Old leaves Drying at 80 °C and boiling water extraction 2006−2007 2,750.16 ± 11.37 [107]
    Ya'an Mature leaves Drying at 70 °C and hydrochloric acid extraction 2006 125.4 [110]
    Hunan One bud and
    five leaves
    Steaming and boiling water extraction 2011 2,330.74 ± 31.39 [51]
    Fujianshuixian Ya'an and
    surroundings
    Old leaves Drying at 80 °C and boiling water extraction 2006−2007 2,548.18 ± 40.97 [107]
    Ya'an Mature leaves Drying at 70 °C and hydrochloric acid extraction 2006 103.7 ± 1.5 [110]
    Fujian Old leaves Drying at 80 °C and hydrochloric acid extraction 2010 1,150.79 ± 4.86 [111]
    Huangyeshuixian Ya'an and
    surroundings
    Old leaves Drying at 80 °C and boiling water extraction 2006−2007 2,424.70 ± 18.85 [107]
    Ya'an Mature leaves Drying at 70 °C and hydrochloric acid extraction 2006 2,950.80 ± 27.73 [110]
    Qianmei 701 Ya'an and
    surroundings
    Old leaves Drying at 80 °C and boiling water extraction 2006−2007 2,522.01 ± 45.33 [107]
    Ya'an Mature leaves Drying at 70 °C and hydrochloric acid extraction 2006 3,693.09 ± 35.12 [110]
    Guizhou One bud and
    five leaves
    Drying at 80 °C and hydrochloric acid extraction 2010 389.95 ± 32.18 [109]
    Guizhou Old leaves Dry samples and hydrochloric acid extraction 2011 2,142.26 ± 16.30 [113]
    Mingshan 130 Ya'an and
    surroundings
    Old leaves Drying at 80 °C and boiling water extraction 2006−2007 2,564.78 ± 51.22 [107]
    Ya'an Mature leaves Drying at 70 °C and hydrochloric acid extraction 2006 3,036.13 ± 31.25 [110]
    Mengshan 9 Ya'an and
    surroundings
    Old leaves Drying at 80 °C and boiling water extraction 2006−2007 2,647.31 ± 70.89 [107]
    Ya'an Mature leaves Drying at 70 °C and hydrochloric acid extraction 2006 3,436.55 ± 20.21 [110]
    Yinghong NO. 2 Ya'an and
    surroundings
    Old leaves Drying at 80 °C and boiling water extraction 2006−2007 2,669.02 ± 799.95 [107]
    Ya'an Mature leaves Drying at 70 °C and hydrochloric acid extraction 2006 3,364.53 ± 51.72 [110]
    Mengshan 11 Ya'an and
    surroundings
    Old leaves Drying at 80 °C and boiling water extraction 2006−2007 2,695.21 ± 59.89 [107]
    Ya'an Mature leaves Drying at 70 °C and hydrochloric acid extraction 2006 3,582.83 ± 9.73 [110]
    Mingshan 311 Ya'an and
    surroundings
    Old leaves Drying at 80 °C and boiling water extraction 2006−2007 2,716.22 ± 42.21 [107]
    Donghuzao 2,731.20 ± 20.78
    Ya'an Mature leaves Drying at 70 °C and hydrochloric acid extraction 2006 3,107.27 ± 54.91 [110]
    Hainandaye Ya'an and
    surroundings
    Old leaves Drying at 80 °C and boiling water extraction 2006−2007 2,746.82 ± 39.71 [107]
    Ya'an Mature leaves Drying at 70 °C and hydrochloric acid extraction 2006 2,961.53 ± 29.94 [110]
    Qianmei 502 Ya'an and
    surroundings
    Old leaves Drying at 80 °C and boiling water extraction 2006−2007 2,878.23 ± 76.94 [107]
    Ya'an Mature leaves Drying at 70 °C and hydrochloric acid extraction 2006 3,881.51 ± 16.48 [110]
    Guizhou One bud and
    five leaves
    Drying at 80 °C and hydrochloric acid extraction 2010 389.95 ± 30.2 [109]
    Old leaves Dry samples and hydrochloric acid extraction 2011 3,260.48 ± 32.12 [113]
    Zisun Ya'an and
    surroundings
    Drying at 80 °C and boiling water extraction 2006−2007 2,904.13 ± 35.40 [107]
    Ya'an Mature leaves Drying at 70 °C and hydrochloric acid extraction 2006 3,140.80 ± 42.86 [110]
    Zhejiang Drying at 80 °C and nitric acid extraction 2002 1,742.7 ± 43.2 [106]
    Qianmei 303 Ya'an and
    surroundings
    Old leaves Drying at 80 °C and boiling water extraction 2006−2007 2,918.13 ± 46.79 [107]
    Ya'an Mature leaves Drying at 70 °C and hydrochloric acid extraction 2006 4,029.11 ± 81.86 [110]
    Guizhou One bud and
    five leaves
    Drying at 80 °C and hydrochloric acid extraction 2010 199.74 ± 16.6 [109]
    Old leaves Dry samples and hydrochloric acid extraction 2011 2,972.79 ± 169.82 [113]
    Anxishuixian Ya'an and
    surroundings
    Old leaves Drying at 80 °C and boiling water extraction 2006−2007 2,924.33 ± 41.39 [107]
    Ya'an Mature leaves Drying at 70 °C and hydrochloric acid extraction 2006 3,454.68 ± 26.29 [110]
    Longjing 43 Ya'an and
    surroundings
    Old leaves Drying at 80 °C and boiling water extraction 2006−2007 3,152.73 ± 27.70 [107]
    Ya'an Mature leaves Drying at 70 °C and hydrochloric acid extraction 2006 4,437.79 ± 26.14 [110]
    Zhejiang Drying at 80 °C and nitric acid extraction 2002 1,377.1 ± 37.0 [106]
    Fujian Old leaves Drying at 80 °C and hydrochloric acid extraction 2010 116.2 ± 0.9 [111]
    Shuyong 307 Ya'an and
    surroundings
    Drying at 80 °C and boiling water extraction 2006−2007 3,223.55 ± 151.43 [107]
    Ya'an Mature leaves Drying at 70 °C and hydrochloric acid extraction 2006 4,296.52 ± 54.98 [110]
    Zhenghedabaicha Ya'an and
    surroundings
    Old leaves Drying at 80 °C and boiling water extraction 2006−2007 3,295.74 ± 27.55 [107]
    Ya'an Mature leaves Drying at 70 °C and hydrochloric acid extraction 2006 3,876.58 ± 21.09 [110]
    Zhejiang Drying at 80 °C and nitric acid extraction 2002 1,373.0 ± 41.9 [106]
    Taiwandaye Ya'an and
    surroundings
    Old leaves Drying at 80 °C and boiling water extraction 2006−2007 3,363.59 ± 456.39 [107]
    Ya'an Mature leaves Drying at 70 °C and hydrochloric acid extraction 2006 4,739.89 ± 58.59 [110]
    Qianmei 419 Ya'an and
    surroundings
    Old leaves Drying at 80 °C and boiling water extraction 2006−2007 3,518.15 ± 76.19 [107]
    Ya'an Mature leaves Drying at 70 °C and hydrochloric acid extraction 2006 4,541.43 ± 28.91 [110]
    Guizhou One bud and
    five leaves
    Drying at 80 °C and hydrochloric acid extraction 2010 133.70 ± 11.2 [109]
    Old leaves Dry samples and hydrochloric acid extraction 2011 2,370.47 ± 11.43 [113]
    Mengshan23 Ya'an and
    surroundings
    Drying at 80 °C and boiling water extraction 2006−2007 3,625.11 ± 86.07 [107]
    Ya'an Mature leaves Drying at 70 °C and hydrochloric acid extraction 2006 4,469.25 ± 40.85 [110]
    Sichuan group species 2,782.59 ± 146.46
    Meitantaicha Guizhou One bud and
    five leaves
    Drying at 80 °C and hydrochloric acid extraction 2010 272.93 ± 27.3 [109]
    Qianmei 101 Drying at 80 °C and hydrochloric acid extraction 2010 175.07 ± 13.5
    Dry samples and hydrochloric acid extraction 2011 3,218.33 ± 57.91 [113]
    Qianmei 601 Drying at 80 °C and hydrochloric acid extraction 2010 267.11 ± 26.31 [109]
    Dry samples and hydrochloric acid extraction 2011 2,823.02 ± 73.36 [113]
    Qianmei 809 Drying at 80 °C and hydrochloric acid extraction 2010 521.48 ± 50.32 [109]
    Dry samples and hydrochloric acid extraction 2011 2,327.91 ± 83.17 [113]
    Qianmei 308 Drying at 80 °C and hydrochloric acid extraction 2010 326.88 ± 29.3 [109]
    Dry samples and hydrochloric acid extraction 2011 3,432.86 ± 159.4 [113]
    Qianmei 415 Drying at 80 °C and hydrochloric acid extraction 2010 186.95 ± 14.2 [109]
    Dry samples and hydrochloric acid extraction 2011 5,090.83 ± 69.56 [113]
    Qiancha NO. 7 Drying at 80 °C and hydrochloric acid extraction 2010 218.81 ± 18.7 [109]
    Qianfu NO. 4 136.82 ± 11.6
    Dry samples and hydrochloric acid extraction 2011 3,066.49 ± 86.35 [113]
    Guiyucha NO. 8 Drying at 80 °C and hydrochloric acid extraction 2010 191.03 ± 18.6 [109]
    Dry samples and hydrochloric acid extraction 2011 2,882.94 ± 195.73 [113]
    Pingyangtezao Drying at 80 °C and hydrochloric acid extraction 2010 125.02 ± 12.1 [109]
    Yuanxiaolv 244.32 ± 20.5
    Nongkangzao 133.70 ± 12.3
    Mingshan 213 106.98 ± 6.74
    Mingke NO. 4 195.29 ± 16.8
    Maolv 174.73 ± 15.8
    Qianmei 412 Old leaves Dry samples and hydrochloric acid extraction 2011 3,396.92 ± 31.61 [113]
    Meitantaicha 2011 3,085.83 ± 101.9
    Zhenong 138 Zhejiang Mature leaves Drying at 80 °C and nitric acid extraction 2002 805.7 ± 6.0 [106]
    Zhenong 12 1,041.2 ± 23.3
    Shuigu 1,123.2 ± 33.5
    Hanlv 1,152.4 ± 2.4
    Zhuzhichun 1,248.2 ± 2.3
    Lvyafoshou 1,298.1 ± 2.0
    Zhenong 139 1,322.4 ± 40.7
    Shuixian 1,323.5 ± 36.1
    Biyun 1,400.9 ± 0.6
    Soubei 1,487.6 ± 29.7
    Maoxie 1,487.7 ± 31.0
    Anhui NO. 9 1,489.7 ± 40.0
    Zhenong 113 1,492.7 ± 43.5
    Yingshuang 1,509.9 ± 7.2
    Zhenong 25 1,521.2 ± 3.2
    Ribenzhong 1,543.8 ± 33.9
    Yunqi 1,549.3 ± 46.9
    Zhenong 23 1,576.7 ± 11.3
    Huangyezao 1,606.7 ± 40.5
    Jinshi 1,662.4 ± 42.4
    Pingyun 1,676.6 ± 44.6
    Zhenong 21 1,678.8 ± 49.6
    Jinfeng 1,705.2 ± 10.3
    Jiukeng 1,779.2 ± 5.0
    Juhuachun 1,993.4 ± 14.5
    Wuniuzao 2,163.2 ± 15.8
    Fujian Old leaves Drying at 80 °C and hydrochloric acid extraction 2010 98.0 ± 1.3 [111]
    Jinguanyin All leaves Drying at 80 °C and nitric acid extraction 2014−2015 536.49 ± 10.41 [112]
    Dangui 2,598.87 ± 24.12
    Old leaves Drying at 80 °C and hydrochloric acid extraction 2010 145.3 ± 0.2 [111]
    Jinmudan All leaves Drying at 80 °C and nitric acid extraction 2014−2015 1,030.21 ± 36.52 [112]
    Ruixiang Drying at 80 °C and nitric acid extraction 1,315.64 ± 21.56
    Xiapu yuanxiao Old leaves Drying at 80 °C and hydrochloric acid extraction 2010 124.6 ± 3.0 [111]
    Jinxuan 103.7 ± 3.5
    Fuandabai 103.0 ± 1.0
    Fuyun NO. 7 104.0 ± 1.1
    Fuyun NO. 6 131.6 ± 1.8
    Fudingdahao 118.0 ± 2.4
    Zaochunhao 107.7 ± 2.8
    Xiapu chunbolv 99.2 ± 1.2
    BaijiguanF1 102.1 ± 1.1
    Huanguanyin Old leaves Drying at 80 °C and hydrochloric acid extraction 99.2 ± 1.3
    Foxiang NO. 1 Yunnan One bud and
    four leaves
    Drying at 60 °C and hydrochloric acid extraction 2011 155.00 ± 6.94 [108]
    Foxiang NO. 2 214.30 ± 5. 94
    Foxiang NO. 4 219. 50 ± 7. 32
    Foxiang NO. 5 190.70 ± 4.09
    Yunkang NO. 10 121. 30 ± 5. 81
    Yunkang NO. 14 198.50 ± 8.49
    Yuncha NO. 1 135.10 ± 4.74
    Baihaozao Hunan One bud and
    five leaves
    Steaming and boiling water extraction 2011 113.2 [51]
    Bixiangzao 121.4
    Taoyuandaye 177.7
    Yulv 165.9
    Jianbohuang NO.13 168.5
    Gaoyaqi 162.8
     | Show Table
    DownLoad: CSV

    In conclusion, selecting low-fluoride tea varieties and reducing the maturity of dark tea raw materials can be used as effective measures to reduce the fluoride content of dark tea.

    Plants can increase their resistance to fluoride through exocytosis and internal tolerance mechanisms. A series of reactions occurs in tea plants to reduce the toxic effects of fluoride and improve tolerance. The results of recent studies indicate that both external and internal factors are involved in fluoride resistance in tea plants. The external factors include the availability of cations that readily chelate fluoride, and the internal factors include the abundance and activity of certain transporters and the capacity of transporter and antioxidant systems (Fig. 3).

    Figure 3.  Mechanisms of fluoride tolerance in tea plants. (A) Metabolites in tea plants reduce the toxic effect of fluoride. Cell wall macromolecular components such as pectin, lignin, cellulose, hemicellulose, polysaccharide, and proteins chelate fluoride. The contents of some metabolites increase during adaptation of tea plants to fluoride. (B) Complexation of cations (Al3+, Ca2+, and Mg2+) with fluoride in tea plants. (C) Roles of the antioxidant system of tea plant in fluoride tolerance. Increases in the activity/abundance of antioxidant enzymes and in the ASA-GSH cycle reduce intracellular levels of reactive oxygen species, leading to increased fluoride tolerance. (D) Roles of transporters in fluoride tolerance. Transporter proteins transport fluoride into the vacuole, and this compartmentalization reduces damage to enzymes and organelles. The CsFEX, CsCLC, and CsABC transporters efflux fluoride from cells, thereby reducing its toxic effects. POD: Peroxidase, CAT: Catalase, SOD: Superoxide dismutase, APX: Ascorbate peroxidase, GR: Glutathione reductase, DHAR: Dehydroascorbate reductase, ABA: Abscisic acid, GA: Gibberellic acid, GHs: Glycoside hydrolases, ASA-GSH: Antioxidant system and the ascorbate-glutathione, ROS: Reactive oxygen species.

    Fluoride ions have a strong ability to form complexes with metal ions. Free F can form complexes with cations such as Al3+, Fe3+, and Ca2+, thereby altering ionic homeostasis and reducing its toxicity to tea plants[52]. Fluoride and aluminum ions form complexes and are enriched in leaves and other organs with a certain proportion. This reduces the toxicity of both Fl- and Al3+, and may be an important physiological mechanism of fluoride enrichment in tea plants[31,53]. Fluoride can also form complexes with Ca2+, so exogenous application of Ca2+ can effectively reduce the fluoride content and enhance the fluoride resistance of tea plants[42]. Fluoride combines with Mg2+, Al3+, and Ca2+ on the surface of tea leaves, and is present on the abaxial and adaxial leaf surfaces in the form of MgF2 and AlF3. The application of a small amount of MgF2 or CaF2 may be a means to reduce the toxicity of fluoride to tea seedlings[40]. Treatment with selenium was shown to reduce the fluoride content in tea, increase the accumulation of fluoride in roots, and reduce the proportion of water-soluble fluoride in tea beverages[54].

    The cell wall is widely involved in plant growth and development and in various stress responses. Fluoride ions can be chelated by the aldehyde, carboxyl, amino, and phosphate groups in polysaccharides, pectin, lignin, proteins, and other components as well as some metal ions adsorbed in the cell wall, which is usually called cell wall fixation[55,56]. Recent studies have shown that fluoride stress activates pathways related to cell wall metabolism, the stress response, signal transduction, and protein degradation, and all of these pathways may contribute to the accumulation/detoxification of fluoride in tea leaves[57,58]. After the application of exogenous fluoride, there are increase in the activities of key enzymes involved in the pectin biosynthetic pathway, in the transcript levels of their encoding genes, and in the pectin polysaccharide content, indicating that treatment with exogenous fluoride promotes pectin biosynthesis. In turn, it promotes the combination of absorbed fluoride with pectin[59]. Lignin is the main component of the plant cell wall, and its amount and the activity of its biosynthetic pathway increase in response to fluoride stress. The lignin content showed the same trend as the fluoride content in leaves, consistent with its important role in alleviating fluoride toxicity in tea plants[15]. Tea polysaccharides can also adsorb and bind fluoride. Compared with polysaccharides in other plants, tea polysaccharides have the highest fluoride content and the strongest fluoride complexation ability. The majority (80%) of fluoride in tea is bound with tea polysaccharides, and the formation of these complexes is one of the factors that enhances tea plants’ fluoride resistance[60]. Studies have found that with increasing fluoride concentration, the F content in the cell wall and its components, the metal ion content in the cell wall, and the contents in total cell wall materials, cellulose, and pectin increased with highly significant positive correlations[59,61].

    To maintain normal plant growth under adverse conditions, a series of metabolic reactions occur to activate defense responses. The formation and transformation of secondary metabolites under fluoride stress may be one way in which tea plants resist fluoride. One study found that as the fluoride concentration increased, catechin was catabolized to produce lignin, the polyphenol content decreased, and the lignin content increased. Thus, leaf lignification promotes stress resistance in tea plants[62]. Organic acids, carbohydrates, and amino acids also play important roles in the fluoride tolerance of tea plants[63]. The contents of free proline and citric acid were found to increase under fluoride stress, and the oxalic acid content in leaves first increased and then decreased as the fluoride concentration increased. These patterns of accumulation suggested that these metabolites were involved in a protective response against fluoride stress in tea plants[64,65]. Another study detected up-regulation of glycoside hydrolases (GHs), primary amine oxidase, and citrate synthetase under fluoride stress, indicating that these enzymes may be involved in the defense response[66]. Plant growth regulators such as abscisic acid and gibberellin play important roles in the response to fluoride stress and in signal transduction[67,68]. However, further studies are required to explore the roles of these and other plant growth regulators in the responses to fluoride stress and in fluoride enrichment in tea plants.

    Subcellular distribution analyses in tea plants have shown that F is concentrated in vacuoles in the cells of tea leaves, indicating that vacuoles are the main site of fluoride accumulation. Fluoride transporters are involved in the vacuole sequestration of fluoride[52]. The fluoride transporter gene FEX in tea plants is expressed in a tissue-specific manner and its product can enhance tolerance to fluoride by reducing the fluoride content in tissues[26]. Studies have shown that fluoride treatment activates the expression of genes encoding receptor-like kinases and MYB and MADS-box transcription factors, thereby regulating fluoride accumulation and fluoride tolerance in tea plants[6971]. Exploring the regulatory mechanism of fluoride transporters is the key to understanding the fluoride enrichment characteristics of tea plants, and is a new direction for molecular research.

    Under fluoride stress, tea plants can eliminate excess reactive oxygen species (ROS) within a certain concentration threshold by regulating their metabolism, thereby protecting themselves against oxidative damage. Under low-level or short-term fluoride treatments, the antioxidant system and the ascorbate-glutathione (ASA-GSH) cycle respond to fluoride stress, and there are increase in the activities of glutathione reductase, ascorbate peroxidase, dehydroascorbate reductase, peroxidase, catalase, and superoxide dismutase. Together, these enzymes remove ROS to reduce the toxicity of fluoride to tea plants. Tea plants that accumulate high levels of fluoride show a stronger ability to remove ROS[72]. Selenium treatment can also modulate fluoride-induced oxidative damage by increasing the activities of superoxide dismutase, peroxidase, and catalase, resulting in reduced malondialdehyde levels[54]. However, as the fluoride concentration increases beyond the detoxification capacity of protective enzymes and non-enzymatic antioxidants in both systems, ROS accumulate to excess levels and cause damage to tea plants[73].

    In conclusion, there are different forms of resistance to fluoride stress in the tea plants, so the adaptability of tea plants to fluorine stress can be improved by enhancing these resistance mechanisms. Appropriate agronomic measures in the tea gardens can enhance the expression level of stress resistance genes in the tea plants, and then increase the content of downstream metabolites to enhance stress resistance. At the same time, the necessary molecular technology can be used as an auxiliary means to carry out a certain aspect of the targeted improvement, and comprehensively enhance the fluorine tolerance of tea plants.

    Fluoride has dual effects on tea plant growth and metabolites related to tea quality. At low concentrations, fluoride has no obvious effect on growth and can promote the normal physiological metabolism of tea plants. High concentrations of fluoride adversely affect tea plants, inhibit growth, and exert toxic effects to reduce the yield. In addition to yield, metabolites related to tea quality are affected by fluoride. At high concentrations, fluoride reduces the synthesis of key secondary metabolites, free amino acids, polyphenols, and caffeine in tea plants, thereby reducing tea quality. In addition, leaf materials with a high fluoride content result in tea beverages with a high fluoride content (Fig. 4). In this way, excessive fluoride seriously affects the quality and safety of tea. Long-term drinking of tea with a high fluoride content can cause skeletal fluorosis, which endangers the health of consumers.

    Figure 4.  Effects of fluoride stress on tea plant growth and tea quality. Fluoride at low concentrations increases the chlorophyll content, photosynthetic rate, and quality-related metabolites in tea plants; and increases the activity of the antioxidant system and the ASA-GSH cycle to remove reactive oxygen species (ROS). Fluoride at high concentrations that exceed the tolerance limit of tea plants decreases the scavenging capacity of the antioxidant system and the ASA-GSH cycle, resulting in ROS accumulation. In addition, damage to chloroplast thylakoid membranes and decreases in chlorophyll content lead to decreases in the photosynthetic rate, stomatal conductance, and carbon assimilation capacity, resulting in decreased biomass and decreased content of quality-related metabolites, as well as leaf yellowing, leaf abscission, and even plant death. POD: Peroxidase, CAT: Catalase, SOD: Superoxide dismutase, APX: Ascorbate peroxidase, GR: Glutathione reductase, DHAR: Dehydroascorbate reductase, ASA-GSH: Antioxidant system and the ascorbate-glutathione, ROS: Reactive oxygen species.

    The growth responses of tea plants to fluoride depend on its concentration. When tea plants were treated with a low concentration of fluoride, the chlorophyll content and photosynthetic rate increased slightly, the initial respiration mode shifted from the glycolysis pathway to the pentose phosphate pathway, and respiration was enhanced. When tea plants were treated with a high concentration of fluoride, the toxic effect was mainly manifested as inhibition of metabolism and damage to cell structure. Excessive fluoride can damage the chloroplasts and cell membrane system of plants. Fluoride can also combine with Mg2+ in chlorophyll, resulting in damage to the chloroplast thylakoid membranes and significant decreases in the leaf photosynthetic rate, chlorophyll content, net photosynthetic rate, and stomatal conductance[7375]. Fluoride can also inhibit the carbon assimilation process by inhibiting the activity of rubisco, and inhibit the activity of ATP synthase on the thylakoid membrane of chloroplasts, thus hindering photophosphorylation[76]. Fluoride significantly inhibits the activities of enzymes involved in respiration, and causes the mitochondria of tea leaves to become vacuolated and degraded. In severe cases, it causes irreversible damage to mitochondria, which in turn leads to a smaller surface area for enzymes to attach to, resulting in weakened cellular respiration. Blocking of sugar metabolism in tea plants reduces respiration, and so ROS accumulate to excess levels[77,78]. Therefore, fluoride at high concentrations can lead to dwarfism, reduced growth, and leaf chlorosis[79,80]. However, few studies have explored the mechanism of fluoride’s effect on tea plant photosynthesis and respiration, and further research is needed.

    Metabolites that contribute to tea quality include polyphenols, amino acids, alkaloids, and aroma substances. The main class of polyphenols is catechins, followed by flavonoids and anthocyanins. Tea polyphenols confer astringency, an important taste quality character. In addition, the oxidation products of tea polyphenols such as theaflavins and thearubigins contribute to the infusion color of fermented teas such as black tea. Most of the flavonols of tea polyphenols are combined with a glycoside to form flavonoid glycosides, which are important contributors to the infusion color of non-fermented teas such as green tea[81]. Tea polyphenols are important antioxidants, and have tumor-inhibiting, anti-inflammatory, and antibacterial activities. Amino acids contribute to the freshness of tea infusions and are an important tea quality parameter. Amino acids can be divided into protein-source amino acids and non-protein-source amino acids. Theanine, a non-protein-source amino acid, is the main amino acid in tea. Theanine contributes to the freshness of tea infusions and offsets the astringency and bitterness of catechin and caffeine. It also has the effect of calming the nerves and promoting sleep in humans[82,83]. The main alkaloid in tea plants is caffeine, which is mainly synthesized and stored in the leaves, and is often stored in the vacuole as a complex with chlorogenic acid. Caffeine affects the quality of tea infusions, and contributes to the bitter taste. It also forms complexes with theaflavins and other substances with a refreshing taste. The quality of tea products is generally positively correlated with the caffeine content[84]. Caffeine has a stimulating effect and promotes blood circulation. Aroma substances in tea confer its unique scent and are important tea quality characters. The aroma of tea is not only an important and pleasant sensory character, but also an important factor in promoting human health.

    Previous studies have shown that fluoride treatments lead to changes in the types and abundance of metabolites such as minor polypeptides, carbohydrates, and amino acids in tea. However, depending on its concentration, fluoride can have dual effects on the physiological metabolism of tea plants. The contents of tea polyphenols, amino acids, caffeine, and water extracts were found to be enhanced by low concentrations of fluoride, but inhibited by fluoride at high concentrations[85]. Similarly, a low-concentration of fluoride was found to increase the contents of the main aroma components in tea and improve tea quality[86,87]. A high fluoride concentration can lead to significant decreases in the amounts of some tea polyphenols, total catechins, protein, theanine, and caffeine, resulting in decreased tea quality[8789]. Aroma is an important quality character of tea, and studies have shown that the amounts of aroma compounds in tea decrease as the fluoride concentration increases. Most aroma compounds show a trend of increasing and then decreasing as the fluoride concentration increases, and only alcohols show the opposite trend. Thus, a high concentration of fluoride adversely affects tea aroma and flavor quality[86,88]. In general, a high fluoride concentration decreases the abundance of important quality metabolites such as tea polyphenols, amino acids, caffeine, and aroma substances, resulting in weakened taste intensity, freshness, and aroma quality. The quality formation of tea is extremely unfavorable under high-fluoride conditions.

    In summary, fluorine stress affects the growth and metabolite content of tea plants, and then affect the safety and quality of tea products. It is necessary to find suitable measures to reduce fluorine in tea garden production, which can increase the content of tea quality metabolites while ensuring or promoting the growth and development of tea plants. On this basis, it is worth studying to further enhance the content of fluoride-tolerant metabolites of tea plants and is a worthwhile research direction.

    Although tea plants have characteristics of polyfluoride and fluoride resistance, excessive fluoride accumulation can still impair their growth and affect tea yield and quality. The long-term consumption of dark tea made from thick, mature leaves can cause tea-drinking fluorosis, and so dark tea has become an important target of tea safety risk research. On the whole, screening for low-fluoride tea varieties, improving soil management measures in tea plantations, and improving tea processing technologies will contribute to reducing the fluoride content in tea and ensuring its quality and safety (Fig. 5).

    Figure 5.  Defluoridation measures for tea plants. (A) Breeding low-fluoride varieties of tea plants. (B) Improving management measures during tea plant cultivation. (C) Improving tea processing technologies. (D) Appropriate brewing methods to prepare tea infusions.

    The fluoride accumulation characteristics vary among tea varieties and are mainly controlled by genotype. Different tea varieties have different fluoride accumulation capabilities. Selecting appropriate low-fluoride varieties is the primary measure to reduce the fluoride content in tea[10]. The differences in fluoride content among varieties are related to differences in leaf structure. Large and thin leaves with well-developed spongy tissue and large intercellular spaces are conducive to absorbing fluoride from the atmosphere, and accumulate a higher fluoride content[86]. Tea plants mainly absorb fluoride through their roots, and there is a significant correlation between root activity and fluoride content in tea plant roots. Therefore, differences in root activity among varieties may explain differences in fluoride uptake. Studies have also shown that fluoride accumulation in tea plants may be affected by the branching angle, a character that is under moderate to strong genetic control[65]. The fluoride content varies widely among different varieties of tea. Breeding and cultivating tea varieties with low fluoride content is an effective way to produce tea beverages with low fluoride concentrations.

    Tea plants can absorb fluoride from the environment. The origin of tea plants and environmental factors directly affect the accumulation of fluoride[90]. Areas where there is a low fluoride content in the soil should be selected for the cultivation of tea plants. The irrigation water should be low-fluoride water, and there should be no fluoride pollution in the air. At the same time, improving soil management measures can effectively reduce the fluoride content in tea leaves. The use of phosphorus fertilizers should be reduced during the planting process, and chemical or organic fertilizers with low fluoride contents should be used to prevent soil pollution. The application of nitrogen fertilizers at appropriate levels combined with root fertilization and foliar spraying can also affect fluoride enrichment in tea plants[91]. Calcium in different forms and concentrations can form CaF2 with fluoride or change the surface charge of soil particles, ion exchange capacity, and the stability of complexes. These changes can alter the soil pH and affect the soil exchangeable fluoride content[37,92]. Competitive adsorption and material chelation reactions in the soil can reduce the absorbable fluoride content. The addition of charcoal from bamboo and other materials can significantly reduce the water-soluble and available fluoride content in tea garden soil, as well as increasing the contents of organically bound fluoride and Fe/Mn-bound fluoride. This method can reduce the absorption and accumulation of fluoride in tea plants without adversely affecting the contents of major secondary metabolites[93,94]. Humic acid aluminum (HAA) adsorbents and low-molecular-weight organic acids can significantly reduce the fluoride content in the soil solution by chelating soluble fluoride, ultimately reducing its absorption by tea plants[95]. Soil defluoridation agents in tea gardens can decrease the soil fluoride content[96], although they do not necessarily decrease the fluoride content in fresh tea leaves.

    The fluoride content in tea mainly depends on the fluoride content in fresh tea leaves, which is affected by the tea genotype and the soil environment. The processing method has a smaller effect on the fluoride content in tea beverages. Compared to green tea, white tea, black tea, yellow tea and oolong tea, the processing of dark tea uses more mature leaves and old leaves, which affects the fluorine content of the finished tea, and there is a risk of excessive fluorine content, so it is necessary to improve dark tea processing technologies to reduce its fluoride content. One study found that appropriate blending of tea raw materials is an effective processing method to reduce the fluoride content in tea leaves. In this method, the fluoride content is measured when selecting raw materials, and fresh tea leaves with different fluoride contents are screened. Blending raw materials with high fluoride content, medium fluoride content, and low fluoride content can effectively control the final fluoride content[39]. During processing, the fluoride content in the tea leaves can be effectively reduced by washing the rolled tea leaves with room-temperature water for 1–2 min, a process that retains the effective components to the greatest extent[97]. Before the dark tea fermentation process, spraying microbial agents while stirring can effectively reduce the fluoride content and improve the quality, aroma, and taste of dark tea. In the processes of tea manufacturing and deep processing, adding different defluorination agents can effectively reduce the fluoride content in tea products without affecting the quality[94,98,99]. Studies have found that Eurotium cristatum is able to phagocytose fluoride. The fluoride content in black tea was effectively reduced using a E. cristatum strain mutagenized by ultraviolet radiation[100].

    Tea beverages are generally prepared by brewing or boiling. The leaching rate of fluoride from tea is affected by factors such as the extraction time, extraction method, and brewing time. Therefore, the brewing method can affect fluoride intake. The fluoride content in matcha depends, in part, on the brewing conditions[9]. The fluoride leaching rate of dark tea was found to be significantly correlated with the brewing method, and was significantly higher in tea prepared using the boiling method than in tea prepared using the ordinary brewing method. The rate of fluoride leaching from tea prepared using the boiling method was also higher with tap water than with pure water. A higher ratio of tea to water, increased water temperatures, and prolonged brewing time also increase the leaching rate of fluoride from tea[101-103]. Therefore, to significantly reduce the intake of fluoride by consumers and prevent fluorosis, it is recommended that tea should be prepared using pure water for brewing, an appropriate tea-water ratio and water temperature, and a shorter brewing time. Adding food-grade nutritional supplements to tea infusions can also reduce the fluoride content below the standard, and does not significantly affect the other bioactive components and quality factors[98].

    The issue of tea safety is an important concern in society. Research on the mechanisms of fluoride enrichment in tea plants and related research on fluoride control and defluorination technologies is of great significance to tea quality and safety, as well as tea genetics and breeding. Recently, some progress has been made in research on the fluoride enrichment and tolerance mechanisms of tea plants, and this has provided a theoretical basis for further research on methods to reduce the fluoride content in tea.

    (1) Although there has been some progress in research on how tea plants adsorb and transport fluoride, the specific mechanisms are still unclear. Further studies should focus on the molecular mechanisms of fluoride ion transport channel proteins (CLC, FEX, and ABC transporters), their interacting proteins, and how they are regulated to control fluoride enrichment. Studies have shown that the deposition of aluminum-fluoride complexes on the cell wall and compartmentalization in the vacuoles are important mechanisms for the detoxification of these ions in tea plants. However, it is still unclear which proteins regulate the absorption, efflux, transport, and storage of these complexes.

    (2) Tea is rich in secondary metabolites such as polyphenols, polysaccharides, and organic acid. Tea polysaccharides can combine with F to form complexes, thereby reducing the toxic effects of F ions[60]. Tea polyphenols contain multiple phenolic hydroxyl groups, have a strong acid-base buffering capacity, and can form complexes with various metal ions to generate ring-shaped chelates. The flavonol content of polyphenols was found to be significantly positively correlated with Al3+ accumulation, and their binding capacity was found to be higher than that of epigallocatechin gallate and proanthocyanidins in the root[104]. Whether polyphenols can further react with F after complexing with Al3+ is worthy of further study. It will be interesting to explore the roles and mechanisms of secondary metabolites in fluoride enrichment and tolerance in tea plants.

    (3) The degree of fluoride stress affects the growth and quality of tea[105]. How to maintain the balance between fluoride content and quality is a problem that needs to be solved in the industry. The reason why dark tea selects leaves with higher maturity is mainly because, in the same amount of leaves, the leaves with higher maturity contain more effective ingredients such as tea polyphenols, amino acids, trace elements and fiber required by the human body, and the finished dark tea with higher leaf maturity has a lower price and is more acceptable to consumers. If the fluorine content of dark tea is reduced by reducing the maturity of the raw materials, the taste will be inappropriate and difficult to be accepted by consumers. Therefore, it is necessary to reduce the fluorine content while maintaining the quality of dark tea, which needs further research .

    (4) There is still a lack of practical and effective fluoride reduction measures in the tea industry, and the development of such measures will be a key breakthrough. In terms of reducing fluoride levels in tea, the first step is to compare fluoride contents among different tea varieties and select varieties with relatively low fluoride content. The next steps are to improve the management of soil in tea plantations, improve tea processing technologies, and recommend appropriate brewing methods. However, there are still no systematic, efficient, and fully effective management measures for reducing the fluoride content in tea. Breeding new low-fluoride varieties of tea plants using traditional breeding methods is long and difficult, and has not yet been achieved using modern molecular breeding technologies. The use of a single defluoridation measure has certain limitations, so it is advisable to combine several strategies to reduce the fluoride content in tea leaves.

    The authors confirm contribution to the paper as follows: study conception and design: Zeng L; data collection: Yang J, Liu C; analysis and interpretation of results: Yang J, Liu C, Zeng L; draft manuscript preparation: Yang J, Liu C, Li J, Zhang Y, Zhu C, Gu D, Zeng L. All authors reviewed and approved the final version of the manuscript.

    The datasets generated during and/or analyzed during the current study are not publicly available due to management requests, but are available from the corresponding author on reasonable request.

    Part of the research aspects carried out by the authors are supported by the financial support from the Key-Area Research and Development Program of Guangdong Province (2023B0202120001), the Guangdong Natural Science Foundation for Distinguished Young Scholar (2023B1515020107), Tea garden standardized production and processing project of Yigong tea farm in Nyingchi City, the South China Botanical Garden, Chinese Academy of Sciences (QNXM-202302), the fund for China Agriculture Research System (CARS-19), Chinese Academy of Sciences Specific Research Assistant Funding Program (2021000064, 2023000030), the Science and Technology Project of Guangzhou (202206010185), the Guangdong Provincial Special Fund for Modern Agriculture Industry Technology Innovation Teams (2023KJ120), and the Science and Technology plan Project of Qingyuan (220804107510735).

  • The authors declare that they have no conflict of interest.

  • Supplemental Fig. S1 Hierarchical clustering of samples in the acclimation experiment. All genes after low count filtering were used for clustering.
    Supplemental Fig. S2 Hierarchical clustering of samples in the deacclimation experiment. All genes after low count filtering were used for clustering.
    Supplemental Fig. S3 Principal component analysis for the transcriptome of the samples in two experiments. A-B) Two−dimensional profiling of leaf samples in the acclimation experiment using PC1, PC2 and PC3; C-D) Two-dimensional profiling of bud samples in the deacclimation experiment using PC1, PC2 and PC3.
    Supplemental Fig. S4 WGCNA of samples in the acclimation experiment. A) Module-trait relationships; B) ME visualization across all timepoints in the experiment. Input genes are all genes after low count filtering. Error bars represent SE (n = 4). The Module-trait relationships were computed using Pearson method. The first line and second line of each cell represent correlation coefficient and correlation p-value, respectively.
    Supplemental Fig. S5 WGCNA of samples in the deacclimation experiment. A) Module-trait relationships; B) ME visualization across all timepoints in the experiment. Input genes are all genes after low count filtering. Error bars are not shown due to minimum variance among replicates. The Module-trait relationships were computed using Pearson method. The first line and second line of cells represent correlation coefficient and correlation p-value, respectively.
    Supplemental Fig. S6 Remodeling of potential grapevine ribosome in response to ABA application in the deacclimation experiment. Presented ribosome was remodeled in Chimera based on cryo-electron microscopy structure of Arabidopsis thaliana mitochondria ribosome. Only homologous proteins shared between Arabidopsis and Vitis are shown. A-B) Potential ribosome in control samples under permissive growing condition (22 °C) for budburst; C-D) Potential ribosome in ABA-treated samples under same condition. At least one gene encoding each blue-highlighted protein exhibited significantly lower transcript abundance in response to ABA application. Abbreviations: SSU, small subunit; LSU, large subunit.
    Supplemental Fig. S7 Expression of VIT_17s0000g02750, an Arabidopsis RACK1 homolog in Vitis, in two experiments.
  • [1] Thomas CD, Cameron A, Green RE, Bakkenes M, Beaumont LJ, et al. 2004. Extinction risk from climate change. Nature 427:145−48 doi: 10.1038/nature02121

    CrossRef   Google Scholar

    [2] Pacifici M, Foden WB, Visconti P, Watson JEM, Butchart SHM, et al. 2015. Assessing species vulnerability to climate change. Nature Climate Change 5:215−25 doi: 10.1038/nclimate2448

    CrossRef   Google Scholar

    [3] Hong C, Mueller ND, Burney JA, Zhang Y, AghaKouchak A, et al. 2020. Impacts of ozone and climate change on yields of perennial crops in California. Nature Food 1:166−72 doi: 10.1038/s43016-020-0043-8

    CrossRef   Google Scholar

    [4] Mosedale JR, Abernethy KE, Smart RE, Wilson RJ, Maclean IMD. 2016. Climate change impacts and adaptive strategies: lessons from the grapevine. Global Change Biology 22:3814−28 doi: 10.1111/gcb.13406

    CrossRef   Google Scholar

    [5] Leisner CP. 2020. Review: Climate change impacts on food security- focus on perennial cropping systems and nutritional value. Plant Science 293:110412 doi: 10.1016/j.plantsci.2020.110412

    CrossRef   Google Scholar

    [6] Teixeira A, Eiras-Dias J, Castellarin SD, Gerós H. 2013. Berry phenolics of grapevine under challenging environments. International Journal of Molecular Sciences 14:18711−39 doi: 10.3390/ijms140918711

    CrossRef   Google Scholar

    [7] Mosedale JR, Wilson RJ, Maclean IMD. 2015. Climate change and crop exposure to adverse weather: changes to frost risk and grapevine flowering conditions. PLoS One 10:e0141218 doi: 10.1371/journal.pone.0141218

    CrossRef   Google Scholar

    [8] Evans RG. 2000. The art of protecting grapevines from low temperature injury. Proceedings Of ASEV 50th Anniversary Annual Meeting, ASEV 50th Anniversary Annual Meeting, Seattle WA, 2000, pp. 60−72. USA
    [9] Poling EB. 2008. Spring cold injury to winegrapes and protection strategies and methods. HortScience 43:1652−62 doi: 10.21273/HORTSCI.43.6.1652

    CrossRef   Google Scholar

    [10] Zabadal TJ, Dami IE, Goffinet MC, Martinson TE, Chien ML. 2007. Winter injury to grapevines and methods of protection, Vol. Ext. Bul. E2930. Michigan State University Extension
    [11] Lang G, Early J, Martin G, Darnell R. 1987. Endo-, para-, and ecodormancy: physiological terminology and classification for dormancy research. HortScience 22:371−77

    Google Scholar

    [12] Gusta LV, Trischuk R, Weiser CJ. 2005. Plant cold acclimation: the role of abscisic acid. Journal of Plant Growth Regulation 24:308−18 doi: 10.1007/s00344-005-0079-x

    CrossRef   Google Scholar

    [13] Fennell AY, Schlauch KA, Gouthu S, Deluc LG, Khadka V, et al. 2015. Short day transcriptomic programming during induction of dormancy in grapevine. Frontiers in Plant Science 6:834 doi: 10.3389/fpls.2015.00834

    CrossRef   Google Scholar

    [14] Hüner NPA, Bode R, Dahal K, Busch FA, Possmayer M, et al. 2012. Shedding some light on cold acclimation, cold adaptation, and phenotypic plasticity. Botany. 91:127−36

    Google Scholar

    [15] Uemura M, Tominaga Y, Nakagawara C, Shigematsu S, Minami A, et al. 2006. Responses of the plasma membrane to low temperatures. Physiologia Plantarum 126:81−89 doi: 10.1111/j.1399-3054.2005.00594.x

    CrossRef   Google Scholar

    [16] Griffith M, Yaish MWF. 2004. Antifreeze proteins in overwintering plants: a tale of two activities. Trends in Plant Science 9:399−405 doi: 10.1016/j.tplants.2004.06.007

    CrossRef   Google Scholar

    [17] Thomashow MF. 2010. Molecular basis of plant cold acclimation: insights gained from studying the CBF cold response pathway. Plant Physiology 154:571−77 doi: 10.1104/pp.110.161794

    CrossRef   Google Scholar

    [18] Signorelli S, Shaw J, Hermawaty D, Wang Z, Verboven P, et al. 2020. The initiation of bud burst in grapevine features dynamic regulation of the apoplastic pore size. Journal of Experimental Botany 71:719−29 doi: 10.1093/jxb/erz200

    CrossRef   Google Scholar

    [19] Xie Z, Forney CF, Bondada B. 2018. Renewal of vascular connections between grapevine buds and canes during bud break. Scientia Horticulturae 233:331−38 doi: 10.1016/j.scienta.2018.02.019

    CrossRef   Google Scholar

    [20] Chai F, Liu W, Xiang Y, Meng X, Sun X, et al. 2019. Comparative metabolic profiling of Vitis amurensis and Vitis vinifera during cold acclimation. Horticulture Research 6:8 doi: 10.1038/s41438-018-0083-5

    CrossRef   Google Scholar

    [21] Campoy JA, Ruiz D, Egea J. 2011. Dormancy in temperate fruit trees in a global warming context: A review. Scientia Horticulturae 130:357−72 doi: 10.1016/j.scienta.2011.07.011

    CrossRef   Google Scholar

    [22] Dokoozlian NK. 1999. Chilling temperature and duration interact on the budbreak of `Perlette' grapevine cuttings. HortScience. 34(6):1−3 doi: 10.21273/HORTSCI.34.6.1

    CrossRef   Google Scholar

    [23] Londo JP, Johnson LM. 2014. Variation in the chilling requirement and budburst rate of wild Vitis species. Environmental and Experimental Botany 106:138−47 doi: 10.1016/j.envexpbot.2013.12.012

    CrossRef   Google Scholar

    [24] Ferguson JC, Tarara JM, Mills LJ, Grove GG, Keller M. 2011. Dynamic thermal time model of cold hardiness for dormant grapevine buds. Annals of Botany 107:389−96 doi: 10.1093/aob/mcq263

    CrossRef   Google Scholar

    [25] Londo JP, Kovaleski AP. 2017. Characterization of wild North American grapevine cold hardiness using differential thermal analysis. American Journal of Enology and Viticulture 68:203 doi: 10.5344/ajev.2016.16090

    CrossRef   Google Scholar

    [26] Kovaleski AP, Londo JP. 2019. Tempo of gene regulation in wild and cultivated Vitis species shows coordination between cold deacclimation and budbreak. Plant Science 287:110178 doi: 10.1016/j.plantsci.2019.110178

    CrossRef   Google Scholar

    [27] Saddhe AA, Kundan K, Padmanabh D. 2017. Mechanism of ABA signaling in response to abiotic stress in plants. In Mechanism of Plant Hormone Signaling under Stress, ed. PandeyGK , Hoboken, New Jersey: John Wiley & Sons, Inc. pp. 173–95 https://doi.org/10.1002/9781118889022.ch8
    [28] Zheng C, Halaly T, Acheampong AK, Takebayashi Y, Jikumaru Y, et al. 2015. Abscisic acid (ABA) regulates grape bud dormancy, and dormancy release stimuli may act through modification of ABA metabolism. Journal of Experimental Botany 66:1527−42 doi: 10.1093/jxb/eru519

    CrossRef   Google Scholar

    [29] Rubio S, Pérez FJ. 2019. ABA and its signaling pathway are involved in the cold acclimation and deacclimation of grapevine buds. Scientia Horticulturae 256:108565 doi: 10.1016/j.scienta.2019.108565

    CrossRef   Google Scholar

    [30] Li S, Dami IE. 2016. Responses of Vitis vinifera 'Pinot gris' grapevines to exogenous abscisic acid (ABA): I. yield, fruit quality, dormancy, and freezing tolerance. Journal of Plant Growth Regulation 35:245−55 doi: 10.1007/s00344-015-9529-2

    CrossRef   Google Scholar

    [31] Wang H, Blakeslee JJ, Jones ML, Chapin LJ, Dami IE. 2020. Exogenous abscisic acid enhances physiological, metabolic, and transcriptional cold acclimation responses in greenhouse-grown grapevines. Plant Science 293:110437 doi: 10.1016/j.plantsci.2020.110437

    CrossRef   Google Scholar

    [32] Rubio S, Noriega X, Pérez FJ. 2019. Abscisic acid (ABA) and low temperatures synergistically increase the expression of CBF/DREB1 transcription factors and cold-hardiness in grapevine dormant buds. Annals of Botany 123:681−89 doi: 10.1093/aob/mcy201

    CrossRef   Google Scholar

    [33] Rubio S, Noriega X, Pérez FJ. 2019. ABA promotes starch synthesis and storage metabolism in dormant grapevine buds. Journal of Plant Physiology 234–235:1−8 doi: 10.1016/j.jplph.2019.01.004

    CrossRef   Google Scholar

    [34] Vergara R, Noriega X, Aravena K, Prieto H, Pérez FJ. 2017. ABA represses the expression of cell cycle genes and may modulate the development of endodormancy in grapevine buds. Frontiers in Plant Science 8:812 doi: 10.3389/fpls.2017.00812

    CrossRef   Google Scholar

    [35] Ju Y, Yue X, Min Z, Wang X, Fang Y, et al. 2020. VvNAC17, a novel stress-responsive grapevine (Vitis vinifera L.) NAC transcription factor, increases sensitivity to abscisic acid and enhances salinity, freezing, and drought tolerance in transgenic Arabidopsis. Plant Physiology and Biochemistry 146:98−111 doi: 10.1016/j.plaphy.2019.11.002

    CrossRef   Google Scholar

    [36] Noriega X, Pérez FJ. 2017. ABA biosynthesis genes are down-regulated while auxin and cytokinin biosynthesis genes are up-regulated during the release of grapevine buds from endodormancy. Journal of Plant Growth Regulation 36:814−23 doi: 10.1007/s00344-017-9685-7

    CrossRef   Google Scholar

    [37] Dobin A, Davis CA, Schlesinger F, Drenkow J, Zaleski C, et al. 2013. STAR: ultrafast universal RNA-seq aligner. Bioinformatics. 29:15−21 doi: 10.1093/bioinformatics/bts635

    CrossRef   Google Scholar

    [38] Canaguier A, Grimplet J, Di Gaspero G, Scalabrin S, Duchêne E, et al. 2017. A new version of the grapevine reference genome assembly (12X.v2) and of its annotation (VCost.v3). Genomics Data. 14:56−62 doi: 10.1016/j.gdata.2017.09.002

    CrossRef   Google Scholar

    [39] Love MI, Huber W, Anders S. 2014. Moderated estimation of fold change and dispersion for RNA-seq data with DESeq2. Genome Biology 15:550 doi: 10.1186/s13059-014-0550-8

    CrossRef   Google Scholar

    [40] Langfelder P, Horvath S. 2008. WGCNA: an R package for weighted correlation network analysis. BMC Bioinformatics. 9:559 doi: 10.1186/1471-2105-9-559

    CrossRef   Google Scholar

    [41] Subramanian A, Tamayo P, Mootha VK, Mukherjee S, Ebert BL, et al. 2005. Gene set enrichment analysis: A knowledge-based approach for interpreting genome-wide expression profiles. PNAS 102:15545−50 doi: 10.1073/pnas.0506580102

    CrossRef   Google Scholar

    [42] Waltz F, Soufari H, Bochler A, Giegé P, Hashem Y. 2020. Cryo-EM structure of the RNA-rich plant mitochondrial ribosome. Nature Plants 6:377−83 doi: 10.1038/s41477-020-0631-5

    CrossRef   Google Scholar

    [43] Conesa A, Madrigal P, Tarazona S, Gomez-Cabrero D, Cervera A, et al. 2016. A survey of best practices for RNA-seq data analysis. Genome Biology 17(1):13 doi: 10.1186/s13059-016-0881-8

    CrossRef   Google Scholar

    [44] Toubiana D, Puzis R, Sadka A, Blumwald E. 2019. A genetic algorithm to optimize weighted gene co-expression network analysis. Journal of Computational Biology 26:1349−66 doi: 10.1089/cmb.2019.0221

    CrossRef   Google Scholar

    [45] Grimplet J, Cramer GR, Dickerson JA, Mathiason K, Van Hemert J, et al. 2009. VitisNet: "Omics" integration through grapevine molecular networks. PLoS One 4:e8365 doi: 10.1371/journal.pone.0008365

    CrossRef   Google Scholar

    [46] Paul A, Jha A, Bhardwaj S, Singh S, Shankar R, et al. 2014. RNA-seq-mediated transcriptome analysis of actively growing and winter dormant shoots identifies non-deciduous habit of evergreen tree tea during winters. Scientific Reports 4:5932 doi: 10.1038/srep05932

    CrossRef   Google Scholar

    [47] Potvin C, Tardif S. 1988. Sources of variability and experimental designs in growth chambers. Functional Ecology 2:123−30 doi: 10.2307/2389472

    CrossRef   Google Scholar

    [48] Wan X, Li L. 2005. Molecular cloning and characterization of a dehydration-inducible cDNA encoding a putative 9-cis-epoxycarotenoid dioxygenase in Arachis hygogaea L. DNA Sequence 16:217−23 doi: 10.1080/10425170500129785

    CrossRef   Google Scholar

    [49] Yang Y, Tan B. 2014. A distal ABA responsive element in AtNCED3 promoter is required for positive feedback regulation of ABA biosynthesis in Arabidopsis. PLoS One 9:e87283 doi: 10.1371/journal.pone.0087283

    CrossRef   Google Scholar

    [50] Liu S, Li M, Su L, Ge K, Li L, et al. 2016. Negative feedback regulation of ABA biosynthesis in peanut (Arachis hypogaea): a transcription factor complex inhibits AhNCED1 expression during water stress. Scientific Reports 6:37943 doi: 10.1038/srep37943

    CrossRef   Google Scholar

    [51] Wang X, Guo C, Peng J, Li C, Wan F, et al. 2019. ABRE-BINDING FACTORS play a role in the feedback regulation of ABA signaling by mediating rapid ABA induction of ABA co-receptor genes. The New Phytologist 221:341−55 doi: 10.1111/nph.15345

    CrossRef   Google Scholar

    [52] Nishizawa A, Yabuta Y, Shigeoka S. 2008. Galactinol and Raffinose Constitute a Novel Function to Protect Plants from Oxidative Damage. Plant Physiology 147:1251−63 doi: 10.1104/pp.108.122465

    CrossRef   Google Scholar

    [53] Leyser O. 2018. Auxin Signaling. Plant Physiology 176:465−79 doi: 10.1104/pp.17.00765

    CrossRef   Google Scholar

    [54] Emenecker RJ, Strader LC. 2020. Auxin-Abscisic Acid Interactions in Plant Growth and Development. Biomolecules. 10:281 doi: 10.3390/biom10020281

    CrossRef   Google Scholar

    [55] Aloni R, Raviv A, Peterson CA. 1991. The role of auxin in the removal of dormancy callose and resumption of phloem activity in Vitis vinifera. Canadian Journal of Botany 69:1825−32 doi: 10.1139/b91-232

    CrossRef   Google Scholar

    [56] Yao C, Finlayson SA. 2015. Abscisic acid is a general negative regulator of arabidopsis axillary bud growth. Plant Physiology 169:611−26 doi: 10.1104/pp.15.00682

    CrossRef   Google Scholar

    [57] Li X, Chen L, Forde BG, Davies WJ. 2017. The biphasic root growth response to abscisic acid in arabidopsis involves interaction with ethylene and auxin signalling pathways. Frontiers in Plant Science 8:1493 doi: 10.3389/fpls.2017.01493

    CrossRef   Google Scholar

    [58] Byrne ME. 2009. A role for the ribosome in development. Trends in Plant Science 14:512−19 doi: 10.1016/j.tplants.2009.06.009

    CrossRef   Google Scholar

    [59] Ramos RS, Casati P, Spampinato CP, Falcone Ferreyra ML. 2020. Ribosomal protein RPL10A contributes to early plant development and abscisic acid-dependent responses in Arabidopsis. Frontiers in Plant Science 11:1627 doi: 10.3389/fpls.2020.582353

    CrossRef   Google Scholar

    [60] Yamasaki S, Matsuura H, Demura T, Kato K. 2015. Changes in Polysome Association of mRNA Throughout Growth and Development in Arabidopsis thaliana. Plant and Cell Physiology 56:2169−80 doi: 10.1093/pcp/pcv133

    CrossRef   Google Scholar

    [61] Guo J, Wang S, Valerius O, Hall H, Zeng Q, et al. 2011. Involvement of Arabidopsis RACK1 in protein translation and its regulation by abscisic acid. Plant Physiology 155:370−83 doi: 10.1104/pp.110.160663

    CrossRef   Google Scholar

    [62] Berardini TZ, Reiser L, Li D, Mezheritsky Y, Muller R, et al. 2015. The arabidopsis information resource: Making and mining the "gold standard" annotated reference plant genome. Genesis 53:474−85 doi: 10.1002/dvg.22877

    CrossRef   Google Scholar

    [63] Zhang Y, Mechlin T, Dami I. 2011. Foliar application of abscisic acid induces dormancy responses in greenhouse-grown grapevines. HortScience. 46:1271−77 doi: 10.21273/HORTSCI.46.9.1271

    CrossRef   Google Scholar

    [64] Zhang Y, Dami I. 2012. Improving freezing tolerance of 'Chambourcin' grapevines with exogenous abscisic acid. HortScience. 47:1750−57 doi: 10.21273/HORTSCI.47.12.1750

    CrossRef   Google Scholar

    [65] Eichhorn KW, Lorenz DH. 1977. Phenological development stages of the grapevine. Nachrichtenblatt Dtsch. Pflanzenschutzdienstes. 29:119−20

    Google Scholar

    [66] Pettersen EF, Goddard TD, Huang CC, Couch GS, Greenblatt DM, et al. 2004. UCSF Chimera—A visualization system for exploratory research and analysis. Journal of Computational Chemistry 25:1605−12 doi: 10.1002/jcc.20084

    CrossRef   Google Scholar

  • Cite this article

    Wang H, Dami IE, Martens H, Londo JP. 2022. Transcriptomic analysis of grapevine in response to ABA application reveals its diverse regulations during cold acclimation and deacclimation. Fruit Research 2: 1 doi: 10.48130/FruRes-2022-0001
    Wang H, Dami IE, Martens H, Londo JP. 2022. Transcriptomic analysis of grapevine in response to ABA application reveals its diverse regulations during cold acclimation and deacclimation. Fruit Research 2: 1 doi: 10.48130/FruRes-2022-0001

Figures(5)

Article Metrics

Article views(8094) PDF downloads(1108)

ARTICLE   Open Access    

Transcriptomic analysis of grapevine in response to ABA application reveals its diverse regulations during cold acclimation and deacclimation

Fruit Research  2 Article number: 1  (2022)  |  Cite this article

Abstract: Abscisic acid (ABA) plays crucial regulatory roles in cold acclimation and deacclimation of grapevine, making it a potential tool to be utilized in vineyards for the acquisition of preferred phenotypes in winter and spring. To understand the function of ABA, we conducted experiments during cold acclimation and deacclimation and evaluated the impact of exogenous ABA on the grapevine transcriptome. RNA-seq data were collected periodically hours or days after ABA treatment. Transcriptomic data were analyzed using principal component analysis (PCA), hierarchical clustering, unsupervised weighed gene co-expression network analysis (WGCNA), contrast-based differentially expressed genes (DEGs) identification and pre-ranked gene set enrichment analysis (GSEA). Our results suggest that ABA functions differently during cold acclimation and deacclimation by selectively regulating key pathways including auxin/indole acetic acid (IAA) metabolism, galactose metabolism and ribosome biogenesis. We also identified the activation of several apparent negative feedback systems that regulated ABA-induced transcriptomic changes, suggesting the existence of a balancing system in response to excessive ABA. This balancing systems potentially eliminates the long-term negative effect on grapevine growing from using ABA in the field. These findings advance our understanding about the regulation of grapevine physiology during dormancy and supports the potential of applying ABA as a cultural practice to mitigate cold injury in winter and spring.

    • Climate change-associated acute events such as drought, flood and extreme temperatures, pose a threat to the sustainability of global agriculture systems[1, 2]. Perennial crops growers face great challenges as adaptive management approaches such as the adoption of new varieties or the relocation of habitats are economically unfriendly or physically impossible due to the long lifespans and high establishment cost of these crops[3]. For this reason, weather-associated adversity is a primary factor that constrains the expansion of perennial crop production, such as grapevine[4, 5]. Heat waves in summer significantly impact fruit and wine quality due to disruption of the biosynthesis for secondary metabolites such as phenolic and aromatic compounds[6, 7]. Cold damage can be far more disastrous since late frost in spring and extreme low temperatures in winter can kill young shoots and threaten the survival of the whole vine, respectively[8, 9].

      Grapevines, like other perennial plants, overwinter and resume growth through a dormancy cycle along with gaining and losing of cold hardiness[10]. The dormancy cycle is described as two phases of change between three types of dormancy: a transition from paradormancy (apical dominance induced growth inhibition) to endodormancy (endogenous unknown molecular lock induced growth inhibition), and a transition from endodormancy to ecodormancy (environmental factor induced growth inhibition)[11]. The transition from paradormancy to endodormancy usually occurs in late summer along with cold acclimation. Cold acclimation is triggered by short-day photoperiod and progressively induced by non-freezing and freezing temperatures[12, 13]. During cold acclimation, plants initiate a flush of metabolite activities, which results in the altering of photosynthesis efficiency in leaves[14], the modification of plasma membrane composition[15], accumulation of functional metabolites in buds[16] and enhancement of cold hardiness of all overwintering tissues[17]. As a component of establishing cold hardiness, grapevine buds progressively isolate from the cane vascular tissue[18, 19]. Previous multi-omics analysis revealed that the sugar biosynthesis, including monosaccharides, disaccharides and raffinose family oligosaccharides (RFOs) were upregulated at both transcriptomic and metabolomic level during cold acclimation, indicating the importance of sugars in grapevine cold hardiness[20]. However, comprehensive examination of the process of cold acclimation in dormant grapevine tissues remains understudied.

      The transition from endodormancy to ecodormancy occurs in correlation with the accumulation of chilling hours[21]. For grapevine, many different chilling hour models can be used, but most assume temperatures between 7.2 °C to 0 °C effectively contribute to chilling fulfillment[22]. However, the quantity of chilling requirement needed for budbreak exhibits enormous variation across Vitis species[23]. The loss of cold hardiness when warm temperatures occur, termed deacclimation, is enhanced once buds have reached ecodormancy[24, 25]. RNA-seq analysis of the deacclimation process during ecodormancy revealed dozens of biological pathways were differently regulated in four grapevine genotypes[26]. These pathways included critical regulatory pathways (e.g. plant hormone metabolism, hormone signaling and transcription factors), metabolism pathways (e.g. fatty acid metabolism, galactose metabolism, starch and sucrose metabolism and phenylpropanoid metabolism) and basal pathways (e.g. cell cycle, circadian rhythm and photosynthesis).

      Overall, the dormancy cycle is a complex mechanism that merges the onsets or offsets of numerous biological pathways, cascades, and networks. However, abscisic acid (ABA), a plant phytohormone, was noted for its concomitant rhythm with cold acclimation, chilling accumulation and deacclimation[12]. ABA serves as a critical regulator in response to abiotic stresses through the signaling mediated by ABA responsive genes and ABA responsive element binding proteins (AREBs)[27]. For grapevine, endogenous ABA content increases during acclimation and decreases during deacclimation, correlating with the gain and loss of bud cold hardiness[28, 29]. Foliar ABA application on grapevines in late fall (early cold acclimation) enhanced bud cold hardiness in winter[29, 30], and ABA application on ecodormant grapevine buds delayed budburst in spring[26, 28]. These findings not only emphasize an important role for ABA in grapevine cold hardiness, but also suggest that exogenous ABA application might serve as a tool for the mitigation of cold-related injury in grapevines. More precise investigations, such as exogenous ABA's impact on key pathways (e.g. sugar metabolism, protein processing or hormonal signaling) would help understand the underlying mechanism and in turn justify its utilization as a culture practice in vineyards.

      ABA-mediated genetic mechanisms of grapevine cold acclimation or deacclimation have been suggested in recent studies. These include ABA's regulation on RFOs biosynthesis[31], synergy with low temperature on the expression of C-repeat (CRT)-binding factor/dehydration-responsive element (DRE) binding protein 1 (CBF/DREB1)[32], promotion of starch biosynthesis[33], repression of cell cycle genes[34], interaction with transcriptome factors[35] and impact on the biosynthesis of other plant phytohormones[36]. However, most of these studies investigated individual genes or pathways through targeted analytical tools such as qPCR, overlooking the importance of co-regulation networks or signaling cascades. In the era of bioinformatics, tools like RNA-seq coupled with specialized machine learning tools would not only eliminate the biases associated with targeted approaches, but also help generate new knowledge to identify unknown underlying mechanisms.

      This two-part study leverages transcriptomic sequencing (RNA-seq), unsupervised bioinformatic tools, such as principal component analysis (PCA) and weighed gene co-expression network analysis (WGCNA) along with gene set enrichment analysis (GSEA) and 3D modeling to investigate the genetic functionality of ABA during grapevine cold acclimation and deacclimation. The first objective was to identify the functionality of ABA on gene co-expression networks during cold acclimation and deacclimation. The second objective was to evaluate the feasibility of ABA application as a tool for the mitigation of grapevine cold injury and identify transcriptomic targets for future mitigation studies.

    • Two experiments were conducted, (1) during grapevine acclimation (the acclimation experiment) and (2) deacclimation (the deacclimation experiment), to investigate the impact of ABA application on the grapevine transcriptome. Leaves and buds were collected periodically within hours or days after ABA application for RNA-seq in the acclimation and the deacclimation experiment, respectively. RNA-seq samples were collected as triplicates, which generated 40 libraries and 34 libraries in the acclimation experiment and the deacclimation experiment, respectively.

      All libraries in both experiments were examined and passed quality assessment using FastQC to assess read quality (www.bioinformatics.babraham.ac.uk/projects/fastqc). In the acclimation experiment, the mean read length per sequence was 77 bp after trimming of barcode adaptors. Reads per library averaged at 3.8 million, and uniquely mapped rate per library after alignment in STAR[37] averaged at 89.2%. Gene count matrix was generated accordingly using all 42,413 genes in VCost.V3 annotation[38]. After low count filtering, a total of 17,056 genes remained in the gene count matrix, and these genes were examined with DESeq2[39]. Variance stabilization transformation (VST) count of genes was used for hierarchical clustering, which demonstrated that no sample significantly deviated from the main cluster, indicating no outlier presented in the dataset (Supplemental Fig. S1). In the deacclimation experiment, the mean read length per sequence was 66 bp after barcode adaptor trimming. The reads per library averaged at 2.9 million, and the uniquely mapped rate per library after alignment in STAR was 91.0%. After low count filtering, a total of 18,906 genes were left in the gene count matrix and used for downstream analysis. Hierarchical clustering of VST data did not identify any outliers in the dataset (Supplemental Fig. S2).

    • WGCNA[40] was implemented to detect gene co-expression modules in response to ABA application during the course of both experiments.

      In the acclimation experiment, 37 distinct gene co-expression modules with a number of genes ranging from 40 (modules 'yellowgreen' and 'skyblue3') to 2,123 (module 'turquoise') were detected. The genes being independent from any co-expression modules (n = 2,663) were categorized into module 'grey' and excluded for any downstream analysis. PCA analysis of the remaining 14,393 genes explained 36.9% of variance among all samples in the first three components (Supplemental Fig. S3A & S3B). No obvious clustering or separation of samples could be identified in two-dimensional profiling with principal component 1 (PC1) and PC2 (Supplemental Fig. S3A). The treatment effect was partially reflected with PC2 and PC3. Although ABA samples at 2 h post-treatment were not clearly separated from control samples, ABA samples at 4 h, 24 h and 48 h post-treatment clustered towards the lower right section (positive PC2 and negative PC3) of the coordinate system, while control samples clustered towards the upper left section (negative PC2 and positive PC3) of the system (Supplemental Fig. S3B).

      Module eigengenes (ME, PC1 of all genes in the module) of 37 modules were correlated with ABA treatment and time post-treatment and visualized across all timepoints in the experiment (Supplemental Fig. S4). Numerous MEs (e.g. 'tan' and 'green') showed very significant correlations with time post-treatment, and other MEs (e.g. 'red' and 'royalblue') showed very significant correlations with ABA treatment (Supplemental Fig. S4A). Based on MEs visualization, most MEs remained unchanged in response to ABA at 2 h post-treatment, indicating that exogenous ABA's impact on grapevine transcriptome might not be as significant within such small window (Supplemental Fig. S4B). Numerous MEs showed significant responses to ABA treatment from 4 h to 48 h post-treatment (Supplemental Fig. S4B), indicating a weak grouping of ABA-impacted genes in WGCNA. Thus, no target module was specifically selected for the experiment. Instead, a contrast of 'all ABA samples after 2 h post-treatment (n = 12) vs. all control samples after 2 h post-treatment (n = 12)' was applied to all 14,393 genes. Eventually, 273 and 61 genes were found significantly upregulated and downregulated, respectively, by ABA treatment after filtering using p-adj (FDR) < 0.05 and log2 fold change (LFC) > |1| of the contrast. These 334 genes were identified as target DEGs for any downstream analysis in the acclimation experiment.

      In the deacclimation experiment, 17 distinct gene co-expression modules with a number of genes ranging from 66 (modules 'grey60') to 4,357 (module 'turquoise') were detected. As above, 2,091 genes were categorized into module 'grey' and were excluded for any downstream analysis. PCA analysis of the remaining 16,815 genes explained 55.2% of variance among all samples in the first three components (Supplemental Fig. S3C & S3D). ABA samples and control samples were clearly separated between '0' on PC1 (Supplemental Fig. S3C). Time post-treatment effect was revealed by an obvious trend in PC2 and PC3: earlier samples located at the lower right section, and later samples located at the upper left section (Supplemental Fig. S3D).

      Module eigengenes (ME) of 17 modules were correlated with ABA treatment and time post-treatments and visualized across all timepoints in the experiment (Supplemental Fig. S5). Numerous MEs (e.g. 'grey60' and 'blue') showed very significant correlations with time post-treatment, and other MEs (e.g. 'turquoise', 'green' and 'yellow) showed very significant correlations with ABA treatment (Supplemental Fig. S5A). It was also noted that the p-values of the correlations for these three MEs and ABA treatment were much lower than that of the others (Supplemental Fig. S5A). Thus, modules 'turquoise', 'green' and 'yellow' were identified as target modules for this experiment. Based on MEs visualization, the MEs of target modules showed significant and consistent response to ABA treatment, indicating that exogenous ABA's impact on the genes in these modules might be significant during the entire experiment (Supplemental Fig. S5B). A contrast of 'all ABA samples (n = 15) vs. all control samples (n = 15)' was conducted to the genes in target modules. After filtering using FDR < 0.05 and LFC > |1| of the contrast, 1,814 and 523 genes were found significantly upregulated and downregulated, respectively, by ABA treatment. These 2,337 genes were identified as target DEGs for any downstream analysis in this experiment.

    • To clarify functional roles of genes, the target DEGs (V3 annotation) identified from WGCNA modules were matched with their corresponding CRIBI V1 annotations (http://genomes.cribi.unipd.it/grape) for better functional annotations to facilitate GSEA. V3 genes without matching V1 annotations (15 genes in the acclimation experiment and 83 genes in the deacclimation experiment) were excluded for downstream analysis. Pre-ranked GSEA was separately conducted using target DEGs in the acclimation experiment, target DEGs in the deacclimation experiment and shared target DEGs in both experiments. Within each DEGs list, GSEA was further separately conducted according to response category (all, downregulated by ABA or upregulated by ABA). For the GSEA of target DEGs in the acclimation and the deacclimation experiments, the ranking criterium was the FDR of the specific contrast created for the experiment per se. For the GSEA of shared target DEGs, the ranking criterium was the mean FDR of two contrasts for two experiments. Only the pathways with NOM p-value < 0.1 are shown in GSEA summary (Fig. 1).

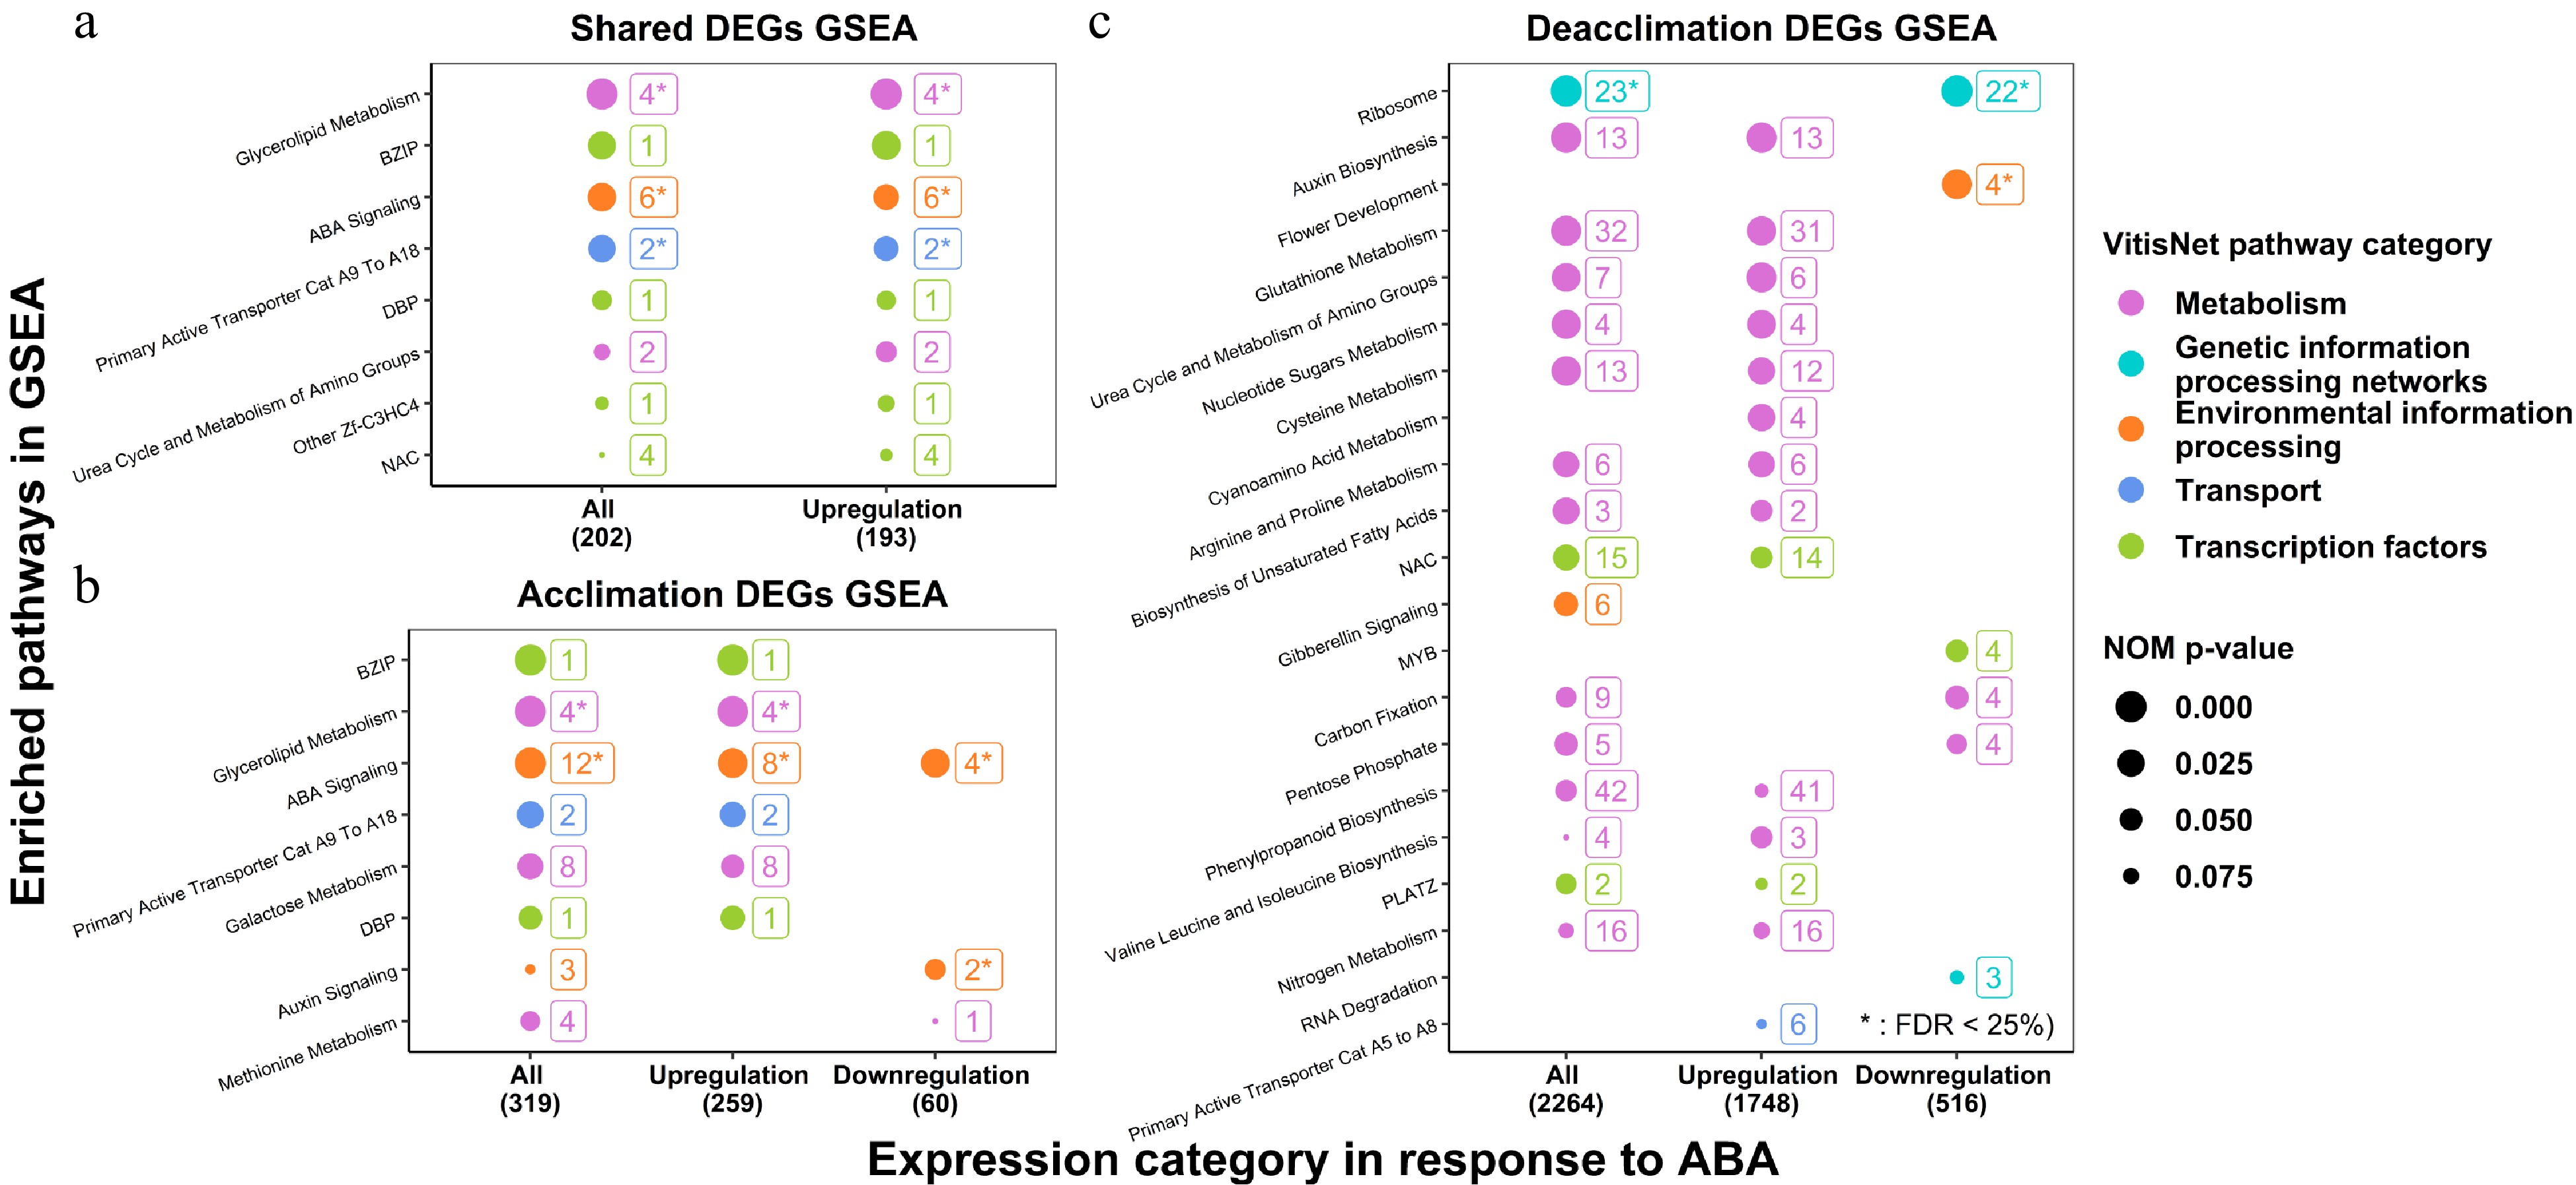
      Figure 1.  GSEA of ABA-induced DEGs in the acclimation and the deacclimation experiments. (a) GSEA of shared DEGs in two experiments; (b) GSEA of DEGs in the acclimation experiment; (c) GSEA of DEGs in the deacclimation experiment. Only the pathways with NOM p-value < 0.1 are shown.

      GSEA analysis demonstrated enriched pathways for shared (8) (Fig. 1a), acclimation (8) (Fig. 1b) and deacclimation (21) (Fig. 1c). These pathways varied by experiment but included specific pathways of all five major categories of gene function: Transcription factors, Metabolism, Environmental Information Processing, Genetic Information Processing, and Transport. Specific subcategory pathway designations are shown in Fig. 1, but it should be noted that pathways related to ABA signaling were enriched in shared target DEGs, additional ABA signaling genes were enriched in the acclimation experiment target DEGs, and many more genes related to Metabolism and Genetic Information Processing were observed in the deacclimation experiment target DEGs. The details of these specific pathways are discussed below.

    • Several critical pathways were examined in detail for their significance in the analysis (FDR of GSEA < 25% and NOW p-value of GSEA < 0.05 as suggested in by GSEA guideline[41]) or their known functionality in grapevine acclimation and deacclimation. Metabolite acronyms are defined in the figure captions.

      The ABA signaling pathway and ABA biosynthesis reactions were defined in detail in Fig. 2 as this pathway was significantly enriched in the GSEA of shared target DEGs and target DEGs in the acclimation experiment (Fig. 1a & b). Briefly, VDE functions as a negative regulator in ABA biosynthesis by catalyzing the transition of violaxanthin (ABA precursor) to zeaxanthin, and NCED serves as a positive regulator by catalyzing violaxanthin to xanthoxin. In ABA signaling, PYL/RCARs bind to PP2C upon the reception of ABA, which forms a ternary complex (PYL-ABA-PP2C). PP2C is deactivated in the ternary complex, facilitating the autophosphorylation of SnRK2 members which in turn phosphorylates transcription factors such as AREB/ABFs. In the nucleus, activated AREB/ABFs stimulate the expression of ABA responsive genes by binding at upstream promoter or enhancer regions. In ABA biosynthesis, two genes encoding NCED were upregulated by ABA in both experiments, and one gene encoding VDE was downregulated in the deacclimation experiment (Fig. 2). In ABA signaling, two genes encoding RCAR10, a member of PYL/RCAR family, were downregulated in deacclimation (Fig. 2). Three genes encoding ABI1, AHG3 and DBPPP2C, members of group A PP2C family, were upregulated in both experiments (Fig. 2). A gene encoding SRK2H, a member of SnRK2 family, was upregulated in the acclimation experiment (Fig. 2). A gene encoding AREB2, a member of AREB/ABF family, was upregulated in both experiments (Fig. 2).

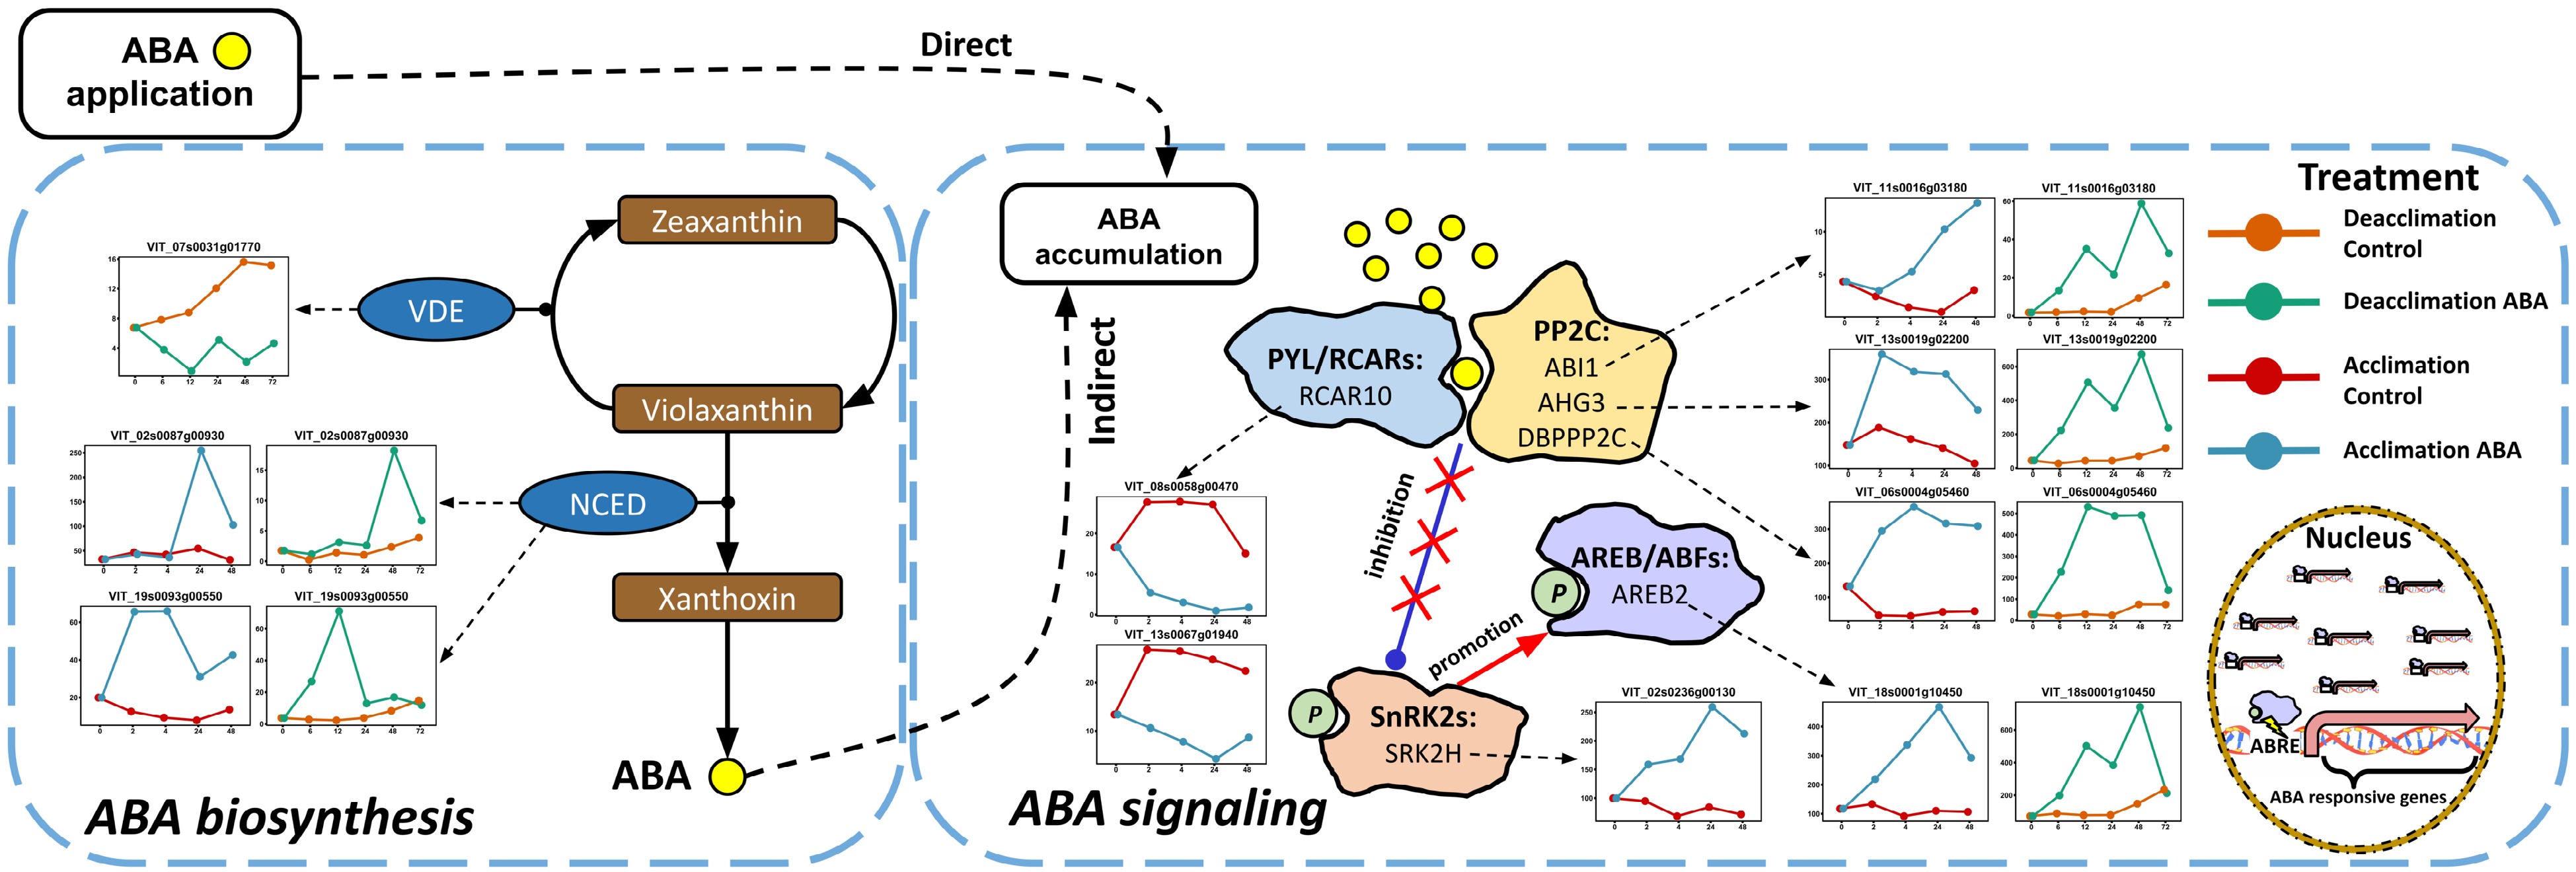
      Figure 2.  Impact of ABA application on ABA biosynthesis and signaling pathways in the acclimation and the deacclimation experiments. The pathways were reduced based on the full pathways in VitisNet. The expression value of genes was normalized by DESeq2. Normalized expressions of the DEGs observed in the deacclimation experiment for control and ABA treatment are orange and green, respectively. Normalized expressions of the DEGs observed in the acclimation experiment for control and ABA treatment are red and blue respectively. All shared and unshared ABA-induced DEGs are shown. Abbreviations: ABRE, ABA responsive element; AREB/ABF, ABRE-binding protein/ABRE-binding factor; NCED, 9-cis-epoxycarotenoid dioxygenase; PP2C, group A protein phosphatase 2C; PYL/RCAR, pyrabactin resistance 1-like protein/regulatory component of ABA receptor; SnRK2, sucrose non-fermenting 1-related protein kinase 2; VDE, violaxanthin de-epoxidase.

      Genes encoding multiple key components in Auxin/IAA biosynthesis pathway and Auxin/IAA conjugation reactions were significantly upregulated by ABA in the deacclimation experiment (Fig. 3). In IAA biosynthesis, upregulated genes included four genes encoding nitrilase, an enzyme catalyzing the transition from IAN to IAA, and two genes encoding AOP, an enzyme catalyzing the transition from TAM to IAA (Fig. 3). In IAA conjugation, upregulated genes included four genes encoding IaaGlu, an enzyme catalyzing the conjugation of IAA and glucose, two genes encoding GH3-1, an enzyme catalyzing irreversible conjugation of IAA and amino acids, and one gene encoding ILR/ILL, an enzyme catalyzing reversible conjugation of IAA and amino acids (Fig. 3).

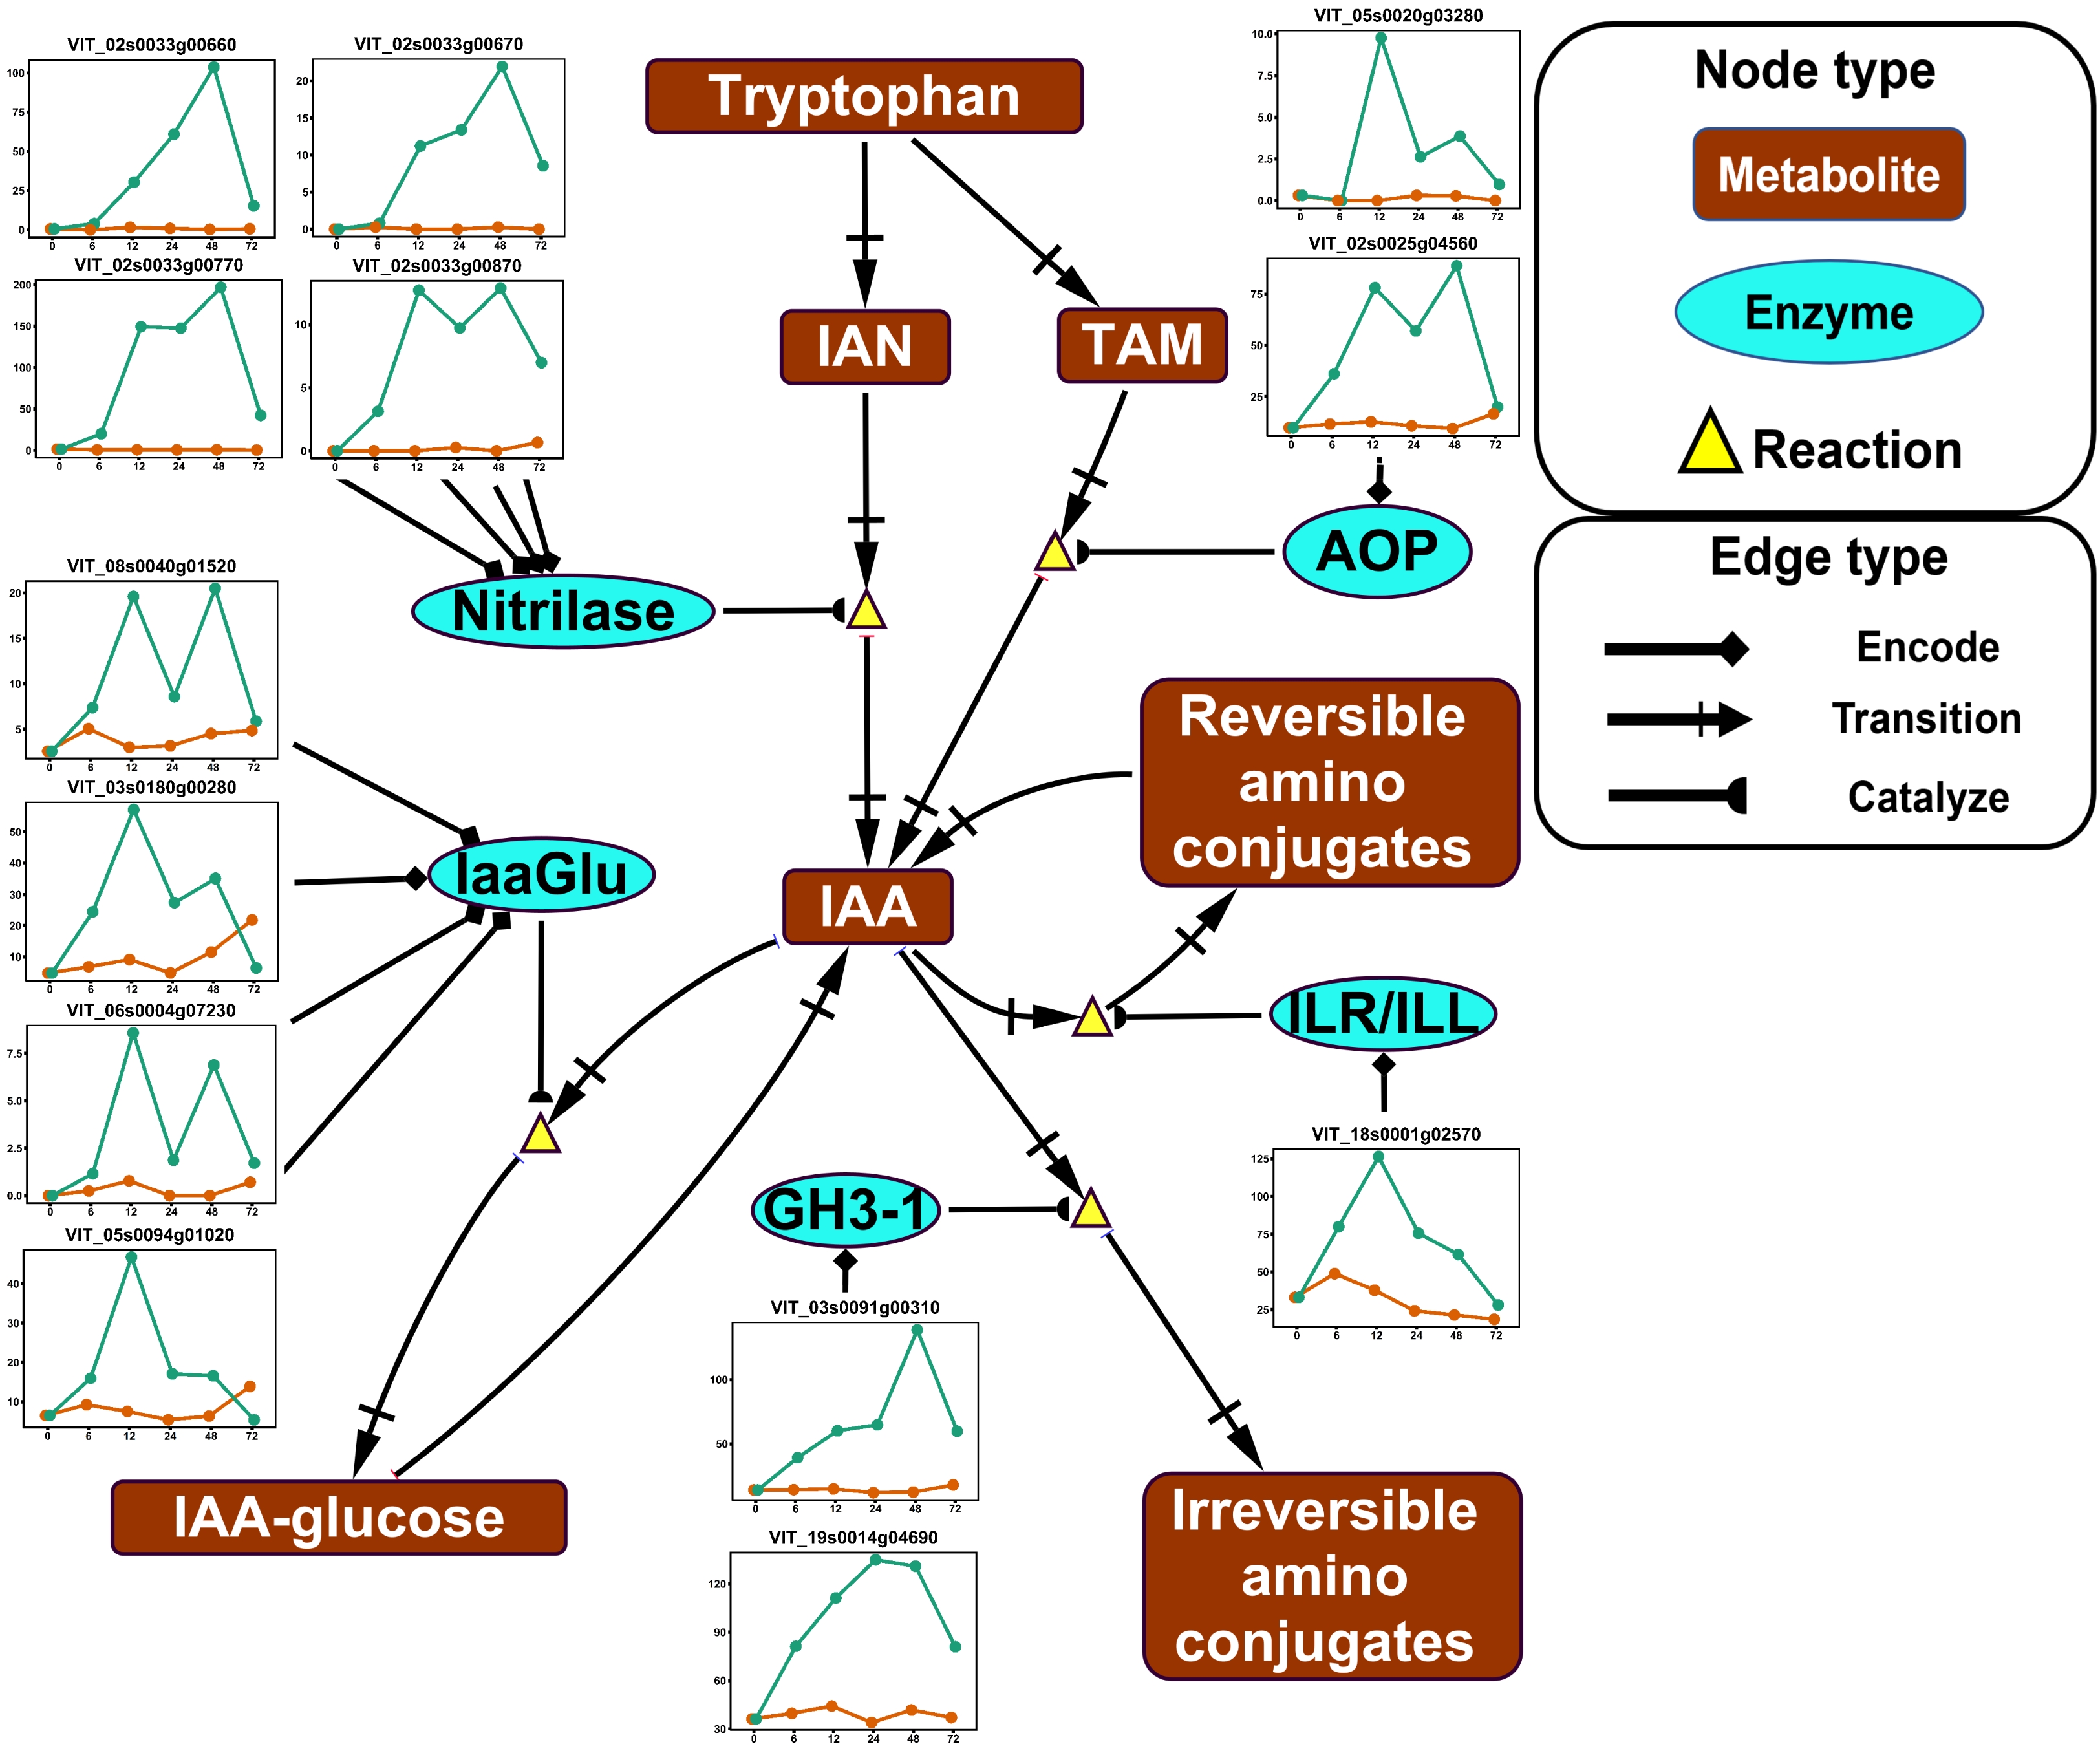
      Figure 3.  Impact of ABA application on auxin (IAA) metabolism in the deacclimation experiment. The pathway was reduced based on the full pathway in VitisNet. The expression value of genes was normalized by DESeq2. Normalized expressions for control and ABA treatment groups are shown by orange and green lines, respectively. Abbreviations: AOP, amine ocidase flavin containing; GH3, GRETCHEN HAGEN 3; IAA, indoleacetic acid; IaaGlu, indoleacetic acid glucosyltransferase; IAN, indole-3-acetonitrile; ILR/ILL, IAA-Leu resistant/ILR-like; TAM, tryptamine. Refer to Fig. 2 for keys of treatments in gene expression plots.

      Eight genes encoding key enzymes in the galactose metabolism were significantly upregulated by ABA in the acclimation experiment (Fig. 4). In RFO biosynthesis, upregulated genes included four genes encoding GolS, an enzyme catalyzing the synthesis of galactinol, one gene encoding RafS, an enzyme catalyzing the transition of galactinol to raffinose, and one gene encoding StaS, an enzyme catalyzing the transition of raffinose to stachyose (Fig. 4). In RFO degradation, two genes encoding α-GAL, an enzyme catalyzing the degradation of RFOs, were upregulated (Fig. 4).

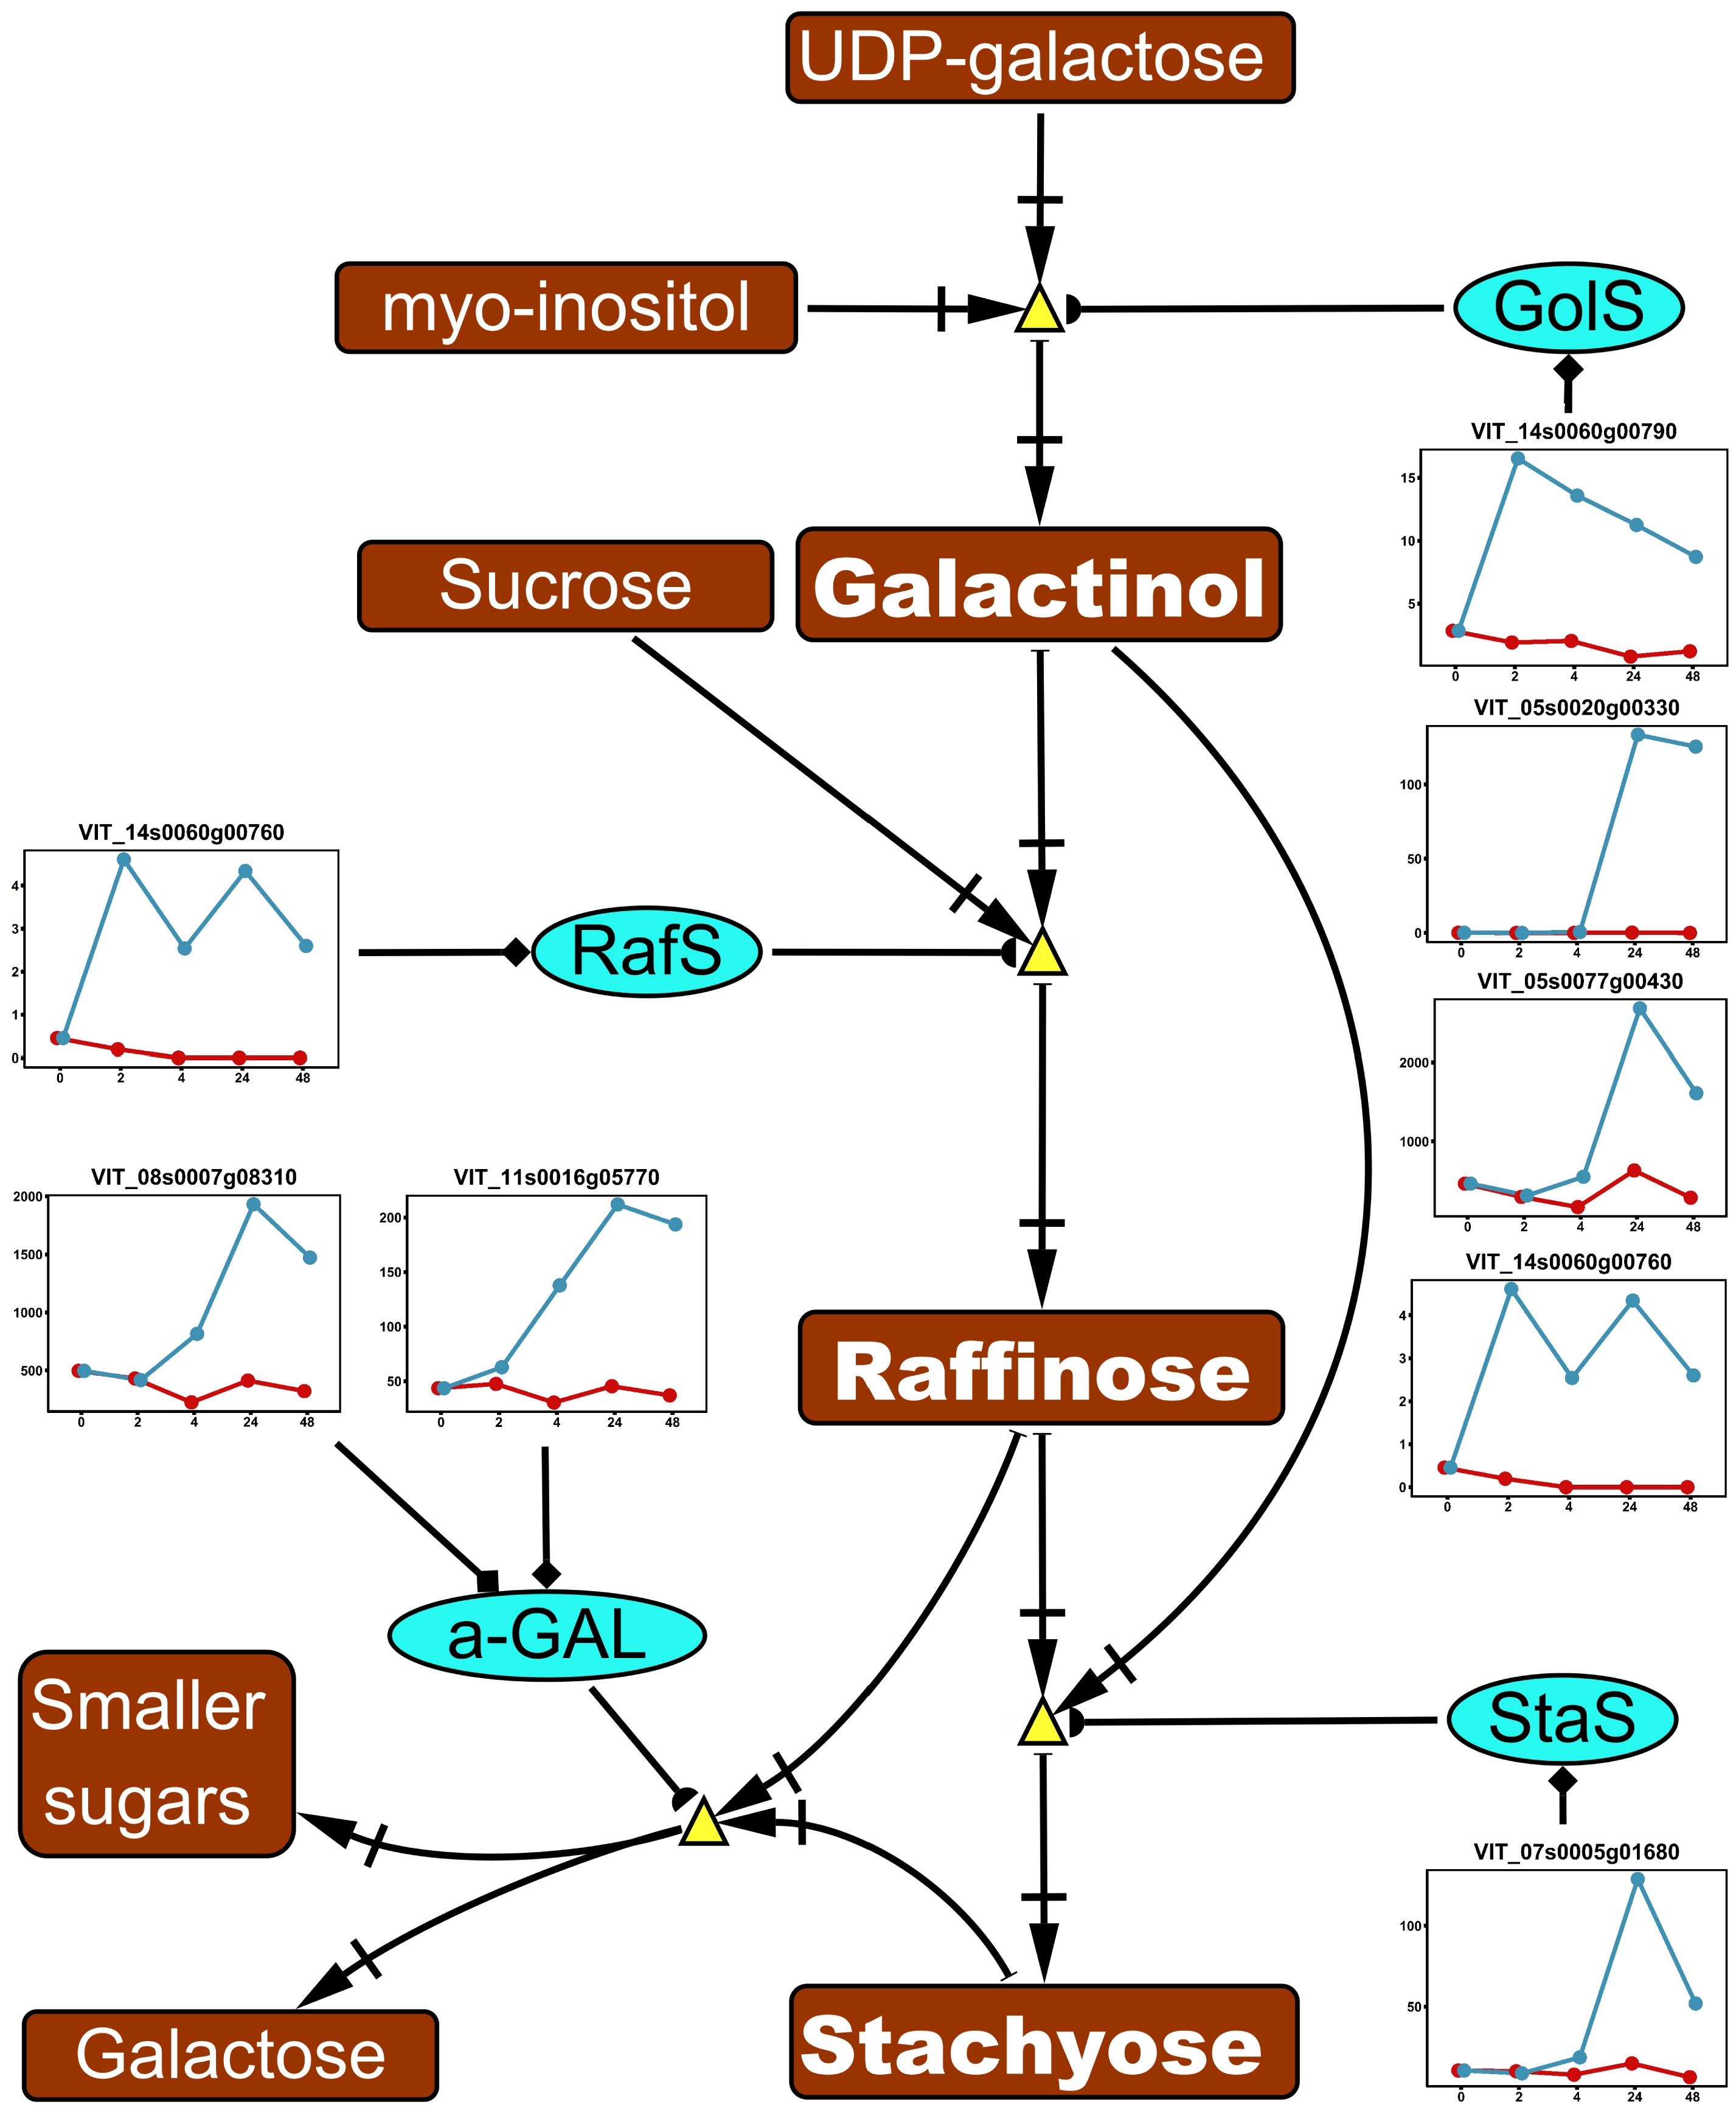
      Figure 4.  Impact of ABA application on raffinose family oligosacchrides (RFOs) metabolism in the acclimation experiment. The pathway was reduced based on the full pathway in VitisNet. The expression value of genes was normalized by DESeq2. Normalized expressions for control and ABA treatment groups are shown by red and blue lines respectively. Abbreviations: α-GAL, alpha-galactosidase; GolS, galactinol synthase; RafS, raffinose synthase; StaS: stachyose synthase. Refer to Fig. 2 and Fig. 3 for figure keys.

      Twenty-two genes encoding ribosomal proteins were downregulated by ABA in the deacclimation experiment (Supplemental Fig. S6). The grape ribosome was remodeled based on the 3D model of Arabidopsis thaliana mitochondrial ribosome[42] with only homologous proteins shared by Vitis and Arabidopsis presented (Supplemental Fig. S6). Three grapevine ribosomal proteins (L12, L29 and L34) encoded by target DEGs in the deacclimation experiment were not present in the current mito-ribosome model in Arabidopsis. Compared to the modeled structure of the ribosome under permissive growing conditions (Supplemental Fig. S6A & S6B), the biosynthesis of 13 and 5 ribosomal proteins on large subunit (LSU) and small subunit (SSU), respectively, appeared to be downregulated in grapevine in response to ABA treatment (Supplemental Fig. S6C & S6D).

    • Deciphering the regulation of ABA during cold acclimation and deacclimation is critical for the sustainability of viticulture under climate change. In this study, we applied exogenous ABA during cold acclimation and deacclimation and precisely investigated the impact of exogenous ABA on the grapevine transcriptome. We followed a data-driven approach in the analysis of RNA-seq data, which facilitated the construction of a gene co-expression network and the identification of target DEGs. In our discussion, we dive into the pathways that exhibited most intensive response to exogenous ABA, correlate these pathways and conclude with a proposed model of how exogenous ABA impacted grapevine transcriptome and ultimately led to altered phenotypes. The coexistence of ABA-induced transcriptomic response and the balancing systems not only enriches the knowledge of grapevine regulation of phytohormone, but also suggests that ABA application might not have any long-term effect on grapevine biology. Implication of this finding may justify the application of exogenous ABA as a cultural practice in vineyards to acquire desired phenotypes to counter cold damage in winter and spring.

      Identification of DEG is a major challenge for the analysis of RNA-seq data, especially in factorial design experiments composed by time courses and treatments. Standard approaches such as pairwise comparison at individual time points or contrasting with basal condition (e.g. pre-treatment) may successfully identify DEGs, nevertheless, ignore the nature of gene co-expression networks[43]. The analysis through a posterior approaches (e.g. only evaluating gene expression on certain pathways) may facilitate the investigation at pathway/cascade level but may also constrain the ability to identify unknown mechanisms. Therefore, network approaches such as WGCNA have gained popularity in RNA-seq data analysis[44]. WGCNA can be conducted through a supervised or an unsupervised approach, but can result in an overwhelming number of genes in large modules, which exacerbates the power of any downstream analysis such as pathway enrichment analysis or the identification of hub players[44].

      To resolve these complications, we followed an analysis pipeline incorporating both standard and network analysis. This pipeline used unsupervised WGCNA to assess expression patterns followed by a target DEGs filtering based on FDR and LFC. We then leveraged the detailed gene functional annotation in VitisNet[45] and conducted pre-ranked GSEA on a ranked DEG list with contrast FDR as ranking criterium. Through this approach, the genes revealing most significant treatment impact on their expressions were assigned with more weight in the pathway enrichment analysis, thus making the analysis more robust by incorporating quantitative gene expression information. While our study was designed to characterize the major changes in gene expression which correlate with ABA treatments, we cannot exclude the possibility that important differences in low expressed genes also occur in response to ABA. Future studies are underway to explore more deeply the pathways uncovered in this study to identify critical candidate genes for gene knockout and functional characterization studies

      One difference of note between the two experiments is the number of modules generated by WGCNA: 37 modules in the acclimation experiment and 17 modules in the deacclimation experiment. Two facts might account for these differences: (1) different transcriptomic activities in different sequenced tissue; (2) different experimental environments. The sequenced tissues in the acclimation experiment were actively growing leaf tissue, while the deacclimation experiment utilized ecodormant buds. Research has demonstrated that most basal pathways for plant growth with large number of genes (e.g. ribosome, spliceosome and photosynthesis) are more active during active growth than during dormancy[46]. We speculate that these active pathways along with the genes in these pathways complicated the co-expression network, which was detected by WGCNA and resulted in increased number of modules in the acclimation experiment. In addition, the acclimation experiment was conducted in a greenhouse with a semi-controlled environment, while the deacclimation experiment was conducted in a growth chamber. Compared to more controlled environments, such as a growth chamber, semi-controlled environments usually lead to an increase of within-replicate variation (error) due to uncontrolled diurnal dynamic and spatial variation[47]. Our results from hierarchical clustering and PCA agreed with this statement as the replicates in the acclimation experiment are less tightly clustered compared with the deacclimation experiment (Supplemental Figs. S1S3). These factors might also account for the fact that the impact of ABA on the transcriptome was less intense regarding the number of DEGs and the magnitude of response (LFC of ABA vs. control) in the acclimation experiment.

      GSEA indicated that ABA signaling pathway was significantly enriched in the shared target DEGs in two experiments (Fig. 1a) In the detailed examination of the pathway, we identified that two genes encoding NCED, a key enzyme in ABA biosynthesis, were upregulated by exogenous ABA in both experiments, however, the upregulation was either transient or unstable (Fig. 2). The increase of NCED transcript abundance in response to exogenous ABA has also been reported in other plants[48, 49], suggesting the existence of a positive feedback for ABA biosynthesis by ABA itself. This positive feedback is balanced by another ABA-dependent negative feedback system mediated by AREB/NAC protein complex[50]. AREBs and NACs are the transcription factors that mediate ABA signaling and induce the expression of ABA responsive genes[27] yet the complex formed by these two proteins can also bind to the promoter region of NCEDs and constrain its transcription in response to excessive ABA[50]. Interestingly, numerous genes coding for AREB or NAC were significantly upregulated in our experiments (Figs 1 & 2), supporting a potential dual role of AREB/NAC also exists in grapevine. The interaction of AREB, NAC and NCED may be critical to maintaining ABA homeostasis in grapevine.

      We also identified a potential negative feedback mechanism in ABA signaling in response to exogenous ABA. This mechanism appears to be mediated by altered expression of genes encoding key proteins in ABA signaling[27]. In the acclimation experiment and in response to ABA application, genes encoding three members in group A PP2C family, a repressor of ABA signaling, were upregulated, and genes encoding a member in PYL/RCARs, a group of ABA receptors, were downregulated (Fig. 2). In the deacclimation experiment and in response to ABA, the same PP2C family members were upregulated, and the response was more intense (relatively speaking) than in the acclimation experiment (Fig. 2). If grapevine proteomic and metabolomic patterns match these transcriptomic responses, signal transduction in the ABA signaling pathway would be constrained, leading to an insensitivity of ABA in cells and generating a negative feedback in ABA signaling. A recent study demonstrated that AREB protein enhances PP2Cs expression by binding at their promotor region after ABA application[51]. This mechanism might be also pivotal for the negative feedback in ABA signaling in response to ABA application in grapevine.

      The enrichment of galactose metabolism pathway and auxin/IAA biosynthesis/metabolism pathway was found in the acclimation and the deacclimation experiment, respectively, suggesting that ABA's regulation of these pathways may depend on the dormancy stage (Figs 3 & 4). However, our data are not sufficient to support this hypothesis due to the complexity of tissue and timing in our experimental design. Among the genes of the galactose metabolism pathway, the metabolism of RFOs have been shown to be important for plant cold hardiness, glass formation, osmotic protection, and hydroxyl radical scavenging[52]. In the acclimation experiment, multiple genes encoding three key enzymes which catalyze the biosynthesis of RFO precursor (galactinol) or RFOs (raffinose or stachyose) were upregulated by ABA application (Fig. 4). Our result agrees with qPCR analysis of the same genes in grapevine buds in response to ABA application[31]. However, it is unreasonable to extrapolate these findings to assess the change of RFOs content in our experiment since two genes encoding a RFO degradation enzyme (α-GAL) were also upregulated during the experiment (Fig. 4). The same scenario was found in auxin/IAA biosynthesis/metabolism pathway in the deacclimation experiment (Fig. 3). Auxin is a plant phytohormone that regulates various plant growth activities including dormancy[53]. It was proposed that the interaction of auxin and ABA along with their signaling pathways might serve as a key regulator in the plant dormancy cycle[54]. Exogenous application of synthetic auxin in grapevine accelerated the removal of callose, which physically facilitates shoot growth after budburst[55]. Gene expression analysis also revealed that IAA biosynthesis was enhanced during dormancy release[36]. As an inference, ABA application might negatively impact IAA biosynthesis and constrain IAA accumulation, thus slowing the process of budburst. This inference is supported by the finding that exogenous ABA inhibited IAA biosynthesis during bud outgrowth in Arabidopsis[56]. However, in our deacclimation experiment, stimulatory effects of ABA application were identified on the pathways contributing to both increase and decrease of free IAA: two tryptophan-dependent IAA biosynthesis pathways were upregulated, and three IAA conjugation/degradation pathways were also upregulated (Fig. 3). These results confound our interpretation of exogenous ABA's impact on IAA metabolism during deacclimation.

      The potential mechanism of negative feedback of exogenous ABA on ABA signaling as discussed above may explain these contradictions. On one hand, ABA application increases free ABA content in cell, which enhances ABA signaling and onset downstream ABA responsive genes as a ubiquitous process. This might be the underlying mechanism for the transcriptional enhancement of RFOs biosynthesis in the acclimation experiment and IAA conjugation/degradation in the deacclimation experiment. One the other hand, when excessive ABA is present in the cell, an unknown scavenging system is activated to balance the overwhelming responses by reversely regulating ABA-induced responses. It is reasonable to infer that the pathways regulated by the scavenging system might intensivelyoverlap with ABA responsive pathways. The activation of this scavenging system might explain ABA-induced constraining of ABA signaling in both experiments, upregulation of RFOs degradation in the acclimation experiment and upregulation of IAA biosynthesis in the deacclimation experiment. The activation of this scavenging system may depend on the concentration of exogenous ABA. This proposed mechanism might be supported, in part, by the fact that the application of exogenous ABA at different concentrations led to distinguished phenotypes of root growth[57].

      ABA application was seen to potentially impact many ribosomal protein genes in the deacclimation experiment. Twenty-two genes, encoding 21 ribosome proteins were downregulated in response to ABA application (Supplemental Fig. S6). Examining the spatial distribution of these proteins using the 3D model of the Arabidopsis mito-ribosome suggests that a large portion of the LSU and SSU monosomes may be impacted by exogenous ABA (Supplemental Fig. S6). Plant ribosomal heterogeneity conferred by different ribosomal components plays crucial roles in plant development by selectively translating specific mRNAs[58]. Arabidopsis ribosomal protein mutants showed distinguished developmental phenotypes, including delayed growth[59]. This finding suggests that different ribosomal proteins might specifically function at different developmental stages or in response to different stresses. Although the transcript abundance of individual ribosomal protein genes does not necessarily correlate with translation efficiency[60], a systematic downregulation of numerous ribosomal protein genes might impact global translation. Guo et al.[61] reported that exogenous ABA inhibited global protein translation in Arabidopsis, and the inhibition might be mediated by ABA-induced downregulation of Receptor for Activated C Protein Kinase1 genes (RACK1). We identified a Vitis homolog (VIT_17s0000g02750) of a Arabidopsis RACK1 gene (AT1G18080)[62], which was significantly downregulated in the deacclimation experiment (Supplemental Fig. S7A), indicating the existence of similar mechanism in Vitis. The same response was not identified in the acclimation experiment (Supplemental Fig. S7B) which suggests that this response may be specific to grapevine deacclimation.

      A schematic representation of a proposed model based on our result and reasoning is shown in Fig. 5. The application of exogenous ABA during grapevine cold acclimation and deacclimation increases free ABA content in cells through direct penetration or indirect positive feedback to endogenous ABA biosynthesis mediated by upregulating NCEDs. Accumulationof free ABA triggers ABA signaling and stimulates downstream ABA responsive metabolism pathways (e.g. RFO metabolism or IAA metabolism) or basal pathways (e.g. ribosomal biogenesis) as a ubiquitous process. The stimulation of the pathways may be selective according to developmental stage, thus making some metabolomic responses specific to cold acclimation or deacclimation. In the meantime, multiple balancing systems are activated to maintain homeostasis of metabolism. These might include inhibition of NCED expression by increased AREB/NAC protein complex, insensitivity of ABA by constrained ABA signaling, and a putative scavenging system that reversely regulates various ABA responsive metabolism pathways. The altered phenotype in response to ABA application, such as deeper dormancy or delayed budburst[26, 31], is likely a consequence of a lingering effect from a short-term disequilibrium of these mechanisms. The existence of the scavenging system also suggests that the application of exogenous ABA would likely induce short-term favored phenotypes without generating long-term negative effects. This finding further justifies the utilization of ABA as a culture practice in vineyards. The onset of the proposed scavenging system is yet to be deciphered and might be of interest for developing other practical tools to acquire more desired phenotypes. Further investigation should be conducted using metabolomics techniques to complement this research with validations at the metabolite level.

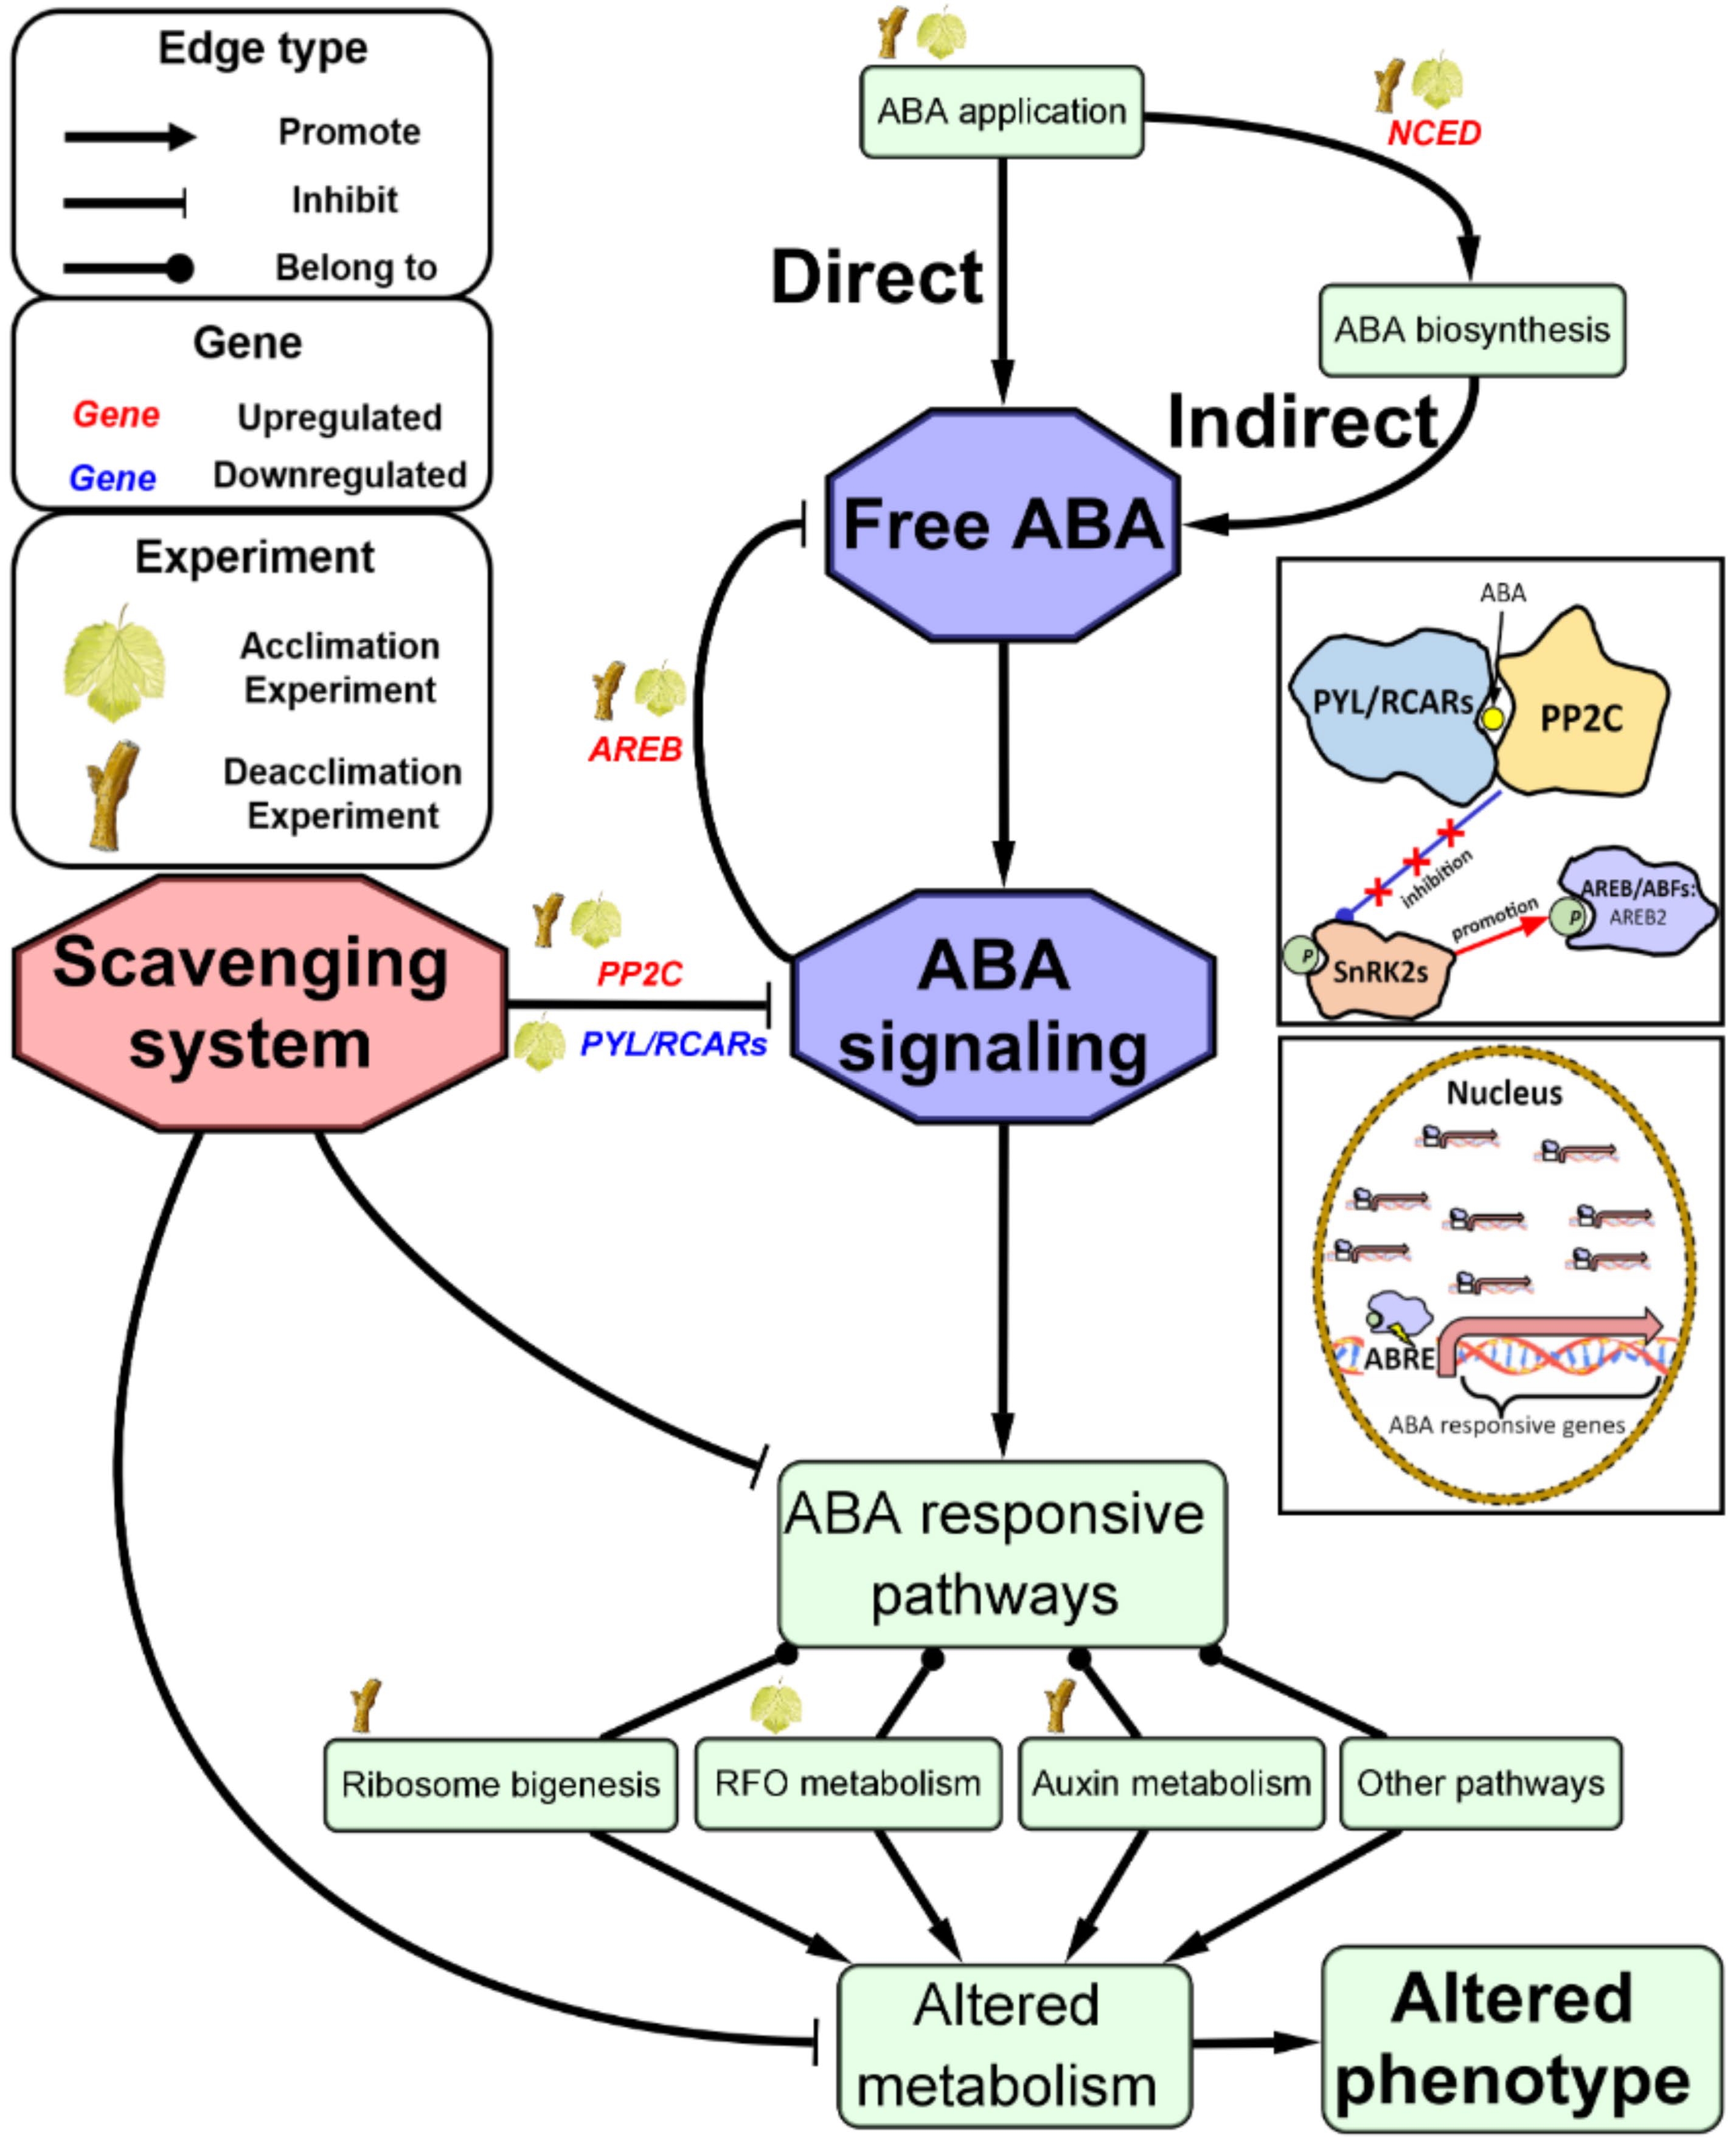
      Figure 5.  Schematic representation of a proposed model for exogenous ABA’s regulation on gene expression in grapevine cold acclimation and deacclimation.

    • The V. vinifera cultivar 'Cabernet Franc' was used in the experiment, in part for its economic importance in the Eastern U.S. The experiment was conducted in a greenhouse at the Ohio Agricultural Research and Development Center (OARDC, Wooster, OH, USA) using two-year-old, self-rooted grapevines cultivated in 7.6 L pots. Greenhouse environmental conditions, growth medium, grapevine training and other managements associated with grapevine growth are as described in previous study[31]. The experiment involved two treatments (control and ABA) in quadruplicate using randomized complete block design. For control treatment, the solution was composed of deionized water with 0.05% (v/v) and Tween-20 (Acros Organic, Hampton, NH, USA) as surfactant. For ABA treatment, the solution was composed of 500 mg L−1 (1.9 mM) S-ABA diluted from ProTone® SG (Valent BioSciences Corporation, Libertyville, IL, USA) and 0.05% (v/v) and Tween-20 as surfactant. This concentration was determined to be effective and safe regarding inducing proper physiological response and generating minimum phytotoxicity, respectively[63, 64]. Treatments were applied at noon of 18 Aug. 2018 when the leaf age of base node was 95 d. This timing corresponds to the start of early cold acclimation in nature in Eastern U.S.[10]. Both treatments were sprayed on all grapevine leaves until runoff to ensure a full coverage.

    • Field-grown 'Cabernet Franc' grapevines were used in this experiment. Grapevines were grafted on 3309C rootstocks and commercially cultivated at Ravine's Wine Cellars in Geneva, NY and subjected to standard vineyard management practices during the growing season. Dormant canes were harvested in March of 2017, after vines had been exposed to > 1,200 chilling hour (NC model https://products.climate.ncsu.edu/ag/chill-models) and chopped into single node cuttings. At collection, the cuttings were at 'winter buds' stage, corresponding to Eichhorn Lorenz Stage 1 (EL1)[65] and had fully transitioned to ecodormancy. Cuttings were randomized and divided into six groups, corresponding to six timepoints for pre and post treatment sample collections. Grouped cuttings were incubated with cut ends in cups of water under permissive growing conditions (22 °C and 16/8 h light/dark) in a growth room. When single bud cuttings developed to 'woolly buds' stage, corresponding to EL3[65], treatments were applied on each group with a hand sprayer to runoff. Control treatment was deionized water, and ABA treatment was 1,322 mg L−1 (5mM) S-ABA diluted from ProTone® SG (Valent BioSciences Corporation, Libertyville, IL, USA). This concentration was reported to be effective to delay budburst on woolly buds[26].

    • In the cold acclimation experiment, leaf samples from the ABA and water (control) treatments were collected at pre-treatment, 2 h, 4 h, 24 h and 48 h post-treatment. Four biological replicates, each consisted of five leaves collected from node number three to 10, were used for RNA-seq. Eight replicates were collected at pre-treatment. In the deacclimation experiment, bud samples treated with ABA and water (control) were collected at pre-treatment, 6 h, 12 h, 24 h, 48 h and 72 h post-treatment. Three biological replicates, each consisting of three buds excised from single-node cuttings, were used for RNA-seq. Four replicates were collected at 48 h post-treatment. Samples were flash-frozen in liquid nitrogen immediately after collection and stored at −80 °C until extraction.

      Total RNA was extracted using SpectrumTM Plant Total RNA Kit (Sigma Aldrich, St Louis, MO, USA) following the protocol suggested by the manufacturer. Libraries were constructed using Lexogen QuantSeq 3'mRNA-Seq Prep Kit (Lexogen, Greenland, NH, USA) following standard practices as a service provided by Cornell University Institute of Genomic Diversity (Ithaca, NY, USA). Sequencing of the libraries was accomplished using NextSeq500 (Illumina, Inc., San Diego, CA, USA) with 95 samples per lane at Cornell University Institute of Biotechnology (Ithaca, NY, USA). The raw read length was 85 bp and 75 bp in the acclimation and deacclimation experiment, respectively. For each library, sequencing was conducted in triplicate to justify technical validity. As RNA-seq data preprocessing, FastQC was applied to each library for quality control. Reads from each library were subsequently trimmed using BBDuk (http://jgi.doe.gov/data-and-tools/bb-tools) to remove adaptors and poly-A following the pipeline suggested by the manufacturer (www.lexogen.com/quantseq-data-analysis). Trimmed reads were aligned to Vitis vinifera 12X.v2 genome and VCost.v3 annotation[38] using STAR[37]. Gene level quantification was conducted using '-quantMode GeneCounts' in STAR.

      The resulting gene count matrices were filtered for low count genes based on total gene count among all samples. The genes with total gene count greater than sample number were considered as expressed genes and subjected to subsequent analysis. The filtered gene count matrix was analyzed for differential expression using DESeq2[39]. The full model of DESeq2 contained time post-treatment as a continuous variable and treatments (ABA or control) as a discrete variable. A normalized gene count matrix was generated by DESeq2 (normalize = TRUE) and was inputted for gene expression visualization in figures. Log transformed gene count matrix was generated by DESeq2 VST and was subjected to downstream analysis.

    • For each experiment, VST count of all genes after low count filtering were used for WGCNA[40] to ensure an unsupervised gene co-expression network construction. A dendrogram of all samples was constructed using hierarchical clustering, and the samples showing substantial distance from the main cluster were removed as outliers. Remaining samples were subjected to one-step signed network construction and module detection using 'blockwiseModules' (power = 12, networkType = "signed", TOMType = "signed", minModuleSize = 50, reassignThreshold = 0, mergeCutHeight = 0.25).

      After network construction, genes in module 'grey' were excluded for any further analysis since these genes were recognized as noise genes by WGCNA. The PC1 of all genes in each module, known as module eigengene or ME, was calculated by WGCNA. MEs were correlated with treatments using the Pearson method and visualized across all timepoints to identify the expression pattern that might explain treatment effect per interest of the experiment. Numeric transformation of treatments (ABA as '1', control as '0') was conducted to facilitate the correlation analysis. Contrasts were created based on identified expression patterns and applied on genes in target modules (if the identified expression pattern exists in few modules) or all genes (if the identified expression pattern exists in numerous modules). The genes subjected to contrasting were further filtered based on FDR < 0.05 and LFC > |1| of the specific contrast in DESeq2. Resultant genes were considered as target DEGs for the experiment.

    • Identifications of target genes were changed to their corresponding V1 annotations for better functional annotations (http://genomes.cribi.unipd.it/grape). Resulting genes were subsequently ranked using FDR of the contrast as the ranking criterion in a decreasing order. A two-column.rnk file containing the gene list and corresponding ranking list was input to GSEA. The gene set file (.gmt) was generated from predefined pathways in VitisNet database[45]. All pathways in VitisNet were used for GSEA. GSEA was conducted through 'Run GSEAPreranked' in 'weighted' mode using 1000 permutations, and normalization mode was set as 'meandiv'.

    • The cryo-electron microscopy structure of Arabidopsis thaliana mitoribosome (RCSB PDB: 6XYW) was used as template for 3D remodeling to visualize the impact of exogenous ABA on grapevine ribosome during deacclimation[42]. The modeling was accomplished in Chimera 1.15[66]. Only homologous proteins shared by Vitis and Arabidopsis were presented in the model. After splitting the entire model into protein segments using 'split', protein surface was calculated through 'surface' and visualized in 'mesh'.

    • All RNA-seq raw data along with processed gene count matrices and sample metadata are available in NCBI-GEO (accession: GSE184114).

      • This work was funded in part by the New York Grape and Wine Foundation, by U.S. Department of Agriculture appropriated project 1910-21220-006-00D, by The Ohio State University Research Competitive Grants Program (SEEDS) and by The Ohio State University College of Food, Agricultural, and Environmental Sciences, Department of Horticulture and Crop Science.
      • The authors declare that they have no conflict of interest.
      • Supplemental Fig. S1 Hierarchical clustering of samples in the acclimation experiment. All genes after low count filtering were used for clustering.
      • Supplemental Fig. S2 Hierarchical clustering of samples in the deacclimation experiment. All genes after low count filtering were used for clustering.
      • Supplemental Fig. S3 Principal component analysis for the transcriptome of the samples in two experiments. A-B) Two−dimensional profiling of leaf samples in the acclimation experiment using PC1, PC2 and PC3; C-D) Two-dimensional profiling of bud samples in the deacclimation experiment using PC1, PC2 and PC3.
      • Supplemental Fig. S4 WGCNA of samples in the acclimation experiment. A) Module-trait relationships; B) ME visualization across all timepoints in the experiment. Input genes are all genes after low count filtering. Error bars represent SE (n = 4). The Module-trait relationships were computed using Pearson method. The first line and second line of each cell represent correlation coefficient and correlation p-value, respectively.
      • Supplemental Fig. S5 WGCNA of samples in the deacclimation experiment. A) Module-trait relationships; B) ME visualization across all timepoints in the experiment. Input genes are all genes after low count filtering. Error bars are not shown due to minimum variance among replicates. The Module-trait relationships were computed using Pearson method. The first line and second line of cells represent correlation coefficient and correlation p-value, respectively.
      • Supplemental Fig. S6 Remodeling of potential grapevine ribosome in response to ABA application in the deacclimation experiment. Presented ribosome was remodeled in Chimera based on cryo-electron microscopy structure of Arabidopsis thaliana mitochondria ribosome. Only homologous proteins shared between Arabidopsis and Vitis are shown. A-B) Potential ribosome in control samples under permissive growing condition (22 °C) for budburst; C-D) Potential ribosome in ABA-treated samples under same condition. At least one gene encoding each blue-highlighted protein exhibited significantly lower transcript abundance in response to ABA application. Abbreviations: SSU, small subunit; LSU, large subunit.
      • Supplemental Fig. S7 Expression of VIT_17s0000g02750, an Arabidopsis RACK1 homolog in Vitis, in two experiments.
      • Copyright: © 2022 by the author(s). Exclusive Licensee Maximum Academic Press, Fayetteville, GA. This article is an open access article distributed under Creative Commons Attribution License (CC BY 4.0), visit https://creativecommons.org/licenses/by/4.0/.
    Figure (5)  References (66)
  • About this article
    Cite this article
    Wang H, Dami IE, Martens H, Londo JP. 2022. Transcriptomic analysis of grapevine in response to ABA application reveals its diverse regulations during cold acclimation and deacclimation. Fruit Research 2: 1 doi: 10.48130/FruRes-2022-0001
    Wang H, Dami IE, Martens H, Londo JP. 2022. Transcriptomic analysis of grapevine in response to ABA application reveals its diverse regulations during cold acclimation and deacclimation. Fruit Research 2: 1 doi: 10.48130/FruRes-2022-0001

Catalog

  • About this article

/

DownLoad:  Full-Size Img  PowerPoint
Return
Return