


-
Dichondra (Dichondra repens) is a perennial convolvulaceous plant that is wildly used as a ground cover for landscaping, ecological restoration, and weed control due to its ability to form a dense and low-growing sward[1, 2]. Previous studies have demonstrated that dichondra was able to establish a denser greensward for weed suppression than other ground cover plants such as creeping red fescue (Festuca rubra) and white clover (Trifolium repens) in an apple orchard[3, 4], but did not cause reduction in fruit yield[5]. In addition, dichondra is also a main constituent in many traditional herbal beverages in China and its extracts including n-butanol, vanillin, umbelliferone, and scopoletin exhibit antinociceptive effect, antibacterial activity, and anti-inflammation for treatment of icterohepatitis, dysentery, hydrops, or other diseases[6−8]. There are more than five species of the genus Dichondra in the world and most of them are distributed in the Americas. Up to now, only one wild species is found in China[8]. Requirement for new dichondra cultivars to be used for park and home landscaping is increasing in virtue due to their creeping growth habit and no need for mowing. However, the breeding of dichondra species is far behind other ground cover plants.
Global warming aggravates the frequency of extreme weather events such as high temperature and drought worldwide. Drought stress causes a lack of water availability in plants resulting in growth retardation and a decline in utility value[9]. Screening and evaluation of relative drought-tolerant genotypes play pivotal roles in breeding for stress-tolerant new cultivars. Multiple molecular markers including microsatellite or simple sequence repeat (SSR), restriction fragment length polymorphism (RFLP), amplified fragment length polymorphism (AFLP), and random-amplified polymorphic DNA (RAPD) markers have been applied for selection and evaluation of diverse plant resources[10]. Among them, SSR markers exhibit outstanding characteristics of chromosome-specific location, co-dominant inheritance, and better interspecific transferability, and has become an important tool for molecular breeding[11]. Earlier studies by Varshney et al. and Powell et al. proved that SSRs were found to be more polymorphic than other molecular markers[12, 13]. Kumar et al. reviewed the importance of SSR markers for molecular breeding of salt-tolerant Brassica genotypes[14]. Maqbool et al. evaluated drought tolerance of 40 chickpea (Cicer arietinum) genotypes based on the change in seed yield and genetic diversity via SSR markers, which provided basic information for breeding of drought-tolerant chickpea genotypes[15].
Understanding of genetic diversity and drought tolerance of different dichondra genotypes could help geneticists or breeders to interpret germplasm architecture or breed new cultivars. In addition, selection and utilization of drought-tolerant dichondra genotypes could be propitious to decrease in maintenance and management costs in the field. Objectives of this study were to evaluate morphological variation, genetic diversity via SSRs, and drought tolerance based on changes in five physiological parameters including leaf relative water content (RWC), electrolyte leakage (EL), chlorophyll (Chl), photosystem II photochemical efficiency (Fv/Fm), and performance index on absorption basis (PIABS) of 33 dichondra genotypes (three cultivars and 30 wild genotypes collected from southwest China). These physiological parameters have been widely used for evaluating stress tolerance in various plant species, since they indicate water status, cell membrane stability, and photosynthetic capacity[16−19]. Current findings will provide potential materials for breeding program and further exploration of drought-resistant mechanism by using drought-tolerant and -sensitive dichondra genotypes.
-
Figure 1 showed leaf sizes among 33 genotypes under normal conditions. There were significant variations in plant height, leaf area, leaf thickness, and petiole length among 33 genotypes (Fig. 2a−d). Dr9 exhibited the highest plant height and the greatest leaf area, whereas Dr12 showed the shortest plant height and Dr28 had smallest leaf area compared to other genotypes (Fig. 2a & b). The value of leaf thickness of all genotypes was more than 0.1 mm except Dr20 (Fig. 2c). The biggest value of leaf thickness was also observed in Dr9 (Fig. 2c). Dr26 and Dr28 had smaller petiole lengths than other genotypes under normal condition (Fig. 2d). Table 1 showed amplification results using 18 SSR primers. A total of 256 bands were amplified by these SSR primers and the total number of polymorphic bands reached 228 (Table 1). Primer C24 or IBM13 exhibited the highest or lowest polymorphism information content (PIC) than other primers, respectively (Table 1). Cluster analysis found that the average variation range of genetic similarity coefficient was from 0.56 to 0.89 among 33 genotypes (Fig. 3). New cultivars 'Xiaoshao' (Dr32) and 'Duliujiang' (Dr33) had closer genetic relationship, and commercial cultivar 'Silver Falls' (Dr30) showed closer genetic relationship with Dr31 (Fig. 3).
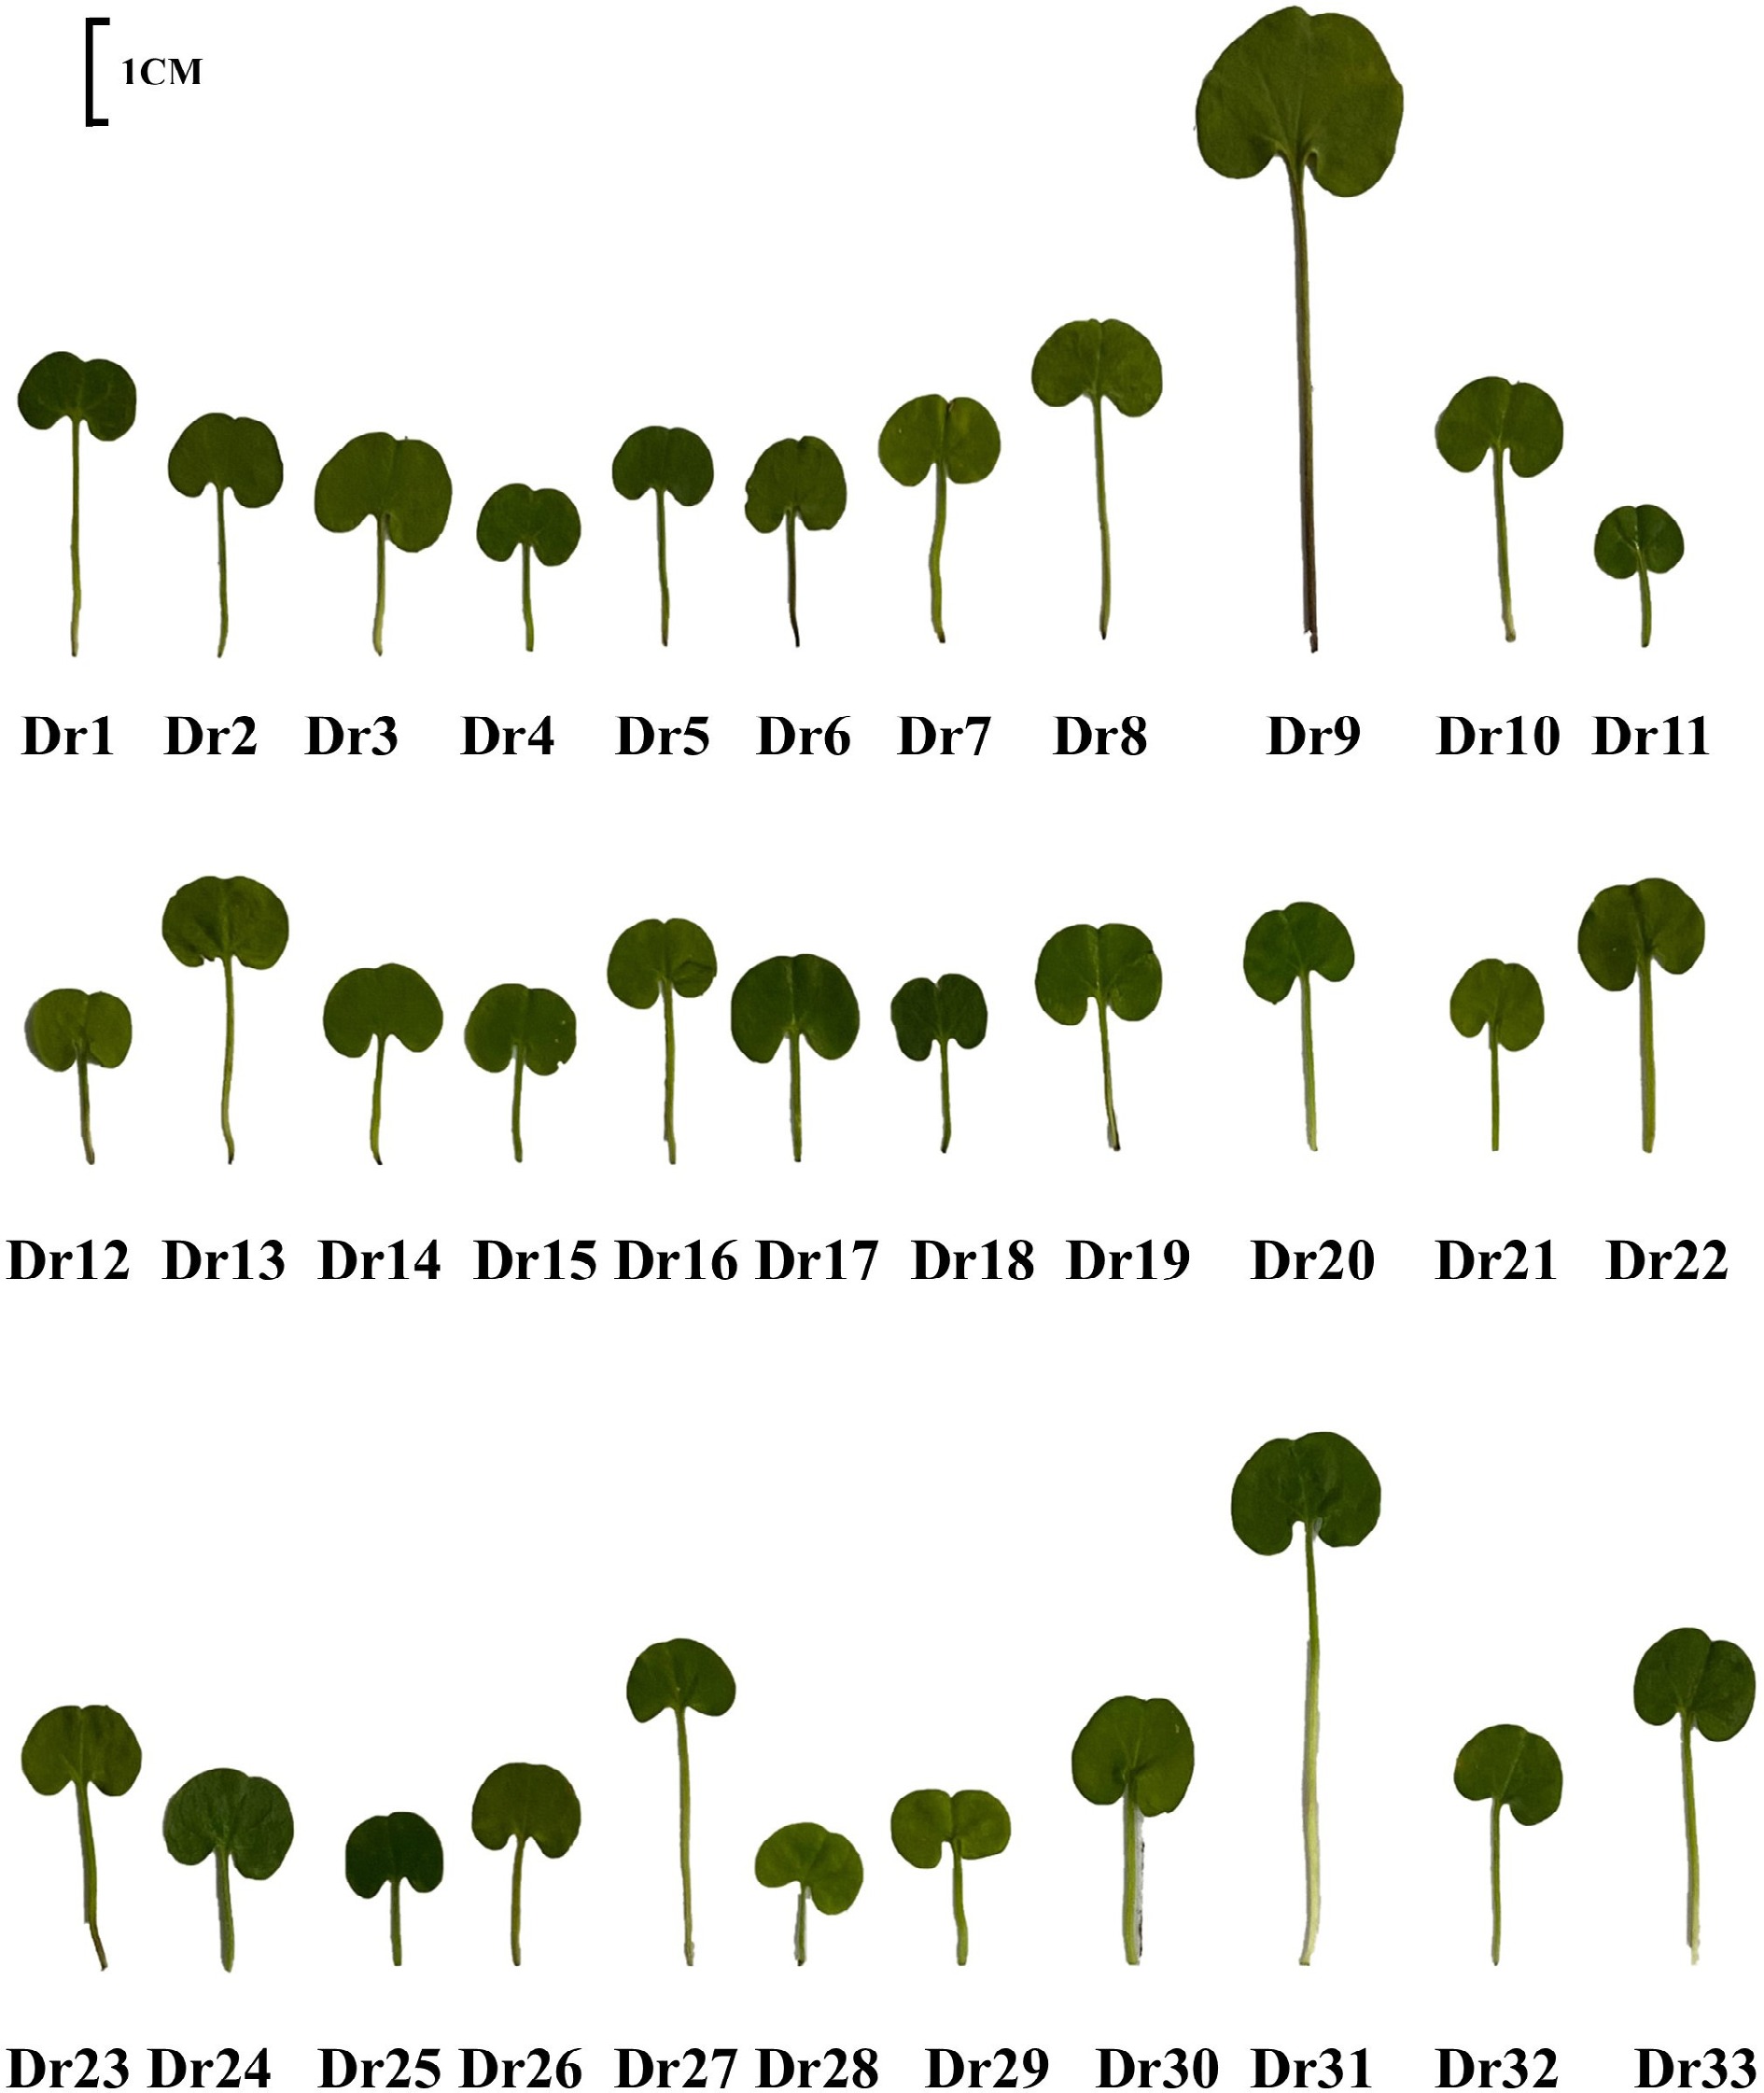
Figure 1.
Phenotypic differences in leaves of 33 Dichondra repens genotypes under normal conditions.
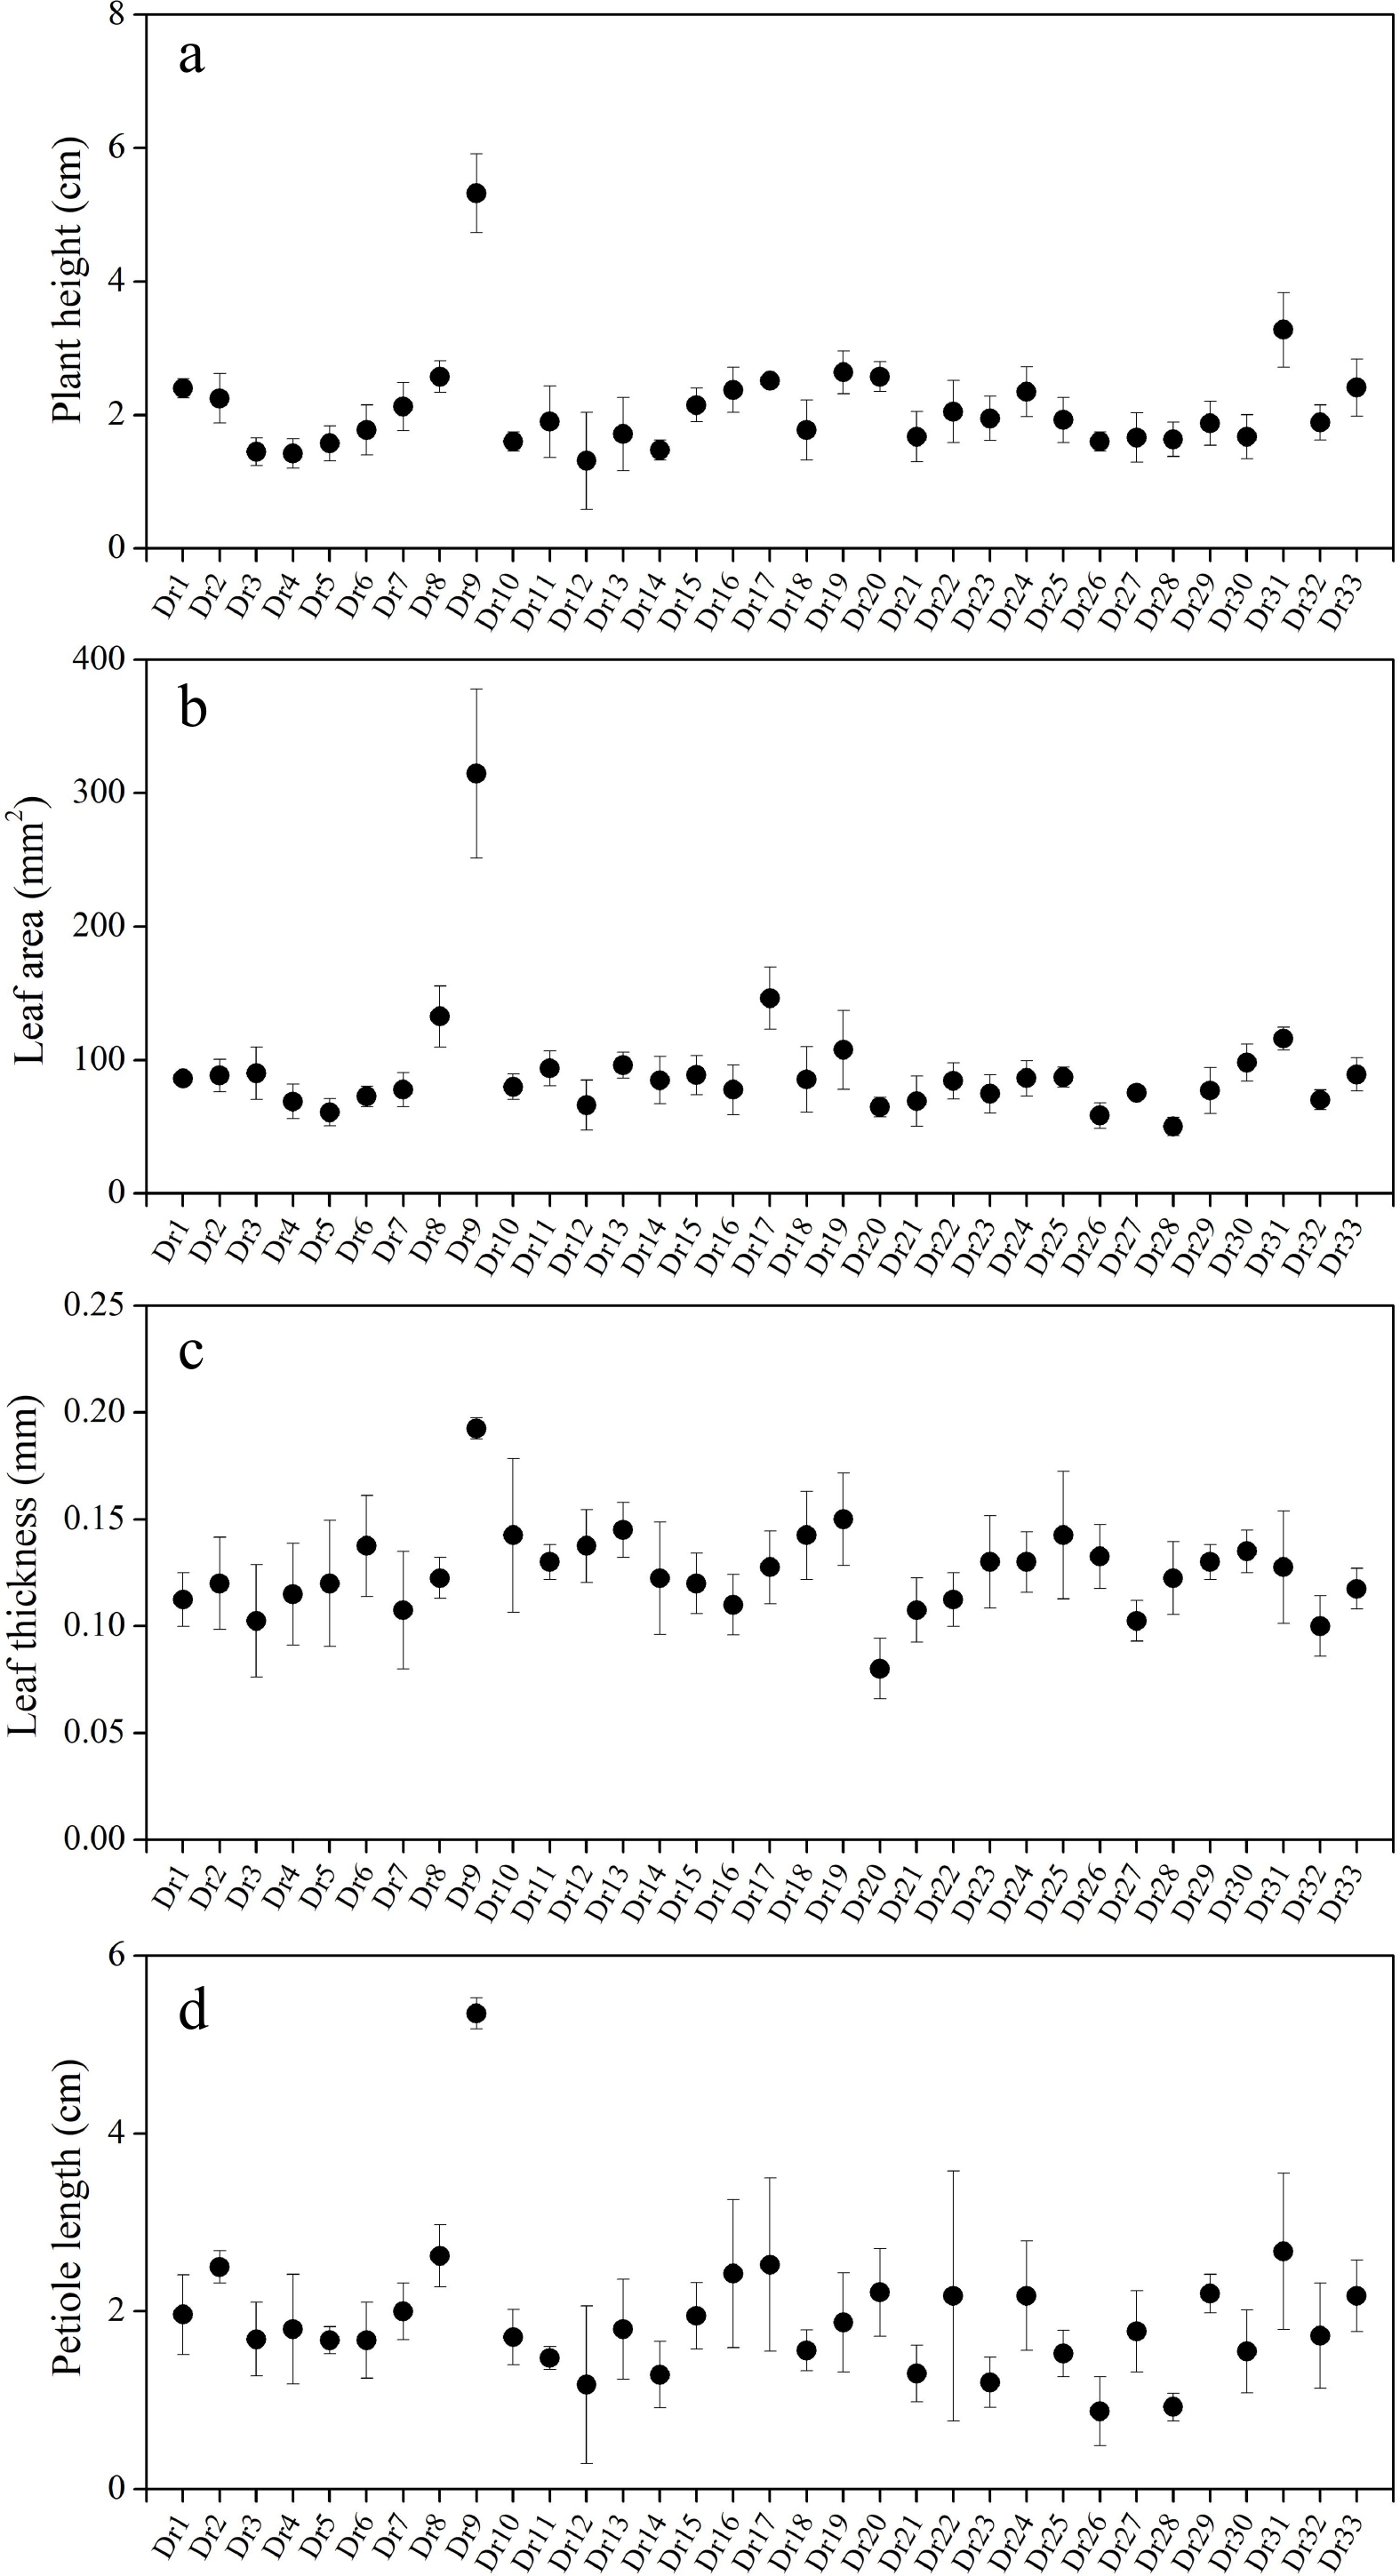
Figure 2.
Differences in (a) plant height, (b) leaf area, (c) leaf thickness, and (d) petiole length among 33 Dichondra repens genotypes under normal conditions. Vertical bars represent standard errors of the mean (n = 10).
Table 1. Amplification results among 33 Dichondra repens using different SSR primers.
Primer
nameTotal number of
amplified bandsNumber of
polymorphic bandsPPB (%) PIC C24 18 18 100.00 0.338 C27 19 19 100.00 0.295 C30 17 9 52.94 0.163 C33 13 13 100.00 0.314 C51 11 10 90.91 0.354 C60 18 18 100.00 0.193 C66 13 13 100.00 0.342 C67 8 8 100.00 0.230 C71 23 19 82.61 0.230 Z25 21 13 62.90 0.163 Z37 3 3 100.00 0.266 Z57 19 16 84.21 0.266 Z69 9 8 88.89 0.215 Z113 16 16 100.00 0.292 Z135 11 11 100.00 0.279 SSR11 12 12 100.00 0.305 IBM13 4 4 100.00 0.111 IBM445 21 18 85.71 0.292 Total 256 228 — — Average 14.22 12.67 91.59 0.258 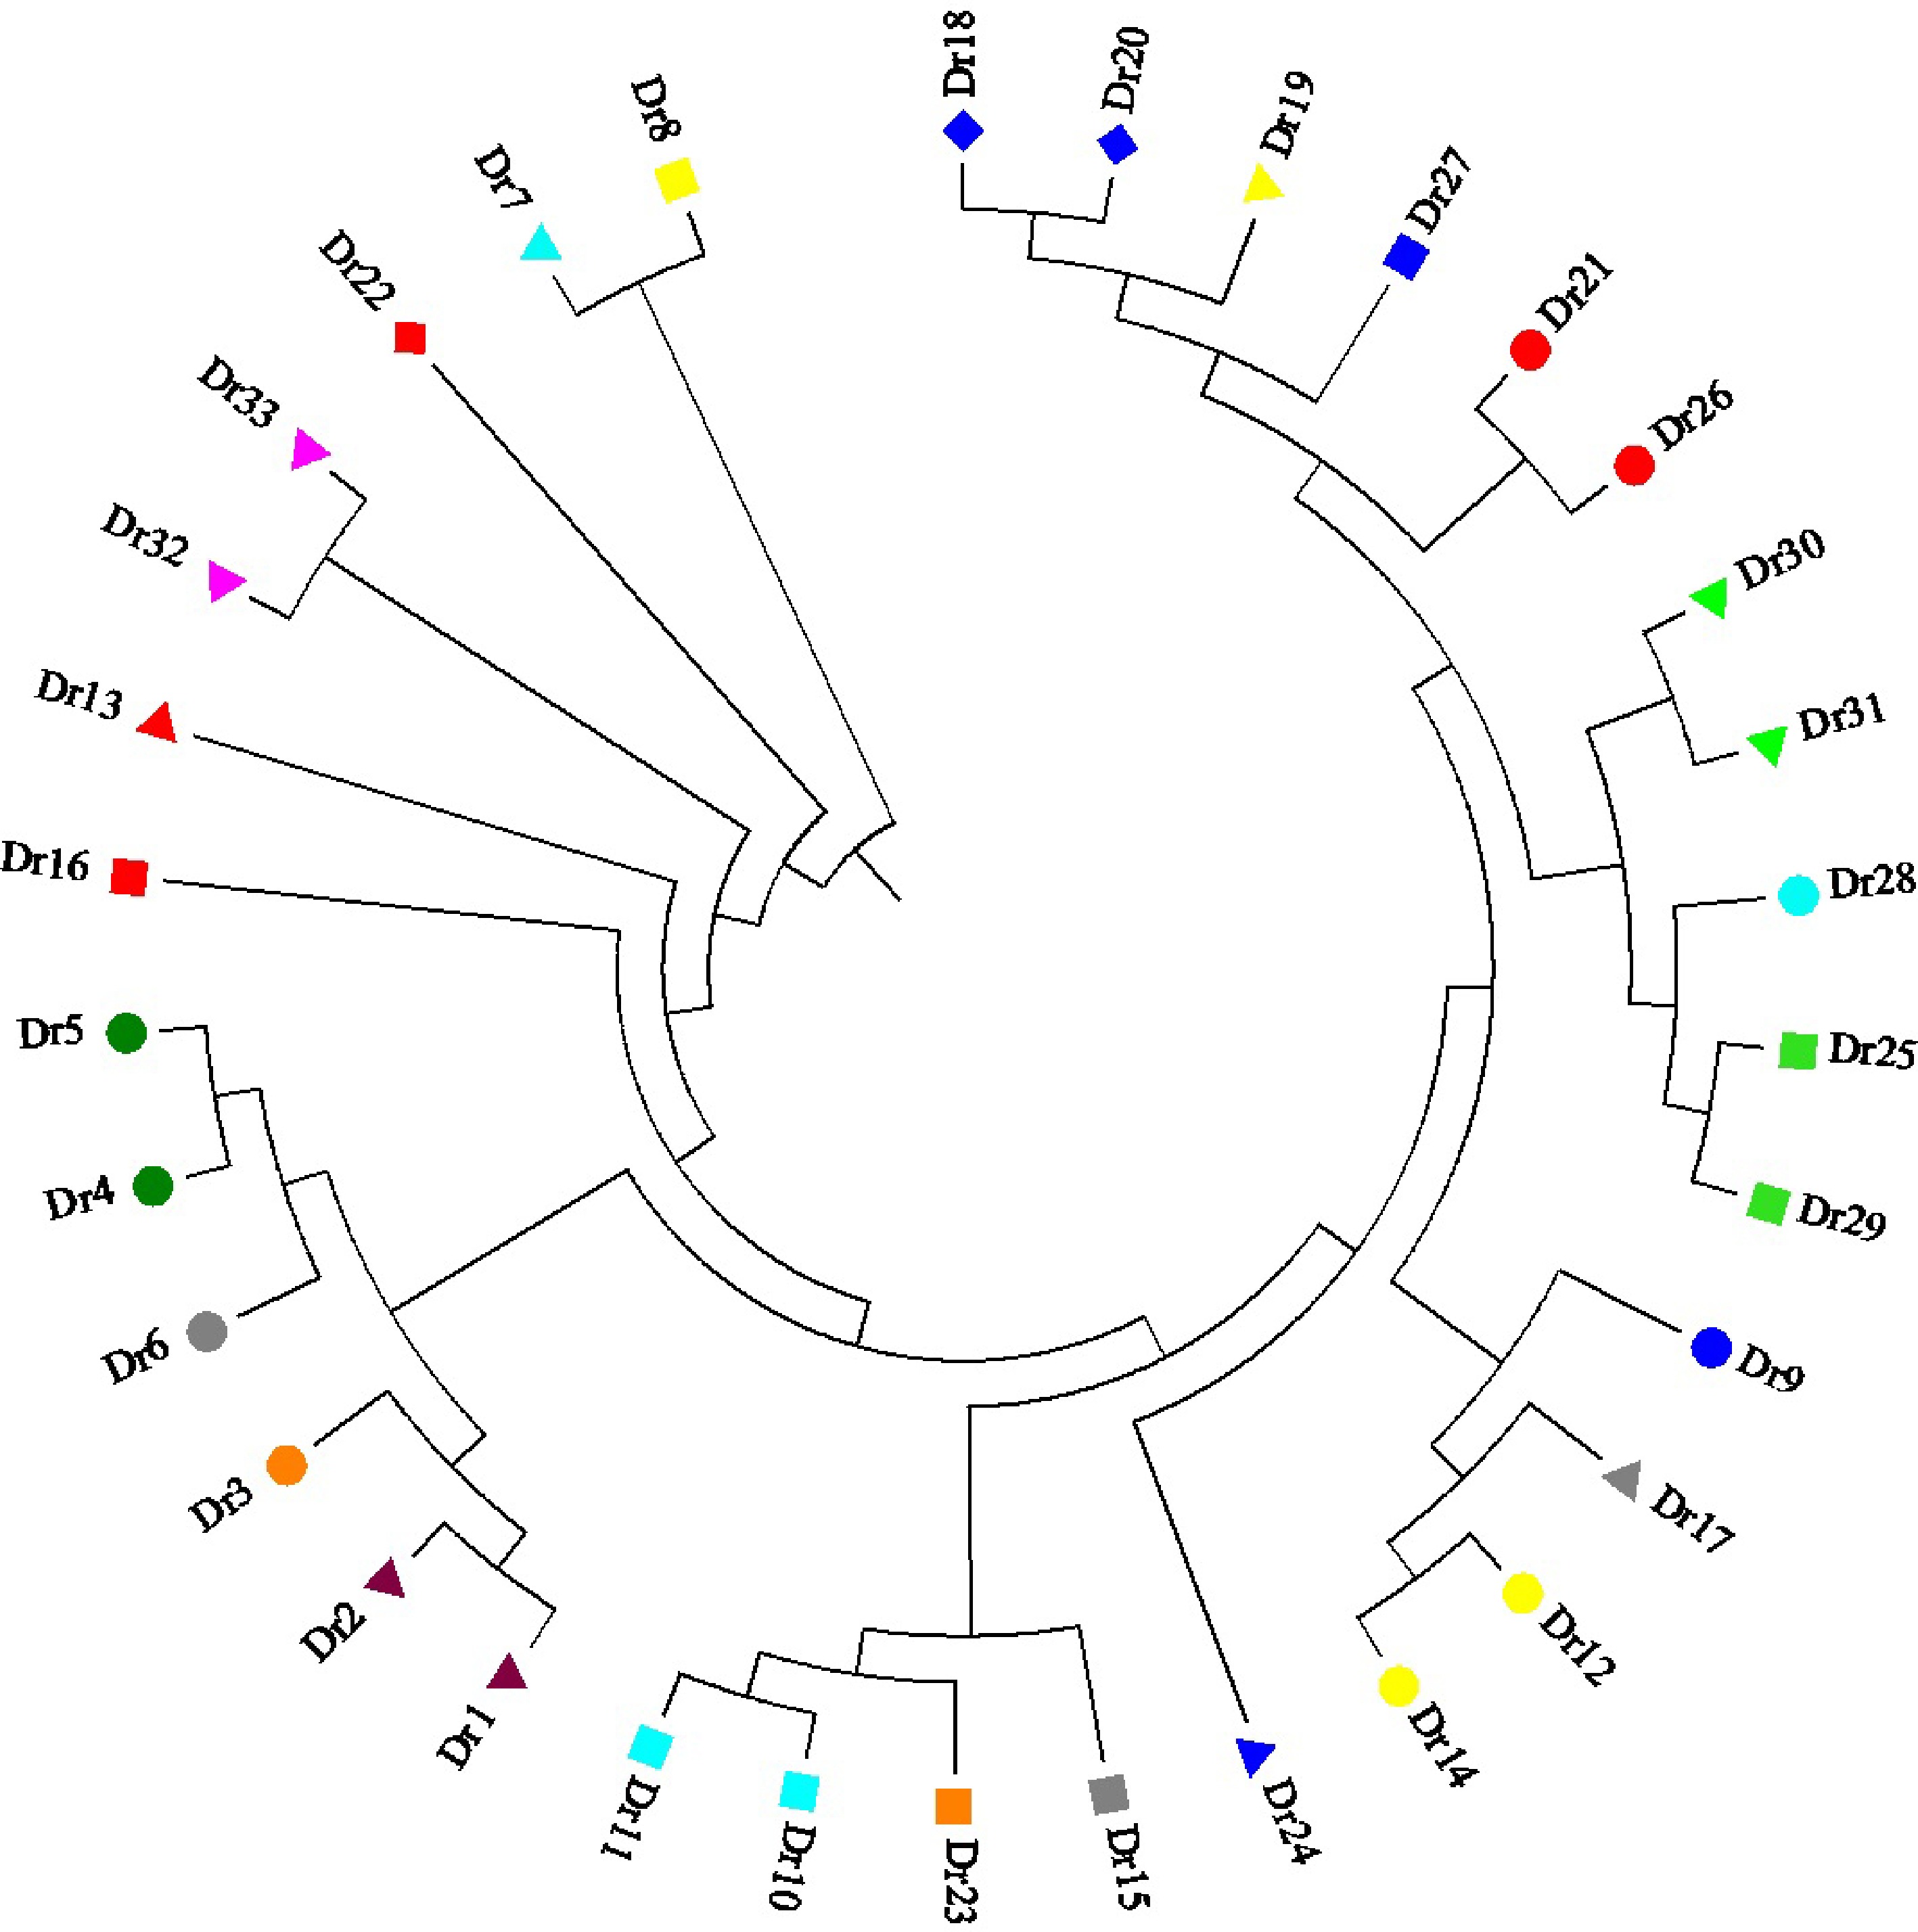
Figure 3.
Cluster analysis of 33 Dichondra repens genotypes based on SSR markers.
Changes in physiological parameters among 33 dichondra
genotypes in response to drought stress -
Dr29 completely died after 46 d of drought stress, so no physiological parameters were detected (Figs 4 & 5). Obvious variations in RWC and EL among 33 genotypes were observed, as demonstrated by drought stress index (DSI) of RWC and EL (Fig. 4a & b). Dr5, Dr18, and Dr33 showed higher DSI of RWC than other genotypes, and smallest DSI of RWC was detected in Dr8 and Dr27 (Fig. 4a). Dr9 or Dr33 had the biggest or smallest DSI of EL than other genotypes, respectively (Fig. 4b). Dr5, Dr9, Dr3, and Dr4 exhibited higher DSI of Chl as compared to other genotypes, whereas Dr28, Dr27, Dr20, and Dr30 had lower DSI of Chl than other genotypes (Fig. 5a). DSI of Fv/Fm of Dr1, Dr2, Dr3, Dr4, or Dr5 was greater than 1.0, but DSI of Fv/Fm of Dr8, Dr14, or Dr27 was less than 0.5 (Fig. 5b). DSI of Fv/Fm of other genotypes ranged from 0.5 to 1.0 (Fig. 5b). The highest DSI of PIABS was detected in Dr5, and DSI of PIABS of Dr7, Dr8, Dr14, or Dr27 were close to 0.0 (Fig. 5c).
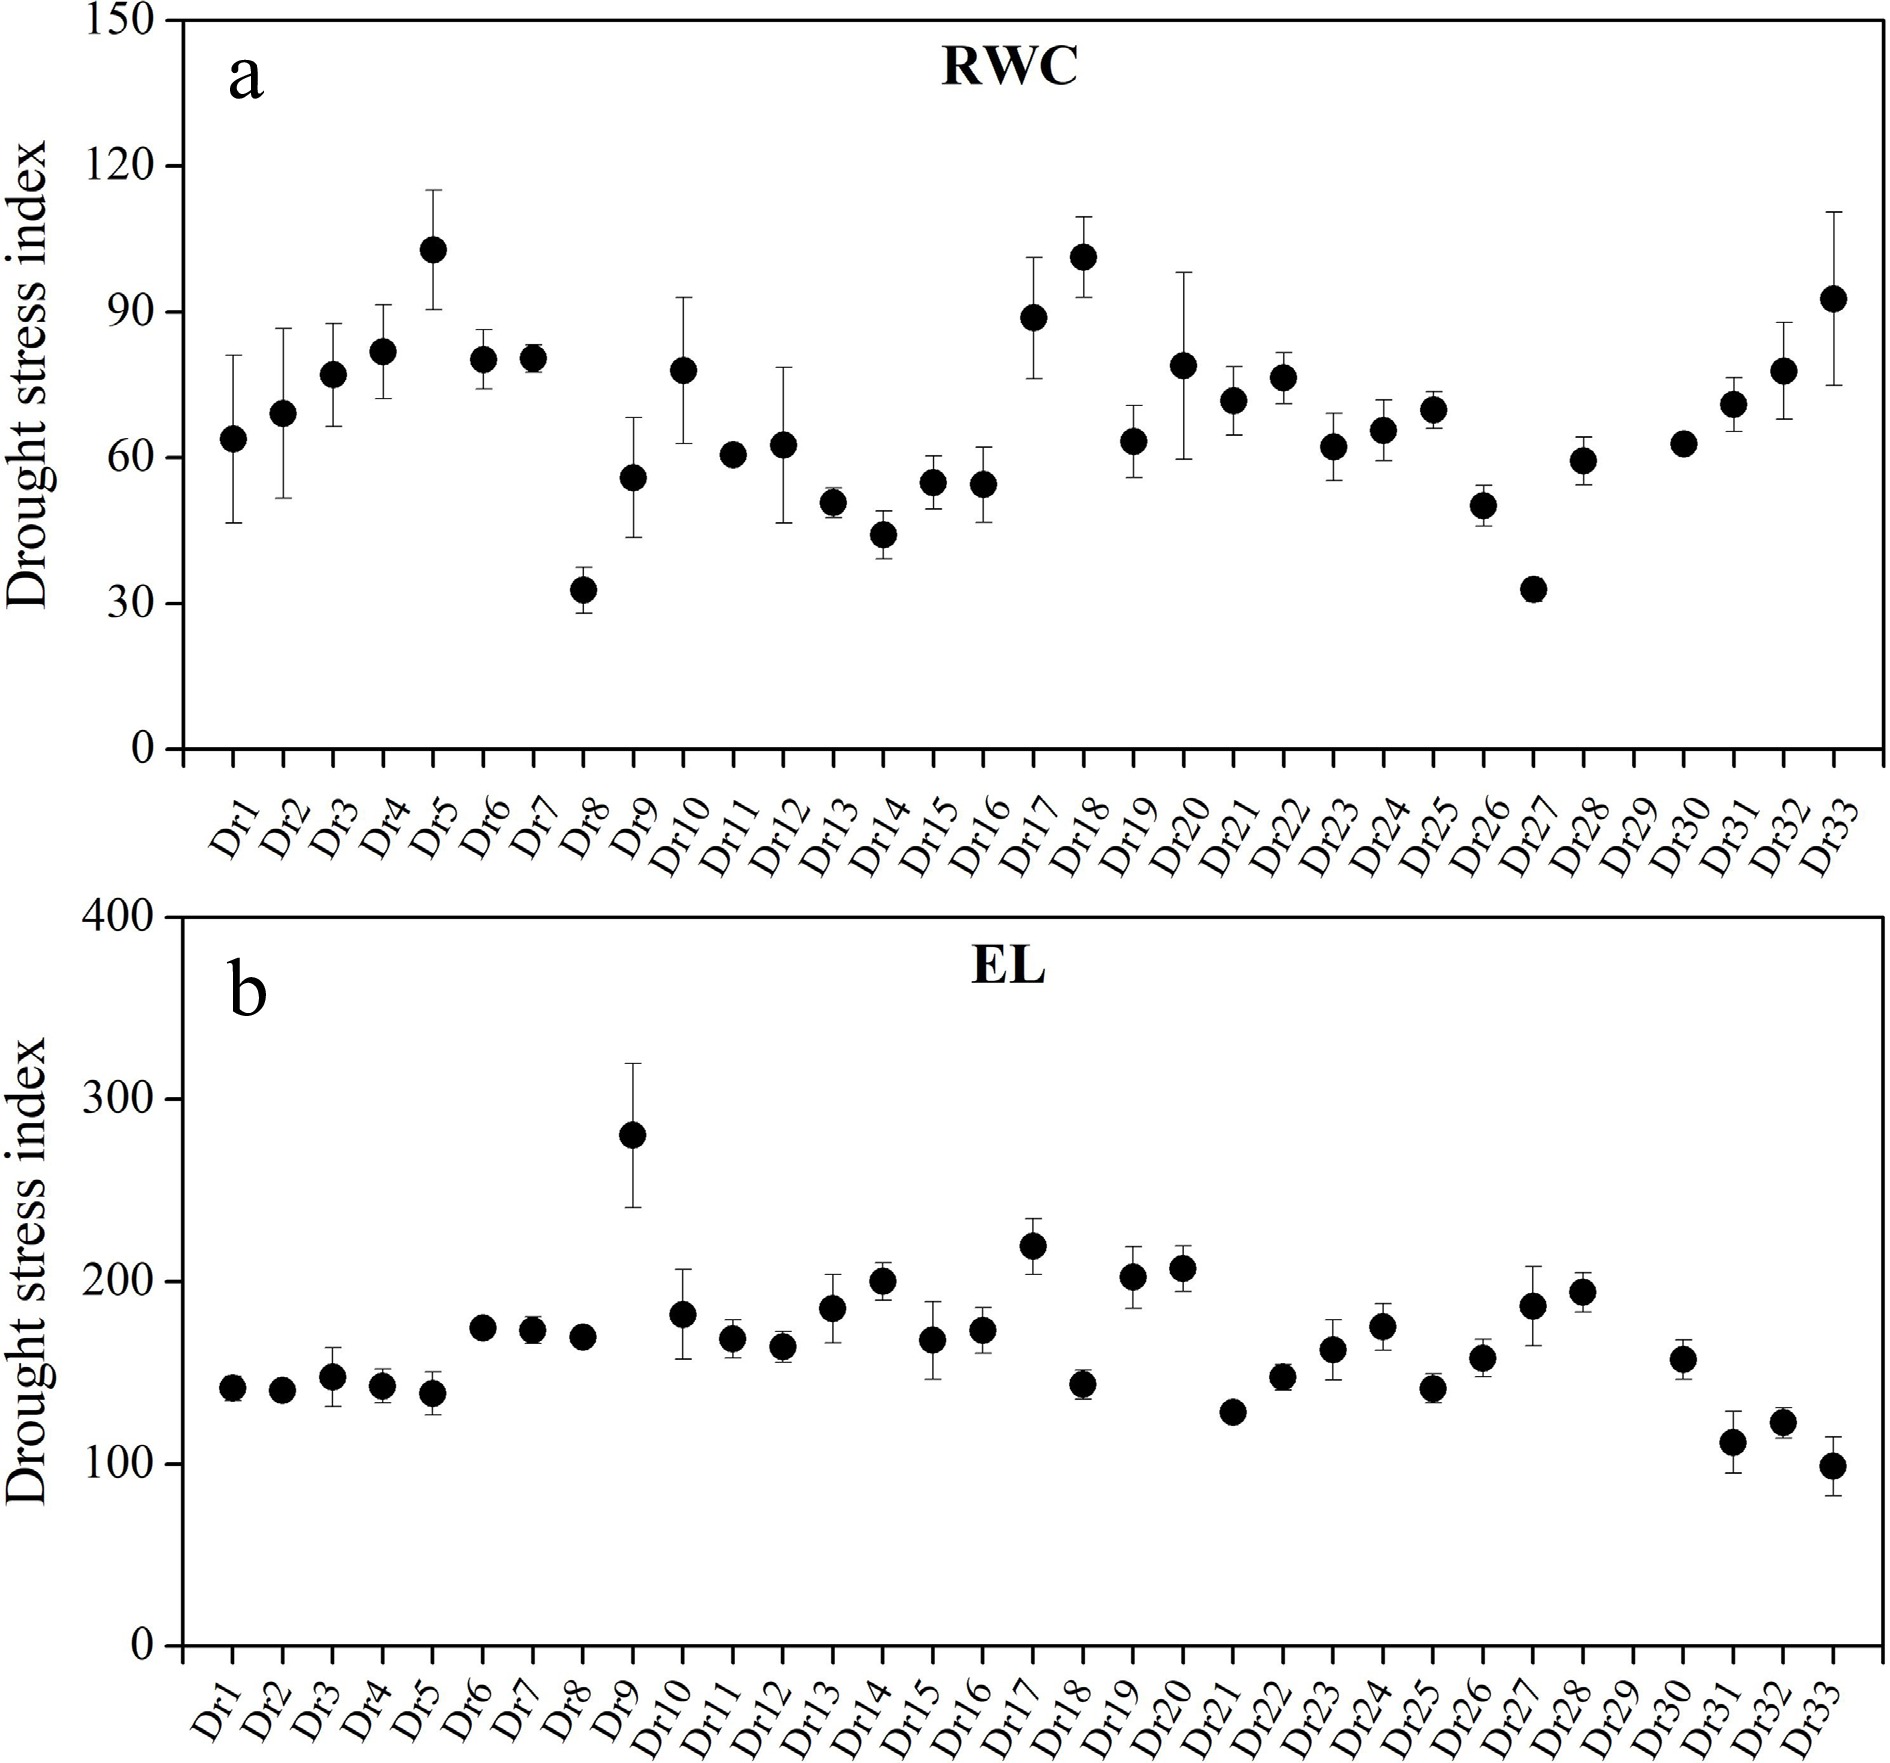
Figure 4.
Differences in drought stress index of (a) relative water content (RWC) and (b) electrolyte leakage (EL) among 33 Dichondra repens genotypes. Vertical bars represent standard errors of the mean (n = 4).
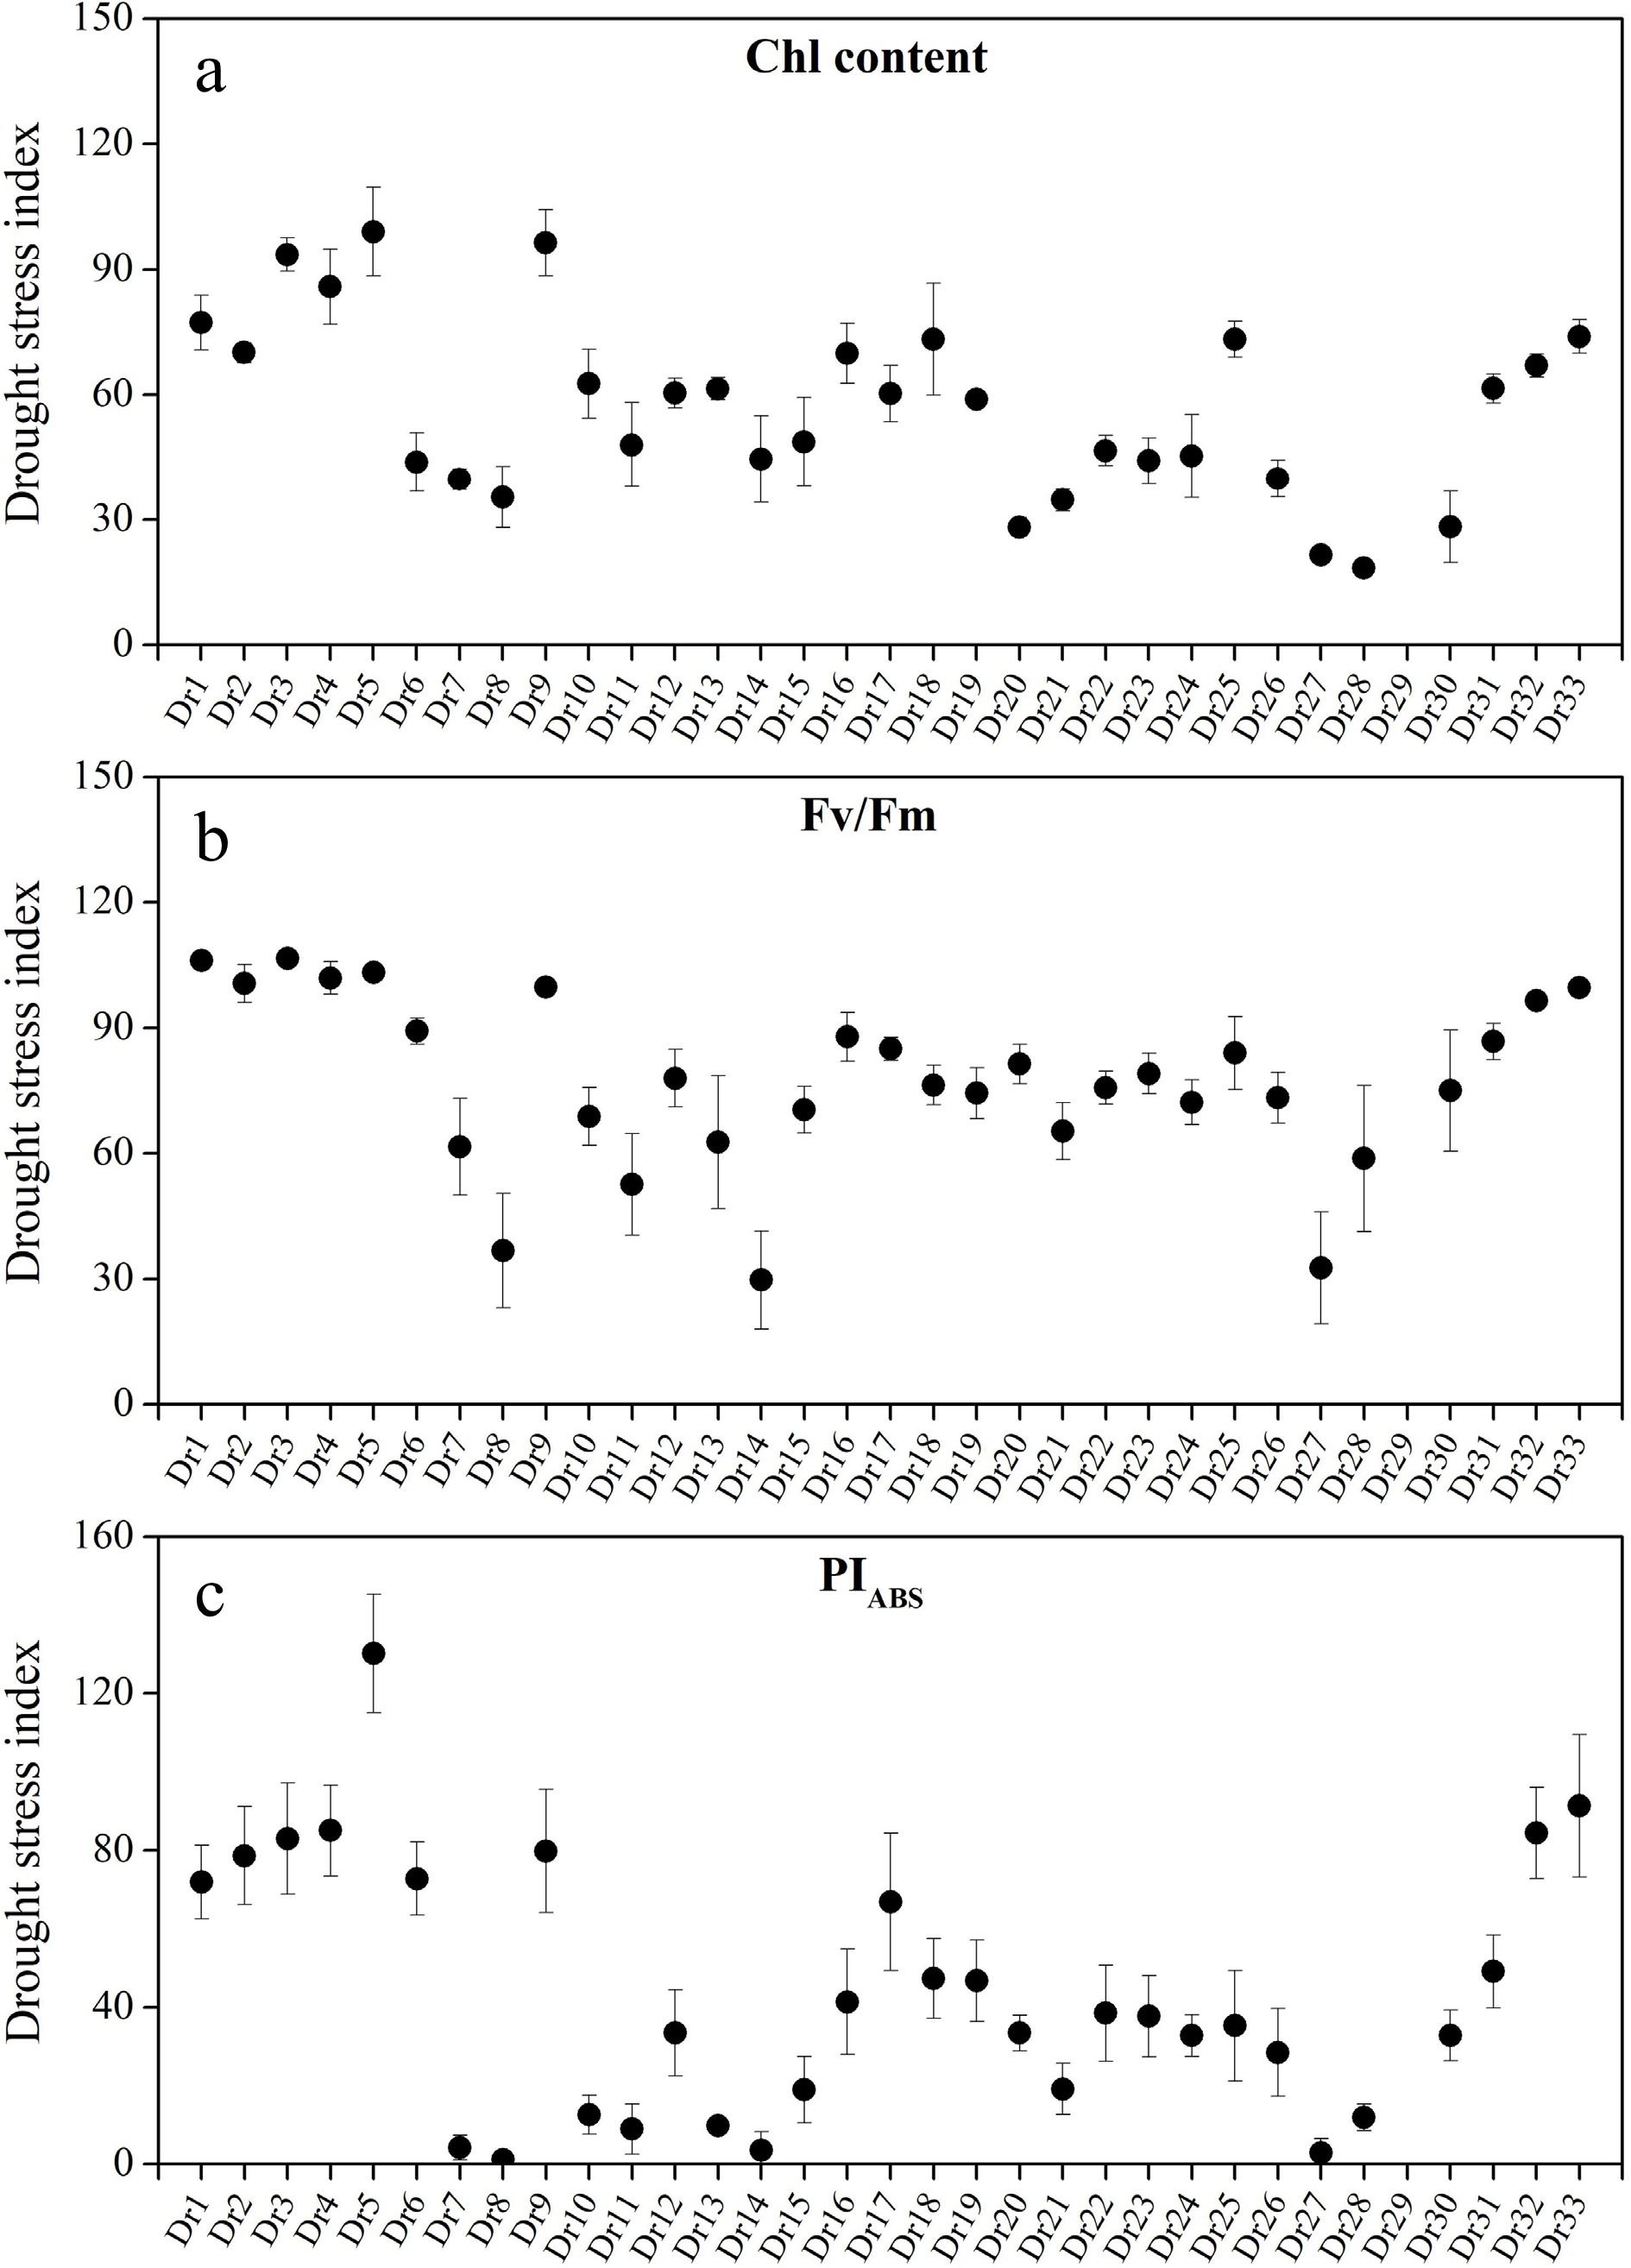
Figure 5.
Differences in drought stress index of (a) chlorophyll (Chl), (b) photosystem II photochemical efficiency (Fv/Fm), and (c) performance index on absorption basis (PIABS) among 33 Dichondra repens genotypes. Vertical bars represent standard errors of the mean (n = 4).
Comprehensive evaluation of drought tolerance among 33 dichondra
genotypes -
Drought tolerance among 33 genotypes was evaluated synthetically based on subordinate function value (SFV) (Table 2). Dr5 had the largest SFV of RWC, and the second or third largest SFV of RWC was found in Dr18 and Dr33, respectively. Dr33 (top), Dr31 (second), and Dr32 (third) showed bigger SFV of EL than other genotypes (Table 2). Maximum SFV of Chl was detected in Dr5. The top three genotypes with bigger SFV of Fv/Fm than other genotypes in the sequences were Dr3, Dr5, and Dr4. Dr5 had the maximum SFV of PIABS as compared to other genotypes, whereas Dr27 exhibited the minimum SFV of PIABS than other genotypes except Dr29. Comprehensive ranking showed Dr29, Dr28, and Dr27 exhibited lower drought tolerance than other genotypes. Out of the 33 genotypes, drought tolerance of Dr5, Dr33, or Dr3 ranked first, second, or third, respectively (Table 2). Heat map showed variations in five physiological parameters among 33 genotypes in response to drought stress (Fig. 6a). 33 genotypes could be divided into three groups based on principal component analysis (PCA) analysis (Fig. 6b). The first group included eight genotypes (Dr5, Dr33, Dr9, Dr1, Dr2, Dr32, Dr3, and Dr4) with better tolerance than other genotypes, and the second group consisted of four genotypes (Dr29, Dr27, Dr8, and Dr14) which had lower drought tolerance than other genotypes. The remaining 21 genotypes were aggregated to form the third group and their drought tolerance was intermediate between the first group and second group (Fig. 6b).
Table 2. Membership function values of five physiological parameters and comprehensive evaluation of drought tolerance among 33 Dichondra repens genotypes.
Material No. RWC EL Chl Fv/Fm PIABS Average Order Dr5 0.836 0.641 0.932 0.879 0.642 0.786 1 Dr33 0.758 0.855 0.719 0.849 0.474 0.731 2 Dr3 0.652 0.618 0.898 0.904 0.455 0.706 3 Dr4 0.681 0.612 0.847 0.868 0.462 0.694 4 Dr32 0.642 0.706 0.637 0.823 0.461 0.654 5 Dr2 0.575 0.613 0.722 0.839 0.433 0.636 6 Dr1 0.536 0.572 0.798 0.842 0.391 0.628 7 Dr18 0.824 0.577 0.752 0.658 0.312 0.625 8 Dr31 0.595 0.766 0.696 0.742 0.295 0.619 9 Dr9 0.458 0.328 0.917 0.851 0.444 0.600 10 Dr6 0.686 0.434 0.570 0.764 0.412 0.573 11 Dr25 0.592 0.545 0.745 0.723 0.253 0.572 12 Dr17 0.735 0.314 0.708 0.727 0.361 0.569 13 Dr16 0.498 0.440 0.736 0.757 0.296 0.545 14 Dr22 0.656 0.569 0.510 0.652 0.252 0.528 15 Dr19 0.539 0.396 0.703 0.643 0.306 0.517 16 Dr10 0.667 0.452 0.703 0.592 0.173 0.517 17 Dr12 0.512 0.430 0.672 0.671 0.248 0.506 18 Dr23 0.523 0.453 0.545 0.679 0.274 0.495 19 Dr21 0.608 0.617 0.428 0.573 0.208 0.487 20 Dr24 0.558 0.422 0.455 0.634 0.272 0.468 21 Dr7 0.717 0.371 0.579 0.539 0.106 0.462 22 Dr15 0.485 0.444 0.541 0.605 0.207 0.456 23 Dr30 0.537 0.484 0.363 0.647 0.243 0.455 24 Dr26 0.425 0.455 0.523 0.635 0.230 0.453 25 Dr13 0.431 0.391 0.718 0.547 0.163 0.450 26 Dr11 0.512 0.483 0.652 0.460 0.142 0.450 27 Dr20 0.676 0.290 0.188 0.700 0.255 0.422 28 Dr8 0.362 0.412 0.567 0.329 0.144 0.363 29 Dr14 0.406 0.281 0.620 0.278 0.145 0.346 30 Dr28 0.505 0.271 0.272 0.514 0.156 0.344 31 Dr27 0.323 0.295 0.321 0.294 0.113 0.269 32 Dr29 0.000 0.000 0.000 0.000 0.000 0.000 33 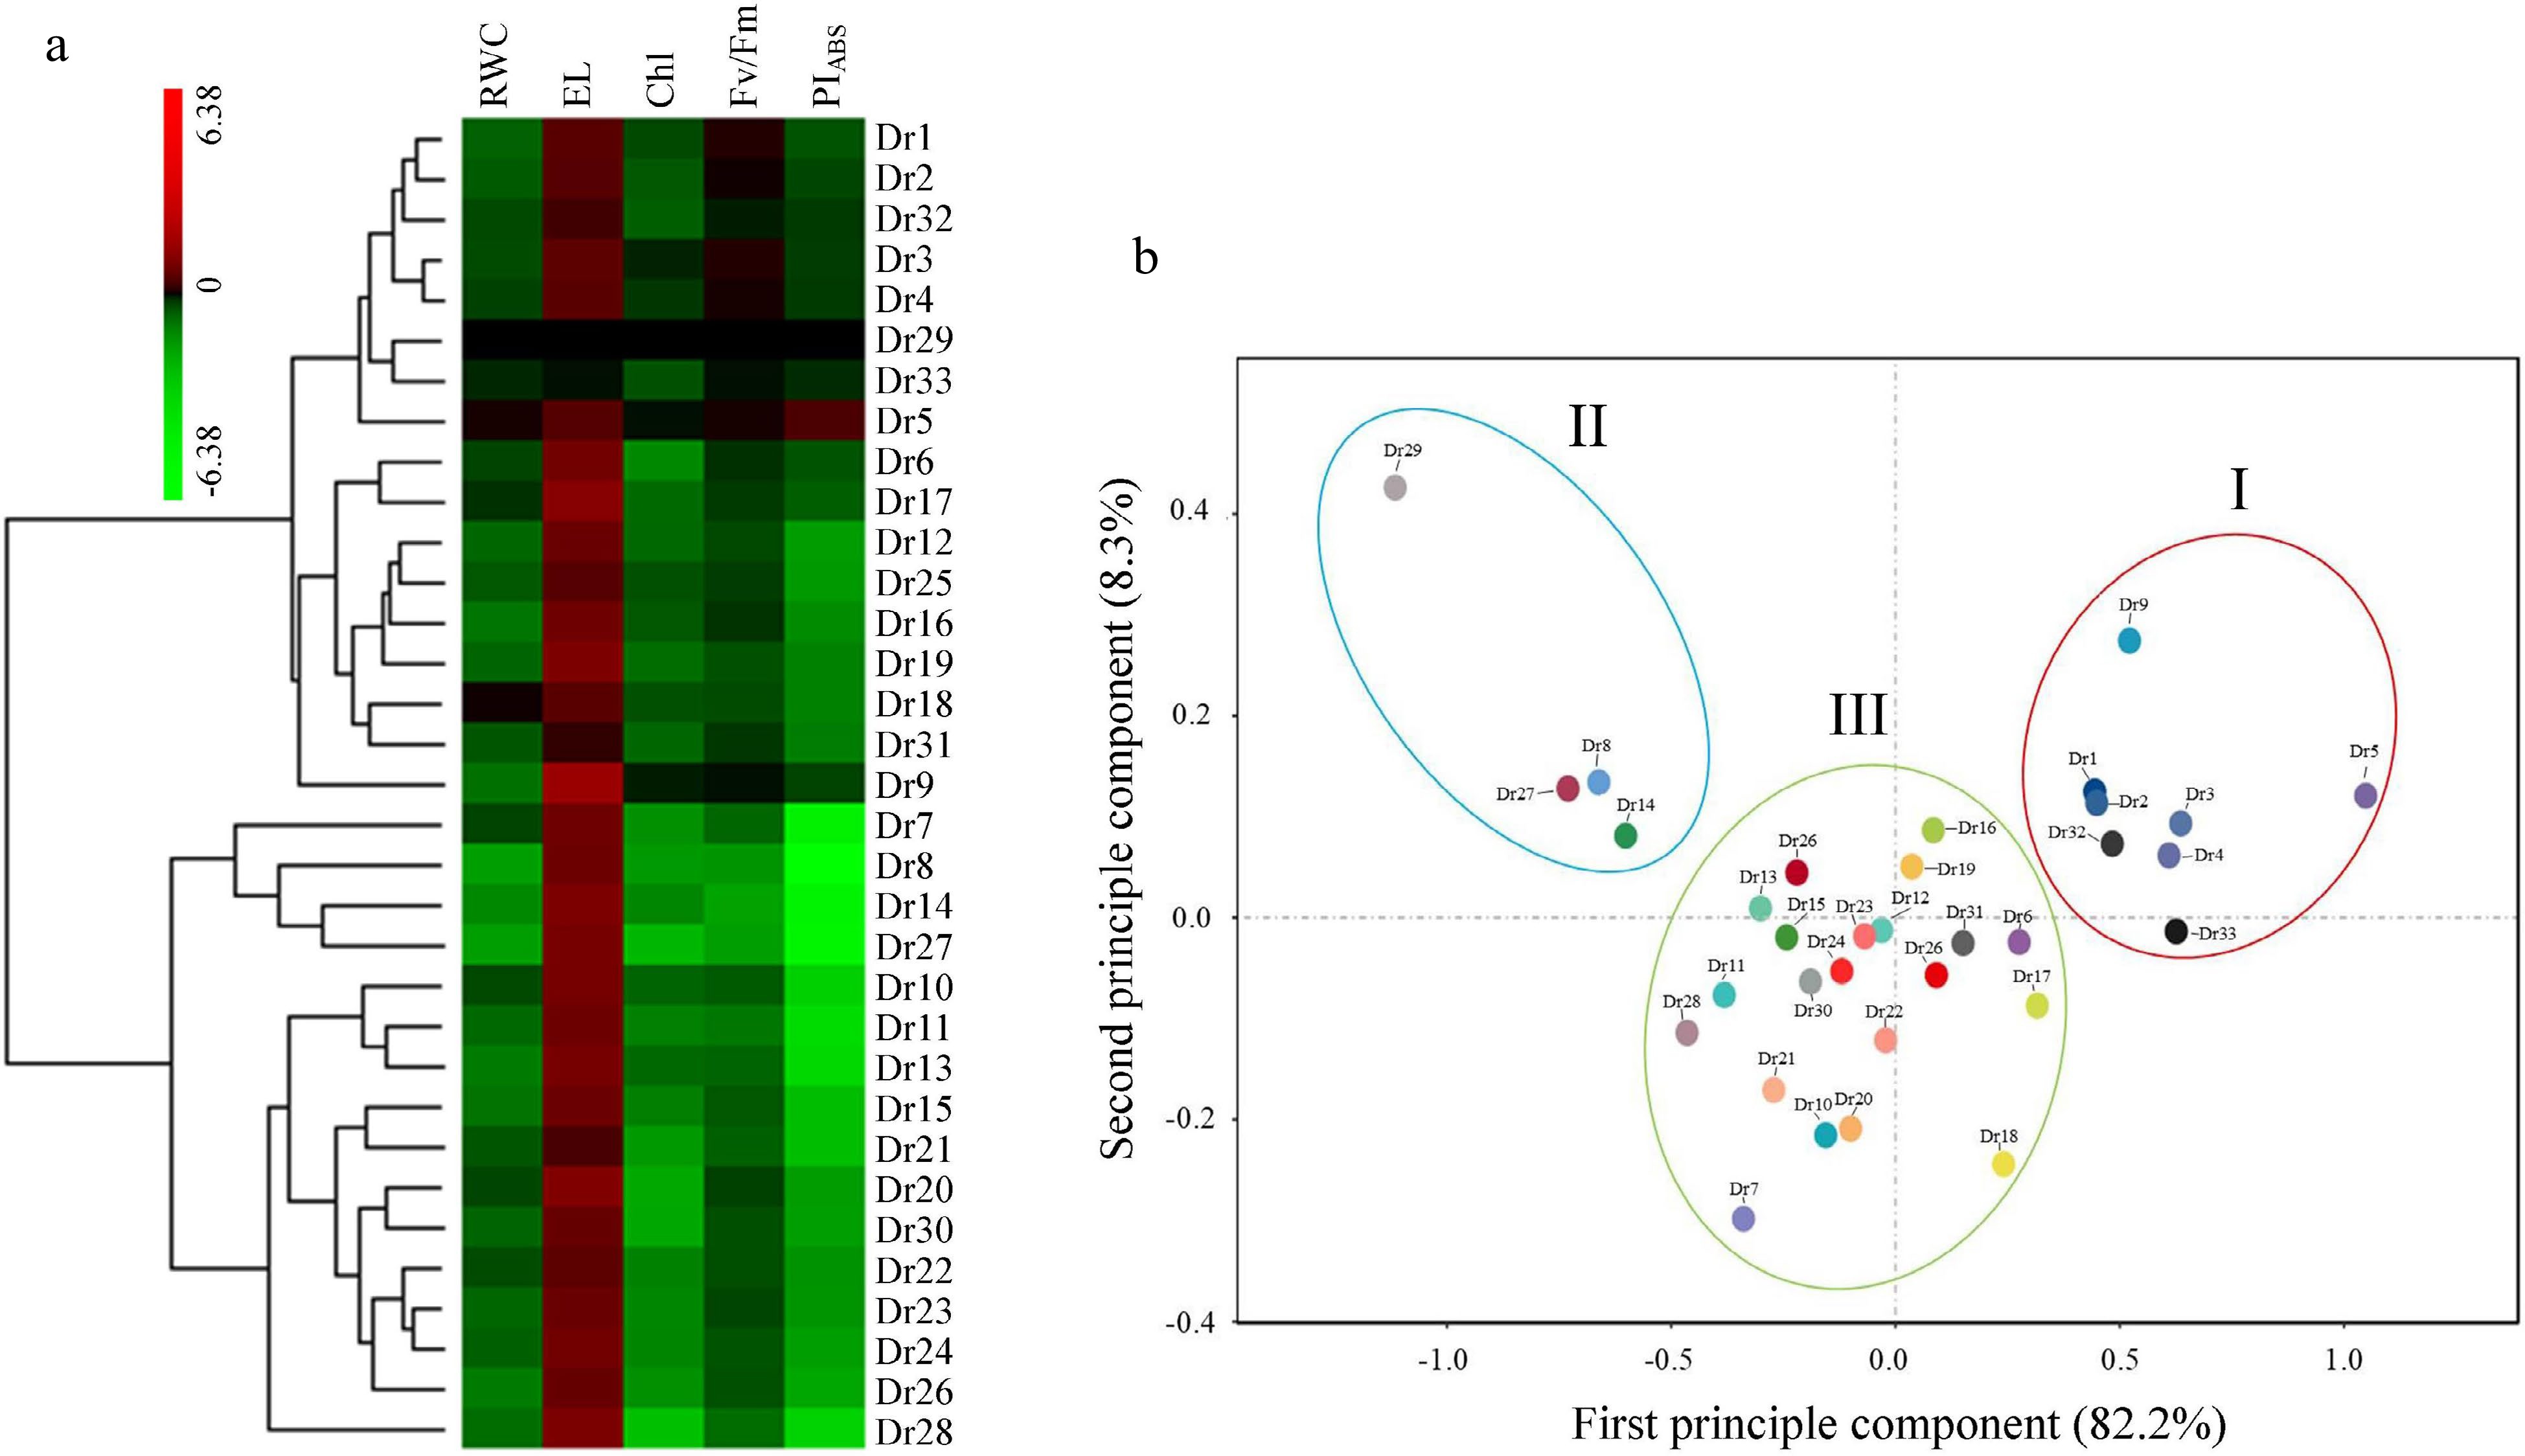
Figure 6.
Changes in (a) heat map and (b) principal component analysis (PCA) based on five different physiological parameters. RWC, relative water content; EL, electrolyte leakage; Chl, chlorophyll; Fv/Fm, photosystem II photochemical efficiency; PIABS, performance index on absorption basis.
-
Wild dichondra is widely distributed in southwest China, but the problem is that lack of enough research has slowed down breeding and utilization of these wild resources. In the past 30 years, SSRs have been widely used to evaluate genetic diversity in various plant species[20−22]. In our current study, significant genetic variation was detected among 33 dichondra genotypes through using 18 selected SSR markers that were developed from convolvulaceous sweet potato (Dioscorea esculenta). Excellent transferability of SSR markers cross related species has been demonstrated in many previous studies. For example, SSR markers from barley (Hordeum vulgare) exhibited good interspecific transferability in wheat (Triticum aestivum) and rye (Secale cereale)[23]. Mutual transferability of SSR between wheat and rye was also very high[24]. In addition, tall fescue (Festuca arundinacea) SSR markers could be applied for evaluation of genetic relationships in meadow fescue (Festuca pratensis), tetraploid fescue (Festuca arundinacea), and ryegrass (Lolium perenne)[25]. Our study found that all 18 primers were found to be polymorphic when they were applied to 33 dichondra genotypes, which indicated these primer pairs could be used for analysis of genetic diversity and cultivar identification in dichondra species. In addition, phenotypic variations in plant height, leaf area, leaf thickness, and petiole length were also observed among 33 dichondra genotypes under well-watered condition. Diverse morphological variability and genetic variation are beneficial to screen suitable accessions for stress adaptation, because variation in morphological characters often indicates genetic differences in one particular plant species, which provides abundant gene resources for screening new cultivars differing in drought tolerance.
Although many previous studies have been conducted to identify drought-tolerant plant genotypes in the field or under controlled conditions[26−29], selection and identification of dichondra genotypes with better drought tolerance have not been reported so far. Leaf RWC and EL are two important indicators of drought tolerance, as the RWC reflects leaf water status and the EL indicates cell membrane stability when plants suffer from drought stress[30]. Both of them have been applied to evaluate plant drought tolerance. Ahmed et al. found that drought tolerance of wheat was positively related to higher RWC and cell membrane stability which could be used to screen drought-tolerant genotypes at the seedling stage[31]. Drought-tolerant bermudagrass (Cynodon dactylon) also showed higher RWC and lower EL than drought-sensitive accessions in response to drought stress[18]. Dhanda et al. reported that cell membrane stability was the most important trait for evaluation of drought tolerance among thirty wheat cultivars[32]. Our current study demonstrated that Dr5, Dr18, and Dr33 could maintain higher leaf RWC and lower EL than other dichondra genotypes, whereas Dr8 exhibited the lowest RWC and the highest EL under drought stress. Those genotypes with higher leaf RWC and lower EL in response to drought stress could be recognized as potential breeding materials for developing drought-tolerant varieties.
Drought-tolerant plants could delay Chl degradation to maintain higher photosynthesis under water-deficit condition[33]. It has been found that the maintenance of higher Chl content is a common characteristic in drought-tolerant plant genotypes[18, 31]. Apart from Chl content, Fv/Fm and PIABS also are critical parameters for evaluation of stress tolerance in plant species, as Fv/Fm represents photosystem II photochemical efficiency and PIABS indicates health status of photosynthetic organs[34, 35]. It has been found that higher Chl content, Fv/Fm, or PIABS were the superior indicators with regard to better tolerance to heat stress in creeping bentgrass (Agrostis stolonifera) accessions[17], salt stress in white clover germplasm[16], and drought stress in sour cherry (Prunus cerasus) genotypes[36]. Dichondra genotypes exhibited significant variations in Chl content, Fv/Fm, and PIABS in response to a prolonged period of drought stress. Higher Chl content, Fv/Fm, and PIABS were found in Dr3, Dr4, Dr5, Dr9, and Dr33 which could be potential drought-tolerant genotypes.
Drought tolerance evaluated by one particular parameter is often one-sided. Subordinate function value analysis (SFVA) has been applied to comprehensively evaluate drought tolerance of diverse plant accessions based on different parameters[28, 37, 38]. The most promising drought-tolerant dichondra genotypes (Dr5, Dr33, Dr3, Dr4, and Dr32) were screened based on the SFVA in our current study. In addition, those 33 dichondra genotypes were classified into three distinct groups according to the analysis of PCA. Group I included 8 genotypes (Dr1, Dr2, Dr3, Dr4, Dr5, Dr9, Dr32, and Dr33) which were identified to be drought-tolerant candidates and group II contained four genotypes (Dr8, Dr14, Dr27, and Dr29) which were recognized as drought-sensitive accessions. The remaining 21 dichondra genotypes were classified into group III, which was intermediate between group I and III for drought tolerance. Similar results were found in the study of Badr et al. who reported that PCA analysis could clearly separate out drought-tolerant maize (Zea mays) genotypes from 40 accessions[39]. Analytic results from SFVA were consistent with the findings based on the analysis of PCA. These selected drought-tolerant genotypes offer available materials for breeders to develop new dichondra cultivars.
-
A total of 18 SSR primer pairs were applied to evaluate genetic diversity of 33 dichondra genotypes and all primer pairs were found to be polymorphic. Natural variations in phenotypes including plant height, leaf area, leaf thickness, and petiole length were also observed among 33 genotypes under the well-watered condition. Drought tolerance of 33 genotypes was ranked by using SFVA, and the most tolerant genotype was Dr5 and most drought-sensitive genotype was Dr29. In addition, PCA analysis could classify 33 genotypes into group I (drought-tolerant), group II (drought-sensitive), and group III (medium types). Current findings showed that 18 selected SSR primer pairs could be used to potentially analyze genetic diversity and varietal identification in dichondra species. Selected drought-tolerant wild resources provide a rich genetic base for the breeding of new cultivars.
-
Thirty wild dichondra genotypes and three commercial cultivars 'Silver falls', 'Xiaoshao', and 'Duliujiang' were collected from the Field Gene Bank at Sichuan Agricultural University (Table 3) and transplanted into polyvinyl chloride (PVC) tubes (33 cm in length, and 11 cm in diameter). All PVC tubes were filled with same mixtures of soil and sand (v:v, 1:1). Plants were cultivated in a greenhouse from July 14th to August 30th, 2020 (average temperature about 27/18 °C day/night and 800 μmol m−2∙s−1 photosynthetically active radiation) and fertilized weekly with full Hoagland's solution[40]. For drought treatment, plants were then divided into two groups: one group was irrigated three times a week to avoid soil drought as well-watered control, and another group was subjected to drought stress by stop irrigating for 46 d. Leaves were collected for detecting physiological parameters and SSR markers. Each genotype was replicated four times (four tubes) under normal condition or drought stress.
Table 3. Test 33 Dichondra repens materials and their sources.
Material No. Origin Altitude (m) Dr1 Zhongjiang, Sichuan 600 Dr2 Pingtang, Guizhou 848 Dr3 Dushan, Guizhou 1010 Dr4 Tianzhu, Guizhou 350 Dr5 Naxi, Sichuan 404 Dr6 Dayi, Sichuan 310 Dr7 Bishan, Chongqing 350 Dr8 Jining, Yunnan 1890 Dr9 Xifeng,Guizhou 990 Dr10 Xishui, Guizhou 1169 Dr11 Sinan, Guizhou 730 Dr12 Jiangkou, Guizhou 475 Dr13 Tongren, Guizhou 415 Dr14 Zhenyuan, Guizhou 382 Dr15 Danzai, Guizhou 894 Dr16 Sandu, Guizhou 500 Dr17 Sandu, Guizhou 780 Dr18 Dujun, Guizhou 842 Dr19 Shuicheng, Guizhou 1193 Dr20 Liuzhi, Guizhou 1035 Dr21 Anshun, Guizhou 1278 Dr22 Qinglong, Guizhou 1393 Dr23 Jin’an, Guizhou 1336 Dr24 Panzhou, Guizhou 1532 Dr25 Xingren, Guizhou 1336 Dr26 Anlong, Guizhou 1250 Dr27 Wangmo, Guizhou 653 Dr28 Ziyun, Guizhou 1160 Dr29 Huishui, Guizhou 980 Dr30 (‘Silver Falls’) USA - Dr31 Xichou, Yunnan 1108 Dr32 (‘Xiaoshao’) Yiliang, Yunnan 1970 Dr33 (‘Duliujiang’) Sandu, Guizhou 600 Measurements of phenotypic and physiological parameters
-
A vernier caliper was used to measure leaf thickness and leaf area (S) which was calculated based on the formula S = π × [(length + width) / 4]2. Plant height and petiole length were measured by using a ruler, and 10 independent plants were selected randomly from each tube for the measurement of these phenotypic parameters. For leaf RWC, fresh leaves were cut from plants and weighted instantly to record fresh weight (FW). These leaves were then soaked in deionized water for 10 h and turgid weight (TW) was weighted. All leaves were put in an oven at 80 °C for 72 h to detect dry weight (DW). The RWC was calculated as RWC (%) = [(FW − DW) / (TW −DW)] × 100)[41]. To detect leaf EL, fresh leaves (0.15 g) were soaked in 40 mL of deionized water for 24 h at 25 °C and initial conductivity of solution (Cinitial) was measured by using a conductivity meter (YSI Model 32, Yellow Spring, OH). Max conductivity of solution (Cmax) was detected after leaves were autoclaved at 120 °C for 20 min. The EL was calculated as the ratio of Cinitial to Cmax[42]. For Chl content, leaves were soaked in 15 mL of dimethyl sulfoxide for 48 h and absorbance was detected at 645 and 663 nm with a spectrophotometer (Spectronic Instruments, Rochester, NY, USA)[43]. For Fv/Fm and PIABS, leaves were kept in darkness for 15 min and a fluorescence meter (Pocket PEA Chl Fluorimeter, Hansatech Instruments Ltd, UK) was used to record Fv/Fm and PIABS[44].
DNA isolation, PCR amplification, and evaluation of polymorphism
-
Total DNA was extracted from approximately 0.1 g of fresh leaf tissues by using an assay kit purchased from Tiangen Biotech Co., LTD, Beijing, China. A Hoefer Dyna Quant 200 (Amersham Biosciences, Piscataway, NJ, USA) was used to detect DNA concentration which was adjusted to 10 ng ∙ μL−1 of final concentration using purified water. PCR reaction was conducted by using 7.5 μL of 2× Mix (P2015, Dongsheng Biotech), 3 μL of DNA, 1.5 μL of 0.6 μmol∙L−1 each primer, and 3 μL of purified water. A total of 18 primer sequences which were developed from sweet potato and their annealing temperature were recorded in Supplmental Table S1[45]. PCR products were electrophoresed in 6% polyacrylamide denaturing gels under 200 V for 30 min and then 400 V for 1.5 h. For SSR bands detection, gels were silver-stained and then captured using a camera. Gel images were analyzed by using the software Gel Analyzer 19.1 (
www.gelanalyzer.com ) to estimate base pair size of bands. Polymorphism was determined based on absence or presence of SSR locus.Statistical analysis
-
Variations in phenotypic and physiological parameters were analyzed by Statistix 8.1 (Tallahassee, FL, USA). PCA biplot analysis was performed by using SPSS 20 (IBM, Armonk, NY, USA). Drought tolerance was evaluated by using SFVA based on five physiological parameters (RWC, EL, Chl, Fv/fm, and PIABS)[17]. DSI was calculated according to the formula DSI = (value of parameter under drought stress) / (value of parameter under normal condition) × 100. Cluster analysis of 33 Dichondra micrantha genotypes based on SSR markers was conducted by using NTSYSPC2.10e and MEGA 6 (Tokyo Metropolitan University, Hachioji, Tokyo, Japan)[46].
-
We appreciate Prof. Youmin Gan who collected wild dichondra resources from southwest China and established the Field Gene Bank at Sichuan Agricultural University.
-
The authors declare that they have no conflict of interest.
- Table S1 SSR primer sequences.
- Copyright: © 2022 by the author(s). Published by Maximum Academic Press, Fayetteville, GA. This article is an open access article distributed under Creative Commons Attribution License (CC BY 4.0), visit https://creativecommons.org/licenses/by/4.0/.
-
About this article
Cite this article
Tan M, Ling Y, Peng Y, Li Z. 2022. Evaluation of genetic diversity and drought tolerance among thirty-three dichondra (Dichondra repens) genotypes. Grass Research 2:8 doi: 10.48130/GR-2022-0008 

Evaluation of genetic diversity and drought tolerance among thirty-three dichondra (Dichondra repens) genotypes
- Received: 01 September 2022
- Accepted: 14 November 2022
- Published online: 28 November 2022
Abstract: Dichondra (Dichondra repens) is an important ground cover plant and is also used as a herbal medicine in China. Objectives of this study were to evaluate phenotypic and genetic diversities among 33 genotypes by using 18 simple sequence repeat (SSR) markers and to further identify the drought tolerance of these germplasms based on five physiological parameters. Results showed that natural variations in phenotypes including plant height, leaf area, leaf thickness, and petiole length were observed among 33 genotypes under well-watered conditions. All 18 SSR primer pairs were found to be polymorphic and significant genetic variation was found in these genotypes. In addition, there were obvious differences in leaf relative water content (RWC), electrolyte leakage (EL), chlorophyll (Chl) content, photochemical efficiency (Fv/Fm), and performance index on absorption basis (PIABS) among 33 genotypes in response to a prolonged period of drought stress (46 d). Drought tolerance of 33 genotypes was then ranked by using subordinate function value analysis (SFVA) and the most drought-tolerant or -sensitive genotypes were identified as Dr5 or Dr29, respectively. Principal component analysis (PCA) further classified 33 genotypes into group I (drought-tolerant), group II (drought-sensitive), and group III (medium types). Current findings showed that 18 selected SSR primers could be potentially used to analyze genetic diversity and varietal identification in dichondra species. Drought-tolerant wild dichondra resources provide a rich genetic base for breeding of new cultivars.
-
Key words:
- Drought /
- Dichondras /
- Genetic diversity /
- SSR /
- Photochemical efficiency