ARTICLE   Open Access    

Insights into microRNA regulation of flower coloration in a lily cultivar Vivian petal

  • # These authors contributed equally: Xiaojuan Yin, Zhenhua Gao

More Information
  • MicroRNAs (miRNAs) are a class of non-coding small RNAs involved in the negative regulation of gene expression, which plays critical roles in developmental and metabolic pathways. However, it is not well understood how miRNA regulate the anthocyanin biosynthesis pathway in lily flowers. Using miRNA sequencing and target gene expression analysis, we explored the regulatory networks of miRNAs and their target-related flower coloration in lily petals. A total of 326 miRNAs were obtained by miRNA sequencing, including 285 known miRNAs and 41 new miRNAs. According to the psRNATarget prediction, there were a total of 75 differentially expressed miRNAs (DEMs) that target 898 potential genes. We also screened the target genes including LvSPL, LvMYB5, LvWD, Lv3GT, LvGRF, LvARF, LvNAC, and LvMADS, which were targeted by LvmiR156, LvmiR828, LvmiR166, LvmiR396, LvmiR160, LvmiR167, LvmiR164, and LvmiR5179. These genes may be involved in regulating other secondary metabolic pathways, and forming a complex regulatory network of anthocyanin biosynthesis. We therefore proposed a putative miRNA-target module associated with anthocyanin biosynthesis. In addition, we predicted the binding site of LvMYB5, the target gene of miR828, and speculated that miR828 targets regulate LvMYB5 transcriptional translation through a cleavage site, which then inhibits anthocyanin synthesis. Our findings contribute to an understanding of the functional characterization of miRNAs and their targets in controlling anthocyanin production in plants and may lead to future identification and characterization of miRNAs in lilies.
  • Grapevines are among the most widely grown and economically important fruit crops globally. Grapes are used not only for wine making and juice, but also are consumed fresh and as dried fruit[1]. Additionally, grapes have been increasingly recognized as an important source of resveratrol (trans-3, 5,4'-trihydroxystilbene), a non-flavonoid stilbenoid polyphenol that in grapevine may act as a phytoalexin. In humans, it has been widely reported that dietary resveratrol has beneficial impacts on various aspects of health[2, 3]. Because of the potential value of resveratrol both to grapevine physiology and human medicine, resveratrol biosynthesis and its regulation has become an important avenue of research. Similar to other stilbenoids, resveratrol synthesis utilizes key enzymes of the phenylpropanoid pathway including phenylalanine ammonia lyase (PAL), cinnamate 4-hydroxylase (C4H), and 4-coumarate-CoA ligase (4CL). In the final steps, stilbene synthase (STS), a type II polyketide synthase, produces trans-resveratrol from p-coumaroyl-CoA and malonyl-CoA, while chalcone synthase (CHS) synthesizes flavonoids from the same substrates[4, 5]. Moreover, trans-resveratrol is a precursor for other stilbenoids such as cis-resveratrol, trans-piceid, cis-piceid, ε-viniferin and δ-viniferin[6]. It has been reported that stilbenoid biosynthesis pathways are targets of artificial selection during grapevine domestication[7] and resveratrol accumulates in various structures in response to both biotic and abiotic stresses[812]. This stress-related resveratrol synthesis is mediated, at least partialy, through the regulation of members of the STS gene family. Various transcription factors (TFs) participating in regulating STS genes in grapevine have been reported. For instance, MYB14 and MYB15[13, 14] and WRKY24[15] directly bind to the promoters of specific STS genes to activate transcription. VvWRKY8 physically interacts with VvMYB14 to repress VvSTS15/21 expression[16], whereas VqERF114 from Vitis quinquangularis accession 'Danfeng-2' promotes expression of four STS genes by interacting with VqMYB35 and binding directly to cis-elements in their promoters[17]. Aided by the release of the first V. vinifera reference genome assembly[18], genomic and transcriptional studies have revealed some of the main molecular mechanisms involved in fruit ripening[1924] and stilbenoid accumulation[8, 25] in various grapevine cultivars. Recently, it has been reported that a root restriction treatment greatly promoted the accumulation of trans-resveratrol, phenolic acid, flavonol and anthocyanin in 'Summer Black' (Vitis vinifera × Vitis labrusca) berry development during ripening[12]. However, most of studies mainly focus on a certain grape variety, not to investigate potential distinctions in resveratrol biosynthesis among different Vitis genotypes. In this study, we analyzed the resveratrol content in seven grapevine accessions and three berry structures, at three stages of fruit development. We found that the fruits of two wild, Chinese grapevines, Vitis amurensis 'Tonghua-3' and Vitis davidii 'Tangwei' showed significant difference in resveratrol content during development. These were targeted for transcriptional profiling to gain insight into the molecular aspects underlying this difference. This work provides a theoretical basis for subsequent systematic studies of genes participating in resveratrol biosynthesis and their regulation. Further, the results should be useful in the development of grapevine cultivars exploiting the genetic resources of wild grapevines. For each of the seven cultivars, we analyzed resveratrol content in the skin, pulp, and seed at three stages of development: Green hard (G), véraison (V), and ripe (R) (Table 1). In general, we observed the highest accumulation in skins at the R stage (0.43−2.99 µg g−1 FW). Lesser amounts were found in the pulp (0.03−0.36 µg g−1 FW) and seed (0.05−0.40 µg g−1 FW) at R, and in the skin at the G (0.12−0.34 µg g−1 FW) or V stages (0.17−1.49 µg g−1 FW). In all three fruit structures, trans-resveratrol showed an increasing trend with development, and this was most obvious in the skin. It is worth noting that trans-resveratrol was not detectable in the skin of 'Tangwei' at the G or V stage, but had accumulated to 2.42 µg g−1 FW by the R stage. The highest amount of extractable trans-resveratrol (2.99 µg g−1 FW) was found in 'Tonghua-3' skin at the R stage.
    Table 1.  Resveratrol concentrations in the skin, pulp and seed of berries from different grapevine genotypes at green hard, véraison and ripe stages.
    StructuresSpeciesAccessions or cultivarsContent of trans-resveratrol (μg g−1 FW)
    Green hardVéraisonRipe
    SkinV. davidiiTangweindnd2.415 ± 0.220
    V. amurensisTonghua-30.216 ± 0.0410.656 ± 0.0432.988 ± 0.221
    Shuangyou0.233 ± 0.0620.313 ± 0.0172.882 ± 0.052
    V. amurensis × V. ViniferaBeibinghong0.336 ± 0.0761.486 ± 0.1771.665 ± 0.100
    V. viniferaRed Global0.252 ± 0.0510.458 ± 0.0571.050 ± 0.129
    Thompson seedless0.120 ± 0.0251.770 ± 0.0320.431 ± 0.006
    V. vinifera × V. labruscaJumeigui0.122 ± 0.0160.170 ± 0.0210.708 ± 0.135
    PulpV. davidiiTangwei0.062 ± 0.0060.088 ± 0.009nd
    V. amurensisTonghua-30.151 ± 0.0660.324 ±0.1040.032 ± 0.004
    Shuangyou0.053 ± 0.0080.126 ± 0.0440.041 ± 0.017
    V. amurensis × V. ViniferaBeibinghong0.057 ± 0.0140.495 ± 0.0680.087 ± 0.021
    V. viniferaRed Global0.059 ± 0.0180.159 ± 0.0130.027 ± 0.004
    Thompson seedless0.112 ± 0.0160.059 ± 0.020nd
    V. vinifera × V. labruscaJumeigui0.072 ± 0.0100.063 ± 0.0170.359 ± 0.023
    SeedV. davidiiTangwei0.096 ± 0.0140.169 ± 0.0280.049 ± 0.006
    V. amurensisTonghua-30.044 ± 0.0040.221 ± 0.0240.113 ± 0.027
    Shuangyound0.063 ± 0.0210.116 ± 0.017
    V. amurensis × V. ViniferaBeibinghongnd0.077 ± 0.0030.400 ± 0.098
    V. viniferaRed Global0.035 ± 0.0230.142 ± 0.0360.199 ± 0.009
    Thompson seedless
    V. vinifera × V. labruscaJumeigui0.077 ± 0.0250.017 ± 0.0040.284 ± 0.021
    'nd' indicates not detected in samples, and '−' shows no samples are collected due to abortion.
     | Show Table
    DownLoad: CSV
    To gain insight into gene expression patterns influencing resveratrol biosynthesis in 'Tangwei' and 'Tonghua-3', we profiled the transcriptomes of developing berries at G, V, and R stages, using sequencing libraries representing three biological replicates from each cultivar and stage. A total of 142.49 Gb clean data were obtained with an average of 7.92 Gb per replicate, with average base Q30 > 92.5%. Depending on the sample, between 80.47%−88.86% of reads aligned to the V. vinifera reference genome (Supplemental Table S1), and of these, 78.18%−86.66% mapped to unique positions. After transcript assembly, a total of 23,649 and 23,557 unigenes were identified as expressed in 'Tangwei' and 'Tonghua-3', respectively. Additionally, 1,751 novel transcripts were identified (Supplemental Table S2), and among these, 1,443 could be assigned a potential function by homology. Interestingly, the total number of expressed genes gradually decreased from the G to R stage in 'Tangwei', but increased in 'Tonghua-3'. About 80% of the annotated genes showed fragments per kilobase of transcript per million fragments mapped (FPKM) values > 0.5 in all samples, and of these genes, about 40% showed FPKM values between 10 and 100 (Fig. 1a). Correlation coefficients and principal component analysis of the samples based on FPKM indicated that the biological replicates for each cultivar and stage showed similar properties, indicating that the transcriptome data was reliable for further analyses (Fig. 1b & c).
    Figure 1.  Properties of transcriptome data of 'Tangwei' (TW) and 'Tonghua-3' (TH) berry at green hard (G), véraison (V), and ripe (R) stages. (a) Total numbers of expressed genes with fragments per kilobase of transcript per million fragments mapped (FPKM) values; (b) Heatmap of the sample correlation analysis; (c) Principal component analysis (PCA) showing clustering pattern among TW and TH at G, V and R samples based on global gene expression profiles.
    By comparing the transcriptomes of 'Tangwei' and 'Tonghua-3' at the G, V and R stages, we identified 6,770, 3,353 and 6,699 differentially expressed genes (DEGs), respectively (Fig. 2a). Of these genes, 1,134 were differentially expressed between the two cultivars at all three stages (Fig. 2b). We also compared transcriptional profiles between two adjacent developmental stages (G vs V; V vs R) for each cultivar. Between G and V, we identified 1,761 DEGs that were up-regulated and 2,691 DEGs that were down-regulated in 'Tangwei', and 1,836 and 1,154 DEGs that were up-regulated or down-regulated, respectively, in 'Tonghua-3'. Between V and R, a total of 1,761 DEGs were up-regulated and 1,122 DEGs were down-regulated in 'Tangwei', whereas 2,774 DEGs and 1,287 were up-regulated or down-regulated, respectively, in 'Tonghua-3' (Fig. 2c). Among the 16,822 DEGs between the two cultivars at G, V, and R (Fig. 2a), a total of 4,570, 2,284 and 4,597 had gene ontology (GO) annotations and could be further classified to over 60 functional subcategories. The most significantly represented GO terms between the two cultivars at all three stages were response to metabolic process, catalytic activity, binding, cellular process, single-organism process, cell, cell part and biological regulation (Fig. 2d).
    Figure 2.  Analysis of differentially expressed genes (DEGs) at the green hard (G), véraison (V), and ripe (R) stages in 'Tangwei' (TW) and 'Tonghua-3' (TH). (a) Number of DEGs and (b) numbers of overlapping DEGs between 'Tangwei' and 'Tonghua-3' at G, V and R; (c) Overlap among DEGs between G and V, and V and R, for 'Tangwei' and 'Tonghua-3'; (d) Gene ontology (GO) functional categorization of DEGs.
    We also identified 57 Kyoto Encyclopedia of Genes and Genomes (KEGG) pathways that were enriched, of which 32, 28, and 31 were enriched at the G, V, and R stages, respectively. Seven of the KEGG pathways were enriched at all three developmental stages: photosynthesis-antenna proteins (ko00196); glycine, serine and threonine metabolism (ko00260); glycolysis/gluconeogenesis (ko00010); carbon metabolism (ko01200); fatty acid degradation (ko00071); cysteine and methionine metabolism (ko00270); and valine, leucine and isoleucine degradation (ko00280) (Supplemental Tables S3S5). Furthermore, we found that the predominant KEGG pathways were distinct for each developmental stage. For example, phenylpropanoid biosynthesis (ko00940) was enriched only at the R stage. Overall, the GO and KEGG pathway enrichment analysis showed that the DEGs in 'Tangwei' and 'Tonghua-3' were enriched for multiple biological processes during the three stages of fruit development. We then analyzed the expression of genes with potential functions in resveratrol and flavonoid biosynthesis between the two cultivars and three developmental stages (Fig. 3 and Supplemental Table S6). We identified 30 STSs, 13 PALs, two C4Hs and nine 4CLs that were differentially expressed during at least one of the stages of fruit development between 'Tangwei' and 'Tonghua-3'. Interestingly, all of the STS genes showed increasing expression with development in both 'Tangwei' and 'Tonghua-3'. In addition, the expression levels of STS, C4H and 4CL genes at V and R were significantly higher in 'Tonghua-3' than in 'Tangwei'. Moreover, 25 RESVERATROL GLUCOSYLTRANSFERASE (RSGT), 27 LACCASE (LAC) and 21 O-METHYLTRANSFERASE (OMT) DEGs were identified, and most of these showed relatively high expression at the G and V stages in 'Tangwei' or R in 'Tonghua-3'. It is worth noting that the expression of the DEGs related to flavonoid biosynthesis, including CHS, FLAVONOL SYNTHASE (FLS), FLAVONOID 3′-HYDROXYLASE (F3'H), DIHYDROFLAVONOL 4-REDUCTASE (DFR), ANTHOCYANIDIN REDUCTASE (ANR) and LEUCOANTHOCYANIDIN REDUCTASE (LAR) were generally higher in 'Tangwei' than in 'Tonghua-3'at G stage.
    Figure 3.  Expression of differentially expressed genes (DEGs) associated with phenylalanine metabolism. TW, 'Tangwei'; TH, 'Tonghua-3'. PAL, PHENYLALANINE AMMONIA LYASE; C4H, CINNAMATE 4-HYDROXYLASE; 4CL, 4-COUMARATE-COA LIGASE; STS, STILBENE SYNTHASE; RSGT, RESVERATROL GLUCOSYLTRANSFERASE; OMT, O-METHYLTRANSFERASE; LAC, LACCASE; CHS, CHALCONE SYNTHASE; CHI, CHALCONE ISOMERASE; F3H, FLAVANONE 3-HYDROXYLASE; FLS, FLAVONOL SYNTHASE; F3'H, FLAVONOID 3′-HYDROXYLASE; DFR, DIHYDROFLAVONOL 4-REDUCTASE; LAR, LEUCOANTHOCYANIDIN REDUCTASE; ANR, ANTHOCYANIDIN REDUCTASE; LDOX, LEUCOANTHOCYANIDIN DIOXYGENASE; UFGT, UDP-GLUCOSE: FLAVONOID 3-O-GLUCOSYLTRANSFERASE.
    Among all DEGs identified in this study, 757 encoded potential TFs, and these represented 57 TF families. The most highly represented of these were the AP2/ERF, bHLH, NAC, WRKY, bZIP, HB-HD-ZIP and MYB families with a total of 76 DEGs (Fig. 4a). We found that the number of downregulated TF genes was greater than upregulated TF genes at G and V, and 48 were differentially expressed between the two cultivars at all three stages (Fig. 4b). Several members of the ERF, MYB, WRKY and bHLH families showed a strong increase in expression at the R stage (Fig. 4c). In addition, most of the TF genes showed > 2-fold higher expression in 'Tonghua-3' than in 'Tangwei' at the R stage. In particular, a few members, such as ERF11 (VIT_07s0141g00690), MYB105 (VIT_01s0026g02600), and WRKY70 (VIT_13s0067g03140), showed > 100-fold higher expression in 'Tonghua-3' (Fig. 4d).
    Figure 4.  Differentially expressed transcription factor (TF) genes. (a) The number of differentially expressed genes (DEGs) in different TF families; (b) Number of differentially expressed TF genes, numbers of overlapping differentially expressed TF genes, and (c) categorization of expression fold change (FC) for members of eight TF families between 'Tangwei' and 'Tonghua-3' at green hard (G), véraison (V), and ripe (R) stages; (d) Heatmap expression profiles of the three most strongly differentially expressed TF genes from each of eight TF families.
    We constructed a gene co-expression network using the weighted gene co-expression network analysis (WGCNA) package, which uses a systems biology approach focused on understanding networks rather than individual genes. In the network, 17 distinct modules (hereafter referred to by color as portrayed in Fig. 5a), with module sizes ranging from 91 (antiquewhite4) to 1,917 (magenta) were identified (Supplemental Table S7). Of these, three modules (ivory, orange and blue) were significantly correlated with resveratrol content, cultivar ('Tonghua-3'), and developmental stage (R). The blue module showed the strongest correlation with resveratrol content (cor = 0.6, p-value = 0.008) (Fig. 5b). KEGG enrichment analysis was carried out to further analyze the genes in these three modules. Genes in the ivory module were significantly enriched for phenylalanine metabolism (ko00360), stilbenoid, diarylheptanoid and gingerol biosynthesis (ko00945), and flavonoid biosynthesis (ko00941), whereas the most highly enriched terms of the blue and orange modules were plant-pathogen interaction (ko04626), plant hormone signal transduction (ko04075) and circadian rhythm-plant (ko04712) (Supplemental Fig. S1). Additionally, a total of 36 genes encoding TFs including in 15 ERFs, 10 WRKYs, six bHLHs, two MYBs, one MADs-box, one HSF and one TRY were identified as co-expressed with one or more STSs in these three modules (Fig. 5c and Supplemental Table S8), suggesting that these TFs may participate in the STS regulatory network.
    Figure 5.  Results of weighted gene co-expression network analysis (WGCNA). (a) Hierarchical clustering tree indicating co-expression modules; (b) Module-trait relationship. Each row represents a module eigengene, and each column represents a trait. The corresponding correlation and p-value are indicated within each module. Res, resveratrol; TW, 'Tangwei'; TH, 'Tonghua-3'; (c) Transcription factors and stilbene synthase gene co-expression networks in the orange, blue and ivory modules.
    To assess the reliability of the RNA-seq data, 12 genes determined to be differentially expressed by RNA-seq were randomly selected for analysis of expression via real-time quantitative PCR (RT-qPCR). This set comprised two PALs, two 4CLs, two STSs, two WRKYs, two LACs, one OMT, and MYB14. In general, these RT-qPCR results strongly confirmed the RNA-seq-derived expression patterns during fruit development in the two cultivars. The correlation coefficients between RT-qPCR and RNA-seq were > 0.6, except for LAC (VIT_02s0154g00080) (Fig. 6).
    Figure 6.  Comparison of the expression patterns of 12 randomly selected differentially expressed genes by RT-qPCR (real-time quantitative PCR) and RNA-seq. R-values are correlation coefficients between RT-qPCR and RNA-seq. FPKM, fragments per kilobase of transcript per million fragments mapped; TW, 'Tangwei'; TH, 'Tonghua-3'; G, green hard; V, véraison; R, ripe.
    Grapevines are among the most important horticultural crops worldwide[26], and recently have been the focus of studies on the biosynthesis of resveratrol. Resveratrol content has previously been found to vary depending on cultivar as well as environmental stresses[27]. In a study of 120 grape germplasm cultivars during two consecutive years, the extractable amounts of resveratrol in berry skin were significantly higher in seeded cultivars than in seedless ones, and were higher in both berry skin and seeds in wine grapes relative to table grapes[28]. Moreover, it was reported that total resveratrol content constantly increased from véraison to complete maturity, and ultraviolet-C (UV-C) irradiation significantly stimulated the accumulation of resveratrol of berry during six different development stages in 'Beihong' (V. vinifera × V. amurensis)[9]. Intriguingly, a recent study reported that bud sport could lead to earlier accumulation of trans-resveratrol in the grape berries of 'Summer Black' and its bud sport 'Nantaihutezao' from the véraison to ripe stages[29]. In the present study, resveratrol concentrations in seven accessions were determined by high performance liquid chromatography (HPLC) in the seed, pulp and skin at three developmental stages (G, V and R). Resveratrol content was higher in berry skins than in pulp or seeds, and were higher in the wild Chinese accessions compared with the domesticated cultivars. The highest resveratrol content (2.99 µg g−1 FW) was found in berry skins of 'Tonghua-3' at the R stage (Table 1). This is consistent with a recent study of 50 wild Chinese accessions and 45 cultivars, which reported that resveratrol was significantly higher in berry skins than in leaves[30]. However, we did not detect trans-resveratrol in the skins of 'Tangwei' during the G or V stages (Table 1). To explore the reason for the difference in resveratrol content between 'Tangwei' and 'Tonghua-3', as well as the regulation mechanism of resveratrol synthesis and accumulation during berry development, we used transcriptional profiling to compare gene expression between these two accessions at the G, V, and R stages. After sequence read alignment and transcript assembly, 23,649 and 23,557 unigenes were documented in 'Tangwei' and 'Tonghua-3', respectively. As anticipated, due to the small number of structures sampled, this was less than that (26,346) annotated in the V. vinifera reference genome[18]. Depending on the sample, 80.47%−88.86% of sequence reads aligned to a single genomic location (Supplemental Table S1); this is similar to the alignment rate of 85% observed in a previous study of berry development in Vitis vinifera[19]. Additionally, 1751 novel transcripts were excavated (Supplemental Table S2) after being compared with the V. vinifera reference genome annotation information[18, 31]. A similar result was also reported in a previous study when transcriptome analysis was performed to explore the underlying mechanism of cold stress between Chinese wild Vitis amurensis and Vitis vinifera[32]. We speculate that these novel transcripts are potentially attributable to unfinished V. vinifera reference genome sequence (For example: quality and depth of sequencing) or species-specific difference between Vitis vinifera and other Vitis. In our study, the distribution of genes based on expression level revealed an inverse trend from G, V to R between 'Tangwei' and 'Tonghua-3' (Fig. 1). Furthermore, analysis of DEGs suggested that various cellular processes including metabolic process and catalytic activity were altered between the two cultivars at all three stages (Fig. 2 and Supplemental Table S3S5). These results are consistent with a previous report that a large number of DEGs and 100 functional subcategories were identified in 'Tonghua-3' grape berries after exposure to UV-C radiation[8]. Resveratrol biosynthesis in grapevine is dependent on the function of STSs, which compete with the flavonoid branch in the phenylalanine metabolic pathway. Among the DEGs detected in this investigation, genes directly involved in the resveratrol synthesis pathway, STSs, C4Hs and 4CLs, were expressed to significantly higher levels in 'Tonghua-3' than in 'Tangwei' during V and R. On the other hand, DEGs representing the flavonoid biosynthesis pathway were upregulated in 'Tangwei', but downregulated in 'Tonghua-3' (Fig. 3 and Supplemental Table S6). These expression differences may contribute to the difference in resveratrol content between the two cultivars at these stages. We note that 'Tangwei' and 'Tonghua-3' are from two highly diverged species with different genetic backgrounds. There might be some unknown genetic differences between the two genomes, resulting in more than 60 functional subcategories being enriched (Fig. 2d) and the expression levels of genes with putative roles in resveratrol biosynthesis being significantly higher in 'Tonghua-3' than in 'Tangwei' during V and R (Fig. 3). A previous proteomic study also reported that the expression profiles of several enzymes in the phenylalanine metabolism pathway showed significant differences between V. quinquangularis accession 'Danfeng-2' and V. vinifera cv. 'Cabernet Sauvignon' at the véraison and ripening stages[33]. In addition, genes such as RSGT, OMT and LAC involved in the production of derivatized products of resveratrol were mostly present at the G and V stages of 'Tangwei', potentially resulting in limited resveratrol accumulation. However, we found that most of these also revealed relatively high expression at R in 'Tonghua-3' (Fig. 3). Despite this situation, which does not seem to be conducive for the accumulation of resveratrol, it still showed the highest content (Table 1). It has been reported that overexpression of two grapevine peroxidase VlPRX21 and VlPRX35 genes from Vitis labruscana in Arabidopsis may be involved in regulating stilbene synthesis[34], and a VqBGH40a belonging to β-glycoside hydrolase family 1 in Chinese wild Vitis quinquangularis can hydrolyze trans-piceid to enhance trans-resveratrol content[35]. However, most studies mainly focus on several TFs that participate in regulation of STS gene expression, including ERFs, MYBs and WRKYs[13, 15, 17]. For example, VvWRKY18 activated the transcription of VvSTS1 and VvSTS2 by directly binding the W-box elements within the specific promoters and resulting in the enhancement of stilbene phytoalexin biosynthesis[36]. VqWRKY53 promotes expression of VqSTS32 and VqSTS41 through participation in a transcriptional regulatory complex with the R2R3-MYB TFs VqMYB14 and VqMYB15[37]. VqMYB154 can activate VqSTS9/32/42 expression by directly binding to the L5-box and AC-box motifs in their promoters to improve the accumulation of stilbenes[38]. In this study, we found a total of 757 TF-encoding genes among the DEGs, including representatives of the MYB, AP2/ERF, bHLH, NAC, WRKY, bZIP and HB-HD-ZIP families. The most populous family was MYB, representing 76 DEGs at G, V and R between 'Tangwei' and 'Tonghua-3' (Fig. 4). A recent report indicated that MYB14, MYB15 and MYB13, a third uncharacterized member of Subgroup 2 (S2), could bind to 30 out of 47 STS family genes. Moreover, all three MYBs could also bind to several PAL, C4H and 4CL genes, in addition to shikimate pathway genes, the WRKY03 stilbenoid co-regulator and resveratrol-modifying gene[39]. VqbZIP1 from Vitis quinquangularis has been shown to promote the expression of VqSTS6, VqSTS16 and VqSTS20 by interacting with VqSnRK2.4 and VqSnRK2.6[40]. In the present study, we found that a gene encoding a bZIP-type TF (VIT_12s0034g00110) was down-regulated in 'Tangwei', but up-regulated in 'Tonghua-3', at G, V and R (Fig. 4). We also identified 36 TFs that were co-expressed with 17 STSs using WGCNA analysis, suggesting that these TFs may regulate STS gene expression (Fig. 5 and Supplemental Table S8). Among these, a STS (VIT_16s0100g00880) was together co-expressed with MYB14 (VIT_07s0005g03340) and WRKY24 (VIT_06s0004g07500) that had been identified as regulators of STS gene expression[13, 15]. A previous report also indicated that a bHLH TF (VIT_11s0016g02070) had a high level of co-expression with STSs and MYB14/15[15]. In the current study, six bHLH TFs were identified as being co-expressed with one or more STSs and MYB14 (Fig. 5 and Supplemental Table S8). However, further work needs to be done to determine the potential role of these TFs that could directly target STS genes or indirectly regulate stilbene biosynthesis by formation protein complexes with MYB or others. Taken together, these results identify a small group of TFs that may play important roles in resveratrol biosynthesis in grapevine. In summary, we documented the trans-resveratrol content of seven grapevine accessions by HPLC and performed transcriptional analysis of the grape berry in two accessions with distinct patterns of resveratrol accumulation during berry development. We found that the expression levels of genes with putative roles in resveratrol biosynthesis were significantly higher in 'Tonghua-3' than in 'Tangwei' during V and R, consistent with the difference in resveratrol accumulation between these accessions. Moreover, several genes encoding TFs including MYBs, WRKYs, ERFs, bHLHs and bZIPs were implicated as regulators of resveratrol biosynthesis. The results from this study provide insights into the mechanism of different resveratrol accumulation in various grapevine accessions. V. davidii 'Tangwei', V. amurensis × V. Vinifera 'Beibinghong'; V. amurensis 'Tonghua-3' and 'Shuangyou'; V. vinifera × V. labrusca 'Jumeigui'; V. vinifera 'Red Globe' and 'Thompson Seedless' were maintained in the grapevine germplasm resource at Northwest A&F University, Yangling, Shaanxi, China (34°20' N, 108°24' E). Fruit was collected at the G, V, and R stages, as judged by skin and seed color and soluble solid content. Each biological replicate comprised three fruit clusters randomly chosen from three plants at each stage. About 40−50 representative berries were separated into skin, pulp, and seed, and immediately frozen in liquid nitrogen and stored at −80 °C. Resveratrol extraction was carried out as previously reported[8]. Quantitative analysis of resveratrol content was done using a Waters 600E-2487 HPLC system (Waters Corporation, Milford, MA, USA) equipped with an Agilent ZORBAX SB-C18 column (5 µm, 4.6 × 250 mm). Resveratrol was identified by co-elution with a resveratrol standard, and quantified using a standard curve. Each sample was performed with three biological replicates. Three biological replicates of each stage (G, V and R) from whole berries of 'Tangwei' and 'Tonghua-3' were used for all RNA-Seq experiments. Total RNA was extracted from 18 samples using the E.Z.N.A. Plant RNA Kit (Omega Bio-tek, Norcross, GA, USA). For each sample, sequencing libraries were constructed from 1 μg RNA using the NEBNext UltraTM RNA Library Prep Kit for Illumina (New England Biolabs, Ipswich, MA, USA). The library preparations were sequenced on an Illumina HiSeq2500 platform (Illumina, San Diego, CA, USA) at Biomarker Technologies Co., Ltd. (Beijing, China). Raw sequence reads were filtered to remove low-quality reads, and then mapped to the V. vinifera 12X reference genome[18, 31] using TopHat v.2.1.0[41]. The mapped reads were assembled into transcript models using Stringtie v2.0.4[42]. Transcript abundance and gene expression levels were estimated as FPKM[43]. The formula is as follows:
    FPKM =cDNA FragmentsMapped Fragments(Millions)× Transcript Length (kb)
    Biological replicates were evaluated using Pearson's Correlation Coefficient[44] and principal component analysis. DEGs were identified using the DEGSeq R package v1.12.0[45]. A false discovery rate (FDR) threshold was used to adjust the raw P values for multiple testing[46]. Genes with a fold change of ≥ 2 and FDR < 0.05 were assigned as DEGs. GO and KEGG enrichment analyses of DEGs were performed using GOseq R packages v1.24.0[47] and KOBAS v2.0.12[48], respectively. Co-expression networks were constructed based on FPKM values ≥ 1 and coefficient of variation ≥ 0.5 using the WGCNA R package v1.47[49]. The adjacency matrix was generated with a soft thresholding power of 16. Then, a topological overlap matrix (TOM) was constructed using the adjacency matrix, and the dissimilarity TOM was used to construct the hierarchy dendrogram. Modules containing at least 30 genes were detected and merged using the Dynamic Tree Cut algorithm with a cutoff value of 0.25[50]. The co-expression networks were visualized using Cytoscape v3.7.2[51]. RT-qPCR was carried out using the SYBR Green Kit (Takara Biotechnology, Beijing, China) and the Step OnePlus Real-Time PCR System (Applied Biosystems, Foster, CA, USA). Gene-specific primers were designed using Primer Premier 5.0 software (PREMIER Biosoft International, Palo Alto, CA, USA). Cycling parameters were 95 °C for 30 s, 42 cycles of 95 °C for 5 s, and 60 °C for 30 s. The grapevine ACTIN1 (GenBank Accession no. AY680701) gene was used as an internal control. Each reaction was performed in triplicate for each of the three biological replicates. Relative expression levels of the selected genes were calculated using the 2−ΔΔCᴛ method[52]. Primer sequences are listed in Supplemental Table S9. This research was supported by the National Key Research and Development Program of China (2019YFD1001401) and the National Natural Science Foundation of China (31872071 and U1903107).
  • The authors declare that they have no conflict of interest.
  • Supplemental Fig. S1 The enrichment analysis of the target genes A: The GO enrichment analysis of the target genes. B: KEGG Pathway Enrichment of the target genes.
    Supplemental Table S1 The primers information of miRNAs in this study.
    Supplemental Table S2 The primers information of target genes in this study.
  • [1]

    Liu X, Gu J, Wang J, Lu Y. 2014. Lily breeding by using molecular tools and transformation systems. Molecular Biology Reports 41:6899−908

    doi: 10.1007/s11033-014-3576-9

    CrossRef   Google Scholar

    [2]

    Jaakola L. 2013. New insights into the regulation of anthocyanin biosynthesis in fruits. Trends in Plant Science 18:477−83

    doi: 10.1016/j.tplants.2013.06.003

    CrossRef   Google Scholar

    [3]

    Lotkowska ME, Tohge T, Fernie AR, Xue GP, Balazadeh S, et al. 2015. The Arabidopsis transcription factor MYB112 promotes anthocyanin formation during salinity and under high light stress. Plant Physiology 169:1862−80

    doi: 10.1104/pp.15.00605

    CrossRef   Google Scholar

    [4]

    Liu Y, Tikunov Y, Schouten RE, Marcelis LFM, Visser RGF, et al. 2018. Anthocyanin biosynthesis and degradation mechanisms in solanaceous vegetables: a review. Frontiers in Chemistry 6:52

    doi: 10.3389/fchem.2018.00052

    CrossRef   Google Scholar

    [5]

    Nishihara M, Nakatsuka T. 2011. Genetic engineering of flavonoid pigments to modify flower color in floricultural plants. Biotechnology Letters 33:433−41

    doi: 10.1007/s10529-010-0461-z

    CrossRef   Google Scholar

    [6]

    Gonzalez A, Zhao M, Leavitt JM, Lloyd AM. 2008. Regulation of the anthocyanin biosynthetic pathway by the TTG1/bHLH/Myb transcriptional complex in Arabidopsis seedlings. The Plant Journal 53:814−27

    doi: 10.1111/j.1365-313X.2007.03373.x

    CrossRef   Google Scholar

    [7]

    Quattrocchio F, Wing JF, Leppen HTC, Mol JNM, Koes RE. 1993. Regulatory genes controlling anthocyanin pigmentation are functionally conserved among plant species and have distinct sets of target genes. The Plant Cell 5:1497−512

    doi: 10.2307/3869734

    CrossRef   Google Scholar

    [8]

    Xu W, Dubos C, Lepiniec L. 2015. Transcriptional control of flavonoid biosynthesis by MYB-bHLH-WDR complexes. Trends in Plant Science 20:176−85

    doi: 10.1016/j.tplants.2014.12.001

    CrossRef   Google Scholar

    [9]

    El-Sharkawy I, Liang D, Xu K. 2015. Transcriptome analysis of an apple (Malus × domestica) yellow fruit somatic mutation identifies a gene network module highly associated with anthocyanin and epigenetic regulation. Journal of Experimental Botany 66:7359−76

    doi: 10.1093/jxb/erv433

    CrossRef   Google Scholar

    [10]

    Cho K, Cho KS, Sohn HB, Ha IJ, Hong SY, et al. 2016. Network analysis of the metabolome and transcriptome reveals novel regulation of potato pigmentation. Journal of Experimental Botany 67:1519−33

    doi: 10.1093/jxb/erv549

    CrossRef   Google Scholar

    [11]

    Xu L, Yang P, Yuan S, Feng Y, Xu H, et al. 2016. Transcriptome analysis identifies key candidate genes mediating purple ovary coloration in Asiatic hybrid lilies. International Journal of Molecular Sciences 17:1881

    doi: 10.3390/ijms17111881

    CrossRef   Google Scholar

    [12]

    Yamagishi M. 2016. A novel R2R3-MYB transcription factor regulates light-mediated floral and vegetative anthocyanin pigmentation patterns in Lilium regale. Molecular Breeding 36:3

    doi: 10.1007/s11032-015-0426-y

    CrossRef   Google Scholar

    [13]

    Yamagishi M. 2018. Involvement of a LhMYB18 transcription factor in large anthocyanin spot formation on the flower tepals of the Asiatic hybrid lily (Lilium spp. ) cultivar "Grand Cru". Molecular Breeding 38:60

    doi: 10.1007/s11032-018-0806-1

    CrossRef   Google Scholar

    [14]

    Li X, Hou Y, Xie X, Li H, Li X, et al. 2020. A blueberry MIR156a-SPL12 module coordinates the accumulation of chlorophylls and anthocyanins during fruit ripening. Journal of Experimental Botany 71:5976−89

    doi: 10.1093/jxb/eraa327

    CrossRef   Google Scholar

    [15]

    Liu R, Lai B, Hu B, Qin Y, Hu G, et al. 2016. Identification of microRNAs and their target genes related to the accumulation of anthocyanins in Litchi chinensis by high-throughput sequencing and degradome analysis. Frontiers in Plant Science 7:2059

    Google Scholar

    [16]

    Jaakola L, Poole M, Jones MO, Kämäräinen-Karppinen T, Koskimäki JJ, et al. 2010. A SQUAMOSA MADS box gene involved in the regulation of anthocyanin accumulation in bilberry fruits. Plant Physiology 153:1619−29

    doi: 10.1104/pp.110.158279

    CrossRef   Google Scholar

    [17]

    Lalusin AG, Nishita K, Kim SH, Ohta M, Fujimura T. 2006. A new MADS-box gene (IbMADS10) from sweet potato (Ipomoea batatas (L.) Lam) is involved in the accumulation of anthocyanin. Molecular Genetics and Genomics 275:44−54

    doi: 10.1007/s00438-005-0080-x

    CrossRef   Google Scholar

    [18]

    Zhang S, Chen Y, Zhao L, Li C, Yu J, et al. 2020. A novel NAC transcription factor, MdNAC42, regulates anthocyanin accumulation in red-fleshed apple by interacting with MdMYB10. Tree Physiology 40:413−23

    doi: 10.1093/treephys/tpaa004

    CrossRef   Google Scholar

    [19]

    Sun Q, Jiang S, Zhang T, Xu H, Fang H, et al. 2019. Apple NAC transcription factor MdNAC52 regulates biosynthesis of anthocyanin and proanthocyanidin through MdMYB9 and MdMYB11. Plant Science 289:110286

    doi: 10.1016/j.plantsci.2019.110286

    CrossRef   Google Scholar

    [20]

    Mahmood K, Xu Z, El-Kereamy A, Casaretto JA, Rothstein SJ. 2016. The Arabidopsis transcription factor ANAC032 represses anthocyanin biosynthesis in response to high sucrose and oxidative and abiotic stresses. Frontiers in Plant Science 7:1548

    doi: 10.3389/fpls.2016.01548

    CrossRef   Google Scholar

    [21]

    Wang Y, Wang N, Xu H, Jiang S, Fang H, et al. 2018. Auxin regulates anthocyanin biosynthesis through the Aux/IAA-ARF signaling pathway in apple. Horticulture Research 5:59

    doi: 10.1038/s41438-018-0068-4

    CrossRef   Google Scholar

    [22]

    Rogers K, Chen X. 2013. Biogenesis, turnover, and mode of action of plant microRNAs. The Plant Cell 25:2383−99

    doi: 10.1105/tpc.113.113159

    CrossRef   Google Scholar

    [23]

    Xia R, Zhu H, An YQ, Beers EP, Liu Z. 2012. Apple miRNAs and tasiRNAs with novel regulatory networks. Genome Biology 13:R47

    doi: 10.1186/gb-2012-13-6-r47

    CrossRef   Google Scholar

    [24]

    Gou JY, Felippes FF, Liu CJ, Weigel D, Wang JW. 2011. Negative regulation of anthocyanin biosynthesis in Arabidopsis by a miR156-targeted SPL transcription factor. The Plant Cell 23:1512−22

    doi: 10.1105/tpc.111.084525

    CrossRef   Google Scholar

    [25]

    Bulgakov VP, Avramenko TV. 2015. New opportunities for the regulation of secondary metabolism in plants: focus on microRNAs. Biotechnology Letters 37:1719−27

    doi: 10.1007/s10529-015-1863-8

    CrossRef   Google Scholar

    [26]

    Gupta OP, Karkute SG, Banerjee S, Meena NL, Dahuja A. 2017. Contemporary understanding of miRNA-based regulation of secondary metabolites biosynthesis in plants. Frontiers in Plant Science 8:374

    doi: 10.3389/fpls.2017.00374

    CrossRef   Google Scholar

    [27]

    Feyissa BA, Arshad M, Gruber MY, Kohalmi SE, Hannoufa A. 2019. The interplay between miR156/SPL13 and DFR/WD40-1 regulate drought tolerance in alfalfa. BMC Plant Biology 19:434

    doi: 10.1186/s12870-019-2059-5

    CrossRef   Google Scholar

    [28]

    Gupta OP, Dahuja A, Sachdev A, Kumari S, Jain PK, et al. 2019. Conserved miRNAs modulate the expression of potential transcription factors of isoflavonoid biosynthetic pathway in soybean seeds. Molecular Biology Reports 46:3713−30

    doi: 10.1007/s11033-019-04814-7

    CrossRef   Google Scholar

    [29]

    Bonar N, Liney M, Zhang R, Austin C, Dessoly J, et al. 2018. Potato miR828 is associated with purple tuber skin and flesh color. Frontiers in Plant Science 9:1742

    doi: 10.3389/fpls.2018.01742

    CrossRef   Google Scholar

    [30]

    Hsieh LC, Lin SI, Shih ACC, Chen JW, Lin WY, et al. 2009. Uncovering small RNA-mediated responses to phosphate deficiency in Arabidopsis by deep sequencing. Plant Physiology 151:2120−32

    doi: 10.1104/pp.109.147280

    CrossRef   Google Scholar

    [31]

    Luo QJ, Mittal A, Jia F, Rock CD. 2012. An autoregulatory feedback loop involving PAP1 and TAS4 in response to sugars in Arabidopsis. Plant Molecular Biology 80:117−29

    doi: 10.1007/s11103-011-9778-9

    CrossRef   Google Scholar

    [32]

    Jia X, Shen J, Liu H, Li F, Ding N, et al. 2015. Small tandem target mimic-mediated blockage of microRNA858 induces anthocyanin accumulation in tomato. Planta 242:283−93

    doi: 10.1007/s00425-015-2305-5

    CrossRef   Google Scholar

    [33]

    Rock CD. 2013. Trans-acting small interfering RNA4: key to nutraceutical synthesis in grape development? Trends in Plant Science 18:601−10

    doi: 10.1016/j.tplants.2013.07.006

    CrossRef   Google Scholar

    [34]

    Wang Y, Wang Y, Song Z, Zhang H. 2016. Repression of MYBL2 by both microRNA858a and HY5 leads to the activation of anthocyanin biosynthetic pathway in Arabidopsis. Molecular Plant 9:1395−405

    doi: 10.1016/j.molp.2016.07.003

    CrossRef   Google Scholar

    [35]

    Zhang H, Zhao X, Li J, Cai H, Deng XW, Li L. 2014. MicroRNA408 is critical for the HY5-SPL7 gene network that mediates the coordinated response to light and copper. The Plant Cell 26:4933−53

    doi: 10.1105/tpc.114.127340

    CrossRef   Google Scholar

    [36]

    Yang F, Cai J, Yang Y, Liu Z. 2013. Overexpression of microRNA828 reduces anthocyanin accumulation in Arabidopsis. Plant Cell, Tissue and Organ Culture (PCTOC) 115:159−67

    doi: 10.1007/s11240-013-0349-4

    CrossRef   Google Scholar

    [37]

    Yin X, Lin X, Liu Y, Irfan M, Chen L, et al. 2020. Integrated metabolic profiling and transcriptome analysis of pigment accumulation in diverse petal tissues in the lily cultivar 'Vivian'. BMC Plant Biology 20:446

    doi: 10.1186/s12870-020-02658-z

    CrossRef   Google Scholar

    [38]

    Shin J, Park E, Choi G. 2007. PIF3 regulates anthocyanin biosynthesis in an HY5-dependent manner with both factors directly binding anthocyanin biosynthetic gene promoters in Arabidopsis. The Plant Journal 49:981−94

    doi: 10.1111/j.1365-313X.2006.03021.x

    CrossRef   Google Scholar

    [39]

    Chen C, Chen H, Zhang Y, Thomas HR, Frank MH, et al. 2020. TBtools: an integrative toolkit developed for interactive analyses of big biological data. Molecular Plant 13:1194−202

    doi: 10.1016/j.molp.2020.06.009

    CrossRef   Google Scholar

    [40]

    Pfaffl MW. 2001. A new mathematical model for relative quantification in real-time RT-PCR. Nucleic Acids Research 29:e45

    doi: 10.1093/nar/29.9.e45

    CrossRef   Google Scholar

    [41]

    Kumar S, Stecher G, Tamura K. 2016. MEGA7:molecular evolutionary genetics analysis version 7.0 for bigger datasets. Molecular Biology and Evolution 33:1870−74

    doi: 10.1093/molbev/msw054

    CrossRef   Google Scholar

    [42]

    Shannon P, Markiel A, Ozier O, Baliga NS, Wang JT, et al. 2003. Cytoscape: a software environment for integrated models of biomolecular interaction networks. Genome Research 13:2498−504

    doi: 10.1101/gr.1239303

    CrossRef   Google Scholar

    [43]

    Yin X, Zhang Y, Zhang L, Wang B, Zhao Y, et al. 2021. Regulation of MYB transcription factors of anthocyanin synthesis in lily flowers. Frontiers in Plant Science 12:761668

    doi: 10.3389/fpls.2021.761668

    CrossRef   Google Scholar

    [44]

    Tirumalai V, Swetha C, Nair A, Pandit A, Shivaprasad PV. 2019. miR828 and miR858 regulate VvMYB114 to promote anthocyanin and flavonol accumulation in grapes. Journal of Experimental Botany 70:4775−92

    doi: 10.1093/jxb/erz264

    CrossRef   Google Scholar

    [45]

    Voinnet O. 2009. Origin, biogenesis, and activity of plant microRNAs. Cell 136:669−87

    doi: 10.1016/j.cell.2009.01.046

    CrossRef   Google Scholar

    [46]

    Zhao X, Zhang H, Li L. 2013. Identification and analysis of the proximal promoters of microRNA genes in Arabidopsis. Genomics 101:187−94

    doi: 10.1016/j.ygeno.2012.12.004

    CrossRef   Google Scholar

    [47]

    Meng X, Li Y, Zhou T, Sun W, Shan X, et al. 2019. Functional differentiation of duplicated flavonoid 3-O-glycosyltransferases in the flavonol and anthocyanin biosynthesis of Freesia hybrida. Frontiers in Plant Science 10:1330

    doi: 10.3389/fpls.2019.01330

    CrossRef   Google Scholar

    [48]

    Bäurle I, Dean C. 2006. The timing of developmental transitions in plants. Cell 125:655−64

    doi: 10.1016/j.cell.2006.05.005

    CrossRef   Google Scholar

    [49]

    Fornara F, de Montaigu A, Coupland G. 2010. SnapShot: control of flowering in Arabidopsis. Cell 141:550.e1−550.e2

    doi: 10.1016/j.cell.2010.04.024

    CrossRef   Google Scholar

    [50]

    Yan Y, Shen L, Chen Y, Bao S, Thong Z, et al. 2014. A MYB-domain protein EFM mediates flowering responses to environmental cues in Arabidopsis. Developmental Cell 30:437−48

    doi: 10.1016/j.devcel.2014.07.004

    CrossRef   Google Scholar

    [51]

    Lepiniec L, Debeaujon I, Routaboul JM, Baudry A, Pourcel L, et al. 2006. Genetics and biochemistry of seed flavonoids. Annual Review of Plant Biology 57:405−30

    doi: 10.1146/annurev.arplant.57.032905.105252

    CrossRef   Google Scholar

    [52]

    Zhao D, Wei M, Shi M, Hao Z, Tao J. 2017. Identification and comparative profiling of miRNAs in herbaceous peony (Paeonia lactiflora Pall.) with red/yellow bicoloured flowers. Scientific Reports 7:44926

    doi: 10.1038/srep44926

    CrossRef   Google Scholar

    [53]

    Honma T, Goto K. 2001. Complexes of MADS-box proteins are sufficient to convert leaves into floral organs. Nature 409:525−29

    doi: 10.1038/35054083

    CrossRef   Google Scholar

    [54]

    Searle I, He Y, Turck F, Vincent C, Fornara F, et al. 2006. The transcription factor FLC confers a flowering response to vernalization by repressing meristem competence and systemic signaling in Arabidopsis. Genes & Development 20:898−912

    doi: 10.1101/gad.373506

    CrossRef   Google Scholar

    [55]

    Lalusin AG, Ocampo E, Fujimura T. 2011. Arabidopsis thaliana plants over-expressing the IbMADS10 gene from sweetpotato accumulates high level of anthocyanin. Philippine Journal of Crop Science 36:30−36

    Google Scholar

    [56]

    Aceto S, Sica M, De Paolo S, D'Argenio V, Cantiello P, et al. 2014. The analysis of the inflorescence miRNome of the orchid Orchis italica reveals a DEF-like MADS-box gene as a new miRNA target. PLoS One 9:e97839

    doi: 10.1371/journal.pone.0097839

    CrossRef   Google Scholar

    [57]

    Yue P, Lu Q, Liu Z, Lv T, Li X, et al. 2020. Auxin-activated MdARF5 induces the expression of ethylene biosynthetic genes to initiate apple fruit ripening. New phytologist 226:1781−95

    doi: 10.1111/nph.16500

    CrossRef   Google Scholar

    [58]

    Liu Z, Shi MZ, Xie DY. 2014. Regulation of anthocyanin biosynthesis in Arabidopsis thaliana red pap1-D cells metabolically programmed by auxins. Planta 239:765−81

    doi: 10.1007/s00425-013-2011-0

    CrossRef   Google Scholar

    [59]

    Lee S, Seo PJ, Lee HJ, Park CM. 2012. A NAC transcription factor NTL4 promotes reactive oxygen species production during drought-induced leaf senescence in Arabidopsis. The Plant Journal 70:831−44

    doi: 10.1111/j.1365-313X.2012.04932.x

    CrossRef   Google Scholar

    [60]

    Ohashi-Ito K, Oda Y, Fukuda H. 2010. Arabidopsis VASCULAR-RELATED NAC-DOMAIN6 directly regulates the genes that govern programmed cell death and secondary wall formation during xylem differentiation. The Plant Cell 22:3461−73

    doi: 10.1105/tpc.110.075036

    CrossRef   Google Scholar

    [61]

    Zhong R, Lee C, Zhou J, McCarthy RL, Ye ZH. 2008. A battery of transcription factors involved in the regulation of secondary cell wall biosynthesis in Arabidopsis. The Plant Cell 20:2763−82

    doi: 10.1105/tpc.108.061325

    CrossRef   Google Scholar

    [62]

    Morishita T, Kojima Y, Maruta T, Nishizawa-Yokoi A, Yabuta Y, et al. 2009. Arabidopsis NAC transcription factor, ANAC078, regulates flavonoid biosynthesis under high-light. Plant and Cell Physiology 50:2210−22

    doi: 10.1093/pcp/pcp159

    CrossRef   Google Scholar

    [63]

    Zhou H, Wang KL, Wang H, Gu C, Dare AP, et al. 2015. Molecular genetics of blood-fleshed peach reveals activation of anthocyanin biosynthesis by NAC transcription factors. The Plant Journal 82:105−21

    doi: 10.1111/tpj.12792

    CrossRef   Google Scholar

    [64]

    Wei Z, Hu K, Zhao D, Tang J, Huang Z, et al. 2020. MYB44 competitively inhibits the formation of the MYB340-bHLH2-NAC56 complex to regulate anthocyanin biosynthesis in purple-fleshed sweet potato. BMC Plant Biology 20:258

    doi: 10.1186/s12870-020-02451-y

    CrossRef   Google Scholar

    [65]

    Wang W, Wang J, Wu Y, Li D, Allan A, et al. 2020. Genome-wide analysis of coding and non-coding RNA reveals a conserved miR164-NAC regulatory pathway for fruit ripening. New Phytologist 225:1618−34

    doi: 10.1111/nph.16233

    CrossRef   Google Scholar

    [66]

    Vale M, Rodrigues J, Badim H, Geros H, Conde A. 2021. Exogenous application of non-mature miRNA-encoded miPEP164c inhibits proanthocyanidin synthesis and stimulates anthocyanin accumulation in grape berry cells. Frontiers in Plant Science 12:706679

    doi: 10.3389/fpls.2021.706679

    CrossRef   Google Scholar

    [67]

    Li Y, Cui W, Qi X, Lin M, Qiao C, et al. 2020. MicroRNA858 negatively regulates anthocyanin biosynthesis by repressing AaMYBC1 expression in kiwifruit (Actinidia arguta). Plant Science 296:110476

    doi: 10.1016/j.plantsci.2020.110476

    CrossRef   Google Scholar

    [68]

    Wu Y, Huang X, Zhang S, Zhang C, Yang H, et al. 2022. Small RNA and degradome sequencing reveal the role of blackberry miRNAs in flavonoid and anthocyanin synthesis during fruit ripening. International Journal of Biological Macromolecules 213:892−901

    doi: 10.1016/j.ijbiomac.2022.06.035

    CrossRef   Google Scholar

  • Cite this article

    Yin X, Gao Z, Sun S, Zhang L, Irfan M, et al. 2023. Insights into microRNA regulation of flower coloration in a lily cultivar Vivian petal. Ornamental Plant Research 3:9 doi: 10.48130/OPR-2023-0009
    Yin X, Gao Z, Sun S, Zhang L, Irfan M, et al. 2023. Insights into microRNA regulation of flower coloration in a lily cultivar Vivian petal. Ornamental Plant Research 3:9 doi: 10.48130/OPR-2023-0009

Figures(6)  /  Tables(1)

Article Metrics

Article views(5269) PDF downloads(683)

ARTICLE   Open Access    

Insights into microRNA regulation of flower coloration in a lily cultivar Vivian petal

Ornamental Plant Research  3 Article number: 9  (2023)  |  Cite this article

Abstract: MicroRNAs (miRNAs) are a class of non-coding small RNAs involved in the negative regulation of gene expression, which plays critical roles in developmental and metabolic pathways. However, it is not well understood how miRNA regulate the anthocyanin biosynthesis pathway in lily flowers. Using miRNA sequencing and target gene expression analysis, we explored the regulatory networks of miRNAs and their target-related flower coloration in lily petals. A total of 326 miRNAs were obtained by miRNA sequencing, including 285 known miRNAs and 41 new miRNAs. According to the psRNATarget prediction, there were a total of 75 differentially expressed miRNAs (DEMs) that target 898 potential genes. We also screened the target genes including LvSPL, LvMYB5, LvWD, Lv3GT, LvGRF, LvARF, LvNAC, and LvMADS, which were targeted by LvmiR156, LvmiR828, LvmiR166, LvmiR396, LvmiR160, LvmiR167, LvmiR164, and LvmiR5179. These genes may be involved in regulating other secondary metabolic pathways, and forming a complex regulatory network of anthocyanin biosynthesis. We therefore proposed a putative miRNA-target module associated with anthocyanin biosynthesis. In addition, we predicted the binding site of LvMYB5, the target gene of miR828, and speculated that miR828 targets regulate LvMYB5 transcriptional translation through a cleavage site, which then inhibits anthocyanin synthesis. Our findings contribute to an understanding of the functional characterization of miRNAs and their targets in controlling anthocyanin production in plants and may lead to future identification and characterization of miRNAs in lilies.

    • Lilies are perennial bulbous flowering plants in the Liliaceae family with fragrant and brightly colored blossoms highly desired by consumers. Lilies are widely used as cut flowers, and are planted in parks and courtyards. There are many varieties of lily each with unique characteristics. Asian hybrid lilies are rich in color but lacking fragrance. The flower of the Oriental hybrid lily is large and beautiful with an intense aroma, but the color of the flower is relatively simple. The main goal of lily breeding is to cultivate richly colored and fragrant lilies[1].

      Brightly-colored plants tend to attract pollinators and resist abiotic and biological stresses[24]. Some cultivar lily petals are rich in anthocyanins, which are secondary metabolites in the biosynthesis pathway of flavonoids. Anthocyanins directly influence the color of flowers as a result of the coordinated expression of structural genes, such as CHS, CHI, F3H, F3 'H, DFR, ANS, 3GT, etc., which encode enzymes in the flavonoid biosynthesis pathway[5]. These structural genes (TFs) can be regulated by the MBW complex, which is composed of the transcription factors MYB, bHLH, and WD[6]. The flavonoid biosynthesis pathway related to anthocyanin synthesis has been extensively studied. Numerous structural and regulatory genes involved in the accumulation of anthocyanins have been found and isolated in model plants[7,8] and fruit cultivars[9,10], and the specific process of the anthocyanin biosynthesis pathway has been defined. The genes that influence lily flower color are currently being explored. The MBW complex can regulate the coloration in lily petals as LhMYB12, LhMYB12-lat, LrMYB15, and LhMYB18 affect anthocyanin pigmentation in the petals, ovary, bud, and spots, respectively[1113]. However, SPL[14,15], MADS-box[16,17], NAC[1820], and ARF[21] can also affect anthocyanins synthesis in many plants by regulating the expression of the MBW complex. For example, in blueberry and Litchi chinensis, the miR156-SPL module coordinates the accumulation of anthocyanins during fruit ripening[14, 15], and a MADS-box gene is involved in the regulation of anthocyanin accumulation in bilberry fruits and sweet potatoes[16, 17], a novel NAC transcription factor regulates anthocyanin accumulation in red-fleshed apples by interacting with MYB[18, 19], NAC can regulate anthocyanin accumulation in Arabidopsis[20], and ARF regulates anthocyanin biosynthesis in apples[21]. Therefore, the regulatory network of anthocyanins in lilies remains to be fully elucidated.

      miRNA, which is common in eukaryotes, is a type of endogenous non-coding small RNA with a length of 18−24 nt. miRNAs cleave target mRNAs or prevent gene translation at the post-transcriptional level to influence gene expression[7,22]. miRNAs play a role in a variety of biological processes, including growth and development, stress responses, auxin signaling, and secondary metabolism[23,24], in which it regulates the synthesis and accumulation of secondary metabolites in plants, such as the metabolism of anthocyanin[23,25,26]. For example, miR156[15,24,27], miR396[28], miR828[2931], and miR858[32] are involved in the biosynthesis of anthocyanins in plants[33].

      The miRNA-regulated anthocyanin synthesis pathway has been thoroughly studied in model plants. As positive regulatory factors, miRNA can promote anthocyanin accumulation by inhibiting the expression of negative regulatory factors. MIR858a in Arabidopsis thaliana positively regulates anthocyanin synthesis by inhibiting MyBL2 in seedlings[34]. Overexpression of miR408, a positive regulatory factor, can increase anthocyanin accumulation in Arabidopsis seedlings[35]. Conversely, miRNA can act as a negative regulator to inhibit the accumulation of anthocyanins by inhibiting the expression of positive regulators. Overexpression of miR828 inhibits MYB expression in Arabidopsis thaliana, reducing anthocyanin accumulation[36]. In summary, miRNAs in plants indirectly affect anthocyanin accumulation by targeting and regulating genes in different ways.

      Research on microRNAs therefore focuses on model plants and is rarely seen in flowering plants. The identification of the regulatory network of miRNA in lilies is currently incomplete. In the current study, we examined the regulation mechanism of miRNAs on lily coloration using lily petals in different stages as experimental material to perform miRNA sequencing. We then analyzed the expression of miRNA and its target genes in the development process of the lily flower based on existing transcriptome data[37]. We discovered a variety of miRNAs related to anthocyanin biosynthesis in lily petals, providing a foundation for future research.

    • Plants of the lily cultivar Vivian were cultivated in the Shenyang Agricultural University (Shenyang, China) greenhouse. Plant materials included bud stage petals (S1), coloring bud petals (S2) and blooming stage petals (S3) with three biological replicates, and were stored at −80 °C for further study.

    • Total anthocyanin content were measured using the method provided by Shin et al.[38]. In brief, the sample powder was first incubated in an acidic methanol solution overnight, then chloroform was added to remove the chlorophyll. The extract's absorbance (530 and 657 nm) was measured, and the formula A530 − 0.33 × A657 was used to analyze the total anthocyanin content.

    • All samples were measured in a random order using the UPLC-MS/MS system. Metabolites were identified and quantified as described by Yin et al.[37].

    • The same lily petal samples were used for miRAN-seq and mRNA-seq, including S1, S2, and S3 with three biological replicates. The Illumina Hiseq2000/2500 system was used to perform the miRNA sequencing. To identify known and novel miRNAs, the miRBase 22.0 and RNAfold software were used to analyze unique sequences. The DEMs were screened according to the difference in expression |fold change| > 2). We also analyzed the miRNA target gene in the RNA-seq data using psRNATarget. We used BLASTN to predict target genes. We then analyzed the data using the Gene Ontology (GO) database and KEGG.

      The FPKM values of the genes were used for analysis. A heatmap was created after performing a row standardization. The heatmap and Sankey plot of the miRNA and the target genes were generated using the TBtools software[39]. The NCBI project PRJNA649743 hosts the transcriptome datasets created and examined for this investigation.

    • A qRT-PCR and statistical analysis were conducted following Yin et al.[37]. The supplemental table includes a list of the primers used in the study (Supplemental Table S1 & S2). SYBR Green Master Mix was used for qRT-PCR. The reference genes were GAPDH and Actin. The 2−ΔΔCᴛ method was used to calculate gene relative expression[40]. The SPSS 16.0 software package was used to perform statistical analysis. A phylogenetic analysis was conducted using MEGA 5.0 (ML method with 1,000 bootstrap replicates)[41].

    • Correlation analyses were performed to obtain the correlation between miRNA and the target genes. Using the 'correlate' function in SPSS, a Pearson correlation analysis was performed between miRNA and the target genes. Then, for visualization, we built a network in Cytoscape[42].

    • A determination of anthocyanin content was performed using three-period petals in S1 (bud stage), S2 (coloring stage), and S3 (blooming stage) to measure the pigmentation in lily petals during development. Each sample contained three replicates of different triennial plants. The color of the S1 petal samples was relatively light compared to the other two samples (Fig. 1a). This parallels the total anthocyanin content measured by anthocyanin content extracted, which was lower in the S1 sample compared to S3 (Fig. 1b). The anthocyanins content in the petals were lower in S1 and higher in S3. The content trend of each cyanidin derivative, including cyanidin, cyanidin 3-O-glucoside, and cyanidin 3-O-rutinoside, was the same as that of the total anthocyanins (Fig. 1c). Overall, the content of total anthocyanins and their components in lily petals gradually accumulated with the development of the petals.

      Figure 1. 

      Determination of anthocyanin content in lily petals. (a) Lily petals in different periods. (b) Anthocyanin content in lily petals at different periods of lily development. (c) The relative content of cyanidin and its compounds in petals determined in metabolomics analysis. * Denotes statistically significant differences between samples. * p-value ≤ 0.1; ** p-value ≤ 0.05; *** p-value ≤ 0.01.

    • miRNA sequencing was carried out on lily flower petals to investigate the genes involved in color creation. We constructed a miRNA library and 10 M clean data generated from sequencing. The Rfam database was selected to annotate and sequence small RNA sequences. Subsequently, unique sequences were analyzed by miRBase 22.0 and RNAfold software to identify the known and novel miRNAs. Finally, it was mapped to the corresponding lily transcriptome using UniGene. A total of 326 miRNAs were obtained through miRNA sequencing from nine libraries, including 285 known miRNAs and 41 new miRNAs. The 285 known miRNAs belonged to 41 families (Fig. 2a). The miR396, miR166, miR156, etc. gene families had the most members.
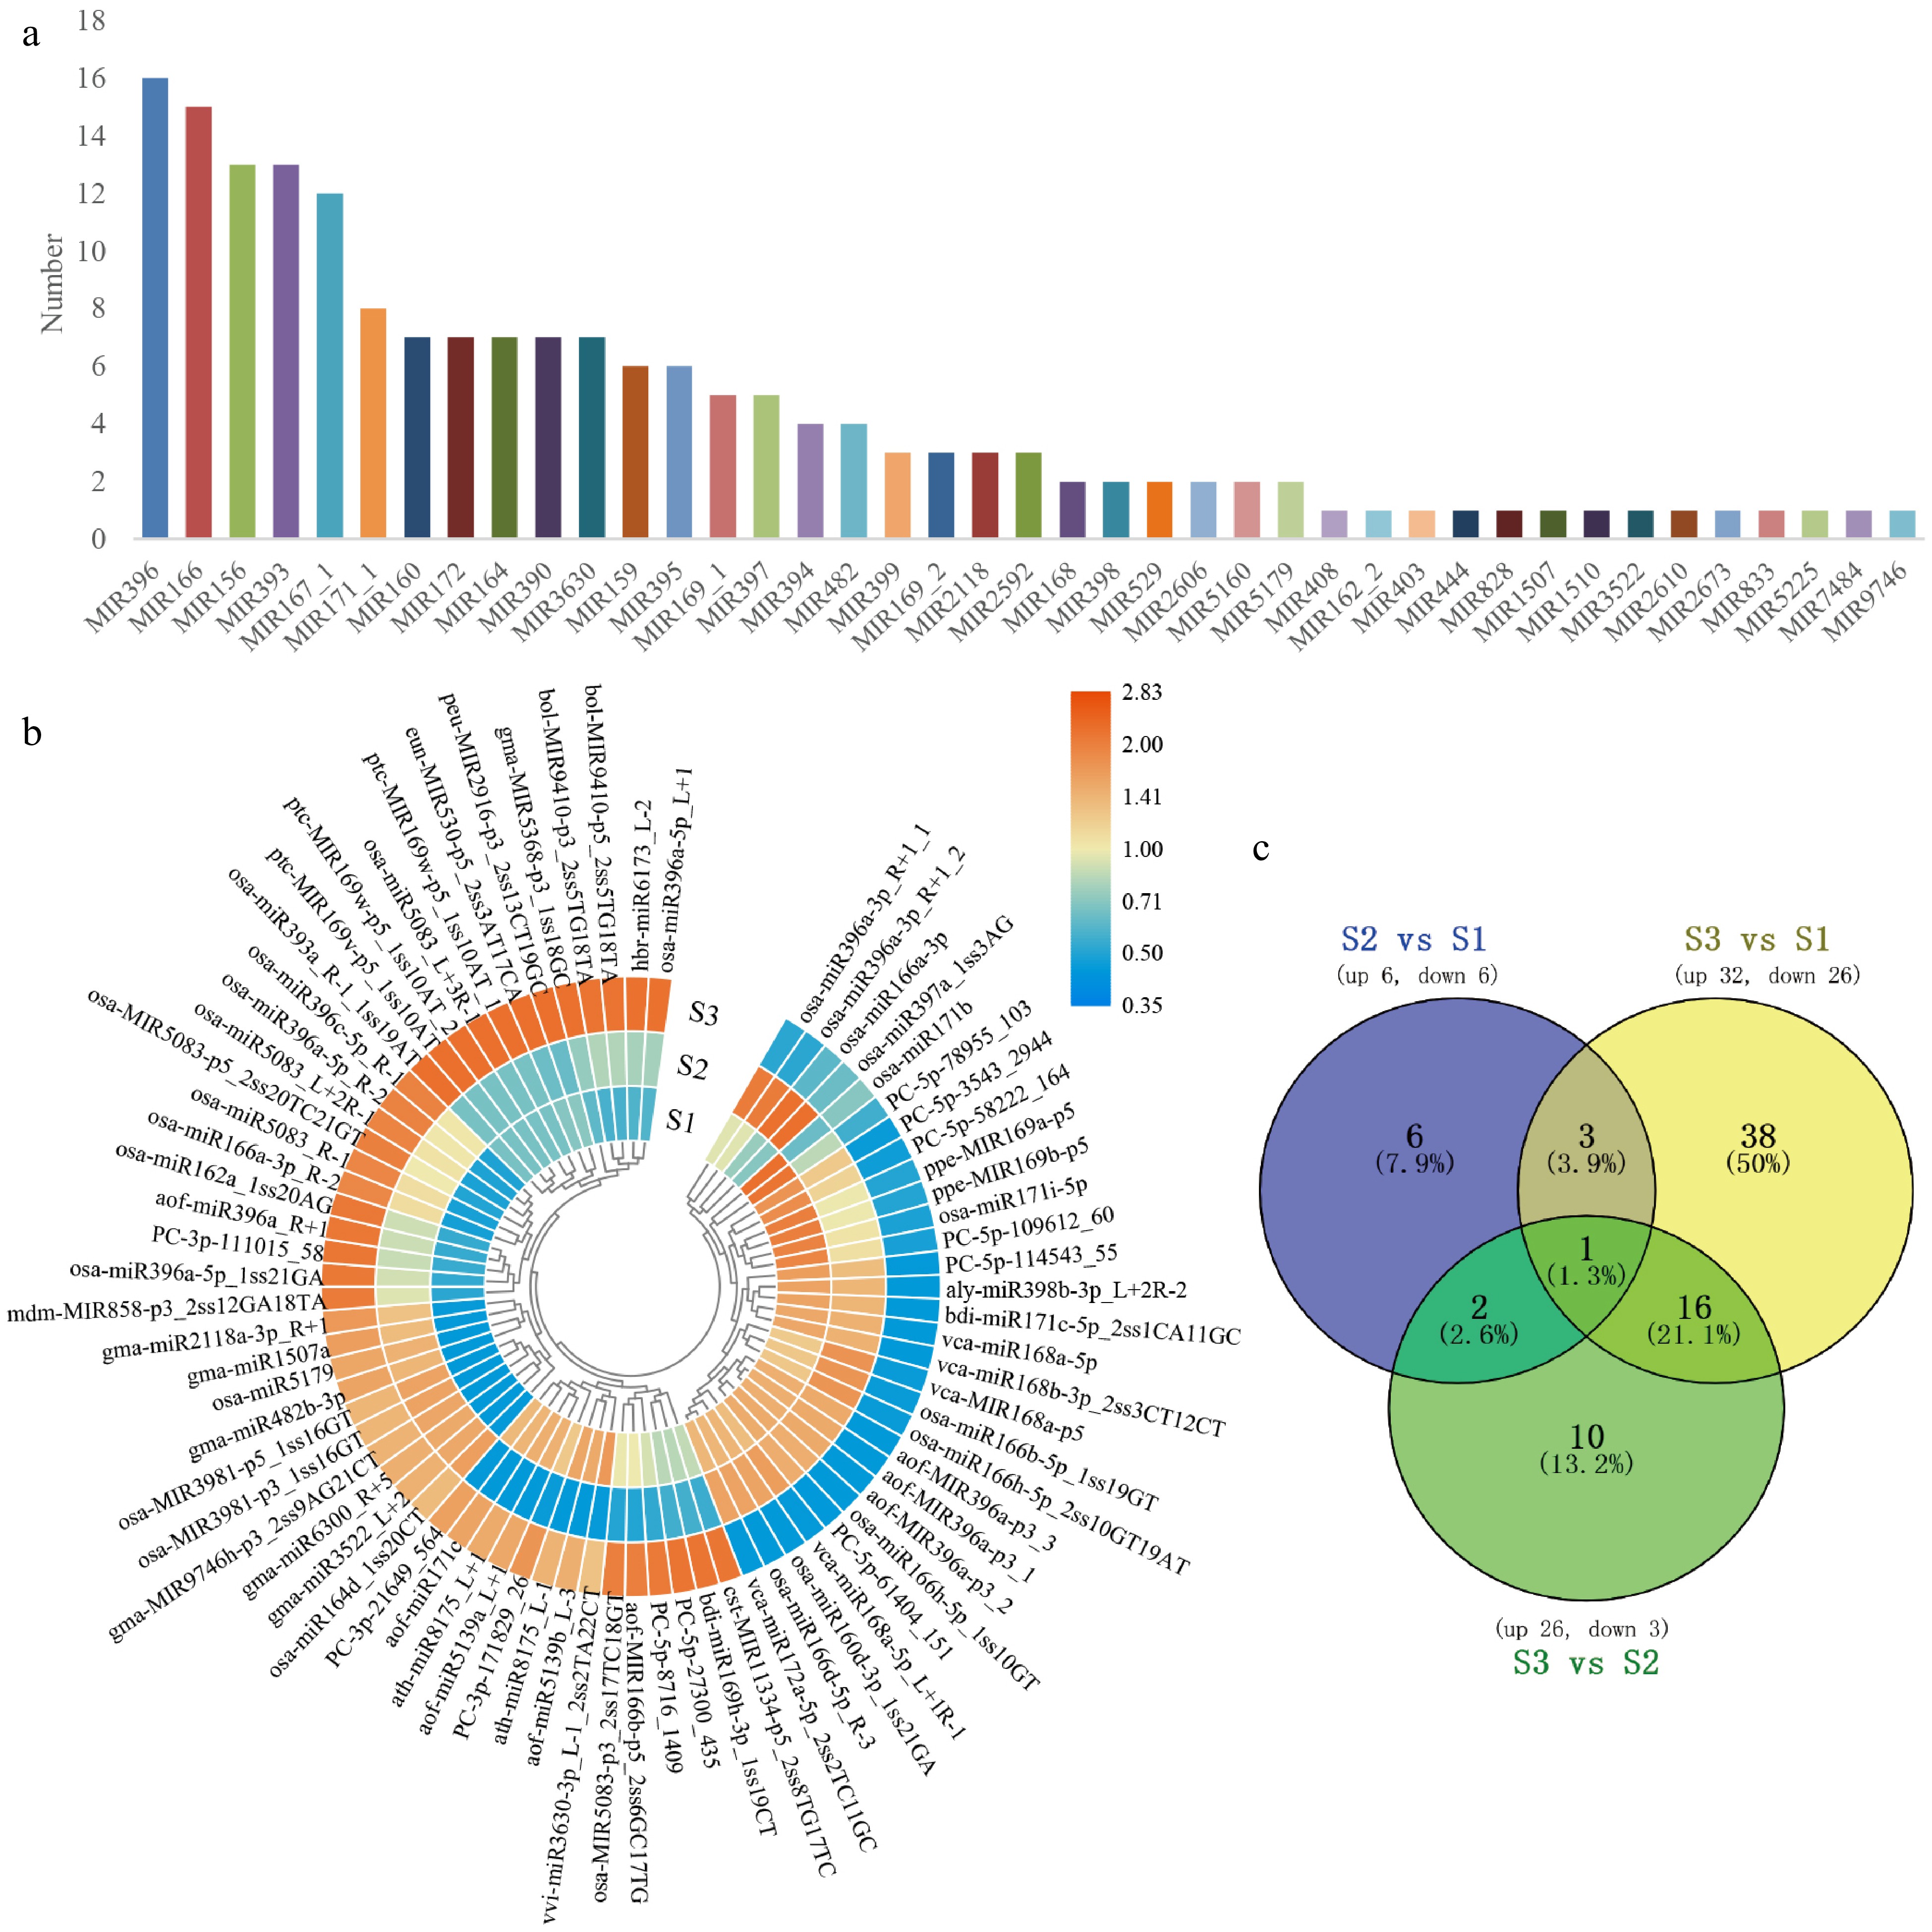
      Figure 2. 

      The classification of miRNA and the target genes. (a) The selected 285 known miRNA belonged to 41 MiRNA families. (b) Heatmap of DEMs expression in the development of flower. After performing row clusters, each colored cell shows the average log2 (FPKM) value of each miRNA. (c) DEMs in floral development is depicted in a Venn diagram.

      To further understand the role of miRNA in the process of flower color formation, we used psRNATarget to predict the miRNA target genes from the data of RNA-seq unigenes and found that 193 known miRNAs targeted 1,374 transcripts. There were 75 significant differentially expressed miRNAs (DEMs) selected by the threshold of a fold change > 2 with a p-value < 0.05 in all the compared groups (Fig. 2b). A total of 12 DEMs (six up, six down) in S2 vs S1; 58 DEMs (32 up, 26 down) in S3 vs S1; 29 DEMs (26 up, 3 down) in S2 vs S3 (Fig. 2c).

      According to the psRNATarget prediction, a total of 898 potential target genes were identified in lily flower petals, which were targeted by the 75 DEMs. GO analysis and KEGG annotation were performed to evaluate the potential functions of these miRNA target genes. The GO analysis showed that these target genes were divided into three categories: cellular components, molecular functions, and biological processes (Supplemental Fig. S1a). In biological processes, the oxidation-reduction process was one of the biggest groups. In cellular components, the integral component of the membrane was the major group. Molecular functions concentrated on zinc ion binding, DNA binding, and ATP binding. KEGG analysis showed that the significantly enriched pathways of the target genes were in metabolism progress (Supplemental Fig. S1b), indicating that target genes regulated by miRNA would have a certain influence on plant metabolic activities. In addition, some target genes were enriched in flavone and flavonol biosynthesis, suggesting that miRNA may indirectly affect the flavonoid biosynthesis pathway.

    • We further analyzed the annotated target genes and found among them many genes encoding transcription factors. The expression levels were similar to the accumulation trend of total anthocyanins and cyanidin derivatives (Fig. 1b, c), and opposite to the expression levels of the corresponding miRNA (Fig. 3a, b), indicating that miRNA negatively regulates the expression of target genes. Therefore, we analyzed the correlation of expression trend between miRNA and the target genes. Gene pairs with p-value ≤ −0.5 were selected for the study data. A correlation network diagram was then created using the Cytoscape program (Fig. 3c).
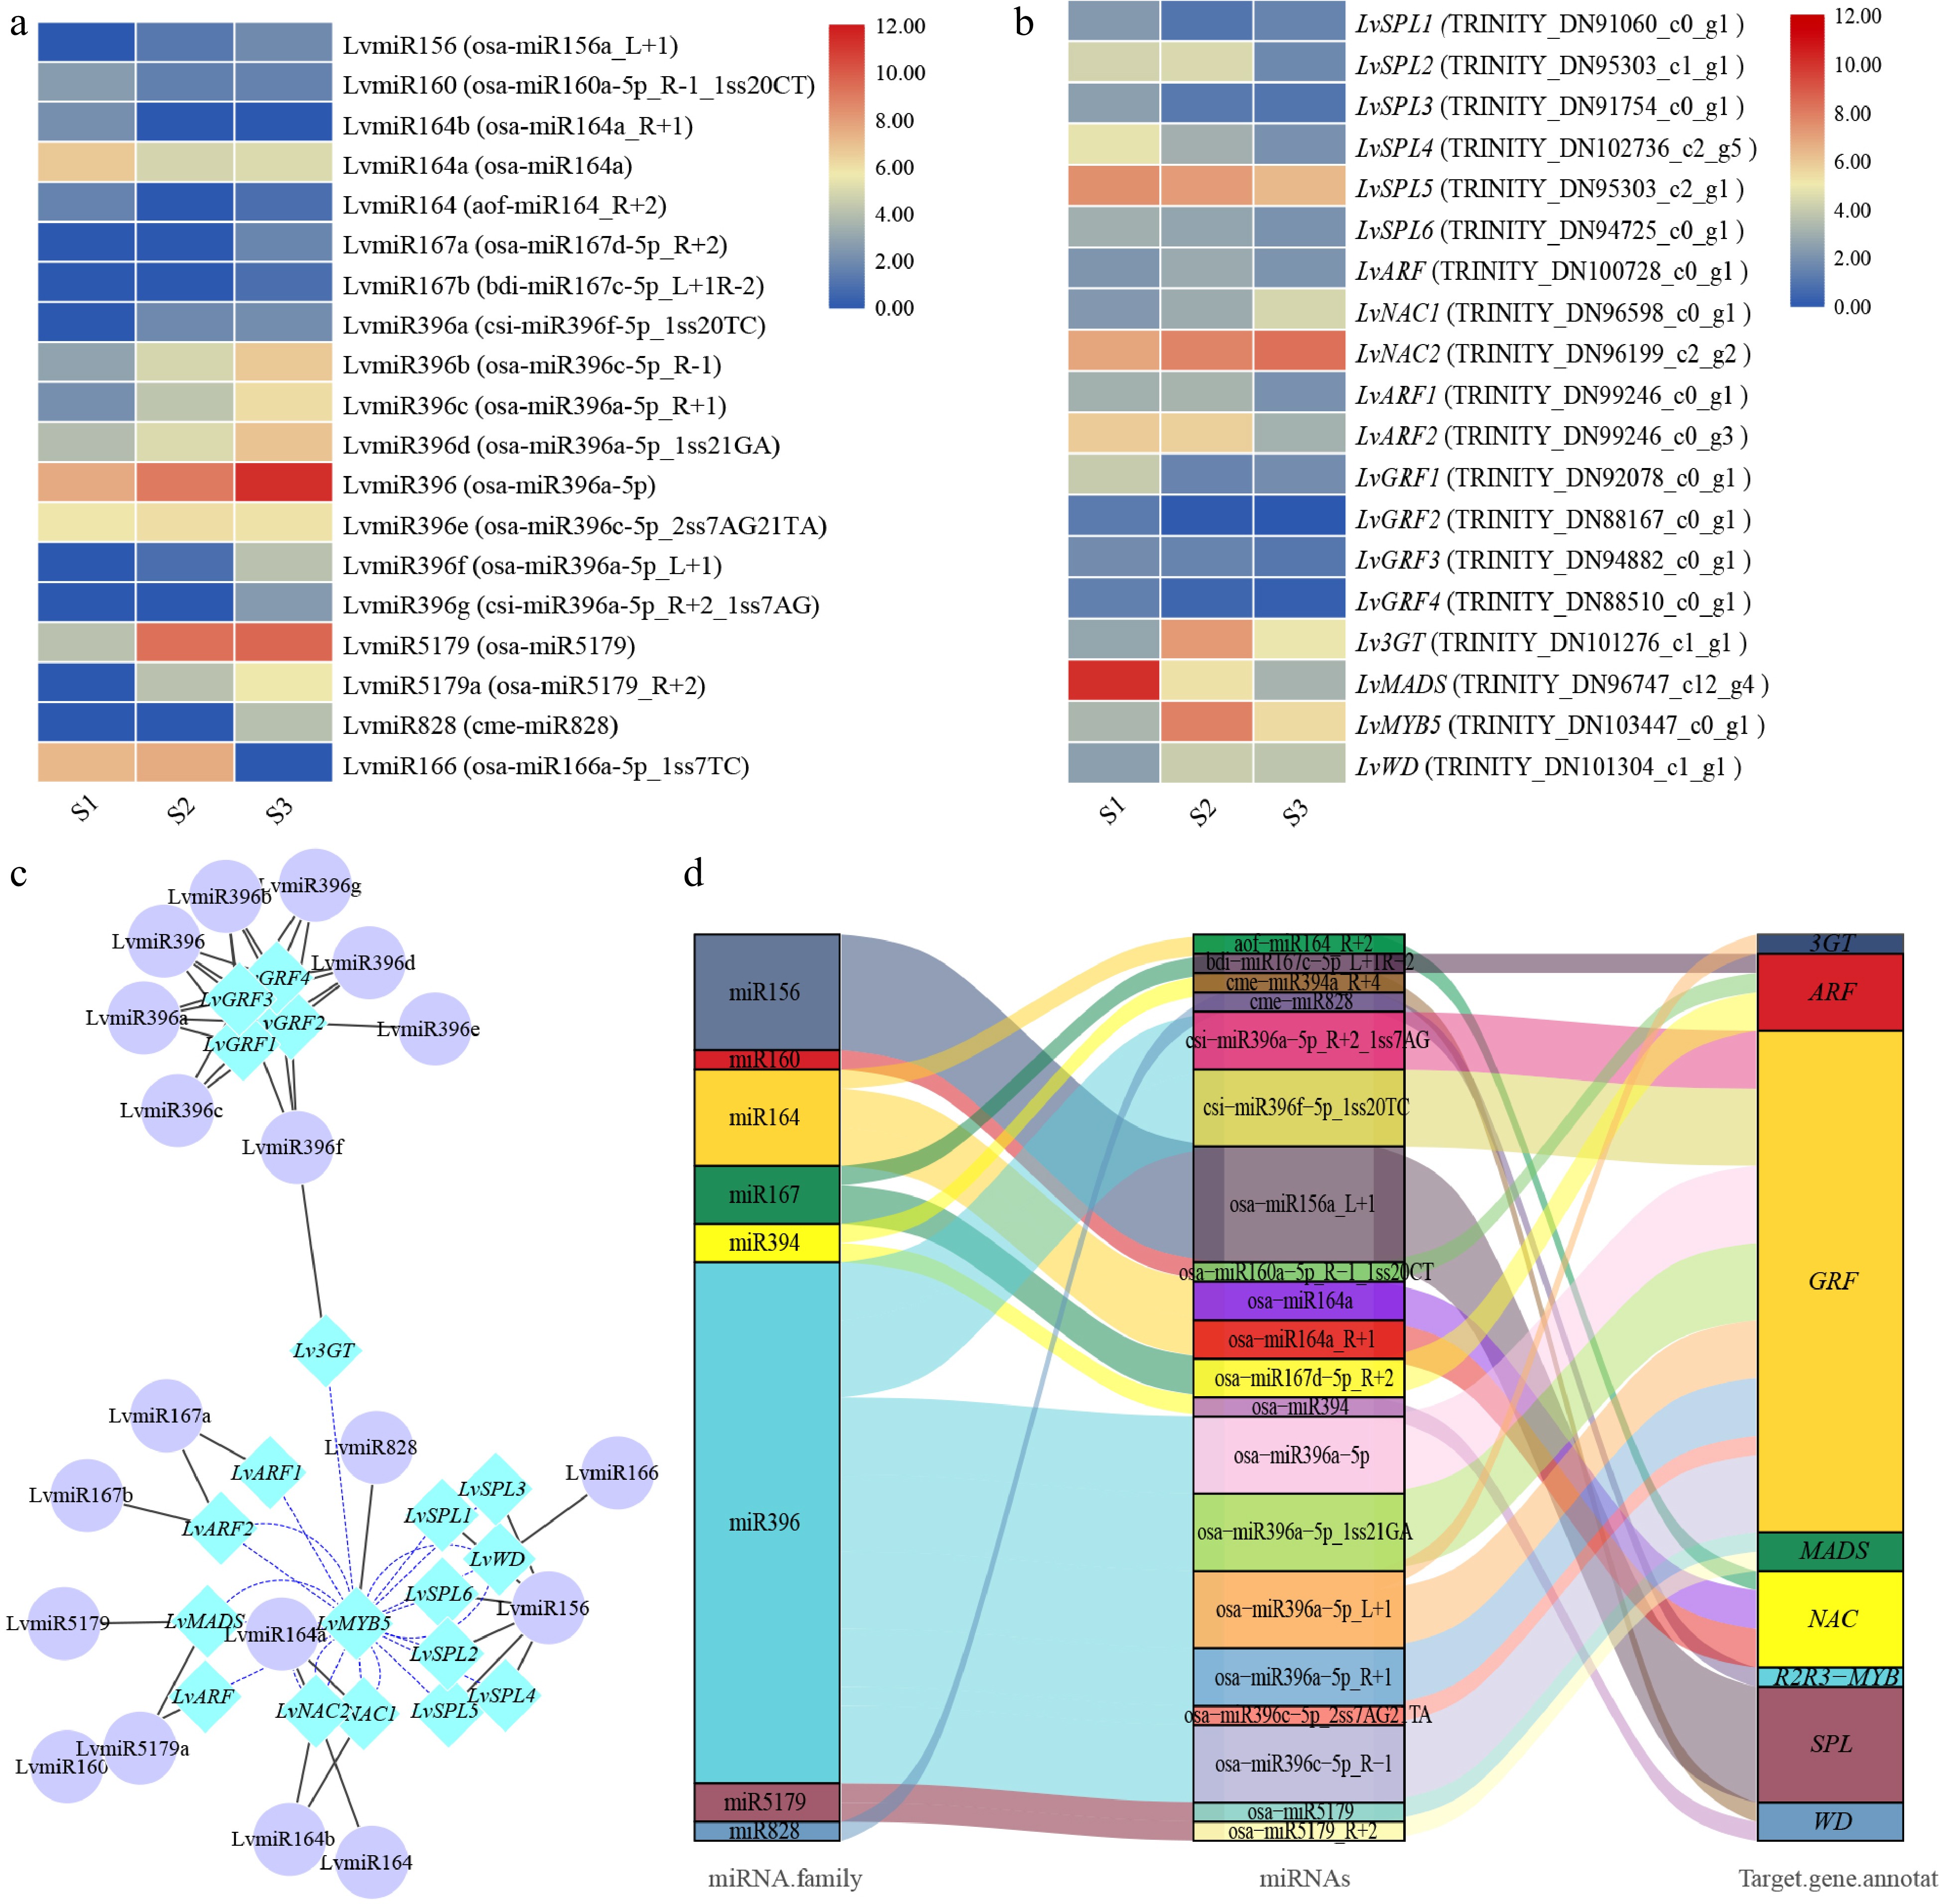
      Figure 3. 

      The correlation between miRNA and target genes screened from lily petals related to anthocyanin synthesis. (a) Heatmap of miRNA expression. (b) MiRNA target gene expression heatmap. The average log2 (FPKM) value of each gene is shown by the color of each cell. (c) The network of target genes and miRNAs controls the progress of anthocyanins synthesis. TF genes are represented by the blue rhombic nodes, miRNA are represented by the purple oval nodes; black lines represent negative correlation; and blue lines represent positive correlation. (d) The Sankey plot of miRNA and target genes.

      Finally, we screened the target genes including SPL (SQUAMOSA promoter-binding protein-like), MYB, WD, 3GT (anthocyanidin 3-O-glucosyltransferase), GRF (growth regulation factor), ARF (Auxin response factor), NAC,and MADS, which were targeted by miR156, miR828, miR166, miR396, miR160, miR167, miR164, and miR5179, respectively (Table 1). The regulation model of these miRNAs and target genes can be divided into two categories: one miRNA target regulates multiple gene transcripts, or several miRNAs target regulate the same gene transcript (Fig. 3d). We found that, miR159 can target multiple SPL, miR164 can target multiple NAC, miR396 can target 3GT and GRF, and both miR160 and miR167 can target ARF, miR828, miR166, miR5179 can target MYB, WD, MADS, respectively (Table 1). In future research, we will select these miRNAs and their target genes for further study.

      Table 1.  Target genes of anthocyanin biosynthesis related miRNAs in lily petals.

      miRNA familymiRNAsTarget genesTarget gene annotation
      miR156osa-miR156a_L+1TRINITY_DN91060_c0_g1, TRINITY_DN95303_c1_g1, TRINITY_DN91754_c0_g1, TRINITY_DN95303_c2_g1, TRINITY_DN94725_c0_g1, TRINITY_DN102736_c2_g5SPL
      miR828cme-miR828TRINITY_DN103447_c0_g1R2R3-MYB
      miR166osa-miR166a-5p_1ss7TCTRINITY_DN101304_c1_g1WD
      miR396osa-miR396a-5p_L+1TRINITY_DN101276_c1_g13GT
      csi-miR396f-5p_1ss20TC, osa-miR396c-5p_R-1, osa-miR396a-5p_R+1, osa-miR396a-5p_1ss21GA, osa-miR396a-5pTRINITY_DN92078_c0_g1GRF
      csi-miR396f-5p_1ss20TC, osa-miR396c-5p_2ss7AG21TA, osa-miR396c-5p_R-1, osa-miR396a-5p_R+1, osa-miR396a-5p_1ss21GA, osa-miR396a-5p, osa-miR396a-5p_L+1, csi-miR396a-5p_R+2_1ss7AGTRINITY_DN88167_c0_g1GRF
      osa-miR396c-5p_R-1, osa-miR396a-5p_R+1, osa-miR396a-5p_1ss21GA, osa-miR396a-5p, csi-miR396f-5p_1ss20TC, osa-miR396a-5p_L+1,
      csi-miR396a-5p_R+2_1ss7AG
      TRINITY_DN94882_c0_g1GRF
      csi-miR396f-5p_1ss20TC, osa-miR396c-5p_R-1, osa-miR396a-5p_1ss21GA, osa-miR396a-5p, osa-miR396a-5p_L+1, csi-miR396a-5p_R+2_1ss7AGTRINITY_DN88510_c0_g1GRF
      miR5179osa-miR5179, osa-miR5179_R+2TRINITY_DN96747_c12_g4MADS
      miR164osa-miR164a, osa-miR164a_R+1TRINITY_DN96598_c0_g1NAC
      osa-miR164a_R+1, osa-miR164a, aof-miR164_R+2TRINITY_DN96199_c2_g2NAC
      miR160osa-miR160a-5p_R-1_1ss20CTTRINITY_DN100728_c0_g1ARF
      miR167osa-miR167d-5p_R+2TRINITY_DN99246_c0_g1ARF
      bdi-miR167c-5p_L+1R-2, osa-miR167d-5p_R+2TRINITY_DN99246_c0_g3ARF

      To reveal the expression patterns of anthocyanin biosynthesis-related miRNAs in lily petals, nine miRNAs and 11 unigenes were selected for RT-qPCR validation (Fig. 4). Generally, the expression patterns of miRNA and unigenes were consistent with the results of the high throughput sequencing, indicating that the sequencing data were reliable. In the process of anthocyanin synthesis in lily petals, LvmiR164 (osa-miR164a_R+1) and LvmiR166 (osa-miR166a-5p_1ss7TC) showed down-regulated pattern, and LvmiR160 (osa-miR160a-5p_R-1_1ss20CT), LvmiR167c (bdi-miR167c-5p_L+1R-2), LvmiR5179 (osa-miR5179_R+2), LvmiR828 (cme-miR828), LvmiR156 (osa-miR156a_L+1) and LvmiR396 (osa-miR396a-5p_L+1) showed up-regulated pattern (Fig. 4). RT-qPCR was also used to confirm the target genes' corresponding expression patterns, including LvNAC1 (TRINITY_DN96598_c0_g1) and LvNAC2 (TRINITY_DN96199_c2_g2) for LvmiR164, LvWD (TRINITY_DN101304_c1_g1) for LvmiR166, LvARF1 (TRINITY_DN100728_c0_g1) and LvARF2 (TRINITY_DN99246_c0_g3) for LvmiR160 and LvmiR167c, LvMADS (TRINITY_DN96747_c12_g4) for LvmiR5179, LvMYB5 (TRINITY_DN103447_c0_g1) for LvmiR828, Lv3GT (TRINITY_DN101276_c1_g1) for LvmiR396, and LvSPL1 (TRINITY_DN91754_c0_g1), LvSPL2 (TRINITY_DN102736_c2_g5), and LvSPL3 (TRINITY_DN95303_c2_g1) for LvmiR156. The expression levels increased in LvNAC1/2 and LvWD and decreased in LvARF1/2, LvMADS, and LvSPL1/2/3. LvMYB5 and, Lv3GT increased in S2 and then decreased slightly in the S3 stage (Fig. 4). In general, the expression trend of the target genes was opposite to that of the miRNA.
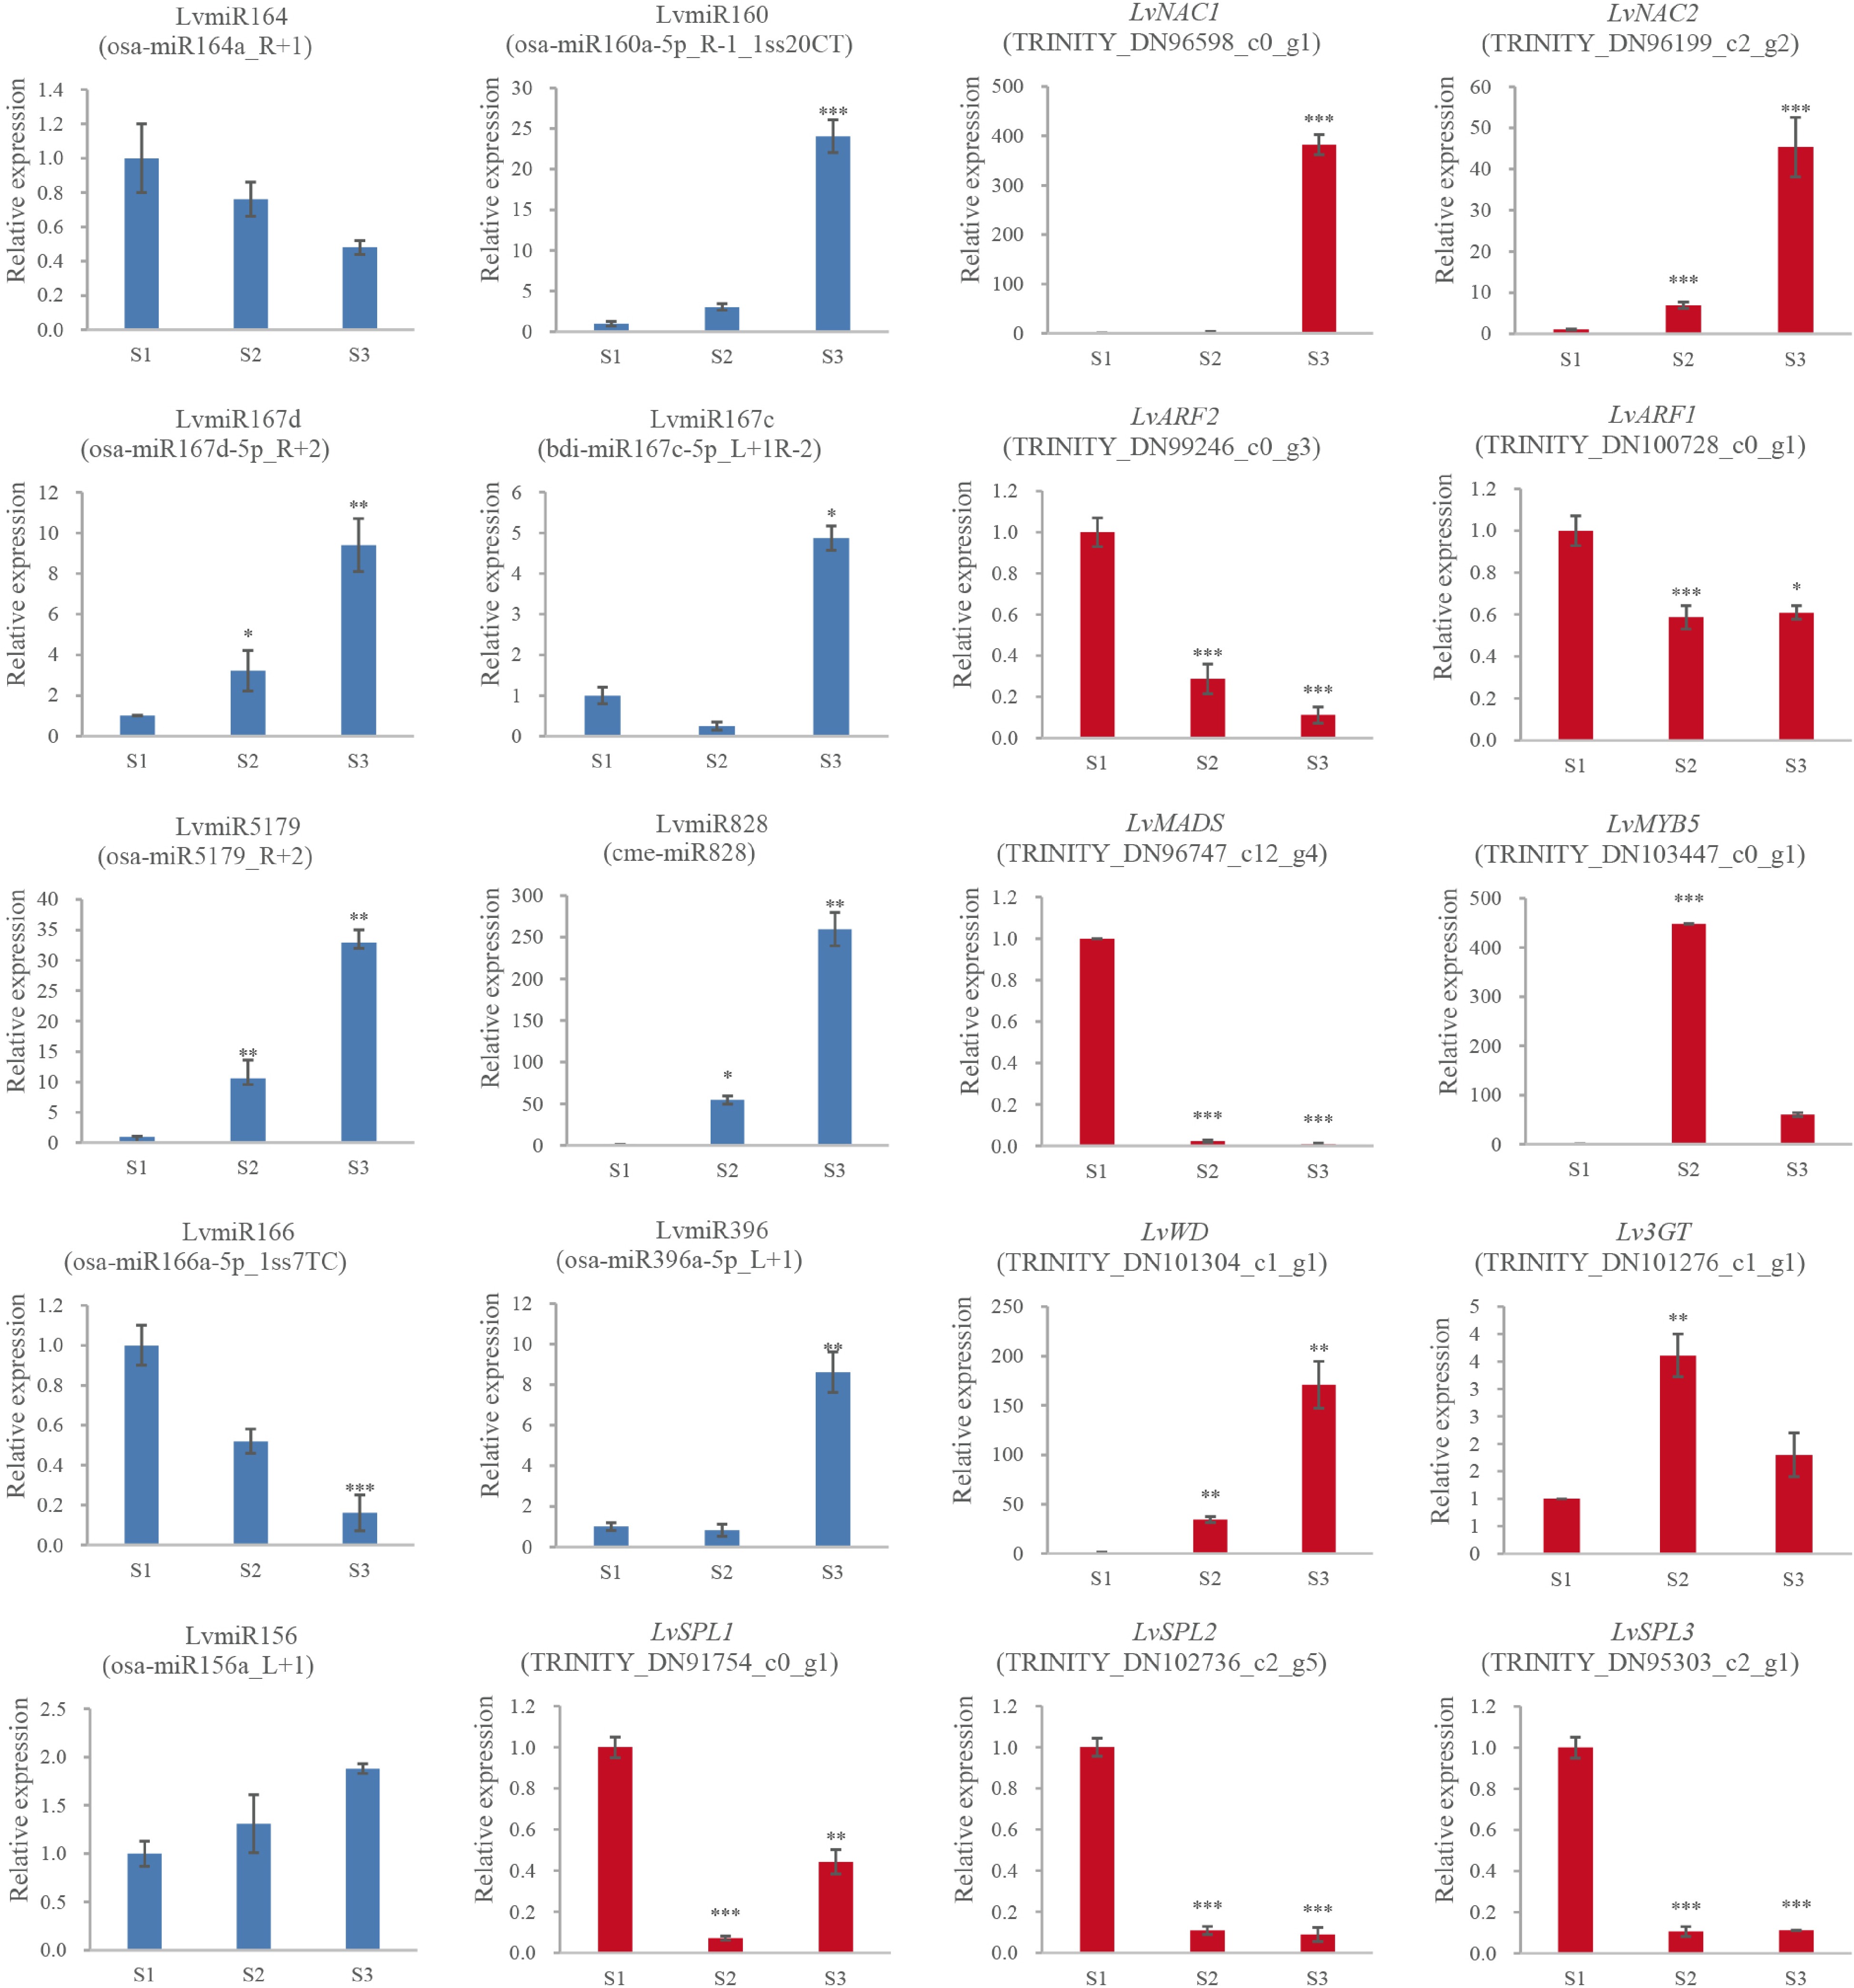
      Figure 4. 

      The expression and the regulation of miRNA and the target genes. 2−ΔΔCᴛ method was used to measure genes' relative expression in S1, S2, S3 stage of lily cultivar Vivian. * Denotes statistically significant differences between samples.

      Consistent with previous experiments, the content of the anthocyanin substances was lowest in the S1 stage and gradually increased in the S2 and S3 stages. This parallels the expression levels of Lv3GT and LvMYB5, which were perhaps the positive regulation genes related to anthocyanin biosynthesis in the lily petals[37,38]. In contrast, for flower coloring, significant inverse relationships between 3GT and LvMYB5 expression levels and LvmiR396 and LvmiR828 expression levels were found in the S2 and S3 stages. These findings suggest that the expression levels of these target genes and miRNAs are related. miRNAs in the pigmentation of lily flowers negatively regulated their target genes.

    • Lv-miR828 targeted LvMYB5 as analyzed by psRNATarget (Table 1), which is directly related to the anthocyanin synthesis pathway[37,43]. This regulatory pathway is therefore likely to affect lily pigmentation, and so we conducted further analysis on these genes.

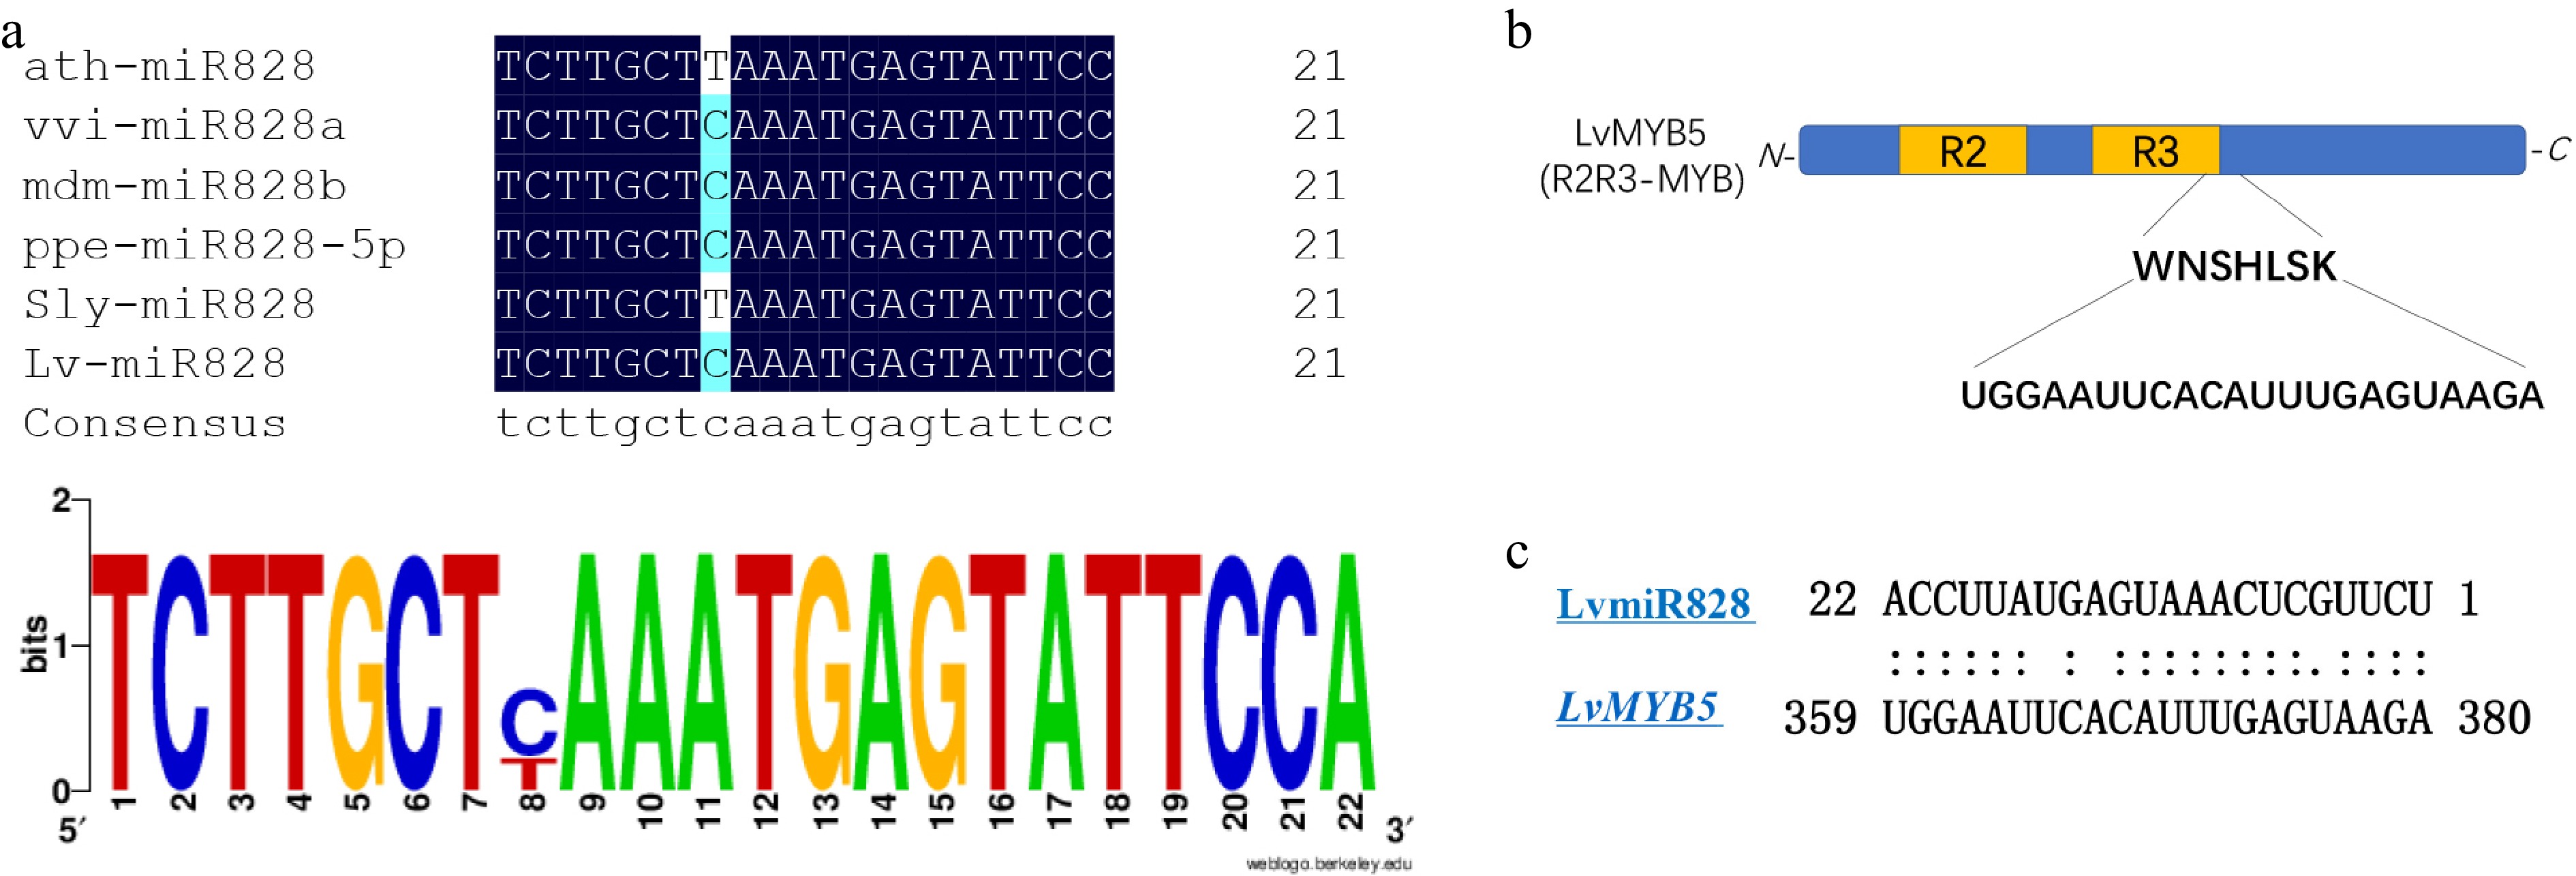
      From the multi-sequence alignment analysis of mature LvmiR828, we found it shares a high identity with miR828 in other plants, where it functions in anthocyanin biosynthesis. There was only one nucleotide difference between the mature miR828 (Fig. 5a), indicating that LvmiR828 might play a similar role here as in other species. The cleavage site was predicted using psRNATarget to be in the CDS sequence of LvMYB5 and the motif site of LvMYB5, coding for helix 3 of specific R3 domain, was targeted by LvmiR828 (Fig. 5b). We further compared the amino acid sequences of the target gene MYB in Arabidopsis thaliana and grapes with LvMYB5 in lilies, and found that the target sites were located at the end of R3 region with high similarity (Fig. 5c). We therefore speculate that miR828 targets LvMYB5 transcriptional translation through the cleavage site and inhibits anthocyanin synthesis.

      Figure 5. 

      A preliminary regulation analysis of LvmiR828 target LvMYB5. (a) Multiple sequence alignment of the mature miR828 in plant. (b) Predicted conserved binding site of LvMYB5 targeted by miR828. (c) The binding sites of MYB in plant targeted by miR828.

    • We found that there was no anthocyanin synthesis at the S1 stage. And the expression of Lv3GT and LvMYB5 was at a lower level. So, there wasn't regulation of post-transcriptional genes. However, transcriptional level and post-transcriptional level regulation appeared since the gene expression was in the stage of lily color formation. Therefore, miRNAs target Lv3GT and LvMYB5 in the stage where the petals start to color (S2 and S3 stage). So, some miRNAs, act as negative regulators and inhibit the expression of MYB activators to limit anthocyanin synthesis at flower developmental stages[44].

      In this study, we found LvmiR828 was negatively correlated with its target gene LvMYB5 during the flower coloration. The prediction results of the targeted regulation of LvMYB5 by LvmiR828 showed that the binding site was at R3 domain 3’ end of LvMYB5, which probably affected the DNA binding activity of LvMYB5 and directly mediated the cleavage of MYB in mRNA level, thus affecting the synthesis of anthocyanins. Similar results have been obtained in Arabidopsis thaliana and potato, where miR828 targets MYB TFs to affect anthocyanin synthesis[29,36]. miR828 targeting AtMYB75, AtMYB113 regulates DFR and LDOX in Arabidopsis[30]. As a negative regulator, miR828 inhibited the biosynthesis of anthocyanin in tomatoes at different developmental stages, and the content of anthocyanin in transgenic plants overexpressing AtmiR828 was also significantly reduced[36]. Similarly, miR828 and miR858 have also been shown to regulate MYB114 resulting in the accumulation of anthocyanins in grapes[44]. Our results are consistent with these findings and the miR828 is conserved in plants. So, LvmiR828 participates in anthocyanin biosynthesis through the targeted regulation LvMYB5. We also found that the abundance of LvmiR828 was also lower than that of other miRNAs such as LvmiR156, and LvmiR159 detected by high throughput sequencing. Additionally, we've seen similar performants in other plants like Malus × domestical[23], Arabidopsis[36], and Vitis[44] among others. The expression of miRNA in plants is the result of many factors. The final expression level of miRNA and its target genes is likely related to a variety of regulatory factors such as space and time[45]. Moreover, miRNA can be expressed under different environmental stimuli[46]. Similarly, other miRNAs that regulate genes related to anthocyanin biosynthesis have been found in lily petal coloring. LvmiR396 and LvmiR166 target Lv3GT and LvWD, respectively, which may affect anthocyanin synthesis. WD can also form complexes with MYB and bHLH to regulate the biosynthesis of anthocyanins[6]. 3GT (Anthocyanidin 3-O-glucosyltransferase) is one of the key enzymes of anthocyanin biosynthesis and plays an important role in anthocyanin accumulation[47]. Therefore, the regulatory network of lily flower color synthesis is very complex, and the synthesis of anthocyanidin may be generated under the combined action of multiple regulatory factors.

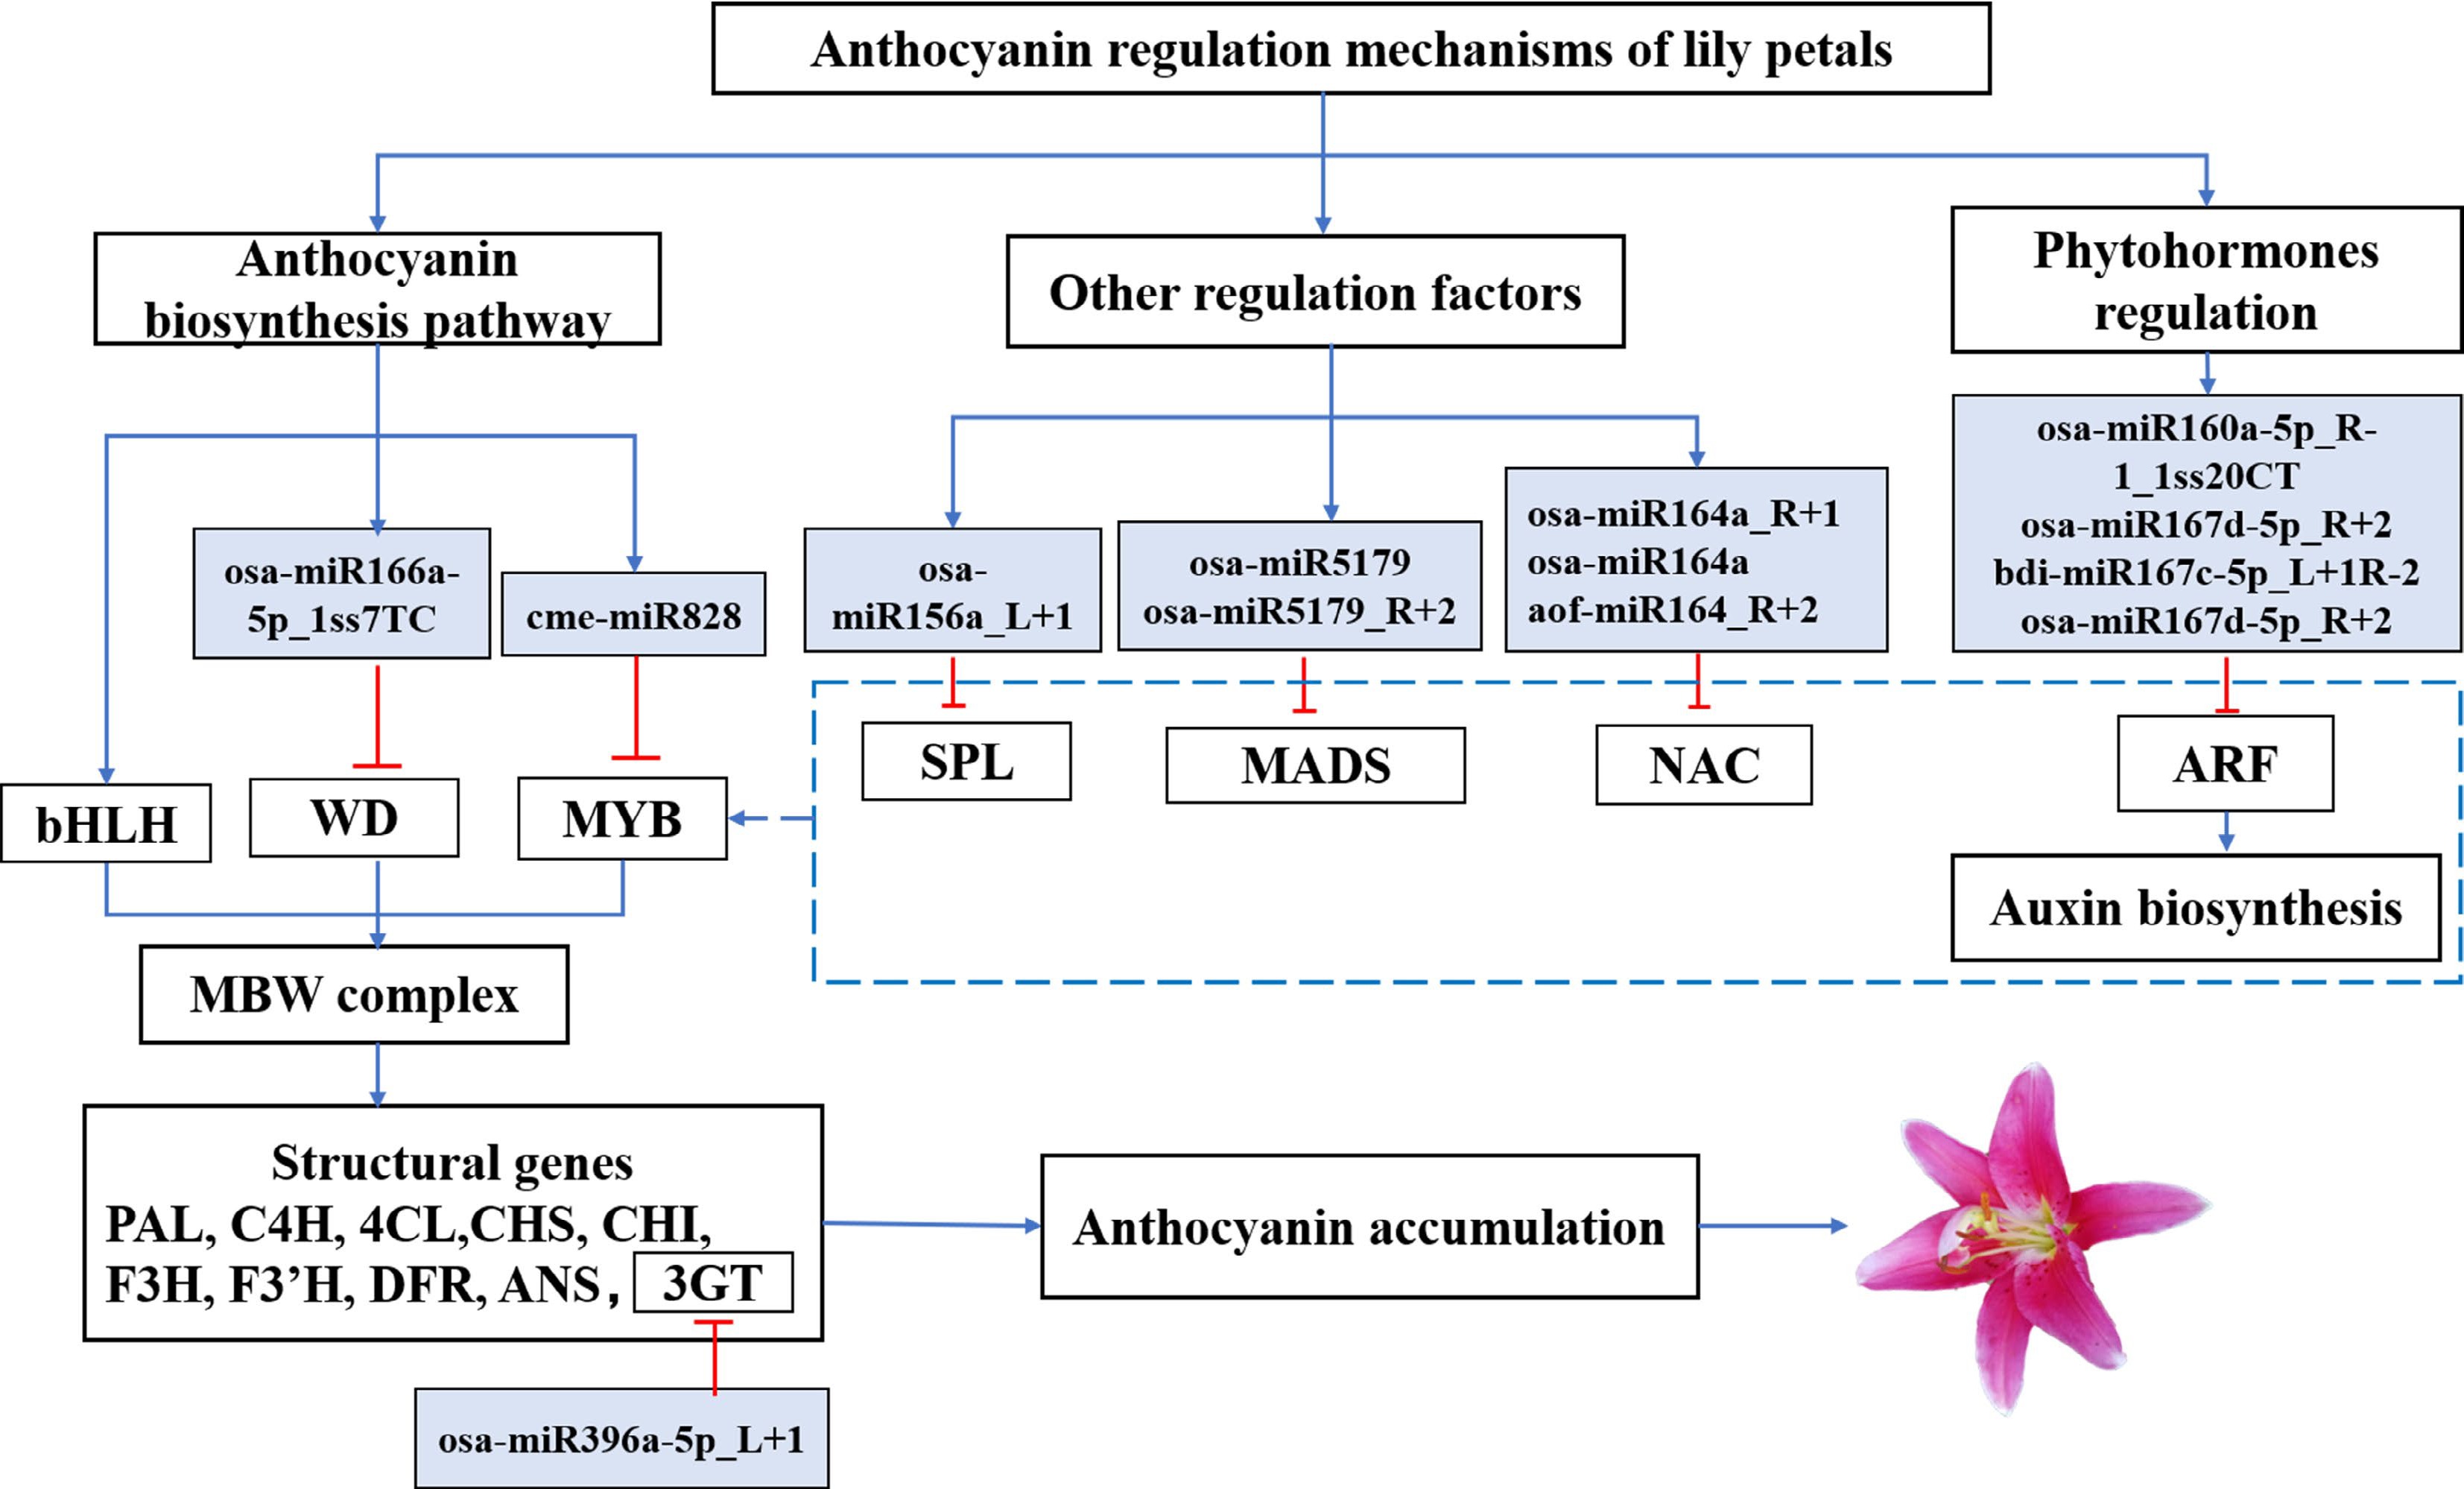
    • Flower blooming and petal pigmentation are the important developmental stages of ornamental plants, along with the transitional period from vegetative growth to reproductive growth[48]. A variety of internal and external signal regulation mechanisms ensure blooming and pigmentation in plants, including light, temperature, sugar and plant hormones, and other regulations[49]. A large amount of evidence indicates that MBW complexes related to anthocyanin synthesis are regulated by both exogenous environmental and endogenous developmental signals[50,51]. Several transcription factors (TFs) have been found to influence anthocyanin biosynthesis by regulating MBW complexes, such as NAC[18,19], MADS[16,17], ARF[20,21] and SPL[14,15] among others. These genes form a complex regulatory network that regulates anthocyanin biosynthesis.

      SPL targeted by miR156 negatively regulates the expression of anthocyanin biosynthesis genes by disrupting the stability of the MBW complex[24]. For example, miR156 suppressed the expression of SPL13 and increased the expression of WD40-1, then enhanced anthocyanin biosynthesis in alfalfa[27]. In blueberries, VcMIR156a-VcSPL12 interacts with VCMYBPA1 to regulate the coloration of the fruit[14]. Similar results were obtained in Arabidopsis thaliana, lychee, and peony[15,24,52].

      In the present study, we found that Lv-mir5179 targets the MADS-box gene. The MADS-box TF family may play an important function in regulating floral organogenesis and flowering time in plants[53,54]. The MADS-box protein is involved in anthocyanin biosynthesis in sweet potatoes (Ipomoea batatas (L.) Lam)[17,55]. And in O. italica, miR5179 inhibited OitaDEF2 (MADS-box) expression and was involved in the development of perianth organs of O. italica[56]. As lilies and O. italica belong to the monocotyledons, they were likely to have similar functions. As a result, the LvmiR5179-mediated MADS-box regulation found in this study may play an important role in pigmentation.

      ARFs may regulate the expression of the MBW complex by binding to auxin response elements in the promoters of MYB[57,58]. Growing evidence suggests that auxin-suppressed anthocyanin biosynthesis in Arabidopsis[58] and Malus[21]. MiR160 and miR167 were found to target ARFs (Table 1)in the process of lily coloration, suggesting that they may indirectly affect the coloration.

      NAC TFs can regulate the pathway of disease resistance, plant development, abiotic stress response, and the phenylpropanoid pathway[5961]. In Arabidopsis thaliana, ANAC032 inhibits anthocyanin accumulation. while ANAC078 promotes coloration. In peaches, PpNAC1 is an activator in pigmentation[6163]. IbNAC56 regulates pigmentation in purple-fleshed sweet potatoes by interacting with the complexes of IbMYB340 and IbbHLH2[64]. Additionally, the miR164-NAC regulatory pathway controls ripening in Rosaceae fruit, grapes, and citrus[65]. We found that LvmiR164 targeted NAC TFs, which may also indirectly regulate anthocyanin biosynthesis via interaction with MYB.

      This study examined miRNA during the coloration progress of lily flowers. A total of 75 miRNAs with different expressions were identified in the process of anthocyanin accumulation. A variety of DEMs may play a regulatory role in the anthocyanin biosynthesis. In this study, miR828 and miR396 targeted LvMYB5 and Lv3GT, respectively, the expression of which could function on the anthocyanin biosynthesis pathway, and impacted the pigment of the petals. In addition, we predict that some miRNA target genes may be indirectly involved in the biosynthesis of anthocyanin in lily petals (Table 1). Such as, LvmiR156 targets LvSPL, LvmiR164 targets LvNAC and LvmiR5179 targets LvMADS, which may regulate MYB TFs to impact the pigment of petals indirectly. In addition, LvmiR167 and LvmiR160 target LvARF, which may activate the auxin signal pathway and indirectly affect the expression of MYB TFs and structural genes involved in the anthocyanin biosynthesis pathway to regulate the formation of flower color. These miRNAs and their target genes may also be involved in regulating other secondary metabolic pathways, forming a complex regulatory network of anthocyanin biosynthesis under the impact of various metabolic pathways.

      It has been recently established that miRNA can affect anthocyanin synthesis, for example, miR164 inhibits anthocyanidin accumulation in grape berry cells[66], microRNA858 inhibits anthocyanin biosynthesis in kiwifruit by suppressing AaMYBC1 expression[67], and blackberry miRNAs play an important role in flavonoid and anthocyanin synthesis[68]. Based on past reports and the data analysis above, we hypothesized a possible miRNA-target module linked to the synthesis of anthocyanin (Fig. 6). These findings contribute to our understanding of the functional characterization of miRNAs and their targets in regulating anthocyanin biosynthesis in plants.

      Figure 6. 

      An interaction model between the target genes for miRNAs involved in the progress of flower coloration in lily petals has been presented. Solid arrowhead lines: the proven regulatory roles. Dashed lines: potential roles.

    • MiRNAs are important post-transcriptional regulators, some of which participate in regulating anthocyanin biosynthesis and other pathways, including plant stress, growth and development, and internal and external hormones[23,24], however, the study of miRNAs involved in lily pigmentation is incomplete. In this study, we comprehensively performed the RNA-seq and miRNA sequencing of lily petals at three stages of flower coloring. A total of 326 miRNAs were identified from nine libraries, including 285 known and 41 new miRNAs, using the Illumina Next Seq 500 platform. The differential miRNAs were screened, and the functions of the target genes were analyzed. The expression patterns of candidate miRNAs and target genes were detected by qPCR to obtain the genes that may function in flower coloration in lily petals. Identification and functional analysis of miRNAs and target genes related to flower coloring will help reveal the coloration regulation mechanism in ornamental plants in complex and variable environments.

      • This work was financially supported by Discipline Construction of Professional Degree (Grant No. 880220039) China, Doctoral Research Foundation of Liaoning Provincial Natural Science (2022-BS-347), and Doctoral Research Launch Foundation of 2022 Science and education integration (Grant No. BS202204). The role of the funding body in the design of the study, the collection, analysis, and interpretation of data and in writing the manuscript is management and supervision.

      • The authors declare that they have no conflict of interest.

      • # These authors contributed equally: Xiaojuan Yin, Zhenhua Gao

      • Supplemental Fig. S1 The enrichment analysis of the target genes A: The GO enrichment analysis of the target genes. B: KEGG Pathway Enrichment of the target genes.
      • Supplemental Table S1 The primers information of miRNAs in this study.
      • Supplemental Table S2 The primers information of target genes in this study.
      • Copyright: © 2023 by the author(s). Published by Maximum Academic Press, Fayetteville, GA. This article is an open access article distributed under Creative Commons Attribution License (CC BY 4.0), visit https://creativecommons.org/licenses/by/4.0/.
    Figure (6)  Table (1) References (68)
  • About this article
    Cite this article
    Yin X, Gao Z, Sun S, Zhang L, Irfan M, et al. 2023. Insights into microRNA regulation of flower coloration in a lily cultivar Vivian petal. Ornamental Plant Research 3:9 doi: 10.48130/OPR-2023-0009
    Yin X, Gao Z, Sun S, Zhang L, Irfan M, et al. 2023. Insights into microRNA regulation of flower coloration in a lily cultivar Vivian petal. Ornamental Plant Research 3:9 doi: 10.48130/OPR-2023-0009

Catalog

  • About this article

/

DownLoad:  Full-Size Img  PowerPoint
Return
Return