ARTICLE   Open Access    

Phylogenetic relationships among Australian native citrus species based upon complete chloroplast genomes and single copy nuclear genes

More Information
  • Australian citrus species formed a monophyletic clade which was separated from the non-Australian species, indicating their unique status within the genus Citrus.

    Citrus inodora and Citrus australasica had a close relationship based on 86 single copy nuclear genes and were distinct from the other four Australian species.

    Citrus australasica had a unique chloroplast which was distinct from all the other Australian species.

    Citrus medica had a similar chloroplast to the Australian species but was more closely related to the Asian citrus species based on nuclear genes.

  • Citrus is widely consumed across the world as a fruit crop. Despite many citrus species being extensively studied around the world, phylogenetic relationships among Australian native species remain unresolved. Here we present the phylogenetic relationships among six Australian native species, two domesticated citrus cultivars of commercial importance in Australia, and another 13 accessions cultivated internationally based on complete, de novo assembled chloroplast genomes and 86 single copy nuclear genes. The chloroplast and nuclear phylogenies were topologically different. The Australian species formed a monophyletic clade based on their nuclear genes. The nuclear phylogeny revealed a close relationship between Citrus inodora and Citrus australasica. These two species were distinct from the other four Australian limes that were more closely related to each other. Citrus australasica had a unique chloroplast which was distinct from all other Australian limes. Among the other Australian limes, Citrus glauca was the most distinct species based on nuclear genes, however, it had a similar chloroplast sequence to C. australis. The undetermined Citrus sp. was more closely related to Citrus garrawayi, indicating that it is a distinct form of Citrus garrawayi. Citrus medica, had a chloroplast similar to Australian species. However, the nuclear gene phylogeny analysis revealed that C. medica was more closely related to Asian citrus species. This study improves our understanding of phylogenetic relationships among Australian citrus species and confirms their unique status within the genus since it formed a monophyletic clade which was clearly separated from the other non-Australian species.
    Graphical Abstract
  • Aquaporin’s (AQPs) are small (21–34 kD) channel-forming, water-transporting trans-membrane proteins which are known as membrane intrinsic proteins (MIPs) conspicuously present across all kingdoms of life. In addition to transporting water, plant AQPs act to transport other small molecules including ammonia, carbon dioxide, glycerol, formamide, hydrogen peroxide, nitric acid, and some metalloids such as boron and silicon from the soil to different parts of the plant[1]. AQPs are typically composed of six or fewer transmembrane helices (TMHs) coupled by five loops (A to E) and cytosolic N- and C-termini, which are highly conserved across taxa[2]. Asparagine-Proline-Alanine (NPA) boxes and makeup helices found in loops B (cytosolic) and E (non-cytosolic) fold back into the protein's core to form one of the pore's two primary constrictions, the NPA region[1]. A second filter zone exists at the pore's non-cytosolic end, where it is called the aromatic/arginine (ar/R) constriction. The substrate selectivity of AQPs is controlled by the amino acid residues of the NPA and ar/R filters as well as other elements of the channel[1].

    To date, the AQP gene families have been extensively explored in the model as well as crop plants[39]. In seed plants, AQP distributed into five subfamilies based on subcellular localization and sequence similarities: the plasma membrane intrinsic proteins (PIPs; subgroups PIP1 and PIP2), the tonoplast intrinsic proteins (TIPs; TIP1-TIP5), the nodulin26-like intrinsic proteins (NIPs; NIP1-NIP5), the small basic intrinsic proteins (SIPs; SIP1-SIP2) and the uncategorized intrinsic proteins (XIPs; XIP1-XIP3)[2,10]. Among them, TIPs and PIPs are the most abundant and play a central role in facilitating water transport. SIPs are mostly found in the endoplasmic reticulum (ER)[11], whereas NIPs homologous to GmNod26 are localized in the peribacteroid membrane[12].

    Several studies reported that the activity of AQPs is regulated by various developmental and environmental factors, through which water fluxes are controlled[13]. AQPs are found in all organs such as leaves, roots, stems, flowers, fruits, and seeds[14,15]. According to earlier studies, increased AQP expression in transgenic plants can improve the plants' tolerance to stresses[16,17]. Increased root water flow caused by upregulation of root aquaporin expression may prevent transpiration[18,19]. Overexpression of Tamarix hispida ThPIP2:5 improved osmotic stress tolerance in Arabidopsis and Tamarix plants[20]. Transgenic tomatoes having apple MdPIP1;3 ectopically expressed produced larger fruit and improved drought tolerance[21]. Plants over-expressing heterologous AQPs, on the other hand, showed negative effects on stress tolerance in many cases. Overexpression of GsTIP2;1 from G. soja in Arabidopsis plants exhibited lower resistance against salt and drought stress[22].

    A few recent studies have started to establish a link between AQPs and nanobiology, a research field that has been accelerating in the past decade due to the recognition that many nano-substances including carbon-based materials are valuable in a wide range of agricultural, industrial, and biomedical activities[23]. Carbon nanotubes (CNTs) were found to improve water absorption and retention and thus enhance seed germination in tomatoes[24,25]. Ali et al.[26] reported that Carbon nanoparticles (CTNs) and osmotic stress utilize separate processes for AQP gating. Despite lacking solid evidence, it is assumed that CNTs regulate the aquaporin (AQPs) in the seed coats[26]. Another highly noticed carbon-nano-molecule, the fullerenes, is a group of allotropic forms of carbon consisting of pure carbon atoms[27]. Fullerenes and their derivatives, in particular the water-soluble fullerols [C60(OH)20], are known to be powerful antioxidants, whose biological activity has been reduced to the accumulation of superoxide and hydroxyl[28,29]. Fullerene/fullerols at low concentrations were reported to enhance seed germination, photosynthesis, root growth, fruit yield, and salt tolerance in various plants such as bitter melon and barley[3032]. In contrast, some studies also reported the phytotoxic effect of fullerene/fullerols[33,34]. It remains unknown if exogenous fullerene/fullerol has any impact on the expression or activity of AQPs in the cell.

    Garden pea (P. sativum) is a cool-season crop grown worldwide; depending on the location, planting may occur from winter until early summer. Drought stress in garden pea mainly affects the flowering and pod filling which harm their yield. In the current study, we performed a genome-wide identification and characterization of the AQP genes in garden pea (P. sativum), the fourth largest legume crop worldwide with a large complex genome (~4.5 Gb) that was recently decoded[35]. In particular, we disclose, for the first time to our best knowledge, that the transcriptional regulations of AQPs by osmotic stress in imbibing pea seeds were altered by fullerol supplement, which provides novel insight into the interaction between plant AQPs, osmotic stress, and the carbon nano-substances.

    The whole-genome sequence of garden pea ('Caméor') was retrieved from the URGI Database (https://urgi.versailles.inra.fr/Species/Pisum). Protein sequences of AQPs from two model crops (Rice and Arabidopsis) and five other legumes (Soybean, Chickpea, Common bean, Medicago, and Peanut) were used to identify homologous AQPs from the garden pea genome (Supplemental Table S1). These protein sequences, built as a local database, were then BLASTp searched against the pea genome with an E-value cutoff of 10−5 and hit a score cutoff of 100 to identify AQP orthologs. The putative AQP sequences of pea were additionally validated to confirm the nature of MIP (Supplemental Table S2) and transmembrane helical domains through TMHMM (www.cbs.dtu.dk/services/TMHMM/).

    Further phylogenetic analysis was performed to categorize the AQPs into subfamilies. The pea AQP amino acid sequences, along with those from Medicago, a cool-season model legume phylogenetically close to pea, were aligned through ClustalW2 software (www.ebi.ac.uk/Tools/msa/clustalw2) to assign protein names. The unaligned AQP sequences to Medicago counterparts were once again aligned with the AQP sequences of Arabidopsis, rice, and soybean. Based on the LG model, unrooted phylogenetic trees were generated via MEGA7 and the neighbor-joining method[36], and the specific name of each AQP gene was assigned based on its position in the phylogenetic tree.

    By using the conserved domain database (CDD, www.ncbi.nlm.nih.gov/Structure/cdd/cdd.shtml), the NPA motifs were identified from the pea AQP protein sequences[37]. The software TMHMM (www.cbs. dtu.dk/services/TMHMM/)[38] was used to identify the protein transmembrane domains. To determine whether there were any alterations or total deletion, the transmembrane domains were carefully examined.

    Basic molecular properties including amino acid composition, relative molecular weight (MW), and instability index were investigated through the online tool ProtParam (https://web.expasy.org/protparam/). The isoelectric points (pI) were estimated by sequence Manipulation Suite version 2 (www.bioinformatics.org/sms2)[39]. The subcellular localization of AQP proteins was predicted using Plant-mPLoc[40] and WoLF PSORT (www.genscript.com/wolf-psort.html)[ 41] algorithms.

    The gene structure (intron-exon organization) of AQPs was examined through GSDS ver 2.0[42]. The chromosomal distribution of the AQP genes was illustrated by the software MapInspect (http://mapinspect.software.informer.com) in the form of a physical map.

    To explore the tissue expression patterns of pea AQP genes, existing NGS data from 18 different libraries covering a wide range of tissue, developmental stage, and growth condition of the variety ‘Caméor’ were downloaded from GenBank (www.ncbi.nlm.nih.gov/bioproject/267198). The expression levels of the AQP genes in each tissue and growth stage/condition were represented by the FPKM (Fragments Per Kilobase of transcript per Million fragments mapped) values. Heatmaps of AQPs gene were generated through Morpheus software (https://software.broadinstitute.org/morpheus/#).

    Different solutions, which were water (W), 0.3 M mannitol (M), and fullerol of different concentrations dissolved in 0.3 M mannitol (MF), were used in this study. MF solutions with the fullerol concentration of 10, 50, 100, and 500 mg/L were denoted as MF1, MF2, MF3, and MF4, respectively. Seeds of 'SQ-1', a Chinese landrace accession of a pea, were germinated in two layers of filter paper with 30 mL of each solution in Petri dishes (12 cm in diameter) each solution, and the visual phenotype and radicle lengths of 150 seeds for each treatment were analyzed 72 h after soaking. The radicle lengths were measured using a ruler. Multiple comparisons for each treatment were performed using the SSR-Test method with the software SPSS 20.0 (IBM SPSS Statistics, Armonk, NY, USA).

    Total RNA was extracted from imbibing embryos after 12 h of seed soaking in the W, M, and MF3 solution, respectively, by using Trizol reagent (Invitrogen, Carlsbad, CA, USA). The quality and quantity of the total RNA were measured through electrophoresis on 1% agarose gel and an Agilent 2100 Bioanalyzer respectively (Agilent Technologies, Santa Rosa, USA). The TruSeq RNA Sample Preparation Kit was utilized to construct an RNA-Seq library from 5 µg of total RNA from each sample according to the manufacturer's instruction (Illumina, San Diego, CA, USA). Next-generation sequencing of nine libraries were performed through Novaseq 6000 platform (Illumina, San Diego, CA, USA).

    First of all, by using SeqPrep (https://github.com/jstjohn/SeqPrep) and Sickle (https://github.com/najoshi/sickle) the raw RNA-Seq reads were filtered and trimmed with default parameters. After filtering, high-quality reads were mapped onto the pea reference genome (https://urgi.versailles.inra.fr/Species/Pisum) by using TopHat (V2.1.0)[43]. Using Cufflinks, the number of mapped reads from each sample was determined and normalised to FPKM for each predicted transcript (v2.2.1). Pairwise comparisons were made between W vs M and W vs M+F treatments. The DEGs with a fold change ≥ 1.5 and false discovery rate (FDR) adjusted p-values ≤ 0.05 were identified by using Cuffdiff[44].

    qPCR was performed by using TOROGGreen® qPCR Master Mix (Toroivd, Shanghai, China) on a qTOWER®3 Real-Time PCR detection system (Analytik Jena, Germany). The reactions were performed at 95 °C for 60 s, followed by 42 cycles of 95 °C for 10 s and 60 °C for 30 s. Quantification of relative expression level was achieved by normalization against the transcripts of the housekeeping genes β-tubulin according to Kreplak et al.[35]. The primer sequences for reference and target genes used are listed in Supplemental Table S3.

    The homology-based analysis identifies 41 putative AQPs in the garden pea genome. Among them, all but two genes (Psat0s3550g0040.1, Psat0s2987g0040.1) encode full-length aquaporin-like sequences (Table 1). The conserved protein domain analysis later validated all of the expected AQPs (Supplemental Table S2). To systematically classify these genes and elucidate their relationship with the AQPs from other plants' a phylogenetic tree was created. It clearly showed that the AQPs from pea and its close relative M. truncatula formed four distinct clusters, which represented the different subfamilies of AQPs i.e. TIPs, PIPs, NIPs, and SIPs (Fig. 1a). However, out of the 41 identified pea AQPs, 4 AQPs couldn't be tightly aligned with the Medicago AQPs and thus were put to a new phylogenetic tree constructed with AQPs from rice, Arabidopsis, and soybean. This additional analysis assigned one of the 4 AQPs to the XIP subfamily and the rest three to the TIP or NIP subfamilies (Fig. 1b). Therefore, it is concluded that the 41 PsAQPs comprise 11 PsTIPs, 15 PsNIPs, 9 PsPIPs, 5 PsSIPs, and 1 PsXIP (Table 2). The PsPIPs formed two major subgroups namely PIP1s and PIP2s, which comprise three and six members, respectively (Table 1). The PsTIPs formed two major subgroups TIPs 1 (PsTIP1-1, PsTIP1-3, PsTIP1-4, PsTIP1-7) and TIPs 2 (PsTIP2-1, PsTIP2-2, PsTIP2-3, PsTIP2-6) each having four members (Table 2). Detailed information such as gene/protein names, accession numbers, the length of deduced polypeptides, and protein structural features are presented in Tables 1 & 2

    Table 1.  Description and distribution of aquaporin genes identified in the garden pea genome.
    Chromosome
    S. NoGene NameGene IDGene length
    (bp)
    LocationStartEndTranscription length (bp)CDS length
    (bp)
    Protein length
    (aa)
    1PsPIP1-1Psat5g128840.32507chr5LG3231,127,859231,130,365675675225
    2PsPIP1-2Psat2g034560.11963chr2LG149,355,95849,357,920870870290
    3PsPIP1-4Psat2g182480.11211chr2LG1421,647,518421,648,728864864288
    4PsPIP2-1Psat6g183960.13314chr6LG2369,699,084369,702,397864864288
    5PsPIP2-2-1Psat4g051960.11223chr4LG486,037,44686,038,668585585195
    6PsPIP2-2-2Psat5g279360.22556chr5LG3543,477,849543,480,4042555789263
    7PsPIP2-3Psat7g228600.22331chr7LG7458,647,213458,649,5432330672224
    8PsPIP2-4Psat3g045080.11786chr3LG5100,017,377100,019,162864864288
    9PsPIP2-5Psat0s3550g0040.11709scaffold0355020,92922,63711911191397
    10PsTIP1-1Psat3g040640.12021chr3LG589,426,47389,428,493753753251
    11PsTIP1-3Psat3g184440.12003chr3LG5393,920,756393,922,758759759253
    12PsTIP1-4Psat7g219600.12083chr7LG7441,691,937441,694,019759759253
    13PsTIP1-7Psat6g236600.11880chr6LG2471,659,417471,661,296762762254
    14PsTIP2-1Psat1g005320.11598chr1LG67,864,8107,866,407750750250
    15PsTIP2-2Psat4g198360.11868chr4LG4407,970,525407,972,392750750250
    16PsTIP2-3Psat1g118120.12665chr1LG6230,725,833230,728,497768768256
    17PsTIP2-6Psat2g177040.11658chr2LG1416,640,482416,642,139750750250
    18PsTIP3-2Psat6g054400.11332chr6LG254,878,00354,879,334780780260
    19PsTIP4-1Psat6g037720.21689chr6LG230,753,62430,755,3121688624208
    20PsTIP5-1Psat7g157600.11695chr7LG7299,716,873299,718,567762762254
    21PsNIP1-1Psat1g195040.21864chr1LG6346,593,853346,595,7161863645215
    22PsNIP1-3Psat1g195800.11200chr1LG6347,120,121347,121,335819819273
    23PsNIP1-5Psat7g067480.12365chr7LG7109,420,633109,422,997828828276
    24PsNIP1-6Psat7g067360.12250chr7LG7109,270,462109,272,711813813271
    25PsNIP1-7Psat1g193240.11452chr1LG6344,622,606344,624,057831831277
    26PsNIP2-1-2Psat3g197520.1669chr3LG5420,092,382420,093,050345345115
    27PsNIP2-2-2Psat3g197560.1716chr3LG5420,103,168420,103,883486486162
    28PsNIP3-1Psat2g072000.11414chr2LG1133,902,470133,903,883798798266
    29PsNIP4-1Psat7g126440.11849chr7LG7209,087,362209,089,210828828276
    30PsNIP4-2Psat5g230920.11436chr5LG3463,340,575463,342,010825825275
    31PsNIP5-1Psat6g190560.11563chr6LG2383,057,323383,058,885867867289
    32PsNIP6-1Psat5g304760.45093chr5LG3573,714,868573,719,9605092486162
    33PsNIP6-2Psat7g036680.12186chr7LG761,445,34161,447,134762762254
    34PsNIP6-3Psat7g259640.12339chr7LG7488,047,315488,049,653918918306
    35PsNIP7-1Psat6g134160.24050chr6LG2260,615,019260,619,06840491509503
    36PsSIP1-1Psat3g091120.13513chr3LG5187,012,329187,015,841738738246
    37PsSIP1-2Psat1g096840.13609chr1LG6167,126,599167,130,207744744248
    38PsSIP1-3Psat7g203280.12069chr7LG7401,302,247401,304,315720720240
    39PsSIP2-1-1Psat0s2987g0040.1706scaffold02987177,538178,243621621207
    40PsSIP2-1-2Psat3g082760.13135chr3LG5173,720,100173,723,234720720240
    41PsXIP2-1Psat7g178080.12077chr7LG7335,167,251335,169,327942942314
    bp: base pair, aa: amino acid.
     | Show Table
    DownLoad: CSV
    Figure 1.  Phylogenetic analysis of the identified AQPs from pea genome. (a) The pea AQPs proteins aligned with those from the cool-season legume Medicago truncatual. (b) The four un-assigned pea AQPs in (a) (denoted as NA) were further aligned with the AQPs of rice, soybean, and Arabidopsis by using the Clustal W program implemented in MEGA 7 software. The nomenclature of PsAQPs was based on homology with the identified aquaporins that were clustered together.
    Table 2.  Protein information, conserved amino acid residues, trans-membrane domains, selectivity filter, and predicted subcellular localization of the 39 full-length pea aquaporins.
    S. NoAQPsGeneLengthTMHNPANPAar/R selectivity filterpIWoLF PSORTPlant-mPLoc
    LBLEH2H5LE1LE2
    Plasma membrane intrinsic proteins (PIPs)
    1PsPIP1-1Psat5g128840.32254NPA0F0008.11PlasPlas
    2PsPIP1-2Psat2g034560.12902NPANPAFHTR9.31PlasPlas
    3PsPIP1-4Psat2g182480.12886NPANPAFHTR9.29PlasPlas
    4PsPIP2-1Psat6g183960.12886NPANPAFHT08.74PlasPlas
    5PsPIP2-2-1Psat4g051960.1195300FHTR8.88PlasPlas
    6PsPIP2-2-2Psat5g279360.22635NPANPAFHTR5.71PlasPlas
    7PsPIP2-3Psat7g228600.22244NPA0FF006.92PlasPlas
    8PsPIP2-4Psat3g045080.12886NPANPAFHTR8.29PlasPlas
    Tonoplast intrinsic proteins (TIPs)
    1PsTIP1-1Psat3g040640.12517NPANPAHIAV6.34PlasVacu
    2PsTIP1-3Psat3g184440.12536NPANPAHIAV5.02Plas/VacuVacu
    3PsTIP1-4Psat7g219600.12537NPANPAHIAV4.72VacuVacu
    4PsTIP1-7Psat6g236600.12546NPANPAHIAV5.48Plas/VacuVacu
    5PsTIP2-1Psat1g005320.12506NPANPAHIGR8.08VacuVacu
    6PsTIP2-2Psat4g198360.12506NPANPAHIGR5.94Plas/VacuVacu
    7PsTIP2-3Psat1g118120.12566NPANPAHIAL6.86Plas/VacuVacu
    8PsTIP2-6Psat2g177040.12506NPANPAHIGR4.93VacuVacu
    9PsTIP3-2Psat6g054400.12606NPANPAHIAR7.27Plas/VacuVacu
    10PsTIP4-1Psat6g037720.22086NPANPAHIAR6.29Vac/ plasVacu
    11PsTIP5-1Psat7g157600.12547NPANPANVGC8.2Vacu /plasVacu/Plas
    Nodulin-26 like intrisic proteins (NIPs)
    1PsNIP1-1Psat1g195040.22155NPA0WVF06.71PlasPlas
    2PsNIP1-3Psat1g195800.12735NPANPVWVAR6.77PlasPlas
    3PsNIP1-5Psat7g067480.12766NPANPVWVAN8.98PlasPlas
    4PsNIP1-6Psat7g067360.12716NPANPAWVAR8.65Plas/VacuPlas
    5PsNIP1-7Psat1g193240.12776NPANPAWIAR6.5Plas/VacuPlas
    6PsNIP2-1-2Psat3g197520.11152NPAOG0009.64PlasPlas
    7PsNIP2-2-2Psat3g197560.116230NPA0SGR6.51PlasPlas
    8PsNIP3-1Psat2g072000.12665NPANPASIAR8.59Plas/VacuPlas
    9PsNIP4-1Psat7g126440.12766NPANPAWVAR6.67PlasPlas
    10PsNIP4-2Psat5g230920.12756NPANPAWLAR7.01PlasPlas
    11PsNIP5-1Psat6g190560.12895NPSNPVAIGR7.1PlasPlas
    12PsNIP6-1Psat5g304760.41622NPA0I0009.03PlasPlas
    13PsNIP6-2Psat7g036680.1254000G0005.27ChloPlas/Nucl
    14PsNIP6-3Psat7g259640.13066NPANPVTIGR8.32PlasPlas
    15PsNIP7-1Psat6g134160.25030NLK0WGQR8.5VacuChlo/Nucl
    Small basic intrinsic proteins (SIPs)
    1PsSIP1-1Psat3g091120.12466NPTNPAVLPN9.54PlasPlas/Vacu
    2PsSIP1-2Psat1g096840.12485NTPNPAIVPL9.24VacuPlas/Vacu
    3PsSIP1-3Psat7g203280.12406NPSNPANLPN10.32ChloPlas
    4PsSIP2-1-2Psat3g082760.12404NPLNPAYLGS10.28PlasPlas
    Uncharacterized X intrinsic proteins (XIPs)
    1PsXIP2-1Psat7g178080.13146SPVNPAVVRM7.89PlasPlas
    Length: protein length (aa); pI: Isoelectric point; Trans-membrane helicase (TMH) represents for the numbers of Trans-membrane helices predicted by TMHMM Server v.2.0 tool; WoLF PSORT and Plant-mPLoc: best possible cellualr localization predicted by the WoLF PSORT and Plant-mPLoc tool, respectively (Chlo Chloroplast, Plas Plasma membrane, Vacu Vacuolar membrane, Nucl Nucleus); LB: Loop B, L: Loop E; NPA: Asparagine-Proline-Alanine; H2 represents for Helix 2, H5 represents for Helix 5, LE1 represents for Loop E1, LE2 represents for Loop E2, Ar/R represents for Aromatic/Arginine.
     | Show Table
    DownLoad: CSV

    To understand the genome distribution of the 41 PsAQPs, we mapped these genes onto the seven chromosomes of a pea to retrieve their physical locations (Fig. 2). The greatest number (10) of AQPs were found on chromosome 7, whereas the least (2) on chromosome 4 (Fig. 2 and Table 1). Chromosomes 1 and 6 each contain six aquaporin genes, whereas chromosomes 2, 3, and 5 carry four, seven, and four aquaporin genes, respectively (Fig. 2). The trend of clustered distribution of AQPs was seen on specific chromosomes, particularly near the end of chromosome 7.

    Figure 2.  Chromosomal localization of the 41 PsAQPs on the seven chromosomes of pea. Chr1-7 represents the chromosomes 1 to 7. The numbers on the right of each chromosome show the physical map positions of the AQP genes (Mbp). Blue, green, orange, brown, and black colors represent TIPs, NIPs, PIPs, SIPs, and XIP, respectively.

    The 39 full-length PsAQP proteins have a length of amino acid ranging from 115 to 503 (Table 1) and Isoelectric point (pI) values ranging from 4.72 to 10.35 (Table 2). As a structural signature, transmembrane domains were predicted to exist in all PsAQPs, with the number in individual AQPs varying from 2 to 6. By subfamilies, TIPs harbor the greatest number of TM domains in total, followed by PIPs, NIPs, SIPs, and XIP (Table 2). Exon-intron structure analysis showed that most PsAQPs (16/39) having two introns, while ten members had three, seven members had four, and five members had only one intron (Fig. 3). Overall, PsAQPs exhibited a complex structure with varying intron numbers, positions, and lengths.

    Figure 3.  The exon-intron structures of the AQP genes in pea. Upstream/downstream region, exon, and intron are represented by a blue box, yellow box, and grey line, respectively.

    As aforementioned, generally highly conserved two NPA motifs generate an electrostatic repulsion of protons in AQPs to form the water channel, which is essential for the transport of substrate molecules[15]. In order to comprehend the potential physiological function and substrate specificity of pea aquaporins, NPA motifs (LB, LE) and residues at the ar/R selectivity filter (H2, H5, LE1, and LE2) were examined. (Table 2). We found that all PsTIPs and most PsPIPs had two conserved NPA motifs except for PsPIP1-1, PsPIP2-2-1, and PsPIP2-3, each having a single NPA motif. Among PsNIPs, PsNIP1-6, PsNIP1-6, PsNIP1-7, PsNIP3-1, PsNIP4-1 and PSNIP4-2 had two NPA domains, while PsNIP1-1, PsNIP2-1-2, PsNIP2-2-2 and PsNIP6-1 each had a single NPA motif. In the PsNIP sub-family, the first NPA motif showed an Alanine (A) to Valine (V) substitution in three PsNIPs (PsNIP1-3, PsNIP1-5, and PsNIP6-3) (Table 2). Furthermore, the NPA domains of all members of the XIP and SIP subfamilies were different. The second NPA motif was conserved in PsSIP aquaporins, however, all of the first NPA motifs had Alanine (A) replaced by Leucine (L) (PsSIP2-1-1, PsSIP2-1-2) or Threonine (T) (PsSIP1-1). In comparison to other subfamilies, this motif variation distinguishes water and solute-transporting aquaporins[45].

    Compared to NPA motifs, the ar/R positions were more variable and the amino acid composition appeared to be subfamily-dependent. The majority of PsPIPs had phenylalanine at H2, histidine at H5, threonine at LE1, and arginine at LE2 selective filter (Table 2). All of the PsTIP1 members had a Histidine-Isoleucine-Alanine-Valine structure at this position, while all PsTIP2 members but PsTIP2-3 harbored Histidine-Isoleucine-Glycine-Arginine. Similarly, PsNIPs, PsSIPs and PsXIP also showed subgroup-specific variation in ar/R selectivity filter (Table 2). Each of these substitutions partly determines the function of transporting water[46].

    Sequence-based subcellular localization analysis using WoLF PSORT predicted that all PsPIPs localized in the plasma membrane, which is consistent with their subfamily classification (Table 2). Around half (5/11) of the PsTIPs (PsTIP1-4, PsTIP2-1, PsTIP2-6, PsTIP4-1, and PsTIP5-1) were predicted to localize within vacuoles. However, several TIP members (PsTIP1-1, PsTIP1-3, PsTIP1-7, PsTIP2-2, PsTIP2-3 and PsTIP3-2) were predicted to localize in plasma membranes. We then further investigated their localizations by using another software (Plant-mPLoc, Table 2), which predicted that all the PsTIPs localize within vacuoles, thus supporting that they are tonoplast related. An overwhelming majority of PsNIPs (14/15) and PsXIP were predicted to be found only in plasma membranes., which was also expected (Table 2). Collectively, the versatility in subcellular localization of the pea AQPs is implicative of their distinct roles in controlling water and/or solute transport in the context of plant cell compartmentation.

    Tissue expression patterns of genes are indicative of their functions. Since there were rich resources of RNA-Seq data from various types of pea tissues in the public database, they were used for the extraction of expression information of PsAQP genes as represented by FPKM values. A heat map was generated to show the expression patterns of PsAQP genes in 18 different tissues/stages and their responses to nitrate levels (Fig. 4). According to the heat map, PsPIP1-2, PsPIP2-3 were highly expressed in root and nodule G (Low-nitrate), whereas PsTIP1-4, PsTIP2-6, and PsNIP1-7 were only expressed in roots in comparison to other tissues. The result also demonstrated that PsPIP1-1 and PsNIP3-1 expressed more abundantly in leaf, tendril, and peduncle, whereas PsPIP2-2-2 and PsTIP1-1 showed high to moderate expressions in all the samples except for a few. Interestingly, PsTIP1-1 expression in many green tissues seemed to be oppressed by low-nitrate. In contrast, some AQPs such as PsTIP1-3, PsTIP1-7, PsTIP5-1, PsNIP1-5, PsNIP4-1, PsNIP5-1, and PsSIP2-1-1 showed higher expression only in the flower tissue. There were interesting developmental stage-dependent regulations of some AQPs in seeds (Fig. 4). For example, PsPIP2-1, PsPIP2-2-1, PsNIP1-6, PsSIP1-1, and PsSIP1-2 were more abundantly expressed in the Seed_12 dap (days after pollination;) tissue than in the Seed_5 dai (days after imbibition) tissue; reversely, PsPIP2-2-2, PsPIP2-4, PsTIP2-3, and PsTIP3-2 showed higher expression in seed_5 dai in compare to seed_12 dap tissues (Fig. 4). The AQP genes may have particular functional roles in the growth and development of the pea based on their tissue-specific expression.

    Figure 4.  Heatmap analysis of the expression of pea AQP gene expressions in different tissues using RNA-seq data (PRJNA267198). Normalized expression of aquaporins in terms of reads per kilobase of transcript per million mapped reads (RPKM) showing higher levels of PIPs, NIPs, TIPs SIPs, and XIP expression across the different tissues analyzed. (Stage A represents 7-8 nodes; stage B represents the start of flowering; stage D represents germination, 5 d after imbibition; stage E represents 12 d after pollination; stage F represents 8 d after sowing; stage G represents 18 d after sowing, LN: Low-nitrate; HN: High-nitrate.

    Expressions of plant AQPs in vegetative tissues under normal and stressed conditions have been extensively studied[15]; however, little is known about the transcriptional regulation of AQP genes in seeds/embryos. To provide insights into this specific area, wet-bench RNA-Seq was performed on the germinating embryo samples isolated from water (W)-imbibed seeds and those treated with mannitol (M, an osmotic reagent), mannitol, and mannitol plus fullerol (F, a nano-antioxidant). The phenotypic evaluation showed that M treatment had a substantial inhibitory effect on radicle growth, whereas the supplement of F significantly mitigated this inhibition at all concentrations, in particular, 100 mg/mL in MF3, which increased the radicle length by ~33% as compared to that under solely M treatment (Fig. 5). The expression values of PsAQP genes were removed from the RNA-Seq data, and pairwise comparisons were made within the Group 1: W vs M, and Group 2: W vs MF3, where a total of ten and nince AQPs were identified as differentially expressed genes (DEGs), respectively (Fig. 6). In Group 1, six DEGs were up-regulated and four DEGs down-regulated, whereas in Group 2, six DEGs were up-regulated and three DEGs down-regulated. Four genes viz. PsPIPs2-5, PsNIP6-3, PsTIP2-3, and PsTIP3-2 were found to be similarly regulated by M or MF3 treatment (Fig. 6), indicating that their regulation by osmotic stress couldn't be mitigated by fullerol. Three genes, all being PsNIPs (1-1, 2-1-2, and 4-2), were up-regulated only under mannitol treatment without fullerol, suggesting that their perturbations by osmotic stress were migrated by the antioxidant activities. In contrast, four other genes namely PsTIP2-2, PsTIP4-1, PsNIP1-5, and PsSIP1-3 were only regulated under mannitol treatment when fullerol was present.

    Figure 5.  The visual phenotype and radicle length of pea seeds treated with water (W), 0.3 M mannitol (M), and fullerol of different concentrations dissolved in 0.3 M mannitol (MF). MF1, MF2, MF3, and MF4 indicated fullerol dissolved in 0.3 M mannitol at the concentration of 10, 50, 100, and 500 mg/L, respectively. (a) One hundred and fifty grains of pea seeds each were used for phenotype analysis at 72 h after treatment. Radicle lengths were measured using a ruler in three replicates R1, R2, and R3 in all the treatments. (b) Multiple comparison results determined using the SSR-Test method were shown with lowercase letters to indicate statistical significance (P < 0.05).
    Figure 6.  Venn diagram showing the shared and unique differentially expressed PsAQP genes in imbibing seeds under control (W), Mannitol (M) and Mannitol + Fullerol (MF3) treatments. Up-regulation (UG): PsPIP2-5, PsNIP1-1, PsNIP2-1-2, PsNIP4-2, PsNIP6-3, PsNIP1-5, PsTIP2-2, PsTIP4-1, PsSIP1-3, PsXIP2-1; Down-regulation (DG): PsTIP2-3, PsTIP3-2, PsNIP1-7, PsNIP5-1, PsXIP2-1.

    As a validation of the RNA-Seq data, eight genes showing differential expressions in imbibing seeds under M or M + F treatments were selected for qRT-PCR analysis, which was PsTIP4-1, PsTIP2-2, PsTIP2-3, PsTIP3-2, PsPIP2-5, PsXIP2-1, PsNIP6-3 and PsNIP1-5 shown in Fig 6, the expression modes of all the selected genes but PsXIP2-1 were well consistent between the RNA-Seq and the qRT-PCR data. PsXIP2-1, exhibiting slightly decreased expression under M treatment according to RNA-Seq, was found to be up-regulated under the same treatment by qRT-PCR (Fig. 7). This gene was therefore removed from further discussions.

    Figure 7.  The expression patterns of seven PsAQPs in imbibing seeds as revealed by RNA-Seq and qRT-PCR. The seeds were sampled after 12 h soaking in three different solutions, namely water (W), 0.3 M mannitol (M), and 100 mg/L fullerol dissolved in 0.3 M mannitol (MF3) solution. Error bars are standard errors calculated from three replicates.

    This study used the recently available garden pea genome to perform genome-wide identification of AQPs[35] to help understand their functions in plant growth and development. A total of 39 putative full-length AQPs were found in the garden pea genome, which is very similar to the number of AQPs identified in many other diploid legume crops such as 40 AQPs genes in pigeon pea, chickpea, common bean[7,47,48], and 44 AQPs in Medicago[49]. On the other hand, the number of AQP genes in pea is greater compared to diploid species like rice (34)[4], Arabidopsis thaliana (35)[3], and 32 and 36 in peanut A and B genomes, respectively[8]. Phylogenetic analysis assigned the pea AQPs into all five subfamilies known in plants, whereas the presence of only one XIP in this species seems less than the number in other diploid legumes which have two each in common bean and Medicago[5,48,49]. The functions of the XIP-type AQP will be of particular interest to explore in the future.

    The observed exon-intron structures in pea AQPs were found to be conserved and their phylogenetic distribution often correlated with these structures. Similar exon-intron patterns were seen in PIPs and TIPs subfamily of Arabidopsis, soybean, and tomato[3,6,50]. The two conserved NPA motifs and the four amino acids forming the ar/R SF mostly regulate solute specificity and transport of the substrate across AQPs[47,51]. According to our analysis, all the members of each AQP subfamilies in garden pea showed mostly conserved NPA motifs and a similar ar/R selective filter. Interestingly, most PsPIPs carry double NPA in LB and LE and a hydrophilic ar/R SF (F/H/T/R) as observed in three legumes i.e., common bean[48], soybean[5] chickpea[7], showing their affinity for water transport. All the TIPs of garden pea have double NPA in LB and LE and wide variation at selectivity filters. Most PsTIP1s (1-1, 1-3, 1-4, and 1-7) were found with H-I-A-V ar/R selectivity filter similar to other species such as Medicago, Arachis, and common bean, that are reported to transport water and other small molecules like boron, hydrogen peroxide, urea, and ammonia[52]. Compared with related species, the TIPs residues in the ar/R selectivity filter were very similar to those in common bean[48], Medicago[49], and Arachis[8]. In the present study, the NIPs, NIP1s (1-3, 1-5, 1-6, and1-7), and NIP2-2-2 genes have G-S-G-R selectivity. Interestingly, NIP2s with a G-S-G-R selectivity filter plays an important role in silicon influx (Si) in many plant species such as Soybean and Arachis[6,8]. It was reported that Si accumulation protects plants against various types of biotic and abiotic stresses[53].

    The subcellular localization investigation suggested that most of the PsAQPs were localized to the plasma membrane or vacuolar membrane. The members of the PsPIPs, PsNIPs, and PsXIP subfamilies were mostly located in the plasma membrane, whereas members of the PsTIPs subfamily were often predicted to localize in the vacuolar membrane. Similar situations were reported in many other legumes such as common bean, soybean, and chickpea[5,7,48]. Apart from that, PsSIPs subfamily were predicted to localize to the plasma membrane or vacuolar membrane, and some AQPs were likely to localize in broader subcellular positions such as the nucleus, cytosol, and chloroplast, which indicates that AQPs may be involved in various molecular transport functions.

    AQPs have versatile physiological functions in various plant organs. Analysis of RNA-Seq data showed a moderate to high expression of the PsPIPs in either root or green tissues except for PsPIP2-4, indicating their affinity to water transport. In several other species such as Arachis[8], common bean[48], and Medicago[49], PIPs also were reported to show high expressions and were considered to play an important role to maintain root and leaf hydraulics. Also interestingly, PsTIP2-3 and PsTIP3-2 showed high expressions exclusively in seeds at 5 d after imbibition, indicating their specific roles in seed germination. Earlier, a similar expression pattern for TIP3s was reported in Arabidopsis during the initial phase of seed germination and seed maturation[54], soybean[6], canola[55], and Medicago[49], suggesting that the main role of TIP3s in regulating seed development is conserved across species.

    Carbon nanoparticles such as fullerol have a wide range of potential applications as well as safety concerns in agriculture. Fullerol has been linked to plant protection from oxidative stress by influencing ROS accumulation and activating the antioxidant system in response to drought[56]. The current study revealed that fullerol at an adequate concentration (100 mg/L), had favorable effects on osmotic stress alleviation. In this study, the radical growth of germinating seeds was repressed by the mannitol treatment, and many similar observations have been found in previous studies[57]. Furthermore, mannitol induces ROS accumulation in plants, causing oxidative stress[58]. Our work further validated that the radical growth of germinating seeds were increased during fullerol treatment. Fullerol increased the length of roots and barley seeds, according to Panova et al.[32]. Fullerol resulted in ROS detoxification in seedlings subjected to water stress[32].

    Through transcriptomic profiling and qRT-PCR, several PsAQPs that responded to osmotic stress by mannitol and a combination of mannitol and fullerol were identified. Most of these differentially expressed AQPs belonged to the TIP and NIP subfamilies. (PsTIP2-2, PsTIP2-3, and PsTIP 3-2) showed higher expression by mannitol treatment, which is consistent with the fact that many TIPs in other species such as GmTIP2;3 and Eucalyptus grandis TIP2 (EgTIP2) also showed elevated expressions under osmotic stress[54,59]. The maturation of the vacuolar apparatus is known to be aided by the TIPs, which also enable the best possible water absorption throughout the growth of embryos and the germination of seeds[60]. Here, the higher expression of PsTIP (2-2, 2-3, and 3-2) might help combat water deficiency in imbibing seeds due to osmotic stress. The cellular signals triggering such transcriptional regulation seem to be independent of the antioxidant system because the addition of fullerol didn’t remove such regulation. On the other hand, the mannitol-induced regulation of most PsNIPs were eliminated when fullerol was added, suggesting either a response of these NIPs to the antioxidant signals or being due to the mitigated cellular stress. Based on our experimental data and previous knowledge, we propose that the fullerol-induced up- or down-regulation of specific AQPs belonging to different subfamilies and locating in different subcellular compartments, work coordinatedly with each other, to maintain the water balance and strengthen the tolerance to osmotic stress in germinating pea seeds through reduction of ROS accumulation and enhancement of antioxidant enzyme levels. Uncategorized X intrinsic proteins (XIPs) Aquaporins are multifunctional channels that are accessible to water, metalloids, and ROS.[32,56]. Due likely to PCR bias, the expression data of PsXIP2-1 from qRT-PCR and RNA-Seq analyses didn’t match well, hampering the drawing of a solid conclusion about this gene. Further studies are required to verify and more deeply dissect the functions of each of these PsAQPs in osmotic stress tolerance.

    A total of 39 full-length AQP genes belonging to five sub-families were identified from the pea genome and characterized for their sequences, phylogenetic relationships, gene structures, subcellular localization, and expression profiles. The number of AQP genes in pea is similar to that in related diploid legume species. The RNA-seq data revealed that PsTIP (2-3, 3-2) showed high expression in seeds for 5 d after imbibition, indicating their possible role during the initial phase of seed germination. Furthermore, gene expression profiles displayed that higher expression of PsTIP (2-3, 3-2) in germinating seeds might help maintain water balance under osmotic stress to confer tolerance. Our results suggests that the biological functions of fullerol in plant cells are exerted partly through the interaction with AQPs.

    Under Bio project ID PRJNA793376 at the National Center for Biotechnology Information, raw data of sequencing read has been submitted. The accession numbers for the RNA-seq raw data are stored in GenBank and are mentioned in Supplemental Table S4.

    This study is supported by the National Key Research & Development Program of China (2022YFE0198000) and the Key Research Program of Zhejiang Province (2021C02041).

  • Pei Xu is the Editorial Board member of journal Vegetable Research. He was blinded from reviewing or making decisions on the manuscript. The article was subject to the journal's standard procedures, with peer-review handled independently of this Editorial Board member and his research group.

  • Supplemental Table S1 Names and descriptions of five finger lime cultivars based on the colour of skin and juice vesicles.
    Supplemental Table S2 The collection sites, geographical locations, characteristics and uses of the citrus species used in this study.
    Supplemental Table S3 List of single copy nuclear genes used for nuclear gene analysis.
    Supplemental Table S4 Parameters used to get the complete chloroplast genomes from GetOrganelle.
    Supplemental Fig. S1 Phylogenetic tree generated from 86 nuclear genes sequences of 29 citrus samples (species/cultivars) with Poncirus trifoliata as the outgroup. The MrBayes tree was generated in Geneious. Posterior probability values are given on each node.
    Supplemental Fig. S2 Chloroplast genome map of citrus species. All the species showed the typical quadripartite structure of the chloroplast genome. The genes belonging to different functional groups are shown in different colours. The thicker black lines indicate the extent of the IR regions separating the LSC and SSC regions. Genes inside the circle are transcribed in clockwise direction whereas the genes outside the circle are transcribed in counter-clockwise direction. LSC: Large Single-Copy, SSC: Small Single-Copy, IR: Inverted Repeat regions.
    Supplemental Fig. S3 Phylogenetic tree generated from complete chloroplast genome sequences of 29 citrus samples (species/cultivars) with Poncirus trifoliata as the outgroup. The MrBayes tree generated in Geneious. Posterior probability values are given on each node. * SRA data obtained from National Centre for Biotechnology Information for chloroplast genome assembly. Chloroplast genome for P. trifoliata which was assembled by GetOrganelle toolkit was obtained from (He et al., 2020).
    Supplemental Fig. S4 The morphological variations of the leaves and fruit of Citrus garrawayi and Citrus sp. Unknown. (a) The difference of the leaves of the two accessions. C. garrawayi is on the left and C. sp. Unknown is on the right. C. garrawayi has lanceolate to obovate leaves and C. sp. Unknown has ovate to obovate leaves (b) The inner and outer appearance of the fruit of C. sp. Unknown. (c) Variation in fruit size and shape of C. garrawayi (top) and C. sp. Unknown (bottom) The fruit of C. sp. Unknown are not as long as C. garrawayi. The juice vesicles and the taste of the fruit are different between C. garrawayi and C. sp Unknown. They both have angular vesicles than C. australasica, however, those of C. sp Unknown are more like C. australis. The taste of the C. sp Unknown fruit is more like green apple (which C. garrawayi can have), however, it is less acidic than C. garrawayi.
  • [1]

    Spiegel-Roy P, Goldschmidt EE. 1996. The biology of citrus. New York, USA: Cambridge university press. pp. 19.

    [2]

    Bayer RJ, Mabberley DJ, Morton C, Miller CH, Sharma IK, et al. 2009. A molecular phylogeny of the orange subfamily (Rutaceae: Aurantioideae) using nine cpDNA sequences. American Journal of Botany 96:668−85

    doi: 10.3732/ajb.0800341

    CrossRef   Google Scholar

    [3]

    Wu GA, Terol J, Ibanez V, López-García A, Pérez-Román E, et al. 2018. Genomics of the origin and evolution of Citrus. Nature 554:311−16

    doi: 10.1038/nature25447

    CrossRef   Google Scholar

    [4]

    Zhong G, Nicolosi E. 2020. Citrus origin, diffusion, and economic importance. In The Citrus Genome, ed. Gentile A, La Malfa S, Deng Z. Switzerland: Springer Cham. pp. 5-21. https://doi.org/10.1007/978-3-030-15308-3_2

    [5]

    Carbonell-Caballero J, Alonso R, Ibañez V, Terol J, Talon M, et al. 2015. A phylogenetic analysis of 34 chloroplast genomes elucidates the relationships between wild and domestic species within the genus Citrus. Molecular Biology and Evolution 32:2015−35

    doi: 10.1093/molbev/msv082

    CrossRef   Google Scholar

    [6]

    Swingle W. 1943. The botany of citrus and its wild relatives of the orange family. In The citrus industry, ed. H Webber. Berkeley and Los Angeles: University of California Press. pp. 129–474.

    [7]

    Alquézar B, Carmona L, Bennici S, Peña L. 2021. Engineering of citrus to obtain huanglongbing resistance. Current Opinion in Biotechnology 70:196−203

    doi: 10.1016/j.copbio.2021.06.003

    CrossRef   Google Scholar

    [8]

    Weber KC, Mahmoud LM, Stanton D, Welker S, Qiu W, et al. 2022. Insights into the mechanism of Huanglongbing tolerance in the Australian finger lime (Citrus australasica). Frontiers in plant science 13:1019295

    doi: 10.3389/fpls.2022.1019295

    CrossRef   Google Scholar

    [9]

    Huang CY, Araujo K, Sánchez JN, Kund G, Trumble J, et al. 2021. A stable antimicrobial peptide with dual functions of treating and preventing citrus Huanglongbing. Proceedings of the National Academy of Sciences of the United States of America 118:e2019628118

    doi: 10.1073/pnas.2019628118

    CrossRef   Google Scholar

    [10]

    Nakandala U, Masouleh AK, Smith MW, Furtado A, Mason P, et al. 2023. Haplotype resolved chromosome level genome assembly of Citrus australis reveals disease resistance and other citrus specific genes. Horticulture Research 10:uhad058

    doi: 10.1093/hr/uhad058

    CrossRef   Google Scholar

    [11]

    Delort E, Yuan YM. 2018. Finger lime/The Australian Caviar—Citrus australasica. In Exotic Fruits, eds. Rodrigues S, de Oliveira Silva E, de Brito ES. Cambridge: Academic Pres. pp. 203-10. https://doi.org/10.1016/b978-0-12-803138-4.00025-3

    [12]

    Ashmore SE. 2015. Wild citrus in Oceania: harnessing the diversity. Acta Horticulturae 1101:191−98

    doi: 10.17660/ActaHortic.2015.1101.29

    CrossRef   Google Scholar

    [13]

    Bani Hashemian S, Barbosa C, Serra P, Duran-Vila N. 2010. Effects of resistance of Eremocitrus glauca and Microcitrus australis to viroid infection: replication, accumulation and long-distance movement of six citrus viroids. Plant Pathology 59:413−21

    doi: 10.1111/j.1365-3059.2009.02234.x

    CrossRef   Google Scholar

    [14]

    Li Y, Zhang Z, Yang J, Lv G. 2018. Complete chloroplast genome of seven Fritillaria species, variable DNA markers identification and phylogenetic relationships within the genus. PLoS ONE 13:e0194613

    doi: 10.1371/journal.pone.0194613

    CrossRef   Google Scholar

    [15]

    Gulsen O, Roose ML. 2001. Chloroplast and nuclear genome analysis of the parentage of lemons. Journal of the American Society for Horticultural Science 126:210−15

    doi: 10.21273/JASHS.126.2.210

    CrossRef   Google Scholar

    [16]

    Feng Y, Gao XF, Zhang JY, Jiang LS, Li X, et al. 2022. Complete Chloroplast Genomes Provide Insights Into Evolution and Phylogeny of Campylotropis (Fabaceae). Frontiers in Plant Science 13:895543

    doi: 10.3389/fpls.2022.895543

    CrossRef   Google Scholar

    [17]

    Lian C, Yang H, Lan J, Zhang X, Zhang F, et al. 2022. Comparative analysis of chloroplast genomes reveals phylogenetic relationships and intraspecific variation in the medicinal plant Isodon rubescens. PLoS ONE 17:e0266546

    doi: 10.1371/journal.pone.0266546

    CrossRef   Google Scholar

    [18]

    Small RL, Cronn RC, Wendel JF. 2004. Use of nuclear genes for phylogeny reconstruction in plants. Australian Systematic Botany 17:145−70

    doi: 10.1071/SB03015

    CrossRef   Google Scholar

    [19]

    Daniell H, Lin CS, Yu M, Chang WJ. 2016. Chloroplast genomes: diversity, evolution, and applications in genetic engineering. Genome Biology 17:134

    doi: 10.1186/s13059-016-1004-2

    CrossRef   Google Scholar

    [20]

    Shi W, Song W, Liu J, Shi C, Wang S. 2023. Comparative chloroplast genome analysis of Citrus (Rutaceae) species: Insights into genomic characterization, phylogenetic relationships, and discrimination of subgenera. Scientia Horticulturae 313:111909

    doi: 10.1016/j.scienta.2023.111909

    CrossRef   Google Scholar

    [21]

    Bausher MG, Singh ND, Lee SB, Jansen RK, Daniell H. 2006. The complete chloroplast genome sequence of Citrus sinensis (L.) Osbeck var'Ridge Pineapple':organization and phylogenetic relationships to other angiosperms. BMC Plant Biology 6:21

    doi: 10.1186/1471-2229-6-21

    CrossRef   Google Scholar

    [22]

    Lin H, Li X, Bai D. 2020. Assembly and phylogenetic analysis of the complete chloroplast genome of Citrus aurantium (Rutaceae). Mitochondrial DNA Part B, Resources 5:2250−51

    doi: 10.1080/23802359.2020.1771228

    CrossRef   Google Scholar

    [23]

    Sun C, Lin H. 2021. The complete chloroplast genome and phylogenetic analysis of Citrus clementina (Rutaceae). Mitochondrial DNA Part B, Resources 6:2926−27

    doi: 10.1080/23802359.2021.1972860

    CrossRef   Google Scholar

    [24]

    Zhang F, Bai D. 2020. The complete chloroplast genome of Citrus medica (Rutaceae). Mitochondrial DNA Part B 5:1627−29

    doi: 10.1080/23802359.2020.1745108

    CrossRef   Google Scholar

    [25]

    Wang B, Zhang Y, Wei P, Sun M, Ma X, et al. 2014. Identification of nuclear low-copy genes and their phylogenetic utility in rosids. Genome 57:547−54

    doi: 10.1139/gen-2014-0138

    CrossRef   Google Scholar

    [26]

    Li Z, De La Torre AR, Sterck L, Cánovas FM, Avila C, et al. 2017. Single-copy genes as molecular markers for phylogenomic studies in seed plants. Genome Biology and Evolution 9:1130−47

    doi: 10.1093/gbe/evx070

    CrossRef   Google Scholar

    [27]

    Ramadugu C, Pfeil BE, Keremane ML, Lee RF, Maureira-Butler IJ, Roose ML. 2013. A six nuclear gene phylogeny of Citrus (Rutaceae) taking into account hybridization and lineage sorting. PloS one 8:e68410

    doi: 10.1371/journal.pone.0068410

    CrossRef   Google Scholar

    [28]

    Garcia-Lor A, Curk F, Snoussi-Trifa H, Morillon R, Ancillo G, et al. 2013. A nuclear phylogenetic analysis: SNPs, indels and SSRs deliver new insights into the relationships in the ‘true citrus fruit trees’ group (Citrinae, Rutaceae) and the origin of cultivated species. Annals of Botany 111:1−19

    doi: 10.1093/aob/mcs227

    CrossRef   Google Scholar

    [29]

    Jeong H, Yun YB, Jeong SY, Cho Y, Kim S. 2022. Identification of Putative Parental Species of Yuzu (Citrus junos Sieb. Ex Tanaka) by Comparative Analyses of Variations in Chloroplast Genomes and Nuclear Single-copy Genes of Citrus. Horticultural Science and Technology 40:420−31

    doi: 10.7235/hort.20220038

    CrossRef   Google Scholar

    [30]

    Wang X, Xu Y, Zhang S, Cao L, Huang Y, et al. 2017. Genomic analyses of primitive, wild and cultivated citrus provide insights into asexual reproduction. Nature Genetics 49:765−72

    doi: 10.1038/ng.3839

    CrossRef   Google Scholar

    [31]

    Mabberley DJ. 2022. A classification for edible citrus: an update, with a note on Murraya (Rutaceae). Telopea 25:271−84

    doi: 10.7751/telopea15954

    CrossRef   Google Scholar

    [32]

    Furtado A. 2014. DNA extraction from vegetative tissue for next-generation sequencing. In Cereal Genomics, eds. Henry RJ, Furtado A. Totowa, NJ: Humana Press. pp. 1−5. https://doi.org/10.1007/978-1-62703-715-0_1

    [33]

    Jin JJ, Yu WB, Yang JB, Song Y, DePamphilis CW, et al. 2020. GetOrganelle: a fast and versatile toolkit for accurate de novo assembly of organelle genomes. Genome Biology 21:241

    doi: 10.1186/s13059-020-02154-5

    CrossRef   Google Scholar

    [34]

    He SL, Tian Y, Yang Y, Shi CY. 2020. Chloroplast genome and phylogenetic analyses of Poncirus trifoliata (Rutaceae). Mitochondrial DNA Part B, Resources 5:2205−06

    doi: 10.1080/23802359.2019.1687023

    CrossRef   Google Scholar

    [35]

    Tillich M, Lehwark P, Pellizzer T, Ulbricht-Jones ES, Fischer A, et al. 2017. GeSeq – versatile and accurate annotation of organelle genomes. Nucleic Acids Research 45:W6−W11

    doi: 10.1093/nar/gkx391

    CrossRef   Google Scholar

    [36]

    Katoh K, Misawa K, Kuma Ki, Miyata T. 2002. MAFFT: a novel method for rapid multiple sequence alignment based on fast Fourier transform. Nucleic Acids Research 30:3059−66

    doi: 10.1093/nar/gkf436

    CrossRef   Google Scholar

    [37]

    Silvestro D, Michalak I. 2012. raxmlGUI: a graphical front-end for RAxML. Organisms Diversity & Evolution 12:335−37

    doi: 10.1007/s13127-011-0056-0

    CrossRef   Google Scholar

    [38]

    Ronquist F, Teslenko M, Van Der Mark P, Ayres DL, Darling A, et al. 2012. MrBayes 3.2: efficient Bayesian phylogenetic inference and model choice across a large model space. Systematic Biology 61:539−42

    doi: 10.1093/sysbio/sys029

    CrossRef   Google Scholar

    [39]

    Letunic I, Bork P. 2019. Interactive Tree Of Life (iTOL) v4: recent updates and new developments. Nucleic acids research 47:W256−W259

    doi: 10.1093/nar/gkz239

    CrossRef   Google Scholar

    [40]

    Nge FJ, Biffin E, Thiele KR, Waycott M. 2021. Reticulate evolution, ancient chloroplast haplotypes, and rapid radiation of the Australian plant genus Adenanthos (Proteaceae). Frontiers in Ecology and Evolution 8:616741

    doi: 10.3389/fevo.2020.616741

    CrossRef   Google Scholar

    [41]

    Acosta MC, Premoli AC. 2010. Evidence of chloroplast capture in south American Nothofagus (subgenus Nothofagus, Nothofagaceae). Molecular Phylogenetics and Evolution 54:235−42

    doi: 10.1016/j.ympev.2009.08.008

    CrossRef   Google Scholar

    [42]

    Hamilton KN, Ashmore SE, Drew RA. 2005. Development of conservation strategies for Citrus species of importance to Australia. Acta Horticulturae 694:111−15

    doi: 10.17660/actahortic.2005.694.15

    CrossRef   Google Scholar

    [43]

    Langgut D. 2017. The history of Citrus medica (citron) in the Near East: Botanical remains and ancient art and texts. In Archaeology and history of citrus fruit in the Mediterranean: acclimatization, diversifications, uses, eds. Zech-Matterne V, Fiorentino G. Naples:Publications du Centre Jean Bérard. pp. 84−94. https://doi.org/10.4000/books.pcjb.2184

    [44]

    Hirota SK, Yasumoto AA, Nitta K, Tagane M, Miki N, et al. 2021. Evolutionary history of Hemerocallis in Japan inferred from chloroplast and nuclear phylogenies and levels of interspecific gene flow. Molecular Phylogenetics and Evolution 164:107264

    doi: 10.1016/j.ympev.2021.107264

    CrossRef   Google Scholar

    [45]

    Kawabe A, Nukii H, Furihata HY. 2018. Exploring the history of chloroplast capture in Arabis using whole chloroplast genome sequencing. International Journal of Molecular Sciences 19:602

    doi: 10.3390/ijms19020602

    CrossRef   Google Scholar

    [46]

    Lu Z, Zhou Z, Xie R. 2011. Molecular phylogeny of the "true citrus fruit trees" group (Aurantioideae, Rutaceae) as inferred from chloroplast DNA sequence. Agricultural Sciences in China 10:49−57

    doi: 10.1016/S1671-2927(11)60306-4

    CrossRef   Google Scholar

  • Cite this article

    Nakandala U, Furtado A, Smith MW, Williams DC, Henry RJ. 2023. Phylogenetic relationships among Australian native citrus species based upon complete chloroplast genomes and single copy nuclear genes. Tropical Plants 2:21 doi: 10.48130/TP-2023-0021
    Nakandala U, Furtado A, Smith MW, Williams DC, Henry RJ. 2023. Phylogenetic relationships among Australian native citrus species based upon complete chloroplast genomes and single copy nuclear genes. Tropical Plants 2:21 doi: 10.48130/TP-2023-0021

Figures(2)  /  Tables(1)

Article Metrics

Article views(4176) PDF downloads(692)

ARTICLE   Open Access    

Phylogenetic relationships among Australian native citrus species based upon complete chloroplast genomes and single copy nuclear genes

Tropical Plants  2 Article number: 21  (2023)  |  Cite this article

Abstract: Citrus is widely consumed across the world as a fruit crop. Despite many citrus species being extensively studied around the world, phylogenetic relationships among Australian native species remain unresolved. Here we present the phylogenetic relationships among six Australian native species, two domesticated citrus cultivars of commercial importance in Australia, and another 13 accessions cultivated internationally based on complete, de novo assembled chloroplast genomes and 86 single copy nuclear genes. The chloroplast and nuclear phylogenies were topologically different. The Australian species formed a monophyletic clade based on their nuclear genes. The nuclear phylogeny revealed a close relationship between Citrus inodora and Citrus australasica. These two species were distinct from the other four Australian limes that were more closely related to each other. Citrus australasica had a unique chloroplast which was distinct from all other Australian limes. Among the other Australian limes, Citrus glauca was the most distinct species based on nuclear genes, however, it had a similar chloroplast sequence to C. australis. The undetermined Citrus sp. was more closely related to Citrus garrawayi, indicating that it is a distinct form of Citrus garrawayi. Citrus medica, had a chloroplast similar to Australian species. However, the nuclear gene phylogeny analysis revealed that C. medica was more closely related to Asian citrus species. This study improves our understanding of phylogenetic relationships among Australian citrus species and confirms their unique status within the genus since it formed a monophyletic clade which was clearly separated from the other non-Australian species.

    • Citrus belongs to the family Rutaceae and subfamily Aurantioideae. The Aurantioideae subfamily is composed of 33 genera and 203 species[1]. The genus citrus has been described as comprising of 1−162 species in different classification systems[2]. Citrus is naturally distributed in a vast area covering the regions of Southeast Asia and Australia[3,4]. The progenitor species of Australian limes are thought to be derived from Southeast Asia and migrated to Australia where they evolved and diversified during the early Pliocene around 4 Ma[3]. The derivation of Australian citrus from Southeast Asia might have resulted from cross-oceanic dispersal by birds or ocean currents when the water level was very low between the two continents[4]. Phylogenies based on complete chloroplast genomes reveal two speciation events in history, one separating Australian citrus and citrons from all other citrus species 8.1 Ma, and a further divergence between Australian citrus and citrons at a later date[5]. There are six citrus species which are endemic to Australia. The evolution of these citrus has resulted in some species with adaptations to tropical rainforests (previously classified as Microcitrus (F.Muell.) Swingle) and one species adapted to semi-desert conditions (previously classified as Eremocitrus (Lindlay) Swingle. The geographical isolation of Australian species from all other citrus and the diversity of edaphic and climatic environments has resulted in them displaying very distinctive characteristics[4,6].

      Australian native limes, including Citrus australasica F.Muell (Australian finger lime), C. australis (Mudie) Planchon (Gympie lime), C. glauca (Lindlay) Burkill (Desert lime), C. inodora F.M. Bailey (Russell River lime) and their hybrids have shown useful levels of resistance to Huanglongbing (HLB), a disease which continues to be highly detrimental to citrus production in many parts of the world[7]. Studies with C. australasica have revealed many genes involved in immune related signalling pathways and the regeneration of cell wall and phloem which provides HLB resistance and a fast recovery from infection[8,9]. Furthermore, recent genomic approaches using C. australis have led to the identification of defence related genes with possible involvement in HLB resistance[10]. Aside from disease resistance, the wide morphological and fruit compositional differences between C. australasica accessions has led to their use in breeding[11]. Fruits of C. australasica and hybrids with this species are popular as commercial foods due to their unique appearance and taste, whilst the tree itself has significant ornamental appeal[11]. C. glauca is another important candidate for use in citrus breeding, showing important characteristics such as tolerance to drought, salt, nematodes and viroids[12,13]. These traits make the Australian citrus species important genetic resources in citrus breeding. A better understanding of the genetic relationships of these species may facilitate improved utilization in rootstock and scion breeding programs.

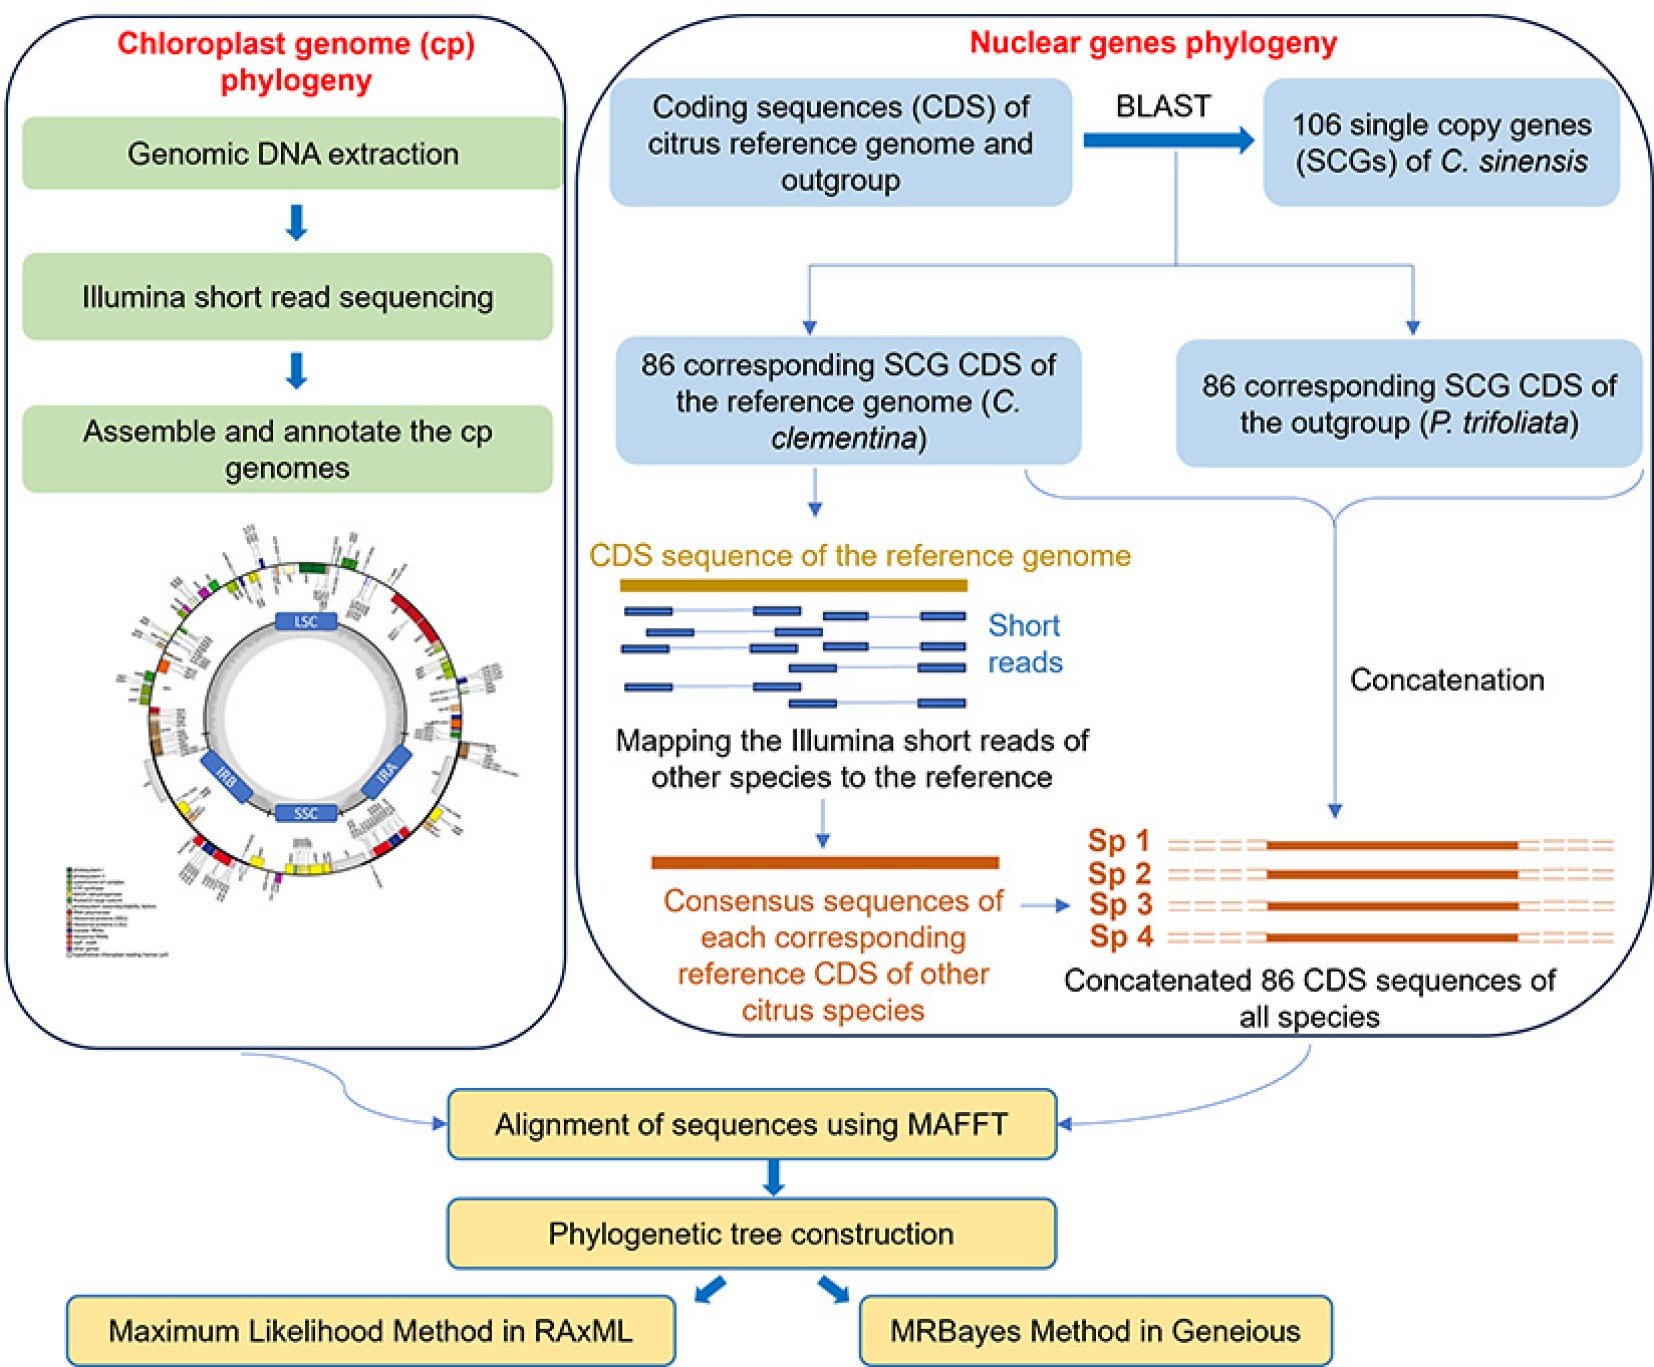
      The chloroplast genome is a highly conserved structure among angiosperms with the four main components in the most common quadripartite structure: a large single copy (LSC) region, a small single copy (SSC) region, and two inverted repeat (IR) regions[14]. Chloroplasts are primarily maternally inherited units in plants (biparental and paternal inheritance are also known) with a highly conserved structure in terms of gene content, gene sequence and order. They have a simple structure, small size, high copy number, lack of recombination and low nucleotide substitution rates thus making them the primary source for determination of maternal parentage, and the evolutionary relationships among species[1518]. Complete chloroplast genome sequences provide overwhelmingly more accurate information about chloroplast evolutionary relationships than a selected few chloroplast DNA sequences, especially between closely related species[19]. An extensive number of chloroplast genomes of different citrus species have been assembled and annotated using short read technology and thus have been used in phylogenies to decipher the relationships, discriminate taxa between and/or within genera/species and to redefine taxonomic boundaries[3,2024].

      Nuclear genomes have higher evolutionary rates than mitochondrial and chloroplast genomes. Consequently, they encompass larger variation within a unit of sequence than in uniparental genomes, which is of great importance in achieving better resolved phylogenies, particularly at low taxonomic levels. The evolutionary independence and biparental inheritance of low copy nuclear genes make them particularly useful in the accurate assessment of taxa[18,25]. Numerous single copy genes have been used to better understand the relationships among species[26]. Polymorphisms in nuclear loci have been used to infer the relationships among citrus taxa using six nuclear genes[27], 27 nuclear genes[28], 80 single copy nuclear genes[29] and 103 single copy genes[30] in previous studies.

      Although there are a growing number of phylogenetic studies for citrus, there are few which have detailed the evolutionary relationships among Australian citrus species with respect to other widely cultivated citrus species. Three Australian taxa (C. australis, C. australasica and C. glauca) were included in an evolutionary and phylogenetic assessment based on complete chloroplast genome sequences[5], polymorphic cp DNA markers[15], and polymorphisms in non-genic and non-pericentromeric genomic regions[3]. The only known molecular phylogeny study involving all six Australian endemic citrus is that of Rich (2004 unpublished) in which ten additional citrus species were compared using three introns and intergenic spacer regions . However, the deduced evolutionary relationships among Australian wild taxa in previous studies have limitations due to the use of a small number of taxa and/or phylogenies based on single copy genes and partial cp DNA sequences.

      The objective of this study was to better understand the relationships among all six Australian endemic citrus species (C. australasica, C. australis, C. garrawayi F.M. Bailey, C. glauca, C. gracilis Mabb., and C. inodora), and how the other 13 main cultivated citrus [C. × aurantifolia (Christm.) Swingle, C. × aurantium L., C. cavaleriei H.Lév. ex Cavalerie, C. × clementina hort. ex Tanaka (Mabberly[31] suggests this should be included under C. × aurantium), C. × limon (L.) Burm. f., C. × limonia Osbeck (This is considered as C. × otaitensis based on recent revisions by Mabberley[31]), C. maxima (Burm.) Merr., C. medica L., C. micrantha Wester (This is considered as C. hystrix based on recent revisions by Mabberley[31]), C. reshni hort. ex Tanaka (Plants of the world online (POWO) suggests this should be included under C. × aurantium), C. reticulata Blanco, Fortunella hindsii (C. hindsii) (POWO suggests this is a synonym of C. japonica), and Poncirus trifoliata a (L.) Raf (C. trifoliata)] are related to Australian citrus based on both complete chloroplast genomes and 86 single copy nuclear genes. Another objective was to infer the relationships between an unknown citrus accession which was collected from Cape York Peninsula (Citrus sp.) and the other Australian citrus species. The results were used to assess the congruence between the chloroplast and nuclear phylogenies and the previous relationships among Australian taxa with the results derived from this study. Improved understanding of genetic relatedness may help explain the evolutionary drivers that have created such a unique clade of citrus species on the Australian continent.

    • Leaf samples of six native citrus species [five cultivars of C. australasica (cultivar names and their descriptions are given in Supplemental Table S1), C. australis, C. garrawayi, C. glauca, C. gracilis, C.inodora), two commercial mandarin cultivars (C. reticulata admixtures); Murcott and Ellendale and three seedlings of C. sp. Unknown (similar to, but morphologically distinct from C. garrawayi) were collected under dry ice for DNA extraction. The characteristics, geographical location and potential uses of the species/cultivars are indicated in the Supplemental Table S2. Materials of C. inodora, C. australasica, C. glauca, and three seedlings of the C. sp. were collected from Herbalistics Pty Ltd private orchard located in Maroochy River, Queensland, Australia. Leaves of C. garrawayi and C. australis were collected from plants maintained at the Glasshouse, University of Queensland, Australia. Leaf material of the two mandarin cultivars was obtained from the arboretum, Department of Agriculture and Fisheries (DAF), Bundaberg, Queensland, Australia. C. gracilis was obtained from Litchfield, South of Darwin, Northern Territory, Australia.

    • Total genomic DNA was extracted from pulverized leaf tissues using CTAB (cetyltrimethyl ammonium bromide) DNA extraction protocol[32]. The quality of DNA was evaluated using nanodrop spectrophotometer with A260/280 and A260/230 absorbance ratios and by agarose gel electrophoresis. The concentrations of genomic DNA were measured by SYBR-safe fluorescence in gel electrophoresis compared to lambda DNA concentration standards. A ratio of 1.8–2.0 for A260/280 and a ratio of 2–2.2 for A260/230 were considered pure for DNA. No shearing indicated high quality genomic DNA. DNA of C. australis, C. garrawayi, C. glauca, C. sp., Murcott, and Ellendale were sequenced at the Ramaciotti Centre, University of New South Wales, NSW, Australia, and C. australasica, C. inodora and C. gracilis species were sequenced at Australian Genome Research Facility (AGRF), Melbourne, Australia.

    • Coding sequences (CDS) were extracted for C. clementina from the Citrus Genome database (www.citrusgenomedb.org) and were subjected to BLAST against 106 single copy genes, which were previously identified from C. sinensis[26] (Supplemental Table S3) to extract the corresponding CDS in CLC Genomics Workbench v23,0.4 (Qiagen, USA). CDS of the outgroup P. trifoliata were subjected to BLAST independently to get the corresponding CDS of P. trifoliata. The BLAST hits were manually checked to select only the single copy genes in C. clementina and P. trifoliata genomes with correct protein description with respect to C. sinensis. The same 86 CDS were selected from the reference species (C. clementina) and the outgroup (P. trifoliata). Then the paired end Illumina reads trimmed using 0.01 quality threshold of all the samples were independently mapped to all the CDS of C. clementina using the mapping setting LF (Length fraction) 0.5 and SF (similarity fraction) 0.8. in CLC Genomics Workbench v23,0.4 (Qiagen, USA). Mapping consensus sequences for 86 CDS of each species were extracted and joined independently to form one concatenated sequence per each species and the concatenated nuclear genes were used in the phylogeny.

    • Raw Illumina paired-end reads were imported to CLC Genomics Workbench v23,0.4 (Qiagen, USA) and trimmed at 0.01 quality limit. A subset (3–4 GB) of quality trimmed Illumina reads were subjected to de novo chloroplast (cp) genome assembly using GetOrganelle toolkit v.1.7.5[33]. The parameters used for GetOrganelle assembly are given in Supplemental Table S4. For C. australis, the individual scaffolds obtained from GetOrganelle were imported to Clone Manager and were aligned with a reference cp genome (C. aurantium) to get the final complete cp genome. The cp genome of P. trifoliata which has previously been assembled by GetOrganelle toolkit[34] was used for our phylogenetic analysis. In addition, 12 other citrus species were obtained from the SRA database, NCBI (www.ncbi.nlm.nih.gov/sra) (Supplemental Table S2), and quality trimmed at the 0.01 quality limit. Subsequently, a subset of the trimmed sequences was assembled using the GetOrganelle toolkit.

      The assembled cp genomes were annotated by Geseq tool using the reference genome; C. aurantium (https://chlorobox.mpimp-golm.mpg.de/geseq.html)[35] with the following settings: Annotation-BLAT search annotation with plastid IR, annotate plastid trans-spliced rps12, protein search identity – 25, rRNA, tRNA, DNA search identity – 85, HMMER profile search –chloroplast land plants (CDS + rRNA), 3rd party tRNA annotators – ARAGORN v1.2.38, tRNAscan-SE v2.0.7, BLAT reference sequence: MPI-MP reference set – chloroplast land plants (CDS + rRNA), 3rd Party Stand-Alone Annotators – Chloë v0.1.0 (CDS + tRNA + rRNA).

      Chloroplast genome sequences were imported to Geneious prime V2021.2, Biomatters Ltd (www.geneious.com) to perform the variant analysis. Two sequences to be compared were subjected to pairwise alignment using MAFFT alignment tool[36] in Geneious prime V2021.2, Biomatters Ltd with default parameters. The species within one subclade were mapped against another species within the same sub clade to identify the total number of variations in terms of SNPs (transitions and transversions), insertions and deletions existing among them.

    • The phylogenetic relationships among the species were inferred from the assembled complete chloroplast genomes and 86 nuclear genes. Complete chloroplast genome sequences and 86 concatenated nuclear genes were independently subjected to multiple sequence alignment using the multiple alignment with fast Fourier transform (MAFFT) alignment in Geneious prime V2021.2, Biomatters Ltd with default parameters. Maximum likelihood (ML) tree construction was performed using RAxML (Randomized Axelerated Maximum Likelihood) method employing generalized time reversible (GTR) GAMMA nucleotide substitutional model[37]. A rapid bootstrap analysis and a search for a best-scoring ML tree was performed with 1,000 bootstrap replicates. MrBayes v. 3.2[38] was performed with GTR substitution model, gamma rate variation and other default parameters in Geneious prime V2021.2, Biomatters Ltd [MCMC settings (Chain length: 1,100,000, Heated Chains: 4, Heated Chain: Temp 0.2, subsampling Freq: 200, Burn-in Length: 100,000, Random seed: 16,907)]. The final tree outputs were further modified in iTOL version 6.5.2[39].

    • The phylogeny based on 86 single copy nuclear genes derived from MrBayes (Supplemental Fig. S1) and RAxML methods (Fig. 1) were congruent. The posterior probability values were high for all the nodes (1/0.99) indicating high supports for all the relationships. The ML tree (Fig. 1) revealed two major clusters separating Australian wild limes from the rest of the citrus cultivars. The Australian clade (Clade I) had two distinct sub-clades in which C. inodora was more closely related to C. australasica (sub-clade A) and the other citrus species were grouped into another sub-clade (sub-clade B). In sub-clade A, the grouping of C. inodora with C. australasica had highly significant node support. Within this sub-clade, C. australasica cv 5 and cv 3 were more closely related to each other than with the other four cultivars of C. australasica. C. australasica cv 4 was more closely related to C. australasica cv 1 and that sister group was nested with C. australasica cv 2 revealing their close relationships. The relationships within C. australasica were well supported by high bootstrap values (Fig. 1). Within the sub-clade B, C. glauca was the most distantly related species and the grouping of C. glauca with other native limes had reasonably high node support. C. gracilis is the next most distant in this sub-clade containing C. australis, C. garrawayi and C. sp., C. garrawayi was closely related to C. sp. with high bootstrap support (Fig. 1).
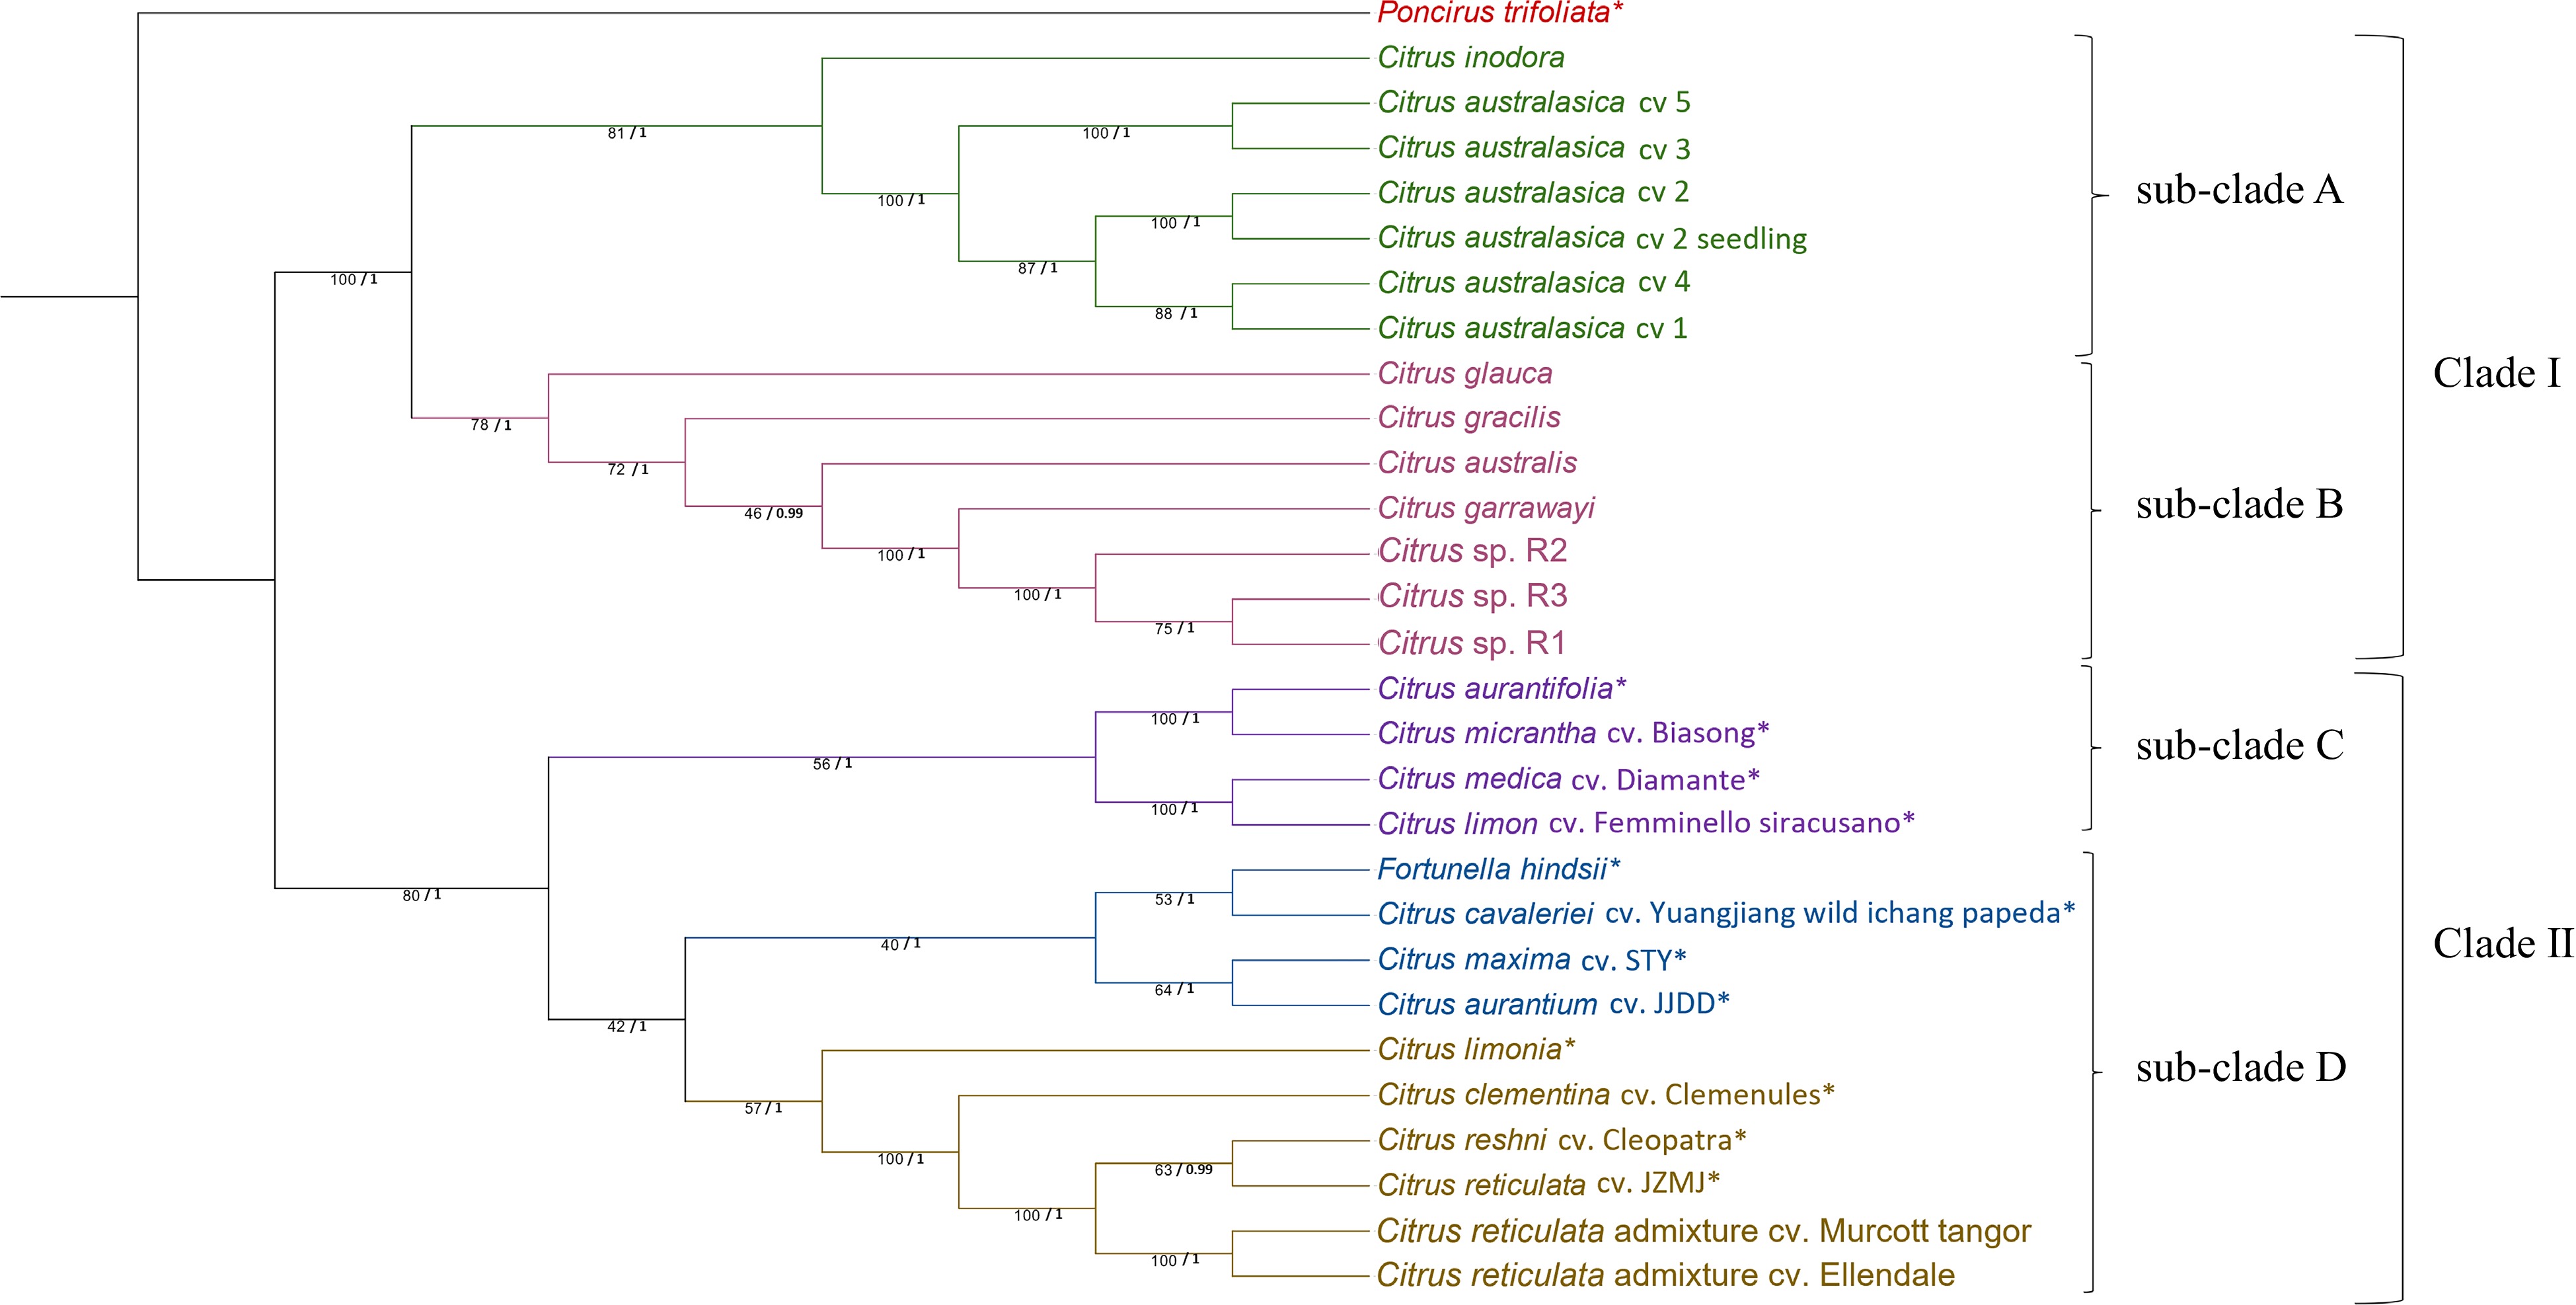
      Figure 1. 

      Phylogenetic tree generated from 86 nuclear genes sequences of 29 citrus samples (species/cultivars) with Poncirus trifoliata as the outgroup. The tree was generated using Maximum Likelihood (ML) method in RAxML with 1,000 bootstrap replicates. ML bootstrap values from 1,000 replicates (/100) and posterior probability values are indicated on each node respectively. * SRA data obtained from National Centre for Biotechnology Information for nuclear genes assembly. Citrus sp. R1, R2 and R3 refers to three different seedlings of the Citrus sp.

      The non-Australian citrus species (Clade II) formed two major and distinct clades. The first major clade (sub-clade C) was split into two sub-clades. The first sub-clade has two sister-clades, one grouping C. aurantifolia and C. micrantha together and the other sister-clade grouping C. medica and C. limon together with high node support. The second major clade (sub-clade D) had two sub-lineages. The first sub-lineage split into two sister groups with F. hindsii and C. cavaleriei in one group and C. maxima and C. aurantium in the other group. The second sub-lineage was comprised of mandarins and related hybrid cultivars (mandarin × sweet orange and mandarin × citrons). Within the mandarin clade, C. limonia (Rangpur lime) (mandarin × citron) was distantly related to mandarins and mandarin × sweet orange hybrids. C. clementina was closely related with the other four mandarin cultivars. C. reticulata (cv. JZMJ) and C. reshni (cv. Cleopatra mandarin) were grouped in one sub-clade and Murcott and Ellendale were grouped in another sub-clade (Fig. 1).

    • Chloroplast genomes of all the species exhibited the typical quadripartite structure of most angiosperms’ chloroplast genomes (Supplemental Fig. S2) with the total genome size ranging from 159,882−160,997 bp. The cp genomes contained a large single-copy region (LSC: 87,137−87,945 bp), small single-copy region (SSC: 18,385−18,801 bp), and a pair of inverted repeat regions (IR: 26,944−27,300 bp). 113−115 functional genes were encoded by all the species. The total number of genes included 78 or 79 CDS, 31 or 32 tRNA genes, and 4 rRNA genes. (Table 1). The species with 78 CDS were found to have two missing genes with compared to those having 79 CDS. The CDS infA was found to be missing in all C. australasica cultivars, C. inodora, and C. glauca and the CDS rps12 was missing in C. australis, giving rise to 78 total number of CDS in them. The gene encoding trnS-CGA tRNA was found to be missing in the species with 31 tRNA.

      Table 1.  Characteristics of the chloroplast genomes of 28 citrus samples.

      SpeciesCultivarGenome size (bp)LSC (bp)SSC (bp)IR (bp)GenesCDStRNA genesrRNA genes
      C. australasicacv 1160,40087,68618,75726,95211378314
      C. australasicacv 2160,40087,72318,75926,95911378314
      C. australasicacv 3160,33587,67718,75426,95211378314
      C. australasicacv 4160,36587,69218,75526,95911378314
      C. australasicacv 5160,33587,67718,75426,95211378314
      C. australisN/A160,53087,88218,76026,94411478324
      C. garrawayiN/A160,49587,78018,76926,97311579324
      C. glaucaN/A160,57087,84918,76326,97911478324
      C. gracilisN/A160,37287,65218,75226,98411579324
      C. inodoraN/A160,66987,94518,72826,99811478324
      C. sp. R1N/A160,58587,86618,78726,96611579324
      C. sp. R2N/A160,57287,85318,78726,96611579324
      C. sp. R3N/A160,57287,85318,78726,96611579324
      C. aurantifolia159,88287,13718,76326,99111579324
      C. aurantiumJJDD160,14087,75518,38527,00011579324
      C. cavalerieiYuangjiang wild
      ichang papeda
      160,99787,63418,76327,30011579324
      C. clementinaClemenules160,72287,94118,80126,99011579324
      C. limonFemminello
      siracusano
      160,14187,75418,38527,00111579324
      C. limonia160,71587,91018,78927,00811579324
      C. maximaSTY160,18687,79118,39527,00011579324
      C. medicaDiamante160,04887,49018,57626,99111579324
      C. micranthaBiasong159,92387,17818,76326,99111579324
      C. reshniCleopatra160,66687,86618,78427,00811579324
      C. reticulataJZMJ160,69987,91818,80126,99011579324
      C. reticulata admixtureMurcott160,69987,91818,80126,99011579324
      C. reticulata admixtureEllendale160,69987,91818,80126,99011579324
      F. hindsii160,26587,58718,73426,97211579324
      P. trifoliata160,26087,44218,76027,02911579324
    • The trees generated by MrBayes (Supplemental Fig. S3), and ML approaches (Fig. 2) were topologically similar. The Mr Bayes tree had high node support for all nodes. We discuss the RA×ML tree for both nuclear and chloroplast phylogenies for ease of comparison. The RA×ML tree (Fig. 2) displayed two major lineages for the citrus species giving rise to two major clades. The first major clade (Clade I) was a cluster grouping all the Australian citrus species and C. medica. In this clade, the sub-clade containing the Australian wild limes was further split into two sub-clusters (sub-clade A and sub-clade B) with high bootstrap support. In sub-clade A, the five different cultivars of C. australasica were grouped into two sub-clusters, while the other wild limes were grouped separately in sub-clade B. In sub-clade A, C. australasica, cv 2 and cv 4 clustered separately from cv 1, cv 3 and cv 5. The sub-clade B, containing other Australian citrus had two sub-lineages separating C. inodora, C. glauca and the C. australis group from the rest. The other sub-lineage clustered C. gracilis, C. garrawayi and the three seedlings of C. sp. together in one sub-clade. The second major clade (Clade II) contained all the domesticated citrus species used in this study and formed two sub-clades. The first sub-clade (sub-clade C) was further divided into two sister groups where C. aurantifolia and C. micrantha formed one group, while C. maxima, C. limon and C. aurantium formed another group. In the second sub-clade (sub-clade D), C. cavaleriei was sistered to the other species. C. limonia and C. reshni formed a sister group and C. clementina and C. reticulata cultivars including the two commercial cultivars (Murcott and Ellendale) formed another sister group.
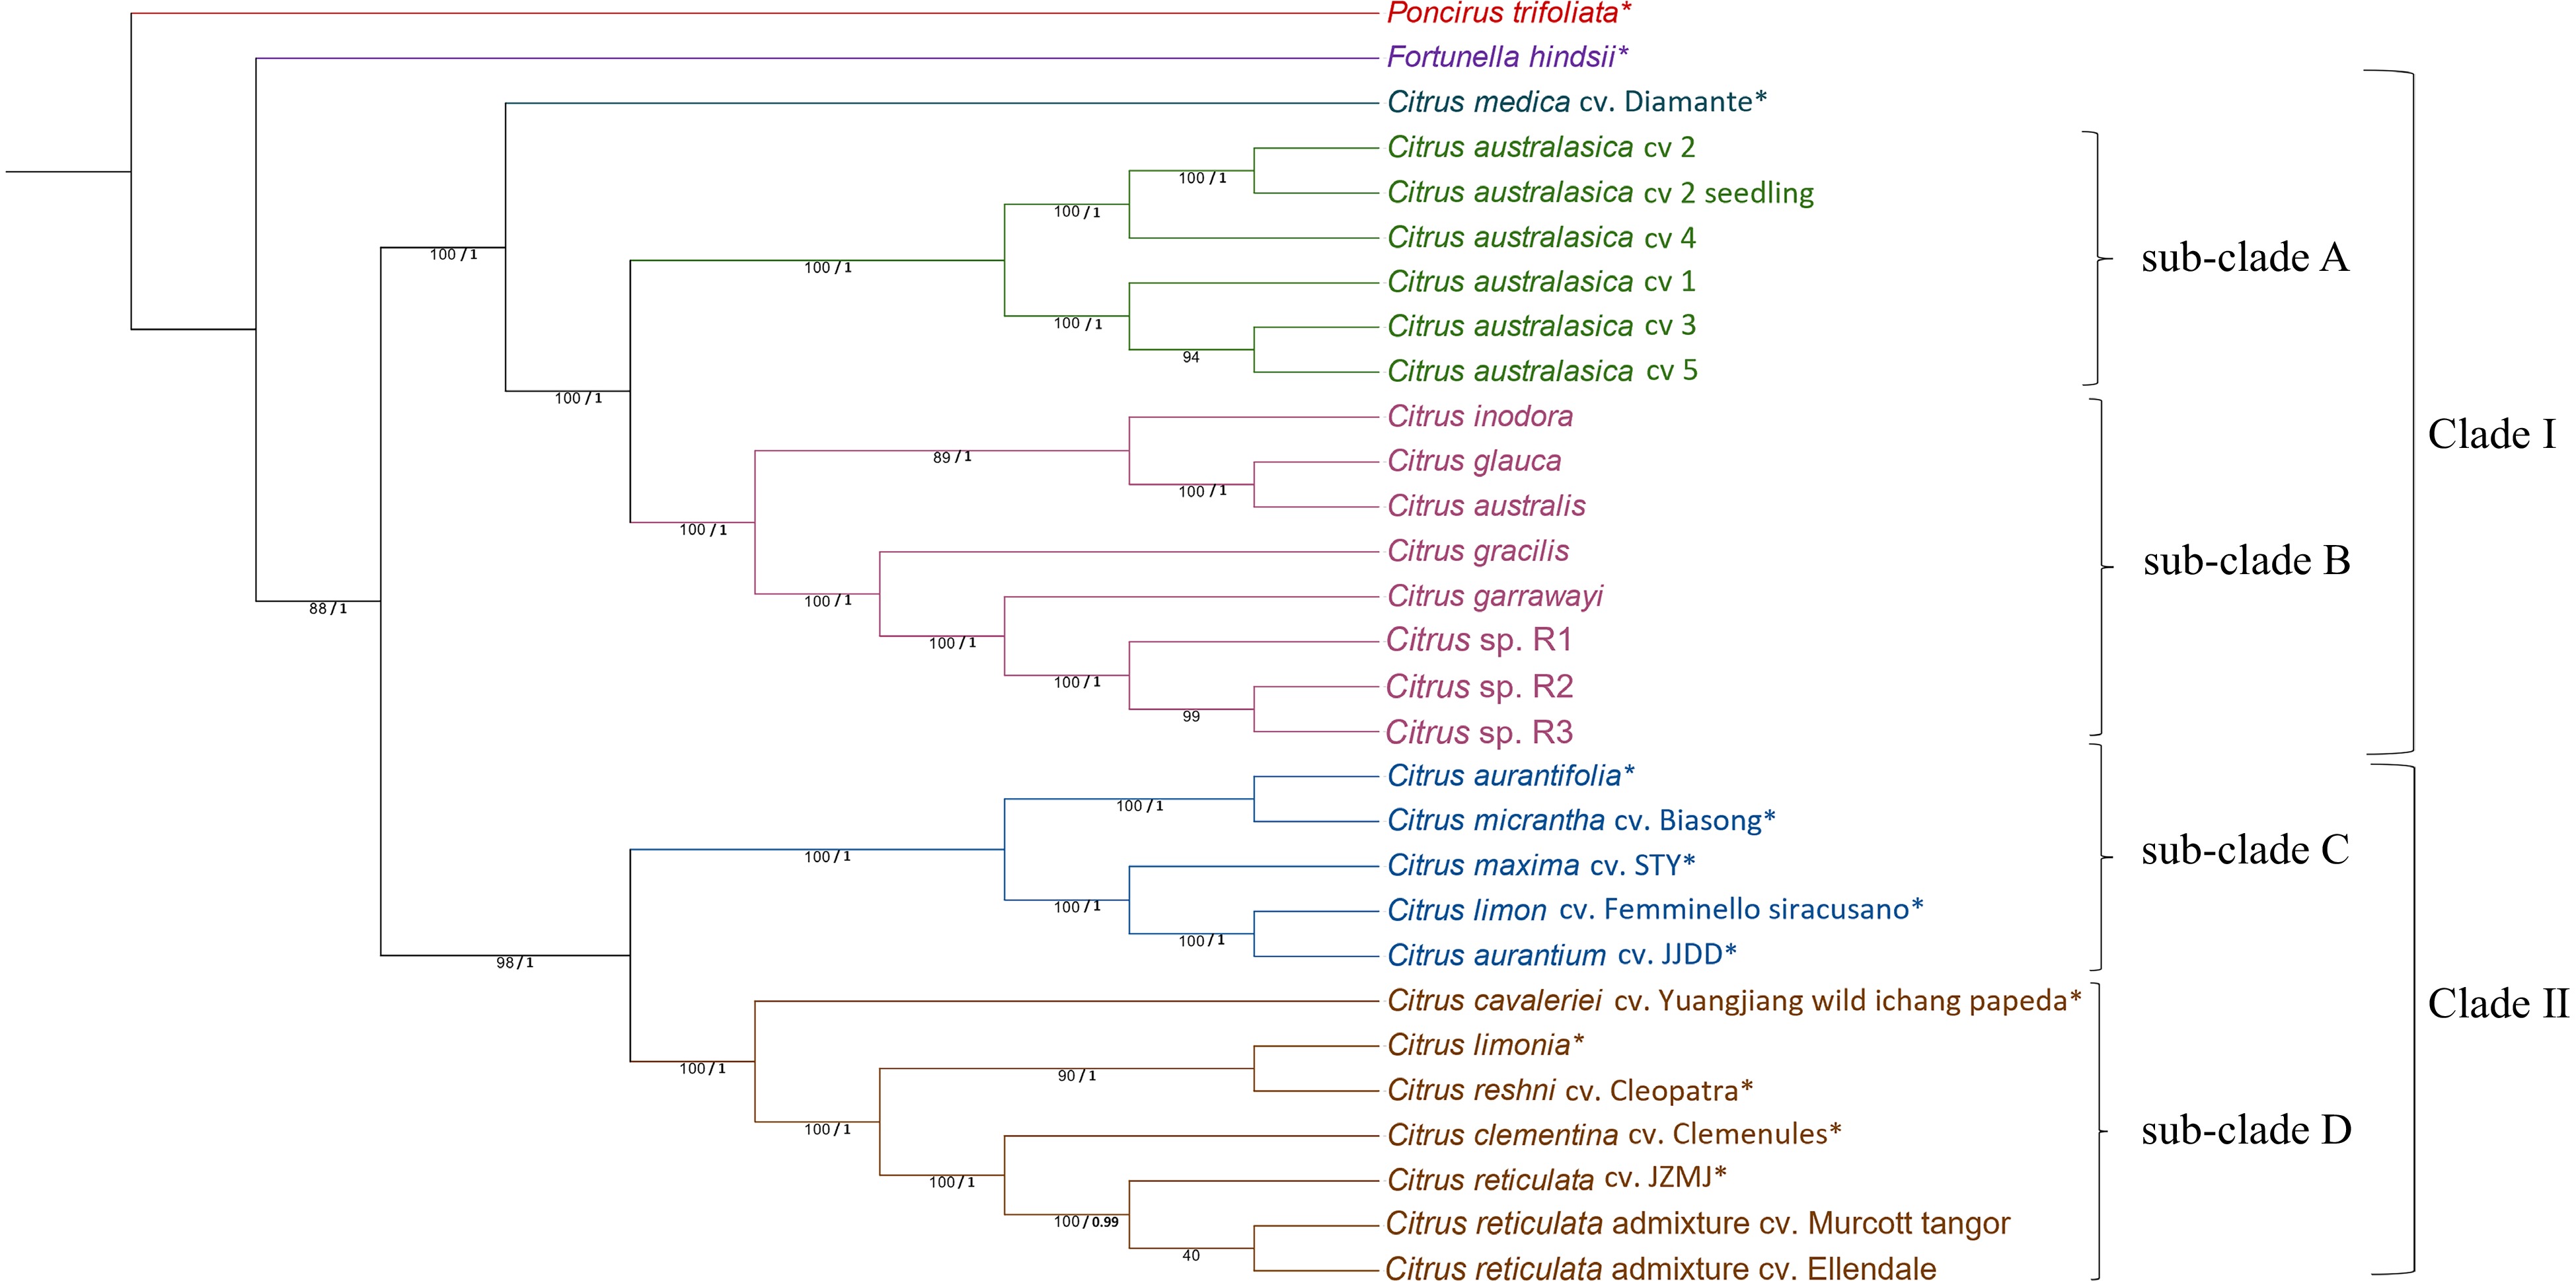
      Figure 2. 

      Phylogenetic tree generated from complete chloroplast genome sequences of 29 citrus samples (species/cultivars) with Poncirus trifoliata as the outgroup. The tree was generated using Maximum Likelihood (ML) method in RAxML with 1,000 bootstrap replicates. ML bootstrap values from 1,000 replicates (/100) and posterior probability values are indicated on each node respectively. * SRA data obtained from National Centre for Biotechnology Information for chloroplast genome assembly. Chloroplast genome for P. trifoliata which was assembled by GetOrganelle toolkit was obtained from[34]. Citrus sp. R1, R2 and R3 refers to three different seedlings of the Citrus sp.

      Analysis of the Australian clade showed that the C. garrawayi chloroplast had a total of 192−198 variants [SNPs (transitions and transversions), insertions and deletions] when compared to the C. sp. The chloroplast sequences of C. sp. R2 and R3 were identical with each other. C. glauca and C. australis formed a sister group with 688 variants between them. In C. australasica cultivars, cv 3 and cv 5 had no variants in their chloroplasts. There were six variants between cv 1 and cv 3 / cv 5 and 38 variants between cv 4 and cv 2.

    • The present study revealed a conflict in the topologies of nuclear and chloroplast phylogenies. Previous studies have explained similar conflicts as potential reticulate evolution, incomplete lineage sorting, or hybridization/introgression[40,41]. The nuclear phylogeny revealed the relationships among species. The Australian native citrus species are distinct from non-Australian citrus based on the nuclear phylogeny. The Australian species are thought to have evolved over millions of years from an ancestral species which originated in Southeast Asia and underwent speciation in Australia[13]. They have adapted to the prevailing edaphic and climatic variations in Australia and developed traits that do not exist or are rarely found in domesticated species[11,42]. C. australasica accessions are particularly interesting amongst the native Australian citrus because of their high morphological and genetic diversity, with wide variations in peel and pulp colours and flavours[11]. They possess a unique nuclear genome closely shared amongst the five accessions used in this study. The fact that C. inodora has a nuclear genome close to C. australasica but with a chloroplast similar to the other native limes suggest that hybridization/introgression and chloroplast capture might have occurred during their evolution.

      Nuclear relationships further showed that C. glauca is relevantly distantly related to C. gracilis, C. australis, C. garrawayi and the C. sp. Our result is congruent with a previous phylogeny based on 27 nuclear genes in which it found a closer relationship between C. glauca and C. australis than with C. australasica[28]. However, this result differs from the finding of Wu et al.[3], which showed a closer relationship between C. australis and C. australasica, than with C. glauca, thus indicating the separation of C. glauca from these two species much earlier. The results of Wu et al.[3] were based on a large number of single nucleotide variations in non-genic and non-pericentromeric genomic regions, which might be a reason for the different topology of our phylogeny, which was based on the coding regions of 86 genes. The close relationship between C. garrawayi and the C. sp. support the view that C. sp. could be a distinct form of C. garrawayi. Morphological differences in terms of the size and shape of the fruit, leaves, (Supplemental Fig. S4) and the flavour of the fruit of the C. sp. support the possibility of extensive genetic variation in this species. Conclusions from future studies would be strengthened by the inclusion of multiple accessions of all six Australian species.

      The availability of complete cp genomes and multiple taxa have improved the ability to define an evolutionary history of Australian native limes. Our results indicate that Australian citrus species have a similar cp sequence to citrons (C. medica), which might be explained by reticulate evolution. Previous studies showed that ancient citrus went through two events in history, one separating Australian citrus and citrons from all other citrus, followed by the separation of citrons from Australian citrus[5]. The origin of citrons and Australian citrus were known to be in Southeast Asia[3,43] and it is possible that the progenitor species of Australian citrus and C. medica might have shared a similar chloroplast through chloroplast capture during their evolution.

      C. australasica forms a monophyletic clade which diverged from the rest of the Australian species and indicates that the five cultivars of this species are likely to share a distinct cp genome, different from all the other wild limes. C. inodora, C. australis and C. glauca have chloroplasts which are closer to the other native limes. Previous studies have suggested that chloroplast phylogenies are associated with the geographical distribution of species and that chloroplast capture can occur as a result of introgression and hybridization between species[44,45]. Intriguingly, our chloroplast phylogeny does not strongly support the geographical distribution of these six species within the Australian continent, nor does it correspond with differences in current edaphic and climatic conditions. The most incongruous sub-clade contains C. inodora, C. glauca and C. australis, representing species that are widely dispersed in their geographical locations, and climates that range from open semi-desert (~300 mm annual rainfall) to dense tropical rainforests (~8,000 mm annual rainfall). This may suggest that the evolutionary pressures that created six distinct and unique citrus species on the Australian continent were very different from those that prevail today.

      The close relationship of C. australis and C. glauca chloroplast genomes is well established in many previous chloroplast phylogenies[2,3,5,15,46]. Some of those phylogenies have also revealed a clear separation of C. australasica from the sub-clade of C. australis and C. glauca indicating that these two latter species are likely to share similar chloroplast sequences. Our results further suggest that C. gracilis, C. garrawayi and the C. sp. might have shared a similar chloroplast during their evolution with a smaller number of variations between the chloroplasts of two forms of C. garrawayi.

    • The nuclear gene phylogeny has identified close relationships among the Australian wild citrus species and confirmed a monophyletic clade quite distinct from other species in this genus. Of the Australian citrus species, C. inodora and C. australasica were closely related and distinct from the other species. However, C. inodora had a chloroplast similar to the other Australian limes probably as a result of reticulate evolution. C. medica shares a chloroplast similar to that found in the Australian species, suggesting a common origin. The Australian clade represents a divergent group of species that is an important genetic resource for citrus[8,10]. This study has clarified their relationships and raised questions about the evolutionary pressures that resulted in such vast extremes of environmental adaptation within the clade.

    • The authors confirm contribution to the paper as follows: study conception and design: Henry R, Furtado A; data collection: Nakandala U; analysis and interpretation of results: Nakandala U, Henry R, Furtado A, Smith M, Williams D; draft manuscript preparation: Nakandala U. All authors reviewed the results and approved the final version of the manuscript.

    • Raw sequence data of Illumina short reads generated in this study have been deposited in NCBI Sequence Read Archive (SRA) under the BioProject PRJNA1010857 and BioSamples SAMN37202700, SAMN37203473, SAMN37203569, SAMN37212709, SAMN37217921, SAMN37217994, SAMN37218139, SAMN37218149, SAMN37218318, SAMN37218425, SAMN37218444, SAMN37282787, SAMN37282790, SAMN37282997 with SRA accession IDs of SRR25867464, SRR25888267, SRR25893096, SRR25899463, SRR25905657, SRR25919244, SRR25923911, SRR25933438, SRR25915022, SRR25948168, SRR25994105

      • This project was funded by the Hort Frontiers Advanced Production Systems Fund as part of the Hort Frontiers strategic partnership initiative developed by Hort Innovation, with co-investment from The University of Queensland, and contributions from the Australian Government and Bioplatforms Australia. We thank the Research Computing Centre (RCC), University of Queensland, for providing high performance computing facilities.

      • The authors declare no conflict of interest. Robert J. Henry is the Editorial Board member of Tropical Plants who was blinded from reviewing or making decisions on the manuscript. The article was subject to the journal's standard procedures, with peer-review handled independently of this Editorial Board member and the research groups.

      • Received 11 September 2023; Accepted 26 October 2023; Published online 21 December 2023

      • Australian citrus species formed a monophyletic clade which was separated from the non-Australian species, indicating their unique status within the genus Citrus.

        Citrus inodora and Citrus australasica had a close relationship based on 86 single copy nuclear genes and were distinct from the other four Australian species.

        Citrus australasica had a unique chloroplast which was distinct from all the other Australian species.

        Citrus medica had a similar chloroplast to the Australian species but was more closely related to the Asian citrus species based on nuclear genes.

      • Supplemental Table S1 Names and descriptions of five finger lime cultivars based on the colour of skin and juice vesicles.
      • Supplemental Table S2 The collection sites, geographical locations, characteristics and uses of the citrus species used in this study.
      • Supplemental Table S3 List of single copy nuclear genes used for nuclear gene analysis.
      • Supplemental Table S4 Parameters used to get the complete chloroplast genomes from GetOrganelle.
      • Supplemental Fig. S1 Phylogenetic tree generated from 86 nuclear genes sequences of 29 citrus samples (species/cultivars) with Poncirus trifoliata as the outgroup. The MrBayes tree was generated in Geneious. Posterior probability values are given on each node.
      • Supplemental Fig. S2 Chloroplast genome map of citrus species. All the species showed the typical quadripartite structure of the chloroplast genome. The genes belonging to different functional groups are shown in different colours. The thicker black lines indicate the extent of the IR regions separating the LSC and SSC regions. Genes inside the circle are transcribed in clockwise direction whereas the genes outside the circle are transcribed in counter-clockwise direction. LSC: Large Single-Copy, SSC: Small Single-Copy, IR: Inverted Repeat regions.
      • Supplemental Fig. S3 Phylogenetic tree generated from complete chloroplast genome sequences of 29 citrus samples (species/cultivars) with Poncirus trifoliata as the outgroup. The MrBayes tree generated in Geneious. Posterior probability values are given on each node. * SRA data obtained from National Centre for Biotechnology Information for chloroplast genome assembly. Chloroplast genome for P. trifoliata which was assembled by GetOrganelle toolkit was obtained from (He et al., 2020).
      • Supplemental Fig. S4 The morphological variations of the leaves and fruit of Citrus garrawayi and Citrus sp. Unknown. (a) The difference of the leaves of the two accessions. C. garrawayi is on the left and C. sp. Unknown is on the right. C. garrawayi has lanceolate to obovate leaves and C. sp. Unknown has ovate to obovate leaves (b) The inner and outer appearance of the fruit of C. sp. Unknown. (c) Variation in fruit size and shape of C. garrawayi (top) and C. sp. Unknown (bottom) The fruit of C. sp. Unknown are not as long as C. garrawayi. The juice vesicles and the taste of the fruit are different between C. garrawayi and C. sp Unknown. They both have angular vesicles than C. australasica, however, those of C. sp Unknown are more like C. australis. The taste of the C. sp Unknown fruit is more like green apple (which C. garrawayi can have), however, it is less acidic than C. garrawayi.
      • Copyright: © 2023 by the author(s). Published by Maximum Academic Press on behalf of Hainan University. This article is an open access article distributed under Creative Commons Attribution License (CC BY 4.0), visit https://creativecommons.org/licenses/by/4.0/.
    Figure (2)  Table (1) References (46)
  • About this article
    Cite this article
    Nakandala U, Furtado A, Smith MW, Williams DC, Henry RJ. 2023. Phylogenetic relationships among Australian native citrus species based upon complete chloroplast genomes and single copy nuclear genes. Tropical Plants 2:21 doi: 10.48130/TP-2023-0021
    Nakandala U, Furtado A, Smith MW, Williams DC, Henry RJ. 2023. Phylogenetic relationships among Australian native citrus species based upon complete chloroplast genomes and single copy nuclear genes. Tropical Plants 2:21 doi: 10.48130/TP-2023-0021

Catalog

  • About this article

/

DownLoad:  Full-Size Img  PowerPoint
Return
Return