REVIEW   Open Access    

Overview of technical research on safety monitoring, early warning, and risk assessment for underground structural engineering construction

More Information
  • On the basis of systematically sorting out the potential risk sources of underground structure construction, this paper describes the surrounding medium of underground structure as soil mass and rock mass. The main risk source of the underground structure based on soil medium comes from the construction mechanics analysis in the construction stage, and the leading factor of the underground structure loading in the construction stage is the stress-strain relationship of soil based on the unloading path. The deep underground engineering structure is faced with a series of disasters such as high-strength water escape, high-strength rock burst, large deformation of soft rock, boulder collapse and rock burst under the action of unloading. In view of the unloading paths faced by the above two different media, the corresponding physical models are developed to describe the above phenomena according to their respective disaster evolution mechanism and disaster breeding mechanism, and the corresponding indexes required for the safety of engineering structures are obtained by solving the physical equations. According to the above indicators, the engineering structure and surrounding media in the construction process are monitored accordingly, and the feedback of the monitoring data is used to obtain the risk assessment and modify the current construction sequence, so as to provide a reference for better serving the construction safety of underground engineering structures.
  • Crimean-Congo Hemorrhagic Fever (CCHF) is a tick-borne disease prevalent in Afghanistan, with a Case Fatality Ratio (CFR) of 10% to 50%. Its incidence is rising in northeast Afghanistan, with animals as the primary source of infection. First identified in the 1940s in the Crimean Peninsula, it is caused by an enveloped negative-sense single-stranded RNA virus belonging to the Bunyaviridae family, Nairovirus genus. The main mode of transmission is through ticks, especially the Hyalomma species[1].

    Wild animals, such as rabbits, hedgehogs, and certain rat species, serve as reservoirs for CCHF in different regions. Domestic animals like cattle, sheep, goats, camels, horses, dogs, donkeys, and poultry also act as reservoirs and amplifying hosts[1]. They can be asymptomatically infected or harbor infected ticks, with cattle being particularly important for CCHFV transmission[2]. Detecting CCHF viral RNA in clinical samples is crucial during the acute phase, especially before symptoms appear when antibody detection isn't feasible. Rapid and reliable diagnostic methods are essential due to high fatality rates, pathogenicity, and potential human-to-human transmission[3,4]. Early, accurate detection and monitoring of viral load are crucial for managing cases and ensuring biosafety, given the absence of specific treatment or approved vaccines[5]. CCHF is a major public health concern in Eastern Europe, Africa, the Middle East, and Asia, where the Hyalomma tick is common. People involved in animal husbandry and slaughtering, especially in rural areas of Afghanistan, face significant risk[6]. Transmission of CCHFV happens through tick bites, contact with crushed infected ticks, animal secretions or blood on injured skin or mucosa, and exposure to contaminated surgical instruments[1,7].

    In Afghanistan, CCHF is mainly reported among livestock workers, but cases have also been documented among healthcare personnel, veterinarians, meat inspectors, butchers, livestock traders, hunters, farmers, ranchers, and the general population[1]. Occupational exposure to infected animals and humans increases the risk of contracting CCHF. The first case was reported in 1998 in Takhar province, northeast Afghanistan. The WHO noted a substantial rise in cases, with 30 reported in 2018 and 947 from all 34 provinces in 2023, leading to 100 fatalities. Afghanistan is an endemic area for CCHF, facilitated by the Hyalomma tick's ecological range.

    CCHF prevalence rises throughout the year, particularly during Eid-Al-Adha, a religious holiday characterized by widespread animal sacrifices and unprofessional slaughtering in rural/urban areas[5]. Eid-ul-Adha is an annual religious festival during which millions of farm animals, including goats, cows, sheep, and camels, are slaughtered. This period, typically falling between June and September, is considered the most susceptible time for disease contraction, particularly Crimean-Congo Hemorrhagic Fever (CCHF). The preference for self-slaughter due to the unavailability of butchers and the convenience of house slaughtering by professional butchers contributes to animal-to-human disease transmission. Notably, CCHF is primarily confined to rural areas of Afghanistan[8,9].

    In 2022, Afghanistan was among the countries with the highest number of CCHF cases reported by the WHO. The number of confirmed cases has been on the rise in Afghanistan recently, but the capacity for laboratory testing and case management remains limited[5,10]. Various lab tests diagnose CCHFV, such as ELISA, serum neutralization, antigen detection, virus isolation, and RT-PCR. RT-PCR is preferred for its simplicity, specificity, and sensitivity[4].

    Therefore, this study aimed to investigate the CCHF virus in Afghanistan, focusing on identifying its primary reservoirs and transmission factors. We conducted molecular and seroprevalence analyses, examined tick morphology, and reviewed national surveillance data from 2007 to 2024. We assessed seroprevalence and molecular detection in blood and tick samples from domestic animals in Kunduz and Takhar provinces. Our findings could guide future surveillance efforts to address this public health threat.

    Kunduz province, strategically located at a border intersection with Takhar, Baghlan, Balkh, and Tajikistan, is a pivotal crossing point. Kunduz has a population of 1,308,389 residents, comprising both rural and urban dwellers[11].

    Takhar, situated in the Northeastern Region of Afghanistan, is one of 34 provinces. The province has a population of 1,109,573 inhabitants, including rural and urban populations. The main occupations in these provinces encompass agriculture, animal husbandry, clothing production, labor, carpet weaving, and business[11].

    A cross-sectional study was conducted from January to March 2024 in the Kunduz and Takhar provinces, Afghanistan. With an expected prevalence of 50%, a sample size of 427 livestock per province was calculated at a 95% confidence level and 5% precision.

    Districts, farms, and villages were chosen based on WHO-identified high outbreak areas. Animal species (cows, sheep, camels, goats, and chickens) were randomly selected, regardless of age, sex, or breed, without tagging animals on farms. A systematic sampling method ensured each animal had an equal chance of selection, with owners consenting before sampling.

    Four hundred and eighty blood samples were collected equally from four districts each in Kunduz and Takhar provinces. Trained veterinarians assisted in drawing 5 ml blood samples from cattle, sheep, camels, goats, and chickens via the jugular vein using BD Vacutainer 10 ml Hematology (K₃EDTA) tubes, regardless of age. Samples were promptly transported on dry ice to the Central Veterinary Diagnostic and Research Laboratory (CVDRL) to maintain cold chain integrity. Upon arrival, serum was obtained through centrifugation, transferred to labeled 5 ml cryogenic vials, and stored at −20°C until further serological and molecular testing.

    CCHF-suspected samples were meticulously investigated for CCHF RNA presence. Total RNA extraction from serum samples utilized the Viral Nucleic Acid Isolation Kit from BioPerfectus Technologies. Extracted RNA was reverse transcribed to cDNA, and amplification was conducted using the one-step RealStar® 1.0 RT-PCR kit from Altona Diagnostics (Germany) on an AriaMx real-time PCR machine.

    Ticks were systematically collected from livestock farms, including cattle, sheep, camels, goats, and chickens, with tick collectors wearing full-body protective clothing. Animals underwent thorough examinations to locate ticks in specific areas. Ticks were carefully removed using blunt forceps and transferred into labeled safety-lock Eppendorf tubes®. Live ticks were transported to the CVDRL in Kabul for morphological examinations, then stored at −80 °C for mRNA extraction and further analysis.

    Ticks were identified based on their geomorphological features under a light stereomicroscope using a multiple electronic entomology key[12]. The ticks were identified up to the species level based on morphological characteristics of the ticks for species identification and recorded respectively.

    The sera were serologically tested as described by Schuster et al.[13]. All samples were first tested in an adapted commercial species-specific indirect CCHFV-IgG ELISA. In the adapted commercial species-specific indirect CCHFV-IgG ELISA, the samples with an OD value > 0.7 were considered positive. In a second step, samples with divergent results were run in a commercial species-adapted indirect CCHFV-IgG immunofluorescence assay (IFA) to obtain the result.

    Samples collected from the field were transferred through a cold chain system and stored in a −80 °C freezer until RNA extraction. Total RNA for RT-PCR and real-time PCR was subsequently extracted and purified from frozen tissues using the Viral Nucleic Acid Isolation Kit (Silica-Based Spin Column) from Jiangsu Bioperfectus Technologies Co Ltd. (Jiangsu), following the manufacturer's protocols. This process aimed to eliminate genomic (g) DNA.

    Serum samples and ticks were individually washed twice with PBS and crushed with a pestle in 200–300 µl of liquid nitrogen in 2 ml cryogenic vials to detect CCHFV RNA. RNA extraction was performed using the QIAamp Viral RNA Mini Kit according to the manufacturer's instructions, and total RNA was stored at −70 °C until use. Gel electrophoresis assessed RNA quality, where the presence of two distinct bands indicated high-quality RNA: the top band represented 28S ribosomal RNA (rRNA) at 4.8 kb, and the lower band represented 18S rRNA at 2.0 kb. Additionally, an in-house molecular method was used alongside a commercial kit for CCHF virus detection.

    A comprehensive questionnaire gathered socio-demographic data and assessed CCHF risk factors. Before administering the structured questionnaire, community engagement activities identified potential additional risk factors for CCHF exposure. Data collected from livestock owners included animal types and numbers, sample collection details, location, weather conditions, and individual animal specifics. Intrinsic factors (species, sex, age, and breed) and extrinsic factors (husbandry practices, body condition score, and tick infestation count) were recorded. Questions on CCHF awareness and public health aspects included closed, multiple-choice, and open-ended questions. Moderated interviews were conducted with farm owners in the local language.

    All data underwent statistical analysis using SPSS Statistics 23.0. Proportions were calculated for qualitative variables, while mean with standard deviation (SD) and median with interquartile range (IQR) were calculated for quantitative variables. The chi-square test of independence and the Fisher exact test were utilized to determine associations among various independent factors (species, sex, breed, housing, hygiene, tick infestation, body condition score, and feeding systems) with CCHF seropositivity rates in cattle, sheep, camels, goats, and chickens. Minitab® 18 software was employed, with statistical significance set at p < 0.05[14].

    Data extracted from Afghanistan's national surveillance system for 2007−2024 revealed 4,667 suspected cases, with 2651 laboratory-confirmed positives and 463 reported deaths. Additional cases were reported annually: 163 in 2016, 245 in 2017, 483 in 2018, 412 in 2022, 1,442 in 2023, and 113 as of March 2024, with the highest in 2023 (Fig. 1). Notably, confirmed positive cases peaked in 2023 (1,236), followed by 2022 (389), 2018 (139), and 2017 (104). This indicates an annual increase in CCHF cases, posing a significant public health threat, with a total case fatality rate of 463, highest in 2023 (114) (Fig. 1).

    Figure 1.  Number of suspected and confirmed CCHF cases and death in Afghanistan, 2007–2024. The horizontal axis year (from 2007 to 2024) and vertical axis shows the number of CCHF cases.

    From 2007 to 2024, the average case fatality ratio (CFR) of confirmed CCHF cases in Afghanistan was 30.2%. The CFR varied annually: 36% in 2016, 48% in 2017, 42.2% in 2018, 32% in 2019, 29% in 2020, 25% in 2021, 17% in 2022, 11% in 2023, and 2.1% as of March 2024. While CCHF cases increased until 2018, deaths subsequently declined (Fig. 1). Possible reasons for reduced CFR include improved public knowledge leading to prompt action, rapid blood donation supply, and increased preventive measures. Comparing January−March incidence from 2022−2024, no cases were reported in January−March 2022−2023, but 26 cases in January 2024, 47 in February, and 64 in March, indicating an anticipated increase in 2024 prevalence. Occupationally, most reported cases were in the 'others' category (23%), followed by unemployed (17%), housewives (14.5%), health staff (12.8%), shepherds (11%), butchers (7%), animal dealers and farmers (7.6%), and students (6.7%) (Fig. 2).

    Figure 3.  National surveillance data due to CCHF outbreak on an annual basis for the northeast region provinces (Kunduz, Takhar, Badakhshan, and Baghlan) during the period of 2007−2024. The horizontal axis shows CCHF prevalence on year basis and vertical axis shows the number of CCHF confirmed cases by the national surveillance system for the northeast region provinces.

    Data from the national surveillance system for northeast region provinces (Kunduz, Takhar, Badakhshan, and Baghlan) showed higher CCHF prevalence in Kunduz (29.6%), followed by Takhar (25.4%), Badakhshan (24%), and Baghlan (20.8%) (Fig. 3). These findings suggest a higher likelihood of future prevalence in Kunduz and Takhar provinces. Hence, early mitigation is crucial, necessitating intensified biosecurity and tick prevention measures on animal farms.

    Figure 2.  Occupational prevalence due to CCHF for the period of 2007−2024. The blue color indicates number of recorded cases while the dark blue color indicates the number of death cases respectively. The horizontal axis indicates the occupation of persons, and the vertical axis indicates the total number of CCHF cases due to occupational incidences of CCHF for the period of 2007−2024.

    A total of 720 tick samples were collected, each containing an average of 27 ticks, totaling 4,672 ticks from Kunduz and Takhar provinces (Fig. 4). Tick species were identified based on morphological characteristics, revealing Hyalomma (H. asiaticum and H. marginatum), Rhipicephalus, Argas, Ornithodorus, Dermacentor, and Linognathus ticks. Hyalomma species were the most prevalent, followed by Rhipicephalus, while Dermacentor was least found. This indicates a significant presence of Hyalomma ticks, the primary vectors of CCHF, suggesting a high risk of transmission from infected animals to humans in the region and nationally (Fig. 4).

    Figure 4.  Different species of ticks presents in Kunduz and Takhar provinces with their percentage. Each species of the ticks found are exhibited in the figure with number and percentage.

    A total of 720 ticks and 480 blood samples were collected, covering eight districts in two provinces equally. Among the samples tested by RT-PCR and IgG ELISA, 73 ticks in Kunduz and 81 ticks in Takhar were confirmed positive. In blood samples, 29 in Kunduz and 36 in Takhar tested positive (Fig. 5). Seropositivity was higher in Takhar than in Kunduz, with Rustaq in Takhar showing the highest prevalence. In Kunduz, Dasht-e-Archi had the highest prevalence. Overall, 102 ticks (17%) and 117 blood samples (19.5%) out of 720 and 480, respectively, were presumed positive for CCHF (Fig. 5).

    Figure 5.  Prevalence of CCHF in Kunduz and Takhar provinces.

    Intrinsic factors, notably animal species, demonstrated a significant association with CCHF prevalence, with cattle showing the highest prevalence, followed by sheep, goats, and camels. Seroprevalence was notably higher in females than males (Table 1). Animals older than 2 years were more susceptible than younger ones, although differences between indigenous and exotic breeds were non-significant, despite higher prevalence in indigenous animals (Tables 2, 3). Extrinsic factors such as housing system, feeding, hygiene practices, body condition score, and tick infestation were also explored (Tables 48). Free-ranging animals had a higher prevalence than tethered ones, with significant associations observed between housing systems and seroprevalence (Table 4). Pasture-grazing animals exhibited higher seroprevalence than stall-fed ones, while animals receiving good hygienic practices had lower prevalence compared to those with poor hygiene (Tables 5, 6). Obese animals demonstrated a higher prevalence than emaciated and average-weight animals, with significant differences based on body condition scores (Table 7). Significant associations were found within districts and between provinces (Kunduz and Takhar) regarding tick infestation, with tick-infested animals showing higher seroprevalence (Tables 8, 9).

    Table 1.  Association of sera-molecular prevalence of CCHF within animal species in the Kunduz and Takhar provinces of Afghanistan.
    Study province Study district Variables Examined Positive Seroprevalence (%) χ2 value p-value
    Kunduz Kunduz-Center Cattle 60 15 30 0.1816 0.0609
    Sheep 40 9 32.5
    Goat 30 3 26.66666667
    Camel 15 0 13.33333333
    Chicken 5 0 0
    Dasht-e-Archi Cattle 60 18 25 0.6031 0.088
    Sheep 40 13 22.5
    Goat 30 8 10
    Camel 15 2 0
    Chicken 5 0 0
    Imam Sahib Cattle 60 9 15 0.5714 0.061
    Sheep 40 11 27.5
    Goat 30 5 16.66666667
    Camel 15 2 13.33333333
    Chicken 5 0 0
    Char Dara Cattle 60 5 8.333333333 0.0742 0.045
    Sheep 40 4 10
    Goat 30 3 10
    Camel 15 0 0
    Chicken 5 0 0
    Takhar Taloqan Cattle 60 14 23.33333333 0.4867 0.067
    Sheep 40 11 27.5
    Goat 30 5 16.66666667
    Camel 15 1 6.666666667
    Chicken 5 0 0
    Rustaq Cattle 60 22 36.66666667 0.5683 0.109
    Sheep 40 16 40
    Goat 30 9 30
    Camel 15 3 20
    Chicken 5 0 0
    Khwaja Bahawodeen Cattle 60 9 15 0.4477 0.053
    Sheep 40 8 20
    Goat 30 4 13.33333333
    Camel 15 0 0
    Chicken 5 0 0
    Khwaja Ghar Cattle 60 3 5 0.4953 0.043
    Sheep 40 5 12.5
    Goat 30 2 6.666666667
    Camel 15 0 0
    Chicken 5 0 0
     | Show Table
    DownLoad: CSV
    Table 2.  Association of sera-molecular prevalence of CCHF within sex of animals in the Kunduz and Takhar provinces of Afghanistan.
    Study province Study district Variables Examined Positive Seroprevalence (%) χ2 value p-value
    Kunduz Kunduz-Center Male 77 12 15.58441558 0.5098 0.0361
    Female 73 15 20.54794521
    Dasht-e-Archi Male 77 11 14.28571429 0.0052 0.0302
    Female 73 30 41.09589041
    Imam Sahib Male 77 10 12.98701299 0.1713 0.0103
    Female 73 17 23.28767123
    Char Dara Male 77 4 5.194805195 0.2301 0.0016
    Female 73 8 10.95890411
    Takhar Taloqan Male 77 11 14.28571429 0.1079 0.0067
    Female 73 20 27.39726027
    Rustaq Male 77 19 24.67532468 8.125 0.015
    Female 73 31 42.46575342
    Khwaja Bahawodeen Male 77 7 9.090909091 0.1222 0.003
    Female 73 14 19.17808219
    Khwaja Ghar Male 77 3 3.896103896 0.1914 0.001
    Female 73 7 9.589041096
     | Show Table
    DownLoad: CSV
    Table 3.  Association of sera-molecular prevalence of CCHF within age of animals in the Kunduz and Takhar provinces of Afghanistan.
    Study province Study district Variables Examined Positive Seroprevalence (%) χ2 value p-value
    Kunduz Kunduz-Center < 6 months 20 3 15 1 0.0137
    1 > Year 30 3 23.33333333
    > 2 Year 40 7 25
    2 > Year 60 14 35
    Dasht-e-Archi < 6 months 20 3 15 1 0.027
    1 > Year 30 7 10
    > 2 Year 40 10 17.5
    2 > Year 60 21 23.33333333
    Imam Sahib < 6 months 20 2 10 1 0.012
    1 > Year 30 5 16.66666667
    > 2 Year 40 9 22.5
    2 > Year 60 11 18.33333333
    Char Dara < 6 months 20 1 5 1 0.007
    1 > Year 30 3 10
    > 2 Year 40 2 5
    2 > Year 60 6 10
    Takhar Taloqan < 6 months 20 2 10 1 0.016
    1 > Year 30 5 16.66666667
    > 2 Year 40 9 22.5
    2 > Year 60 15 25
    Rustaq < 6 months 20 5 25 1 0.035
    1 > Year 30 10 33.33333333
    > 2 Year 40 13 32.5
    2 > Year 60 22 36.66666667
    Khwaja Bahawodeen < 6 months 20 2 10 1 0.0103
    1 > Year 30 3 10
    > 2 Year 40 5 12.5
    2 > Year 60 11 18.33333333
    Khwaja Ghar < 6 months 20 1 5 1 0.006
    1 > Year 30 2 6.666666667
    > 2 Year 40 2 5
    2 > Year 60 5 8.333333333
     | Show Table
    DownLoad: CSV
    Table 4.  Association of sera-molecular prevalence of CCHF within breed of animals in the Kunduz and Takhar provinces of Afghanistan.
    Study province Study district Variables Examined Positive Seroprevalence (%) χ2 value p-value
    Kunduz Kunduz-Center Indigenous 140 26 18.57142857 0.5571 0.45
    Exotic 10 1 10
    Dasht-e-Archi Indigenous 140 39 27.85714286 0.6757 0.504
    Exotic 10 2 20
    Imam Sahib Indigenous 140 26 18.57142857 0.5571 0.45
    Exotic 10 1 10
    Char Dara Indigenous 140 12 8.571428571 0.3558 0.401
    Exotic 10 0 0
    Takhar Taloqan Indigenous 140 30 21.42857143 0.4654 0.465
    Exotic 10 1 10
    Rustaq Indigenous 140 47 33.57142857 0.8684 0.541
    Exotic 10 3 30
    Khwaja Bahawodeen Indigenous 140 20 14.28571429 0.7389 0.429
    Exotic 10 1 10
    Khwaja Ghar Indigenous 140 10 7.142857143 0.399 0.395
    Exotic 10 0 0
     | Show Table
    DownLoad: CSV
    Table 5.  Association of sera-molecular prevalence of CCHF with housing system of animals in the Kunduz and Takhar provinces of Afghanistan.
    Study province Study district Variables Examined Positive Seroprevalence (%) χ2 value p-value
    Kunduz Kunduz-Center Extensive 75 19 25.33333333 0.5086 0.007
    Intensive 75 8 10.66666667
    Dasht-e-Archi Extensive 75 29 38.66666667 0.0181 0.023
    Intensive 75 12 16
    Imam Sahib Extensive 75 22 29.33333333 0.0031 0.018
    Intensive 75 5 6.666666667
    Char Dara Extensive 75 10 13.33333333 0.026 0.003
    Intensive 75 2 2.666666667
    Takhar Taloqan Extensive 75 26 34.66666667 0.0005 0.029
    Intensive 75 5 6.666666667
    Rustaq Extensive 75 39 52 0.0005 0.07
    Intensive 75 11 14.66666667
    Khwaja Bahawodeen Extensive 75 17 22.66666667 0.0007 0.01
    Intensive 75 4 5.333333333
    Khwaja Ghar Extensive 75 9 12 0.0141 0.003
    Intensive 75 1 1.333333333
     | Show Table
    DownLoad: CSV
    Table 6.  Association of sera-molecular prevalence of CCHF with feeding system of animals in the Kunduz and Takhar provinces of Afghanistan.
    Study province Study district Variables Examined Positive Seroprevalence (%) χ2 value p-value
    Kunduz Kunduz-Center Stall feeding 75 6 8 0.0076 0.0145
    Pasture grazing 75 21 28
    Dasht-e-Archi Stall feeding 75 6 8 4.8928 0.064
    Pasture grazing 75 35 46.66666667
    Imam Sahib Stall feeding 75 3 4 0.0001 0.027
    Pasture grazing 75 24 32
    Char Dara Stall feeding 75 1 1.333333333 0.0053 0.005
    Pasture grazing 75 11 14.66666667
    Takhar Taloqan Stall feeding 75 5 6.666666667 0.0004 0.029
    Pasture grazing 75 26 34.66666667
    Rustaq Stall feeding 75 9 12 0.002 0.088
    Pasture grazing 75 41 54.66666667
    Khwaja Bahawodeen Stall feeding 75 3 4 0.002 0.013
    Pasture grazing 75 18 24
    Khwaja Ghar Stall feeding 75 2 2.666666667 0.066 0.001
    Pasture grazing 75 8 10.66666667
     | Show Table
    DownLoad: CSV
    Table 7.  Association of sera-molecular prevalence of CCHF with hygenenic measures for animals in the Kunduz and Takhar provinces of Afghanistan.
    Study province Study district Variables Examined Positive Seroprevalence (%) χ2 value p-value
    Kunduz Kunduz-Center Good 75 5 6.666666667 0.0024 0.018
    Poor 75 22 29.33333333
    Dasht-e-Archi Good 75 7 9.333333333 0.0001 0.056
    Poor 75 34 45.33333333
    Imam Sahib Good 75 4 5.333333333 0.0007 0.023
    Poor 75 23 30.66666667
    Char Dara Good 75 2 2.666666667 0.026 0.003
    Poor 75 10 13.33333333
    Takhar Taloqan Good 75 7 9.333333333 0.0052 0.019
    Poor 75 24 32
    Rustaq Good 75 12 16 0.0013 0.061
    Poor 75 38 50.66666667
    Khwaja Bahawodeen Good 75 4 5.333333333 0.0077 0.01
    Poor 75 17 22.66666667
    Khwaja Ghar Good 75 3 4 0.2205 0.0008
    Poor 75 7 9.333333333
     | Show Table
    DownLoad: CSV
    Table 8.  Association of sera-molecular prevalence of CCHF with body condition score of animals in the Kunduz and Takhar provinces of Afghanistan.
    Study province Study district Variables Examined Positive Seroprevalence (%) χ2 value p-value
    Kunduz Kunduz-Center Obese 50 15 44 5.9152 0.0002
    Average 50 4 14
    Emaciated 50 8 24
    Dasht-e-Archi Obese 50 22 30 1.0036 0.001
    Average 50 7 8
    Emaciated 50 12 16
    Imam Sahib Obese 50 16 32 1.3038 0.0004
    Average 50 3 6
    Emaciated 50 8 16
    Char Dara Obese 50 7 14 7.6074 1.194
    Average 50 1 2
    Emaciated 50 4 8
    Takhar Taloqan Obese 50 16 32 2.748 0.0003
    Average 50 4 8
    Emaciated 50 11 22
    Rustaq Obese 50 17 34 2.386 0.0053
    Average 50 6 12
    Emaciated 50 27 54
    Khwaja Bahawodeen Obese 50 11 22 2.4731 0.0001
    Average 50 1 2
    Emaciated 50 9 18
    Khwaja Ghar Obese 50 4 8 0.0001 2.627
    Average 50 1 2
    Emaciated 50 5 10
     | Show Table
    DownLoad: CSV
    Table 9.  Association of sera-molecular prevalence of CCHF with tick infestation in animals in the Kunduz and Takhar provinces of Afghanistan.
    Study province Study district Variables Examined Positive Seroprevalence (%) χ2 value p-value
    Kunduz Kunduz-Center Indigenous 75 19 25.33333333 0.0508 0.007
    Exotic 75 8 10.66666667
    Dasht-e-Archi Indigenous 75 32 42.66666667 0.0013 0.041
    Exotic 75 9 12
    Imam Sahib Indigenous 75 18 24 0.1103 0.005
    Exotic 75 9 12
    Char Dara Indigenous 75 8 10.66666667 0.2663 0.0008
    Exotic 75 4 5.333333333
    Takhar Taloqan Indigenous 75 24 32 0.0052 0.019
    Exotic 75 7 9.333333333
    Rustaq Indigenous 75 39 52 0.0005 0.0702
    Exotic 75 11 14.66666667
    Khwaja Bahawodeen Indigenous 75 18 24 0.002 0.013
    Exotic 75 3 4
    Khwaja Ghar Indigenous 75 8 10.66666667 0.0666 0.0018
    Exotic 75 2 2.666666667
     | Show Table
    DownLoad: CSV

    Afghanistan is currently facing an intensified surge of Crimean-Congo Hemorrhagic Fever (CCHF) nationwide. Domestic ruminants, including cattle, sheep, goats, camels, and chickens, can act as reservoir hosts for CCHFV, aiding virus transmission through tick bites or direct contact with infected tissues. This situation raises substantial public health concerns. From 2007 to 2024, Afghanistan has seen an annual rise in confirmed CCHF cases and associated deaths. Public surveillance data indicates 4,667 suspected cases during this period, with 2,651 confirmed positive cases and 463 deaths. Specific numbers for certain years include: 163 cases in 2016, 245 in 2017, 483 in 2018, 412 in 2022, 1,442 in 2023, and 113 as of March 2024. The highest confirmed cases were in 2023 (1,236), followed by 2022, 2018, and 2017. Despite a rise until 2018, there has been a decline in deaths since then[5].

    The present investigation compared CCHF incidences nationally from January to March in 2022 to 2024. Surprisingly, no cases were reported in January to March in 2022 and 2023. However, in January 2024, 26 cases were confirmed, followed by 47 in February and 64 in March, totaling 137 cases with a CFR of 1%. These findings indicate a higher tendency for increased CCHF cases in 2024 compared to previous years[15].

    The present findings on occupational transmission of CCHF from 2007 to 2024 aligns with previous studies[16]. Most cases were from individuals categorized as 'others' (23%), followed by the unemployed (17%), housewives (14.5%), health staff (12.8%), shepherds (11%), butchers (7%), animal dealers, and farmers (7.6%), and students (6.7%). These patterns correspond with studies by Ahmad et al., Sahak, and research in Pakistan, which reported CFR rates ranging from 10% to 40%[5,17].

    Program experts suggest that the increase in CCHF cases may be linked to environmental factors. Drought and a lack of fodder in the West and North regions have led to dry pastures, prompting the migration of livestock and people to areas with better grazing conditions. This movement increases the potential for infected tick exposure as migrating herds mix with others[2,4,10].

    Data from the national surveillance system for the northeast region provinces (Kunduz, Takhar, Badakhshan, and Baghlan) showed Kunduz had the highest prevalence (29.6%), followed by Takhar (25.4%), Badakhshan (24%), and Baghlan (20.8%)[18]. This suggests a higher likelihood of prevalence in Kunduz and Takhar in the future. Domestic ruminants like cattle, goats, and sheep can act as reservoir hosts for CCHFV, making tick-borne diseases a significant concern due to their veterinary and public health implications. Hyalomma species are major vectors for CCHFV transmission to both animal and human hosts through bites[18,19]. Across eight districts in the Kunduz and Takhar provinces, a total of 720 ticks and 480 blood samples were collected. Of the 360 ticks sampled in each province, 73 in Kunduz and 81 in Takhar tested positive for CCHFV using RT-PCR and IgG ELISA (Fig. 5). Regarding blood samples, 29 out of 240 were positive in Kunduz, while 36 out of 240 were positive in Takhar. Seropositivity was higher in Takhar province than in Kunduz. In Takhar, Rustaq had the highest prevalence, followed by Taloqan, Khwaja Bahawodeen, and Khwaja Ghar, ranging from 10% to 2%. In Kunduz, Dasht-e-Archi had the highest prevalence, followed by Kunduz Center, Imam Sahib, and Char Dara, ranging from 8.2% to 2.4% (Fig. 5).

    Remarkably, among the eight districts of both provinces, Rustaq showed the highest prevalence of CCHF at 10%, followed by Dasht-e-Archi at 8.2%. Across both provinces, 102 (17%) tick samples were presumed positive and 117 (19.5%) blood samples out of 720 and 480, respectively (Fig. 5).

    These findings are in line with parallel studies conducted in various countries. For instance, in Gambia[20], a higher prevalence was reported in cattle compared to small ruminants (sheep and goats), which aligns with the present results. Similarly, studies[18,21] in different locations also revealed higher seropositivity of CCHFV in cattle than in goats and sheep, consistent with the present findings. Additionally, research in Pakistan reported the highest seroprevalence of CCHFV antibodies in cattle, followed by sheep and goats. Studies in Corsica, France[22] and Kosovo, Germany, also found higher seropositivity in cattle compared to sheep and goats[23].

    The present findings reveal higher seroprevalence in cattle compared to sheep, goats, and camels, suggesting they could serve as a source of CCHFV transmission to these animals during grazing interactions. This possibility is supported by previous research[24]. The elevated seroprevalence in cattle may be attributed to Hyalomma ticks, the primary carriers of CCHFV, which prefer feeding on larger animals like cattle. Ticks readily attach to cattle for feeding, facilitating efficient viral transfer between infected ticks and cattle. CCHFV replicates to higher levels in cattle compared to sheep, goats, and camels, leading to a higher viral load in the bloodstream. This increases the likelihood of ticks acquiring CCHFV when feeding on infected cattle.

    In the present study, a significantly higher seroprevalence of CCHF was found in female domestic animals compared to males (p > 0.05). This aligns with previous research[18,20,25,26]. The elevated seroprevalence in female domestic animals could be attributed to factors such as pregnancy stress, lactation stress, and limited access to balanced nutrition, which may reduce immunity and decrease their resistance to tick infestations.

    The present study supports previous findings that local breeds exhibit higher seropositivity compared to exotic breeds, as reported in previous studies[18,25]. Similarly, previous research[18,25] indicates that indigenous cattle breeds experience more tick infestations and external parasites compared to exotic breeds, potentially leading to higher seroprevalence. This similarity could be attributed to factors such as poor hygiene, limited access to quality feed, and inferior husbandry practices observed in Indigenous breeds compared to exotic breeds found in the study areas. The current study highlights higher seroprevalence in animals raised extensively or on communal grazing systems, while those in intensive housing systems exhibit lower seroprevalence. These findings align with previous research[18,24,27] . The increased seroprevalence in extensively raised animals may be attributed to their closer proximity to tick vectors, lack of acaricide use, and poor hygiene management practices on the farm. Conversely, the lower seroprevalence in animals kept in intensive housing systems may result from effective tick control measures, such as regular acaricide application and good hygiene practices, which reduce tick populations[27].

    Early studies support the present findings that higher seroprevalence in older and tick-infested cattle is age-dependent[28]. Seroprevalence in cattle increases with age and the presence of tick infestation, as documented in previous research[29]. Studies conducted in Kenya, northwestern Senegal, Afghanistan, and Uganda[30] also support this association between seroprevalence and age in cattle. Additionally, research suggests that the seroprevalence of CCHFV antibodies in domestic ruminants is dependent on age, with older animals exhibiting higher seroprevalence rates than younger ones[21]. This higher seroprevalence with age may be attributed to increased production of IgG antibodies in response to continuous exposure to CCHFV-infected ticks in older animals in endemic areas, compared to younger animals with maternal immunity.

    The present investigations have identified a correlation between the body condition of domestic animals and CCHFV antibody seroprevalence. Previous research[18] found a high seroprevalence in overweight ruminants, correlating with weight. They observed that obese animals were more susceptible to CCHF compared to emaciated animals due to weakened immunity. The present study supports this, revealing that obese domestic animals exhibited the highest seroprevalence, followed by those of average weight, and then emaciated animals, respectively.

    Furthermore, heavily infested ruminants play a crucial role in CCHFV transmission and can become sources of infection for healthy animals compared to tick-free animals, as reported previously[18,31]. Similarly, it was reported that tick-infested cattle have a higher seroprevalence compared to tick-free animals[28], which is fully consistent with the current study.

    Afghanistan, situated in the ecological range of the Hyalomma tick, experiences an annual increase in CCHF incidence[10,32]. The variation in seropositivity observed in the present study may be attributed to the endemicity of CCHF in the region, the significant abundance of ticks, and host behavior patterns influenced by climate changes and drought. Additionally, differences in laboratory examinations for molecular and serological detection of CCHFV antibodies, including specificity and sensitivity could contribute to these variations. These insights call for further investigation into the associated factors contributing to the rising number of CCHF cases within the country.

    The higher seroprevalence underscores a significant healthcare concern, given the recent rise in CCHF cases and fatalities in Afghanistan. The initial report highlights a notably elevated prevalence of CCHFV nationally and regionally, urging urgent attention to mitigate further spread, particularly in livestock. Extrinsic risk factors (husbandry practices, animal condition, and tick infestation) and intrinsic factors (species, sex, age, and breed) show significant associations with CCHFV seroprevalence, detected through IgG antibodies and RT-PCR analysis. Collaborating with Afghan molecular experts, an in-house molecular method has been developed for CCHF virus detection in ticks and blood samples, facilitating deeper genome studies. Early detection and understanding of risk factors in animal hosts aid in mapping endemic areas. Given CCHF's impact on human health, especially those in direct animal contact, control strategies are imperative. Livestock plays a vital role in rural Afghans' livelihoods and can transmit diseases. Raising local awareness, collaborating with health and veterinary departments, promoting animal health practices, and intensifying livestock husbandry alongside establishing active disease surveillance are essential for enhancing one-health approaches.

  • All procedures were reviewed and approved by the Animal Care and Research Committee of Ministry of Agriculture Irrigation and Livestock (MAIL), identification number: (KBL-2023–MAIL-03), approval date: 2023-12-09, and implemented based on the standard of Experimental Animal Care and Use Guidelines of Animals. The research followed the "Replacement, Reduction, and Refinement" principles to minimize harm to animals. This article provides details on the housing conditions, care, and pain management for the animals, ensuring that the impact on the animals is minimized during the experiment.

  • The authors confirm contribution to the paper as follows: writing – draft manuscript preparation, investigation, conceptualization: Hamdard E; formal analysis, data curation: Karwand B, Din Muhammad S; data collection – review & editing, methodology: Zahir A, Din Muhammad S, Mosavi SH. writing – final draft and editing: Sayedpoor S. All authors reviewed the results and approved the final version of the manuscript.

  • The original contributions presented in this study are included in the article/supplementary material. Further inquiries can be directed to the corresponding author.

  • The authors declare that they have no conflict of interest.

  • [1]

    Li SC, He P, Li LP, Zhang QQ, Shi SS, et al. 2018. Reliability analysis method of sub-classification of tunnel rock mass and its engineering application. Rock and Soil Mechanics 39(3):967−76

    doi: 10.16285/j.rsm.2016.2785

    CrossRef   Google Scholar

    [2]

    He MC, Xie HP, Peng SP, Jiang YD. 2005. Study on rock mechanics in deep mining engineering. Chinese Journal of Rock Mechanics and Engineering 24(163):2803−13

    doi: 10.3321/j.issn:1000-6915.2005.16.001

    CrossRef   Google Scholar

    [3]

    Zhou HW, Xie HP, Zuo JP. 2005. Developments in researches on mechanical behaviors of rocks under the condition of high ground pressure in the depths. Advances in Mechanics 35(1):91−99

    doi: 10.3321/j.issn:1000-0992.2005.01.009

    CrossRef   Google Scholar

    [4]

    Chinese Academy of Engineering. Prediction, forecast, early warning and prevention and control technology of rockburst, water inrush and mud inrush disasters. Beijing: Higher Education Press. pp. 121-23.

    [5]

    Qian QH. 2014. Definition, mechanism, classification and quantitative forecast model for rockburst and pressure bump. Rock and Soil Mechanics 35(1):1−6

    doi: 10.16285/j.rsm.2014.01.028

    CrossRef   Google Scholar

    [6]

    Li SC, Wang K, Li LP, Zhou ZQ, Shi SS, et al. 2017. Mechanical mechanism and development trend of water-inrush disasters in Karst tunnels. Chinese Journal of Theoretical and Applied Mechanics 49(1):22−30

    doi: 10.6052/0459-1879-16-345

    CrossRef   Google Scholar

    [7]

    Song B, Cao Y. 2013. Stability criterion of surrounding rock in roadway under blasting vibration load based on wavelet energy. Rock and Soil Mechanics 34(S1):234−40

    doi: 10.16285/j.rsm.2013.s1.038

    CrossRef   Google Scholar

    [8]

    Nanni A, Yang CC, Pan K, Wang J, Michael RR. 1991. Fiber-optic sensor for concrete strain-stress measurement. ACI Materials Journal 88(3):257−64

    Google Scholar

    [9]

    Ansari F, Yuan LB. 1998. Mechanics of bond and interface shear transfer in optical fiber sensors. Engineering Mechanics 124:385−94

    doi: 10.1061/(asce)0733-9399(1998)124:4(385)

    CrossRef   Google Scholar

    [10]

    Zhou Z, Li YL, Ou JP. 2006. Interface strain transfer mechanism and error modification of embedded FBG strain sensor. Journal of Harbin institute of Technology 38(1):49−55

    doi: 10.3321/j.issn:0367-6234.2006.01.015

    CrossRef   Google Scholar

    [11]

    Ling HY, Lau KT, Cheng L, Chow KW. 2005. Embedded fibre Bragg grating sensors for non-uniform strain sensing in composite structures. Measurement Science and Technology 16(12):2415

    doi: 10.1088/0957-0233/16/12/003

    CrossRef   Google Scholar

    [12]

    Wang W, Lin YC, Huang YG. 2008. Research on Strain transferring of Surface FBG sensor. Laser and infrared 38(12):1218−20(in Chinese)

    doi: 10.3969/j.issn.1001-5078.2008.12.010

    CrossRef   Google Scholar

    [13]

    Zhou ZD, Tan YG, Liu MY, Yang WY, Li ZY. 2013. Actualities and Development on Dynamic Monitoring and Diagnosis with Distributed Fiber Bragg Grating in Mechanical Systems. Journal of Mechanical Engineering 49(19):55−69(in Chinese)

    doi: 10.3901/JME.2013.19.055

    CrossRef   Google Scholar

    [14]

    Guo W, Li XL, Song H. 2011. Analysis of Strain Transfer of Fiber Grating Sensors Adhered to the Structure Surface. Measure Technology 31(4):1−4(in Chinese)

    doi: 10.3969/j.issn.1674-5795.2011.04.001

    CrossRef   Google Scholar

    [15]

    Tan YL, Zhang M, Xu Q, Guo WY, Yu FH, et al. 2019. Study on the mechanism, monitoring and early warning of rock burst induced by hard roof. Coal Science and Technology 47(1):166−72(in Chinese)

    doi: 10.13199/j.cnki.cst.2019.01.023

    CrossRef   Google Scholar

    [16]

    Pan YS, Geng L, Li ZH. 2010. Research on evaluation indices for impact tendency and danger of coal seam. Journal of China Coal Society 35(12):1975−78(in Chinese)

    doi: 10.13225/j.cnki.jccs.2010.12.006

    CrossRef   Google Scholar

    [17]

    Zhao TB, Tan YL, Zhang Z. 2010. Geomechanical mechanism of rock burst in deep level of Datai Mine. Journal of China Coal Society 35(12):2039−44(in Chinese)

    doi: 10.13225/j.cnki.jccs.2010.12.016

    CrossRef   Google Scholar

    [18]

    Lv JG, Jiang YD, Zhao YX, Zhu J, Gao F. 2013. Hierarchical monitoring for coal bumps and its study and application of early warning methods. Journal of China Coal Society 38(7):1161−67(in Chinese)

    doi: 10.13225/j.cnki.jccs.2013.07.023

    CrossRef   Google Scholar

    [19]

    Miao XX, Pu H, Bai HB. 2007. Principle of water resisting key strata and its application in water preserved mining. Journal of China Coal Society 32(6):561−64(in Chinese)

    doi: 10.3321/j.issn:0253-9993.2007.06.001

    CrossRef   Google Scholar

    [20]

    He MC. 2016. Research on the double-block mechanics based on Newton force measurement. Chinese Journal of Rock Mechanics and Engineering 35(11):2161−73(in Chinese)

    doi: 10.13722/j.cnki.jrme.2016.1012

    CrossRef   Google Scholar

    [21]

    He MC, Li C, Gong WL, Wang J, Tao ZG. 2016. Support principles of NPR bolts/cables and control techniques of large deformation. Chinese Journal of Rock Mechanics and Engineering 35(8):1513−29(in Chinese)

    doi: 10.13722/j.cnki.jrme.2015.1246

    CrossRef   Google Scholar

    [22]

    He MC, Ren SL, Tao ZG. 2021. Remote monitoring and forecasting system of Newton force for landslide geological hazards and its engineering application. Chinese Journal of Rock Mechanics and Engineering 40(11):2161−72(in Chinese)

    doi: 10.13722/j.cnki.jrme.2020.1189

    CrossRef   Google Scholar

    [23]

    Liu SJ, Wu LX, Mao YC, He LM, Wang Z, et al. 2020. Spaceborne-airborne-ground collaborated intelligent monitoring on open pit slope and its typical applications. Journal of China Coal Society 45(6):2265−76(in Chinese)

    doi: 10.13225/j.cnki.jccs.zn20.0362

    CrossRef   Google Scholar

    [24]

    Qiu DW, Zhu SJ, Wang LY, Duan MX. 2018. Dynamic monitoring and analysis of geological disaster deep displacementusing SAA. Bulletin of Surveying and Mapping 3:122−125,129(in Chinese)

    doi: 10.13474/j.cnki.11-2246.2018.0089

    CrossRef   Google Scholar

    [25]

    Li Y. 2019. Analysis of landslide monitoring results based on arraydisplacement meter. Shaanxi Water Resources 7:35−38(in Chinese)

    Google Scholar

    [26]

    Dong WW, Zhu HH, Sun YJ, Shi B. 2016. Current status and new progress on slope deformation monitoring technologies. Journal of Engineering Geology 24(6):1088−95(in Chinese)

    doi: 10.13544/j.cnki.jeg.2016.06.007

    CrossRef   Google Scholar

    [27]

    Wang T, Liu XY, Lin YM, Li G. 2019. Design, implementation and early warning method of slope deep displacement and groundwater level monitoring in Internet of Things. Highway Transportation Technology (Applied Technology) 15(2):52−55(in Chinese)

    Google Scholar

    [28]

    Fan YB, Hou YF, Li SH. Liu XY. 2013. Landslide stability analysis based on surface and deep displacement monitoring data. Journal of Engineering Geology 21(6):885−91(in Chinese)

    doi: 10.3969/j.issn.1004-9665.2013.06.015

    CrossRef   Google Scholar

    [29]

    Chen H, Li YJ, Fang R, Li G. 2015. A novel technique for monitoring deep displacement and early-warning of landslide. Chinese Journal of Rock Mechanics & Engineering 34(S2):4063−70

    doi: 10.13722/j.cnki.jrme.2015.0867

    CrossRef   Google Scholar

    [30]

    Liu YL, Sun HY. 2013. Research on deformation monitoring and determination of displacement of anti-slide piles. Chinese Journal of Rock Mechanics and Engineering 32(10):2147−53(in Chinese)

    Google Scholar

    [31]

    Zhang ZL, He N, He B, Xu BH, Jiang YB. 2020. New method to measure structure stress based on distributed optical fiber technology. Chinese Journal of Scientific Instrument 41(9):45−55

    doi: 10.19650/j.cnki.cjsi.J2006699

    CrossRef   Google Scholar

    [32]

    Wei YC. 2015. A study on SAA measurement technology and its application in slope monitoring. Thesis. Nanjing University, Nanjing. pp. 55−78 (in Chinese).

    [33]

    Chai J, Qiu FQ, Li TB, Zhang DD, Liu Q, et al. 2019. Study on Pull-out Test of Anchor Bolt Based on FBG-BOTDA Combined Sensing Technology. Safety In Coal Mines 50(10):62−65(in Chinese)

    doi: 10.13347/j.cnki.mkaq.2019.10.014

    CrossRef   Google Scholar

    [34]

    He MC, Du S, Gong WL, Nie W. 2022. Mechanical characteristics and engineering applications of bolt / cable with negative poission's ratio. Mechanics in Engineering 44(1):75−87(in Chinese)

    doi: 10.6052/1000-0879-21-210

    CrossRef   Google Scholar

    [35]

    Liu Y, Li SH, Liu XY. 2011. Application of guyed-type landslide surface displacement real-time monitoring system. The Chinese Journal of Geological Hazard and Control 12(4):24−31(in Chinese)

    doi: 10.16031/j.cnki.issn.1003-8035.2011.04.005

    CrossRef   Google Scholar

    [36]

    Zhang XJ, Ye DM, Guo JB, Hu SY, Yu B. 2022. Deformation influence control technology of deep and large foundation pits near subway stations. Building Structure 52(S1):2508−12(in Chinese)

    Google Scholar

    [37]

    Zhang LM, Zhu GP, Zheng XY, Yang ZD. 2017. Monitoring and analysis of influence of excavations on adjacent metro structures in soft soils. Chinese Journal of Geotechnical Engineering 39(S2):175−79(in Chinese)

    doi: 10.11779/CJGE2017S2043

    CrossRef   Google Scholar

    [38]

    Li YT, Ding QJ. 2011. The Monitoring and Analysis of the Subway Deep Excavation the Bearing Axial Forces and Retaining Structure Deformation. Railway Construction Technology 1:102−104+115(in Chinese)

    doi: 10.3969/j.issn.1009-4539.2011.01.024

    CrossRef   Google Scholar

    [39]

    Ren QY, Liu WT, Zhao QY, Yang SL, Li S. 2018. The Top-down Construction Method of Super High-rise Buildings in Structural Design of the Nanking Youth Olympic Center. Construction Science and Technology 16:20−22(in Chinese)

    doi: 10.16116/j.cnki.jskj.2018.16.002

    CrossRef   Google Scholar

    [40]

    Bao ZJ, Yao ZY, Sheng H, Zhang Z. 2019. Construction Technology for Permanence and Temporariness Combined Tower Crane Foundation Based on Conditions of Central Part by Bottom-Up Method and Peripheral Part by Top-Down Method. Building Construction 41(1):56−58(in Chinese)

    doi: 10.14144/j.cnki.jzsg.2019.01.021

    CrossRef   Google Scholar

    [41]

    Zhang XY, Qian DL, Wei XY. 2015. Study of deformation control in deep foundation pit excavation on saturated soft soil foundation and its risk. Journal of Hefei University of Technology(Natural Science) 38(2):208−12(in Chinese)

    doi: 10.3969/j.issn.1003-5060.2015.02.015

    CrossRef   Google Scholar

    [42]

    Zheng G. 2022. Method and application of deformation control of excavations in soft ground. Chinese Journal of Geotechnical Engineering 44(1):1−36(in Chinese)

    doi: 10.11779/CJGE202201001

    CrossRef   Google Scholar

    [43]

    Wang RS, Guo CC, Cao DF, Ye JT, Ye SC. 2021. Deformation Characteristics of Flexible Support Structure in Silt Foundation Pit. Science Technology and Engineering 21(5):2011−18(in Chinese)

    Google Scholar

    [44]

    Zong LD, Wang WD, Xu ZH, Zhu YF. 2022. Mechanical properties of a 56-m deep circular shaft foundation pit support structure in soft soils. Tunnel Construction 42(7):1248−56(in Chinese)

    doi: 10.3973/j.issn.2096-4498.2022.07.013

    CrossRef   Google Scholar

    [45]

    Zhang Y. 2021. Analysis of monitoring case of deep foundation pit of a high-rise residential building in Chengde. Engineering Technology Research 6(21):139−40(in Chinese)

    Google Scholar

    [46]

    Xi JM, Chen RQ. 2020. Deformation and surface settlement analysis of super-deep and large foundation pit excavation enclosure structures in soft soil area. Building Science 36(3):143−50(in Chinese)

    doi: 10.13614/j.cnki.11-1962/tu.2020.03.022

    CrossRef   Google Scholar

    [47]

    Ji XP, Zhang ZC, Li K, Zhang C, Qian K. 2022. Application of distributed optical fiber monitoring technology in monitoring of excavation. Journal of Zhongyuan University of Technology 33(6):49−53(in Chinese)

    doi: 10.3969/j.issn.1671-6906.2022.06.009

    CrossRef   Google Scholar

    [48]

    Wang HX, Teng H, Li QL, Wang J, Luo ZH. 2019. Application of large diameter anchor in foundation pit reinforcement in deep soft soil area. Building Structure 49(S1):779−82(in Chinese)

    Google Scholar

    [49]

    Lei M. 2016. Deformation law of a deep foundation pit retaining structure in Lanzhou. Railway Construction Technology 5:92−95(in Chinese)

    Google Scholar

    [50]

    Ciufegni S, Sacchi F, Utzeri L. 2012. Retaining walls, ground improvement works and monitoring for the new high-speed railway station in Bologna. Geomechanics and Tunnelling 5(3):261−74

    doi: 10.1002/geot.201200019

    CrossRef   Google Scholar

    [51]

    Hashash YMA, Song H, Osouli A. 2011. Three-dimensional inverse analyses of a deep excavation in Chicago clays. International Journal for Numerical and Analytical Methods in Geomechanics 35(9):1059−75

    doi: 10.1002/nag.949

    CrossRef   Google Scholar

    [52]

    Pilgerstorfer T, Radončić N, Moritz B, Goricki A. 2011. Evaluation and Interpretation of monitoring data in the test adit EKT Paierdorf. Geomechanics and Tunnelling 4(5):423−34

    doi: 10.1002/geot.201100036

    CrossRef   Google Scholar

    [53]

    Wang JH, Chen JJ, Li MG. 2015. Concept and characters of deep excavation groups in urban underground space development. Japanese Geotechnical Society Special Publication 2(44):1559−62

    doi: 10.3208/jgssp.atc6-07

    CrossRef   Google Scholar

    [54]

    Tan Y, Wang D. 2013. Characteristics of a large-scale deep foundation pit excavated by the central-island technique in Shanghai soft clay. I: Bottom-up construction of the central cylindrical shaft. Journal of Geotechnical and Geoenvironmental Engineering 139(11):1875−93

    doi: 10.1061/(ASCE)GT.1943-5606.0000928

    CrossRef   Google Scholar

    [55]

    Liu JH, Zhang XH, Wang KF, Peng KD, Yang XF. 2020. Quality analysis of deformation surveying results. Geotechnical Investigation and Surveying 48(12):49−52,62

    Google Scholar

    [56]

    Zevgolis IE, Daffas ZA. 2018. System reliability assessment of soil nail walls. Computers and Geotechnics 98:232−42

    doi: 10.1016/j.compgeo.2017.10.020

    CrossRef   Google Scholar

    [57]

    Liu AH, Li H, Luo RW. 2010. Application of the Space-Time Effect Theory in the Soft-Soil Foundation Construction. Chinese Journal of Underground Space and Engineering 6(3):571−576+594

    doi: 10.3969/j.issn.1673-0836.2010.03.025

    CrossRef   Google Scholar

    [58]

    Pan Y, Fang F, Li B, Wang F. 2019. Stability analysis and full-scale test of a new recyclable supporting structure for underground ecological granaries. Engineering Structures 192:205−19

    doi: 10.1016/j.engstruct.2019.04.087

    CrossRef   Google Scholar

    [59]

    Chen ZX. 2022. Research on deformation of a deep large foundation pit supporting structure. Geotechnical Investigation & Surveying 50(1):65−69

    Google Scholar

    [60]

    Li QQ. 2016. Sesearch into the effection of adjacent building to excavation. Thesis. Chang'an University. Shan'xi. pp: 46−88(in Chinese).

    [61]

    Xi JM, Fu L. 2019. Analysis of deformation law of deep foundation pit based on space-time effect. Science Technology and Engineering 19(16):290−97

    Google Scholar

    [62]

    Jiang J, Xiao M, Liu ZY, Wang Z, Yang D. 2018. Monitoring of deep foundation pit with a combination of various supporting systems under complicated environment. Journal of Guangxi University (Natural Science Edition) 43(1):268−78(in Chinese)

    doi: 10.13624/j.cnki.issn.1001-7445.2018.0269

    CrossRef   Google Scholar

  • Cite this article

    Wan Z, Qin J, Wei Z. 2023. Overview of technical research on safety monitoring, early warning, and risk assessment for underground structural engineering construction. Emergency Management Science and Technology 3:18 doi: 10.48130/EMST-2023-0018
    Wan Z, Qin J, Wei Z. 2023. Overview of technical research on safety monitoring, early warning, and risk assessment for underground structural engineering construction. Emergency Management Science and Technology 3:18 doi: 10.48130/EMST-2023-0018

Figures(7)  /  Tables(1)

Article Metrics

Article views(3401) PDF downloads(444)

Other Articles By Authors

REVIEW   Open Access    

Overview of technical research on safety monitoring, early warning, and risk assessment for underground structural engineering construction

Emergency Management Science and Technology  3 Article number: 18  (2023)  |  Cite this article

Abstract: On the basis of systematically sorting out the potential risk sources of underground structure construction, this paper describes the surrounding medium of underground structure as soil mass and rock mass. The main risk source of the underground structure based on soil medium comes from the construction mechanics analysis in the construction stage, and the leading factor of the underground structure loading in the construction stage is the stress-strain relationship of soil based on the unloading path. The deep underground engineering structure is faced with a series of disasters such as high-strength water escape, high-strength rock burst, large deformation of soft rock, boulder collapse and rock burst under the action of unloading. In view of the unloading paths faced by the above two different media, the corresponding physical models are developed to describe the above phenomena according to their respective disaster evolution mechanism and disaster breeding mechanism, and the corresponding indexes required for the safety of engineering structures are obtained by solving the physical equations. According to the above indicators, the engineering structure and surrounding media in the construction process are monitored accordingly, and the feedback of the monitoring data is used to obtain the risk assessment and modify the current construction sequence, so as to provide a reference for better serving the construction safety of underground engineering structures.

    • Underground structures are generated during the production or construction process of underground spaces, and different underground structures face different underground environments and disaster risks. For example, in the deep underground coal mining process, the support structures of tunnels are established in the coal and rock environment, and face hazards caused by rocks and underground water, such as rock bursts, gas outbursts, and underground water leakage. These problems are inherent in the deep rock mass environment and require a deep understanding of the mechanical behavior of deep rock masses and the laws of underground water in order to better serve safety production through monitoring means.

      For urban underground space development, due to the shallow depth, underground structures exist in the soil environment, and thus the interaction between the soil and structures becomes the main contradiction. The static and dynamic mechanical behavior of soil and the interaction between soil and underground structures are the key points that need to be mastered. With the acceleration of urbanization, underground structure engineering has become an important component of urban construction. However, the construction of underground structure engineering is difficult, and there are safety risks due to the complex construction environment. In order to ensure the safety of underground structure construction, monitoring and risk warning assessments are needed. This article will explore the monitoring of underground structure construction, risk assessment methods, and their applications.

      The response to external load of underground structure and above-ground structure is very different due to different environments. For example, under the action of earthquake load, the seismic force on the above-ground structure is often manifested as the failure mechanism dominated by inertial force, while the underground structure is due to the interaction between the structure and the surrounding rock mass or soil mass under earthquake action. Therefore, the failure result of underground structures is usually caused by the extrusion or deformation of rock mass or soil mass to the structure. Through statistical analysis of the dynamic failure results of underground structures under different buried depths, the investigation results show that the damage of underground structures built in soil is usually more serious than that in hard rock mass, and the damage degree of underground structures decreases with the increase of the thickness of the cover layer. The underground structure based on the development of urban underground space is usually located in the shallow soil stratum space, and the prevention and early warning of earthquake disasters are still mainly based on above-ground monitoring. Meanwhile, the underground structure has a passive defense design for earthquake action. On the other hand, the surrounding medium of underground structures such as coal mines or hydropower stations in deep rock mass is rock mass, and the occurrence environment of rock mass is more complex, with prominent problems such as high ground stress, high ground temperature and high osmotic pressure, presenting strong sudden water gushes, high-strength rock burst, sustained large deformation of soft rock, boulder collapse, coal mine rock burst and other phenomena. Therefore, the main disasters faced by deep underground engineering structures are not earthquake disasters, but the external environment determined by the stress state of rock mass caused by high ground stress. Therefore, it is necessary to set up monitoring schemes for disaster types respectively. For example, for underground structures under shallow soil, such as subway stations, underground shopping malls, underground tunnels and other engineering structures, grating fiber sensors need to be arranged to monitor structural deformation and surrounding soil displacement data. For the deformation monitoring of deep rock mass structure, it is necessary to combine the occurrence characteristics of rock mass and the characteristics of potential damage caused by the outside world to rock mass formation to carry out targeted measurement point arrangements[17].

    • Underground space structure in a city is used to expand the urban living space and utilize space. Main underground structures include subway stations, section tunnels, underground shopping malls, underground parking lots, underground integrated pipe corridors among others. Disaster risk sources of underground structures are mainly divided into disasters during construction and disasters during service. In the construction process, changes in the stress field and seepage field of underground rock and soil mass caused by construction activities have damage effects on the existing environment and structure. The damage during service refers to the damage of underground engineering structures formed by normal use or the damage of underground structures caused by earthquakes during normal use. In order to grasp the working state of the engineering structure in the construction stage or the service stage in real time, it is necessary to monitor its condition in order to evaluate the health state of the engineering structure. As the construction process is an orderly loading process with time, the stress of the underground soil layer is in the stage of gradual release, while the corresponding load is gradually applied to the underground engineering structure. The corresponding monitoring objects and monitoring indicators should be able to reflect the characteristics of the above gradual change, such as the horizontal displacement of the supporting structure, the internal force of the supporting pile, and the vertical and horizontal displacement of the surrounding structure.

      There are several main measurement methods for construction process monitoring, including the following: Construction monitoring methods for underground structural engineering include surface measurement, underground measurement, and sensor monitoring. Surface measurement refers to measuring the deformation of excavation using traditional measurement methods, such as total station and level. Underground measurement refers to monitoring the support structure and underground building using underground measuring instruments, such as inclinometers and pressure gauges. Sensor monitoring refers to fixing sensors at positions such as excavation, support structures, and underground buildings to collect data for monitoring. Types of sensors include displacement sensors, pressure sensors, and seepage meters. In the monitoring of underground engineering structures, fiber optic grating sensors are used to measure the stress and strain of underground structures. In 1991, Nanni et al.[8] embedded fiber optic grating sensors in concrete structures for the first stress-strain test of structures. In 1998, Ansari & Yuan[9] analyzed the strain transmission theory of fiber optic sensors in more detail, assuming that the strain at the center of the embedded fiber optic grating is the same as that of the substrate, and obtained the axial strain distribution of the fiber optic grating. In addition, other researchers[1014] further studied the accuracy of fiber optic grating sensors in concrete measurement.

    • Monitoring and measurement technology for underground structures usually focuses on the stress and displacement of the support structure of excavation earthwork, and the information sources and monitoring schemes are relatively simple. For the deformation monitoring of engineering structures in soil layers, it is generally based on the deformation of the soil during excavation and the changes in soil pressure, and the deformation and stress mechanisms in shallow strata can be well predicted, so monitoring points can be arranged accordingly. However, for tunnels with depths of hundreds or even thousands of meters, such as those in coal mining, the underground deep rock mass is structurally complex and subject to complex structural stresses. The rock mass itself has various types of cracks, joints, and heterogeneity. In addition, it is always in a dynamic process of construction and production, which can cause dynamic stress problems such as rockburst, gas outburst, and underground tunnel water inrush[1518]. Therefore, for the monitoring of deep rock masses, although increasing the monitoring density can improve the monitoring effect, the workload and equipment costs will increase exponentially. In addition, there are differences between the monitoring devices and monitoring systems, and the information is difficult to share. Moreover, the generation mechanism and rules of impact dynamic behavior of deep rock masses are not yet clear, and the dynamic change rules have not been fully grasped.

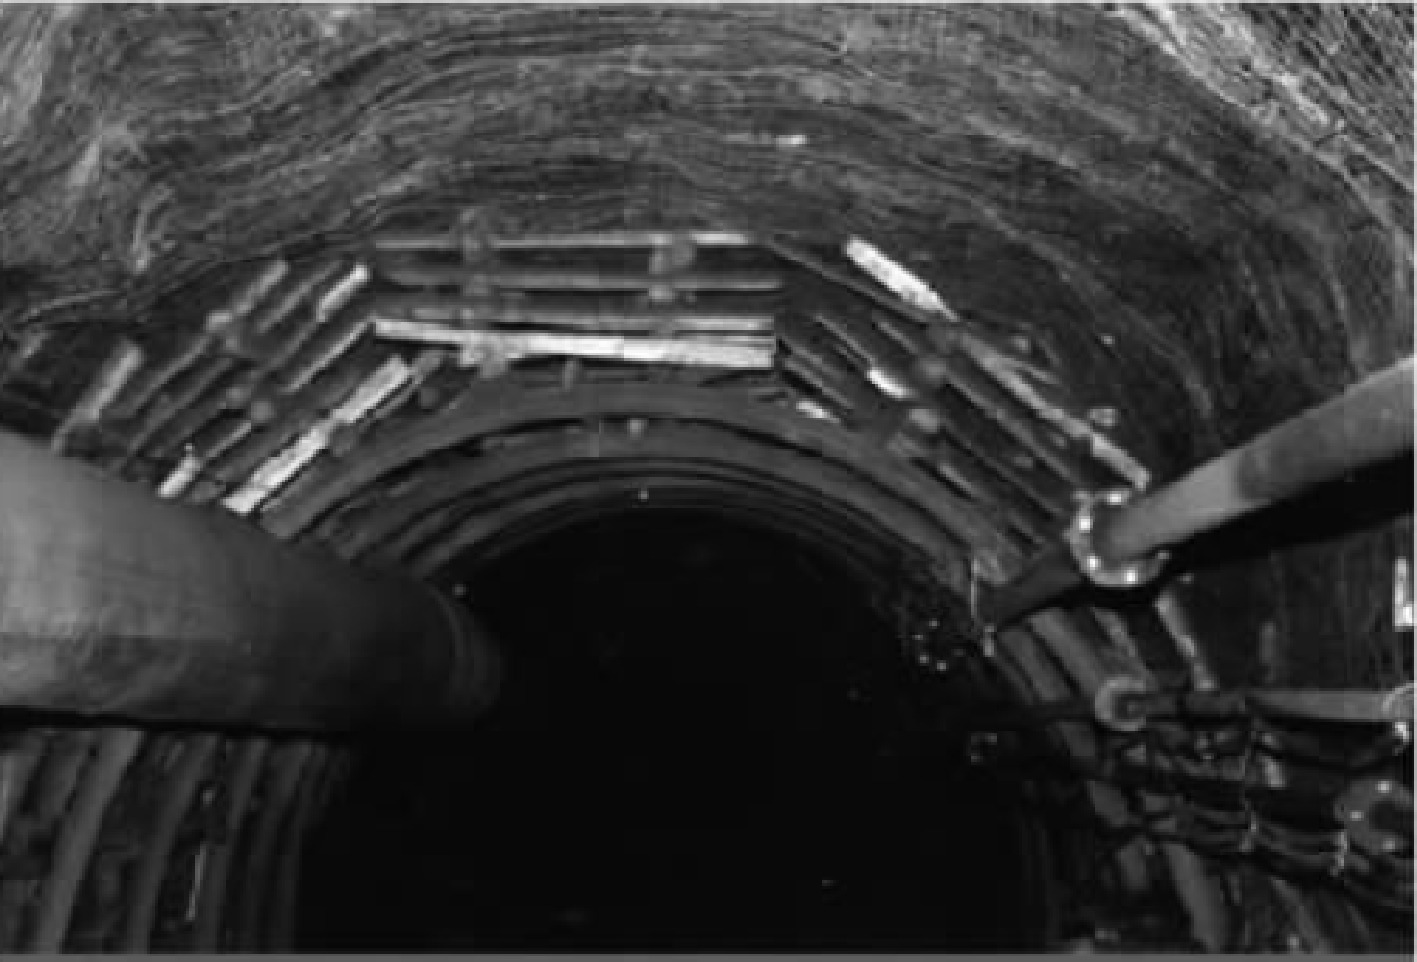
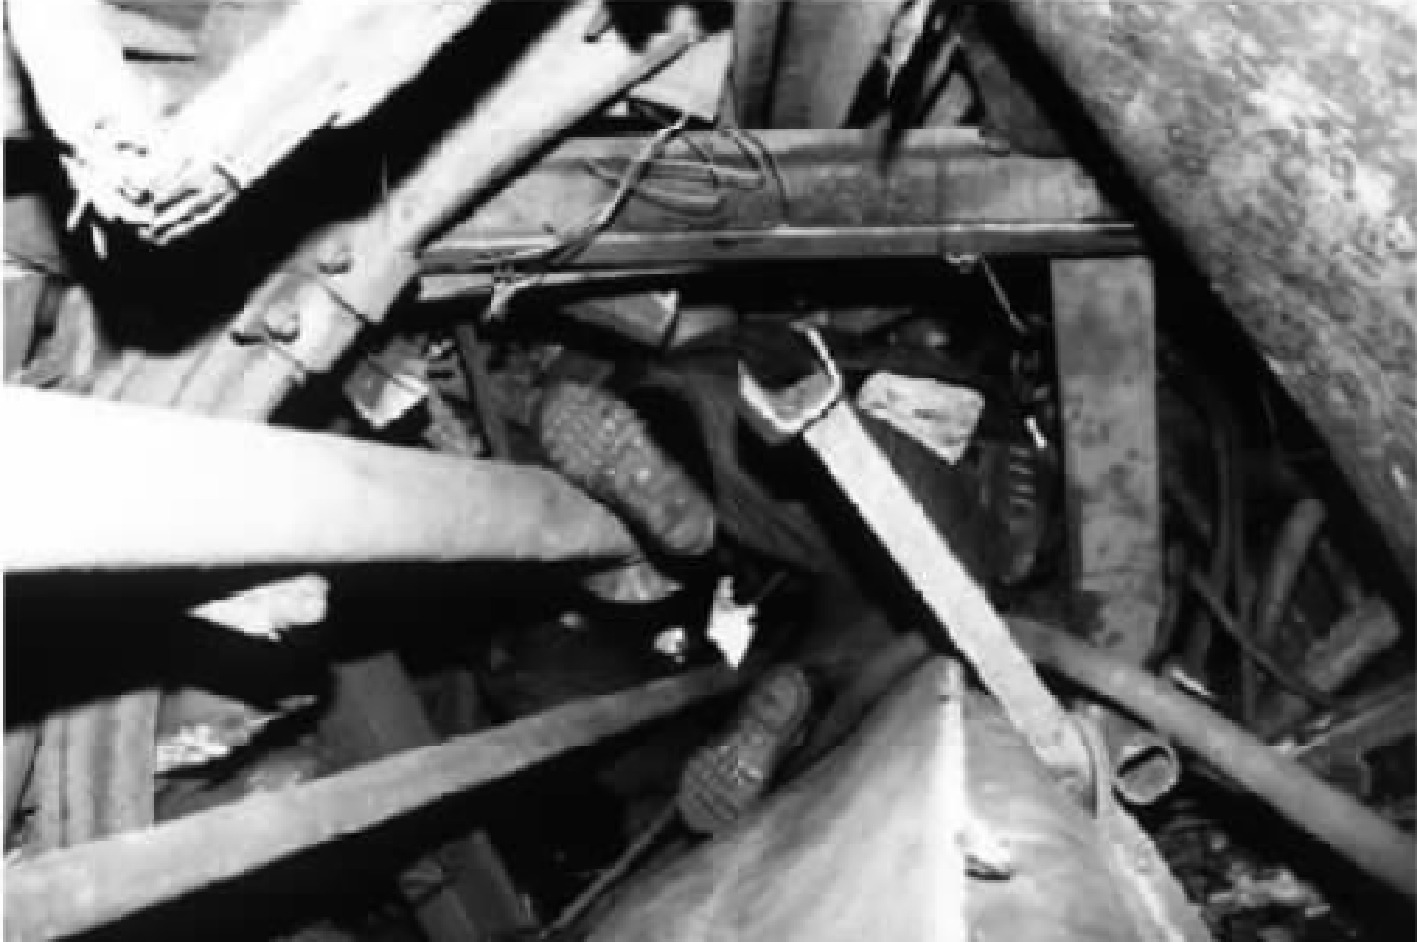
      Currently, there are still some difficulties in the dynamic monitoring of deep rock masses, including: (1) the effective monitoring range of deep rock masses is difficult to determine; (2) it is difficult to accurately classify the monitoring warning levels; (3) the monitoring sensors of deep rock masses are difficult to deploy; and (4) there is a time lag in knowing the existence of on-site production based on monitoring warning information. For the problem of fault water inrush in deep rock masses, the monitoring warning time domain is first determined to be the stage of crack initiation, and then the spatial distribution range of monitoring warning space domain is determined using the key water-blocking layer theory[19] and geophysical methods. Whether the fault zone produces water inrush phenomenon needs to analyze the temperature field of sandstone strata rich in groundwater and the change of seepage pressure field to determine the monitoring warning threshold. Then, sensors are used to implement control in the determined monitoring space domain, and the extension trend of deep rock mass fracture zone is sent in a timely manner. According to the deep rock mass monitoring warning discrimination criteria, the warning levels during the mining process are classified, which can achieve safe mining of coal resources. Generally, the formation mechanism of impact ground pressure in deep rock masses can be roughly divided into the following three types: (1) Deep strain type impact ground pressure, which accumulates a large amount of elastic energy in the surrounding rock under high stress in deep rock masses. Once the unloading confinement pressure is released, the elastic energy is rapidly released, causing impact disasters. (2) Deep hard roof type impact ground pressure. The exposed area of the deep hard roof in the goaf is much larger than in the shallow part, and more energy is accumulated. When it suddenly fractures, a large amount of energy is input into the coal rock system, causing rapid damage to the coal and causing impact disasters. The difference in the combination of the hard roof with the coal seam under deep conditions has a more prominent impact on the degree of impact. (3) Deep fault slip type impact ground pressure. When a fault is activated, a large amount of elastic energy accumulates in the top plate near the fault under high overlapping stress and is suddenly released, which accelerates the sliding of the fault and causes rapid damage to the coal seam, resulting in an impact disaster. As shown in Figs 1 and 2, the comparison view of impact ground pressure failure can be displayed.

      Figure 1. 

      Deep rock mass roadway support before impact ground pressure failure.

      Figure 2. 

      Deep rock mass roadway support after impact ground pressure failure.

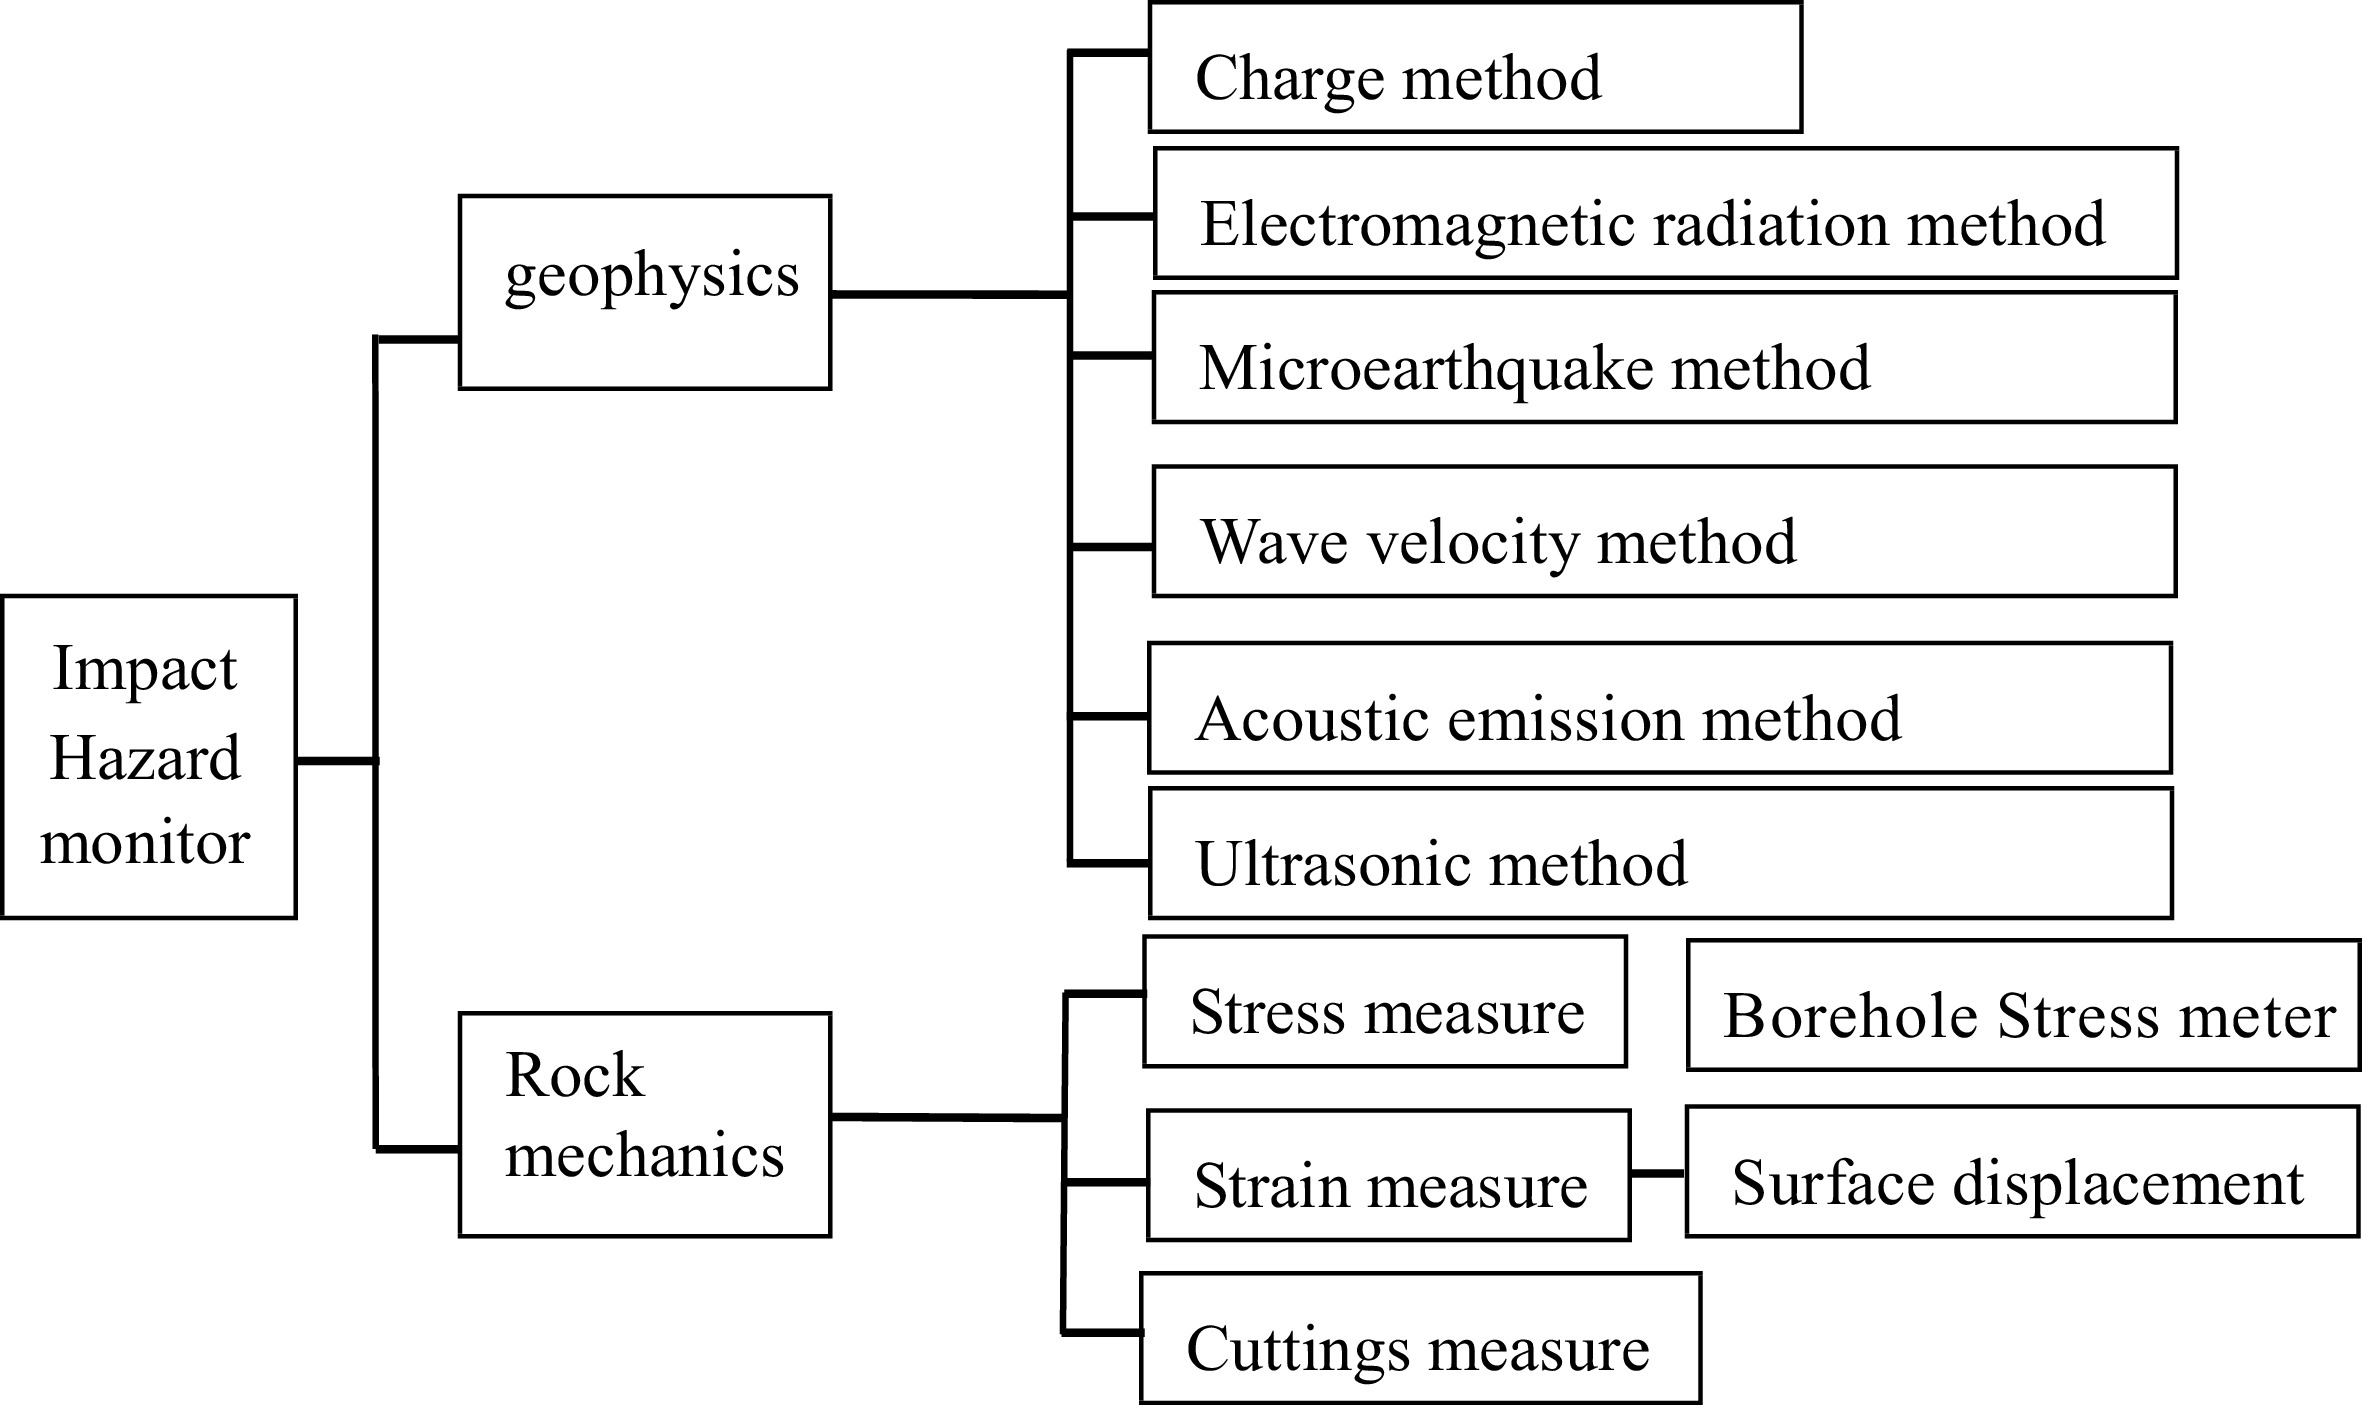
      There are various methods for early warning and monitoring of impact ground pressure disasters[2026]. As shown in Fig. 3, they can be broadly classified into two categories: physical methods and mechanical methods. Physical methods utilize various instruments to capture information about energy changes released to the outside world during rock mass rupture, such as waves, sound, and electrical resistivity information. The potential development state of impact ground pressure is obtained by interpreting the above information. Mechanical methods rely on equipment to directly test the rock mass. For example, the drilling debris method is simple, practical, and intuitive, but the number of boreholes is small, the detection range is limited, and important blind spots are often missed in practical operation. Although the deformation-based dynamic top plate instrument method and roadway surface displacement method are simple and practical, their disadvantages are limited deployment range and small monitoring range. The borehole stress meter method also suffers from the problem of limited monitoring range.

      Figure 3. 

      Various monitoring methods for impact ground pressure.

      Another method for testing impact ground pressure is to use displacement meters installed in the blank area between roadway support anchor rods. Multiple displacement meters are arranged on the cross section to monitor the deformation at various locations. For deep rock mass water inrush issues, fiber optic grating demodulators, fiber optic grating thermometers, fiber optic grating seepage pressure gauges, collection hosts, and signal transmission fiber optic cables can be used. They are installed on the roadway cross section, and the sensors are installed in the boreholes of the deep rock mass to collect water temperature and pressure signals for monitoring the direction of water flow[2733]. Whether there is a sudden water inflow during the initiation stage of fault fissures depends on whether the fissures can cause the overlying aquifers to move along the fault zone and be uplifted along the fractures in the coal seam roof. By analyzing the changes in the mixed water temperature field and seepage pressure field in the monitoring area, the monitoring and warning threshold can be determined, and a warning sign for delayed water inrush monitoring of faults can be established.

      Blast vibration monitoring technology is a technique that monitors blast vibration using vibration sensors. This technology is usually used in mining, construction sites, tunnels, and other situations that require blasting operations to ensure that the impact of blasting operations on the surrounding environment is within acceptable limits. Vibration sensors are devices that measure the vibration of an object, usually using accelerometers or vibration sensors to measure the acceleration or velocity of the object. When an object vibrates, the vibration sensor captures the vibration signal by measuring the acceleration or velocity. In blast vibration monitoring, vibration sensors are installed in the area to be monitored, such as surrounding buildings or the ground. During the blasting process, the vibration sensor captures the vibration signal caused by the blast and transmits the signal to the data acquisition system or monitoring system for processing and analysis. By analyzing the vibration signal, the impact of the blasting operation on the surrounding environment, such as the structural safety of buildings, foundation stability, and environmental noise, can be evaluated. If the vibration signal exceeds the preset safety threshold, the monitoring system will issue an alert and take necessary measures to protect the surrounding environment and personnel safety.

      Microseismic monitoring technology is mainly used to record the vibration energy during mining operations, and then analyze and determine the direction of the vibration. By locating the epicenter, the overall dynamic behavior of the mine can be evaluated. Microseismic monitoring activities are carried out around the entire mining area, comprehensively recording the situation of microseismic activity, achieving accurate calculation of the source location and micro-positive energy, and providing powerful data information for the assessment of rockburst hazards. The ground sound monitoring technology used mainly involves configuring low-frequency sensors to achieve comprehensive monitoring of the mining-induced impact zone.

      As shown in Fig. 4, a monitoring procedure can be exhibited. Generally, centralized monitoring of the production area is carried out using corresponding data information, such as comprehensive analysis of frequency and energy, to determine the main rules of ground sound activity, and then infer the stress and damage degree of the coal and rock mass, analyze the stability of the coal and rock mass, and accurately judge the impact risk. In addition, electromagnetic radiation methods can also be used. Typically, when the coal and rock mass fractures or breaks under load, electromagnetic radiation and sound emission signals are produced. By analyzing the dynamic changes of various signals, accurate early warning of coal and rock dynamic disasters can be achieved, providing support for safety supervision. Actual monitoring projects usually use a comprehensive approach using multiple methods. First, the occurrence mechanism of rockburst is preliminarily judged based on the principles of rockburst, and severe coal and rock mass damage and high stress concentration are usually the precursor of rockburst. By in-depth exploration of microseismic, electromagnetic radiation, and drilling debris methods, the approximate occurrence range of rockburst can be determined. Microseismic monitoring is used for real-time monitoring of the entire system, and drilling debris methods are used to monitor key local areas, thereby constructing a multi-level monitoring system.

      Figure 4. 

      Deep roadway water inrush monitoring system principles.

      To effectively prevent landslide damage in open-pit mining, the team led by He et al.[34] Manchao from China University of Mining and Technology invented the Negative Poisson's Ratio (NPR) anchor and applied it in open-pit mining engineering. NPR technology has also been applied in the engineering monitoring of large slopes[24, 26, 35]. Based on the mechanism of landslides, a dual-block catastrophic mechanical model was proposed, and the sudden decrease in sliding Newton force between the landslide body and the sliding bed was used as a criterion for monitoring landslide initiation. Based on this principle, the 'Landslide Newton Force Remote Monitoring and Early Warning System' was developed, which can effectively monitor the development process of landslides in real-time. According to the curve of the landslide development process, it is divided into four stages, and a four-stage early warning mechanism is established. Through this warning mechanism, the status of the slope can be accurately judged, providing accurate and real-time warning information and reference for mining schemes in open-pit mining.

    • In the current urban development process, due to various factors affecting ground transportation and limited usage area, underground engineering has become a direction for infrastructure growth dedicated to tapping the potential of the city. However, underground engineering is different from above-ground engineering and is greatly influenced by the surrounding environment, especially the mechanical properties of the geological layers. Therefore, for underground structural engineering construction such as foundation pits, underground shopping malls, subway stations, underground tunnels, etc., there are inevitably significant safety issues. This requires planned and targeted construction process monitoring, which spans the entire construction process, and requires real-time feedback of monitoring data to understand the ground settlement, underground structure displacement, and changes in groundwater level in detail. Mastering the change laws is helpful for judging the safety of underground structures[3646].

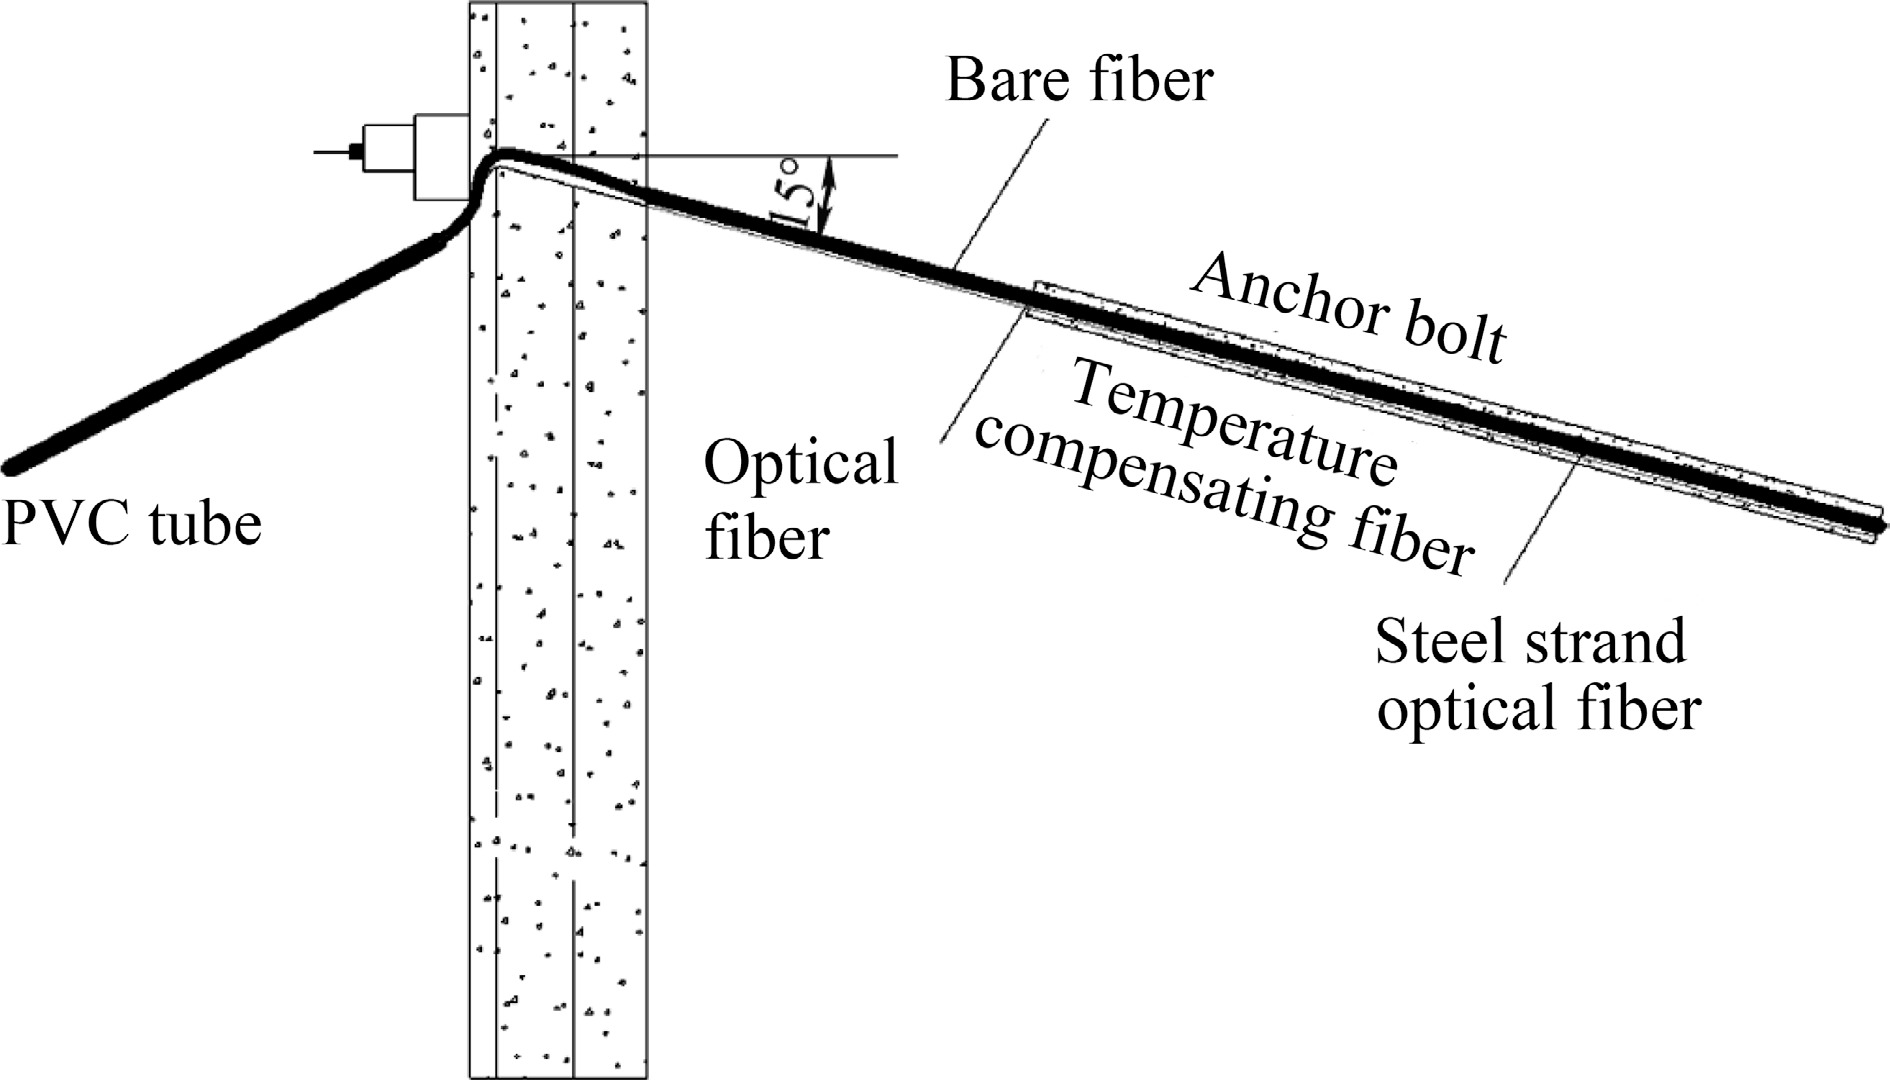
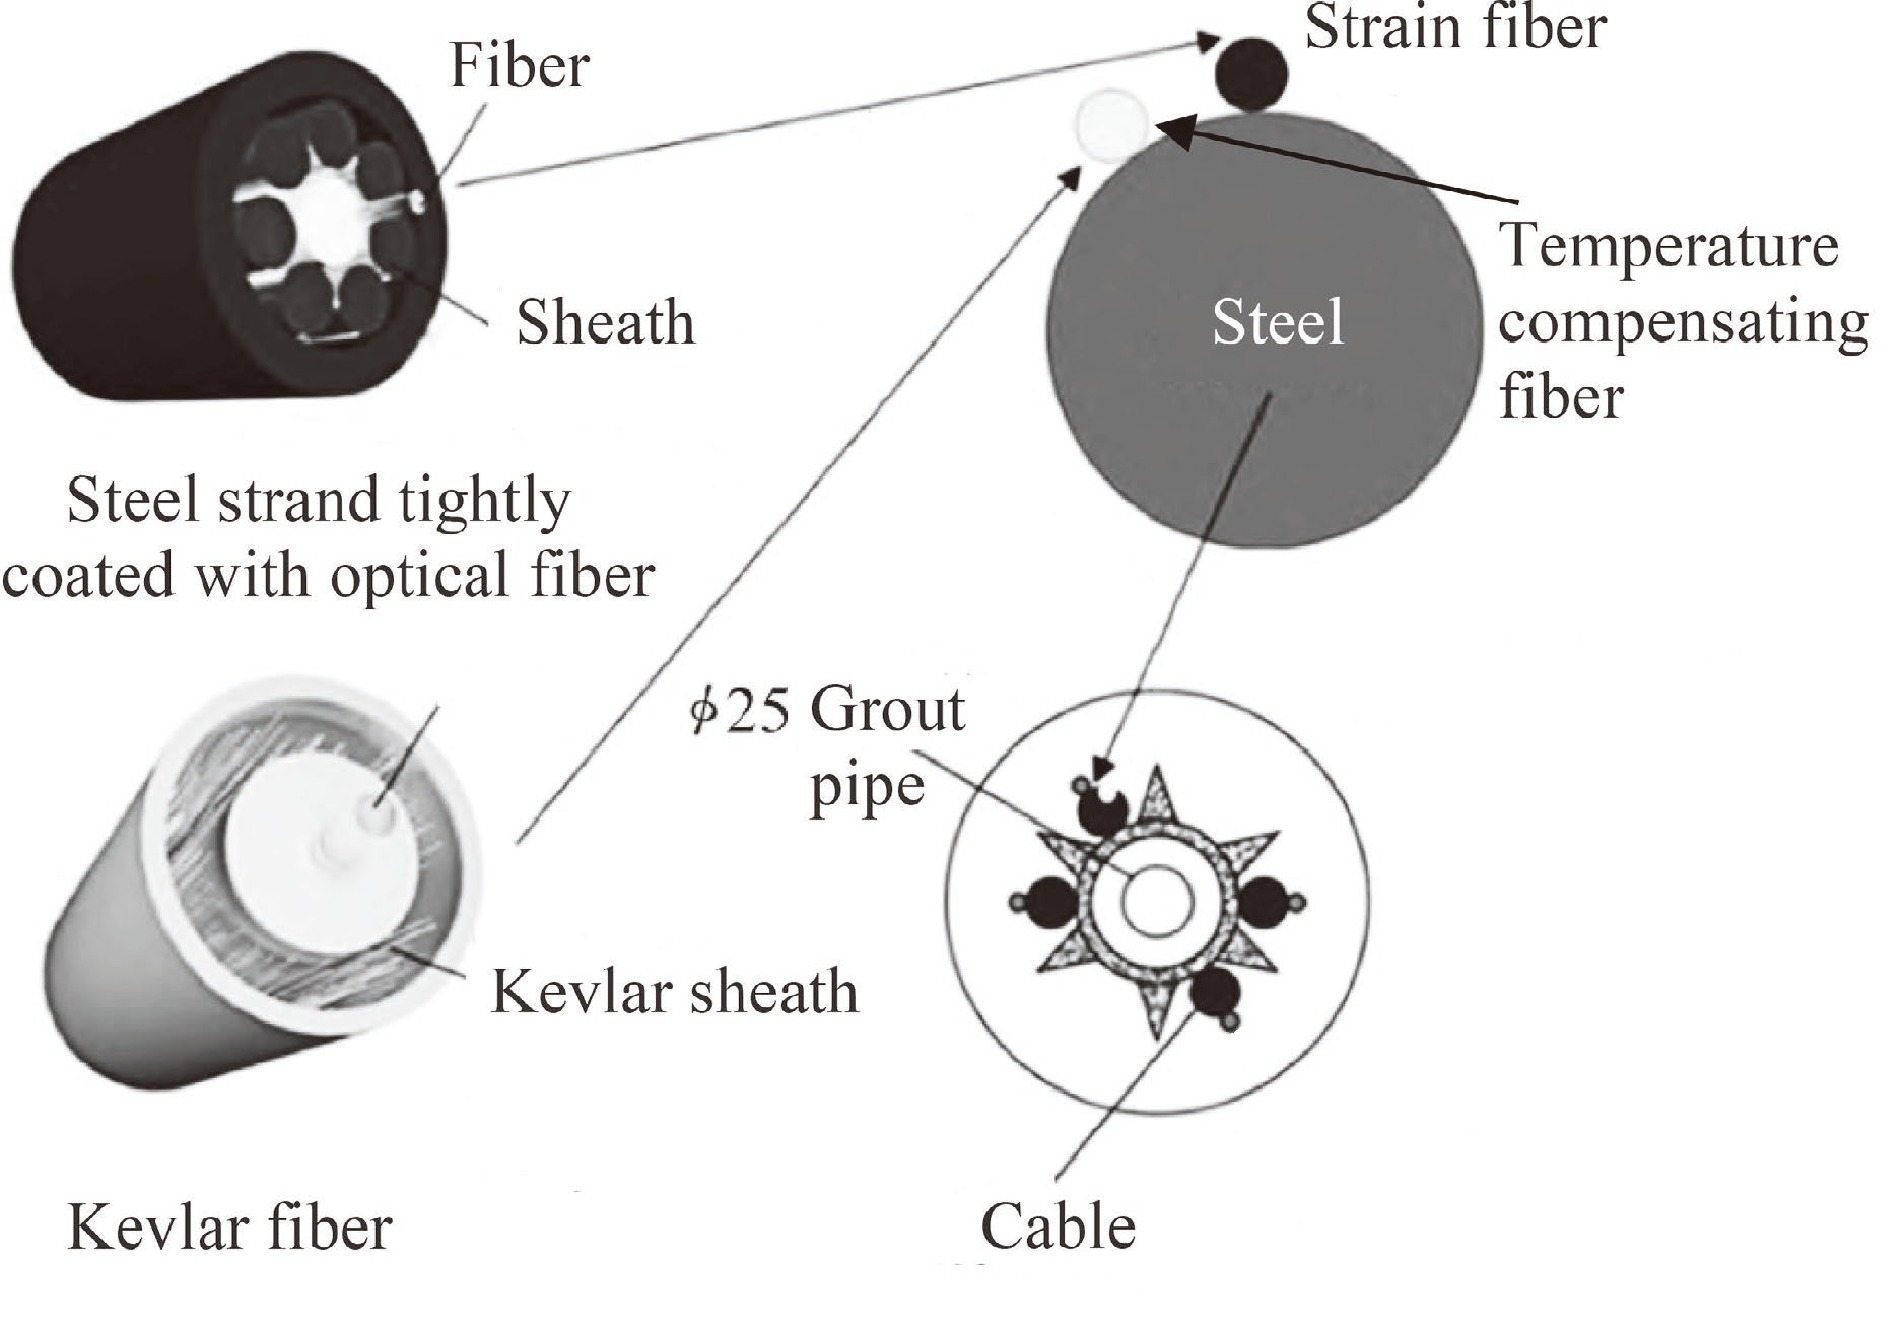
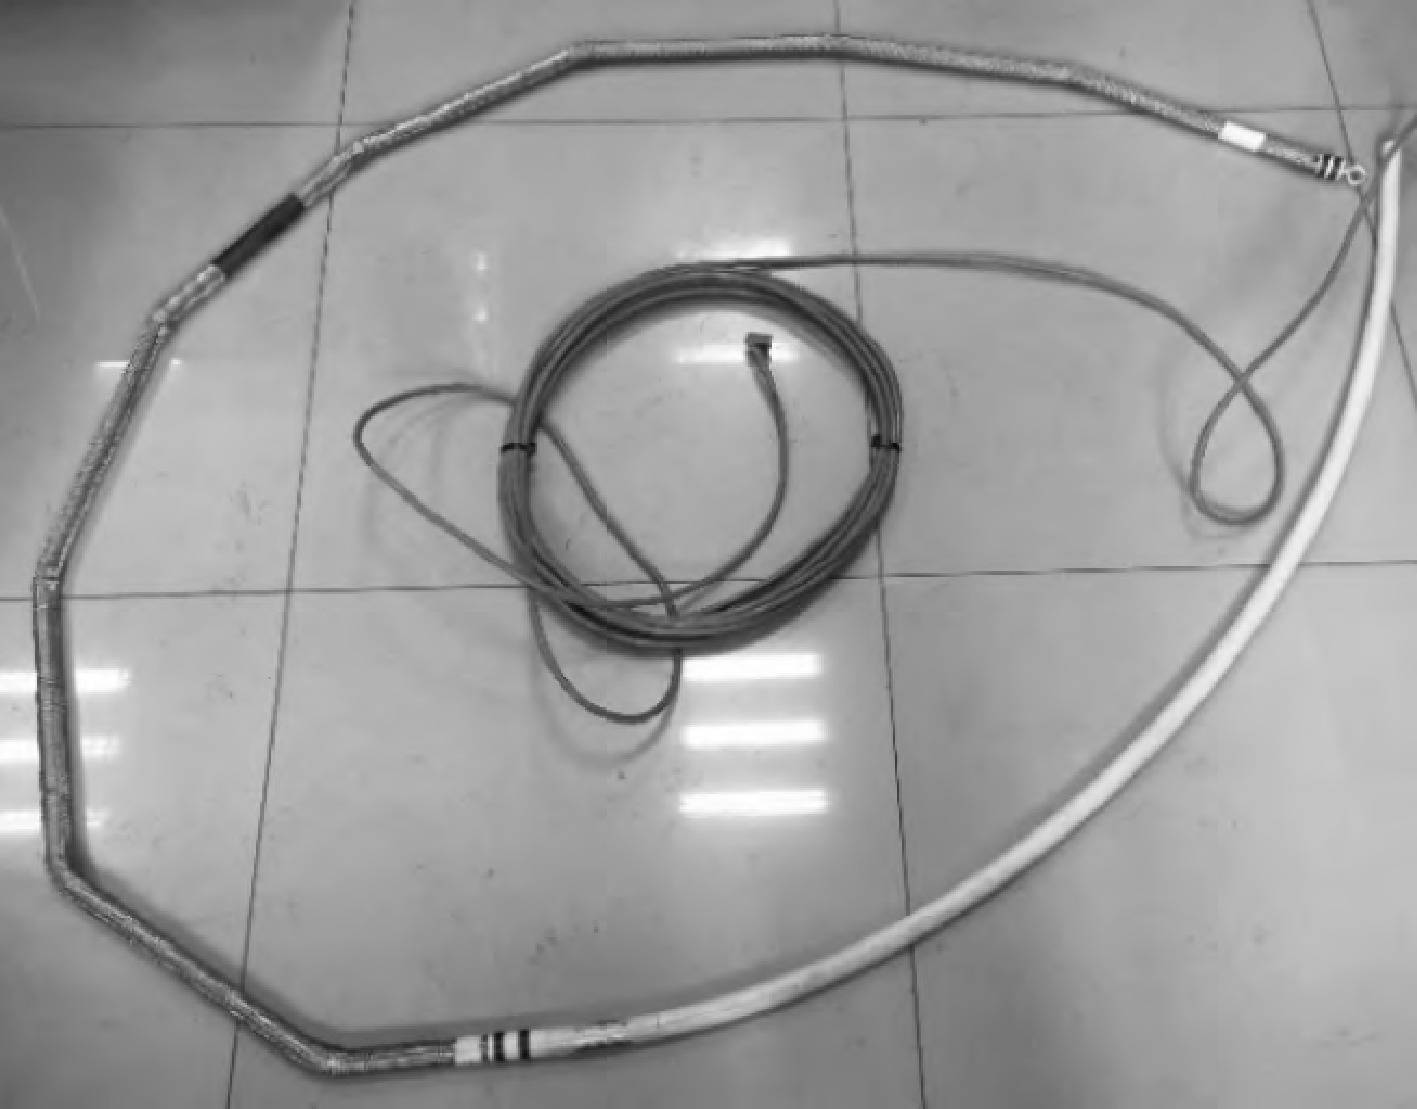
      In addition to the commonly used method of regularly monitoring underground support structures or underground structures by deploying sensors, there are currently some new monitoring technologies being adopted. For example, Ji et al.[47] used distributed fiber optic measurement to measure the axial force and strain of prestressed anchor rods. The strain monitoring fiber optic was tightly wrapped with 5 mm steel strands and temperature compensation fiber optic was used to eliminate the temperature effect on fiber optic monitoring. The distributed strain monitoring fiber optic was fed into the anchor rod hole along the rod body, and after grouting, the distributed fiber optic and the grouting formed a whole and deformed together, with the strain of the distributed fiber optic being the same as that of the anchor rod body. The installation diagram of distributed optical fiber in anchor rod is shown in Fig. 5.

      Figure 5. 

      The installation diagram of distributed optical fiber in the anchor rod.

      Figure 6 shows the arrangement of strain fibers and temperature compensation fibers on the steel strands, with each steel strand corresponding to a strain fiber sensor. The monitoring results demonstrate that monitoring strain can reflect the bond force between the anchoring body and the soil, providing guidance for the design parameters of the anchor rod, and has a considerable degree of engineering application value.

      Figure 6. 

      Detailed structure diagram of fiber optic anchor bar.

      The monitoring of horizontal displacement, especially for underground engineering support structures, has always been a focus. Currently, automated monitoring of deep-level horizontal displacement in deep foundation pits mainly uses fixed inclinometers, with sensor vertical spacing generally between 1−3 m. With the promotion of MEMS technology, flexible inclinometers have gradually been promoted from slope monitoring to enclosure structure monitoring in deep foundation pits, measuring the two-dimensional or three-dimensional deformation of the measurement object. The system has no preferred axis, and adjacent measurement segments can be freely curved, and can be installed vertically and horizontally. When installed vertically, the horizontal displacement of the measurement object at different depths can be obtained, while horizontal installation obtains the corresponding vertical displacement.

      Figure 7 shows the physical diagram of the strain annular array displacement sensor (SAA) sensor, which is composed of multiple sub-segments connected by flexible joints. Each sub-segment consists of MEMS sensors and has a length of 0.3−0.5 m, and is externally equipped with wear-resistant and corrosion-resistant materials. The total length can be customized according to the test object, and each sub-array can bend up to a maximum angle of 60 degrees. The displacement sensor consists of 64 sub-arrays and has a total length of approximately 32 m, with an end-point displacement measurement accuracy of 1.5 mm. The above sensors can be effectively used for landslide displacement monitoring and the horizontal displacement of support piles in foundation pit engineering.

      Figure 7. 

      Strain annular array displacement sensor.

      Discussion on monitoring standards for underground foundation pit engineering, a comprehensive and rigorous monitoring system, is usually established during the construction process, including monitoring of the surrounding environment[4862]. Specific monitoring content includes lateral deformation of support structures, axial force of concrete supports, and monitoring of columns and ground settlement. By obtaining real-time monitoring data of the foundation pit and analyzing the development trend of the data, construction and the safety of the foundation pit can be ensured, and the impact on the surrounding environment can be minimized to the greatest extent possible. For common foundation pit engineering projects, the control values of monitoring data are shown in Table 1.

      Table 1.  Monitoring items and limits for excavation engineering.

      Monitor itemsMaximum
      value
      Rate
      warning
      (mm/d)
      Control
      value
      Wall displacement (mm)Supporting pile 1335
      Supporting axial force (kN)Supporting axial force 113,777
      Water table (mm)Water table 12,000
      Column settlement (mm)Column 1220
      Ground displacement (mm)Ground 1335
      Horizontal displacement of supporting pile (mm)Pile320
      Vertical displacement of supporting pile (mm)Pile320

      As shown in Table 1, during the excavation phase of foundation pit engineering, the horizontal displacement of the supporting pile injection will increase, and the maximum surface settlement value will increase. Additionally, the supporting axial force will increase rapidly. The allowable limit values corresponding to each monitoring item indicate the maximum allowable deformation data of the supporting structure and the bearing capacity of the concrete support. By continuously monitoring the measuring points on the foundation pit or retaining structure, the daily settlement deformation rate and cumulative value can be obtained. By utilizing monitoring data, the advantages of informationized construction can be reflected, i.e., using monitoring data to provide feedback for guiding construction plans. For the waist beam position where deformation needs to be strictly controlled, controlling the horizontal displacement of the supporting pile can be achieved by applying prestress to ensure the safety and stability of foundation pit engineering.

      For monitoring the soil pressure on the outside or inside of the foundation pit, a soil pressure box can be used for testing. The embedded test method is commonly used when conducting soil pressure monitoring. In the process of using the embedded monitoring method, the embedding operation and monitoring requirements need to be matched to ensure that the pressure film is in a vertical state, the force surface is in close contact with the detected object, and protection work is done for the pressure film. Accurate records of relevant monitoring data should be made. After the soil pressure monitoring is completed, the pressure film should be carefully inspected to ensure that there are no problems with damage, in order to avoid distortion of the recorded data. In fact, due to the contact problem between the soil and the structure, the pressure that the soil pressure film bears is not always loaded vertically. Usually, it bears a certain amount of friction, which can lead to inaccuracies in the measured soil pressure values.

    • The tunnel surrounding rock deformation monitoring technology is a technology that uses strain gauges, measuring instruments and other equipment to monitor the real-time strain changes of the surrounding rock in a tunnel, in order to warn of the deformation risk caused by instability or cracking of the rock. This technology is mainly used to ensure the safety and reliability of tunnel construction and operation. The strain gauge is an instrument used to measure the strain changes of an object. By installing the strain gauge on the surface of the surrounding rock, the strain gauge can record the strain value when the rock deforms, and transmit this data to a computer for processing through a sensor. The measuring instruments include level gauges, inclinometers, total stations, etc. By measuring the tilt and horizontal degree of the surrounding rock, the deformation of the tunnel surrounding rock can be accurately monitored. Through tunnel surrounding rock deformation monitoring technology, the deformation of the tunnel surrounding rock can be monitored in real time, and signs of rock instability or cracking can be discovered in a timely manner, and corresponding measures can be taken to reduce risks during tunnel construction and operation. In addition, tunnel surrounding rock deformation monitoring technology can also provide valuable data support for tunnel maintenance and management, helping tunnel managers to timely understand the safety status of the tunnel, carry out maintenance and repairs, and prolong the service life of the tunnel, ensuring the safety and reliability of tunnel operation.

      The main steps of tunnel surrounding rock deformation monitoring technology include geological exploration, surrounding rock mechanical property testing, monitoring equipment installation, data collection and analysis, etc. Common monitoring equipment includes strain gauges, displacement sensors, pressure sensors, etc. By collecting data such as surrounding rock deformation, stress and pressure through these devices, analysis and evaluation can be conducted to determine the stability and safety of the tunnel surrounding rock.

      Tunnel surrounding rock deformation monitoring technology has been widely used in various tunnel engineering projects such as highway tunnels, railway tunnels, water conservancy tunnels, and subway tunnels. Timely discovery and treatment of surrounding rock deformation problems during tunnel construction and operation are of great significance for ensuring the safe operation of tunnels and prolonging their service life.

    • The monitoring frequency of underground structure engineering construction should be determined based on specific circumstances. Generally, the monitoring frequency in the early stage of construction should be higher than that in the later stage. During the initial stage of excavation, monitoring should be conducted daily to promptly grasp the stability and deformation of the earthwork. The monitoring frequency in the later stage of construction can gradually decrease, but the monitoring data should cover the entire construction process. Therefore, construction safety monitoring and risk assessment of underground structure engineering are particularly important.

      Construction safety monitoring of underground structure engineering refers to real-time monitoring of the construction process through monitoring technology during the construction process of underground structure engineering to promptly identify and solve safety hazards and ensure construction safety. The monitoring of underground structure engineering construction mainly includes monitoring of soil displacement, changes in groundwater level, and structural deformation. Among them, soil displacement monitoring is the focus of underground structure engineering monitoring. During the construction process of underground structure engineering, soil displacement is influenced by various factors such as groundwater level, soil compaction, underground pipelines, etc. Therefore, continuous monitoring and analysis of soil displacement are needed to promptly identify and solve problems where the soil displacement is too large.

      Safety accidents can occur at any time during the construction process of underground structure engineering, so it is necessary to conduct risk assessment and warning evaluation of the construction process. The risks in the construction process of underground structure engineering mainly include soil stability, groundwater level, and underground pipelines. By predicting and evaluating the risks that may occur during the construction process, corresponding measures can be taken in advance to prevent accidents.

      In the safety monitoring and risk assessment of underground structural engineering construction, the selection and use of monitoring technology are particularly important. By reviewing the latest underground engineering construction monitoring technology, the following conclusions can be drawn:

      (1) Analyzing the disaster-causing mechanism in the underground engineering construction process, and using laboratory experimental techniques to reproduce the underground disaster process at the production site is conducive to engineering technicians' in-depth understanding of the entire process of underground disaster incubation. Based on the disaster-causing principle in the production process, new ideas can be proposed to prevent and mitigate disasters, such as using high deformation resistance anchor rods to effectively predict the sudden drop phenomenon of Newton's force formed by landslide bodies, which can provide early warning and guide the production progress of open-pit mines, and ensure maximum production efficiency while achieving the goal of controlling landslide disasters safely.

      (2) For certain underground engineering projects, personalized warning signals should be proposed in conjunction with regional geological characteristics, such as combining local construction standards and local underground engineering monitoring technical specifications to determine specific indicator limits. For example, in the sand and gravel formation, the horizontal displacement limit of the support pile can be controlled at 20 mm, and this limit is based on the consideration that the sand and gravel formation has relatively high stiffness and strength characteristics. If the above limit is applied to underground engineering in areas with thicker silty soil, it is not applicable. On the one hand, the pile-anchor support system used in hard soil areas is not suitable for silty soil layers. On the other hand, it may cause unnecessary increases in engineering costs, making it economically unfeasible. Therefore, the monitoring limit values for underground engineering in silty soil areas should be based on local monitoring technical specifications as guidance indicators.

      (3) Based on the significant differences between deep and shallow strata in underground engineering, the surrounding medium of the former is rock, while the latter is mostly soil material. Therefore, the physical properties of rock and soil are very different, which causes significant differences between deep and shallow underground engineering. Both should be executed in accordance with relevant specifications.

    • The authors confirm contribution to the paper as follows: study conception and design: Wan Z; draft manuscript preparation: Wan Z; data curation: Qin J; investigation and data analysis: Wei Z. All authors reviewed the results and approved the final version of the manuscript.

    • The data are available from the corresponding author on reasonable request.

      • The authors declare that they have no conflict of interest.

      • Copyright: © 2023 by the author(s). Published by Maximum Academic Press on behalf of Nanjing Tech University. This article is an open access article distributed under Creative Commons Attribution License (CC BY 4.0), visit https://creativecommons.org/licenses/by/4.0/.
    Figure (7)  Table (1) References (62)
  • About this article
    Cite this article
    Wan Z, Qin J, Wei Z. 2023. Overview of technical research on safety monitoring, early warning, and risk assessment for underground structural engineering construction. Emergency Management Science and Technology 3:18 doi: 10.48130/EMST-2023-0018
    Wan Z, Qin J, Wei Z. 2023. Overview of technical research on safety monitoring, early warning, and risk assessment for underground structural engineering construction. Emergency Management Science and Technology 3:18 doi: 10.48130/EMST-2023-0018

Catalog

  • About this article

/

DownLoad:  Full-Size Img  PowerPoint
Return
Return