-
The rapid expansion of urban areas in recent decades has generated significant demand for transportation infrastructure, particularly in the domain of road networks, leading to the construction of new structures such as tunnels. These constructions, driven by both economic and functional considerations, are typically designed at shallow depths, distinguishing them from deep tunnels used in railways or subways. This inherent characteristic of tunnel design raises concerns about user safety, particularly regarding the potential accumulation of pollutants and the occurrence of fires. Research in tunnel safety is an ever-evolving field, and numerous prior studies have contributed to improving our understanding of these complex issues. In a significant early study, Johansson et al.[1] analyzed smoke propagation using a multizone model. This approach enhanced our comprehension of how smoke spreads within a confined space like a tunnel and lays the groundwork for further research in this area. In a complementary effort, Ang et al.[2] simulated airflows within tunnels, validating their open-source approach and studying its performance. This study further refined our knowledge of air and smoke dynamics within tunnels, which is crucial for designing effective ventilation systems. Other researchers have focused on developing appropriate intervention techniques in the event of tunnel fires[3,4], as managing incidents in these confined environments pose unique challenges. The findings of these studies have led to the development of intervention protocols better suited to the specific conditions of tunnels. In some countries, the analysis of smoke behavior relies on the use of Computational Fluid Dynamics (CFD) models to assess various ventilation modes[5]. This numerical approach has allowed for a detailed exploration of the effects of ventilation on smoke dispersion and occupant safety. Chow et al.[6] further delved into the movement of smoke in inclined tunnels with longitudinal ventilation during fires, seeking a better understanding of the stratification management issue by identifying the critical ventilation velocity. Their research contributed to defining crucial parameters for ventilation system design in such scenarios. Several studies have also developed experimental and numerical approaches to optimize the use of longitudinal ventilation[7−10], as tunnels, even those of designed recently, present a complex environment for occupational health and safety due to confined space, lighting conditions, natural air currents exacerbating lower temperatures at altitude, and noise associated with ventilation[11,12].
Wu & Bakar[13] focused on the effects of fire power and tunnel geometry on critical ventilation velocity. Their work improved our understanding of how these factors influence tunnel safety and provided crucial information for decision-making in design. To ensure the safety of individuals and the stability of tunnel structures, the challenges associated with modeling smoke plume dispersion require rigorous studies[14−16]. These research efforts have contributed to refining smoke dispersion models used to evaluate tunnel fire scenarios, enhancing our ability to predict and mitigate risks.
In this regard, Zhao et al.[17] investigated fire behavior in tunnels over long distances, representing an additional challenge in terms of safety management. Their work shed light on the complex dynamics of large-scale fires in tunnels. Concurrently, Yao et al.[18] closely examined smoke movement and control in tunnels in China, highlighting specific challenges related to safety management in different geographical contexts.
To conduct a comprehensive numerical study and establish the differential equations governing this problem, we referred to highly advanced work in the field of numerical fluid mechanics, such as that done by Patankar[19].
Overall, this research represents a valuable contribution to the field of tunnel ventilation, and its results are not only useful for improving the design and implementation of ventilation systems but also underscore the critical importance of carefully considering mesh density when conducting Computational Fluid Dynamics simulations. These studies continue to shape our understanding of fire-related risks in tunnels and contribute to enhancing the safety of users in these vital infrastructures.
This research focuses on tunnel safety, particularly in urban tunnels under 500 m in length, which often exhibit non-horizontal geometries, unlike their much longer railway counterparts. This unique characteristic poses a ventilation challenge due to the complexity of the geometry, which differs from standard tunnels.
-
To comprehensively address the underlying phenomena that govern the particular issue at hand, the following set of equations are introduced[13] :
$ {V}^{*}=\dfrac{V}{\sqrt{g\overline{H}}}$ (1) $ {Q}^{*}=\dfrac{Q}{\sqrt{{\rho }_{0}{C}_{P}{T}_{0}\sqrt{g{\overline{H}}^{5}}}} $ (2) $ {V}^{*}=0.4{\left[0.20\right]}^{-\frac{1}{3}}{\left[{Q}^{*}\right]}^{\frac{1}{3}};\;for\;{Q}^{*}\le 0.2 $ (3) $ {V}^{*}=0.4;\;for\;{Q}^{*} \lt 0.20 $ (4) Where, V is the ventilation velocity, m/s; Q is the fire convective heat release rate, kW; V* is the dimensionless critical velocity based on hydraulic tunnel height; Q* is dimensionless heat release rate based on hydraulic tunnel height; g is gravitational force, m/s2;
$ {\rho }_{0} $ $ {V}_{c}={K}_{1}{K}_{g}{\left(\dfrac{g.H.Q}{\rho .{C}_{p}.A.{T}_{ f}}\right)}^{1/3} $ (5) $ {T}_{ f}=\dfrac{Q}{\rho .{C}_{p}.A.{V}_{c}}+T $ (6) The Froude number is defined as:
$ F r=\dfrac{{V}^{2}}{gD}=\dfrac{Inertia\;f orces}{Gravity\;f orces} $ (7) Where, Vc is the critical velocity, m/s; the Froude number factor (Fr−1/3) K1 is equal to 0.606 (7); Kg is the grade factor; g is gravitational force, m/s2; H is height of tunnel, m; Q is heat release rate, KW; ρ is average density of approach (upstream air), kg/m3; CP is specific heat capacity of air, KJ/kg.k; A is area perpendicular to the flow, m2; Tf is average temperature of the fire site gases, K; T is temperature of the approach air, K. In our research endeavor, our primary goal is to meticulously emulate real-world scenarios by generating a tunnel model characterized by specific dimensions measuring 300 m in length, 7.22 m wide, and 10.5 m in height, employing the sophisticated ANSYS Spaceclaim design tool. This innovative approach has empowered us to intricately capture the nuanced intricacies of the tunnel's geometry, thereby securing the utmost applicability of our findings within real-world practical settings. Illustrated in Fig. 1, this figure offers an exhaustive portrayal of the model, affording a visual examination of its multifaceted dimensions and intricate structural composition. This comprehensive level of detail and precision has consequently facilitated our comprehensive comprehension of the multitude of factors that exert influence upon tunnel ventilation.
In this configuration (Table 1), meticulous attention has been dedicated to ensuring the comfort and safety of users. To achieve this, the maximum height of the sinusoid is intentionally set at 1/3 of the tunnel entrance height (H), thereby adhering to the prescribed maximum slope. This precautionary measure is implemented to guarantee that the tunnel's gradient remains below a specific threshold, thereby enhancing the overall experience for users. It's imperative to highlight that this constraint is derived from a comprehensive evaluation of various comfort and safety criteria, including factors such as travel velocity and field of vision. In this specific setup, as outlined in Table 1, a deliberate effort has been made to prioritize the comfort of tunnel users. By establishing a maximum sinusoidal height equivalent to 1/3 of the tunnel entrance height (H), it is the aim to ensure that the tunnel's gradient stays within acceptable limits, thereby contributing to a more enjoyable experience for those traversing the tunnel.
Table 1. Dimensional characteristics of the tunnel.
Characteristics Dimensions Tunnel length L (m) 300 Tunnel height H (m) 7.22 Tunnel width W (m) 10.5 Amplitude of the sinusoid α (m) 2.4 Size of fire pit (m3) 2 × 2 × 2 To tackle this intricate problem comprehensively, the finite volume method, a numerical approach that discretizes the domain into control volumes was used to solve the governing equations. Specifically, the equations corresponding to unsteady, incompressible fluid flow were addressed using the Boussinesq approximation. This approximation is particularly suited for modeling buoyancy-driven flows, which are prevalent in tunnel ventilation scenarios. Simulation efforts were conducted through the utilization of Computational Fluid Dynamics (CFD), a powerful tool for numerically solving fluid flow problems. The CFD approach allowed analysis of the complex interactions of fluid dynamics within the tunnel environment. To capture the effects of turbulence in the present analysis, the K-ω SST (Shear-Stress Transport) turbulence model was employed. This model is well-suited for confined flows, offering a combination of the K-ω model near the walls, where turbulence is strongly influenced by viscous effects and the K-ε model in the core of the flow, where turbulence characteristics are different. One of the critical aspects in CFD simulations is the mesh, as it discretizes the computational domain into discrete elements. In the current study, with the presence of a sinusoidal geometry, it was essential to carefully select an appropriate mesh density. To achieve this, a mesh sensitivity analysis was conducted, systematically varying the mesh size and assessing its impact on the results. After thorough examination it was determined that a mesh with 3,960,850 nodes, as illustrated in Fig. 2, provides the most accurate representation of the flow physics, capturing all relevant phenomena while still maintaining computational efficiency. By employing these advanced numerical techniques and fine-tuning the mesh density to the optimal level, the complex problem at hand was effectively addressed and the reliability and accuracy of the simulation results ensured. This comprehensive approach allowed a deep insight into the intricate dynamics of tunnel ventilation.
-
To gain a deeper understanding of temperature and velocity variations in the context of tunnel ventilation, it is essential to note that the current case study, characterized by the presence of a sinusoidal pattern on the tunnel floor, is virtually unprecedented in specialized literature. Despite the scarcity of similar numerical models, the objective remains to provide a comprehensive analysis encompassing the entire tunnel.
The current visualizations highlight the evolution of temperature along the entire tunnel length, as well as temperature variations at different distances from the heat source. This approach will allow the detailed scrutinization of temperature and velocity fluctuations, thus contributing to a better understanding of flow behavior in a tunnel with unique characteristics, such as the presence of the sinusoidal floor. By exploring these temperature and velocity variations in the current specific context, the aim is to make a significant contribution to the research field by shedding light on the complexity of confined flow dynamics under unusual conditions. Furthermore, this study underscores the crucial importance of ventilation in mitigating the effects of extreme temperatures in unconventional tunnel configurations. Figure 3 presents a comparison between Fu's temperature contour[22] and the simulated temperature distribution, thereby demonstrating the uniqueness of the current approach in the scientific literature.

Figure 3.
Temperature contour for (a) Fu's temperature contour[22] and (b) the present our results.
-
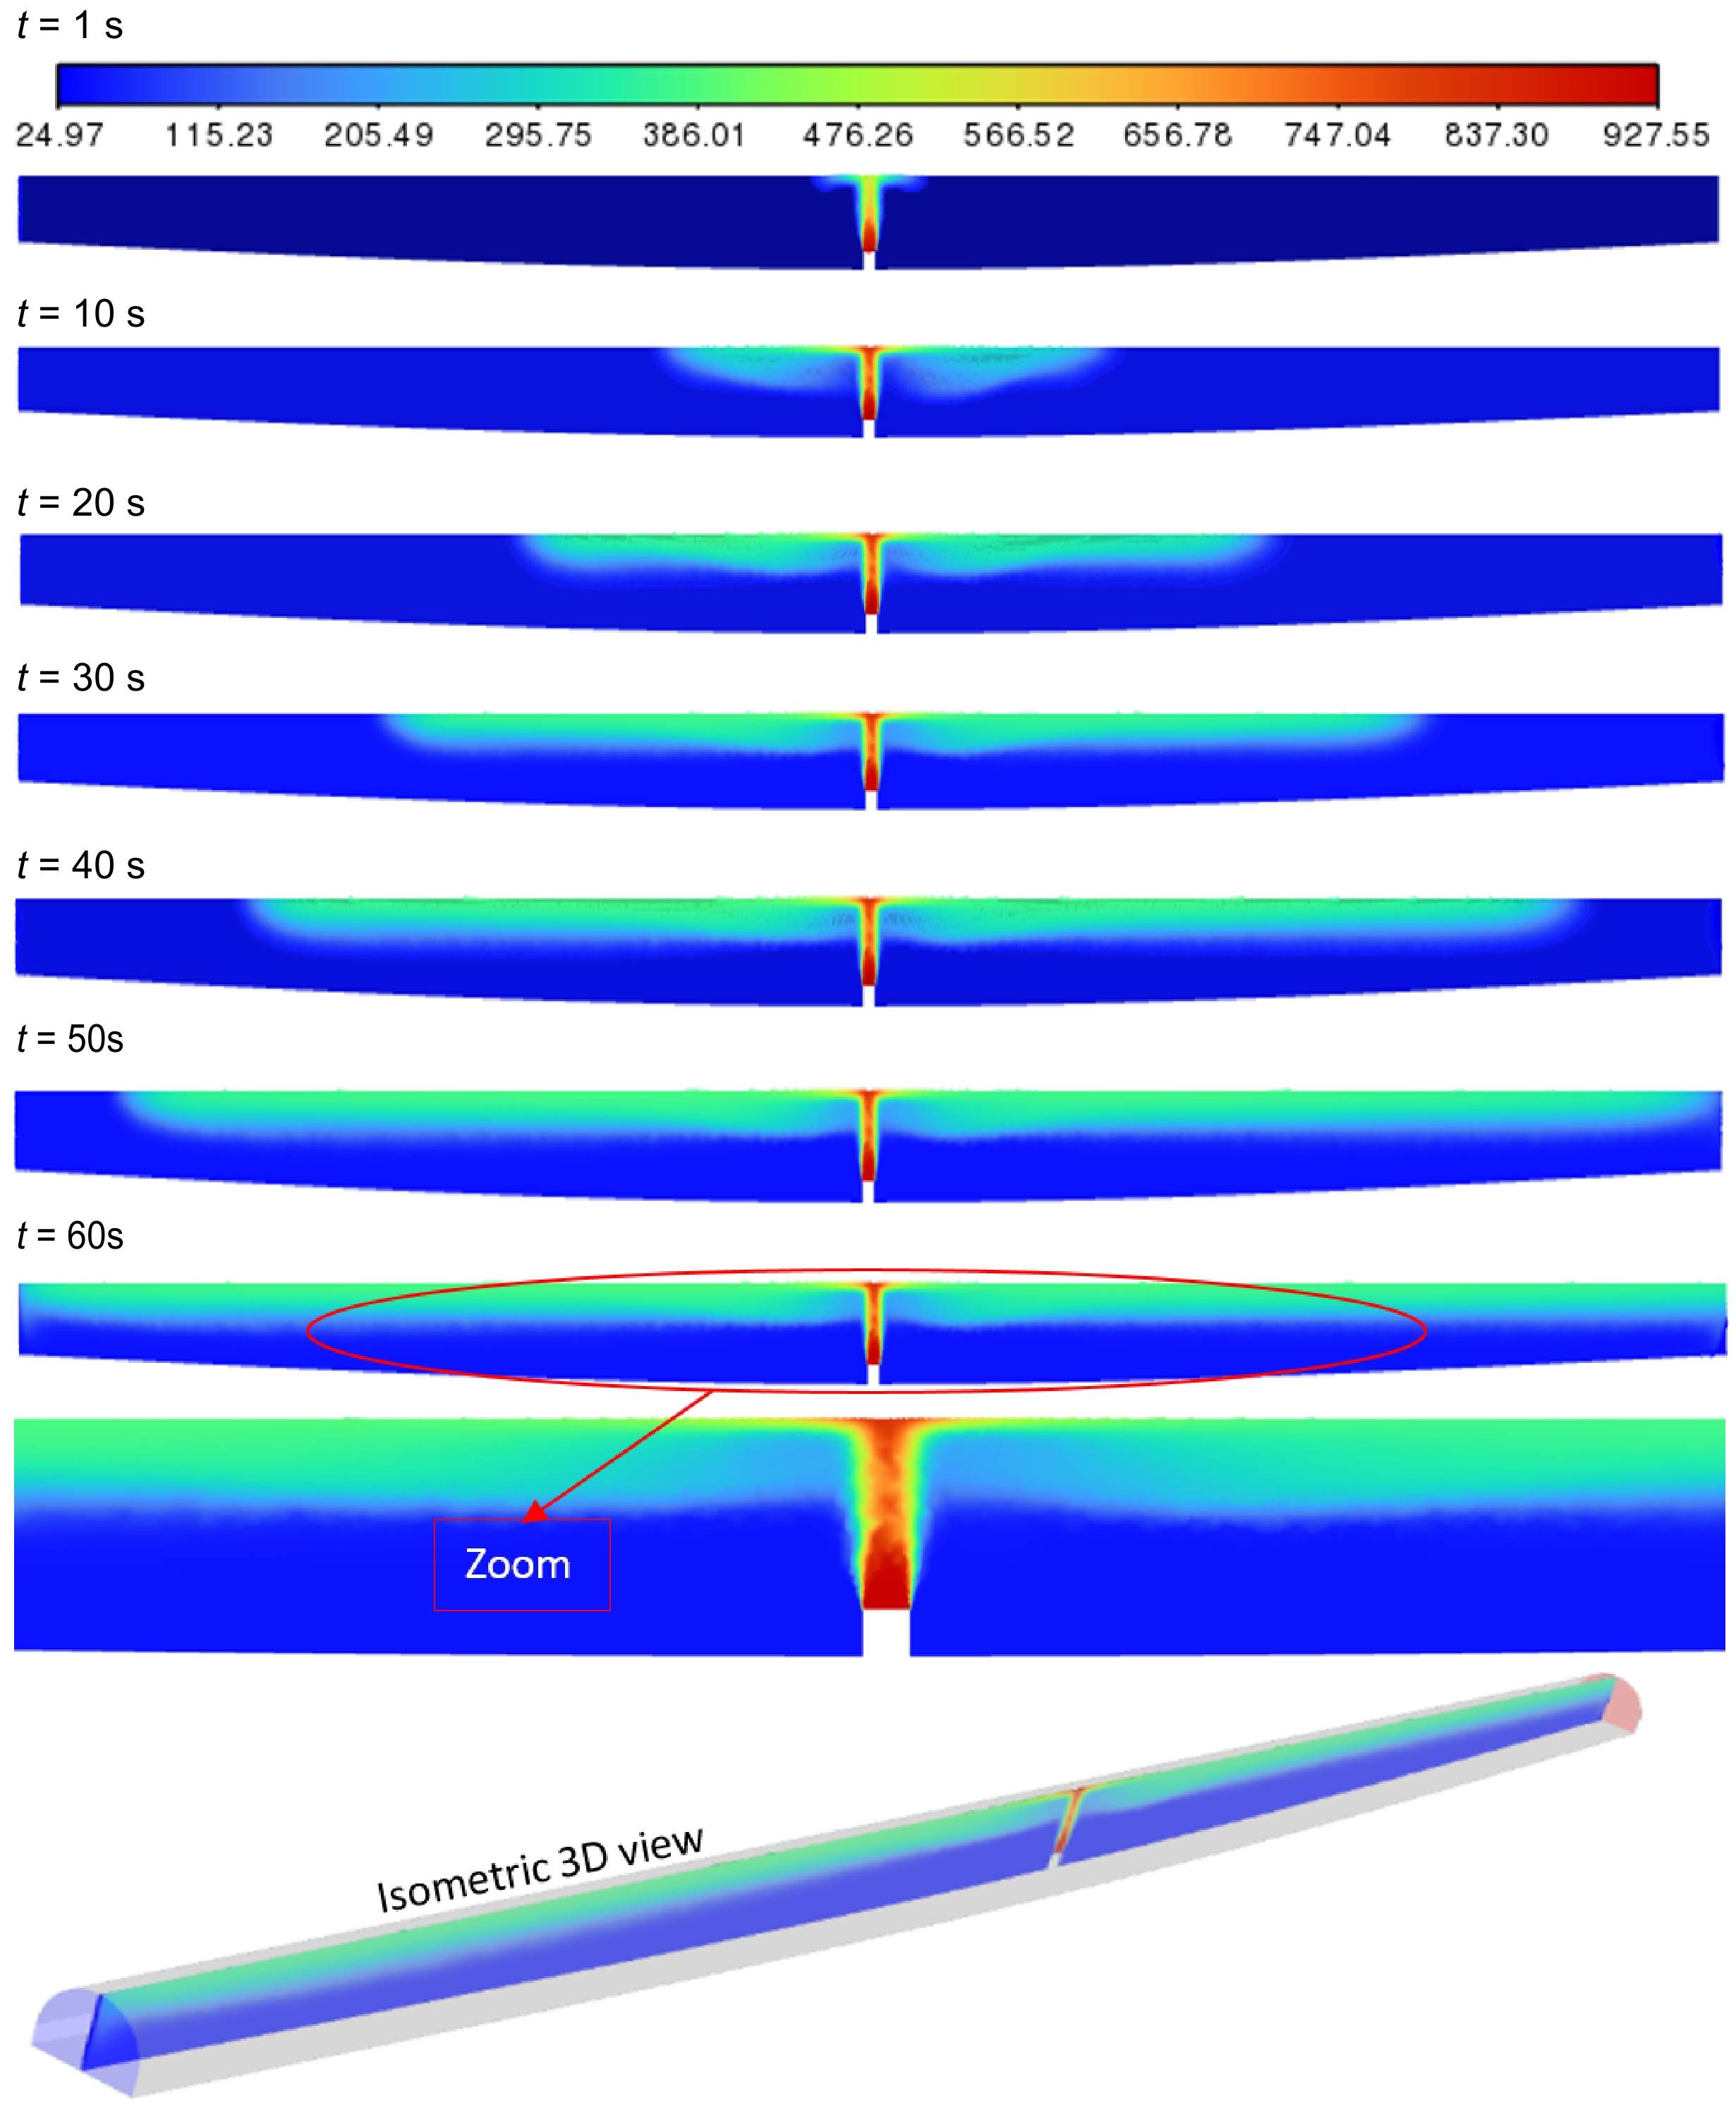
The results of the current simulations have shed light on the thermodynamic properties of smoke within a tunnel with a sinusoidal floor. To facilitate a more comprehensive understanding, the analysis was divided into two parts: the first part focused on the ventilated scenario, while the second examined the non-ventilated case. In Fig. 4, the evolution of temperature from 1 to 60 s, with a 10-s interval is depicted, and an enlarged view at t = 60 s provided. In both situations (with or without ventilation), it was observed that hot gases moved symmetrically from the fire source toward the ceiling. This symmetry holds significant importance as it prevents the formation of back-layering within the tunnel, which could compromise ventilation. Starting at t = 10 s, the emergence of two concave regions with high temperatures, parallel to the sinusoidal shape of the tunnel, extending approximately 10 m from the heat source were noted. This observation can be explained by the fact that hot gas particles are lighter near the heat source and acquire sufficient kinetic energy to rise from the floor to the ceiling. As these particles move away from the heat source, they become heavier and descend more rapidly, thereby creating this concave-shaped pocket of hot gas parallel to the sinusoidal tunnel roof. Over time, an almost parallel stratification of the hot smoke along the ceiling was observed, owing to the thermal uniformity of the gas particles surrounding the heat source. In summary, the present results have deepened our understanding of smoke behavior in a tunnel with a sinusoidal floor, whether ventilated or not, and have underscored the importance of symmetry and thermal uniformity in avoiding back-layering issues.
A thorough analysis of the simulation results has yielded intriguing insights into the temperature distribution within the tunnel with a sinusoidal floor. To gain a better understanding of temperature variation relative to the distance from the heat source, graphs depicting temperature at various distances from the source were generated and illustrated in the figures within this article.
These graphs reveal a discernible and significant trend: the temperature exhibits a consistent rise from the tunnel floor to the ceiling, irrespective of the chosen distance from the heat source. This empirical observation strongly validates the findings presented in Fig. 4, where it was established that the ascent of hot smoke from the fire source to the ceiling was characterized by remarkable symmetry. This symmetrical behavior is of paramount importance as it mitigates the occurrence of issues associated with layering and stratification within the tunnel environment. Furthermore, the results from our simulations have brought to the forefront a compelling revelation: the concentration of hot gas particles is predominantly skewed toward the upper half of the tunnel. These particles reach exceptionally high temperatures, occasionally soaring up to 500 °C, contingent upon their proximity to the heat source (as indicated in Fig. 5,). This phenomenon aligns seamlessly with the fundamental principles of fluid dynamics. Specifically, the buoyant force exerted on these hot gas particles, owing to their reduced density relative to the surrounding air propels them upwards, thus causing their accumulation in the upper region of the tunnel. In addition to this elevation in temperature, our results have underscored a conspicuous and consistent decline in temperature as one moves farther from the heat source and descends from the ceiling towards the floor (Figs 6, 7 & 8). This temperature reduction can be ascribed to the process of heat dissipation, a mechanism where thermal energy is transferred through the tunnel walls, coupled with thermal losses due to radiation. The culmination of these intricate thermal dynamics further enriches our comprehension of the temperature behavior within a tunnel featuring a sinusoidal floor, both with and without ventilation.
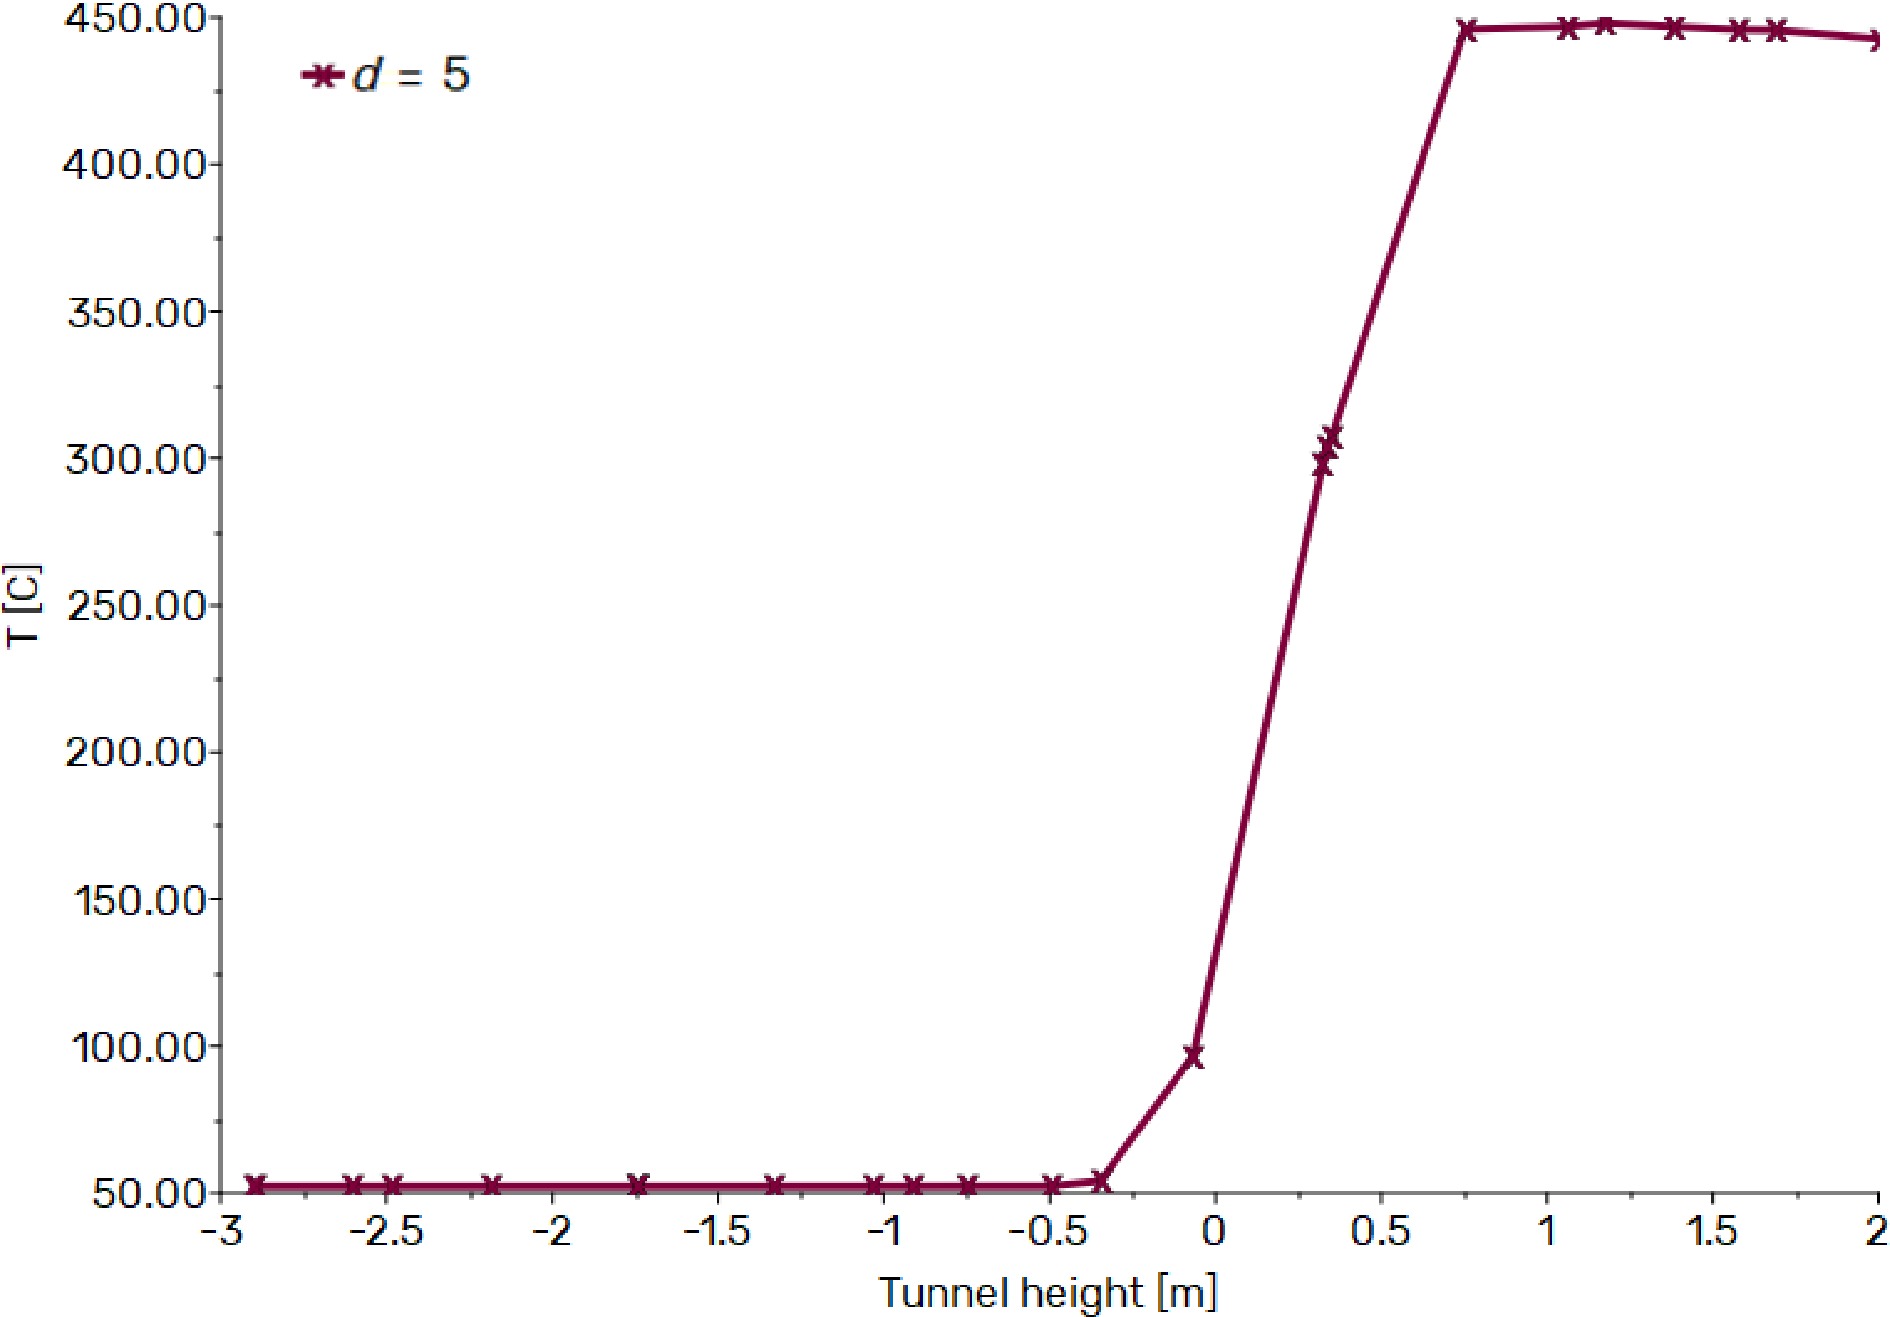
Figure 5.
Temperature trend without ventilation as a function of tunnel height at 5 m from the fire source.
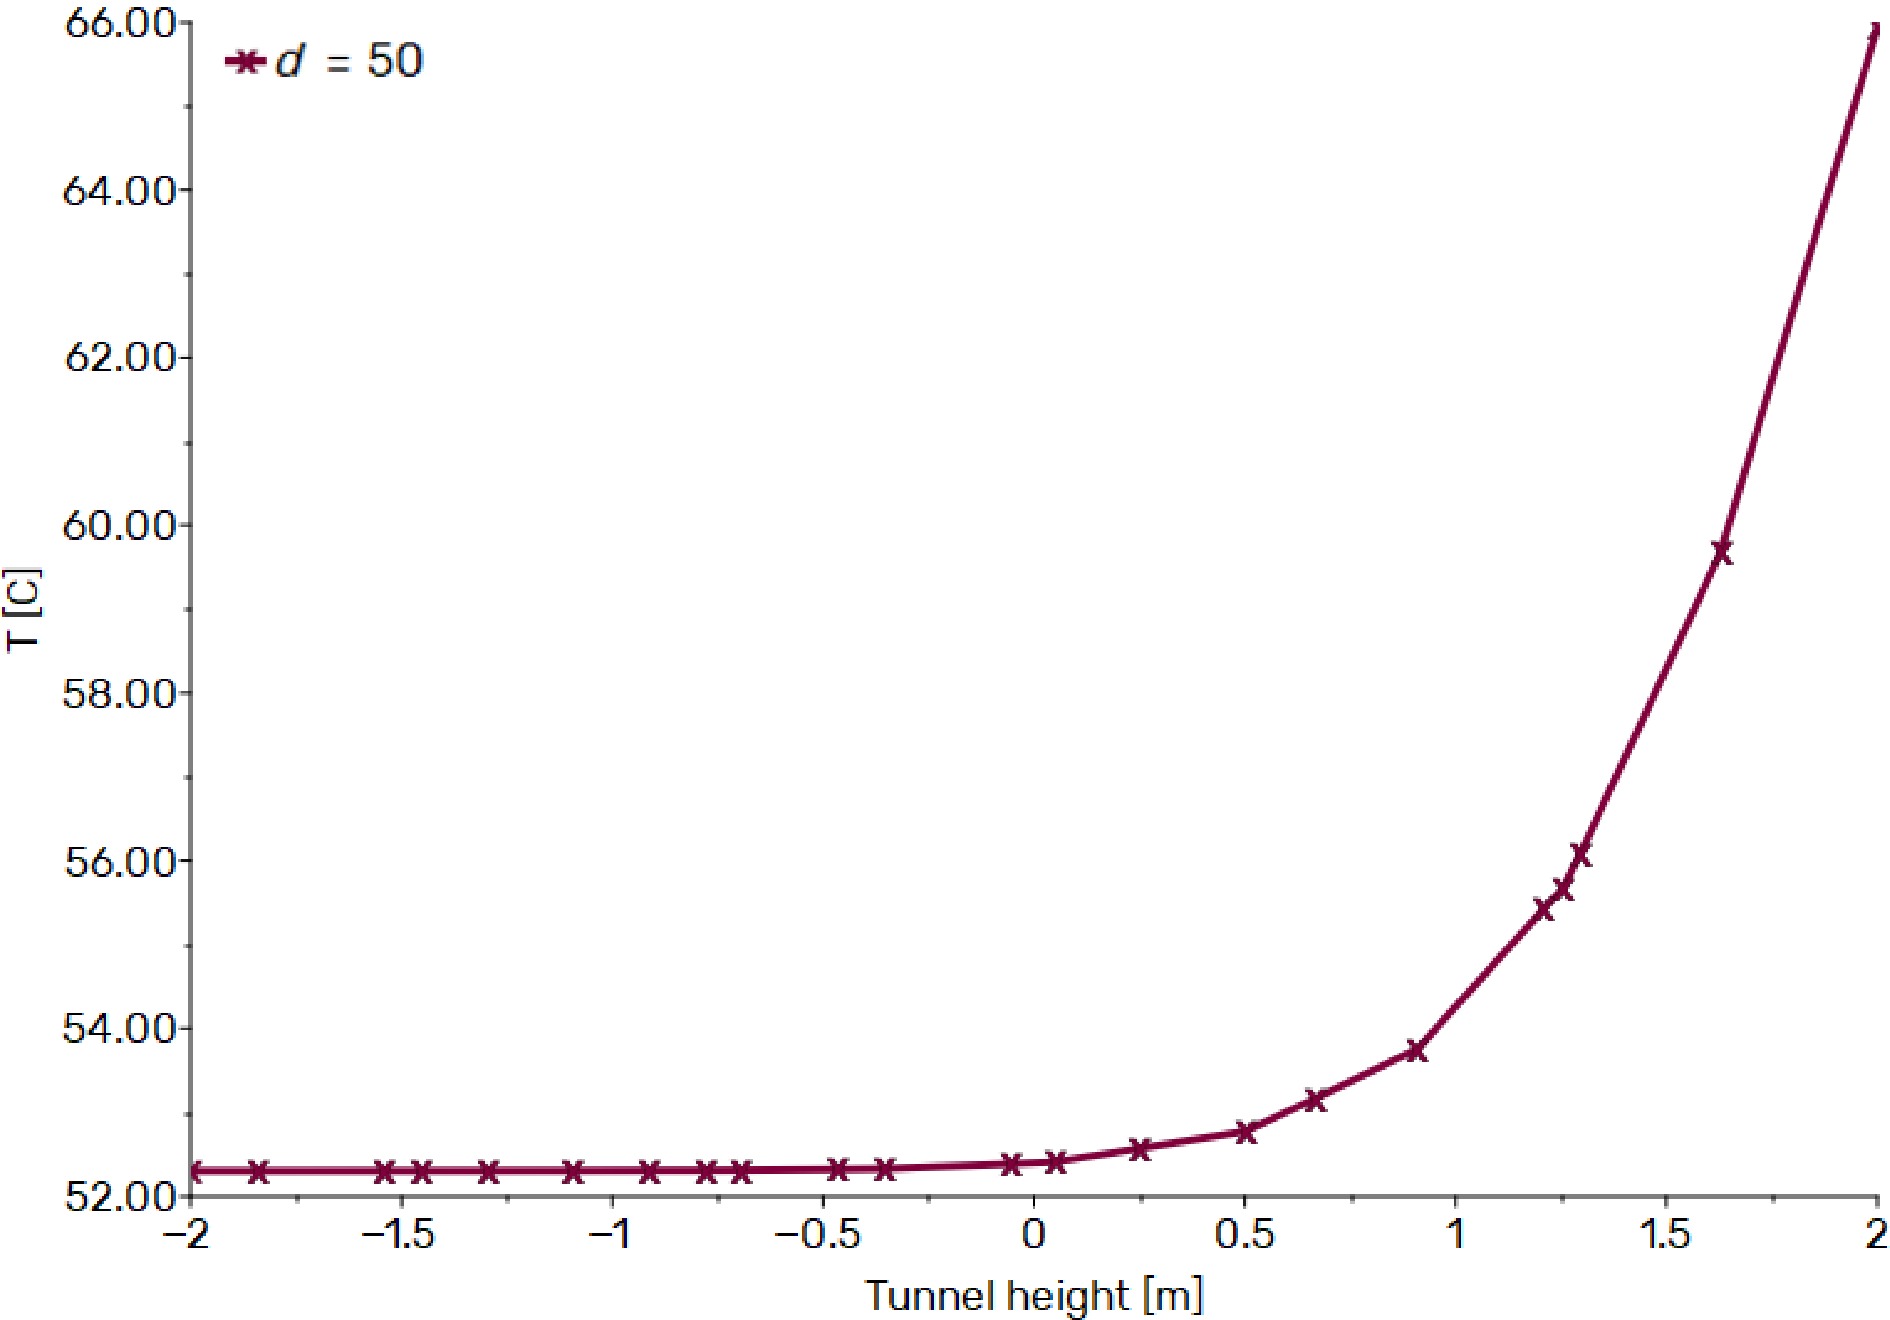
Figure 6.
Temperature trend without ventilation as a function of tunnel height at 50 m from the fire source.
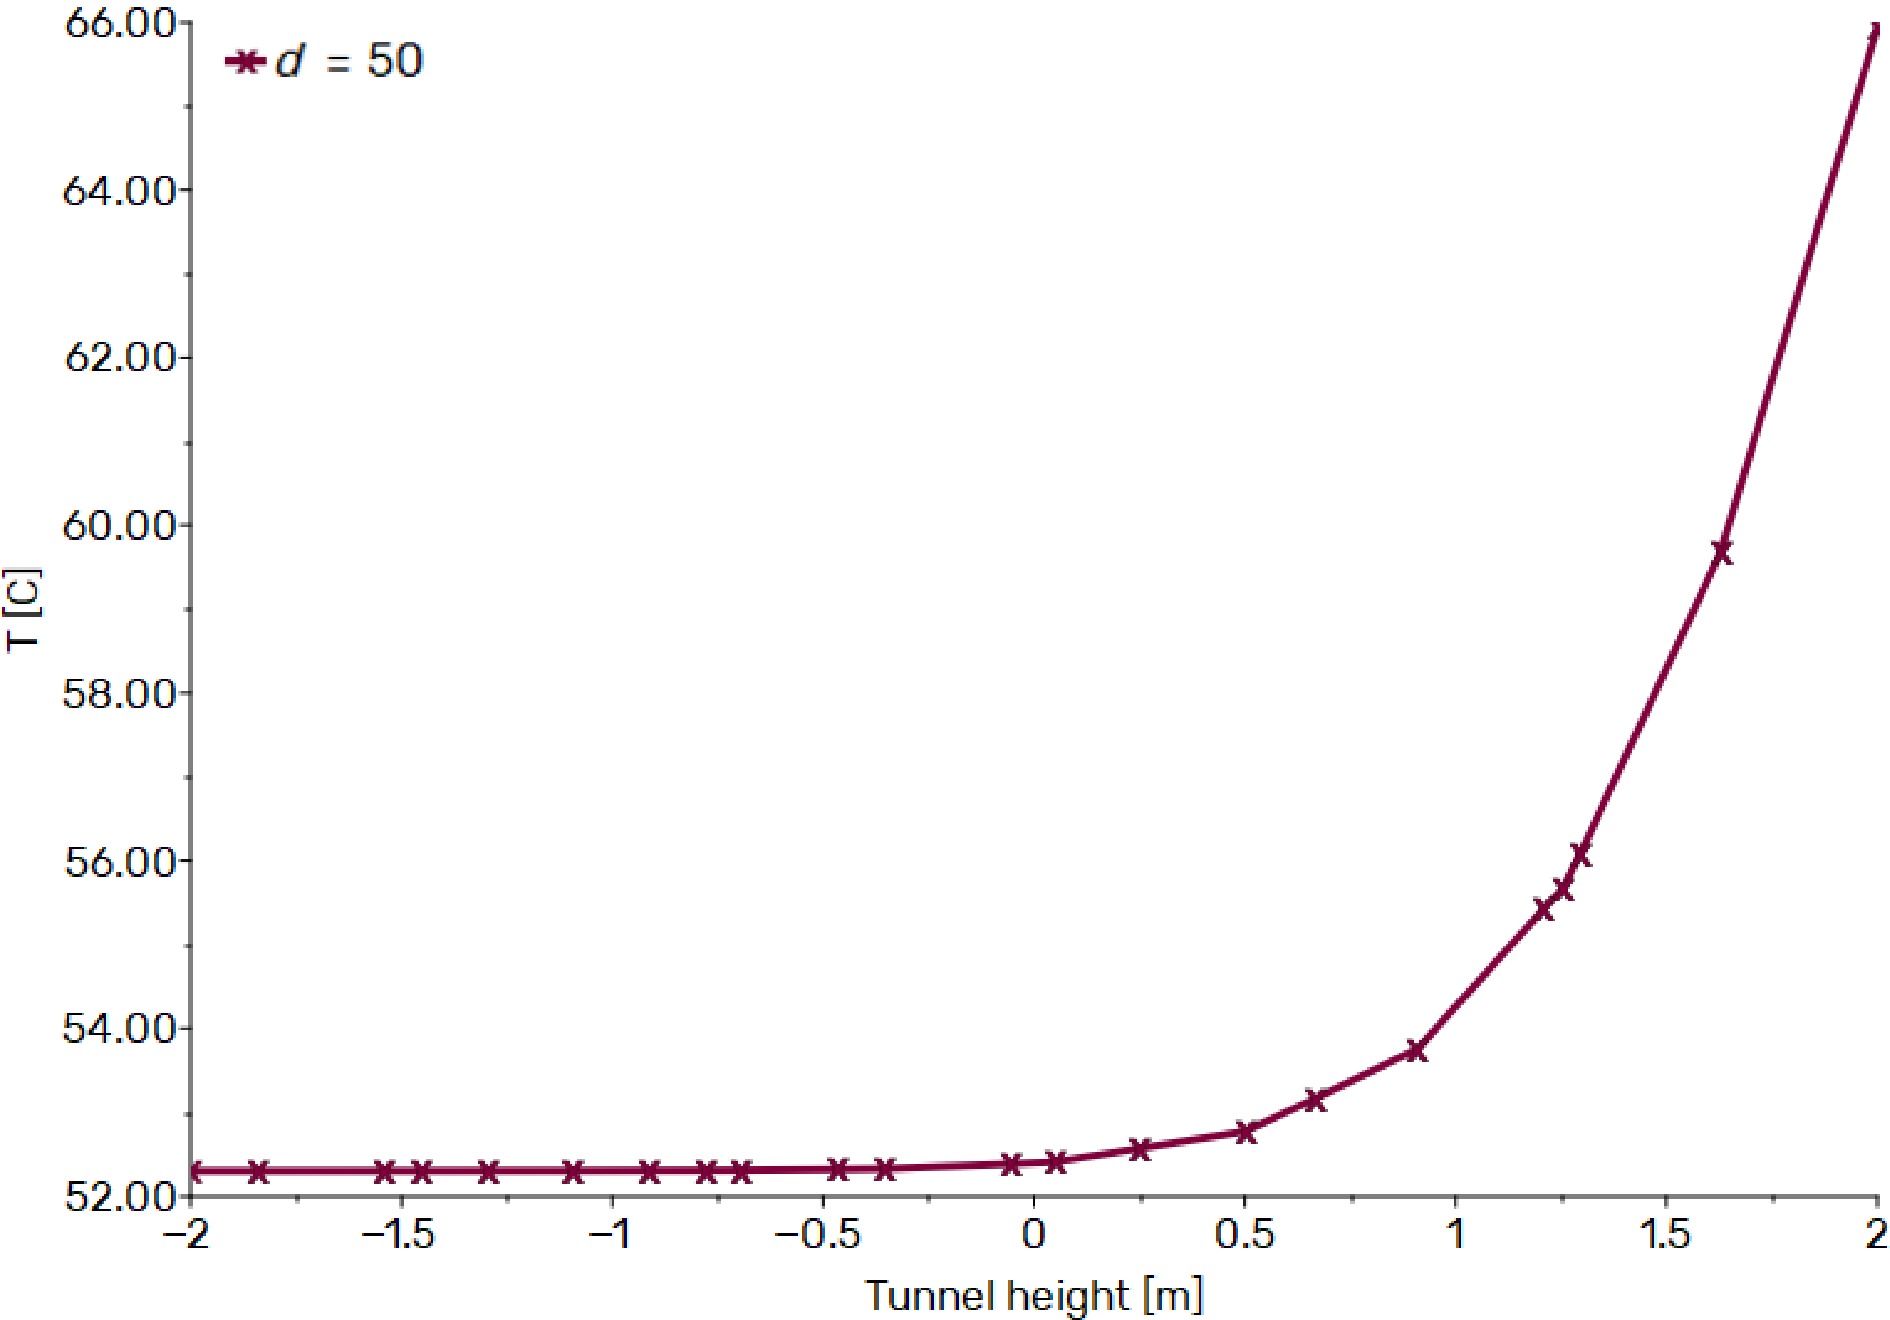
Figure 7.
Temperature trend without ventilation as a function of tunnel height at 70 m from the fire source.
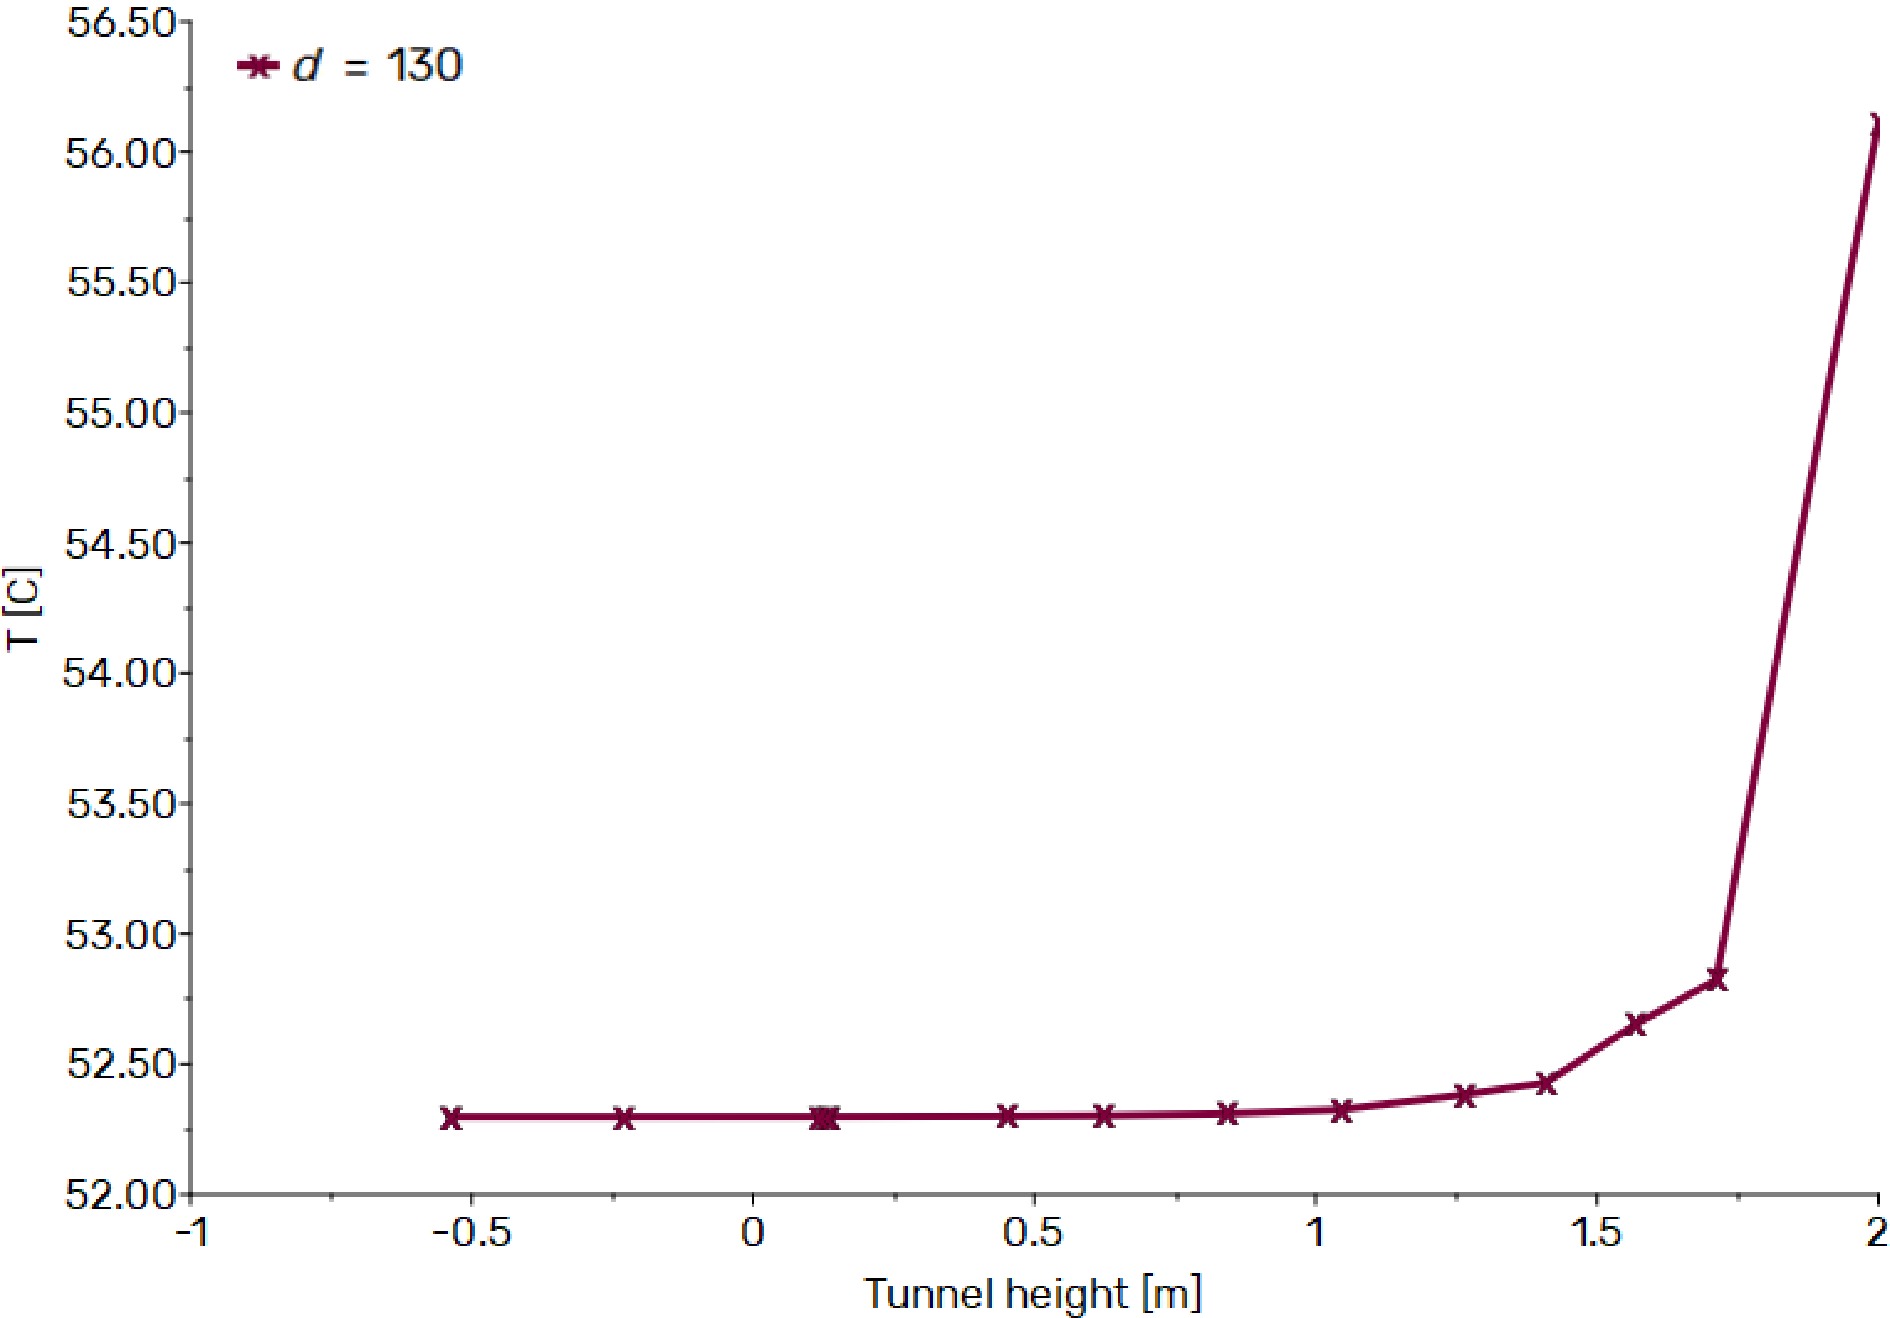
Figure 8.
Temperature trend without ventilation as a function of tunnel height at 130 m from the fire source.
Temperature evolution with ventilation
-
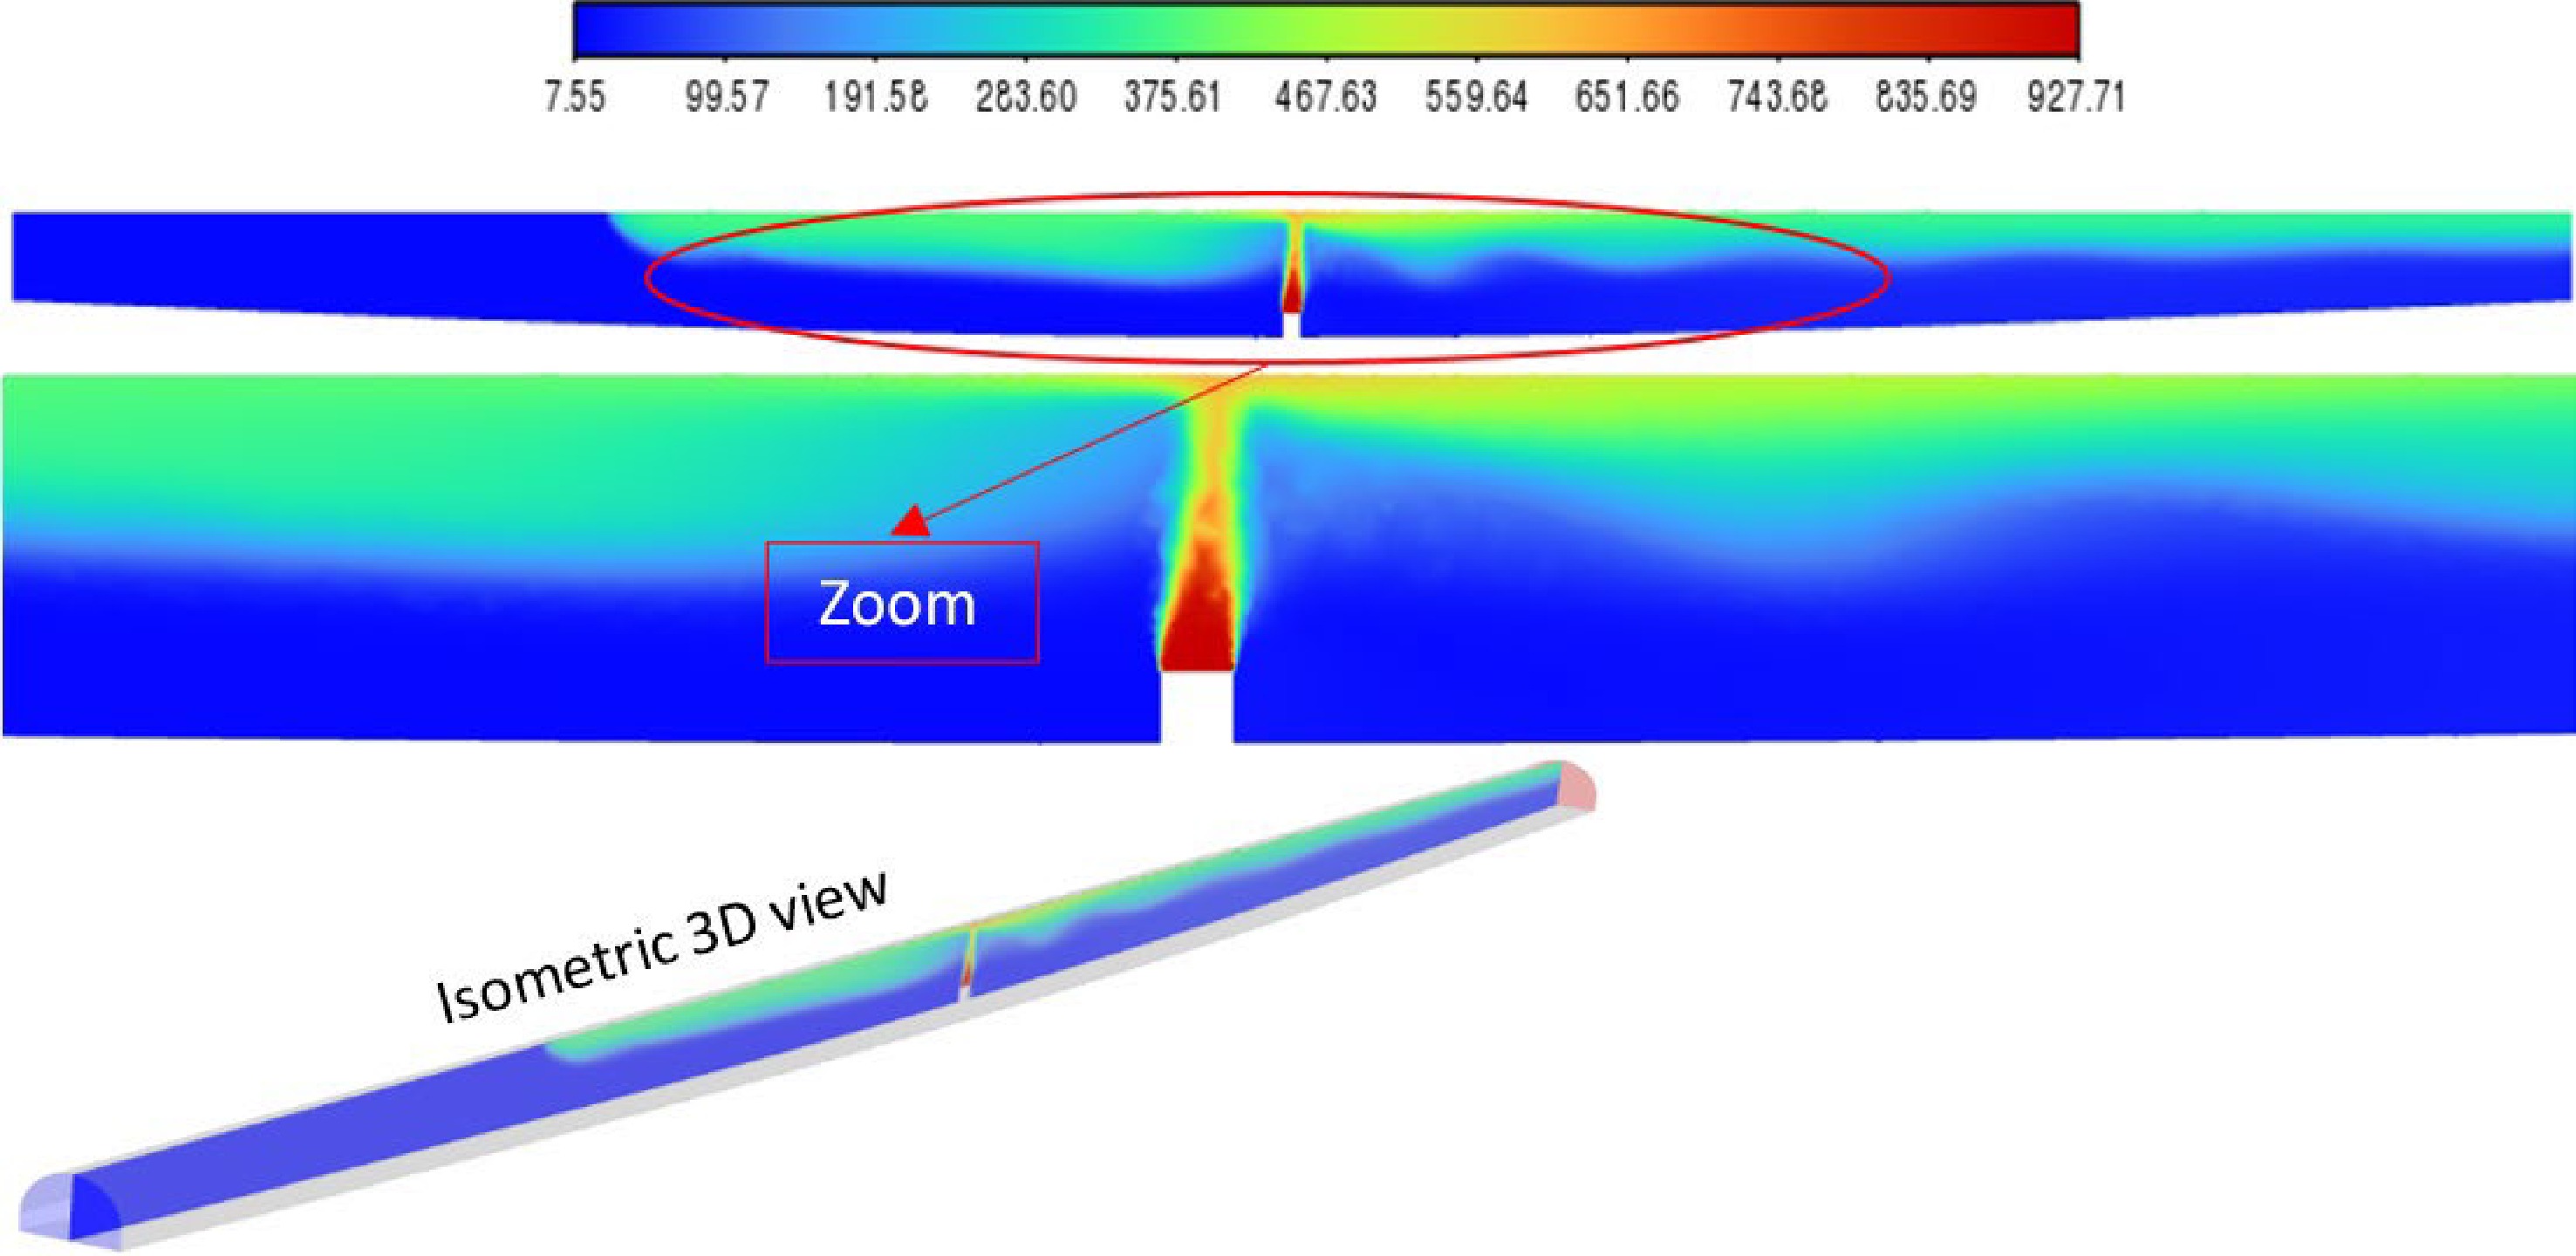
In the second part of the study on ventilation, a widely used critical ventilation velocity of 2.9 m/s was initially tested, as commonly employed in standard tunnel scenarios. This choice was made considering that the ventilation system was located approximately 150 me from the fire source. However, it was promptly discovered that this velocity was insufficient to effectively remove the hot smoke without inducing back-layering due to the sinusoidal shape of the tunnel, as illustrated in Fig. 9.
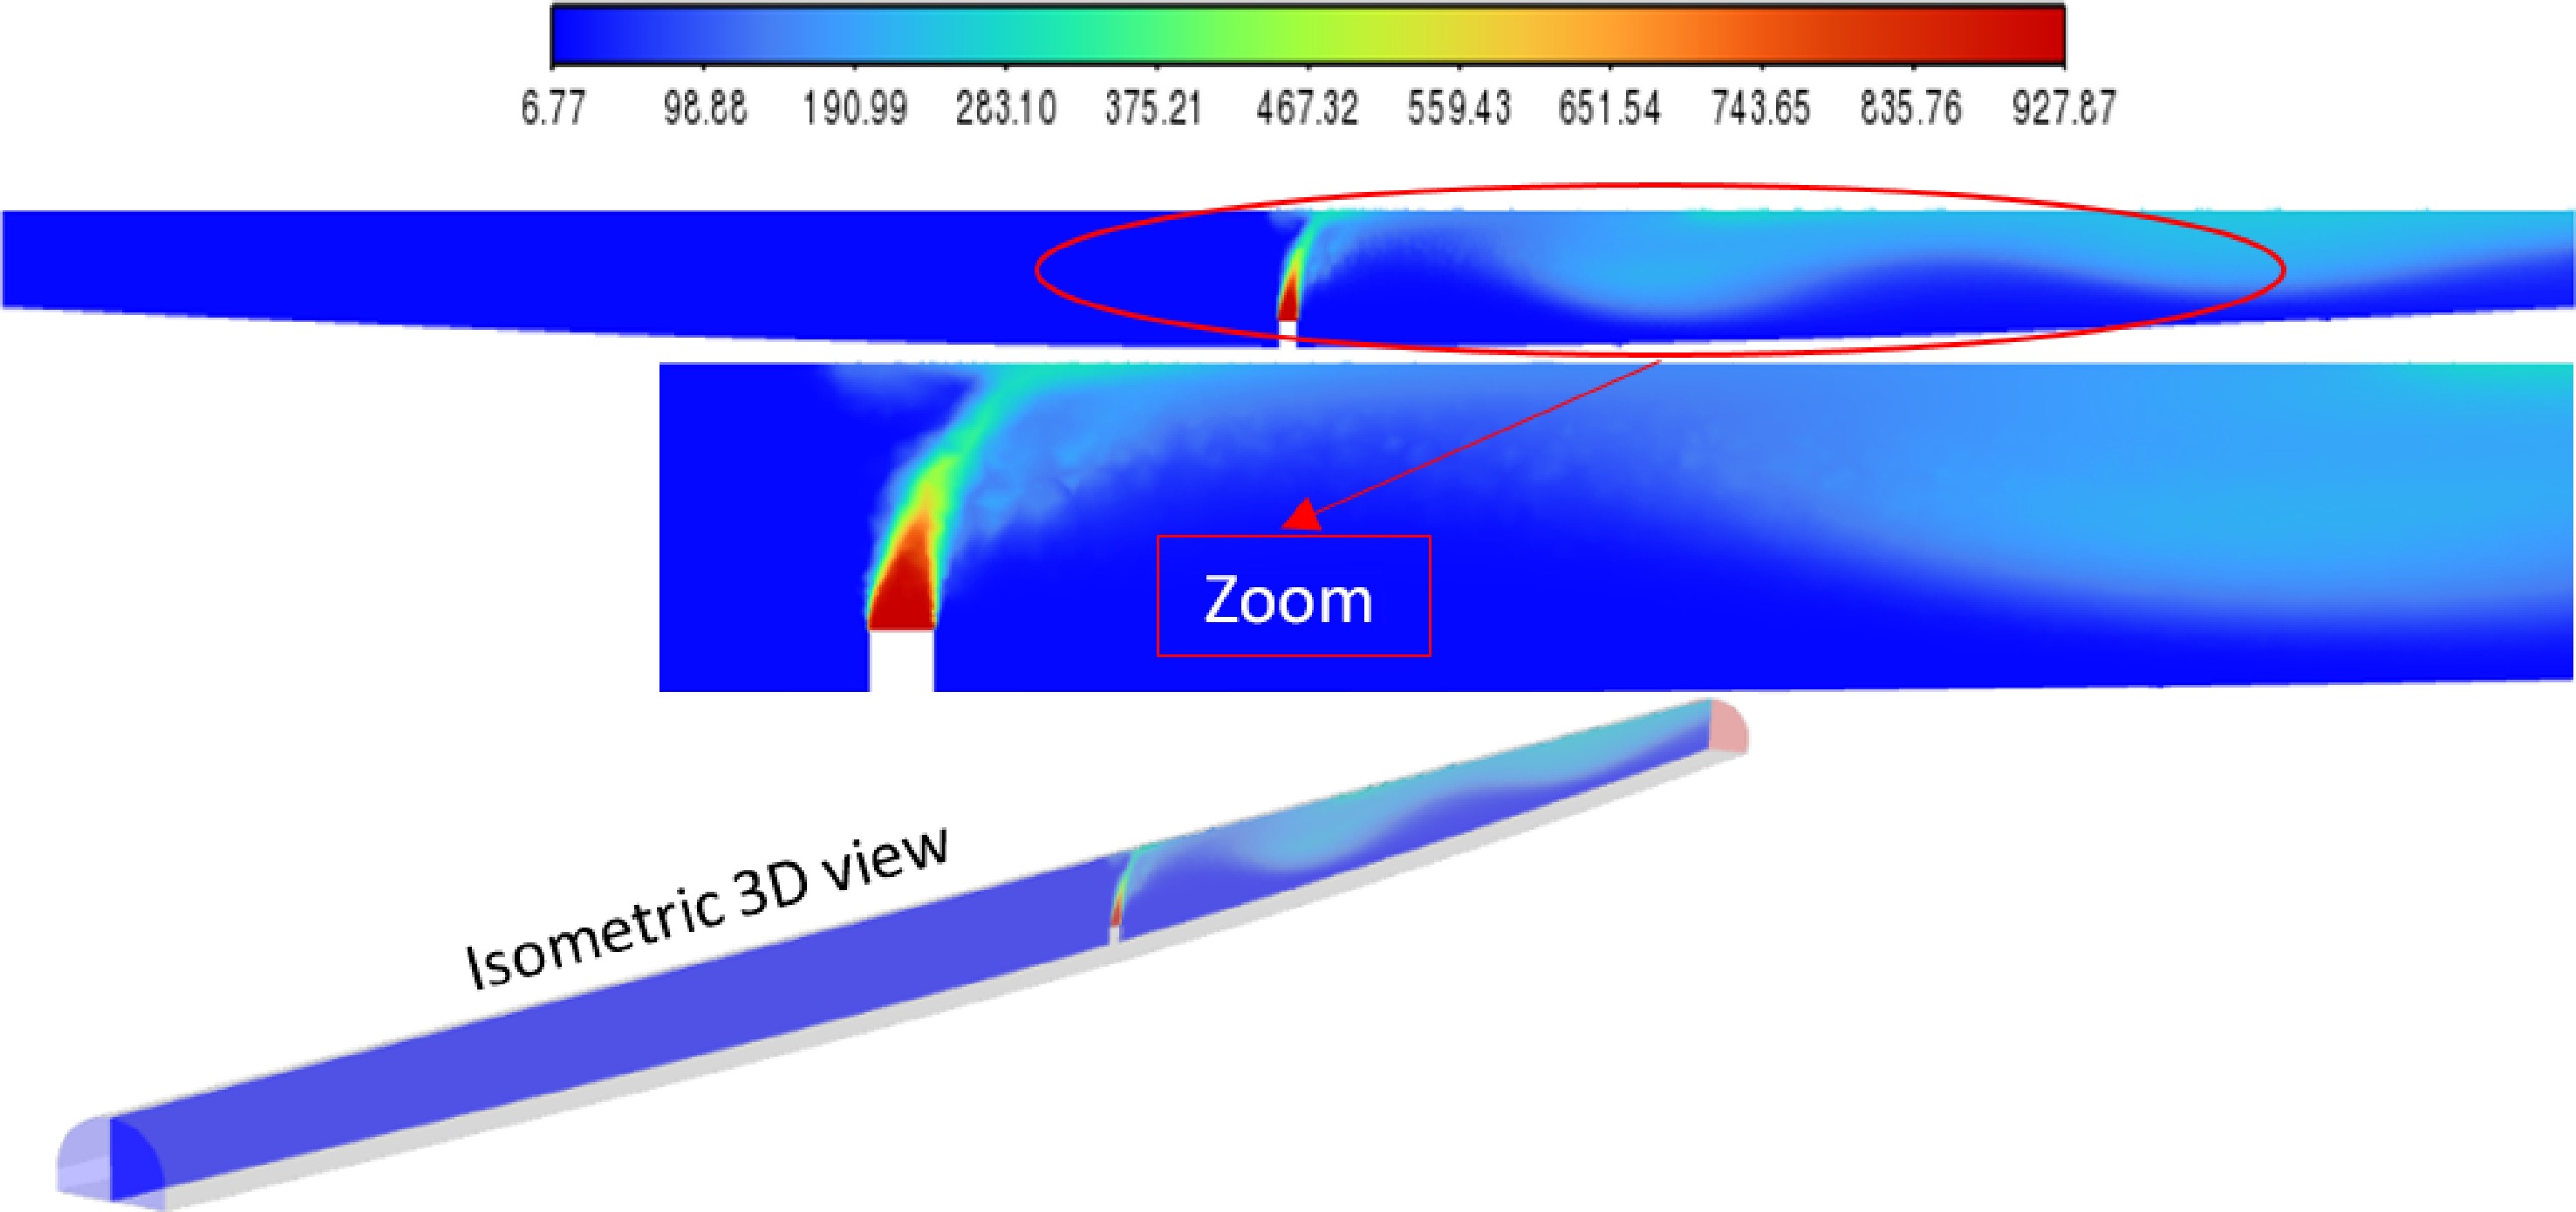
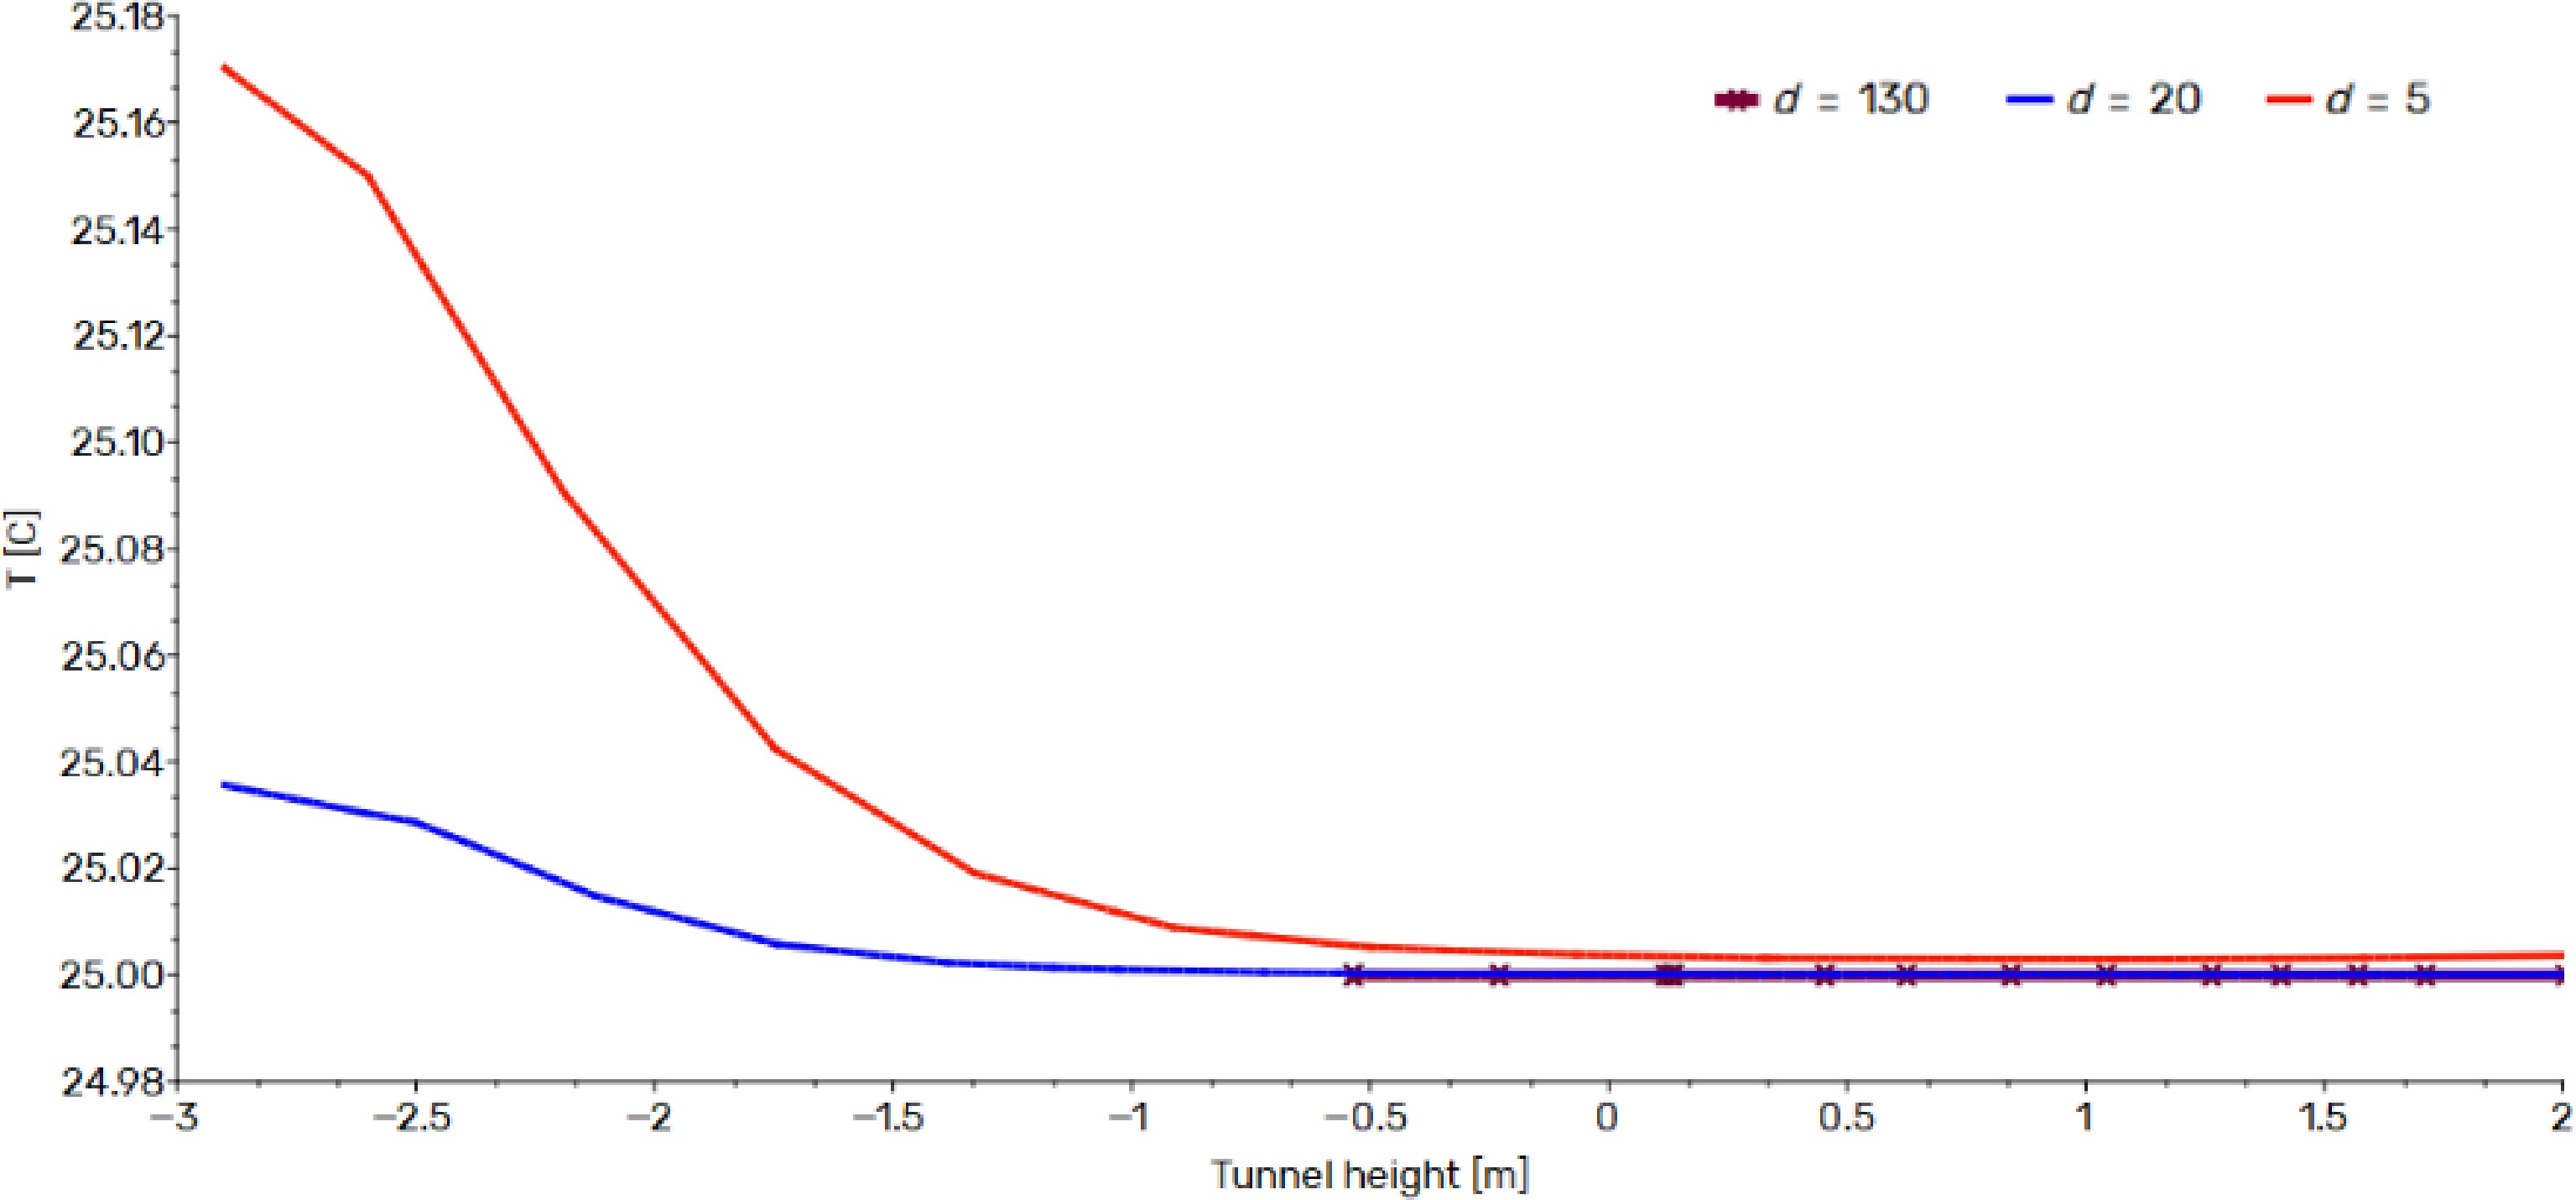
Consequently, we embarked on a series of tests to determine the optimal ventilation velocity for our specific tunnel, exploring various values. Ultimately, we determined that the most suitable velocity, considering the dimensions and geometry of our problem, was approximately double the standard critical velocity of 2.9 m/s, totaling around 5.8 m/s, as indicated in Fig. 10. Despite the reduction in velocity in the undulating portion of the tunnel, resulting from the tunnel's widening at that point, the hot smoke was effectively evacuated without turbulence towards the exit. However, due to the undulating floor of the tunnel, the smoke layer conformed to the sinusoidal pattern. Nevertheless, the efficiency of the ventilation system was demonstrated by the significant temperature reduction between the tunnel entrance and the fire source, as illustrated in Fig. 11, with temperatures approaching 25 °C. A decrease in temperature was also observed downstream from the fire source, with a maximum temperature of approximately 200 °C. In contrast, when the ventilation velocity was set at 2.9 m/s, maximum temperatures reached around 500 °C, underscoring the effectiveness of ventilation at the critical velocity of 5.8 m/s.
-
This paper represents an in-depth exploration through a CFD (Computational Fluid Dynamics) modeling case study focused on fire and smoke extraction in a tunnel characterized by a sinusoidal floor design, located in Dakar. The primary objective of this study is to tackle some of the most intricate challenges associated with tunnel ventilation and smoke extraction, particularly within the context of a tunnel featuring such a unique floor structure. The outcomes of our research reveal a critically important parameter: the optimal ventilation velocity, denoted as V, which is determined to be 5.8 m/s. This velocity value stands out significantly as it is nearly double the standard value of 2.9 m/s commonly found in the existing literature. The substantial deviation from convention can be attributed to the sinusoidal configuration of the tunnel floor, which introduces distinct aerodynamic characteristics.
These results carry substantial implications. They offer practical insights for the optimization of ventilation systems in tunnels designed with sinusoidal floors, thereby contributing to the enhancement of safety protocols for tunnel users. The elevated ventilation velocity of 5.8 m/s proves to be essential in effectively evacuating hot smoke and preventing the occurrence of back-layering, a critical aspect of tunnel safety.
Furthermore, this study serves as a valuable resource for gaining a deeper understanding of smoke behavior in tunnel environments, particularly in scenarios with non-standard features like the sinusoidal floor. The knowledge derived from this investigation has the potential to catalyze the development of more efficient and tailored safety solutions, ultimately benefiting tunnel users and public safety.
In conclusion, the findings from this research represent crucial decision-making tools for urban planners, civil engineering professionals, and policymakers. They empower these stakeholders with the knowledge needed to ensure the design and operation of tunnels that prioritize the safety and well-being of those who utilize them.
-
The authors confirm their contribution to the article as follows: study conception and design: Drame O, Mbow C; data collection: Drame O; analysis and interpretation of results: Drame O, Yahya Z, Sarr A; draft manuscript preparation: Drame O; Yahya Z; Sarr A. All authors reviewed the results and approved the final version of the manuscript.
-
All data generated or analyzed during this study are included in this published article.
-
This work is the result of collaboration between: Fluid Mechanics and Applications Laboratory, Department of Physics, Faculty of Science and Technology, Cheikh Anta Diop University (UCAD), the Water, Energy, Environment, and Industrial Processes Laboratory (LE3PI) at the Polytechnic School of Dakar, and the Department of Physics, College of Sciences, Qassim University, Buraidah, Saudi Arabia. This collaboration was made possible thanks to the logistical support of ANSYS, who provided a teaching license of Ansys Fluent version 2024R1 through their representative, Analytics Systems Africa.
-
The authors declare that they have no conflict of interest.
- Copyright: © 2024 by the author(s). Published by Maximum Academic Press on behalf of Nanjing Tech University. This article is an open access article distributed under Creative Commons Attribution License (CC BY 4.0), visit https://creativecommons.org/licenses/by/4.0/.
-
About this article
Cite this article
Drame O, Yahya Z, Sarr A, Mbow C. 2024. Soumbedjioune tunnel in dakar: a case study for CFD modeling of fire-smoke extraction in a sinusoidal floor tunnel. Emergency Management Science and Technology 4: e011 doi: 10.48130/emst-0024-0011
Soumbedjioune tunnel in dakar: a case study for CFD modeling of fire-smoke extraction in a sinusoidal floor tunnel
- Received: 17 February 2024
- Revised: 03 April 2024
- Accepted: 17 April 2024
- Published online: 21 May 2024
Abstract: Despite numerous studies on fires, each simulation faces several limitations. Fire is a complex phenomenon, and some of its processes remain poorly understood. Furthermore, the progression of flames and smoke is influenced by turbulent flow phenomena. In this context, this article delves into the analysis of smoke flow behavior using numerical fluid dynamics simulations (CFD) with the assistance of ANSYS FLUENT. The primary focus lies in describing the longitudinal ventilation system, a critical element for fire management. The chosen study area is the Soumbédjioune tunnel located in Dakar, Senegal, characterized by a sinusoidal floor with an amplitude equivalent to one-third of the entrance height. The tunnel has dimensions of 300 m in length (L), 10.5 m in width (W), and 7.22 m in height (H). To simulate the source of heat and smoke, a 2-cubic meter fire was placed in the center of the tunnel, modeling the combustion of N2, H2O, and O2 gases at a high temperature of 926.85 °C. The simulations yielded a critical ventilation velocity of 5.8 m/s, a crucial piece of information for fire management in this specific context. Furthermore, this article extends its analysis by examining the evolution of temperature and velocity contours in both ventilated and non-ventilated conditions, providing a deeper understanding of the underlying mechanisms at play.
-
Key words:
- Computer simulation /
- Environmental pollutants /
- Air pollution control /
- Pollutant removal /
- Efficiency /
- Optimization


