


-
Vegetables are an important source of micronutrients and phytochemicals such as tocopherol, provitamin A carotenoids, iron, zinc, calcium, and magnesium[1]. Green leafy vegetables contain these micronutrients and therefore have the potential to address daily requirements, especially of individuals with poor nutritional status[2,3]. Indigenized species, within the context of Africa, are the ones that originated in other continents[4,5], but have become part and parcel of traditional African food culture and agriculture production systems[6]. Dark green leafy vegetables (DGLVs) sometimes indigenous to the locals have been shown to provide carotenoids and iron in diets consumed in Tanzania[5]. Weinberger & Msuya[7] reported that in Northern Tanzania traditional leafy vegetables are good sources of micronutrients such as iron, zinc, and β-carotene. In this study, DGLVs will refer to crop species or varieties genuinely native to a region, or crops introduced to the region over time, although the species may not be native. Despite their merits, the consumption of vegetables in Tanzania has been 130 g per day, which remains below the recommended amount of 400 g per person per day by the World Health Organization[8]. Micronutrient malnutrition especially among children is a major concern in Tanzania, where 30% of children under 5 years of age are stunted and 59% of them are anemic while in the case of Lindi stunting and anemia were 21% and 71% respectively[9,10]. Gowele et al.[11] reported that more than 42% of children aged 5−10 years in the Kilosa and Chamwino districts of Tanzania were anaemic and in the Lindi region prevalence of anemia was 76.8% of children and women aged 15−49[12]. Male farmers (35%) in the Lindi region were also reported to be anaemic[12]. This study is part of the 'Vegi-Leg' project which focuses on the development of DGLVs processing technologies and corresponding products. In the context of DGLVs, simple solar drying technologies were developed to produce dried DGLVs with improved shelf-life for consumption during the dry season. Different preservation and storage techniques such as sun drying, solar drying, pickling and fermentation have been used in Africa in an attempt to make vegetables available during the lean season[13−16]. Traditional leafy vegetables production is dominated by female farmers to sustain household food security[17]. Solar dried leafy vegetables in the Lindi region have been shown to be safe and of good quality[18]. Limited studies have been conducted in the Lindi region about processed DGLVs. In addition, concentrations of different phytochemicals and bioactive compounds and micronutrients such as carotenoids, vitamins, and minerals in the different DGLVs species found there, are less documented. Therefore, this study aimed to determine carotenoids, tocopherols, and minerals (e.g. iron, zinc) of 14 different DGLVs from the Nachingwea and Ruangwa districts in the Lindi region (screening trial). The phytate concentration as an important naturally occurring anti-nutrient that may reduce the bioavailability of minerals was also determined. In addition, a drying assessment was conducted to analyze concentrations of carotenoids and tocopherols to compare three drying techniques (open sun drying (traditional), direct and indirect solar drying) and corresponding changes in micronutrient and secondary plant metabolite contents.
-
The study was conducted in the Lindi region of Tanzania, involving Nachingwea and Ruangwa districts (Fig. 1). Two villages, Mitumbati in Nachingwea district and Mibure in Ruangwa district were selected for this study[19]. The two districts experience erratic, but adequate, rainfall between December and March.
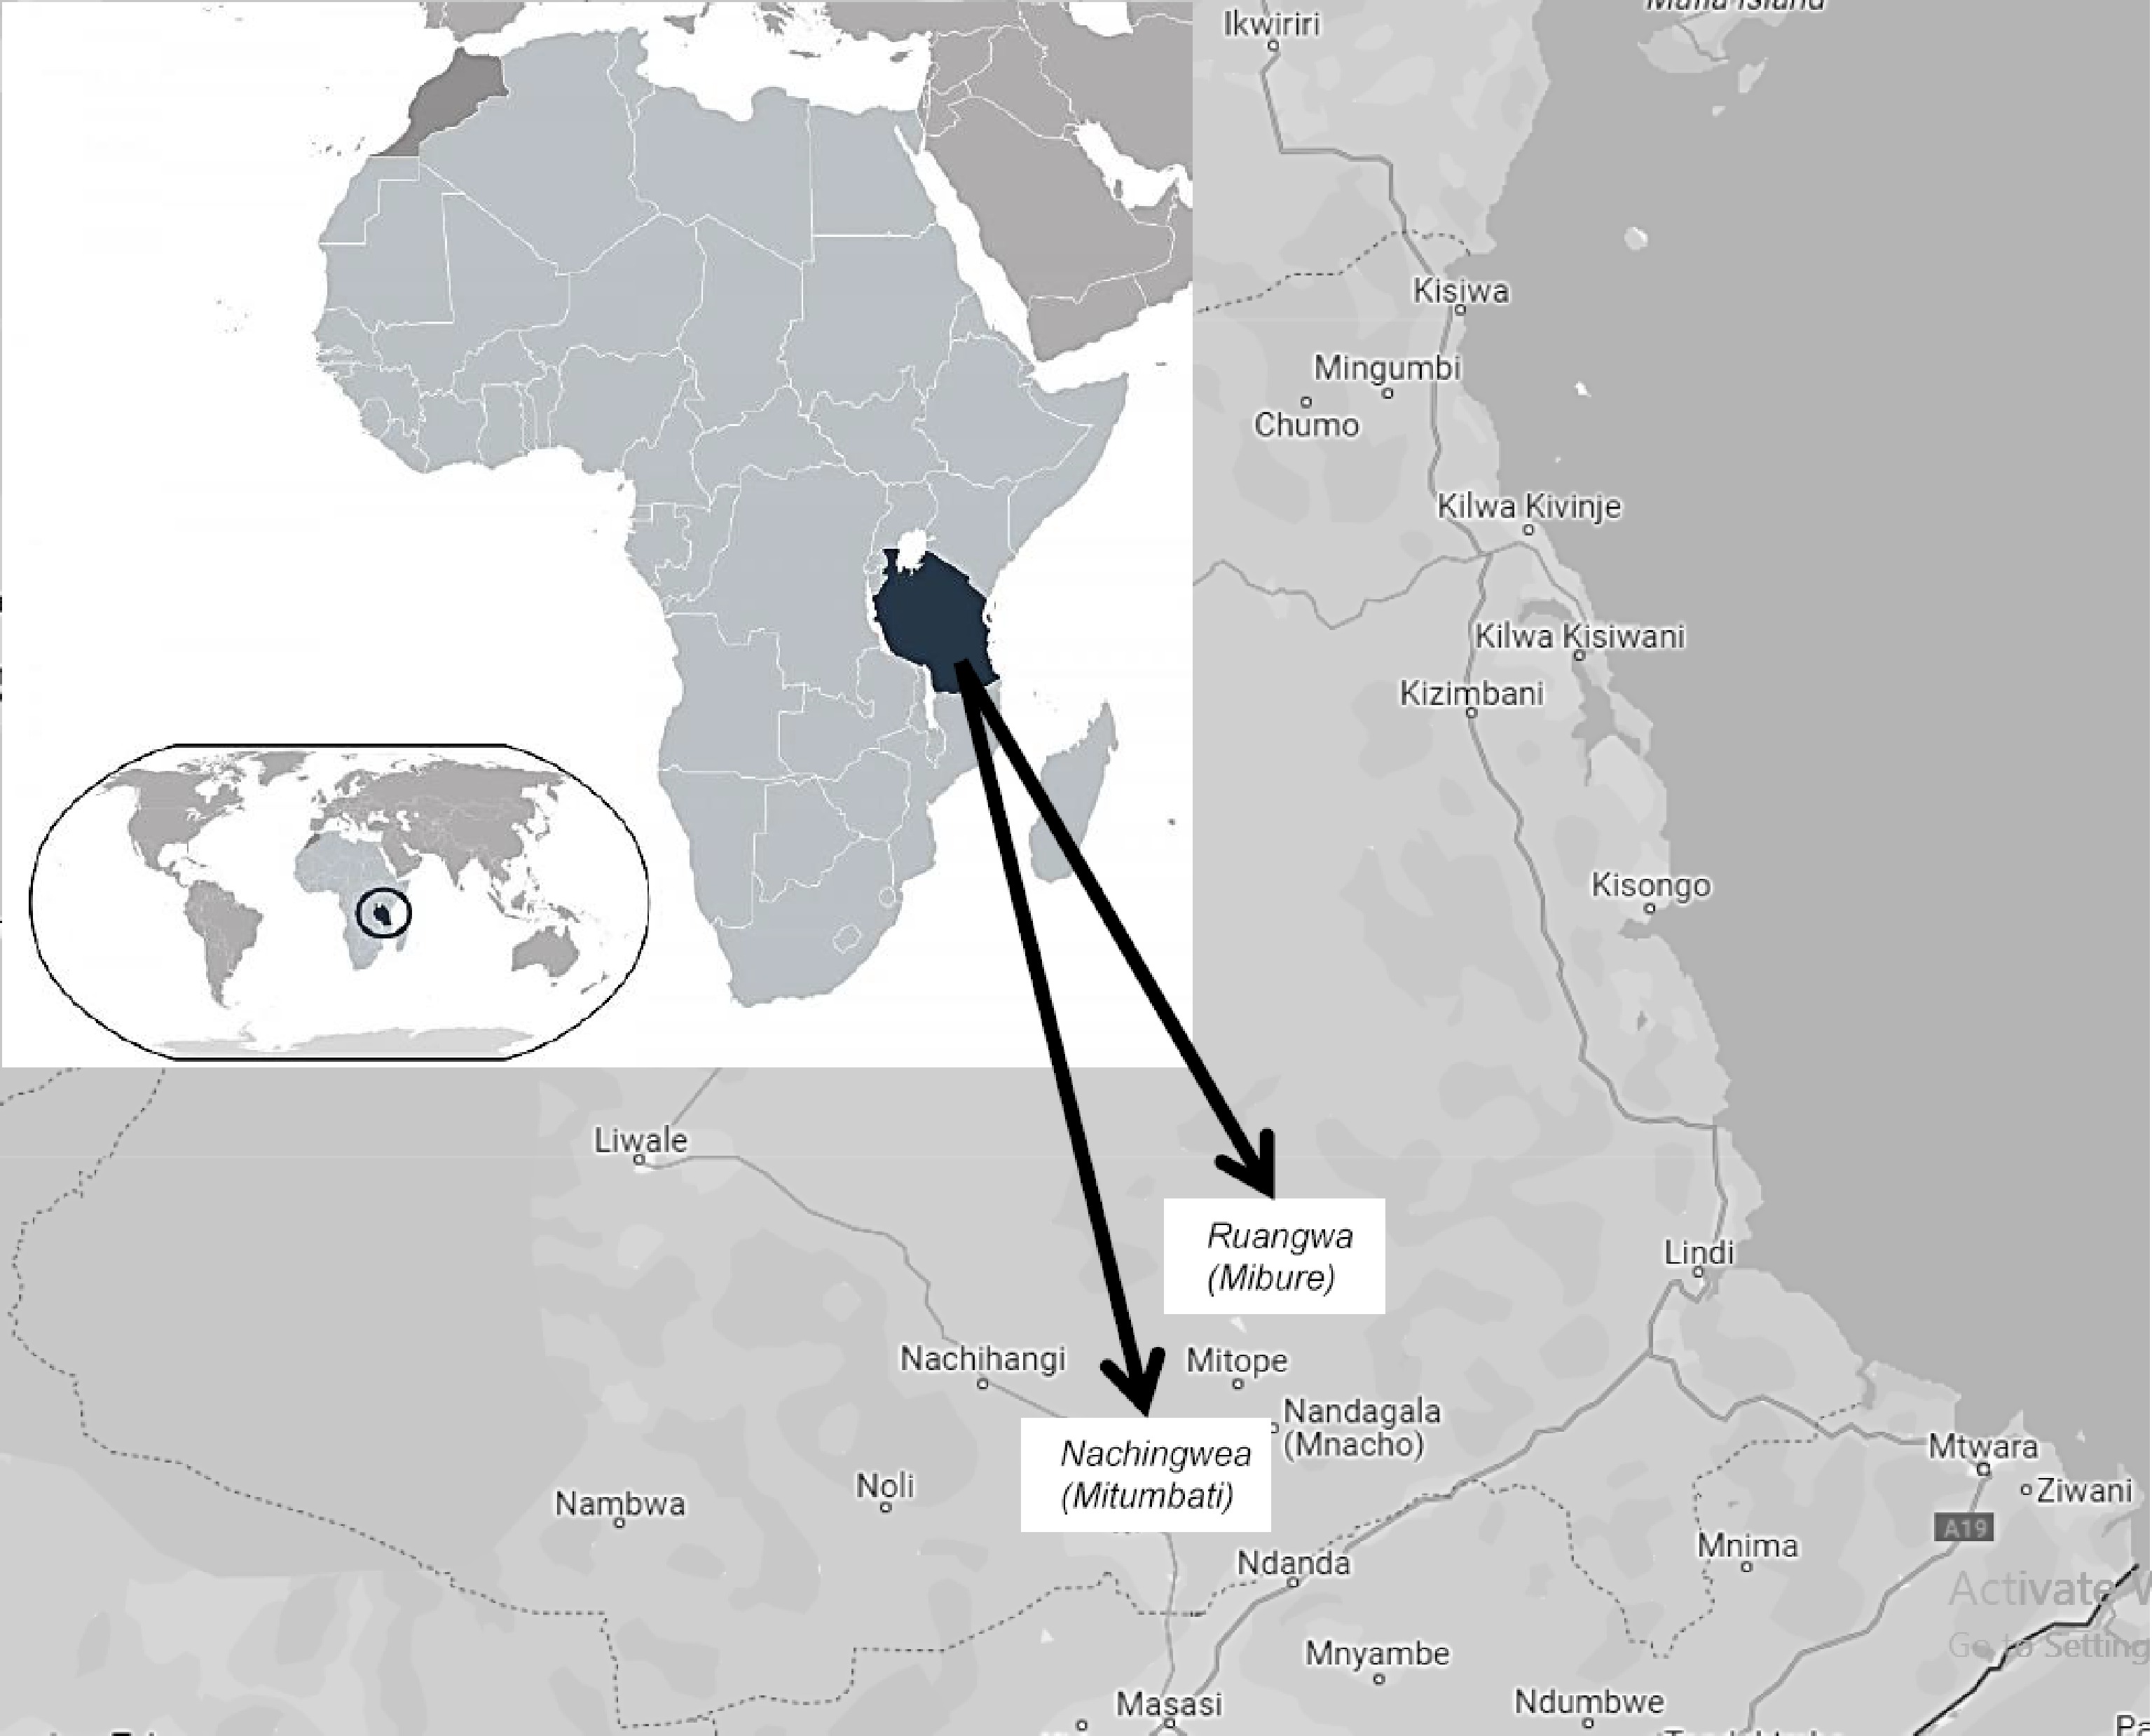
Figure 1.
Study areas, Nachingwea and Ruangwa districts.
Sample collection and preparation
Fresh vegetables and their sources (screening trial 2018)
-
Fourteen different species of dark green leafy vegetables (DGLVs) (Table 1) were collected from both study villages during the rainy season in May 2019 (fresh vegetables). The vegetables were selected based on a preliminary survey and focus group discussions with the village leadership and farmers to identify available and commonly consumed DGLVs. Identification of the vegetable samples was done by a botanist from the Department of Crop Science and Horticulture at Sokoine University of Agriculture (SUA). For the fresh vegetables, the edible parts of the vegetables were separated, washed with potable (bottled) drinking water, and air-dried at room temperature at the study sites. Then they were placed in black polyethylene bags, put in a cool box containing ice, transported to the laboratory at SUA, and stored in the freezer at −30 °C. Fresh DGLVs samples were finally packed with dry ice and transported (Turkish airline cargo) to the University of Hohenheim, Stuttgart (Germany), stored at −80 °C, then freeze-dried (2014 model LyoQuest, Telstar, Spain) and again stored at −80 °C until being analyzed for the individual measurements including carotenoids and tocopherols, minerals, and phytates.
Table 1. Fresh vegetable samples (collected 2018) names and origin.
Botanical name Local/English name Origin Conversion factor Mitumbati Mibure Amaranthus graecizans Tindi pori/Amaranthus √ − 5.27 Amaranthus maadira Mchicha bangi/Amaranthus √ − 4.87 Amaranthus spinosus Mchicha pori/Amaranthus √ √ 5.78 Amaranthus spp. Mchicha wa nyumbani/Amaranthus √ √ 6.33 Amaranthus viridis Tindi ya nyumbani/Amaranthus √ √ 4.49 Cleome gynandra Mgagani/African spider plant √ − 4.60 Corchorus olitorius LilendeJute mallow) √ √ 6.06 Curcubita maxima Majani ya maboga/Pumpkin leaves √ √ 4.51 Dioscorea spp. Nandelele √ − 5.49 Gisekia pharnaceoides L. Mtimba mwisi √ − 5.96 Ipomea aquatica Mkokobwado √ √ 7.48 Ipomea batatas L. Tembele/Sweet potato leaves √ √ 5.67 Manihot esculenta Kisamvu/Cassava leaves √ √ 2.96 Vigna unguiculata L. Majani ya kunde/Cowpea leaves √ √ 4.90 √ means the vegetable is from the respective district while − means that the vegetable is not present in the district. Conversion factor = FW/DW, fresh weight/freeze-dried weight. All individual 'fresh' samples were weighed before and after freeze-drying to estimate weight lost by freeze-drying; the resulting conversion factor was used to convert the results per analyzed freeze-dried weight (mg/100 g DW) to estimate fresh weight (mg/100 g FW) as follows:
Values per fresh weight (mg/100g FW) = Values per dried weight (mg/100 g DW)/Conversion factor
Collection and drying of vegetables (drying experiment 2021)
-
The ten most consumed varieties of 14 dark green leafy vegetables (DGLVs) were collected from each study village in March 2021 and dried on-site using three drying methods; open sun drying (traditional drying), direct solar drying, and indirect solar drying as shown in Fig. 2.
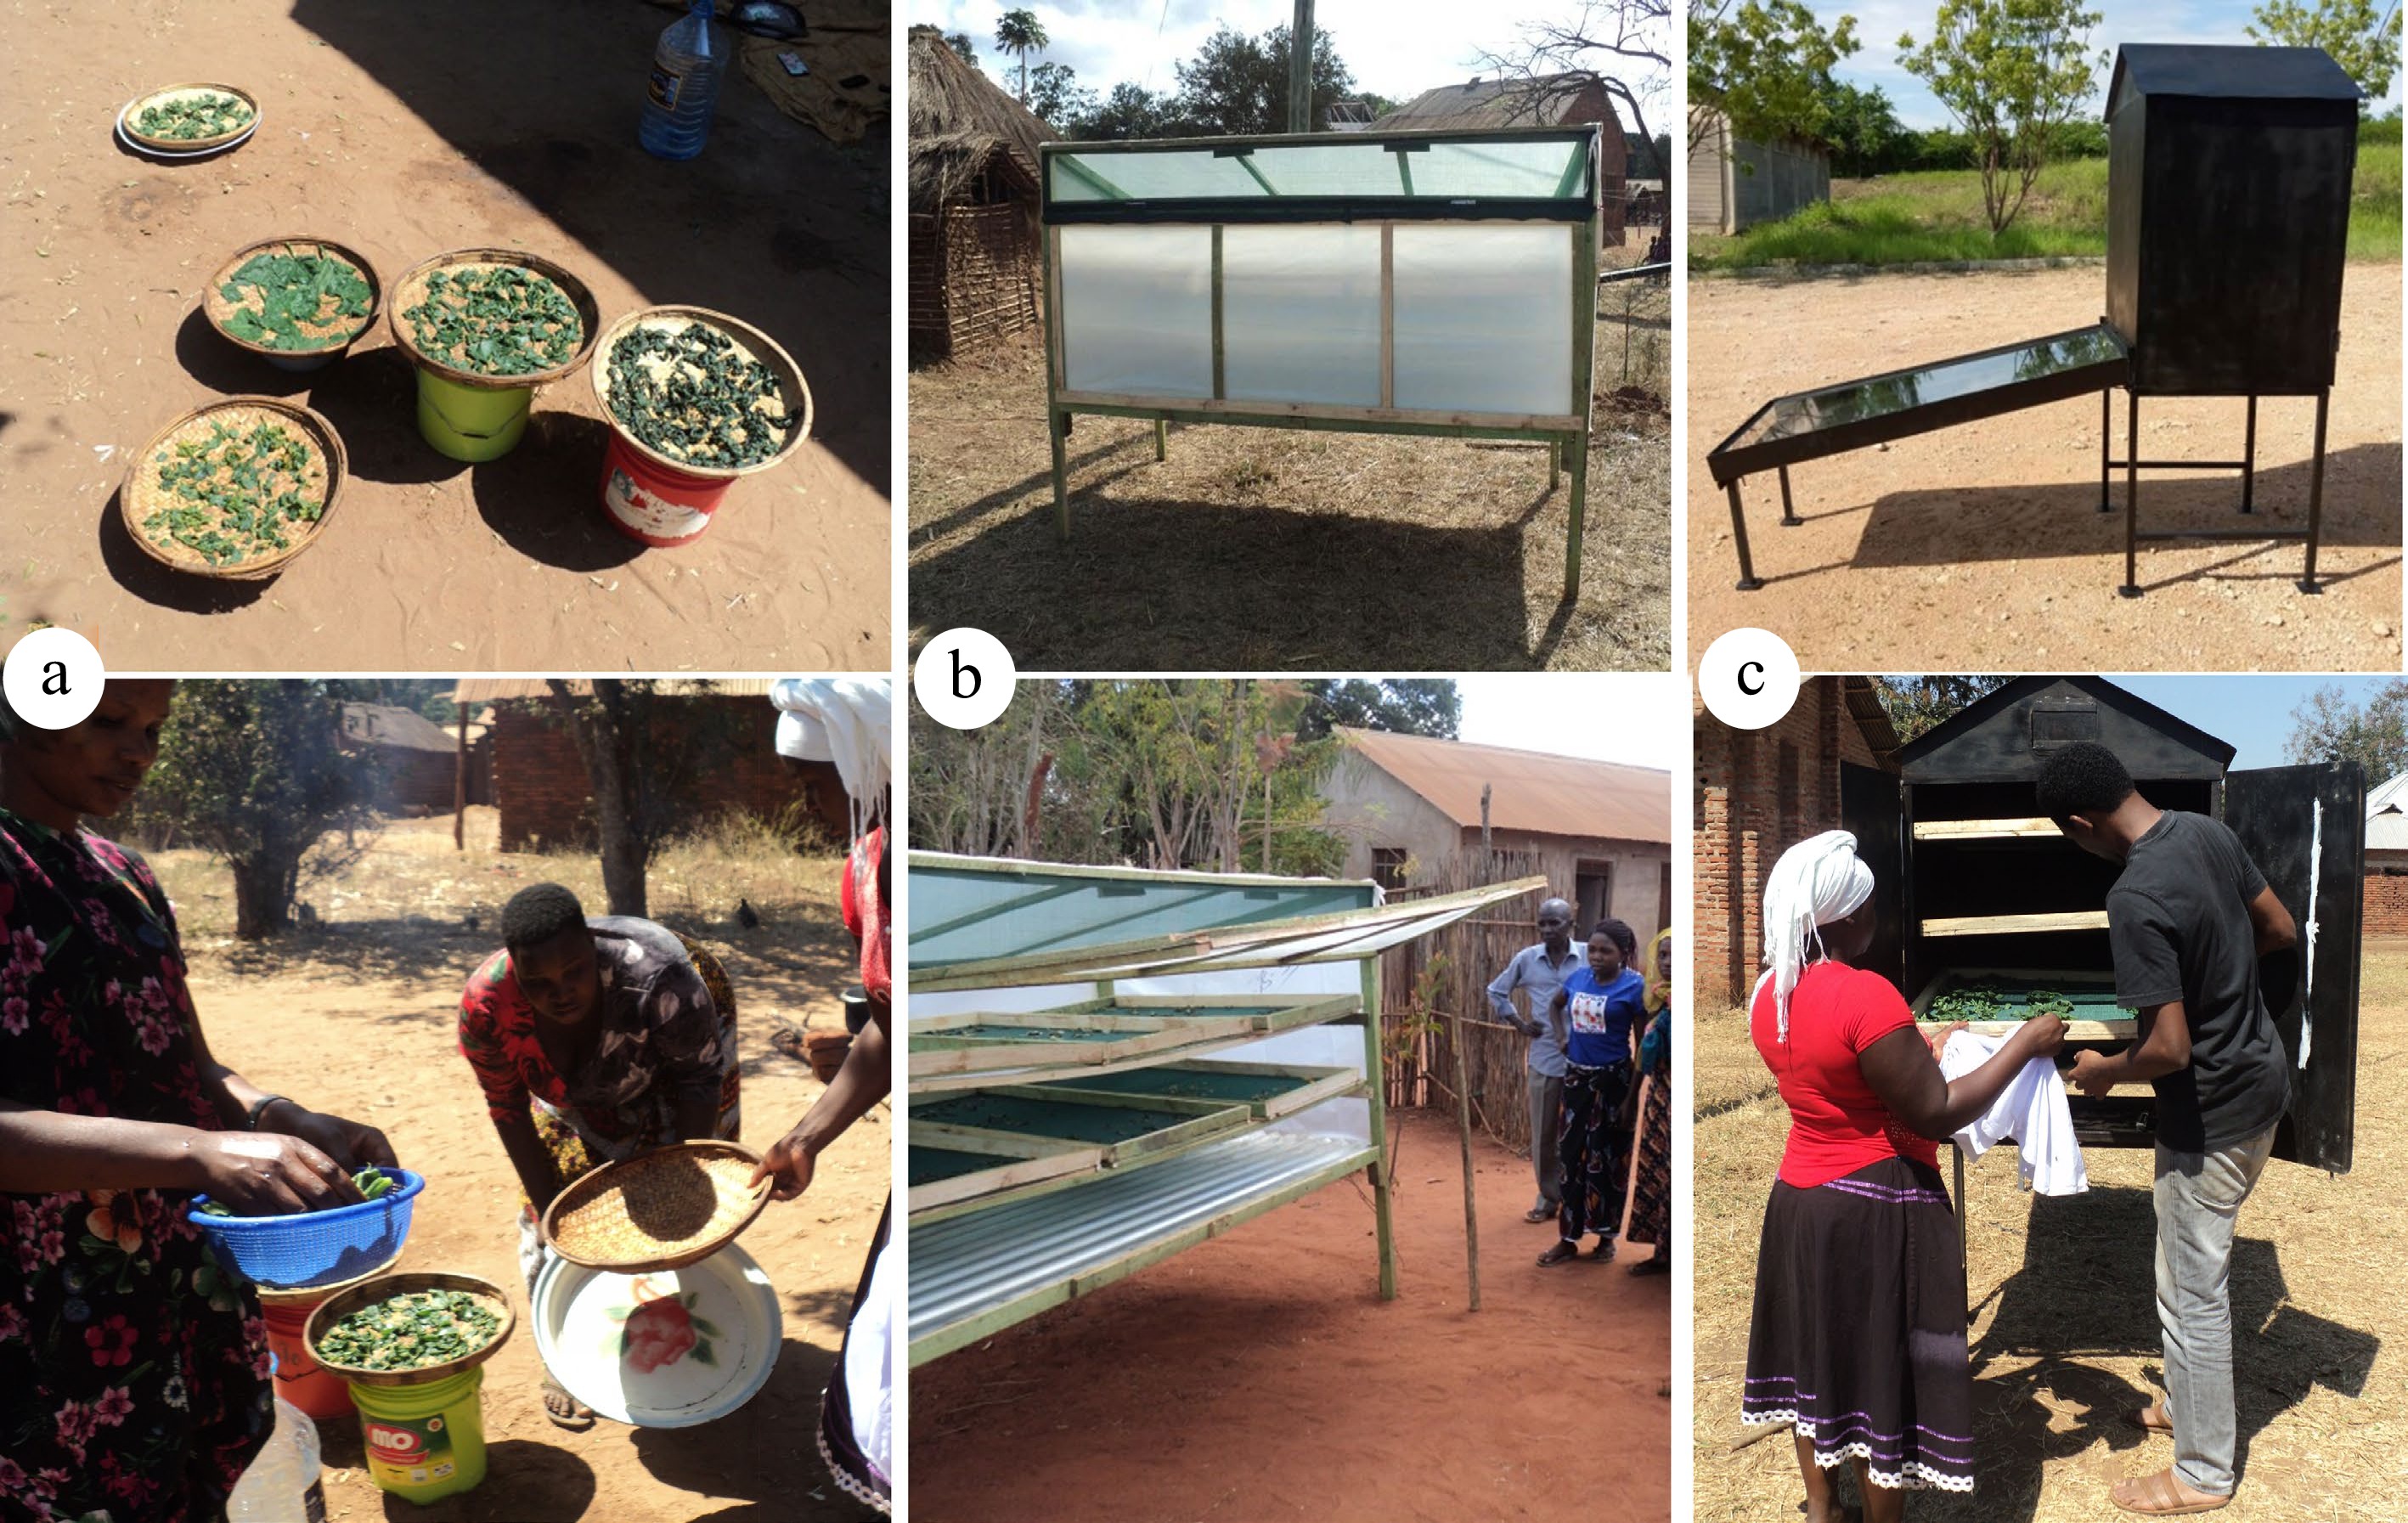
Figure 2.
(a) Open sun drying (traditional drying), (b) direct solar drying, and (c) indirect solar drying.
For open sun drying, edible leafy parts of the vegetables were collected, washed, and left to air dry. The leaves were then traditionally processed by boiling them for 2 min at 100 °C, putting them in a winnowing basket and left to dry under the open sun. For direct and indirect solar drying (Fig. 2), edible leafy parts of the vegetables were collected, washed, weighed and then blanched at 80 °C for 1 min then taken directly to the dryers and left to dry. Times, ambient, and solar dryer (internal) temperatures were also recorded. Once the vegetables were dried to a crispy texture, they were put immediately in airtight opaque polyethylene bags transported to the SUA laboratory and stored in a dry clean place away from sunlight. The samples were transported by Turkish Airline Cargo and DHL to the University of Hohenheim, Stuttgart in Germany in May 2022 and stored at −80 °C for one week. Afterwards, the individual DGLVs samples were freeze-dried for 48 h (to constant weight), using a Telstar freeze drier (2014 model LyoQuest; Telstar, Spain) and protected from light (using aluminum foil). The samples were then ground in an electric mortar to a fine homogenous powder and stored again at −80 °C in airtight containers protected from light; aliquots of the (freeze-dried) powder were finally weighed as samples for analyses on carotenoids and tocopherols.
Temperature of dryers
-
The mean temperatures of ambient (open sun), and internal direct and indirect solar dryers were determined using food-grade thermometers (Brewferm, BROWLAND) from 900 to 1,500 h.
Determination of micronutrients, secondary plant metabolites and phytate
Determination of carotenoids and tocopherols
-
The measurement of carotenoids (lutein, zeaxanthin, α-/β-carotene) and tocols (tocopherols and tocotrienols) were performed using HPLC as previously described[20−22]. Freeze-dried DGLV samples (100 mg) were saponified with 500 µL of KOH (50% w/w) and 1 mL ethanol containing 1 µL/mL of β-apo-8'-carotenal methyloxime (internal standard) at 70 °C for 30 min. After saponification, 2 mL of saline solution (15% w/V) were added and the samples were neutralized with 500 L of glacial acetic acid. The fat-soluble components were extracted with hexane (2 × 1 mL), and combined fractions were evaporated in a rotational vacuum evaporator (RVC 2-33 IR, Christ, Osterode am Harz, Germany). The residue was re-dissolved in 70 µL ethanol (> 96%) and 210 µL acetonitrile for analysis of carotenoids using RP-HPLC, UV-vis at 450 nm and fluorescence detection excitation set at 298 nm and emission set at 328 nm for α- /γ-tocopherol analysis. All reagents and solvents were of analytical and (ultra) gradient HPLC grade. N-hexane, 1,4-dioxane, potassium hydroxide solution (50%), acetic acid (100%), and ethanol were from Carl Roth GmbH + Co. KG (Karlsruhe, Germany), while methanol and acetonitrile were from J.T. Baker (Deventer, The Netherlands).
Determination of minerals
-
Iron (Fe), zinc (Zn), calcium (Ca), and magnesium (Mg) were determined by inductively coupled plasma optical emission spectrometry (ICP-OES, Vista Pro Radial (Varian Inc.) after microwave-heated nitric acid digestion (Milestone Ultra Clave II; Leutkirch, Germany), as previously described by Stuetz et al.[23]. The percentage contribution of each DGLV variety (per 100 g FW) in the respective mineral recommendation according to WHO/FAO[24] was calculated taking into account the bio-availability and corresponding values for male and female adults (19–65 years): Fe (10% bio-availability) – 14 mg (males) and 29 mg (females), Zn (low bio-availability) – 14 mg (males) and 9.8 mg (females), Ca – 1,000 mg (males) and 1,300 mg (females), Mg – 260 mg (males) and 220 mg (females).
Determination of phytate
-
Phytate (inositol hexakisphosphate or IP6), was quantitatively measured by HPLC as previously described[25]. For the analysis of InsP isomers (IP6, IP5 and IP4) in digested samples, 1.0 g of the sample was extracted for 30 min with 10 mL of a solution containing 0.2 M-EDTA and 0.1 M-sodium fluoride (pH = 10) as phytase inhibitor using a rotary shaker. The samples were centrifuged at 12,000 g for 15 min and the supernatant fraction was removed and preserved on ice. The residue was re-suspended in 5 mL of the EDTA–sodium fluoride solution and extracted again for 30 min. Next, 1 mL of the pooled supernatant fraction (of the two extraction steps) was centrifuged at 14,000 g for 15 min and 0.5 mL of the resulting supernatant fraction, filtered through a 0.2 μm cellulose acetate filter (VWR) into a Microcon filter (cut-off 30 kDa) device (Millipore) and centrifuged again at 14,000 g for 30 min. Throughout the whole extraction procedure, the samples were kept below 6 °C.
Filtrates were analyzed by high-performance ion chromatography and UV detection at 290 nm after post-column derivatisation using an ICS-3000 system (Dionex). InsP with different degrees of phosphorylation (InsP3–6) and their positional isomers were separated, without enantiomer differentiation, on a Carbo Pac PA 200 column and corresponding guard column. Fe (NO3)3 solution (1 g/L, Fe (NO3)3.9H2O, product no. 103883; Merck KGaA) in HClO4 (20 g/L, product no. 100518; Merck KGaA) was used as a reagent for derivatization according to Phillippy & Bland[26]. InsP5 isomer standards were purchased from Sirius Fine Chemicals. Seven out of nine myo-inositol tetrakisphosphate (InsP4) and nine out of 12 myo-inositol trisphosphate (InsP3) isomer standards were available from Santa Cruz Biotechnology. However, only IP6 was detected in DGLV samples. Critical values of molar ratios of phytate:iron > 1, phytate:zinc > 15, phytate:calcium > 0.24, were used to predict the inhibitory effect of phytate on Fe, Zn, and Ca bioavailability[24].
Statistical analysis
-
Concentrations of carotenoids, tocopherols, and minerals in the 14 different 'estimated' fresh leafy vegetables, and carotenoids and tocopherols in the 10 different dried leafy vegetables are described as medians and 25th and 75th percentiles while phytates are presented as mean with SD. Median values for carotenoids and tocopherols were computed from eight determinations while for minerals from six and phytate from two or four determinations, as appropriate. The concentrations of carotenoids, tocopherols, and minerals between the 14 fresh DGLVs were compared using the Kruskal-Wallis pairwise multiple comparison test while the phytate content of the 14 fresh DGLVs were compared using One-Way ANOVA and Tukey's post-hoc test. The individual carotenoid (Lutein-zeaxanthin, α-/β-carotene) and tocopherol (α-/γ-tocopherol) concentrations of the 10 dried DGLVs were compared between open-, direct- and indirect sun (or solar) drying technique using Friedman's multiple pairwise comparison test. All statistical analyses were carried out using IBM SPSS software (Version 20, IBM Corp., Armonk, NY, USA); a p-value < 0.05 was considered statistically significant.
-
Provitamin A carotenoid and tocopherol contents of different fresh DGLVs species including corresponding calculated retinol equivalents (RE) and tocopherol equivalents (TE) with percentages of contribution regarding the recommended nutrient intakes (RNI) are presented in Table 2. In contrast to other analysed DGLVs, Manihot esculenta had the highest content of lutein-zeaxanthin (20.28 mg/100 g FW) but was not significantly (p > 0.05) different from Vigna unguiculata L., Curcubita maxima, Cleome gynandra, Corchorus olitorius, Amaranthus graecizans and Amaranthus viridis. Amaranthus spinosus had the lowest lutein-zeaxanthin concentration (4.90 mg/100 g FW). The range of β-carotene levels was 1.01 to 6.89 mg/100 g FW with Cleome gynandra having the highest content of 6.89 mg/100 g FW compared to other DGLVs, but significantly different from Dioscorea spp., Amanaranthus spinosus, and Amaranthus maadira. α-carotene was highest in Amaranthus spinosus (0.96 mg/100 g). Cleome gynandra, Amaranthus graecizans and Manihot esculenta could provide ≥ 92% and 111% of the retinol RNI for males and females, respectively. Generally, α-tocopherol was the predominant tocopherol. The highest concentration of α-tocopherol were detected in Manihot esculenta (12.50 mg/100 g FW), Corchorus olitorius (3.20 mg/100 g) and Curcubita maxima (2.78 mg/100 g FW). In the case of γ-tocopherol, the highest contents were found in Dioscorea spp. (2.30 mg/100 g FW) followed by Curcubita maxima (1.23 mg/100 g FW). The concentration of γ-tocopherol of the DGLVs ranged from 0.01 to 2.03 mg/100 g FW with Dioscorea spp having the highest content. Amaranth maadira, Amaranth spinosus, Amaranth spp, Amaranth viridis, Ipomea aquatica, and Ipomea batats L. differed significantly (p > 0.05) from other DGLVs in the γ-tocopherol concentration.
Table 2. Lutein-zeaxanthin, α- and β-carotene and α- and γ-tocopherol in fresh DGLVs (mg/100 g fresh weight).
Botanical name lutein-zeaxanthin α-carotene β-carotene RE M F α-tocopherol γ-tocopherol α-TE M F Amaranth maadira 5.14 (4.80, 5.50)c 0.07 (0.05, 0.07)a,b 1.08 (0.8, 1.26)b 93 15 19 1.39 (1.30, 1.40)a,b 0.01 (0.01, 0.01)b 1.40 14 19 Amaranthus graecizans 10.6 (10.4, 11.1)a,c 0.50 (0.40, 0.60)a 6.38 (4.90, 7.40)a,b 553 92 111 2.07 (1.80, 2.20)a,b 0.60 (0.50, 0.60)a,b 2.16 22 29 Amaranthus spinosus 4.90 (4.90, 5.10)c 0.09 (0.09, 0.10)a,b 1.47 (1.30, 1.50)b 127 27 33 0.99 (0.90, 1.10)b 0.01 (0.01, 0.01)b 1.00 10 13 Amaranthus spp 6.67 (6.12, 6.94)b,c 0.38 (0.20, 0.40)a 4.66 (3.05, 5.50)a,b 404 67 81 1.21 (1.0, 1.40)a,b 0.05 (0.03, 0.05)b 1.21 12 16 Amaranthus viridis 8.01 (6.53, 9.29)a,c 0.38 (0.20, 0.80)a 2.75 (2.20, 4.70)a,b 245 41 49 1.27 (1.20, 1.40)a,b 0.04 (0.03, 0.05)b 1.30 13 17 Cleome gynandra 11.9 (11.5,12.0)a,c 0.12 (0.10, 0.13)a,b 6.89 (5.50, 9.70)a 579 97 116 1.06 (1.00, 1.10)a,b 0.19 (0.10, 0.20)a,b 1.12 11 15 Corchorus olitorius 8.73 (8.20, 9.26)a,c 0.03 (0.02, 0.05)b 2.82 (2.20, 5.20)a,b 236 39 47 3.20 (1.50, 5.20)a,b 0.35 (0.2, 0.5)a,b 3.23 32 43 Curcubita maxima 12.0 (9.58, 14.8)a 0.21 (0.08, 0.29)a,b 2.84 (2.20, 3.50)a,b 245 41 49 2.78 (2.10, 3.80)a,b 1.23 (0.90, 1.50)a 2.92 29 39 Dioscorea spp 5.02 (4.74, 5.20)c 0.01 (0.01, 0.02)b 1.01 (0.90, 1.40)b 85 14 17 0.59 (0.50, 0.70)b 2.30 (2.10, 2.50)a 0.83 8 11 Gisekia pharnaceoides L. 5.92 (5.70, 6.34)b,c 0.02 (0.01, 0.02)b 1.53 (1.40, 2.10)a,b 128 21 26 0.43 (0.40, 0.50)b 0.15 (0.14, 0.16)a,b 0.44 4.4 6 Ipomea aquatica 5.40 (5.00, 6.00)c 0.10 (0.08, 0.10)a,b 2.80 (2.40, 4.40)a,b 238 40 48 0.76 (0.70, 0.80)b 0.10 (0.07, 0.10)b 0.77 8 10 Ipomea batatas L. 7.91 (7.74, 8.07)b,c 0.29 (0.24, 0.30)a 4.50 (2.80, 6.90)a,b 387 65 77 0.74 (0.60, 0.80)b 0.08 (0.08, 0.10)b 0.75 7 10 Manihot esculenta 20.3 (17.8, 21.4)a 0.07 (0.05, 0.10)a,b 6.74 (4.40, 7.70)a 565 94 113 12.5 (8.20, 16.6)a 1.03 (0.70, 1.10)a 12.6 126 168 Vigna unguiculata L. 12.9 (10.9, 15.0)a,b 0.10 (0.05, 0.30)a,b 4.28 (3.10, 10.9)a,b 362 60 72 1.60 (1.10, 2.00)a,b 0.27 (0.20, 0.30)a,b 1.63 16 22 Values are expressed as medians of four or eight determinations (extraction/analysis) for carotenoids and tocopherols; values in parenthesis represent minimum and maximum values; values within a column not sharing a common superscript letter (a,b,c) are significantly different (p-value < 0.05); M = Males and F = Females; RE, retinol equivalents (sum of RE), for which 1 RE = 24 µg α-carotene or 12 µg β-carotene. RNI, recommended nutrient intakes for vitamin A by WHO/FAO[24]; values (microgram) for male (600 µg RE/d) and female (500 µg RE/d) adults (19–65 years). α-TEs, α-tocopherol equivalents (1 mg α-TE = 1 mg α-tocopherol or 10 mg γ-tocopherol. RNI, recommended nutrient intakes for vitamin E by WHO/FAO; values (mg) for male (10 mg/d) and female (7.5 mg/d) adults (19–65 years). Mineral contents of DGLVs
-
The median mineral concentrations of the fresh vegetables are presented in Table 3. Substantial amounts of Fe (1.70–11.13 mg/100 g FW), Zn (0.30–1.40 mg/100 g FW), Ca (76.88–469.15 mg/100 g FW), and Mg (37.43–370.71 mg/100 g FW) were found in the analyzed DGLVs species. The DGLVs with the highest Fe content was Cleome gynandra (11.13 mg/100 g FW) which was significantly different from Manihot esculenta, and Amaranthus spp. Manihot esculenta contained the highest amount of Zn (1.15 mg/100 g FW) and was significantly different from Ipomea aquatica, Ipomea batatas, Amaranthus maadira, and Amaranthus spinosus. Calcium contents ranged from 115.3 mg/100 g FW in Ipomea aquatica to 370.76 mg/100 g FW in Amaranthus viridis, while magnesium concentrations ranged from 37.43 mg/100 g FW in Ipomea aquatica to 370.71 mg/100 g FW in Amaranthus graecizans. The concentration of iron in 100 g FW of Cleome gynandra could contribute to more than 80% of RNI for males and 270% for females, respectively, while Manihot esculenta could contribute more than 10% of RNI for zinc in both, males and females. Amaranthus viridis (100 g FW) could provide more than 47% and 36% of RNI of calcium for males and females, respectively. Amaranthus viridis, Amaranthus graecizans, Amaranth maadira, and Dioscorea spp (100 g FM) could provide more than 80% of RNI for magnesium for both sexes.
Table 3. Mineral contents (mg/100 g 'estimated' fresh weight) of DGLV and their contribution (%) to the daily recommended nutrient intake by gender (M, F).
Botanical name Iron M F Zinc M F Calcium M F Magnesium M F Amaranthus maadira 2.55 (2.52,2.56)ab 18 9 0.41 (0.41, 0.40)b 3 4 381 (376, 393)a,b 38 29 309 (309, 314)a,b 119 141 Amaranthus graecizans 6.28 (6.19, 6.32)ab 45 21 1.15 (1.14, 1.17)a,b 8 12 393 (379, 403)a,b 39 30 371 (371, 379)a 143 169 Amaranthus spinosus 3.50 (3.45, 3.56)ab 25 12 0.39 (0.39, 0.39)b 3 4 435 (408, 456)a 44 33 165 (165, 166)a,b 63 75 Amaranthus spp 1.70 (1.71, 1.81)b 12 6 0.55 (0.54, 0.57)a,b 4 6 295 (283, 314)a,b 30 23 115 (105, 117)a,b 44 52 Amaranthus viridis 5.31 (5.24, 5.38)ab 38 18 0.72 (0.71, 0.75)a,b 5 7 469 (405, 547)a 47 36 217 (214, 218)a,b 84 99 Cleome gynandra 11.1 (10.6, 11.7)a 80 38 0.65 (0.65, 0.66)a,b 5 7 237 (236, 237)a,b 24 18 54.0 (53.9, 54.2)a,b 21 25 Corchorus olitorius 4.69 (1.71, 7.70)ab 34 16 0.50 (0.49, 0.50)a,b 4 5 235 (151, 321)a,b 23 18 55.0 (44.5, 64.8)b 21 25 Curcubita maxima 4.20 (3.10, 5.31)ab 30 14 0.71 (0.70, 0.71)a,b 5 7 232 (216, 249)a,b 23 18 115 (106, 126)a,b 44 53 Dioscorea spp 8.74 (8.66, 8.79)a 62 30 0.44 (0.44, 0.44)a,b 3 4 235 (235, 238)a,b 24 18 278 (276, 279)a,b 107 126 Gisekia pharnaceoides L. 5.14 (5.08, 5.25)ab 37 18 0.51 (0.51, 0.52)a,b 4 5 76.9 (75.3, 78.0)b 8 6 61.2 (59.6, 62.0)a,b 24 28 Ipomea aquatica 3.64 (3.13, 4.21)ab 26 12 0.39 (0.23?, 0.54?)b 2 3 115 (105, 130)b 12 9 37.4 (33.9, 41.6)b 14 17 Ipomea batatas L. 3.79 (3.55, 4.02)ab 27 13 0.34 (0.29, 0.40)b 2 3 127 (119, 136)b 13 10 68.0 (61.1, 73.5)a,b 26 31 Manihot esculenta 2.21 (2.11, 2.34)b 16 8 1.41 (1.37, 1.43)a 10 14 212 (190, 237)a,b 21 16 94.5 (94.0, 94.9)a,b 36 43 Vigna unguiculata L. 2.93 (2.23, 3.87)ab 21 10 0.58 (0.54, 0.63)a,b 4 6 208 (159, 258)a,b 21 16 58.0 (56.8, 59.5)b 22 26 Values are medians (minimum, maximum) of three or six determinations (extraction/analysis) or percentages (contributions for M, F); values within a column not sharing a common superscript letter (a,b) are significantly different (Kruskal-Wallis multiple pairwise comparison; Adj. p < 0.05). M = Males and F = Females; RNI, recommended nutrient intakes by WHO/FAO[24], values all in [mg/d] for adults by gender (19–65 years): iron (10% bioavailability) – 14 (M) and 29 (F); zinc (low availability) – 14 (M) and 9.8 (F); calcium 1,000 (M) and 1,300 (F); magnesium – 260 (M) and 220 (F). Phytate content of DGLVs
-
Total phytate using IP6 contents of DGLVs and phytate ratios to Fe, Zn, Ca, and Mg are presented in Table 4. Molar ratios along with the suggested critical values for estimating the effect of phytate on their bioavailability are also presented. Cleome gynandra (22.98 mg/100 g FW) had the highest phytate contents followed by Corchorus olitorius (12.73 mg/100 g FW) which were not significantly (p > 0.05) different. Gisekia pharnaceoides L. and Dioscorea spp. had the lowest phytate content and molar ratios of phytate to minerals. All DGLVs did not exceed the critical values of the inhibitory effect of phytate on mineral bioavailability.
Table 4. Phytate content (mg/100 g fresh weight) and its ratios to individual minerals in DGLVs.
Botanical name Total phytate Phy:Fe Phy:Zn Phy:Ca Phy:Mg Amaranth maadira 6.08 ± 0.57b 0.20 1.47 0.00 0.00 Amaranthus graecizans 5.64 ± 0.53b 0.08 0.49 0.00 0.00 Amaranthus spinosus 5.14 ± 0.48b 0.12 1.31 0.00 0.00 Amaranthus spp. 4.69 ± 0.44b 0.23 0.84 0.00 0.00 Amaranthus viridis 6.26 ± 0.63b 0.10 0.86 0.00 0.00 Cleome gynandra 23.0 ± 1.90a 0.17 3.50 0.01 0.02 Corchorus olitorius 13.1 ± 9.54a,b 0.23 2.52 0.00 0.01 Curcubita maxima 9.50 ± 3.24b 0.18 1.25 0.00 0.00 Dioscorea spp. 1.82 ± 0.16b 0.02 0.41 0.00 0.00 Gisekia pharnaceoides L. 1.66 ± 0.15b 0.03 0.32 0.00 0.00 Ipomea aquatic 10.1 ± 1.87b 0.25 3.50 0.01 0.01 Ipomea batatas L. 4.88 ± 0.54b 0.11 1.42 0.00 0.00 Manihot esculenta 9.59 ± 0.88b 0.37 0.67 0.00 0.00 Vigna unguiculata L. 6.44 ± 0.66b 0.19 1.10 0.00 0.00 Values are means and standard deviation of two or four determinations (extraction/analysis) for phytate; values within a column not sharing a common superscript letter (a,b) are significantly different (p-value < 0.05). Phy = phytate, Fe = iron, Zn = zinc, Ca = calcium and Mg = magnesium; Molar masses (µ/mol) for phytate: 660.04, Fe: 55.84, Zn: 65.38, Ca: 40.07 and Mg: 24.30; Critical values of molar ratios predicting the inhibitory effect of phytate on Fe, Zn, and Ca: phytate:iron > 1, phytate:zinc > 15, phytate:calcium > 0.24. Effect of different drying methods on carotenoids and tocopherols contents
Temperature of dryers used for drying DGLVs (drying experiment 2021)
-
The mean ambient and internal direct and indirect solar dryers' temperatures are presented in Fig. 3. The values changed over time with direct solar drying attaining higher temperatures (47.5 °C; 11 am) as compared to the indirect solar dryer temperature (41 °C; 2 pm) and ambient (open sun drying) temperature (32 °C; 2 pm).
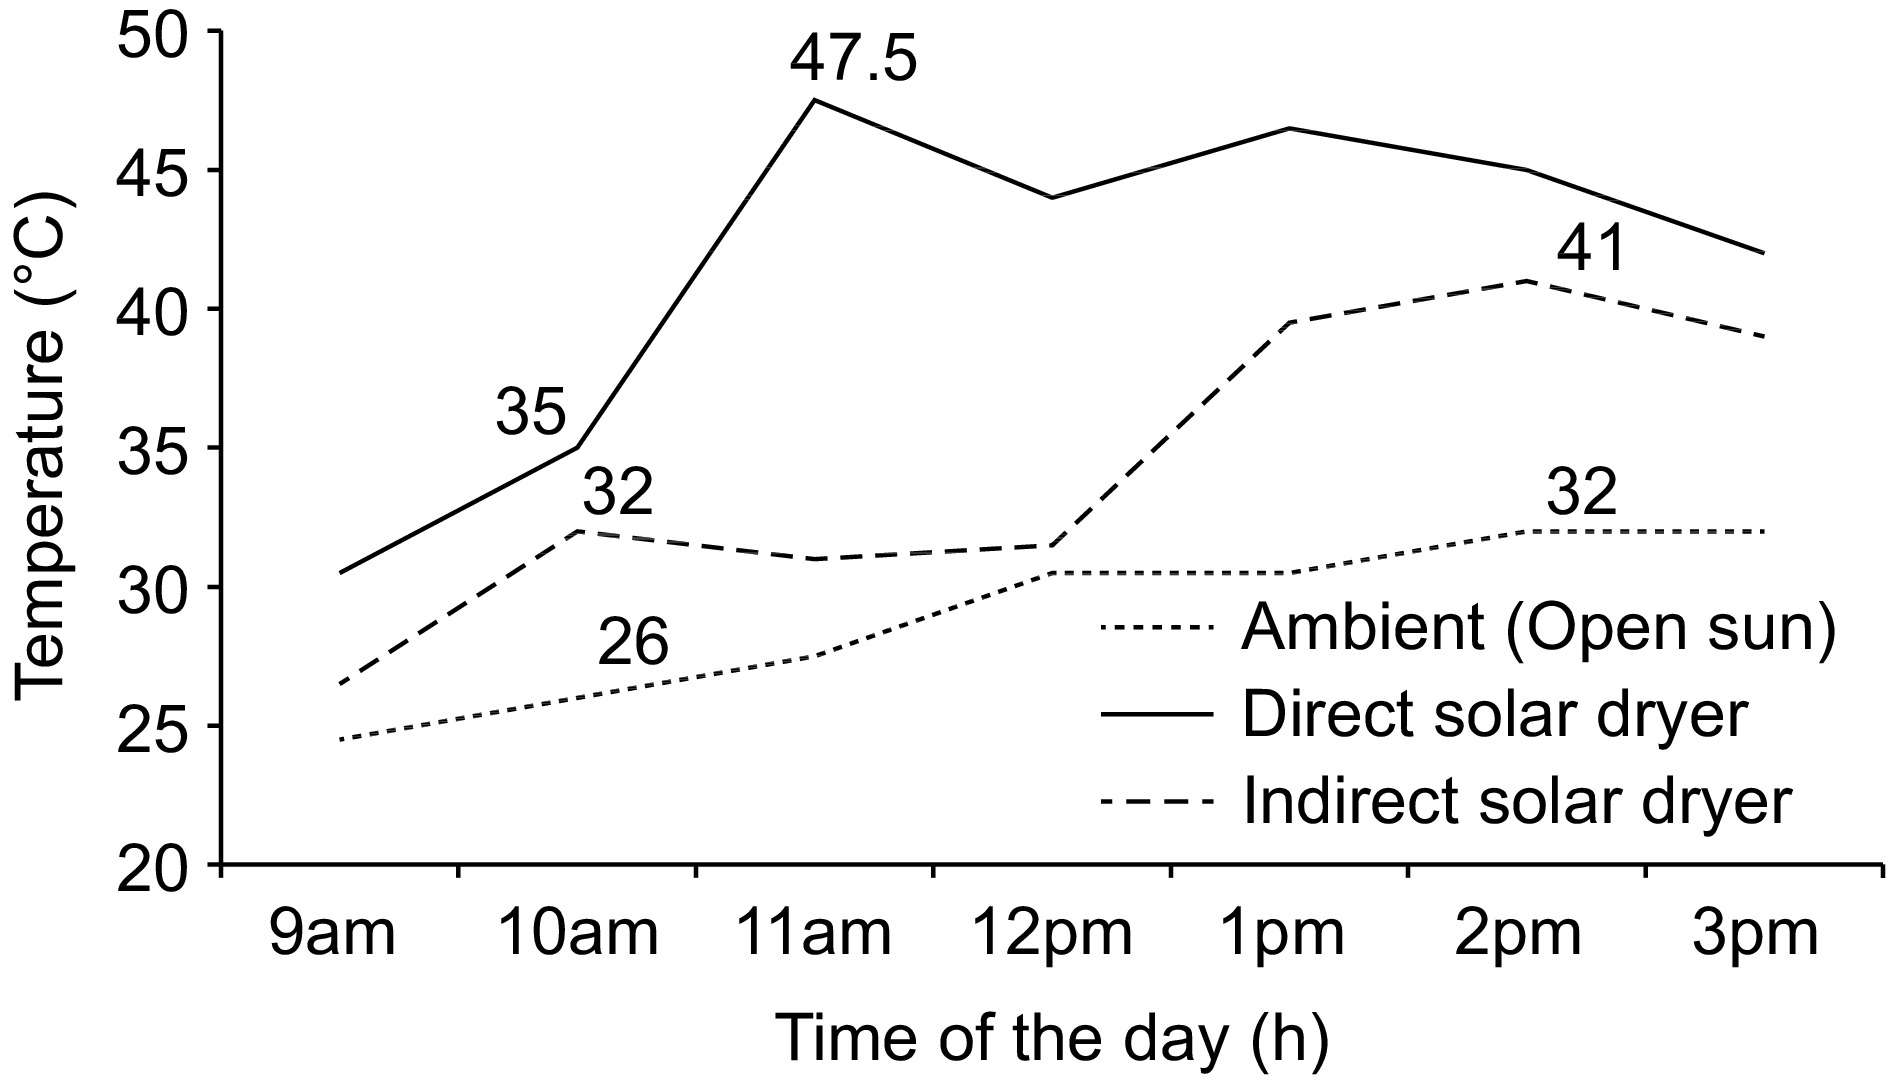
Figure 3.
Variation of the average ambient and drying temperatures (°C) inside the dryers over time (d) in both villages for 7 d.
Effect of drying methods on lutein- zeaxanthin, α and β-carotene contents of DGLVs
-
The effect of different drying methods on lutein-zeaxanthin, α and β carotene contents of DGLV species are presented in Table 5. For Manihot esculenta, the highest lutein-zeaxanthin contents (43.08 mg/100 g DW) were found in open sun-dried samples, followed by indirect (41.55 mg/100 g DM) and direct solar drying (33.95 mg/100 g DM). On the other hand, Corchorus olitorius (43.72 mg/100g) and Manihot esculenta (41.55 mg/100 g) had higher contents from direct solar and indirect solar drying technologies, respectively, compared to open sun drying. There was no significant difference in drying methods for Manihot esculenta, Curcubita maxima, and Ipomea batatas L. There was no significant difference in lutein-zeaxanthin concentration of open sun drying and direct solar drying except for Amaranthus viridis.
Table 5. Lutein- zeaxanthin, α and β-carotene contents (mg/100 g dry weight) of DGLVs from different drying methods.
Botanical names Lutein- zeaxanthin α-carotene β-carotene Open sun Direct solar Indirect solar Open sun Direct solar Indirect solar Open sun Direct solar Indirect solar Amaranthus graecizans 33.0ab 22.58b 38.9a 1.04ab 0.09b 1.12a 20.4a 6.96b 17.4a (31.2, 38.2) (22.4, 22.8) (37.0, 42.0) (0.89, 1.17) (0.09, 0.19) (0.95, 1.37) (13.2, 23.7) (6.89, 7.32) (16.0, 22.9) Amaranthus spp. 18.8ab 21.1a 11.4b 1.01a 0.38ab 0.21b 12.0a 11.2ab 4.44b (18.3, 20.9) (20.4, 22.4) (11.1, 11.8) (0.90, 1.10) (0.35, 0.54) (0.18, 0.24) (11.6, 12.6) (10.6, 11.4) (4.32, 4.48) Amaranthus viridis 28.1a 16.0b 21.0ab 1.90a 0.81b 1.20ab 13.9a 7.58b 8.73ab (24.8, 30.2) (14.1, 17.3) (17.4, 23.6) (1.76, 2.37) (0.75, 0.86) (1.11, 1.32) (12.4, 19.4) (6.92, 8.23) (8.26, 9.18) Corchorus olitorius 33.3ab 43.7 29.1b 0.22ab 0.49a 0.14b 8.81b 27.4a 9.83ab (28.7, 34.8) (40.6, 45.6) (28.7, 29.3) (0.10, 0.31) (0.29, 0.60) (0.10, 0.17) (8.04, 9.07) (20.4, 28.7) (9.53, 10.1) Curcubita maxima 20.2a 24.2a 23.0a 0.44a 0.76a 0.54a 6.04a 7.31a 6.93a (19.0, 20.9) (20.2, 25.3) (15.9, 30.5) (0.39, 0.54) (0.52, 1.24) (0.27, 0.64) (5.78, 6.59) (6.56, 7.66) (4.81, 9.14) Gisekia pharnaceoides L. 18.1ab 27.2a 16.3b 0.63a 0.23ab 0.12b 6.55a 13.2b 6.30a (16.8, 19.0) (25.3, 28.5) (14.9, 17.7) (0.18, 0.68) (0.18, 0.30) (0.4, 0.15) (6.24, 7.31) (9.26, 14.7) (5.12, 6.99) Ipomea aquatica 21.1ab 24.3a 17.2b 0.39ab 0.29b 0.52a 7.62ab 9.11a 5.20b (20.5,22.0) (23.7, 24.6) (16.9, 17.4) (0.33, 0.50) (0.23, 0.33) (0.37, 0.61) (7.21, 8.05) (8.84, 9.43) (5.07, 5.21) Ipomea batatas L. 28.8a 32.1a 26.9a 0.74a 0.78a 0.59a 14.0a 15.6a 11.8a (20.5, 35.5) (22.8, 35.4) (24.1, 28.4) (0.26, 1.23) (0.63, 1.07) (0.48, 0.74) (10.7, 17.5) (11.1, 20.3) (10.5, 14.1) Manihot esculenta 43.1as 34.0a 41.6a 0.25a 0.34a 0.29a 17.7a 13.5a 20.5a (40.0, 40.7) (27.5, 47.2) (40.1, 50.4) (0.18, 0.32) (0.13, 0.66) (0.22, 0.41)a (12.6, 23.4) (7.6, 24.3) (14.2, 23.8) Vigna unguiculata L. 35.3ab 39.3a 31.1b 0.62a 0.86a 0.67a 12.1a 12.0a 9.77a (23.6, 40.9) (36.1, 41.4) (30.4, 31.8) (0.41, 0.99) (0.54, 1.10) (0.48, 0.90)a (1.1, 14.3) (10.2, 15.8) (9.13, 12.5) Values are medians of four determinations (extraction /analysis) for lutein-zeaxanthin, α and β-carotene (n = 4). Values in parenthesis represent minimum and maximum values; values within a row not sharing a common superscript letter are significantly different at p < 0.05 (Friedman' 2 way ANOVA, multiple pairwise comparison). Open sun-dried Amaranthus viridis had the highest α-carotene content (1.90 mg/100 g DW) followed by Amaranthus graecizans (1.04 mg/100 g DW). On the other hand, direct solar-dried Vigna unguiculata L. (0.86 mg/100 g DW) and indirect solar dried Amaranthus graecizans (1.12 mg/100 g DW) had higher α-carotene contents compared to other vegetables. Direct solar drying retained higher levels of α-carotene concentration when compared to the other drying method for most vegetables. On the other hand, direct solar-dried Corchorus olitorius (27.36 mg/100 g DW), and indirect solar-dried Manihot esculenta (20.53 mg/100 g DW) had higher α-carotene content compared to other vegetables. Open sun dried, direct, and indirect solar-dried α-carotene concentrations of Ipomea batatas L., Vigna unguiculata L., Curcubita maxima and Manihot esculenta were not significantly different.
The β-carotene concentrations of Ipomea batatas L., Vigna unguiculata L., Curcubita maxima, and Manihot esculenta were not significantly different. Open sun-dried Amaranthus graecizans, Amaranthus viridis, Corchorus olitorius, and Gisekia pharnaceoides L. were not significantly different from indirect solar drying in their β-carotene concentrations. For some of the vegetables such as Corchorus olitorius, Gisekia pharnaceoides L., Ipomea aquatic, and Ipomea batatas L. showed to have more β-carotene when compared to the other drying methods.
Effect of drying methods on tocopherol contents of DGLVs
-
The α and γ-tocopherol contents of different DGLV species subjected to different drying methods are presented in Table 6. Ipomea batatas L., Vigna unguiculata L., Curcubita maxima, and Manihot esculenta showed no significant difference (p < 0.05) in their γ-tocopherol concentrations from the different drying methods. Open sun-dried Amaranthus spp., Amaranthus viridis and Corchorus olitorius were not significantly different (p < 0.05) from indirect drying in γ-tocopherol concentrations but different from direct-solar drying. Amaranthus graecizans showed to have the highest γ-tocopherol (6.96 mg/100 g DW) and α-tocopherol (40.83 mg/100 g DW) contents when indirectly solar-dried compared to the other drying methods. Open sun-dried Ipomea batatas L., and Curcubita maxima were significantly different (p < 0.05) from direct and indirect forms.
Table 6. α and γ- tocopherol contents (mg/100 g dry weight) of DGLVs by different drying methods.
Botanical names γ-tocopherol α-tocopherol Open sun Direct solar Indirect solar Open sun Direct solar Indirect solar Amaranthus graecizans 5.79ab 1.29b 6.96a 31.8a 2.34b 40.4a (5.43, 5.85) (1.24, 1.34) (6.81, 7.21) (30.3, 33.1) (2.28, 2.46) (39.3, 40.7) Amaranthus spp. 0.96a 0.26b 0.56ab 12.5a 6.24ab 4.76b (0.90, 1.01) (0.23, 0.31) (0.38, 0.58) (12.0, 13.3) (5.35, 6.92) (4.15, 5.01) Amaranthus viridis 1.43a 0.28b 1.07ab 25.9a 6.14b 19.8ab (1.35, 1.47) (0.25, 0.39) (0.94, 1.19) (25.1, 27.7) (5.41, 7.04) (17.2, 22.7) Corchorus olitorius 3.79a 2.40b 3.51ab 50.6a 22.2b 40.8ab (3.49, 4.01) (2.20, 2.59) (3.35, 3.64) (47.7, 52.9) (20.2, 24.3) (38.6, 43.2) Curcubita maxima 3.49a 3.73a 4.99a 14.6a 16.3a 18.5a (2.61, 4.25) (1.40, 6.56) (2.26, 7.65) (12.2, 16.4) (8.07, 24.9) (6.36, 31.1) Gisekia pharnaceoides L. 4.71a 4.07ab 3.88b 6.68b 28.2a 8.47ab (4.67, 4.80) (3.95, 4.51) (3.63, 4.12) (6.15, 7.18) (27.4, 32.1) (7.55, 9.32) Ipomea aquatica 1.15a 0.53b 0.64ab 15.8a 1.55b 3.96ab (1.10, 1.25) (0.52, 0.58) (0.63, 0.66) (14.5, 18.4) (1.42, 1.61) (3.88, 4.09) Ipomea batatas L. 1.25a 0.90a 0.74a 24.1a 6.73b 6.49b (1.02, 1.53) (0.36, 1.35) (0.52, 1.07) (16.0, 33.8) (1.46, 12.5) (4.81, 9.16) Manihot esculenta 2.57a 2.78a 2.35a 25.9a 34.5a 32.0a (1.69, 3.45) (0.93, 4.91) (1.62, 3.08) (22.2, 29.2) (18.0, 59.6) (22.5, 37.5) Vigna unguiculata L. 1.67a 5.03a 1.24a 10.8a 19.9a 12.0a (1.21, 2.74) (0.72, 10.3) (1.16, 6.41) (10.4, 14.4) (7.51, 34.9) (8.60, 15.6) Values are medians of four determinations (extraction/analysis) for α and γ-tocopherol; values in parenthesis represent minimum and maximum values; values within a row not sharing a common superscript letter are significantly different (p-value < 0.05). The α-tocopherol concentration among DGLV varieties differs among drying methods. The concentration of α-tocopherol in Vigna unguiculata L., Curcubita maxima and Manihot esculenta was not significantly different (p < 0.05) among the drying methods. However, there was also no significant difference in α-tocopherol concentration between direct and indirect solar drying methods for Amaranthus spp, Amaranthus viridis, Corchorus olitorius, Ipomea aquatic, and Ipomea batatas. The concentrations of α-tocopherol in direct and indirect solar dried Ipomea batatas L. were higher (> 6 mg/100 g DW) and were significantly different (p < 0.05) from its open sun-dried form.
-
The concentrations of lutein-zeaxanthin, α and β-carotene were highest in Manihot esculenta, Amaranthus graciezans and Cleome gynandra. The α-carotene (0.38 mg/100 g FW) and β-carotene (4.66 g/100 g FW) concentrations of Amaranthus spp from this study were higher for α- and lower for β-carotene with those reported by Gowele et al.,[20] (α-carotene: 0.32 mg/100 g FW and β-carotene: 4.82 g/100 g FW) from a study conducted in Tanzania. A study in Tanzania as reported by Gowele et al.[20] showed Vigna unguiculata L. to have lower levels of β-carotene of 2.96 mg/100 g FW indicating a lower concentration as compared to this study. Gowele et al.[20] reported for Amaranthus spinosus, Amaranthus spp., Cleome gynandra, and Vigna unguiculata α-carotene contents ranging from 0.05–0.32 mg/100 g FW in comparison to our findings where; Amaranthus spinosus (0.96 mg/ 100 FWg), Amaranthus spp (0.38 mg/100 g FW), Cleome gynandra (0.12 mg/100 g FW) and Vigna unguiculata (0.13 mg/100 g FW), overall had higher levels of α-carotene contents. Results in this study show that Vigna unguiculata L., Ipomea batatas L., Amaranthus spp., Amaranthus graecizans and Cleome gynandra could be good sources of carotenoids as consumption of 100 g FW of these vegetables can provide more than 60% of the RNI for retinol equivalents (RE) for females and males. These results are consistent with those reported by Gowele et al.[20]. Except for this study, data on lutein-zeaxanthin contents in leafy vegetables are currently not available from Tanzania. A study conducted in South Africa of different Ipomea batatas L. species showed lutein-zeaxanthin contents ranging from 0.05 to 0.72 mg/100 g dry weight (DW)[27], in comparison to ours which had 48.87 mg/100g DW meaning a higher content. Neugart et al.[28] reported β-carotene concentration in some species was high for amaranth (up to 10.17 mg/100 g DW) and Cleome gynandra (up to 6.47 mg/100 g DW). The current study showed higher concentrations of β-carotene in Cleome gynandra (up to 31.74 mg/100 g DW) and Amaranthus graciezans (up to 6.47 mg/100g DW). These differences may be due to soil and agricultural practices or the type of analysis done using HPLC as the current study.
Nevertheless, the current study cannot be compared directly to previously reported concentrations, due to limited data on freshly frozen and later gently freeze-dried samples (on freeze-dried varieties). Moreover, the applied method using HPLC to analyze carotenoids in the present study differs, with the exception of Gowele et al.[20], from previous publications on DGLV, which frequently analyzed DGLV by photometric methods only, thus showing the tendency of higher carotenoid contents. The highest levels of α-tocopherol were detected in Manihot esculenta (38.40 mg/100 g FW), Corchorus olitorius (14.88 mg/100 g FW) and Curcubita maxima (12.33 mg/100 g FW). The highest level of α-tocopherol equivalents (α-TE) was detected in Manihot esculenta. A 100 g portion of fresh Amaranthus spp, Corchorus olitorius, Ipomea batatas L., and Manihot esculenta could provide more than 100% of the RNI for vitamin E for males and females aged 19–65 years (Table 2). To date, limited data are available on the tocopherol contents of Amaranthus spp, Corchorus olitorius, Ipomea batatas L. and Manihot esculenta. A previous study showed Vigna unguiculata L. to contain 0.02 mg/100g of α-TE contributing to 20% of RNI of female adults aged 19–50 years[20]. The α-TE of Vigna unguiculata L. in the present study showed concentrations of 1.63 mg/100 g FW, which could contribute to 22% of RNI of female adults aged 19–65 years. Findings from this study suggest that Amaranthus spp, Corchorus olitorius, Ipomea batatas L., and Manihot esculenta could contribute to improving dietary TE intake.
Mineral and phytate contents
-
The calcium contents of Amaranthus viridis (469 mg/100 g FW) and Corchorus olitorius (235 mg/100 g FW) were similar to those reported in Nigeria[29]. Gowele et al.[20] reported higher concentrations in Amaranthus spinosus (289.1 mg/100 g FW), Cleome gynandra (206.1 mg/100 g FW), Amamranthus spp (853.7 mg/100 g FW); Vigna unguiculata L. (274.2 mg/100 g FW). Low concentrations of iron (6.62 mg/100 g DW), calcium (3.73 mg/100 g DW), zinc (5.03 mg/100 g DW) and magnesium (6.63 mg/100 g DW) in fresh cowpea leaves were reported by Bighaghire et al.[13] using AAS analyzing techniques. The higher contents of the same minerals of cowpea leaves in the present study in mg/100 g when converted to dry weight basis (Fe: 11.05; Zn: 2.71; Ca: 948.92 and Mg: 267.8) may be due to the use of analyzing ICP-OES technique. The phytate levels in all DGLVs analyzed are low compared to a previous study conducted in Tanzania[29].
Gowele et al.[20] reported very high phyate levels of 739 mg/100 g FW (Amaranthus spp) and 334 mg/100 g FW (Amaranthus spinosus) compared to our results of 4.69 mg/100 g FW and 5.14 mg/100 g FW for Amaranthus spp and 334 mg/100 g FW Amaranthus spinosus, respectively. The calculated phytate:iron molar ratios for all DGLVs were below the suggested critical level (> 1) indicating good bioavailability of iron. The same was for all DGLVs for the phytate: zinc molar ratios being below the suggested critical level of 15, above which bioavailability of zinc is decreased[30].
The phytate:calcium molar ratios in all DGLVs samples ranged between 0.01–0.06, which is below the critical level of 0.24 where calcium bioavailability is reduced[30−32]. This indicates that the phytate levels of the analyzed DGLVs will not have a significant reducing effect on calcium bioavailability in humans and thus DGLVs can be an important and excellent source of minerals in the human diet. Gowele et al.[20] reported similar phytate:calcium molar ratios in leafy vegetables from Tanzania. Total phytate values in the present study (all in the form of IP6) using the HPLC technique were lower compared to previously reported phytate content in DGLVs by Gowele et al.[20] using an indirect measurement via reaction with Wade reagent (0.06% FeCl3∙6H2O + 0.6% sulfosalicylic acid) and following photometric detection only. Previous studies reported that traditional food preparation and cooking methods such as heating and fermentation can reduce the levels of phytate in vegetables[17,33,34]. Fermentation and traditional cooking methods can increase the contribution of DGLVs as important sources of Fe, Zn, Ca, and Mg[21,35,26]. The HPLC techniques in the present study thus gave lower phyate values as compared to previous studies which overestimate the phytate content due to unspecific photometric methods. The low phytate thus makes the DGLVs as good sources of iron, zinc, calcium, and magnesium.
Impact of drying methods on carotenoid and tocopherol contents of DGLVs
-
The impacts of solar drying on the micronutrient quality of DGLVs among African countries are generally very low[36]. The observed differences among different drying methods are likely going to affect the drying duration and product quality. The internal air temperatures of the direct and indirect solar dryers (Fig. 1) of this study are comparable to those reported in Africa and India[37]. An investigation carried out in Tanzania revealed that when cowpea pea leaves were exposed to open sunlight, their β-carotene content was 87.56 mg/100 g DW[38] which is greater than the results of the current study (12.1 mg/100 g DW). Consistent with our results, in Kenya, it was found that preserved and fresh cowpea leaves were rich in β-carotene with ranges of 0.25–36.55 mg/100 g DW[39]. Data on open sun-dried Ipomea batatas L., Vigna unguiculata L., Curcubita maxima and Manihot esculenta were significantly different from direct and indirect drying methods. This may be due to different temperatures and drying times including the nature of DGLVs species. β-carotene was shown to be less destructed when using lower drying temperature as reported by Bishnoi et al.[40] in fenugreek leaves. It was shown that the boiling and sun-drying method significantly reduced provitamin A content in Vigna unguiculata samples, with a 50% reduction observed[13]. The present study showed the β-carotene of open sun-dried Curcubita maxima to have 12.48 mg/100 g DW while its direct solar dried form had 7.3 mg/100 g DW and α-carotene of 0.92 mg/100 g DW (open sun-dried) and 0.76 mg/100 g DW (direct solar-dried). 100 g/DW Curcubita maxima could provide more than 100% of RE for vitamin A for both females and males. A study on Vigna unguiculata L. showed open unblanched cowpea leaves the β-carotene was reduced by 50% when blanched and sun dried[41]. A study conducted by Nambafu et al.[42], showed that Curcubita maxima and Vigna unguiculata L. subjected to direct solar drying showed significantly lower β-carotene contents ranging from 54–65 mg/100 g DW as compared to fresh blanched forms. Lee et al.[43] reported that high-temperature cooking of carrots can alter their physical condition, with blanching allowing cellular lipids to solubilize carotenoids. Dripping during cooking may cause variations in beta-carotene retention in cooked vegetables. A study indicated a loss of β-carotene in Cleome gynandra and Vigna unguiculata when blanched then sundried[44]. β-carotene also being sensitive to light its concentration may be affected[45]. Although carotenoids are heat-sensitive, UV light may be less important than temperature. According to a study by Sonntag et al.[46], temperature had an impact on the amount of carotenoids in amaranth leaves; they started to decrease at 20 °C but then dramatically increased 10–14 d after UV treatment. Unlike in the case of carotenoids, γ-tocopherol contents in the vegetables dried using different methods did not show a clear pattern or trend in γ-tocopherol reduction in dried samples. Limited data on γ- and α-tocopherol in DGLVs have been reported in Tanzania. Open sun-dried (4.71 mg/100 g DW) Gisekea pharnaceoides L. was the only DGLVs that showed to have a significant difference (p < 0.05) in γ-tocopherol concentration from indirect drying (3.88 mg/100 g DW) compared to other DGLVs. A study showed low contents of α-tocopherol observed in Amaranthus spp (0.67 mg/100 g DW) and Vigna unguiculata L. (0.02 mg/100 g DW)[29]. Direct solar-dried pumpkin, amaranth, and cowpea leaves were shown to have α-tocopherol contents ranging from 51–65 mg/100 g DW in Kenya[42]. The α-tocopherol concentration of Curcubita maxima, Manihot esculenta, and Vigna unguiculata among the three drying methods did not differ significantly (p < 0.05). The high α and γ-tocopherol contents in blanched open sun and indirect solar dried vegetables could be due to heat treatment (blanching and ambient/solar temperatures). This may soften plant tissue, releasing vitamin E from lipids, and eliminating tocopherol oxidase activity, which is present in all parts of the plant[43]. Heat treatment could deactivate endogenous oxidative enzymes in vegetables making vitamin E more pronounced in results after extraction[47]. There were also no significant differences in α and β-carotene and α and γ-tocopherol concentration in Curcubita maxima, Ipomea batatas L., Manihot esculenta, and Vigna unguiculata among the different drying methods. This could be due to the similarity of plant matrices, color, and the water content of these DGLVs. Since matrices are part of food structures, they are also subject to some major changes during processing, particularly in their physical state (e.g., due to phase and state transitions), chemical condition (e.g. due to thermal reactions and solubilization). Sun drying and solar drying is applied as a processing method to prolong the shelf life of vegetables in villages but in turn also adds value to diets from a nutrition perspective. The drying process involves, mass and momentum transfer which may associate with changes in the physical, chemical, biochemical, microbiological, organoleptic, and nutritional properties of foods and severe heating may have deleterious effects in terms of nutrient loss[41,45,48,49]. Differences in drying techniques and models of dryers used as well as freeze-drying handling of samples and environmental factors might be responsible for different carotenoids and tocopherols concentrations. Findings from this study suggests that open sun drying and solar drying techniques are good means of drying vegetables for food security despite their effect on the concentration of different carotenoids and tocopherols. More research may be done on the role of solar drying temperatures, UV, and matrices of Amaranthus graciezans, Manihot esculenta, Corchorus olitorius, and Curcubita maxima play in providing tocopherols for human diets.
-
Provitamin A carotenoids, lutein-zeaxanthin, tocopherols, and minerals can be found in the DGLVs in Lindi, Tanzania. The phytate concentrations were very low; which means DGLV are excellent sources of minerals, as the concentrations are much lower than those in previous reports in the literature. However, if all the analyzed DGLVs would be consumed in combination with local diets at all times during the year adequate micronutrient supply of carotenoids, tocopherols, and minerals could be achieved especially for Amanrathus and Manihot esculenta. Preserving DGLVs using affordable drying methods such as direct sun-drying can be used as a strategy for achieving all year around availability of micronutrient-dense foods despite reduction of some nutritional properties of individual varieties. The study has demonstrated that improved solar drying methods such as using direct solar dryers can lead to nutrient retention and provide a cheap but also more time-efficient way of drying vegetables in the village setting. The remarkable content of iron and carotenoids found in the DGLVs can play an important role in meeting daily recommended micronutrient requirements of the farmers in the study area and therefore have the potential to improve food and nutrition security. Promoting consumption of the DGLVs in Lindi supports the Tanzania Nutrition Policy whose goals are to eliminate malnutrition, to improve nutrition status particularly women and children and to ensure food security.
-
The authors confirm contribution to the paper as follows: study conception and design, data collection, HPLC analysis, statistical analysis, draft manuscript preparation: Tiisekwa AB; freezing dried the DGLVs samples, HPLC analysis, chromatograms cleanup and statistical analysis: Stuetz W; reviewing and refining the manuscript: Chove BE, Mongi R, Rybak C, Stuetz W. All authors reviewed the results and approved the final version of the manuscript.
-
All data generated or analyzed during this study are included in this published article, and are available from the corresponding author on reasonable request.
The authors acknowledge the financial support from the Vegi-Leg project. The project is supported by funds from the Federal Ministry of Food and Agriculture (BMEL) based on a decision of the Parliament of the Federal Republic of Germany via the Federal Office for Agriculture and Food (BLE; 2816PROC9 and 2816PROC10). The funders had no role in the study design, data collection, analysis, or the decision to publish. Great thanks to district officials and village leaders in both Ruangwa and Nachingwea districts in Lindi, Tanzania for their support and willingness to participate in the study and for providing the requested information.
-
The authors declare that they have no conflict of interest.
- Copyright: © 2024 by the author(s). Published by Maximum Academic Press, Fayetteville, GA. This article is an open access article distributed under Creative Commons Attribution License (CC BY 4.0), visit https://creativecommons.org/licenses/by/4.0/.
-
About this article
Cite this article
Tiisekwa AB, Chove BE, Mongi R, Rybak C, Stuetz W. 2024. Carotenoids, tocopherols, minerals and phytate in fresh and carotenoids and tocopherol contents in sun-dried dark green leafy vegetable varieties from the Lindi region, Tanzania. Technology in Horticulture 4: e014 doi: 10.48130/tihort-0024-0011 

Carotenoids, tocopherols, minerals and phytate in fresh and carotenoids and tocopherol contents in sun-dried dark green leafy vegetable varieties from the Lindi region, Tanzania
- Received: 05 January 2024
- Revised: 01 May 2024
- Accepted: 16 May 2024
- Published online: 03 June 2024
Abstract: The present study explores the nutritional value of different dark green leafy vegetable (DGLV) varieties from Tanzania. Carotenoids, tocopherols, minerals, and phytates were analyzed in unprocessed and differently sun-dried DGLV. HPLC analyses revealed highest concentrations of lutein-zeaxanthin (20.3 mg/100 g estimated fresh weight (FW) in Manihot esculenta), β-carotene (6.89 mg/100 g FW in Cleome gynandra) and α-tocopherol (12.5 mg/100 g FW in Manihot esculenta); thus 100 g of a DGLV could provide up to 116% of the recommended daily intake (RDI) for vitamin A and 168% of the RDI for vitamin E. High concentrations (per 100 g calculated FW) of iron (up to 11.1 mg in Cleome gynandra), calcium (up to 469 mg in Amaranthus viridis) and magnesium (up to 371 mg in Amaranthus graecizans) were found; thus 100 g could contribute up to 80%, 47% and 169% of the RDI for iron, calcium, and magnesium, respectively. HPLC analyses revealed pleasantly low phytate (1.66−13.1 mg/100g FW); this resulted in low phytate-to-mineral molar ratios not exceeding the critical values of bioavailability. The differently sun-dried DGLV had similarly high concentrations of carotenoids and tocopherols compared to the unprocessed fresh DGLV (mg/ 100 g dry weight), with essentially no marked differences between simple open sun-dried and direct and indirect solar drying techniques. In conclusion, results indicate that both, fresh and sundried DGLV could make a substantial contribution to micronutrient supply, e.g. pro-vitamin A and iron in the diets of the Tanzanian population.
-
Key words:
- Carotenoids /
- Tocopherols /
- Minerals /
- Phytate /
- Dark green leafy vegetables