


-
Gastric cancer is a prevalent malignancy and a leading cause of cancer-related mortality in China[1]. Current treatment approaches, including surgery, chemotherapy, targeted therapy, and immunotherapy, are often combined to enhance patient outcomes. Neoadjuvant chemotherapy, administered before surgery, aims to shrink tumors and increase resection success[2], while adjuvant chemotherapy after surgery targets residual cancer cells to reduce recurrence risk. Advances in targeted therapies and immunotherapies, particularly for advanced stages, represent significant progress in gastric cancer management.
Cell metabolism is essential for the initiation and progression of gastric cancer. Gastric cancer cells undergo metabolic reprogramming, predominantly adopting glycolysis to enhance survival and metastasis — a phenomenon known as the Warburg effect. This common metabolic phenotype in cancer is strongly linked to drug resistance[3,4]. The Warburg effect involves increased glucose uptake and lactate production, leading to elevated levels of metabolites such as fumaric acid and alpha-ketoglutaric acid in cancer tissues[5]. Similarly, higher concentrations of 3-hydroxypropionic acid and pyruvic acid are detected in the blood of gastric cancer patients[6]. These metabolic alterations support cancer cell growth and confer resistance to chemotherapy[7]. Key proto-oncogenes, such as Myc, drive this glycolytic shift by upregulating enzymes like glucose transporter 1 (GLUT1), lactate dehydrogenase A (LDHA), and pyruvate kinase M2 (PKM2)[8−11]. Additionally, the inactivation of the tumor suppressor gene p53 further promotes glycolysis[11]. Unlike normal cells, which primarily rely on oxidative phosphorylation (OXPHOS) for energy, cancer cells favor glycolysis to generate intermediates that support rapid proliferation[12]. Beyond glycolysis, lipid metabolism is crucial for cancer cell growth and metastasis. Enhanced lipid synthesis and uptake facilitate membrane biosynthesis and energy storage[13,14]. Amino acid metabolism also plays a pivotal role, particularly in one-carbon metabolism, which is essential for DNA and RNA synthesis and promoting cell proliferation. Moreover, gastric cancer cells experience heightened oxidative stress, resulting in DNA damage and mutations that drive cancer progression[15]. Accumulated reactive oxygen species (ROS) further exacerbate metabolic dysregulation, creating a feedback loop that fuels malignancy. Understanding these metabolic adaptations highlights potential therapeutic targets, underscoring the importance of metabolic pathways in gastric cancer biology.
Trastuzumab, a recombinant humanized monoclonal antibody, specifically targets the human epidermal growth factor receptor 2 (HER2) and is the only approved first-line targeted therapy for HER2-positive advanced gastric cancer[16,17]. Combination of trastuzumab with platinum-fluoropyrimidine chemotherapy has been shown to significantly improve survival in patients with HER2-positive gastric cancer[16]. However, the overall response rate remains below 50%, indicating that many HER2-positive cases have developed resistance to HER2 inhibition[18]. Identifying patient subgroups likely to benefit from trastuzumab and optimizing HER2-targeted treatment regimens are therefore critical. While trastuzumab is highly effective against HER2-positive tumors, particularly in breast cancer, resistance mechanisms in gastric cancer are less well-characterized compared to breast cancer. Addressing this gap is essential to improve therapeutic outcomes in HER2-positive gastric cancer patients.
Emerging evidence highlights the significant role of glycolysis in influencing trastuzumab efficacy in gastric cancer. Activation of 6-phosphofructo-2-kinase (PFKFB3) within the glycolytic pathway induces trastuzumab resistance and promotes vascular instability in HER2-positive gastric cancer. In contrast, PFKFB3 inhibition reduces tumor growth and normalizes vasculature[19]. Similarly, GATA6 knockout re-sensitizes gastric cancer cells to trastuzumab by regulating metabolic pathways such as the TCA cycle and glycolysis[20]. Various glycolysis inhibitors, including MTCI, PDK, LDHA, and hexokinase inhibitors, have been explored to counteract resistance to cancer therapies[21−23]. These agents disrupt cancer metabolism, enhancing therapeutic efficacy. Notably, 2-deoxy-D-glucose (2-DG)[24], and Oxamate[25] have shown promise in clinical trials. 2-DG, when combined with docetaxel, exhibits efficacy with manageable side effects, while Oxamate selectively targets cancer cells, sparing normal tissues. Combining glycolysis inhibitors with anti-tumor therapies offers a potential strategy to overcome drug resistance and improve treatment outcomes. Future research should prioritize optimizing these inhibitors for clinical application.
Through a combination of in vivo and in vitro experiments alongside bioinformatics analyses, we identified a significant upregulation of the glycolytic enzyme ENO1 in trastuzumab-resistant gastric cancer cell lines. Elevated ENO1 expression levels were shown to suppress ACO1 expression, thereby inhibiting cellular ferroptosis. These findings highlight the potential of targeting ENO1 or modulating ACO1 expression to overcome trastuzumab resistance, offering new avenues for novel personalized treatment strategies in gastric cancer.
-
Trastuzumab-sensitive (NCI-N87, MKN45) and trastuzumab-resistant (NCI-N87R, MKN45R) gastric cancer cell lines (Genelily Biotech Co., LTD, China) were cultured in DMEM medium supplemented with 10% fetal bovine serum (FBS) (Gibco, USA) and 1% antibiotics (100 U/mL penicillin G and 100 μg/mL streptomycin). The cells were maintained at 37 °C in an atmosphere containing 5% CO2.
In vivo mouse models
-
The Balb/c Nude mice were housed under specific pathogen-free conditions following the guidelines of Changzhou Cavens Laboratory Animal Co., Ltd (Changzhou, China). Animals aged 6 to 8 weeks, with age- and gender-matched controls, were used for all in vivo experiments. Detailed sample sizes for each study are provided in the figure legends.
The dorsal skin of Balb/c Nu mice was sterilized with alcohol. A total of 1 × 10⁷ tumor cells were injected subcutaneously, and housed under standard conditions. Trastuzumab was administered intraperitoneally at a dose of 30 mg/kg every 5 d. Tumor size was measured at 5-d intervals up to day 30. After the final measurement, the tumors were photographed, excised, and fixed in formalin. Tumor volume was calculated using the formula V = a × b2/2, where a is the length and b is the width of the tumor.
Generation of modified gastric cancer cell lines
-
All shRNA (pLVX-shRNA) and overexpression (pLVX-IRES-puro-RNA) vectors were synthesized by Genelily Biotech Co., LTD (Shanghai, China). These vectors were subsequently packaged into lentiviruses for the establishment of stably transfected cell lines. Cells were seeded in 6-well plates at a density of 5 × 10⁵ cells per well, followed by the addition of distinct lentiviruses (pLVX-IRES-puro and pLVX-IRES-puro-ENO1) at a multiplicity of infection (MOI) of 50. The medium was replaced 24 h post-infection. After 48 h, the medium was completely switched to one containing 2 μg/mL puromycin. The medium was refreshed every 2 d. Once stable cell growth was observed, cells were passaged. After two passages, puromycin was no longer required in the culture medium, indicating the successful establishment of the cell lines. A portion of the cells was preserved for future use, while another portion was utilized for RNA and protein extraction to validate ENO1 expression via Real-time PCR and Western blotting, respectively.
Cell counting Kit-8 assay
-
In a 96-well plate, 100 μL of a cell suspension at a density of 2 × 10⁴ cells/mL was dispensed into each well and incubated at 37 °C with 5% CO2 for 24 h. Following the pre-incubation period, the cells were treated with varying concentrations of trastuzumab (0.1, 0.3, 1, 3, 10, 30, 100, 300, and 1,000 μg/mL) and further incubated for an additional 24 h. At predetermined time points (0, 12, 24, 48, and 72 h), the plate was removed, and 10 μL of CCK-8 solution was added to each well, ensuring the avoidance of bubble formation to prevent interference with OD values. The plate was incubated for 1 h, and absorbance was measured at 450 nm using a microplate reader to assess cell viability. The data were analyzed, and the IC50 curve was generated using Prism 9 software.
Colony formation assay
-
Cells in the logarithmic growth phase were treated with 0.25% trypsin to dissociate them into single cells, which were subsequently suspended in DMEM medium supplemented with 10% FBS. The cell suspension was serially diluted, and 100 cells per dish were seeded into 10 mL of pre-warmed culture medium at 37 °C. The dishes were gently rotated to ensure even cell distribution and incubated at 37 °C in a cell culture incubator with 5% CO2 and saturated humidity for 2 to 3 weeks. Regular observations were made, and upon the appearance of visible colonies, the culture was terminated. The supernatant was removed, and the cells were washed twice with PBS. The cells were then fixed with 5 mL of 4% paraformaldehyde for 15 min, after which the fixative was discarded. The cells were stained with crystal violet solution for 10 to 30 min, followed by gentle washing with running water, and the dishes were air-dried. Finally, the colony plates were scanned for imaging, and the number of colonies was quantified using ImageJ software.
RNA pull-down assay
-
Firstly, the cell protein was extracted from a sample containing 1 × 10⁷ cells and set aside. Next, 50 μL of resuspended streptavidin magnetic beads were added to each 1.5 mL EP tube, and the beads were washed twice with 500 μL of Wash Buffer to remove impurities. The beads were then resuspended in 500 μL of Wash Buffer. Subsequently, 2 μg of biotin-labeled IRP1 mRNA was introduced and incubated at 4 °C for 6−8 h to facilitate binding. Following the binding process, 100 μL of pre-lysed cell lysate and 5 μL of RNase inhibitor were added to prevent RNA degradation, followed by overnight incubation at 4 °C. Ten μL of the lysate was taken as an input sample and stored at −20 °C for subsequent analysis. The beads-RNA-protein complex was centrifuged at low speed and washed six times with 500 μL of Wash Buffer II to remove unbound proteins, ensuring complete removal of the supernatant after each wash. Finally, 40 μL of Wash Buffer and 10 μL of 5 × SDS loading buffer were added to the beads and heated at 95 °C for 10 min to release the proteins. The resulting samples were then subjected to SDS-PAGE gel electrophoresis and Western blotting to detect the ENO1 protein in the IRP1 mRNA-enriched fraction, thereby analyzing the binding efficiency of IRP1 mRNA to ENO1 protein.
Extracellular acidification rate assay
-
A total of 175 μL of the original growth medium was aspirated from each well, followed by two rinses with 600 μL of hippocampal testing medium. Subsequently, 450 to 525 μL of hippocampal testing medium was added to each well. Microscopic examination confirmed that the cell monolayer in each well remained continuous and undamaged. The culture plate was then incubated in a non-CO2 incubator for 1 h. Post-incubation, cells were treated with specified drug concentrations according to the manufacturer's operating procedures. Following drug treatment, the culture plate was transferred to the Seahorse XF Analyzer, where baseline ECAR values were recorded. Sequential injections of glucose, oligomycin, and 2-DG were performed, with ECAR changes recorded at each step to assess cellular glycolytic capacity. All ECAR data were collected for statistical analysis, and comparisons of ECAR values across different treatment groups were conducted to evaluate the drugs' impact on cellular glycolytic metabolism.
Single-cell RNA-seq data analysis
-
scRNA-seq data for gastric cancer were obtained from the GEO database (GSE183904)[26] and processed using the standard workflow provided by the Seurat package. Initially, Seurat objects were created for each dataset, and the percentages of mitochondrial and ribosomal RNA were calculated and added to the metadata. These datasets were then merged into a single Seurat object and normalized using the LogNormalize method. Variable features were identified using DUBStepR, and cell cycle scoring was performed based on these features to mitigate cell cycle effects. Data standardization and Principal Component Analysis (PCA) were conducted for preliminary dimensionality reduction. Batch effects were corrected with the Harmony algorithm. The resulting principal components were utilized for clustering analysis, and Uniform Manifold Approximation and Projection (UMAP) visualizations were generated. Clusters were annotated based on marker gene expression, and multiple plots were produced to provide a comprehensive visualization of the data.
RNA-seq data analysis
-
RNA-seq data for trastuzumab-sensitive and -resistant gastric cancer cells were sourced from GEO database (GSE77346)[27], and gene sets associated with trastuzumab resistance were identified. The AddModuleScore function was applied to the scRNA-seq data to compute scores, categorizing epithelial cells into resistance high and resistance low groups based on the median score. Differential expression genes (DEGs) between these groups were calculated using the FindMarkers function. Metabolic pathway scores were calculated using gene sets from the hallmark database. All visualizations were generated using functions from the Seurat package.
Cell-cell communication analysis
-
After data preprocessing, we used the CellPhoneDB tool to analyze receptor-ligand interactions between different cell populations. CellPhoneDB leveraged a comprehensive receptor-ligand interaction database and integrated single-cell transcriptomic data to identify potential intercellular communication networks by calculating interaction scores between cell types. The workflow involved inputting the processed single-cell expression matrix into CellPhoneDB, defining the cell types, and running the analysis to generate receptor-ligand interaction scores and their statistical significance across cell populations.
Following the initial analysis, further filtering of the interaction data was conducted, focusing on the interactions between epithelial cells and various components of the tumor microenvironment. The selection criteria included the significance of receptor-ligand pairs, their expression levels, and their potential biological functions. Finally, the filtered receptor-ligand interaction network was visualized using the ktplots package for clearer interpretation and presentation.
Statistical analysis
-
All bioinformatics analyses were conducted using R-4.2.3, RStudio, and GraphPad Prism 9. No new algorithms were generated during these bioinformatics analyses. All figures were created using Adobe Illustrator 2023 for scientific visualization. scRNA-seq data were analyzed using the Seurat package. For specific details on statistical tests, please refer to the legends associated with the figures.
-
To explore the association between HER2 expression and key metabolic pathways, we applied the GSVA method to calculate scores for seven metabolic pathways from the Hallmark database. Correlation analysis revealed a strong positive relationship between ERBB2 expression and both the cholesterol homeostasis and glycolysis pathways (Fig. 1a). This finding prompted further investigation into the link between ERBB2 expression and glycolysis. Using data from both the TCGA and GEO (GEO: GSE220917) databases, Pearson correlation analysis confirmed a significant association between ERBB2 expression and glycolysis in both datasets (Fig. 1b & c).
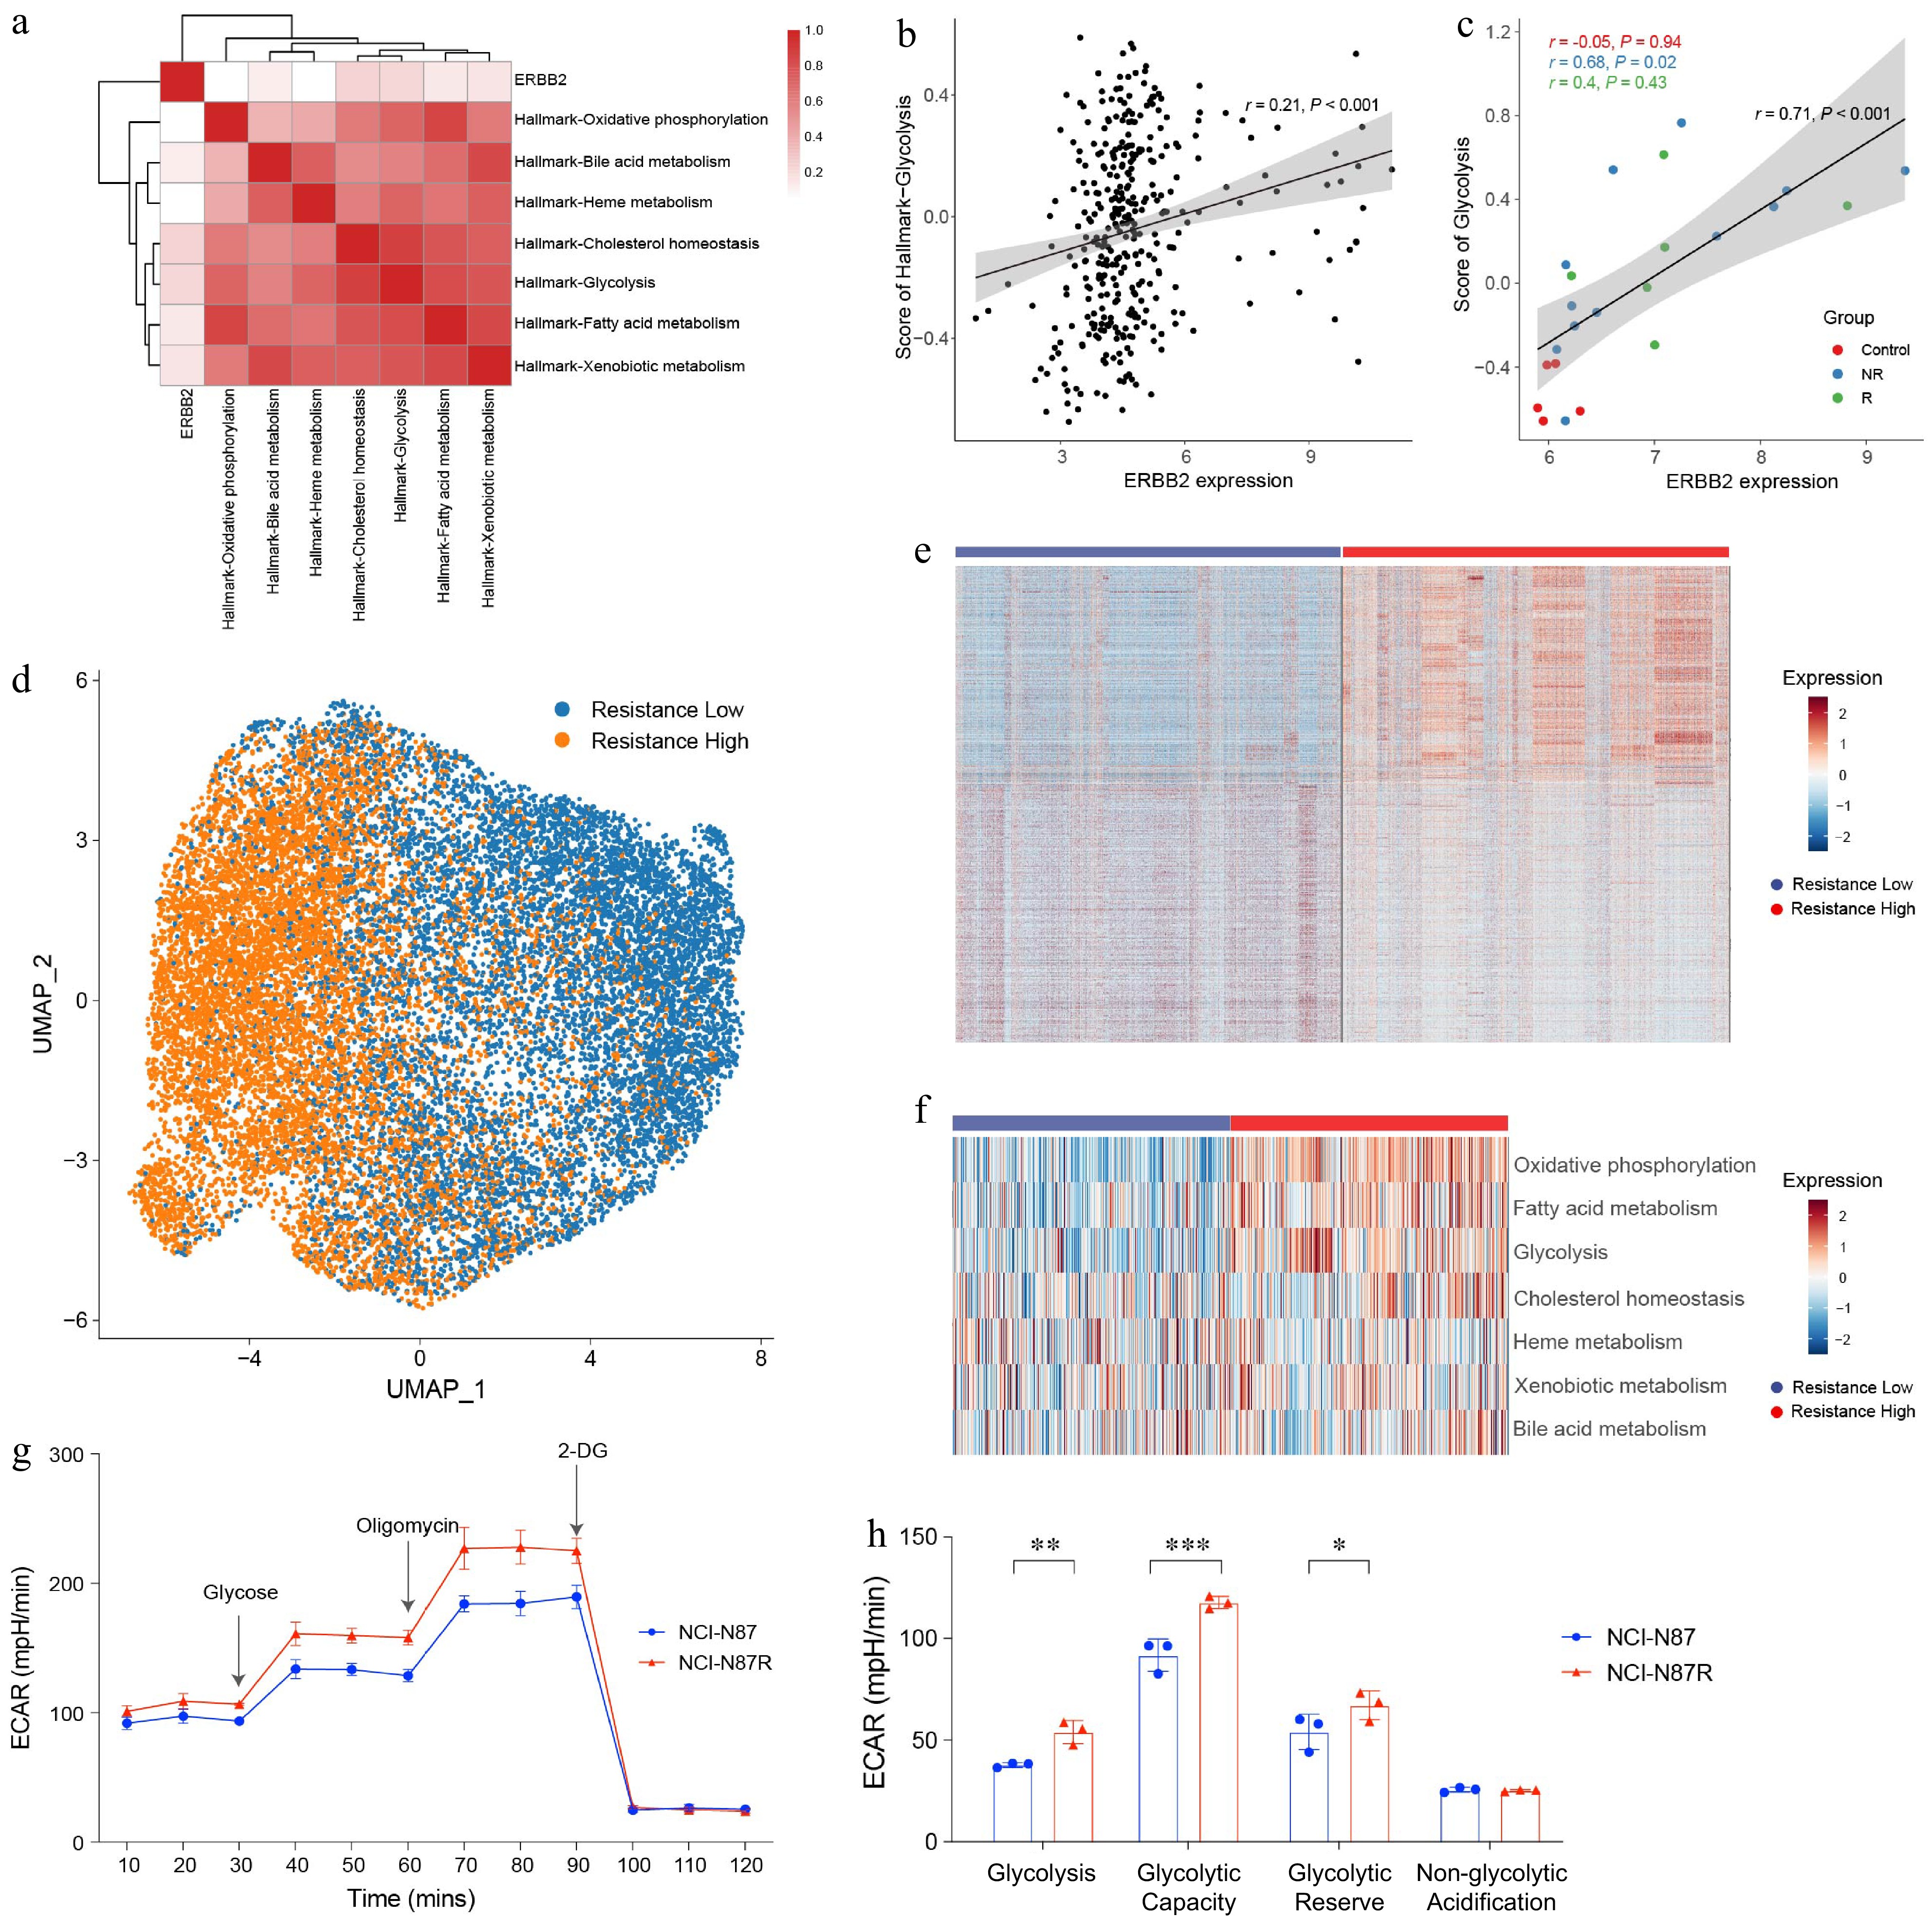
Figure 1.
Elevated glycolysis in trastuzumab-resistant gastric cancer cells. (a) Heat map showing the correlation between ERBB2 expression and metabolic pathways in TCGA-STAD. (b) Dot plot showing the correlation between ERBB2 expression and glycolysis in the TCGA-STAD. (c) Dot plot showing the correlation between ERBB2 expression and glycolysis in the GEO database. (d) UMAP visualized the clustering of gastric cancer cells based on the trastuzumab-resistant score. (e) Heat map showing the DEGs between 'resistance low' and 'resistance high' groups. (f) Scores of metabolism-related pathways between 'resistance low' and 'resistance high' groups. (g) ECAR assay results of trastuzumab-resistant gastric cancer cell line NCI-N87R and trastuzumab-sensitive gastric cancer cell line NCI-N87. The experiment was performed with three biological replicates (N = 3). (h) Box plots displaying the basal glycolysis level (glycolysis), glycolytic capacity (glycolytic capacity), glycolytic reserve (glycolytic reserve), and non-glycolytic acidification (non-glycolytic acidification) of two gastric cancer cell lines according to (g). Pearson correlation analysis was used to calculate the correlation in (a)−(c). The 'resistance low' and 'resistance high' groups are defined by the median value of the trastuzumab-resistant score. Statistical analyses in (h) were performed using an unpaired, two-tailed Student's t-test. * p < 0.05, ** p < 0.01, *** p < 0.001.
To investigate the mechanisms underlying trastuzumab resistance in gastric cancer, we utilized previously published gene sets associated with trastuzumab resistance[27]. By scoring the trastuzumab resistance-related gene set in scRNA-seq data[26] (GEO: GSE183904) of gastric cancer epithelial cells, the cells were classified into two groups: low resistance and high resistance (Fig. 1d). Differential expression genes analysis revealed marked differences in gene expression profiles between these two groups (Fig. 1e).
Given the critical role of metabolic pathways in influencing trastuzumab treatment outcomes, we evaluated the activity of metabolism-related pathways using Hallmark gene sets. The analysis showed significant enrichment of oxidative phosphorylation, fatty acid metabolism, and glycolysis pathways in the resistant high group (Fig. 1f). These results suggest that metabolic reprogramming may contribute substantially to trastuzumab resistance.
Since glycolysis has been implicated in immune suppression across various cancers, we further assessed glycolysis activity in trastuzumab-sensitive and trastuzumab-resistant gastric cancer cell lines. Extracellular acidification rate (ECAR) assays revealed significantly reduction glycolysis activity in the trastuzumab-resistant gastric cancer cell line NCI-N87R (Fig. 1g & h). These findings indicate that glycolysis inhibition may contribute to trastuzumab resistance and highlight the glycolysis pathway as a promising target for overcoming therapeutic resistance.
ENO1 was upregulated in trastuzumab-resistant gastric cancer cells
-
To further investigate the role of glycolysis in trastuzumab resistance, we conducted a comparative analysis of glycolysis-related genes between the resistant-low and resistant-high groups. This analysis revealed significant upregulation of several key glycolytic genes, including ENO1, PGK1, PGAM1, TPI1, PKM, and ALDOA, in the resistant-high group (Fig. 2a). Among these, ENO1 demonstrated consistent upregulation in four gastric cancer cell lines (GEO: GSE77346), aligning with the scRNA-seq findings (Fig. 2b).
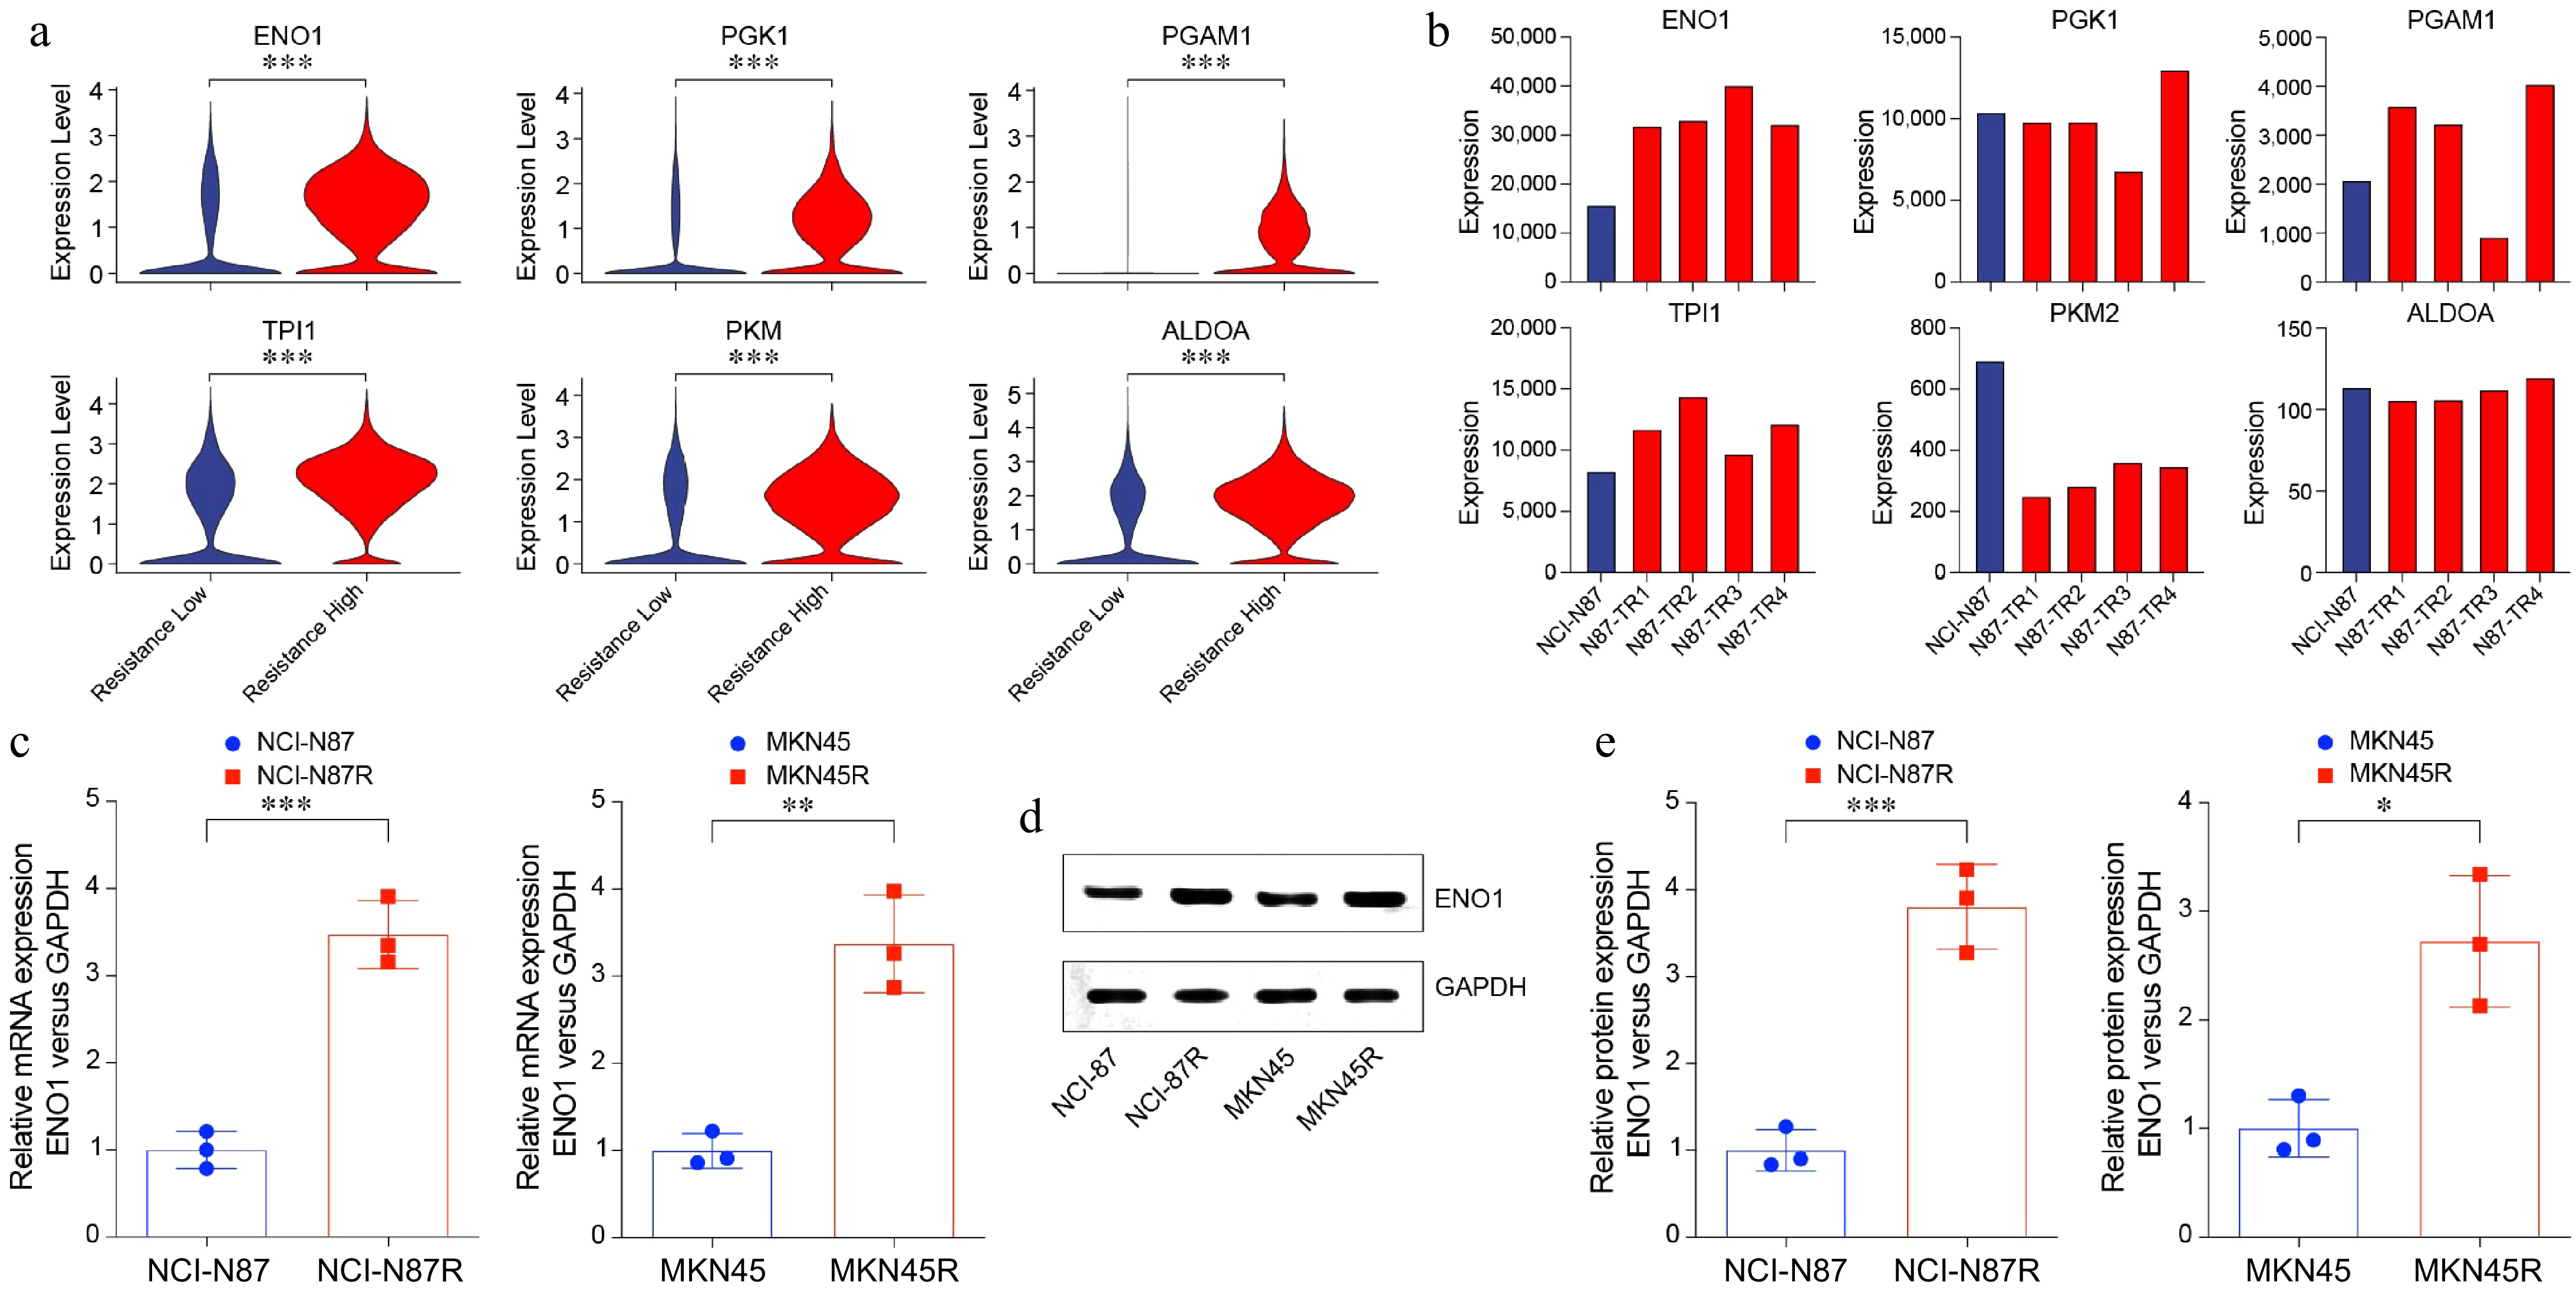
Figure 2.
Increased ENO1 expression in trastuzumab-resistant gastric cancer cells. (a) Violin plots showing upregulated glycolysis-related genes in Fig. 1a. (b) Bar plots displaying upregulated glycolysis-related genes in gastric cancer cell lines. (c) RT-PCR analysis of ENO1 expression in trastuzumab-resistant and trastuzumab-sensitive gastric cancer cell lines. The experiment was performed with three biological replicates (N = 3). (d) and (e) Western blot analysis of ENO1 protein levels in trastuzumab-resistant and trastuzumab-sensitive gastric cancer cell lines. The experiment was performed with three biological replicates (N = 3). Statistical analyses in (a), (c), and (e) were performed using an unpaired, two-tailed Student's t-test. * p < 0.05, ** p < 0.01, *** p < 0.001.
ENO1 encodes a pivotal enzyme in glycolysis that catalyzes the conversion of 2-phosphoglycerate to phosphoenolpyruvate, a critical step in the glycolytic pathway. As glycolysis is a major metabolic process that supports cancer cells' energy demands and proliferation, the elevated expression of ENO1 suggests its role as a metabolic adaptation mechanism promoting trastuzumab resistance. To validate the involvement of ENO1 in glycolysis and trastuzumab resistance, we performed RT-PCR (Fig. 2c), and Western blotting (Fig. 2d & e) analyses on trastuzumab-sensitive (NCI-N87 and MKN45) and resistant (NCI-N87R and MKN45R) gastric cancer cell lines. The results demonstrated significant upregulation of ENO1 at both mRNA and protein levels in resistant cell lines compared to their sensitive counterparts (Fig. 2c−e).
In summary, our findings underscore the upregulation of ENO1 and other glycolysis-related genes in trastuzumab-resistant gastric cancer cell lines. These results suggest that ENO1 plays a central role in glycolysis-mediated mechanisms contributing to trastuzumab resistance, highlighting it as a potential target for therapeutic intervention.
ENO1 was associated with cell survival, colony formation, and tumor growth in gastric cancer
-
To further investigate the functional role of ENO1 in gastric cancer, we established ENO1 overexpression models in the trastuzumab-sensitive cell lines NCI-N87 and MKN45, and ENO1 knockdown models in the trastuzumab-resistant cell lines NCI-N87R and MKN45R (Fig. 3a−c). ENO1 knockdown significantly reduced glycolysis activity, as demonstrated by decreased lactate production and extracellular acidification rate (Fig. 3d & e). Conversely, overexpression of ENO1 in trastuzumab-sensitive cells significantly enhanced their resistance to trastuzumab treatment, while knockdown of ENO1 in resistant cells notably reduced their resistance (Fig. 3f). Colony formation assays demonstrated that elevated ENO1 expression significantly increased the clonogenic capacity of gastric cancer cells (Fig. 3g & h). Specifically, ENO1 overexpression resulted in a substantial rise in both colony number and size, indicating a pronounced enhancement in tumorigenic potential.
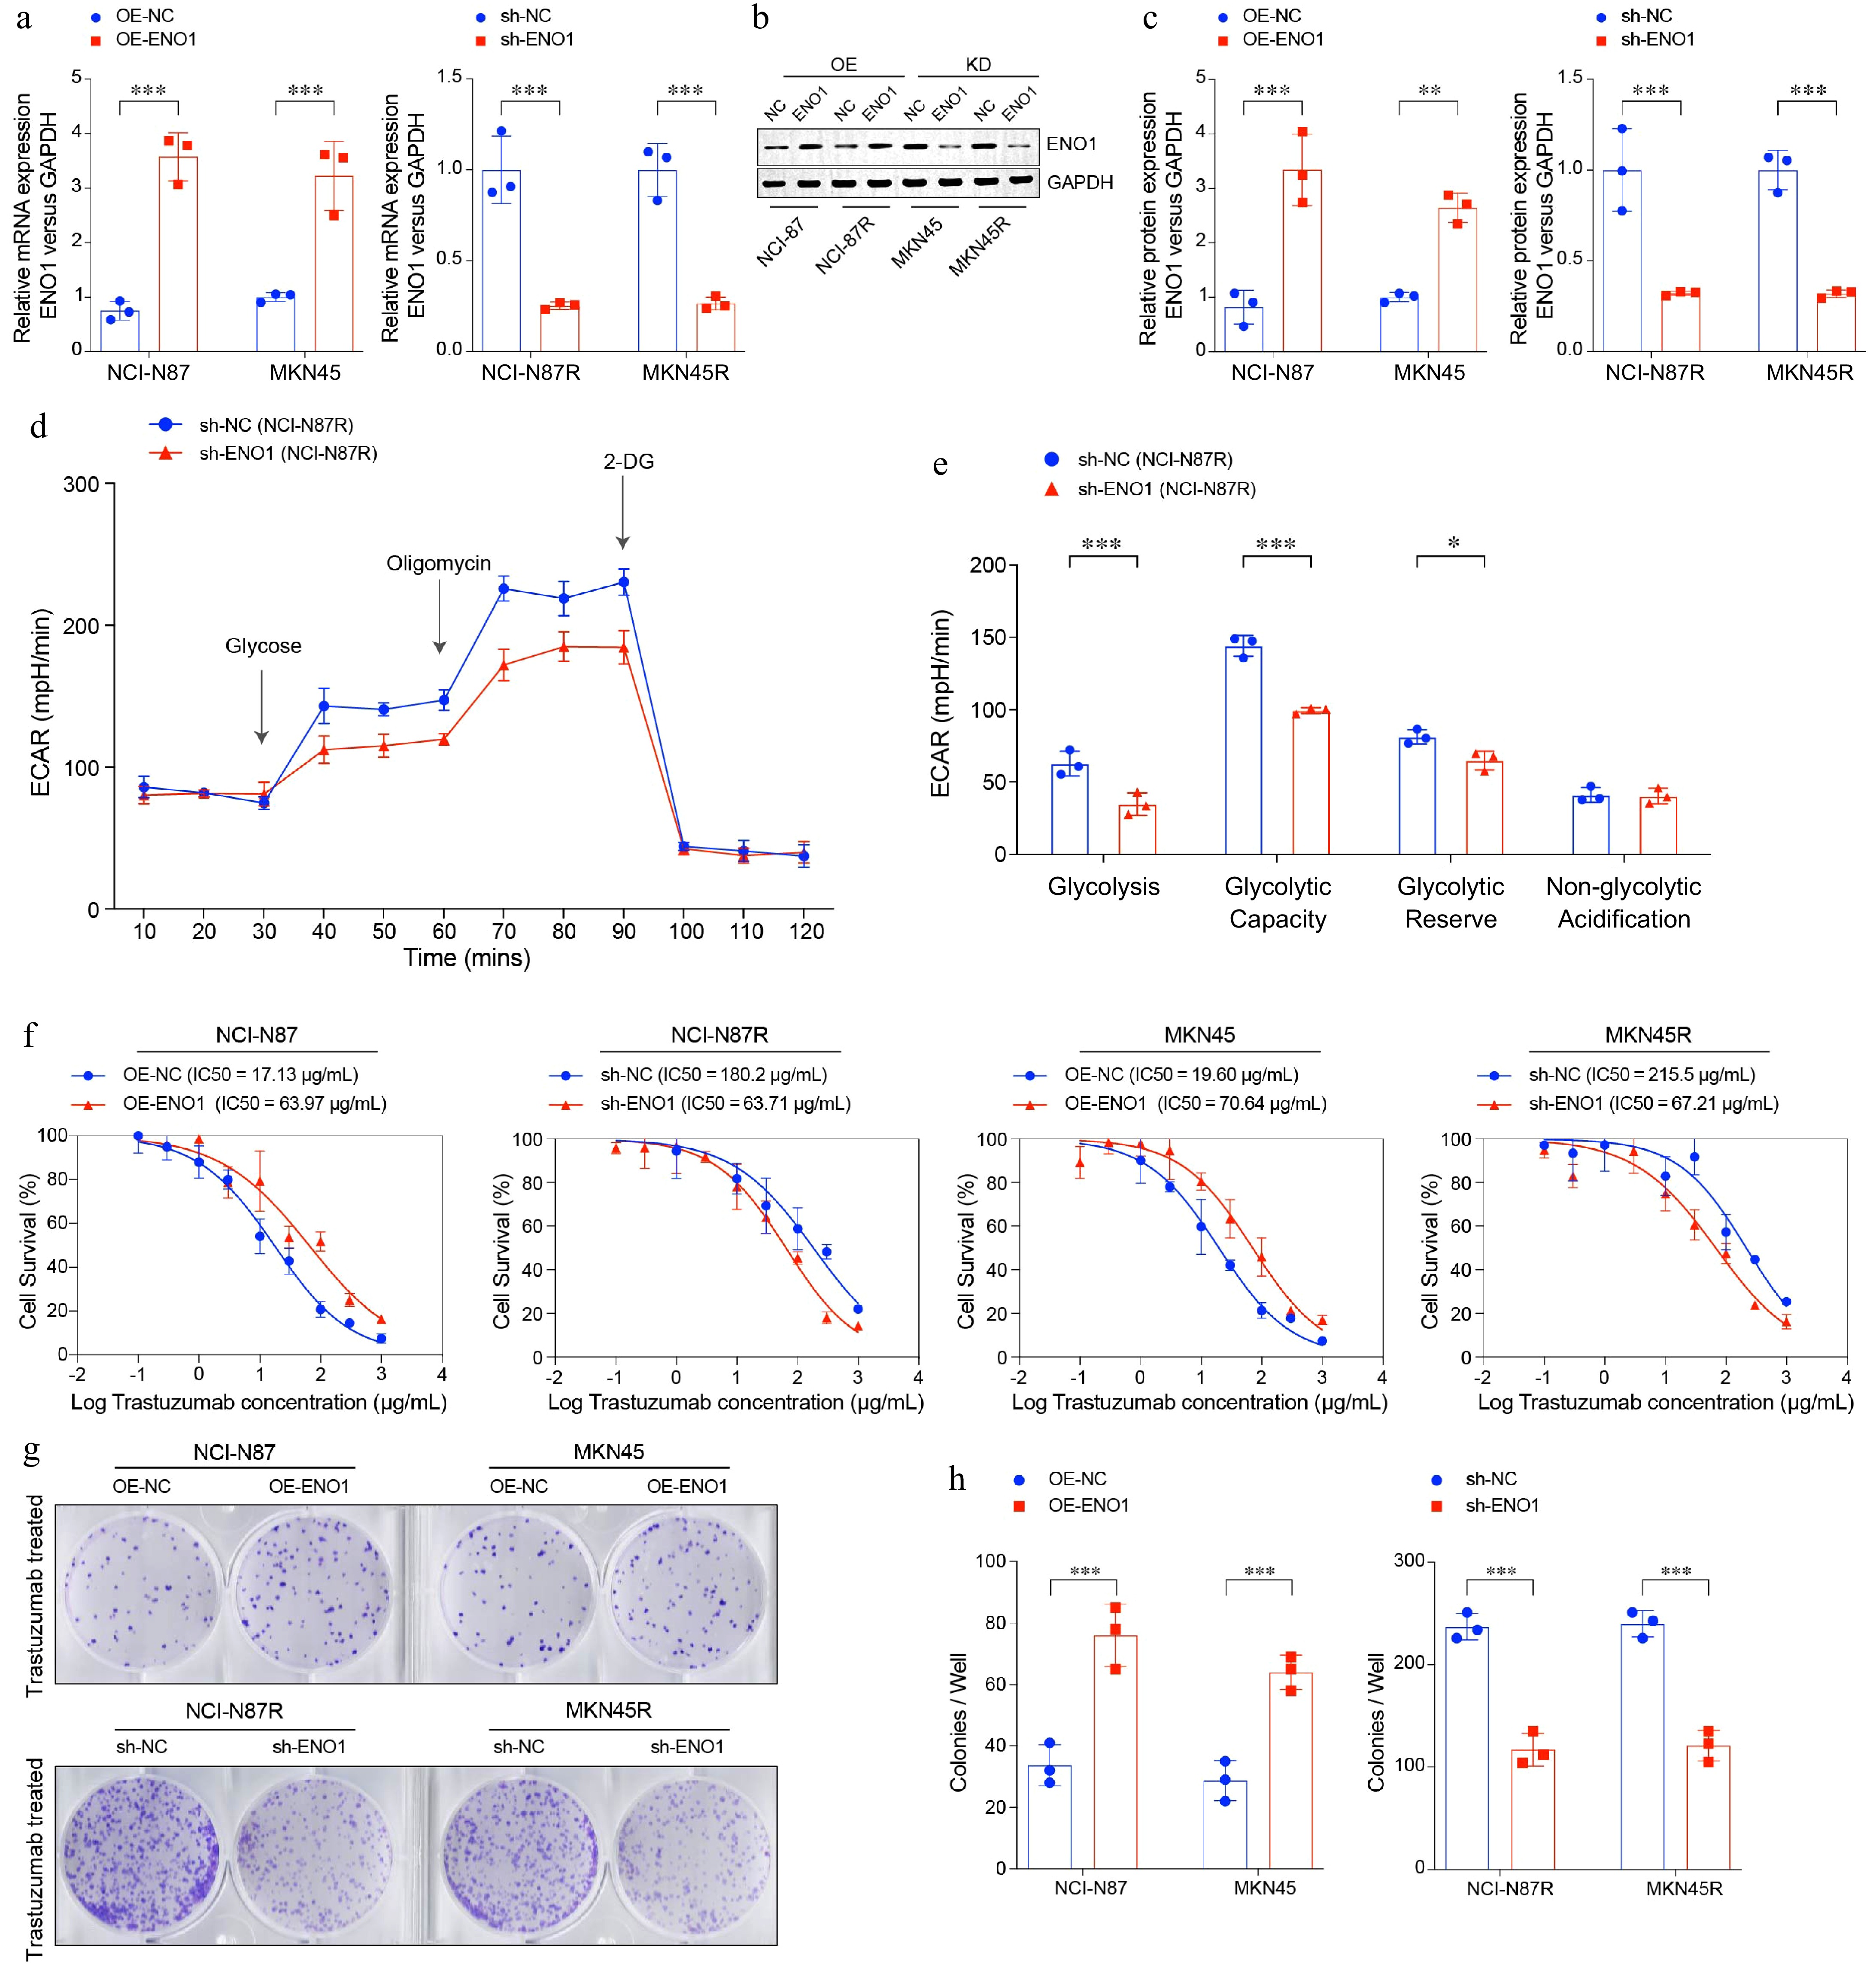
Figure 3.
ENO1 linked to enhanced cell survival and colony formation in gastric cancer cells. (a) RT-PCR analysis of ENO1 expression in modified gastric cancer cell lines. (b) and (c) Western blot analysis of ENO1 protein levels in modified gastric cancer cell lines. (c) ECAR assay results of ENO1-knockdown gastric cancer cell lines. (d) Box plots displaying the basal glycolysis level (glycolysis), glycolytic capacity (glycolytic capacity), glycolytic reserve (glycolytic reserve) and non-glycolytic acidification (non-glycolytic acidification) of two gastric cancer cell lines according to (c). (f) Curves of cell viability assay for modified gastric cancer cell lines. (g) and (h) Colony formation assay results for modified gastric cancer cell lines. The experiment was performed with three biological replicates (N = 3). Statistical analyses in (a), (c), (e), and (h) were performed using an unpaired, two-tailed Student's t-test. * p < 0.05, ** p < 0.01, *** p < 0.001.
To explore the impact of ENO1 expression on tumor growth in gastric cancer, we constructed an in vivo mouse xenograft model. ENO1 knockdown was performed in the trastuzumab-resistant NCI-N87R cell line, and the modified cells were injected into mice to establish stable tumor models. Mice were subsequently treated with trastuzumab to evaluate its efficacy under conditions of reduced ENO1 expression (Fig. 4a & b). The results revealed that ENO1 knockdown significantly suppressed tumor growth in mice bearing trastuzumab-resistant gastric cancer cells (Fig. 4c−e). These findings indicate that elevated ENO1 expression is linked to accelerated tumor progression while reducing ENO1 expression can mitigate tumor growth, suggesting its potential as a therapeutic target in gastric cancer treatment.
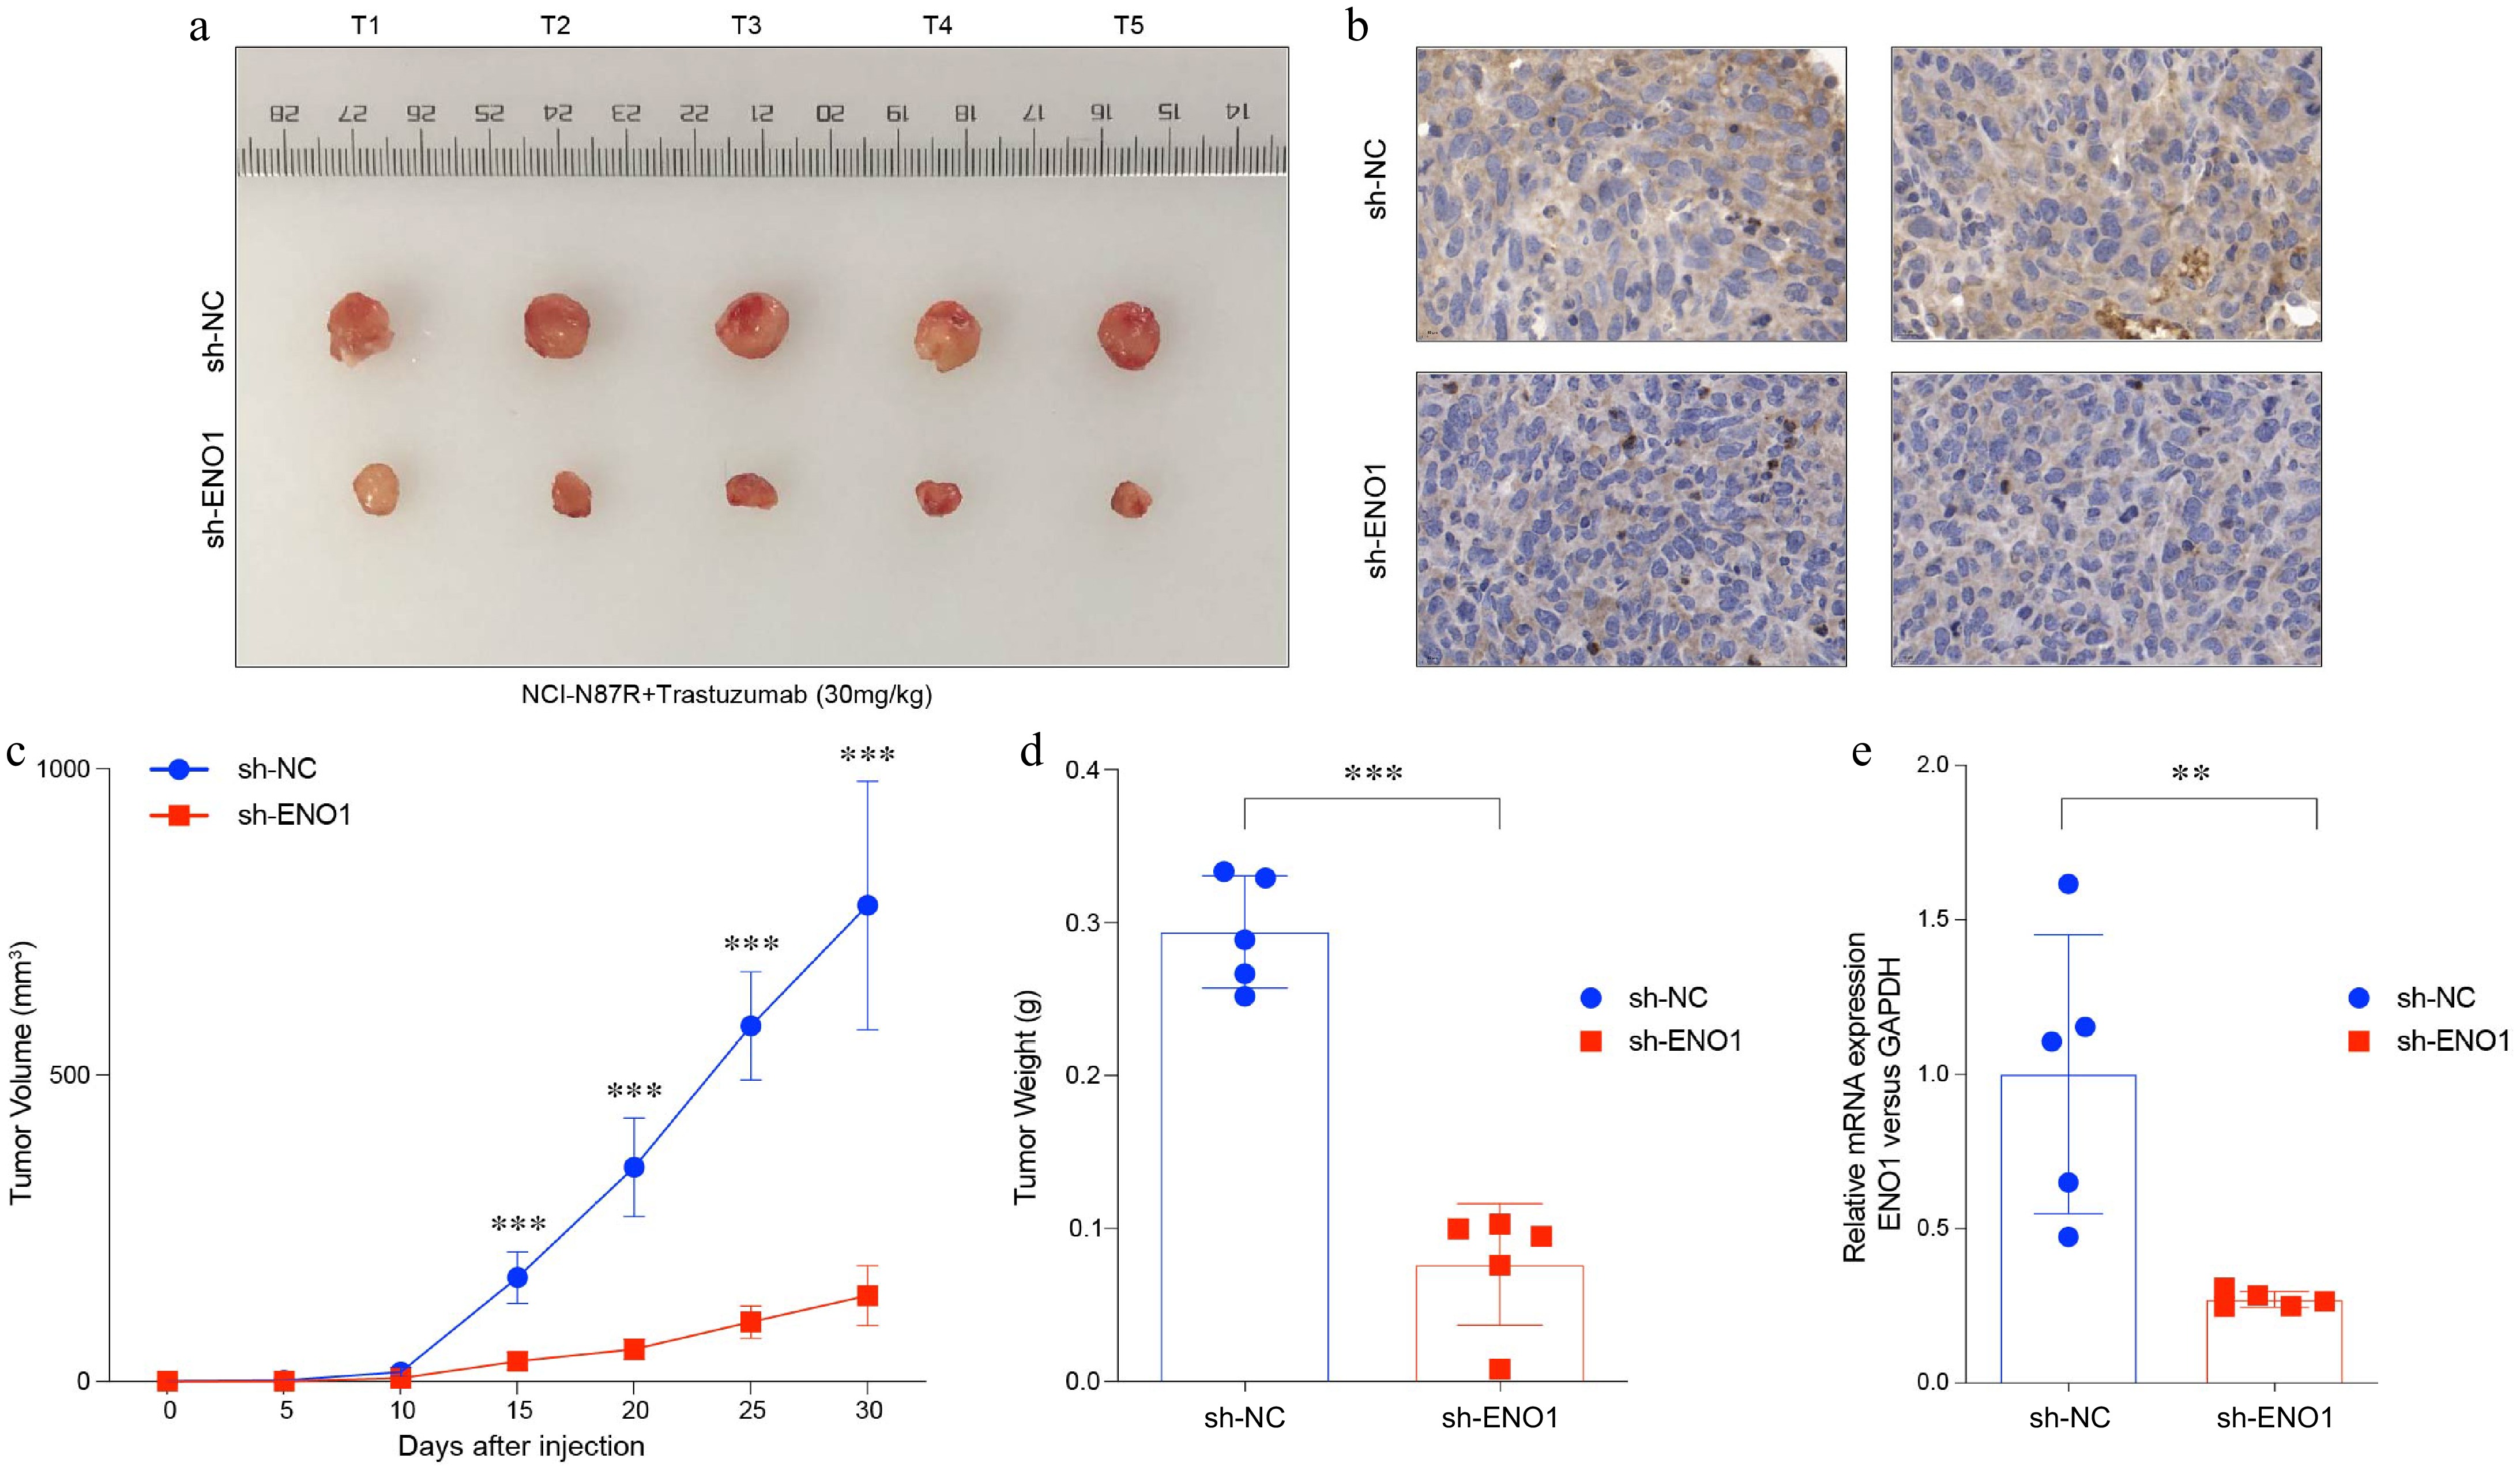
Figure 4.
ENO1 was associated with tumor growth in gastric cancer. (a) Balb/c Nu mice were injected subcutaneously with 1 × 10⁷ tumor cells and housed under standard conditions. Trastuzumab (30 mg/kg) was administered intraperitoneally every 5 d. Tumor size was measured every 5 d until day 30, after which the tumors were photographed, excised, and fixed in formalin. Tumor volume diagram with five biological replicates (N = 5). (b) Representative IHC staining results from (a). (c) Tumor growth curves corresponding to (a). (d) Box plots illustrated tumor weight in (a). (e) Levels of ENO1 protein based on IHC results in (b). Statistical analyses in (c)−(e) were performed using an unpaired, two-tailed Student's t-test. ** p < 0.01, *** p < 0.001.
Collectively, our results underscore the pivotal role of ENO1 in driving trastuzumab resistance and promoting tumor clonogenicity in gastric cancer cells. Targeting ENO1 offers a promising therapeutic strategy to overcome resistance and inhibit tumor progression, paving the way for improved treatments for gastric cancer.
Overexpressed ENO1 inhibited the expression of TCA-related gene IRP1
-
Previous studies have shown that ENO1 suppresses the expression of the TCA cycle-related gene IRP1[28]. IRP1 functions as a cytoplasmic isomer of aconitase, an iron-sulfur protein requiring a 4Fe-4S cluster for its enzymatic activity, which catalyzes the conversion of citrate to isocitrate[29]. To investigate this relationship, we analyzed IRP1 mRNA and protein levels in NCI-N87 and MKN45 gastric cancer cell lines using RT-PCR and Western blotting. The results demonstrated that elevated ENO1 expression significantly downregulates IRP1 mRNA and protein levels (Fig. 5a−c). Additionally, RNA pull-down assays revealed that ENO1 can bind to IRP1 mRNA, thereby regulating its expression (Fig. 5d). These findings underscore ENO1's critical role in metabolic reprogramming by suppressing IRP1, thereby influencing TCA cycle activity and cellular metabolism.
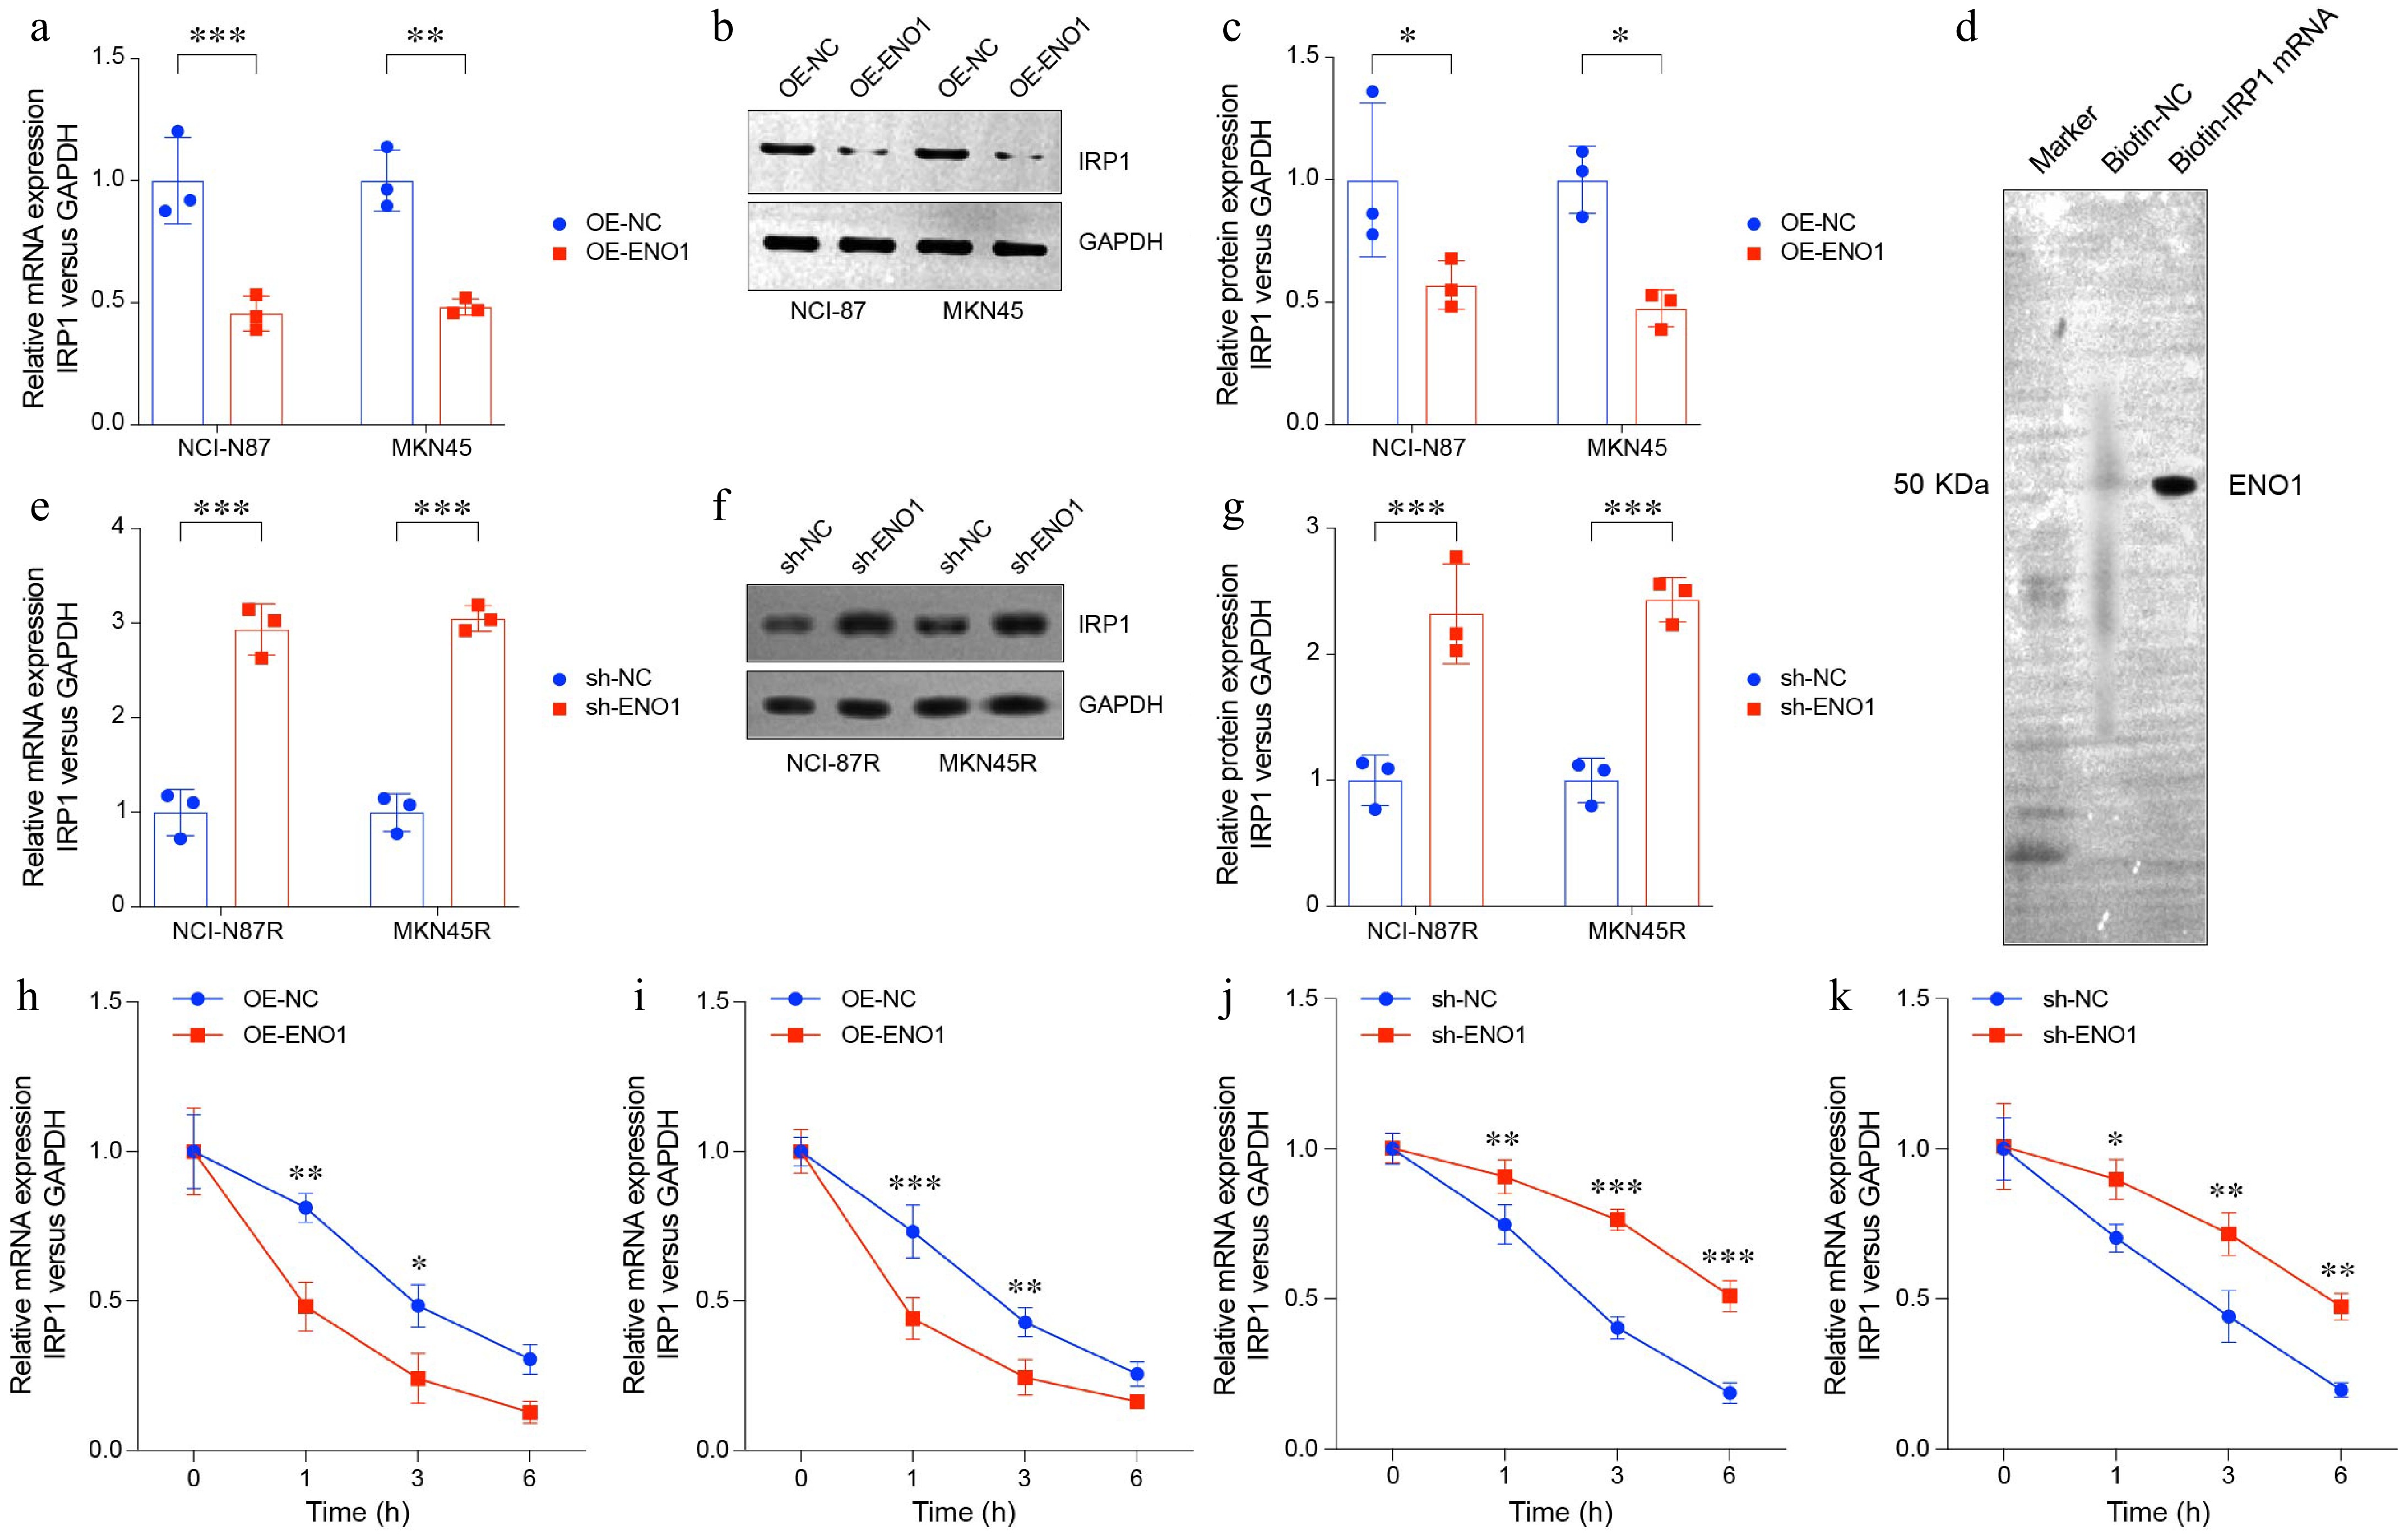
Figure 5.
ENO1 overexpression suppressed TCA-related gene IRP1 expression. (a) RT-PCR analysis of IRP1 expression in ENO1-overexpressed gastric cancer cell lines. (b) and (c) Western blot analysis of IRP1 protein levels in ENO1-overexpressed gastric cancer cell lines. (d) RNA pull-down assay of trastuzumab-resistant gastric cancer cell line NCI-N87R. (e) RT-PCR analysis of IRP1 expression in ENO1-knockdown gastric cancer cell lines. (f) and (g) Western blot analysis of IRP1 protein levels in ENO1-knockdown gastric cancer cell lines. The experiment was performed with three biological replicates (N = 3). (h)−(k) The curves represent IRP1 expression at various time points (0, 1, 3, 6 h). (h) OE-ENO1 NCI-N87R. (i) OE-ENO1 MKN45R. (j) sh-ENO1 NCI-N87R. (k) sh-ENO1 MKN45R. All statistical analyses were performed using an unpaired, two-tailed Student's t-test. * p < 0.05, ** p < 0.01, *** p < 0.001.
To further validate these mechanisms in trastuzumab-resistant gastric cancer, we examined IRP1 expression in NCI-N87R and MKN45R cell lines. Knocking down ENO1 expression markedly increased IRP1 mRNA and protein levels (Fig. 5e−g). Additionally, RNA stability assays revealed that high ENO1 expression decreases IRP1 mRNA stability, whereas ENO1 knockdown enhances its stability (Fig. 5h−k).
These results suggest that ENO1 modulates IRP1 expression and mRNA stability through multiple mechanisms, leading to potential disruptions in the TCA cycle. This regulatory axis highlights ENO1's pivotal role in the metabolic reprogramming of gastric cancer cells and provides insights into its contribution to tumor progression and therapeutic resistance.
Elevated IRP1 impaired cell survival, colony formation, and tumor growth in gastric cancer
-
To further investigate the role of IRP1 in gastric cancer, we conducted both in vitro and in vivo experiments. Using the trastuzumab-resistant NCI-N87R cell line, we established IRP1 knockdown models (Fig. 6a & b). In vitro analysis demonstrated that IRP1 downregulation significantly increased trastuzumab resistance. Colony formation assays further revealed that reduced IRP1 expression enhanced the clonogenic potential of gastric cancer cells, as evidenced by a notable increase in colony number and size (Fig. 6c & d), indicating greater tumorigenic capacity.
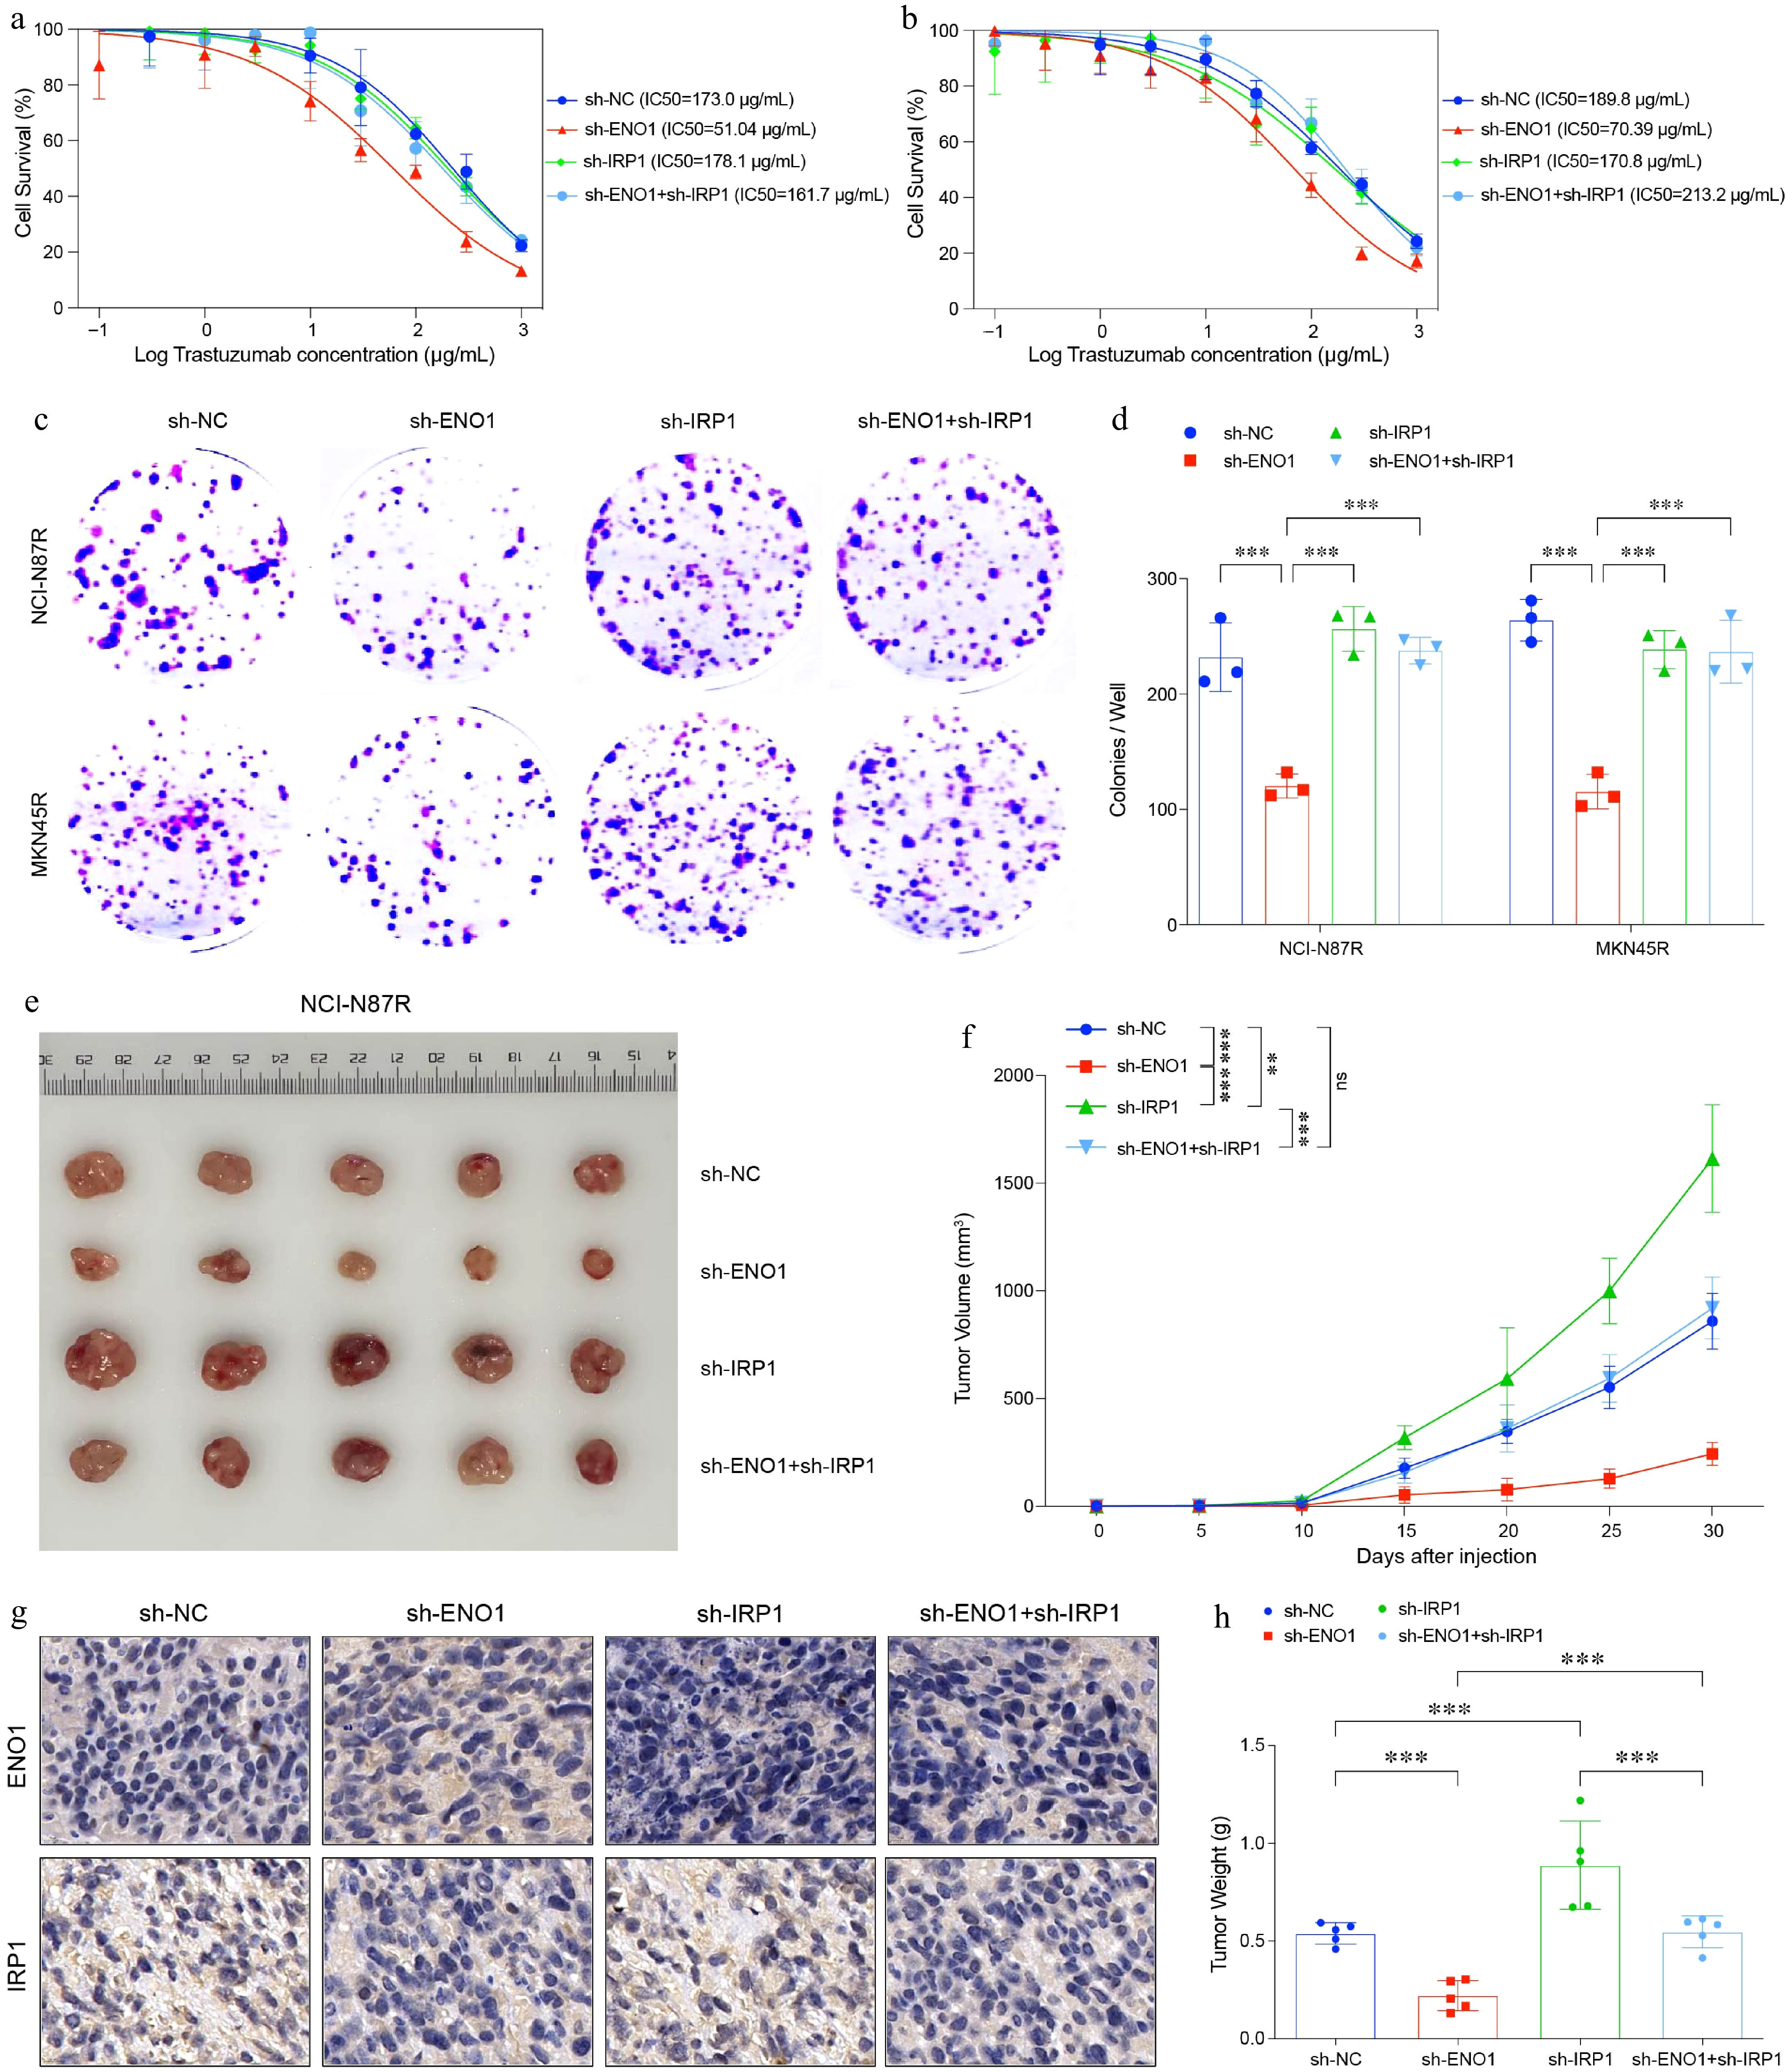
Figure 6.
IRP1 impaired cell survival, colony formation and tumor growth in gastric cancer. (a) and (b) Curves of cell viability assay for modified gastric cancer cell lines. (a) NCI-N87R. (b) MKN45R. (c) and (d) Colony formation assay results for modified gastric cancer cell lines. The experiment was performed with three biological replicates (N = 3). (e) Balb/c Nu mice were injected subcutaneously with 1 × 10⁷ tumor cells and housed under standard conditions. Trastuzumab (30 mg/kg) was administered intraperitoneally every 5 d. Tumor size was measured every 5 d until day 30, after which the tumors were photographed, excised, and fixed in formalin. Tumor volume diagram with five biological replicates (N = 5). (f) Tumor growth curves corresponding to (e). (g) Representative IHC staining results from (e). (h) Box plots illustrated tumor weight in (e). All statistical analyses were performed using the Tukey's multiple-comparison test. *** p < 0.001.
To examine the impact of IRP1 expression on tumor growth, we constructed an in vivo mouse xenograft model. Mice were subsequently treated with trastuzumab to evaluate its efficacy under conditions of reduced IRP1 and ENO1 expression (Fig. 6e). The results showed that IRP1 downregulation significantly accelerated tumor growth in mice bearing trastuzumab-resistant gastric cancer cells (Fig. 6f−h). These findings suggest that high IRP1 expression is associated with reduced tumorigenicity and slower tumor progression, while its suppression promotes tumor growth.
In summary, our study highlights IRP1 as a key regulator of trastuzumab resistance and tumor progression in gastric cancer. Targeting IRP1 may offer a novel therapeutic strategy to mitigate tumor progression and improve treatment outcomes in trastuzumab-resistant gastric cancer.
IRP1 regulated ferroptosis in gastric cancer cells
-
In trastuzumab-resistant gastric cancer cells, ferroptosis levels are typically reduced[30]. Analysis of scRNA-seq data revealed upregulation of the ferritin-encoding genes FTL and FTH1 in these resistant cells (Fig. 7a & b). This upregulation might be linked to mechanisms that enable gastric cancer cells to evade ferroptosis. In contrast, trastuzumab-sensitive cells showed elevated expression of IRP1, a key regulator of cellular ferroptosis (Fig. 7c). Additionally, the transferrin receptor gene (TFRC), involved in iron ion transport, was also upregulated in sensitive cells (Fig. 7c). These findings indicate that trastuzumab-sensitive cells may increase intracellular iron levels by upregulating iron regulatory and transport proteins, thereby promoting ferroptosis and enhancing trastuzumab sensitivity.
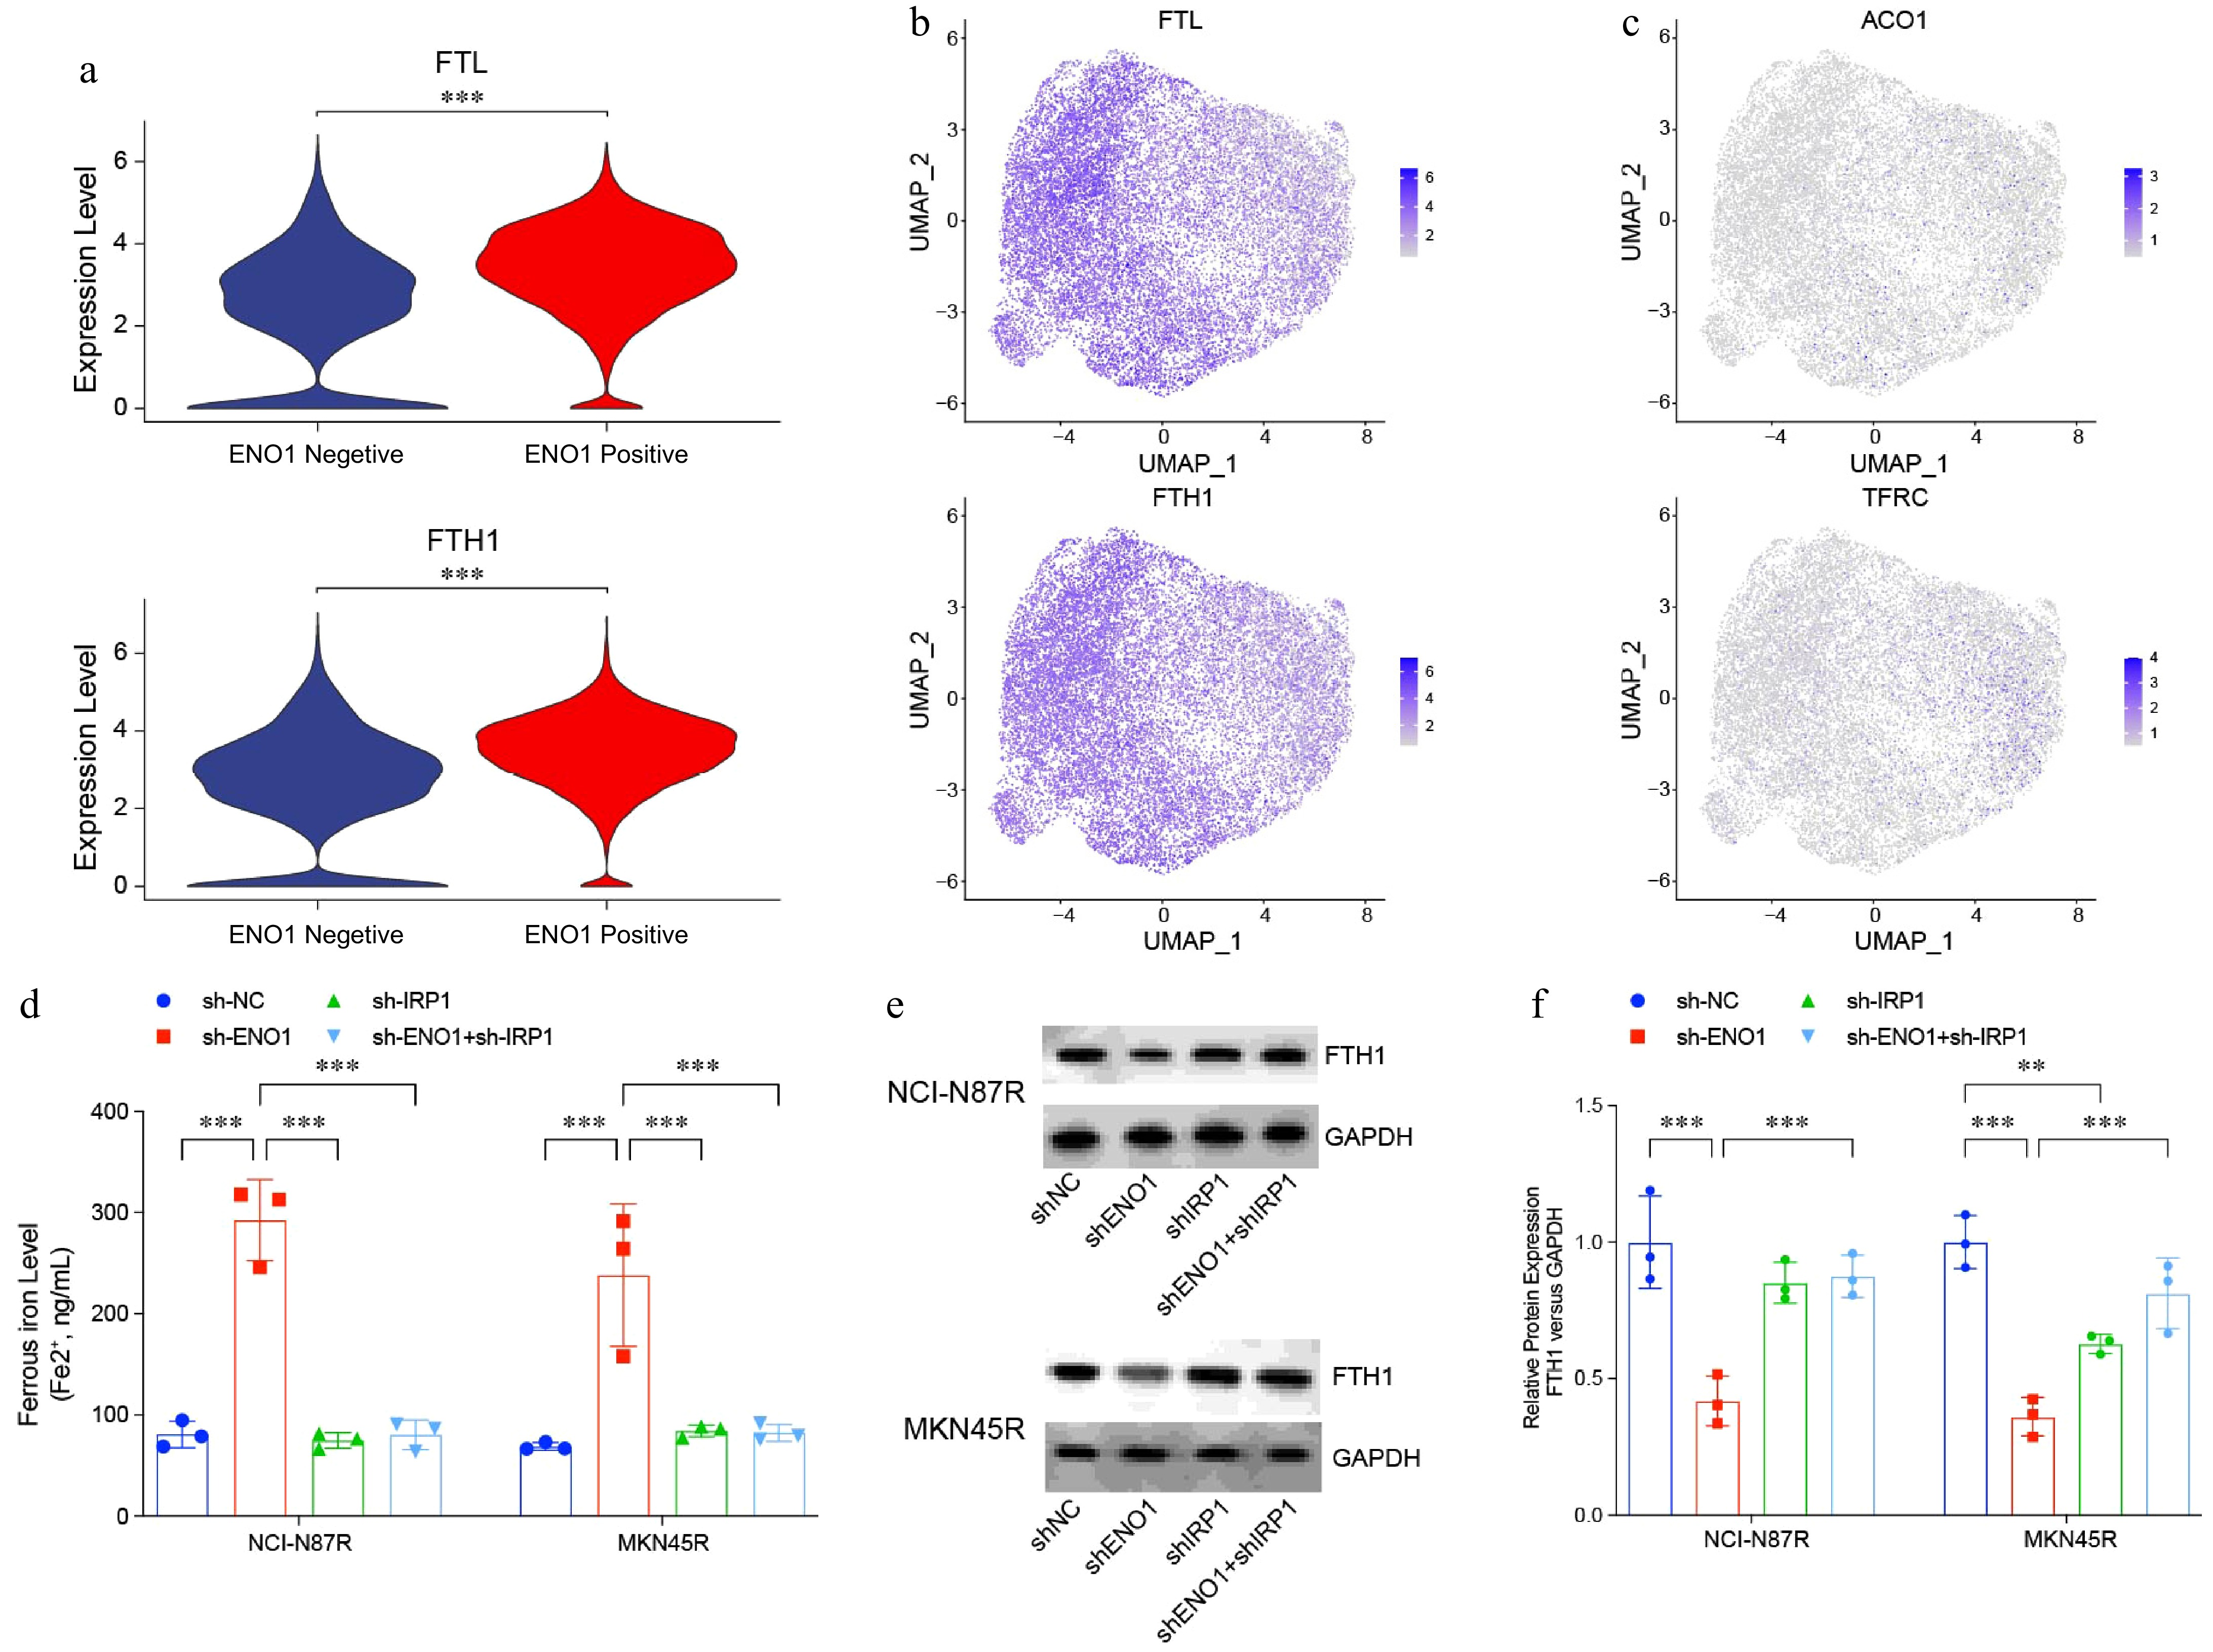
Figure 7.
IRP1 regulated ferroptosis in gastric cancer cells. (a) and (b) Violin and UMAP plots visualizing expression of ferritin-encoding genes FTL and FTH1 in Fig. 1a. (c) UMAP plots visualizing expression of ferritin-encoding genes ACO1 and TRRC in Fig. 1a. (d) Ferrous iron levels in modified gastric cancer cell lines. (e) and (f) Western blotting analysis of ferritin levels in modified gastric cancer cell lines. The experiment was performed with three biological replicates (N = 3). Statistical analyses in (a) were performed using an unpaired, two-tailed Student's t-test, (d) and (f) were performed using the Tukey's multiple-comparison test. ** p < 0.01, *** p < 0.001.
Further analysis of ferrous ion levels across various gastric cancer cell lines revealed a significant decrease in ferrous ion levels in trastuzumab-resistant lines following ENO1 knockdown. However, this reduction was reversed by IRP1 loss (Fig. 7c & d). Western blot analysis showed that ferritin levels, encoded by FTL and FTH1, were markedly reduced in ENO1-knockout cells, while IRP1 deficiency led to a significantly increased ferritin level (Fig. 7e). These findings indicate that ENO1 suppresses IRP1 expression, thereby impairing its critical role in regulating ferroptosis. By modulating iron homeostasis and ferroptosis, ENO1 contributes to the resistance mechanisms in trastuzumab-resistant gastric cancer cells.
Gastric cancer epithelial cells expressing ENO1 enhanced the interaction with other components of the tumor microenvironment
-
CellPhoneDB analysis revealed that ENO1-overexpressing epithelial cells exhibited significantly enhanced interactions with stromal, endothelial, and myeloid cells, indicating robust intercellular communication (Supplementary Fig. S1). In contrast, their interactions with immune cells, including T cells, B cells, plasma cells, and mast cells, were notably weaker. This suggests that immune cell engagement with ENO1-overexpressing epithelial cells may occur indirectly, mediated by signaling from stromal and endothelial cells.
Further analysis of the Wnt and Notch signaling pathways identified strong ligand-receptor interactions in the ENO1-overexpressing group. Stromal cells secreted ligands such as WNT2B, WNT4, and WNT5A, which interacted prominently with receptors on ENO1-overexpressing epithelial cells (Fig. 8a & b). Similarly, endothelial cell-derived ligands, including DLL1, DLL4, JAG1, and JAG2, exhibited significant interactions with receptors on these epithelial cells (Fig. 8c & d), underscoring the importance of the Wnt and Notch pathways in regulating cell communication, potentially contributing to tumor aggressiveness and therapy resistance.
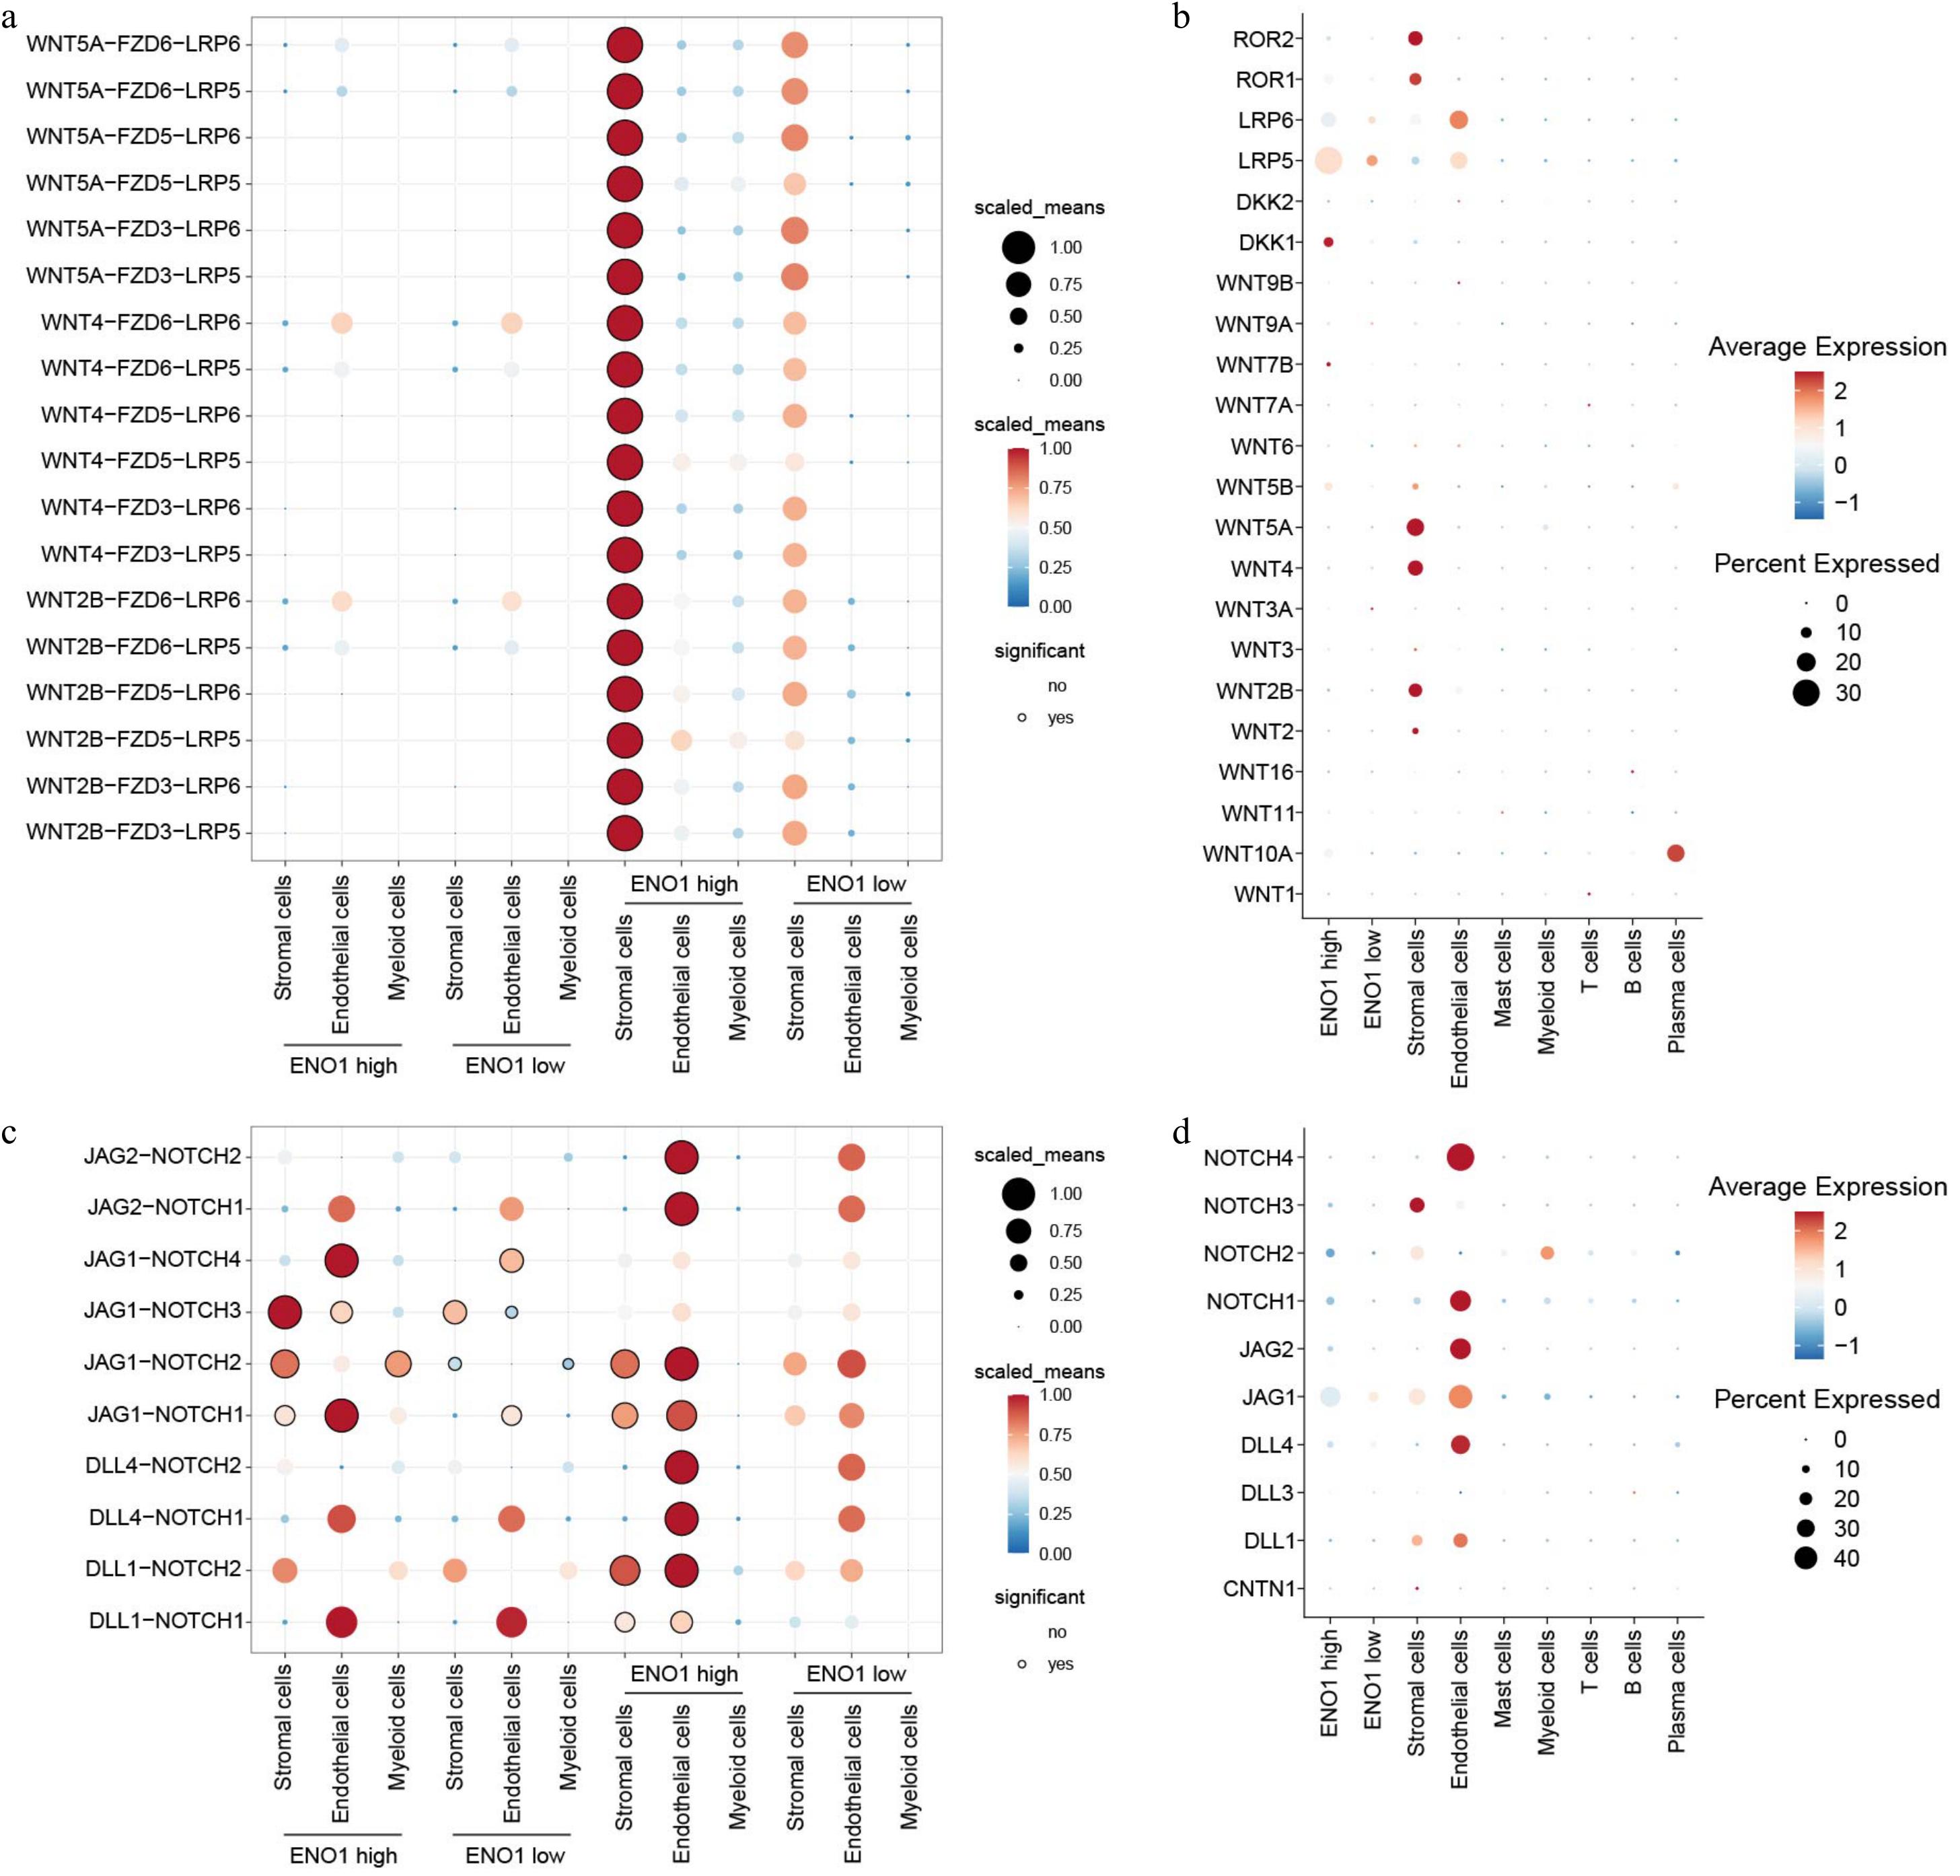
Figure 8.
ENO1 expression levels regulated ligand-receptor interactions of Wnt and Notch signaling pathways in different cell types. (a) Dot plot showing the interactions of the Wnt signaling pathways across different cell types. The color of the dots represents the number of receptor-ligand pairs involved in the interactions, while the size of the dots indicates the percentage of interacting cells. The black circles around the dots denote statistically significant interactions. (b) The expression of the corresponding genes in different cell populations from (a). The size of the circles represent the percentage of cells expressing the genes, and the color of the circles indicate the average expression levels. (c) Dot plot showing the interactions of the Notch signaling pathways across different cell types. (d) The expression of the corresponding genes in different cell populations from (c).
TGF-β signaling also played a major role, with strong ligand-receptor interactions between TGF-β ligands and ENO1-overexpressing epithelial cells, suggesting its involvement in promoting tumor progression and immune evasion (Supplementary Fig. S2a & b). Additionally, EGF signaling was implicated, as interactions between ENO1-overexpressing epithelial cells and EGFR on stromal cells, mediated by TGF-α, further suggested a role in driving tumor aggressiveness. Gene expression analysis reinforced these findings, with high expression of TGFB2 and TGFB3 in stromal cells and elevated TGFA in ENO1-overexpressing epithelial cells. Moreover, TNF and chemokine signaling pathways provided further insights into the complex communication within the ENO1-overexpressing tumor microenvironment (Supplementary Fig. S2c & d). TNFSF10 from myeloid cells interacted strongly with ENO1-overexpressing epithelial cells, emphasizing the role of TNF signaling in immune regulation. Chemokines such as CXCL1, secreted by ENO1-overexpressing cells, and CCL11, secreted by stromal cells, showed significant interactions with their respective receptors, highlighting their roles in immune cell recruitment and activation (Supplementary Fig. S2e & f).
In conclusion, the Wnt, Notch, TGF-β, EGF, TNF, and chemokine pathways create a highly integrated communication network in ENO1-overexpressing tumors, regulating tumor growth, immune modulation, and progression.
-
The present study provides critical insights into the metabolic alterations underlying trastuzumab resistance in HER2-positive gastric cancer. Through scRNA-seq data analysis, we classified gastric cancer cells and observed a significant upregulation of glycolysis-related genes in trastuzumab-resistant cells, particularly ENO1. Subsequent validation using RT-PCR and Western blot confirmed the overexpression of ENO1, identifying it as a key driver of metabolic reprogramming. Elevated ENO1 expression enhanced glycolysis, contributing to increased cell survival, colony formation, and tumor growth in trastuzumab-resistant gastric cancer.
Beyond its role in glycolysis, ENO1 has emerged as a multifunctional target in cancer therapy. Elevated ENO1 levels are linked to disease progression and poor survival outcomes across various cancers, including colorectal, breast, and gastric cancers, glioblastoma, head and neck cancers, and leukemia. ENO1 contributes to tumor growth by promoting angiogenesis, evading immune detection, and resisting apoptosis. ENO1 inhibitors have shown promise in suppressing cancer cell proliferation[31−33]. For example, the selective ENO1 inhibitor POMHEX has demonstrated effectiveness in reducing glioblastoma progression in vivo by inducing apoptosis, with a favorable safety profile in non-human primates[34]. Similarly, macrosphelide A, another potent ENO1 inhibitor, has exhibited anticancer activity by targeting ENO1 alongside aldolase and fumarase[35].
The glycolytic shift was associated with a significant downregulation of the TCA cycle-related gene IRP1, as identified through RNA immunoprecipitation assays. IRP1 suppression disrupted cellular metabolism, contributing to the resistance mechanism. Additionally, our analysis revealed that ENO1 plays a dual role in regulating ferroptosis, a form of regulated cell death linked to iron metabolism and oxidative stress. In trastuzumab-resistant cells, the inhibition of ferroptosis-related genes highlighted the complex interplay between glycolysis and ferroptosis mediated by ENO1. This dual regulatory function underscores ENO1's pivotal role in the metabolic alterations driving trastuzumab resistance.
Recent advances in targeting glycolysis in HER2-positive advanced gastric cancer has yielded significant insights. HER2-positive gastric cancer cells undergo metabolic reprogramming by regulating key glycolytic enzymes, including hexokinase 2 (HK2), phosphofructokinase 1 (PFK1), and pyruvate kinase M2 (PKM2), as well as the transcription factor HIF-1α[36−38]. This reprogramming facilitates cancer cell proliferation and survival. Furthermore, lactate produced during glycolysis suppresses immune function by inhibiting T cells and NK cells while promoting regulatory T cell (Treg) survival, thereby contributing to immune evasion[39,40]. In clinical settings, combining HER2-targeted therapies, such as pembrolizumab, trastuzumab, and chemotherapy, has improved progression-free survival (PFS) and overall survival (OS) in patients[41]. Additionally, novel agents like trastuzumab deruxtecan (ENHERTU®)[42] have shown promising response and disease control rates, even in patients with low to intermediate HER2 expression. These findings enhance our understanding of metabolic reprogramming in gastric cancer and provide a foundation for developing innovative diagnostic and therapeutic strategies.
In conclusion, our findings underscore the pivotal role of ENO1-mediated metabolic reprogramming in driving trastuzumab resistance. Targeting glycolysis and ENO1, alongside further investigation into the regulatory mechanisms involving IRP1 and ferroptosis, offers promising therapeutic avenues to overcome resistance in trastuzumab in HER2-positive gastric cancer. These insights provide a foundation for developing more effective strategies aimed at disrupting the metabolic dependencies of resistant gastric cancer cells, potentially improving treatment outcomes.
The present study was supported by the Supported by Changzhou Sci & Tech program (CJ20230053, CJ20200050, and CJ20241101).
-
All mouse experiments were approved by the Ethics Committee of the Third Affiliated Hospital of Soochow University.
-
The authors confirm contribution to the paper as follows: conception and design: Jiang Y, Yuan M; administrative support: Jiang Y, Yuan M; collection and assembly of data: Wang L, Fang Z; data analysis and interpretation: Wang L, Ding X, Yang J; manuscript writing: all authors. All authors reviewed the results and approved the final version of the manuscript.
-
All sequencing data in this study were obtained from publicly available articles, and no additional data were generated during the course of this research.
-
The authors declare that they have no known competing financial interests or personal relationships that could have appeared to influence the work reported in this paper.
- Supplementary Fig. S1 CellphoneDB analyzed of the interactions between gastric cancer epithelial cells and other components in the TME.
- Supplementary Fig. S2 ENO1 expression levels regulated ligand-receptor interactions of other signaling pathways in different cell types.
- Copyright: © 2025 by the author(s). Published by Maximum Academic Press, Fayetteville, GA. This article is an open access article distributed under Creative Commons Attribution License (CC BY 4.0), visit https://creativecommons.org/licenses/by/4.0/.
-
About this article
Cite this article
Wang L, Ding X, Yang J, Fang Z, Yuan M, et al. 2025. ENO1 regulates trastuzumab resistance in gastric cancer cells through IRP1. Gastrointestinal Tumors 12: e004 doi: 10.48130/git-0025-0004 

ENO1 regulates trastuzumab resistance in gastric cancer cells through IRP1
- Received: 16 December 2024
- Revised: 12 January 2025
- Accepted: 20 January 2025
- Published online: 11 February 2025
Abstract: This study aims to investigate the metabolic alterations, their impacts on trastuzumab resistance, and potential therapeutic strategies to overcome resistance to trastuzumab in HER2-positive gastric cancer. Single-cell RNA sequencing (scRNA-seq) was employed to classify gastric cancer cells, and glycolysis-related genes, particularly Enolase 1 (ENO1), were quantified by RT-PCR and Western blotting. ENO1 overexpression and knockdown models were developed to explore its role in trastuzumab resistance. RNA immunoprecipitation (RIP) assays explored ENO1's interaction with Iron Regulatory Protein 1 (IRP1). Additionally, the expression of ferroptosis-related genes was analyzed to determine their association with trastuzumab sensitivity. Our study revealed a significant upregulation of glycolysis in trastuzumab-resistant gastric cancer cells, primarily driven by the overexpression of the glycolytic enzyme ENO1. This metabolic reprogramming was identified as a pivotal mechanism underlying trastuzumab resistance, contributing to enhanced cell survival, increased colony formation, and accelerated tumor growth. Detailed analyses demonstrated that ENO1 overexpression not only facilitated glycolysis but also inhibited the expression of the tricarboxylic acid (TCA) cycle-related gene IRP1. This inhibition modulated ferroptosis, and further promoted resistance. The dual role of ENO1 in regulating both glycolysis and ferroptosis underscored its critical involvement in metabolic adaptations. Metabolic reprogramming, particularly through ENO1, plays a key role in trastuzumab resistance. Targeting glycolysis gene ENO1, along with elucidating the regulatory mechanisms of IRP1 and ferroptosis, presents promising therapeutic strategies to overcome trastuzumab resistance in gastric cancer.
-
Key words:
- Gastric cancer /
- Trastuzumab resistance /
- ENO1 /
- IRP1 /
- Ferroptosis