


-
Wucai (Brassica campestris L. ssp. chinensis var. rosularis Tsen et Lee), a biennial plant in the family Cruciferae, is a prominent leafy vegetable widely consumed during autumn and winter. It is rich in dietary fiber, calcium, iron, vitamins, and carotenoids, contributing to its high nutritional value. At present, with the continuous expansion of the scale of the Wucai industry, the market feedback on the quality of Wucai is uneven, and the primary demand of the industry is no longer the pursuit of output, but the focus is shifted to the demand for quality control. Therefore, based on stabilizing the planting area and yield of the Wucai, to further improve the competitiveness of the Wucai industry to breed high-quality varieties is an urgent problem to be solved. Flavor characteristics are critical determinants of vegetable food quality and play a pivotal role in shaping consumer preferences[1]. Free amino acids (FAAs) are a kind of important taste active compounds, which are categorized based on their sensory properties into sweet, umami, bitter, and aromatic amino acids[2]. Additionally, FAAs can be classified into essential amino acids (EAAs) and non-essential amino acids (NEAAs) depending on whether they can be synthesized by the human body[3]. The content and composition of FAAs play a pivotal role in determining the overall taste and sensory attributes of various foods, making them important indicators of food quality[4]. While L-amino acids contribute to sweetness or bitterness of fruits and vegetables, most D-amino acids are primarily associated with sweetness[5]. Specific FAAs such as L-glutamine and L-asparagine are found to be negatively correlated with bitterness in Brassica leafy crops, while other compounds including raffinose, maltose, and malic acid are positively correlated with bitterness[6]. Moreover, in bamboo shoots, bitterness is primarily attributed to L-phenylalanine, uridine, L-amino acid, L-tryptophan, and adenine, with L-phenylalanine being the major contributor[7].
1-Aminocyclopropane-1-carboxylic acid synthase (ACS) is the rate-limiting enzyme in the ethylene biosynthesis pathway[8]. Ethylene is closely linked to amino acids, many of which serve as important precursors of volatiles[9]. Research has shown that the umami amino acids in ethylene-treated nuts are significantly upregulated compared to untreated nuts[10]. Additionally, applying ethylene to soybean leaves increases the levels of both EAAs and NEAAs by five and six times, respectively[11]. Conversely, in a transgenic tomato line with antisense LeACS2, the contents of various amino acids—including aspartic acid, glutamic acid, serine, glycine, histidine, arginine, proline, valine, methionine, cystine, isoleucine, leucine, phenylalanine, and lysine—are decreased[12].
In this study, we employed metabolomics to analyze the changes in FAAs before and after the quality transformation of Wucai. Moreover, electronic tongue analysis was utilized to assess the taste changes before and after this transformation, and key FAAs affecting the quality of Wucai were identified. A combined analysis of transcriptomics and metabolomics was conducted to screen for genes potentially responsible for these changes in key FAAs. The functions of these key genes were then verified, and interacting proteins were screened using a yeast two-hybrid (Y2H) library and verified through bimolecular fluorescence complementation (BiFC) assays.
-
The plant material used in this experiment was the Wucai cultivar 'W16-19-5', obtained by the vegetable genetic breeding team at the College of Horticulture, Anhui Agricultural University, China. Wucai seedlings were initially cultured in plug trays until they developed 6–7 true leaves, after which they were transplanted into nutrient bowls. The transplanted seedlings were placed in an artificial climate growth chamber under controlled temperature conditions for room-temperature treatment: 25 ± 1 °C during the day and 15 ± 1 °C during the night, which was recorded as 0 days after planting (DAP). At 28 DAP, the temperature was adjusted to 10 °C during the day and 4 °C during the night to simulate a cooler environment. Throughout the growth period, the light intensity was maintained at 16,680 lx. The photoperiod was set to 16 h/8 h (day/night), with a relative humidity of 70%. For sampling, fresh leaves from the inner to outer layers, specifically those with 4–5 leaves, were selected as molecular and physiological samples, with veins and leaf margins removed. The first sampling occurred at 28 DAP, followed by additional samplings every 6 d until 58 DAP. Molecular samples were collected more frequently, every 3 d. Fresh leaves were dried for 24 h. The dried leaves were ground into a fine powder and stored in dry centrifuge tubes. Three biological replicates were used for the determination of physiological and biochemical indices. Fresh samples were stored in a −80 °C refrigerator.
Metabolomic analysis
-
The extraction, detection, and quantitative analysis of metabolites in the samples were conducted by Shanghai Lu-Ming Biotechnology Co., Ltd. (Shanghai, China) (
www.lumingbio.com ). For the analysis, 80 mg freeze-dried sample was weighed and combined with 20 μL of an internal standard (2-chloro-l-phenylalanine, 0.3 mg/mL in methanol) and 1 mL of methanol solution (methanol : water = 7:3, v/v). The mixture is pre-cooled at −20 °C for 2 min and ground at 60 Hz grinding 2 min, ice water bath ultrasonic extraction 30 min, −20 °C overnight; after centrifugation at 13,000 r/min for 10 min at 4 °C, 150 μL of the supernatant was taken and filtered, which was transferred to a liquid chromatography injection vial and stored at −80 °C. The sample extract was filtered and analyzed using liquid chromatography-tandem mass spectrometry (LC-MS/MS), UPLC (Waters, Milford, USA) combined with VION IMS QTOF mass spectrometer (Waters, Milford, USA) was used for analysis. For the gas chromatography-tandem mass spectrometry (GC-MS/MS) analysis, 60 mg fresh leaves were weighed and added with 40 μL internal standard (the same as LC-MS/MS). The mixture was ground and ultrasonically treated for 30 min. Subsequently, 200 μL chloroform and 400 μL water were added for vortex extraction. Transfer 200 μL of the supernatant to a glass sampling bottle for vacuum drying. Then 80 μL 15 mg/mL methoxyamine was added and incubated at 37 °C for 90 min. Following incubation, 80 μL N,O-bis(trimethylsilyl)trifluoroacetamide [BSTFA; containing 1% trimethylchlorosilane (TMCS)] and 20 μL n-hexane were added, vortexed violently for 2 min, and derivatized at 70 °C for 60 min. The samples were then allowed to stand at room temperature for 30 min, and then analyzed on 7890B gas chromatography system (Agilent Technologies, CA, USA).Unsupervised principal component analysis (PCA) and orthogonal partial least squares-discriminant analysis (OPLS-DA) were employed to observe changes in metabolites between samples. According to the OPLS-DA model, a variable importance in projection (VIP) score greater than 1 indicates a significant contribution to group differences. Metabolites with a VIP score greater than 1 and a p-value less than 0.05 were considered differentially accumulated metabolites (DAMs).
Transcriptome analysis
-
Total RNA was extracted from Wucai leaves collected at 34 and 46 DAP, using the mirVana miRNA Isolation Kit (Ambion, TX, USA), following the manufacturer's instructions. Three biological replicates were processed for each time point. According to the manufacturer's instructions, the library was constructed using the TruSeq Stranded mRNA LT sample preparation kit (Illumina, San Diego, CA, USA). Six complementary DNA (cDNA) libraries were then sequenced on the Illumina sequencing platform. The raw sequencing reads were processed using Trimmomatic[13] to remove low-quality reads to obtain clean readings for subsequent analysis. These clean reads were then aligned to the Chinese cabbage (Brassica rapa) reference genome using HISAT2[14]. Gene expression levels were quantified using Cufflinks and HTSeqcount[15] as per thousand base transcript fragments ( FPKM ) and per 100 base transcript read counts. The DESeq (2012) function was used to estimate the size factor and binomial test to identify differentially expressed single genes (DEGs), and q < 0.05 and |log2(fold change)| > 1 was used as the threshold for significant differential expression. Based on hypergeometric distribution, KEGG pathway enrichment analysis of DEGs was performed using R software. The FPKM values were utilized to generate heat maps for visualizing gene expression patterns.
Electronic tongue analysis
-
The 30 g sample was weighed and added with 150 mL of pure water, ground, and centrifuged at 4,000 rpm for 10 min. The supernatant was then filtered through gauze to remove any remaining solid particles. Taste analysis was conducted using the SA402B taste analysis system (INSENT, Tokyo, Japan), which employs a wide-area selective artificial lipid membrane sensor to simulate the taste perception mechanisms found in living organisms. The system evaluates five basic taste attributes—acidity, astringency, bitterness, saltiness, and umami—by detecting changes in membrane potential induced by electrostatic or hydrophobic interactions between flavor compounds and the artificial lipid membranes[16]. The testing procedure followed a method similar to that described in previous electronic tongue measurements[17]. Each sample underwent four measurement cycles, with the first cycle being discarded, and the average of the subsequent three cycles was recorded for analysis.
The output value of the reference solution, which contains potassium chloride and tartaric acid, serves as the tasteless baseline. Specifically, the tasteless thresholds for sourness and saltiness are defined as less than −13 and less than −6, respectively, while those for umami, bitterness, astringency, aftertaste-A, aftertaste-B, and sweetness are defined as zero or negative. Any measurements exceeding these tasteless thresholds are considered valid flavor data.
Determination of ACS enzyme activity
-
The enzyme activity of ACS was measured using an enzyme-linked immunosorbent assay. The assay was conducted following the manufacturer's instructions provided with the kit (Jiangsu Boshen Biotechnology Co. Ltd.).
Generation of transgenic Arabidopsis plants
-
The overexpression vectors for BcACS6 (1305-BcACS6) were constructed and introduced into the Agrobacterium tumefaciens strain GV3101. Arabidopsis thaliana plants were transformed using the floral dip method. Seeds from putatively transgenic plants were sown on Murashige and Skoog (MS) medium supplemented with hygromycin to select for successful transformants. The cultivation of Arabidopsis thaliana in the experiment was carried out in an artificial climate chamber, and the cultivation conditions were carried out according to the cultivation scheme of Wucai in 2.1.
Measurement of FAA contents in transgenic plants
-
To measure the FAA contents in transgenic Arabidopsis thaliana leaves, 0.1 g of dried leaf tissue was accurately weighed and finely ground using a mortar to obtain a homogeneous powder. The powder was transferred to a 10 mL centrifuge tube, and 10 mL of 4% sulfosalicylic acid was added. The mixture was subjected to ultrasonic extraction for 30 min, with inversion mixing every 5 min. After sonication, the samples were allowed to settle for 10 min, and 4 mL of the supernatant was transferred to a fresh 10 mL centrifuge tube. The samples were then centrifuged at 12,000 rpm for 30 min. Post-centrifugation, the supernatant was carefully collected and filtered with a 0.22 μm disposable water filter. The filtrate was transferred to the sample bottle and analyzed by L-8900 automatic amino acid analyzer. The amino acid components in the Arabidopsis thaliana leaf samples were quantified using the external standard method, based on the relationship between the mass concentration and peak area of the amino acid standard. Each measurement was biologically replicated three times.
Self-activation detection of bait vector
-
To construct the bait vector, the coding sequence (CDS) of BcACS6 was cloned into the pGBKT7 vector. For the self-activation detection assay, the positive control (pGBKT7-53 + pGADT7-T), negative control (pGADT7-Lam + pGADT7-T), and self-activation verification group (pGBKT7-BcACS6 + pGADT7) were transformed into yeast cells. The transformed cells were dotted onto synthetic dropout plates SD/-Trp/-Leu or SD/-Trp/-Leu/-His/-Ade medium but supplemented with X-α-gal and aureobasidin A (AbA) for the detection of self-activation.
Y2H library screening
-
The pGBKT7-BcACS6 plasmid was co-transformed with a yeast library plasmid into competent yeast cells. The transformed cells were plated on SD/-Trp/-Leu/X-α-Gal/AbA medium to select for successful transformations. After incubation at 30 °C for 3–5 d, the resulting monoclonal colonies were streaked onto SD/-Trp/-Leu/-His/-Ade/X-α-Gal/AbA medium colonies that continued to grow normally and exhibited a blue color were selected for polymerase chain reaction (PCR) amplification and sequencing.
Verification of pGBKT7-BcACS6 and its interacting proteins
-
To verify interactions, the CDS of BcACS6 and 10 potential interacting genes identified from the Y2H screening were cloned into either the pGADT7 (bait) or pGBKT7 (prey) vectors. These constructs were co-transformed into Y2HGold yeast cells. The transformed cells were then dotted onto SD/-Trp/-Leu/-His/-Ade/X-α-Gal/AbA medium to assess protein–protein interactions.
BiFC assay
-
For the BiFC assay, the CDS of BcACS6, BcCOR413PM1, BcDnaJ, and BcPCR8 were cloned into the pSPYNE vector. The pSPYNE constructs (pSPYNE-BcACS6) were co-expressed with their corresponding pSPYCE constructs (pSPYCE-BcCOR413PM1, pSPYCE-BcDnaJ, and pSPYCE-BcPCR8) in Nicotiana benthamiana leaves through Agrobacterium-mediated transient transformation. Agrobacterium cultures were grown overnight, and the optical density of the bacterial suspension was adjusted to 0.8–1.0 using activation buffer (2-(N-morpholino) ethanesulfonic acid (MES) : MgCl2 = 5:1). Acetosyringone (AS) was added to the bacterial suspension at a ratio of 1,000:1, and the N. benthamiana leaves were infiltrated following a 3-h dark incubation at 28 °C. The plants were then kept in the dark for one day, followed by light culture for approximately two days. Fluorescence signals were observed using a confocal laser scanning microscope (Leica TCS SP2, Leica, Germany).
Statistical analysis
-
Excel 2021 was used for data statistics, SPSS 26.0 was used for significant analysis of the data, and the significant level was p < 0.05. Prism6 was used to draw the statistical data and Adobe Illustrator 2023 was used to beautify and edit the pictures.
-
Building on our previous findings regarding sugar content changes during the quality transformation of Wucai, we conducted an in-depth analysis of DAMs during this transformation. Our analysis identified a total of 6,599 metabolites through LC-MS/MS and 379 metabolites through GC-MS/MS; furthermore, 650 and 111 DAMs (p < 0.05 and VIP ≥ 1) were identified through statistical analysis, respectively (Supplementary Fig. S1). In the LC-MS/MS analysis, a total of 385 DAMs were upregulated (log2(FC) > 0), and 265 DAMs were downregulated (log2(FC) < 0) at 46 DAP compared to that at 34 DAP (Supplementary Fig. S1a). Subclass classification of these 650 DAMs (Supplementary Table S1) showed that the most prevalent categories included 'carbohydrates and carbohydrate derivatives', 'amino acids, polypeptides, and analogs', and 'flavonoid glycosides' (Fig. 1a). Notably, 55 DAMs were identified in the 'amino acids, polypeptides, and analogues' category, representing 8.5% of the total DAMs, with 34 upregulated and 21 downregulated DAMs (Supplementary Fig. S2a). GC-MS/MS analysis revealed that 43 and 68 DAMs were upregulated and downregulated at 46 DAP compared to that at 34 DAP, respectively (Supplementary Fig. S1b). The metabolite classification from GC-MS/MS (Supplementary Table S2) also highlighted 'amino acids, polypeptides, and analogues', 'carbohydrates and carbohydrate derivatives', and 'fatty acids and derivatives' as the most abundant categories. Within the 'amino acids, polypeptides, and analogues' category, 26 DAMs were identified, comprising 30.6% of the total DAMs, which is significantly higher than in other metabolite categories (Fig. 1b). Of these, eight DAMs were upregulated and 18 DAMs were downregulated (Supplementary Fig. S2b).
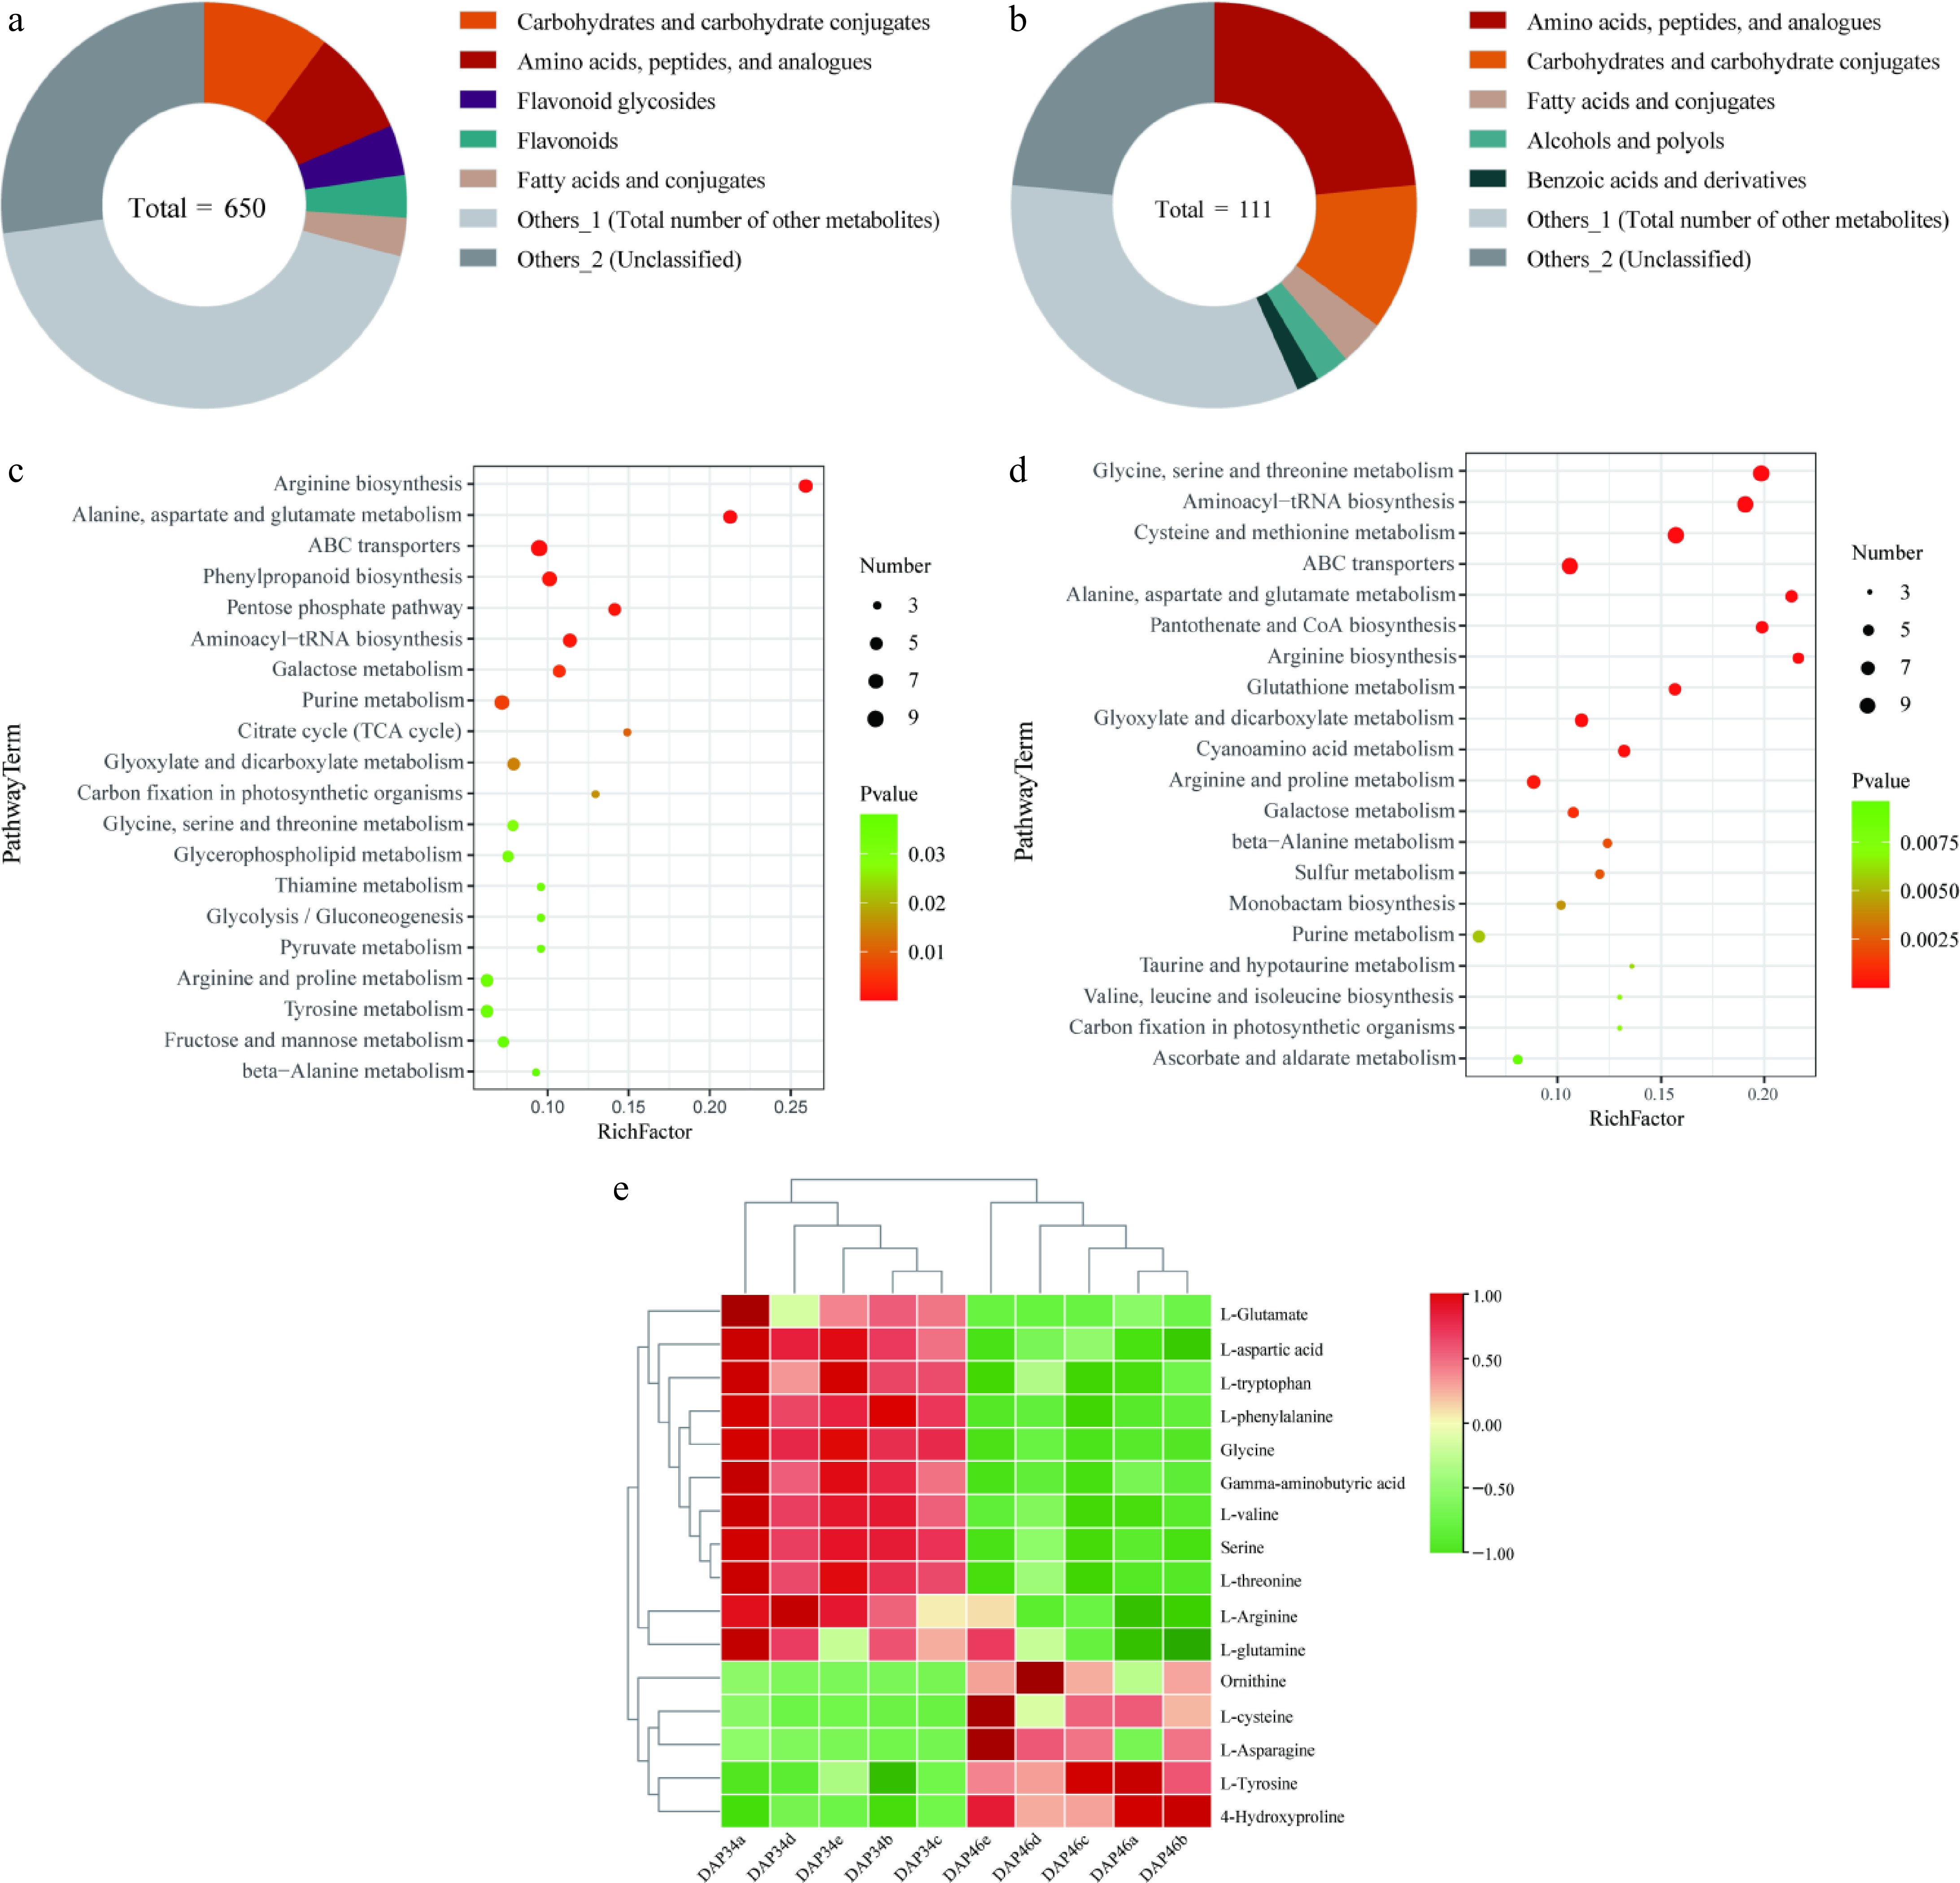
Figure 1.
Extensive targeted metabolomics analysis revealing the changes in amino acid contents before and after the quality transformation of Wucai. Classification of subclasses of differentially accumulated metabolites (DAMs) in (a) liquid chromatography-tandem mass spectrometry (LC-MS/MS), and (b) gas chromatography-tandem mass spectrometry (GC-MS/MS). Enriched Kyoto Encyclopedia of Genes and Genomes (KEGG) pathways associated with DAMs in (c) LC-MS/MS, and (d) GC-MS/MS. (e) Heat map showing the abundance of flavor amino acids detected in the metabolome.
Next, we performed KEGG enrichment analysis on the DAMs identified by LC-MS/MS and GC-MS/MS. Among the most prominent top 20 KEGG pathways identified through LC-MS/MS, several pathways related to amino acid metabolism were significantly enriched. These included arginine biosynthesis (brp00220); alanine, aspartic acid, and glutamate metabolism (brp00250); glycine, serine, and threonine metabolism (Brp00260); arginine and proline metabolism (brp00330); and tyrosine metabolism (brp00350) pathways (Fig. 1c). Similarly, in the top 20 KEGG pathways identified through GC-MS/MS, significantly represented amino acid metabolism pathways included glycine, serine, and threonine metabolism (brp00260); cysteine and methionine metabolism (brp00270); alanine, aspartic acid, and glutamic acid metabolism (brp00250); arginine biosynthesis (brp00220); arginine and proline metabolism (brp00330); and valine, leucine, and isoleucine biosynthesis (brp00290) pathways (Fig. 1d). Therefore, we believe that these amino acids may play an important role in the transformation of the flavor quality of Wucai.
Analysis of amino acid contents at different developmental stages
-
To further investigate the effect of amino acids on the leaf quality of Wucai, we screened FAAs with flavor characteristics identified from the DAMs in the 'amino acids, polypeptides, and analogues' category in the metabolome. Our analysis revealed 15 flavor amino acids with significant differences between developmental stages: L-arginine, L-glutamic acid, L-tryptophan, L-glutamine, L-aspartic acid, glycine, L-phenylalanine, γ-aminobutyric acid, L-valine, serine, L-threonine, L-cysteine, L-asparagine, ornithine, and L-tyrosine. A significant accumulation of L-cysteine, L-asparagine, ornithine, and L-tyrosine was observed at 46 DAP compared to that at 34 DAP. Conversely, the contents of L-arginine, L-glutamic acid, L-tryptophan, L-glutamine, L-aspartic acid, glycine, L-phenylalanine, γ-aminobutyric acid, L-valine, serine, and L-threonine were found to be significantly reduced (Fig. 1e). It can be seen that there are obvious differences in flavor amino acids in different stages of development.
Taste patterns of Wucai at different developmental stages
-
Leaf samples from six developmental stages of Wucai were analyzed using an electronic tongue to monitor taste patterns during quality transformations. The results indicated that the acid response value of Wucai leaf samples across these stages was consistently lower than the tasteless baseline (Supplementary Table S3), suggesting that there was no significant change in acidity during the quality transformation of Wucai. Further analysis of other taste attributes revealed several trends. The umami taste exhibited a gradual increase throughout the quality transformation of Wucai. In contrast, the salty taste showed an overall significant decrease, although there was a notable fluctuation in its response value at 40 DAP. The trend in astringency closely paralleled that of saltiness, with a significant reduction during the quality transformation. Bitterness also showed a gradual decline, whereas sweetness increased progressively from 28 DAP to 40 DAP, followed by no significant change from 46 DAP to 58 DAP (Fig. 2a).
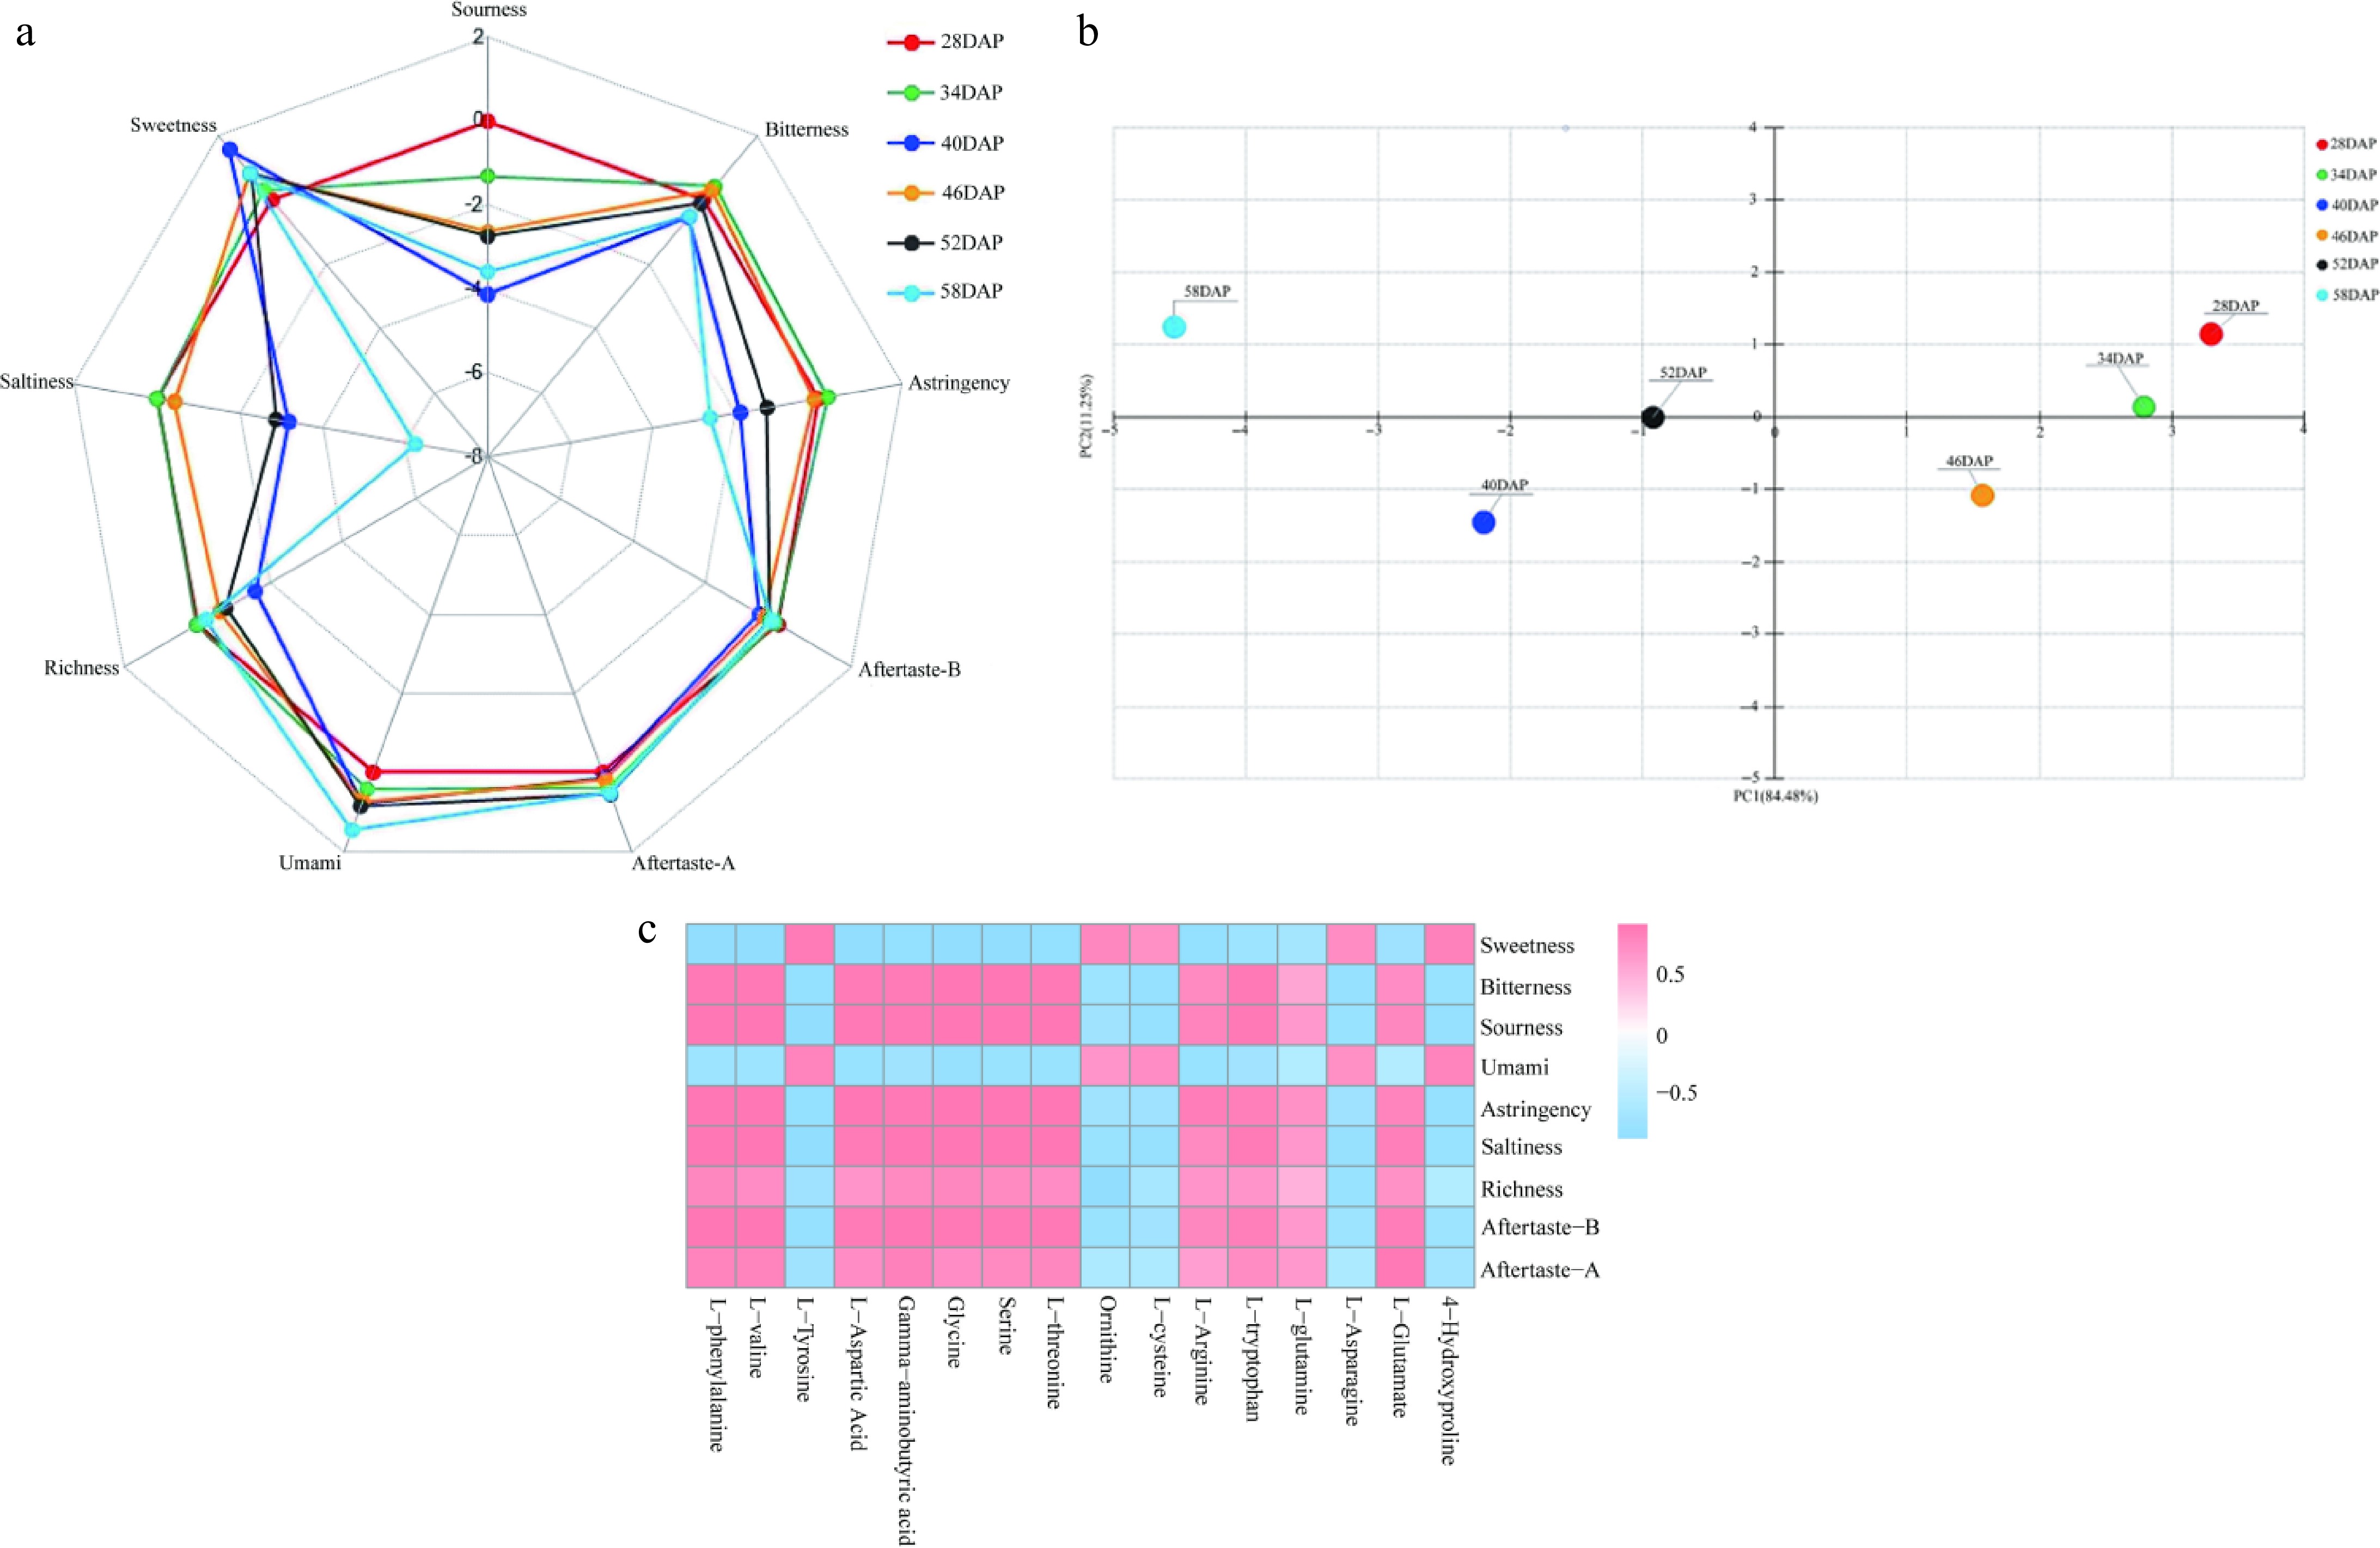
Figure 2.
Changes in taste attributes before and after the quality transformation of Wucai as determined by electronic tongue analysis. (a) Radar plot of electronic tongue analysis results. (b) Principal component analysis plot of electronic tongue analysis results. (c) Heat map showing the correlation between electronic tongue response values and flavor amino acids.
In the PCA of the electronic tongue response values, the variance contribution rates for PC1 and PC2 were 84.48% and 11.25%, respectively. These high contribution rates demonstrate that these two principal components effectively represent and reflect the taste patterns during the quality transformation of Wucai (Fig. 2b). PC1 was predominantly influenced by saltiness, sourness, astringency, and umami, while PC2 was mainly associated with sourness and saltiness. Given that the sour taste was consistently below the tasteless baseline, the primary taste attributes that characterized the quality transformation of Wucai were saltiness, astringency, and umami (Supplementary Table S4). The umami showed an upward trend, while the salty and astringent showed a downward trend.
Correlation analysis between taste patterns and flavor amino acids
-
To explore the relationship between taste attributes and flavor amino acids, we calculated the correlation between the electronic tongue response values at 34 DAP and 46 DAP and the reaction intensity data of flavor amino acids using the Spearman correlation coefficient method.
The analysis revealed that umami taste was positively correlated with L-cysteine and negatively correlated with L-arginine. Astringency was positively correlated with L-phenylalanine, L-valine, L-aspartic acid, γ-aminobutyric acid, glycine, serine, L-threonine, and L-tryptophan, while it was negatively correlated with L-tyrosine and 4-hydroxyproline. The salty taste was positively correlated with L-phenylalanine, L-valine, γ-aminobutyric acid, glycine, serine, L-threonine, and L-glutamic acid and negatively correlated with L-tyrosine and 4-hydroxyproline. Sweetness was found to be negatively correlated with L-glutamic acid alone. Moreover, bitterness was positively correlated with L-threonine and negatively correlated with ornithine, L-cysteine, and L-asparagine (Fig. 2c).
Given that the primary taste attributes before and after the quality transformation of Wucai were saltiness, astringency, and umami, we further screened the flavor amino acids with the highest correlation with these three taste attributes. The results indicated that L-cysteine exhibited the highest absolute correlation coefficient with umami. L-aspartic acid had the highest correlation with astringency, while L-phenylalanine, L-tyrosine, and γ-aminobutyric acid had identical and higher correlation coefficients with saltiness compared to those for other amino acids (Supplementary Table S5). Therefore, L-cysteine, L-aspartic acid, L-phenylalanine, L-tyrosine, and γ-aminobutyric acid were selected for further analysis.
Transcriptome analysis
-
To investigate the molecular mechanisms underlying amino acid changes associated with quality transformation in Wucai, we performed RNA-sequencing analysis on samples collected at 34 and 46 DAP. The analysis revealed a total of 4,761 DEGs at 46 DAP compared to that at 34 DAP (p < 0.05, log2(FC) > 1). Of these DEGs, 2,371 were upregulated and 2,390 were downregulated. KEGG enrichment analysis was further conducted to categorize these DEGs, and they were annotated to 18 KEGG pathways. Notably, 104 DEGs were associated with the 'amino acid metabolism' pathway (Supplementary Fig. S3). Among the pathways enriched with upregulated DEGs, 'signal transduction', 'lipid metabolism', and 'carbohydrate metabolism' were the most abundant pathways, with 36 upregulated DEGs annotated under the 'amino acid metabolism' pathway, making it the fifth most abundant category (Fig. 3a). Conversely, for downregulated DEGs, the most enriched pathways were 'translation', 'amino acid metabolism', and 'carbohydrate metabolism', with 68 downregulated DEGs annotated to the 'amino acid metabolism' pathway (Fig. 3b).
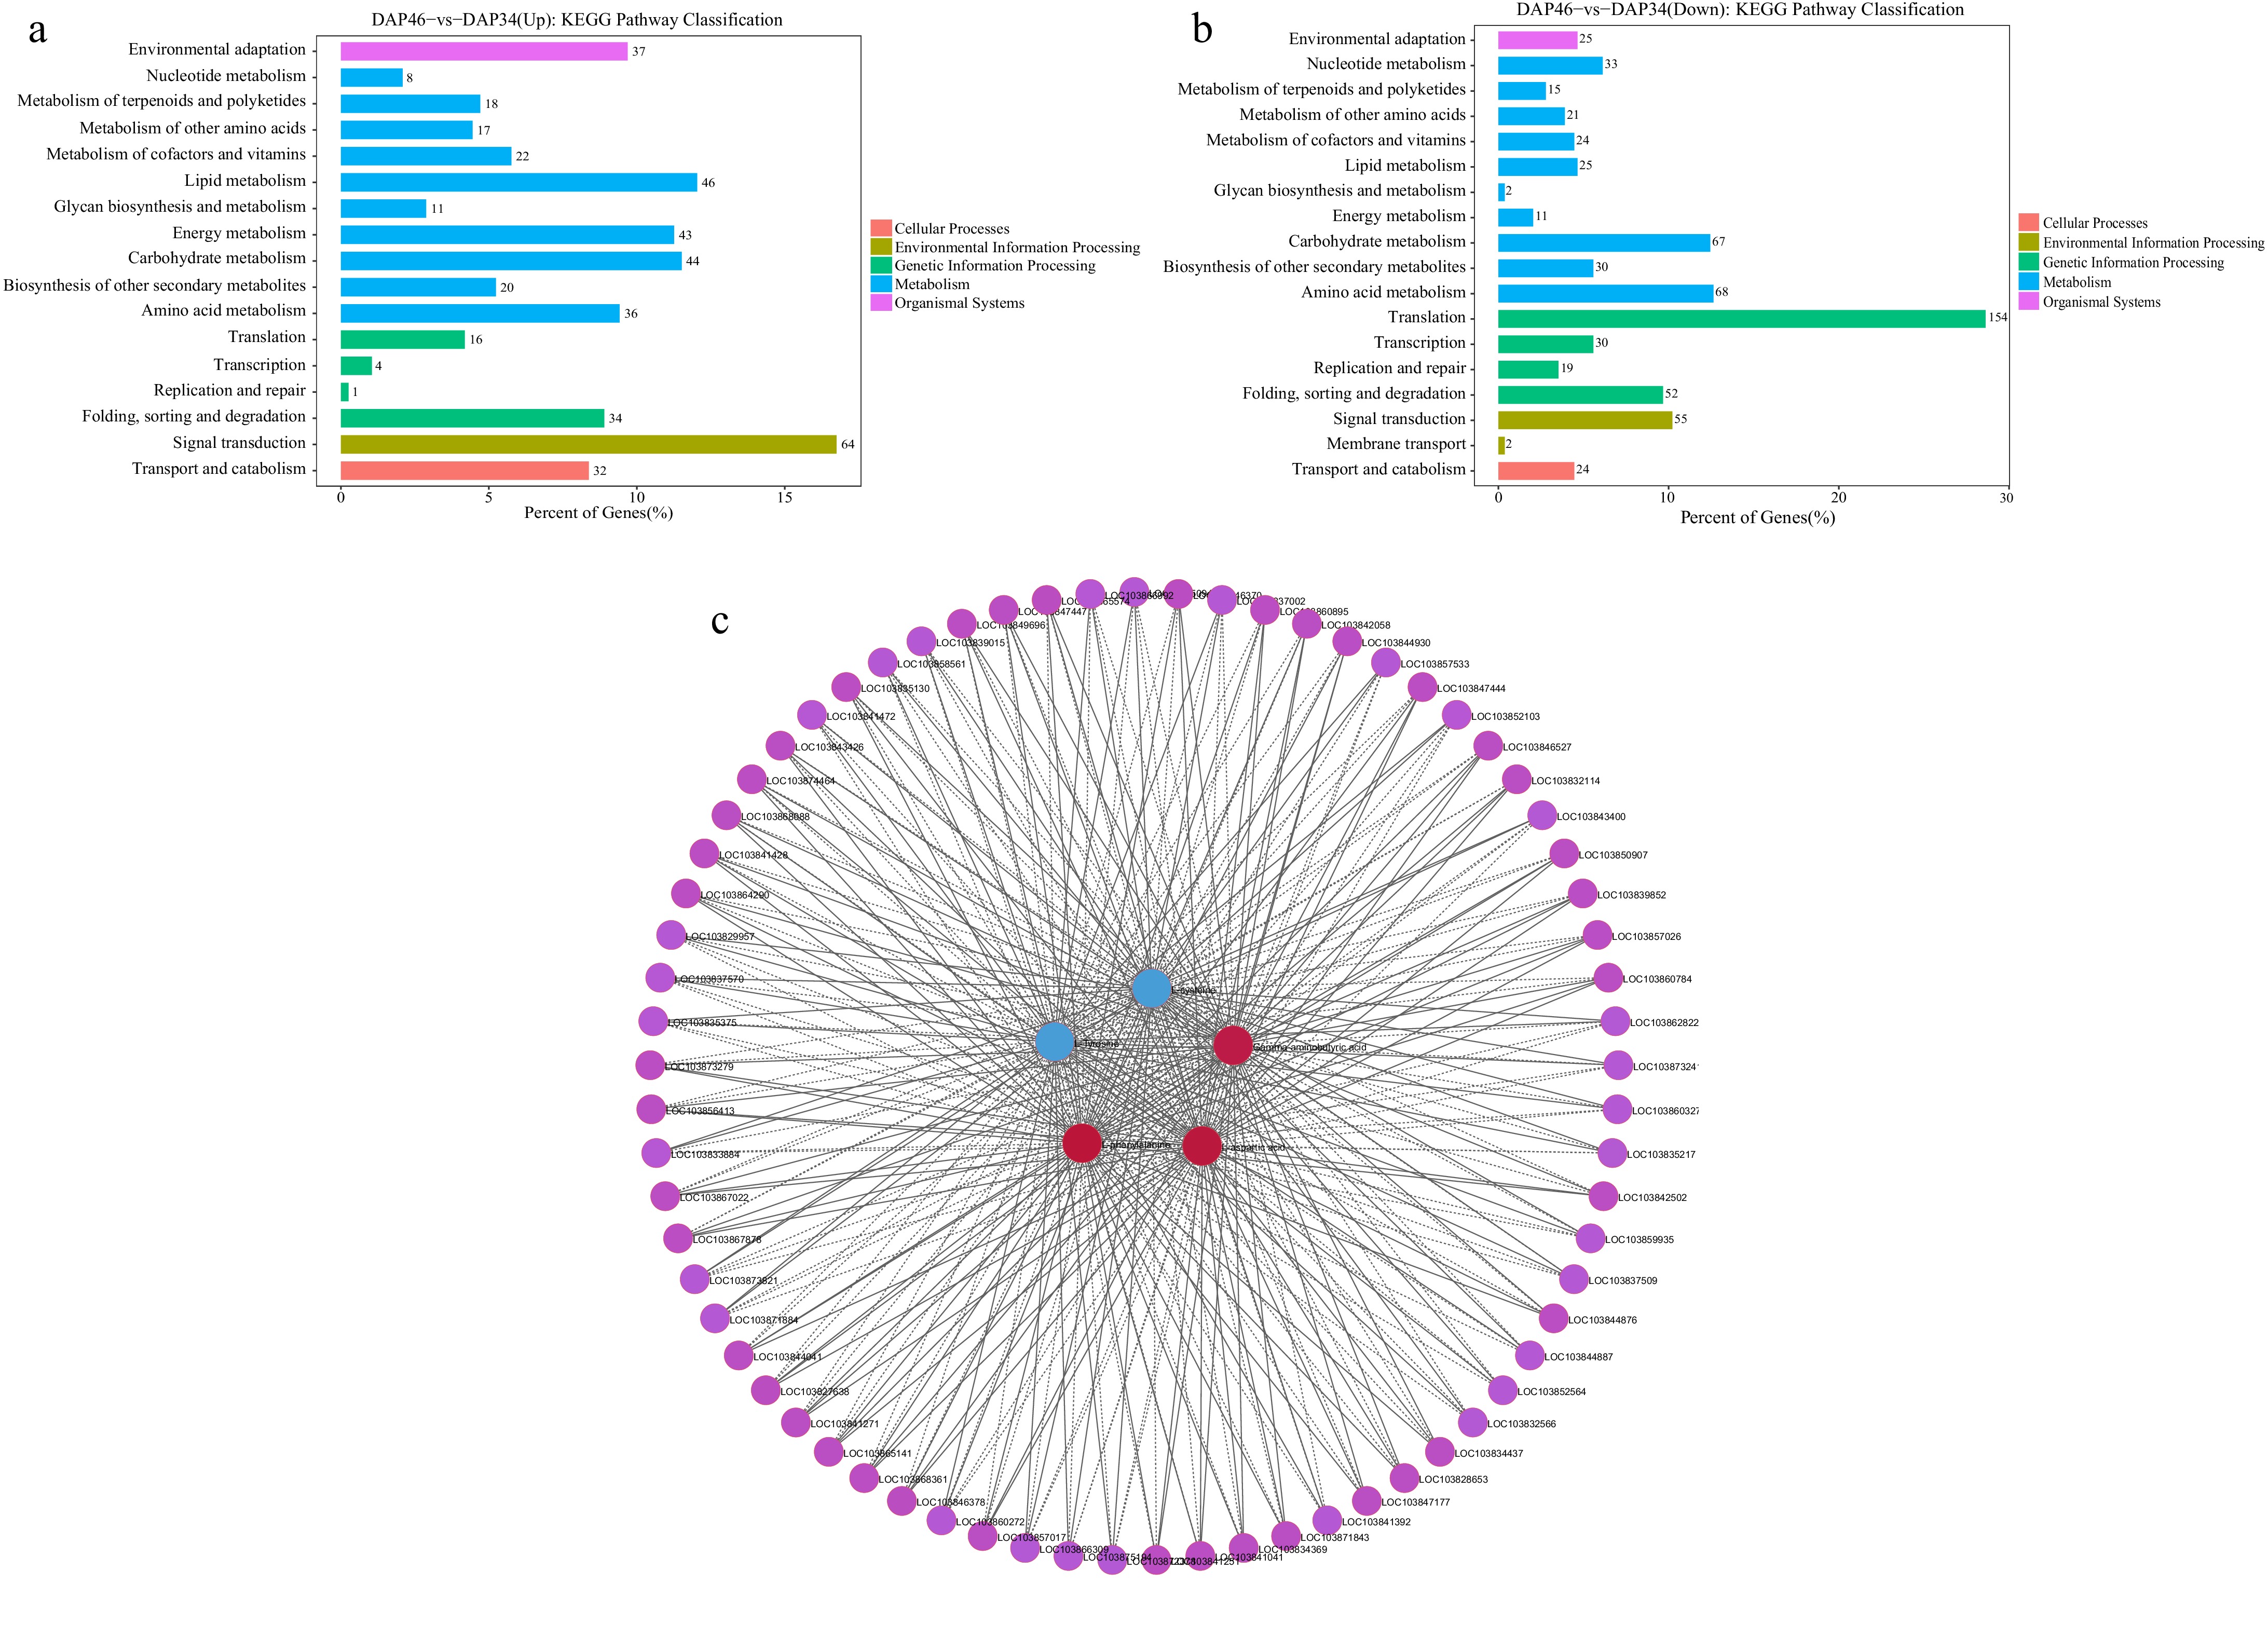
Figure 3.
Screening of genes related to key amino acids. KEGG pathway classification of (a) upregulated, and (b) downregulated genes. (c) Correlation network diagram illustrating between the relationships between five key amino acids and the top 500 genes with Fragments Per Kilobase of transcript per Million mapped reads (FPKM) value where p < 0.05.
To identify the genes regulating L-cysteine, L-aspartic acid, L-phenylalanine, L-tyrosine, and γ-aminobutyric acid, we screened the top 500 DEGs with the highest FPKM values from the transcriptome data. Using the Pearson correlation method, we calculated the correlation between these key amino acids and the DEGs, selecting those with a p-value < 0.05 for further analysis. This allowed us to construct a correlation network between the DEGs and the five amino acids (Fig. 3c). A total of 69 DEGs were found to be significantly correlated with the key amino acids. Among these, seven genes, namely BcSAHH2 (adenosine homocysteine enzyme 2), BcACS6 (1-aminocyclopropane-1-carboxylic acid synthase 6), BcCAT2 (catalase 2), BcPAL1 (phenylalanine ammonia lyase 1), BcPAL2 (phenylalanine ammonia lyase 2), BcP5CSB (δ-1-pyrroline-5-carboxylic acid synthase B), and two BcTHI1 (thiazole synthetase 1), were annotated to the 'amino acid metabolism' pathway (Supplementary Fig. S4). Among these genes, BcACS6 exhibited a significantly higher FC compared to the other DEGs (Supplementary Table S6). Therefore, we selected the BcACS gene for subsequent verification.
Changes in relative expression levels and enzyme activity of BcACS6 in Wucai
-
Transcriptome analysis revealed that BcACS6 exhibited the most significant differential expression during the quality transformation of Wucai. To further investigate the role of BcACS6, we conducted quantitative reverse transcription (qRT)-PCR to determine its relative expression levels in the leaves of Wucai across five different developmental stages. The results indicated that BcACS6 expression initially increased and then decreased during 34 DAP to 46 DAP, peaked at 43 DAP, and then decreased by 46 DAP (Fig. 4a). To confirm whether the changes in BcACS6 expression have a functional impact, we measured the activity of ACS in Wucai leaves at 34 and 46 DAP. The results demonstrated that ACS enzyme activity at 46 DAP was significantly higher than that at 34 DAP (Fig. 4b). This suggests that the upregulated expression of BcACS6 enhances ACS enzymatic activity.
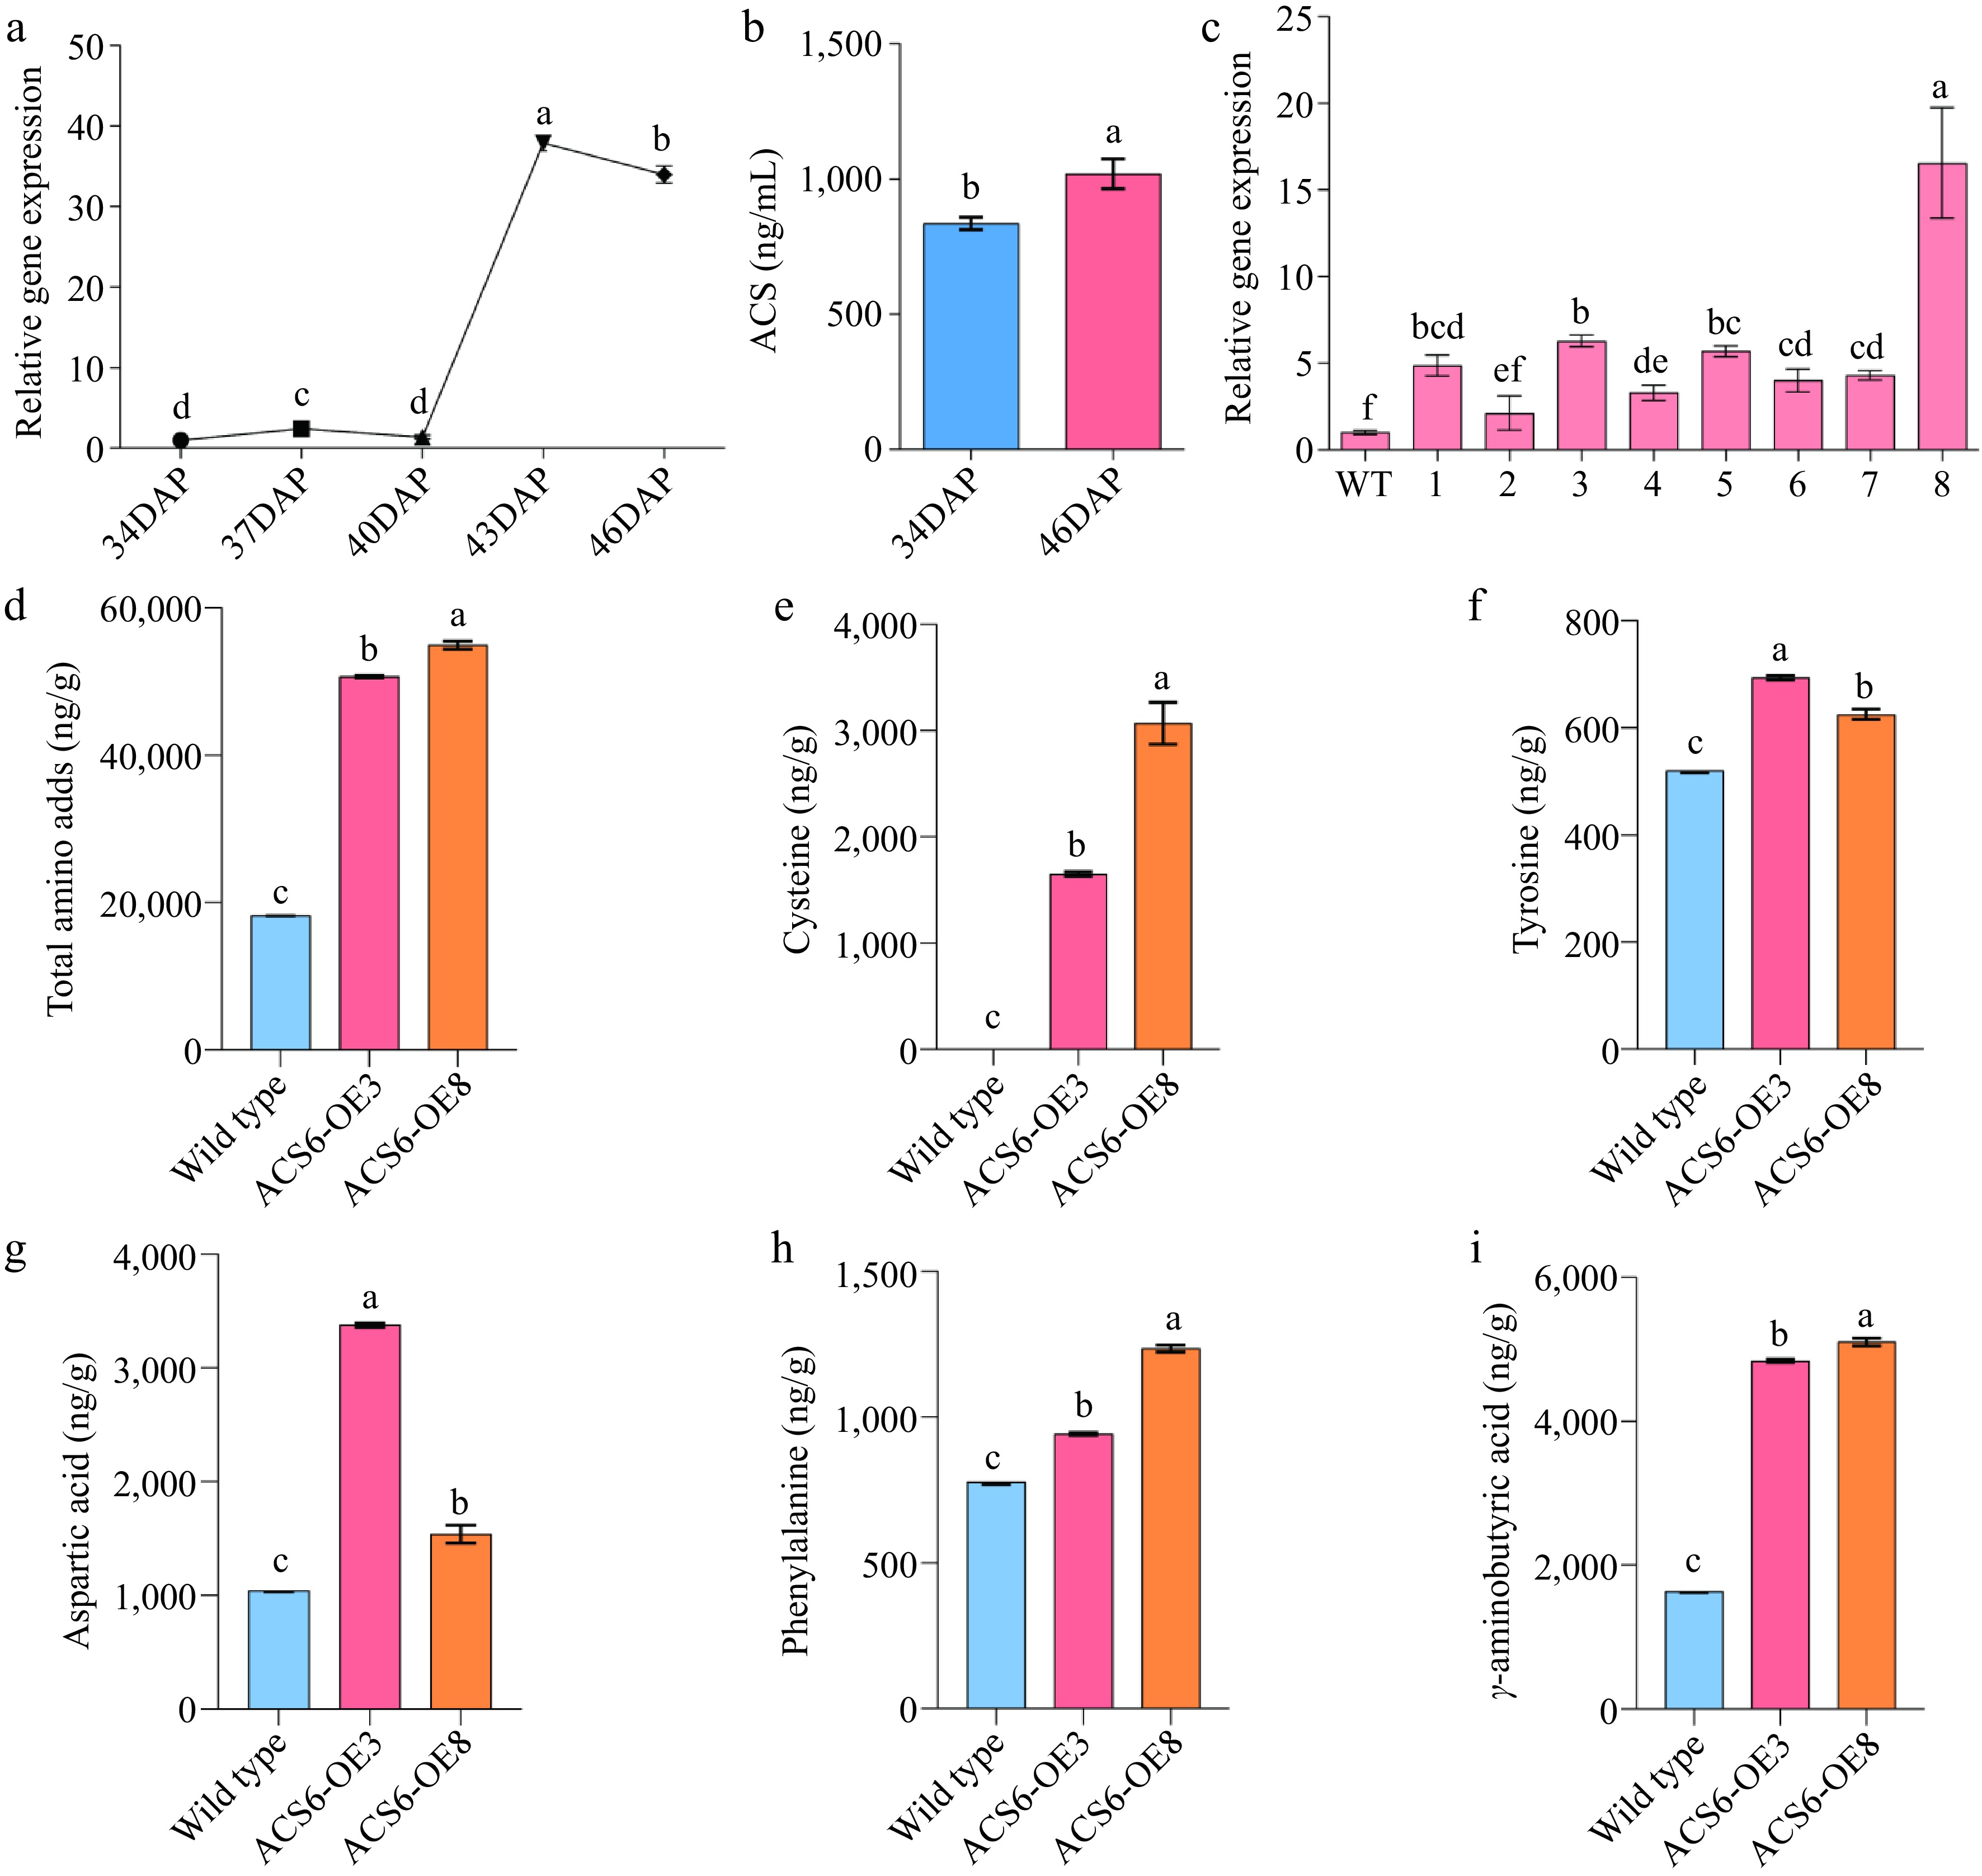
Figure 4.
Verification of BcACS6 overexpression. (a) Relative expression levels of the BcACS6 gene at different developmental stage. The relative expression level at 34 days after planting (DAP) was normalized to 1. (b) Assay results of 1-aminocyclopropane-1-carboxylic acid synthase (ACS) enzyme activity. (c) Relative expression levels of BcACS6 in T2 transgenic Arabidopsis thaliana. (d)−(i) Amino acid content analysis in wild-type and BcACS6-overexpressing Arabidopsis leaves.
Amino acid contents in transgenic Arabidopsis
-
The BcACS6 gene was successfully cloned and ligated into the pCAMBIA1305-35S vector to construct the overexpression vector pCAMBIA1305-35S-BcACS6 (Supplementary Fig. S5). This overexpression vector was then transformed into Arabidopsis thaliana. The harvested seeds were subsequently sown on 50 mg/L hygromycin medium for selection. Screening continued until pure transgenic Arabidopsis thaliana strains were obtained by the T3 generation.
To assess the efficacy of the transformation, the relative expression levels of T2 transgenic Arabidopsis lines were determined by qRT-PCR. Among these, lines OE#3 and OE#8, which exhibited significantly higher BcACS6 expression, were screened for further functional analysis (Fig. 4c).
The FAA content of dry leaves from both wild-type (WT) Arabidopsis lines and T3 transgenic Arabidopsis lines overexpressing BcACS6 was measured, indicating a significant increase in the content of most FAAs in the transgenic Arabidopsis lines. Specifically, the total amino acid content in WT leaves was 18,284.97 ng/g, whereas, in BcACS6-OE3 and BcACS6-OE8 leaves, it was significantly higher, at 50,661.81 ng/g and 54,920.08 ng/g, respectively. Further analysis of five key amino acids—L-cysteine, L-aspartic acid, L-phenylalanine, L-tyrosine, and γ-aminobutyric acid—revealed that their contents in BcACS6-OE3 and BcACS6-OE8 were significantly increased. Notably, L-cysteine was undetectable in WT (0 ng/g), but in BcACS6-OE3 and BcACS6-OE8, its content was significantly elevated to 1,652.77 ng/g and 3,070.94 ng/g, respectively (Fig. 4d−i). These findings align with the metabolomics data, where the contents of L-cysteine and L-tyrosine were upregulated and those of L-aspartic acid, L-phenylalanine, and γ-aminobutyric acid were downregulated before and after the quality transformation of Wucai. These results indicate that the upregulated expression of BcACS6 promotes the accumulation of L-cysteine and L-tyrosine.
BcACS6 interaction with BcCOR413PM1, BcDnaJ, and BcPCR8 in vitro
-
To identify potential interaction partners of BcACS6, we conducted a Y2H assay using the CDS of BcACS6 cloned into the pGBKT7 plasmid, creating a bait construct. Initially, we performed self-activation detection to ensure the bait vector did not exhibit self-activating activity. The results confirmed that BcACS6 lacked self-activating (Fig. 5a), validating its suitability for Y2H library screening. Subsequently, the pGBKT7-BcACS6 plasmid was cotransformed with a yeast library plasmid into yeast competent cells, leading to the identification of 10 potential interacting proteins (Supplementary Table S7). The primers used are shown in Supplementary Table S8.
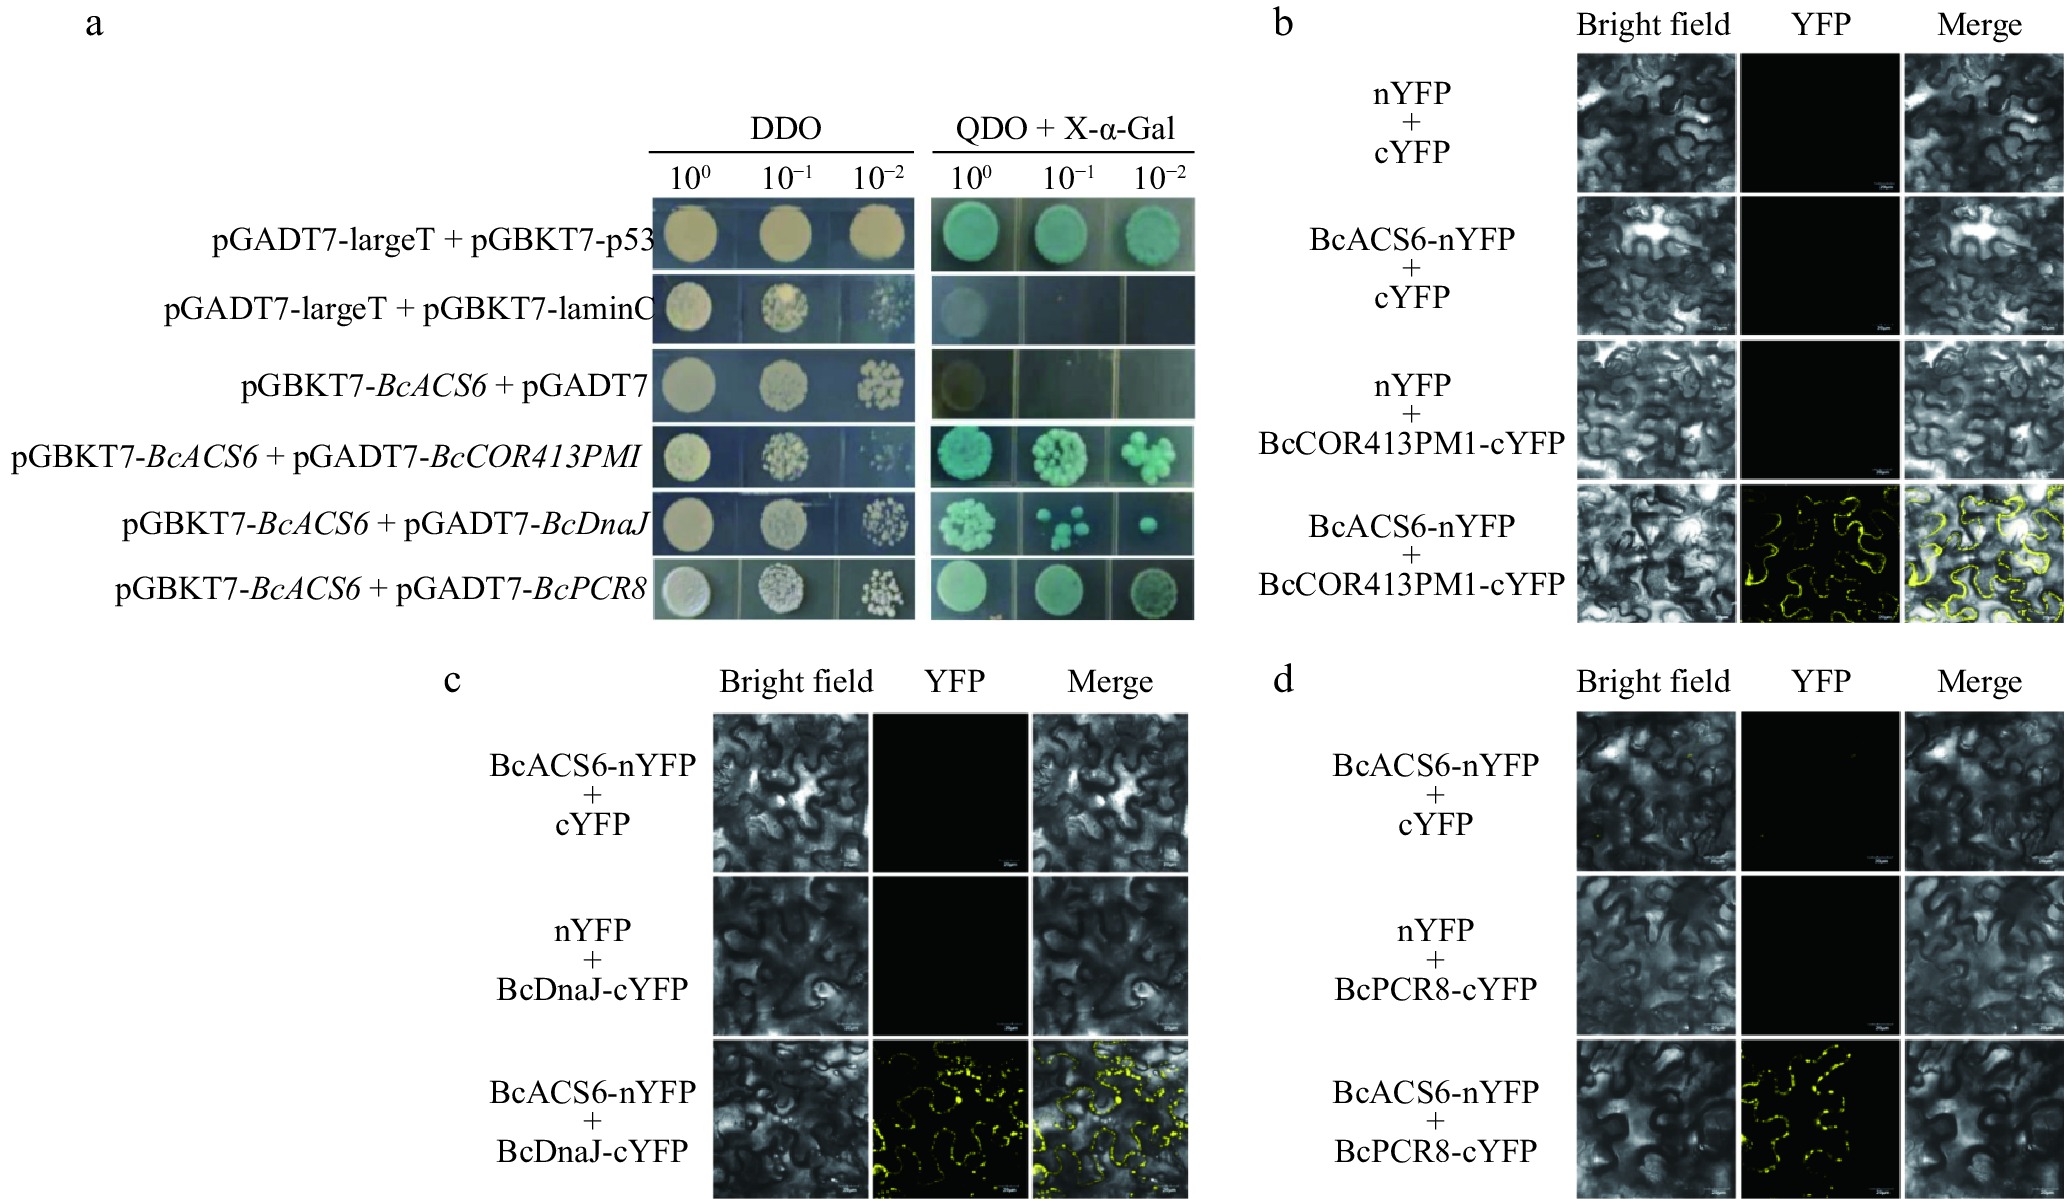
Figure 5.
Yeast two-hybrid and bimolecular fluorescence complementation (BiFC) verification. (a) Self-activation detection of the decoy vector and interaction protein verification. The positive control consisted of pGBKT7-53 + pGADT7-T, the negative control included pGADT7-Lam + pGADT7-T, and the self-activation verification group used pGBKT7-BcACS6 + pGADT7. DDO, SD medium lacking tryptophan and leucine (SD/-Trp/-Leu); QDO + X-α-gal, SD medium lacking tryptophan, leucine, histidine, and adenine (SD/-Trp/-Leu/-His/-Ade), supplemented with X-α-gal and aureobasidin A (AbA). Transformed yeast cells were spotted at 10−1 dilution on selective media. (b) BiFC assay showing interaction between BcACS6 and BcCOR413PM1 in Nicotiana benthamiana leaves. (c) BiFC assay showing interaction between BcACS6 and BcDnaJ in N. benthamiana leaves. (d) BiFC assay showing interaction between BcACS6 and BcPCR8 in N. benthamiana leaves. BcACS6, BcCOR413PM1, BcDnaJ, and BcPCR8 were fused with either the C- or N-terminus of yellow fluorescent protein (designated as cYFP or nYFP, respectively). Bright field, white light; YFP, YFP fluorescence; merge, combined signal of YFP and white light.
To validate the interactions identified in the Y2H screen, we cloned the CDS of these 10 potential interacting proteins into pGADT7 plasmid and cotransfected them with the pGBKT7-BcACS6 plasmid into yeast competent cells (Y2H). The interaction verification results confirmed that BcACS6 interacts specifically with BcCOR413PM1, BcDnaJ, and BcPCR8 (Fig. 5a).
To eliminate the possibility of false positives, we employed a BiFC assay to further verify these protein–protein interactions. The constructs pSPYNE-BcACS6, pSPYCE-BcCOR413PM1, pSPYCE-BcDnaJ, and pSPYCE-BcPCR8 were constructed and transformed into Agrobacterium tumefaciens strain GV3101. These constructs were then infiltrated into the leaves of N. benthamiana for transient expression. Yellow fluorescence signals were detected in the leaves cotransformed with pSPYNE-BcACS6 + pSPYCE-BcCOR413PM1, pSPYNE-BcACS6 + pSPYCE-BcDnaJ, and pSPYNE-BcACS6 + pSPYCE-BcPCR8 (Fig. 5b–d). These results conclusively demonstrate that BcACS6 interacts with BcCOR413PM1, BcBcDnaJ, and BcPCR8 in N. benthamiana.
-
Previous research on Wucai quality has predominantly focused on carbohydrates and carbohydrate derivatives[18]. However, a comprehensive understanding of key flavor substances and regulatory factors is crucial for understanding and enhancing vegetable quality. This study utilized an extensive targeted metabolomics approach, combining LC-MS/MS and GC-MS/MS, to investigate the changes in FAAs before and after the quality transformation of Wucai. Our LC-MS/MS analysis identified a total of 650 DAMs, while GC-MS/MS analysis revealed a total of 111 DAMs. Among these, 15 flavor amino acids exhibited significant differences, with four amino acids showing significant upregulation and 11 displaying significant downregulation.
Flavor is a multifaceted attribute[19], influenced by the composition and concentration of amino acids[20]. In related research, strawberry flavor is determined by sugars (such as glucose, fructose, and sucrose), certain FAAs (such as valine, leucine, and isoleucine), and aroma volatile metabolites[21]. Similarly, in peaches, amino acids significantly influence taste[22]. Peaches with low concentrations of major amino acids may taste bland, yet this does not necessarily detract from their overall flavor profile. On the contrary, high concentrations of certain amino acids, particularly asparagine, and arginine, can negatively impact the taste, leading to a less desirable flavor profile. By integrating widely targeted metabolomics with specific analyses and sensory data on flavor-related compounds[23], this study provides new insights into how Wucai's metabolic profile correlates with its sensory quality. The electronic tongue, which measures flavor responses, is closely related to the chemical composition of fruits and vegetables. It effectively distinguishes flavor differences, such as those observed between betaine-treated and controlled peach fruits during low-temperature storage. Through correlation analysis of metabolic profiles and electronic tongue responses, previous research has demonstrated that total soluble solids, organic acids, and certain FAAs significantly influence peach flavor[24].
In this study, PCA of the electronic tongue response values was employed to identify the primary taste attributes before and after the quality transformation of Wucai, which were determined to be saltiness, astringency, and umami. Correlation analysis further revealed that the differences in umami, astringency, and saltiness during the quality transformation were primarily attributed to cysteine; aspartic acid; phenylalanine, tyrosine, and γ-aminobutyric acid, respectively. These findings offer new insights into the flavor-related compounds of Wucai, advancing our understanding of its sensory quality.
ACS plays a pivotal role as a key enzyme in ethylene biosynthesis[25], which is linked to the regulation of amino acid metabolism in plants. The interaction between ethylene and amino acids has been well-documented, with studies highlighting that amino acids are involved in the modulation of ethylene production[26,27], and conversely, ethylene regulates the production of amino acids[28]. In tomato, for example, L-arginine and L-cysteine have been shown to inhibit ripening-related ethylene production by suppressing the activity of key enzymes crucial for ethylene biosynthesis, thereby delaying the postharvest ripening process[29]. Similarly, in strawberry, Ethephon treatment increased the concentration of 11 of the 19 FAAs in mature fruits, among which green and white fruits had the greatest effect. A total of 41 volatile compounds were significantly correlated with 14 amino acids[30]. In this study, we determined the expression pattern of the ACS regulatory gene BcACS6 and assessed ACS enzyme activity at different developmental stages of Wucai. The findings revealed that BcACS6 expression was significantly upregulated at 46 DAP compared to that at 34 DAP, which correlated with a significant increase in ACS enzyme activity. This indicates that BcACS6 may promote the accumulation of L-cysteine and L-tyrosine through the ethylene signaling pathway, ultimately influencing the flavor and quality of Wucai.
Temperature is known to influence the expression of ACS genes[31]. For instance, in late-maturing pear varieties, Pc-ACS1a transcripts accumulate throughout cold treatment and are co-expressed with Pc-ACS2a during the maturation of cold-dependent varieties[32]. In the present study, we used an artificial climate growth chamber to simulate the natural growth environment of Wucai, adjusting the temperature from 3 to 0 °C at 43 DAP to simulate external conditions. The relative expression level of BcACS6 was determined using qRT-PCR, revealing that its expression initially increased from 34 DAP to 40 DAP, peaked significantly at 43 DAP, and then decreased by 46 DAP. We hypothesize that the significant increase in BcACS6 expression at 43 DAP was triggered by the low-temperature environment. Therefore, it is plausible that during the quality transformation of Wucai, the cold-induced upregulation of BcACS6 led to enhanced ethylene production, which in turn promoted vegetative growth and altered the content of flavor amino acids, ultimately affecting the overall quality of Wucai.
Cold-regulated proteins (CORs) are plant lipid-transfer protein homologs that play a critical role in stabilizing membranes during freezing[33]. The expression of cold-responsive genes is integral to the process of plant cold acclimation[34]. COR413-PM1 is a novel multi-transmembrane cold-regulated protein[35] that has been shown to significantly contribute to freezing tolerance in Arabidopsis thaliana; mutants lacking COR413-PM1 experience greater damage to the cell membrane system under freezing temperatures[36]. There is evidence suggesting a correlation between amino acids and CORs. For example, leucine-rich repeat receptor-like kinase (LRR-RLK) facilitates the accumulation of proline through the C-repeat binding factor (CBF) pathway, enhancing cold tolerance in plants[37]. Additionally, amino acid biosynthesis may positively regulate cold resistance in tea plants, with arginine potentially enhancing cold tolerance by activating the polyamine synthesis pathway and the CBF–COR regulatory pathway under low-temperature stress[38]. In alfalfa, the transcriptional levels of two COR genes, cas15 and GaS, have been shown to be strongly upregulated during autumn hardening, accompanied by an increase in the concentrations of cryoprotectant sugars and amino acids such as proline, asparagine, and arginine, which improve frost resistance[39]. In this study, the interaction between BcACS6 and BcCOR413-PM1 protein suggests that the accumulation of amino acids in Wucai may be related to low temperatures, thereby influencing the overall quality of Wucai.
PCR8 (plant cadmium resistance protein 8) is known to enhance plant resistance to Cd[40], a highly toxic pollutant that poses significant risks to human health[41]. Cd exposure has been linked to neurotoxicological and behavioral changes in both human and experimental animal models[42]. The accumulation of Cd in plant-derived foods is primarily due to the absorption of Cd from contaminated soils[43]. Studies have shown that the accumulation of amino acids can improve plant resistance to heavy metal stress. For instance, the overexpression of BcaSOD1 gene in alfalfa has been found to enhance Cd tolerance by promoting the expression of arginine synthesis genes[44]. Similarly, cysteine-rich proteins have been shown to confer Cd tolerance in both yeast cells and plants[45,46]. In the present study, the upregulated expression of BcACS6 was associated with the accumulation of L-cysteine and L-tyrosine and its interaction with the BcPCR8 protein, which may play a regulatory role in the resistance of L. chinensis to Cd stress.
DnaJ is a typical member of the HSP40 (heat shock protein 40) family, characterized by a J domain, a G/F-rich domain, a CR-type zinc finger containing four repeats of the CxxCxGxG motif, and a substrate-binding C-terminal domain[47,48]. The classical DnaJ protein functions as a co-chaperone, collaborating with HSP70 to maintain protein homeostasis[49]. The evolutionarily conserved Hsp40/DnaJ protein plays a key role in various cellular processes by stimulating the ATP enzyme activity of the chaperone Hsp70 protein, including protein folding and unfolding, translocation, synthesis, and degradation[50,51]. ATP hydrolysis induces a conformational change in Hsp70, transitioning it from an open state characterized by high substrate association and dissociation rates to a closed state with reduced substrate exchange rates[52]. This conformational cycle is regulated by co-chaperones such as DNAJ family members (also known as Hsp40s) that stimulate ATP hydrolysis[53,54]. The Hsp40/DNAJ protein modulates Hsp70 activity by stabilizing its expression[55,56]. In this study, the interaction between BcACS6 and BcDnaJ suggests that BcACS6 may be involved in protein synthesis and degradation processes regulated by the DnaJ protein.
-
This study employed GC-MS/MS and LC-MS/MS-based targeted metabolomics to investigate the changes in FAAs before and after the quality transformation of Wucai. Additionally, electronic tongue analysis was utilized to determine the variations in primary taste attributes before and after the quality transformation, leading to the identification of key amino acids influencing this transformation. By integrating these metabolomic findings with transcriptome analysis, the study suggests that the BcACS6 gene may regulate these key amino acids. Specifically, the upregulated expression of BcACS6 was found to promote the accumulation of L-cysteine and L-tyrosine, thereby influencing the overall quality of Wucai.
This research was financially supported by the Provincial Key Development Program for Basic Research of Anhui (2023z04020005), and the Natural Science Foundation of China Projects (32272703).
-
The authors confirm contribution to the paper as follows: study conception and design: Zhang W, Li G, Hou J, Wang W, Wu J, Chen G, Tang X, Wang C, Yuan L; data collection: Zhang W, Li G, Xiong M, Chen Q, Wang K, Zhao Z, Zhou L, Liu Y ; analysis and interpretation of results: Zhang W, Li G, Xiong M, Gao X; draft manuscript preparation: Zhang W. All authors reviewed the results and approved the final version of the manuscript.
-
The datasets generated during or analyzed during the current study are available from the corresponding author on reasonable request.
-
The authors declare that they have no conflict of interest.
-
# Authors contributed equally: Wenying Zhang, Guoliang Li, Mengnan Xiong
- Supplementary Table S1 Subclass analysis of differentially accumulated metabolites in LC-MS/MS.
- Supplementary Table S2 Subclass analysis of differentially accumulated metabolites in GC-MS/MS.
- Supplementary Table S3 Results from electronic tongue tests (The taste response value of Wucai in different periods).
- Supplementary Table S4 Contribution table of taste index of electronic tongue.
- Supplementary Table S5 Correlation analysis between electronic tongue response values and flavor amino acids.
- Supplementary Table S6 Table of candidate gene difference multiplier.
- Supplementary Table S7 Table of candidate gene difference multiplier.
- Supplementary Table S8 Primers used in this study.
- Supplementary Fig. S1 Volcano map of differentially accumulated metabolites (DAMs) identified through (a) liquid chromatography-tandem mass spectrometry (LC-MS/MS) and (b) gas chromatography-tandem mass spectrometry (GC-MS/MS) analysis.
- Supplementary Fig. S2 Heat maps of amino acids, polypeptides, and analogues detected by (a) LC-MS/MS and (b) GC-MS/MS.
- Supplementary Fig. S3 Heatmap of 104 differentially expressed genes annotated to the "amino acid metabolism" pathway.
- Supplementary Fig. S4 Venn diagram showing the overlap between amino acid metabolism genes and significantly related genes. In panel, yellow-colored genes are significantly associated with amino acid metabolism, while green-colored genes are significantly associated with the five key amino acids (p < 0.05).
- Supplementary Fig. S5 Polymerase chain reaction amplification of BcACS6 (Note: M2000 denotes the D2000 DNA Marker; the above panel shows the cloned BcACS6 gene fragment from Wucai).
- Copyright: © 2025 by the author(s). Published by Maximum Academic Press, Fayetteville, GA. This article is an open access article distributed under Creative Commons Attribution License (CC BY 4.0), visit https://creativecommons.org/licenses/by/4.0/.
-
About this article
Cite this article
Zhang W, Li G, Xiong M, Chen Q, Gao X, et al. 2025. BcACS6 overexpression promotes the accumulation of L-cysteine and L-tyrosine and improves the quality of Wucai. Vegetable Research 5: e008 doi: 10.48130/vegres-0025-0003 

BcACS6 overexpression promotes the accumulation of L-cysteine and L-tyrosine and improves the quality of Wucai
- Received: 02 October 2024
- Revised: 22 November 2024
- Accepted: 06 January 2025
- Published online: 21 March 2025
Abstract: At present, the research on the quality of Wucai (Brassica campestris L. ssp. chinensis var. rosularis Tsen et Lee.) is still in its infancy. The content and type of amino acids play a pivotal role in determining the quality of Wucai. This study employed widely targeted metabolomics technology to examine the changes in metabolites associated with the quality transformation of Wucai, identifying amino acids as prominent differentially accumulated metabolites during this process. Electronic tongue analysis revealed that the primary taste attributes of Wucai before and after quality transformation are saltiness, astringency, and umami. To elucidate the relationship between amino acid composition and taste, we analyzed the correlation between electronic tongue response values and the reaction intensity data of flavor amino acids. The results showed that the absolute value of the correlation coefficient was highest between L-cysteine and umami, as well as between astringency and L-aspartic acid. Moreover, the values for L-phenylalanine, L-tyrosine, and γ-aminobutyric acid with saltiness were identical and surpassed those for all other amino acids. Transcriptomic analysis further revealed that BcACS6 was significantly positively correlated with changes in amino acid content, and its overexpression in Arabidopsis significantly increased the content of five amino acids associated with the primary taste attributes of Wucai, before and after its quality transformation. Additionally, BcCOR413PM1, BcBcDnaJ, and BcPCR8 were found to interact with BcACS6, suggesting that BcACS6 may be involved in protein synthesis and degradation during low-temperature acclimation, thereby regulating amino acid content and influencing flavor development in Wucai.
-
Key words:
- Wucai /
- Amino acids /
- Electronic tongue /
- Functional verification /
- Protein interaction