ARTICLE   Open Access    

Clinicopathological features and prognostic significance of SYT8 in patients with colorectal cancer who received curative surgery

  • # Authors contributed equally: Jin Zhu, Jiarong Shang

More Information
  • To clarify the clinicopathological and predictive significance of SYT8 expression in patients with colorectal cancer (CRC) who underwent radical tumor resection. The demographic, clinicopathologic, survival outcomes, and SYT8 expression information in CRC patients were extracted from The Cancer Gene Atlas (TCGA) databases. Then we assessed the diagnostic value of SYT8 and determined the underlying prognostic factors of PFI and OS. The SYT8 core genes were identified online based on the Kaplan-Meier Plotter database, and prognostic information was obtained for online analysis. To validate the above results, we retrospectively analyzed 153 CRC patients, and collected their clinicopathological, demographic, and survival information. The clinicopathological features and prognostic value of SYT8 were analysed in patients with colorectal cancer. In total, 643 CRC patients were included from the TCGA database. SYT8 was significantly overexpressed in CRC tissues compared to adjacent tissues (0.84 ± 0.79 vs 0.28 ± 0.30, p < 0.01). ROC curve results indicated that SYT8 performed a satisfactory diagnostic value in CRC (AUC: 0.863). Additionally, SYT8 was an independent prognostic factor affecting patients' OS (p = 0.01) instead of PFI. The results of retrospective validation demonstrated that SYT8 expression is one of the independent prognostic factors to OS (p < 0.05). Moreover, SYT8 expression was positively correlated with lymph node metastasis. SYT8 overexpressed in CRC tissues and could be applied as a diagnostic and prognostic biomarker in these patients after curative surgery.
  • Polyploidy is widespread in plants for driving plant evolution, adaptation and biodiversity[1]. At least 50% of angiosperms are polyploid[2], including many important cultivated fruit crops, for instance, kiwifruit (hexaploid)[3], banana (triploid)[4] and strawberry (octoploid)[5]. Among fruit crops, most polyploid plants have properties of large fruit size, good quality and stronger disease resistance[6,7]. Most of the extant polyploid plants were selected from spontaneous mutations in seedlings or clones, with a low mutation rate of 0.3%[8,9]. Artificial induction of polyploid breeding is an efficient strategy to accelerate the breeding process. Polyploid induction efficiency depends on several factors, including materials types, the types and concentration of chemical inducer, and induction time[10,11]. At present, colchicine is the most widely applied and effective chemical inducer to induce polyploidy[12], and it has been successfully applied in many fruit trees as the materials of explants, such as apple[13], banana[14], pomegranate[15] and citrus[16].

    Pear belongs to the genus Pyrus in the family of Rosaceae, which is also one of the most economically important fruit crops cultivated in more than 50 countries[17]. Pear fruit is a favorite of consumers for its delicious taste. Since 1982, the chromosome numbers of more than 400 pear cultivars have been observed, and more than 20 polyploid cultivars have been found[18,19]. Compared to diploid plants, tetraploid pear cultivars have larger fruits and most of them are highly productive. Breeding high-yielding pear cultivars is a major goal of pear breeding. Like most fruit trees, pear polyploid breeding is also mainly achieved by explants[20]. Currently, explants of the pear cultivar of 'Fertility' and 'Hosui' have been reported to induce tetraploid pear plants by the treatment of colchicine[20,21]. Compared with explants, the use of seeds as the induced materials have the advantage of producing multi-genotypic homozygous polyploids with multiple heterozygosity and shorter time to obtain polyploidy[2224]. Recent studies have shown that the tetraploids were successfully obtained from the diploid wild species 'Duli' pear (Pyrus betulaefolia) by chemical mutagenesis[25]. However, the induction efficiency of cultivated species pear polyploidy through the seeds treated with colchicine remain largely unknown.

    'Dangshansuli' (Pyrus bretschneideri, 2n = 34), with an annual yield of more than 4 million tons, is the most important ancient local commercial pear cultivar, and it has been cultivated in China for more than 500 years[26]. To establish an effective method for inducing polyploid plants of pear, the seeds from the mature fruits of 'Dangshansuli' were firstly removed of the seed coat, and then treated with colchicine at different concentrations for different temporal gradients. Finally, the chromosome ploidy level of all the germinated seeds was detected by flow cytometry. In order to select abundant variants for domestication and further breeding programs, we also compared the physiological indices of diploids and tetraploids after transplanting.

    'Dangshansuli' was obtained from the orchard in Gaoyou, Jiangsu, China. All pear trees were managed according to standard horticultural practices (fertilization, pruning, irrigation, and pest and disease control). All mature fruits were picked and transported promptly to the laboratory. Then, all pear seeds were collected.

    After manually removing the seed coat, the seed kernels were placed in plastic petri dishes with a wet filter paper at the bottom. Each petri dish contained 50 seeds. The plant materials were incubated at 25 ± 1 °C, under a 16/8 h (light/dark) photoperiod. As shown in Fig. 1, the seeds with the seed coat removed were immersed in colchicine solution at final concentrations of 0.1%, 0.5% and 1% (w/v) for 12 h, 24 h and 48 h, respectively. The control groups were treated with sterile distilled water. The seeds were then washed five times with water and cultured on plastic petri dishes for 13 d. Plants were transplanted into mixed soil (organic matter: vermiculite = 1: 1) for subsequent experiments.

    Figure 1.  Flow-process diagram of inducing polyploidy from pear seeds treated with colchicine. (a) Pear seeds; (b) pear seeds soaking in colchicine solution; (c) seeds treated with colchicine solution; (d) seeds spread in plastic Petri dishes; (e) seedlings; (f) seedlings transplanted into soil; (g) plant growth; (h) collected leaf samples; (i) chopped leaves; (j) samples to be tested after centrifugation; (k) flow cytometry assay.

    Samples of 100 mg fresh leaves were collected, putting them into a glass Petri dish. Then, we added 1 ml of lysate, and chopped the leaves within 2 min. The mixture was filtered into a 2 ml centrifuge tube with a 300 mesh nylon filter sieve and centrifuged at 5,000 rpm for 4 min. One hundred μl of supernatant was obtained, 400 μl of lysate added, then vortexed and mixed, centrifugation was carried out once. Finally, we added 200 μl lysate, 500 μl Na2HPO4 solution, 50 μl RNaseA and 70 μl staining solution to avoid light staining for 5 min, and the ploidy level was detected by flow cytometry (CytoFLEX, Beckman Coulter, Inc., USA).

    The germination rate of investigated plants was based on the root growing up to 1 cm, and the germination rate of control and induced plants was calculated respectively. The formula was as follows:

    where, a is the number of seeds with roots exceeding 1 cm and b is the number of all seeds.

    From the 3rd to 5th leaves at the base of the plant, the length and width of the leaves were measured with a steel ruler and the leaf index was calculated. The formula was as follows:

    leaf index = leaf length/leaf width

    The upper epidermal leaf flesh of the fresh leaves placed on a clean slide were immediately scraped away with a one-sided blade, and the thin transparent lower epidermis was covered with a coverslip. Stomata were observed with an Olympus inverted fluorescence microscope (OLYMPUS PH0054, Tokyo, Japan). At least 10 view fields were assessed for each sample under 16 × 40 lense for counting stomatal density and measuring length, width and length-width ratio of guard cells.

    Three pear leaves in the same position from each plant were collected and cleaned of surface dirt. Then, 0.1 g leaves from both sides of the main vein were collected, and cut into pieces and placed in a 10 ml centrifuge tube, 2 ml of 85% ethanol solution was added, and wrapped with tinfoil. When the material completely turned white after 24 h, the chlorophyll content was tested using a Microplate Reader (Cytation3, BioTek, USA) and calculated using the formula from Arnon[27].

    Electron microscopy was performed as described previously[28]. Leaf pieces (4 × 4 mm) from one side of the main vein for each plant were excised using a blade, fixed in 2.5% glutaraldehyde. The dehydrated samples were attached to a sample stage with conductive tape and coated with gold particles using a Hitachi E-1045. The coated samples were examined using a Hitachi 4800 field emission scanning electron microscope.

    The surface area of pear leaf was quantified by ImageJ software[29]. Pear leaves cuticular wax was extracted according to the method of Li et al.[30]. Leaves were soaked in chloroform for 1 min under a fume hood. The wax-containing solvent was transferred to a vial, blow dried with a nitrogen blowing instrument (JHD001S, Shanghai Jiheng Industrial Co., Ltd., Shanghai, China).

    The components in the wax extracts were analyzed using the method of Wu et al [31]. The extracted samples dissolved with 1.2 mL chloroform were detected by gas chromatography-mass spectrometry (Bruker 450-GC, Bruker 320-MS) and a column (BR-5MS, 30 × 0.25 × 0.25). The carrier gas was helium at a flow rate of 1.2 mL/min. The parameters were as follows: inlet temperature, 280 °C; MS transfer line temperature, 280 °C; ion source temperature, 250 °C; quadrupole temperature, 150 °C; EI, 70 eV; scanning range, 50−650 m/z.

    The temperature increase procedure was as follows: initally50 °C for 2 min. Next, the temperature was increased to 200 °C at a rate of 40 °C/min for 2 min. Finally, the temperature was increased to 320 °C at a rate of 3 °C/min and held for 30 min.

    The chemical composition of cuticular wax was analyzed using the NIST 2013 Library. The cluster relationships of the wax composition data were determined via principal component analysis (PCA). Significance of the samples was tested using T-test. Data analysis was carried out using SPSS Statistics 25.0 and Microsoft Excel 2016. The data is shown as the means ± SD.

    The process of inducing polyploidy of pear using seeds could be divided into the following four steps: 1) use colchicine to soak 'Dangshansuli' seeds with seed coat removed (Fig. 1a, b); 2) grow the treated seeds in a Petri dish with wet filter paper at the bottom (Fig. 1c, d); 3) transplant the seedings into the soil (Fig. 1e, f); 4) identify the ploidy of plants (Fig. 1gk). To find not only the most suitable concentration of colchicine but also the suitable time for the treatment of the seeds, nine experimental groups (0.1% colchicine for 12 h, 24 h, 48 h; 0.5% colchicine for 12 h, 24 h, 48 h; 1% colchicine for 12 h, 24 h, 48 h) were set up, and we found that the most effective induction treatment was 0.1% colchicine for 12 h (tetraploid rate, 6.0%) (Table 1). In addition, we also observed that the survival rate of the colchicine treated seed was significantly lower than that of the control groups. As shown in Fig. 2, all seeds in the control groups survived, and the seeds were germinated and the length of the radicle was rapidly extended within 10 d (Fig. 2a). On the contrary, the germination rate of seeds was significantly decreased (0%−46%) and the radicle was extremely short (Fig. 2e) in the treated groups. The germination rate was only 8% and the radicle was difficult to develop into taproot after treating with 1% colchicine for 24 h (Fig. 2d). When treated with 0.5% and 1.0% colchicine for 12 h, 24 h and 48 h, respectively, compared to the control group, the plant height and the number of true leaves decreased by 56.00%−80.80% and 43.75%−70.88%, respectively (Table 1). The most significant phenotype was obtained by treating with 0.5% colchicine for 48 h, with the shortest plant (1.20 cm) and the lowest true leaf number (2.33) (Table 1). This result indicates that the inhibitory effect of colchicine was not proportional to the concentration and duration of colchicine.

    Table 1.  Mutagenic effect of colchicine concentration and treatment time on ‘Dangshansuli’ seeds with seed coat removed.
    Concentration
    (%)
    Number
    of seeds
    Time
    (h)
    Survival
    rate (%)
    Plant
    height/cm
    True leaf
    number
    Number of tetraploidTetraploid
    rate (%)
    Control5048866.25 ± 2.45a8.00 ± 1.26a00
    0.15012285.20 ± 1.94a5.83 ± 1.17b36
    5024406.65 ± 2.22a7.83 ± 0.98a00
    5048163.28 ± 2.30b4.00 ± 1.41cd24
    0.55012241.72 ± 0.42b3.83 ± 1.17cd12
    502482.75 ± 0.96b4.50 ± 1.29c12
    504841.20 ± 0.20b2.33 ± 0.58e00
    15012181.38 ± 0.32b3.33 ± 0.82cde24
    502482.23 ± 1.21b3.00 ± 1.41de12
    504800000
    Note: Statistical significance was determined using Student's t-test. Different letters indicate significant differences at the 5% level. Control: control group treated with water solution.
     | Show Table
    DownLoad: CSV
    Figure 2.  Seed germination performance of Dangshansuli’ in control and colchicine treatment groups. (a) Control group treated with water for 24 h; (b) 0.1% colchicine treatment for 24 h; (c) 0.5% colchicine treatment for 24 h; (d) 1.0% colchicine treatment for 24 h; (e) germination rate of 'Dangshansuli' seeds treated with colchicine at different concentrations and times.

    To identify the chromosome ploidy of each plant, we examined the peaks at different fluorescence intensities by flow cytometry (Table 1). The result showed that diploid plants only had a single peak at fluorescence intensity 200, whereas 10 plants treated with colchicine had a single peak at fluorescence intensity 400, indicating that colchicine can induce chromosome doubling of pear seeds, and these 10 plants should be tetraploid plants (Fig. 3ad, Table 1).

    Figure 3.  Analysis of ploidy levels and growth morphology of 'Dangshansuli' pear. Flow cytometry histograms for (a) diploid and (b), (c), (d) tetraploids. Top view of phenotype of (e) diploid plants and (f), (g), (h) tetraploid plants planted in soil for 60 d. (i) Lateral view of phenotype of diploid plants (first from the left) and tetraploid plants (second to fourth from the left) planted in soil for 60 d. (j) Plant height in diploid and tetraploid 'Dangshansuli' seedlings.

    It has been reported that the induced tetraploid could change the morphological characteristics of leaves[32]. Here, we also detected the differences of morphological characteristics of leaves and stomata between diploid and tetraploid 'Dangshansuli' seedlings. Our results showed that the size of tetraploid 'Dangshansuli' seedlings were significantly smaller than that of diploid seedlings (Fig. 3ei). Compared to diploid plants, tetraploid plants have shorter stem nodes, fewer number of true leaves and slower growth (Fig. 3i, j). The stomata of tetraploid 'Dangshansuli' seedlings were larger than those of diploid (Fig. 4ad). The stomata length, width and length to width ratio increased by 90.43%, 48.15% and 29.43% in the induced tetraploids (Fig. 4e, f), which indicating that the guard cells in tetraploid 'Dangshansuli' seedlings are longer and narrower in appearance (Fig. 4ad). In contrast, stomatal density, leaf length, leaf width and leaf shape index of tetraploid 'Dangshansuli' seedlings were reduced by 67.86%, 50.30%, 38.55% and 19.80% (Fig. 4g, h, i). Specifically, the leaf shape of tetraploid plants is oval with leaf shape index of 1.6, and the leaf shape of diploid plants are ellipse with a leaf shape index of 2.1 (Fig. 4i).

    Figure 4.  Leaf morphology and stomatal characteristics of diploids and tetraploids 'Dangshansuli' seedlings. Abaxial stomata in leaves of (a) diploid and (b) − (d) tetraploid 'Dangshansuli' seedlings; (e) the length and width of guard cells in diploid and tetraploid 'Dangshansuli' seedlings; (f) length/width ratio in diploid and tetraploid 'Dangshansuli' seedlings; (g), stomatal density in diploid and tetraploid 'Dangshansuli' seedlings; (h) length and width of leaf in diploid and tetraploid 'Dangshansuli' seedlings; (i) leaf shape index in diploid and tetraploid 'Dangshansuli' seedlings; (j) chlorophyll content in diploid and tetraploid 'Dangshansuli' seedlings. Data are the means ± SD of three replicates. P values were determined by student's two-tailed t-test (***P < 0.001; **P < 0.01; *P < 0.05).

    The determination of photosynthetic pigment content showed that chlorophyll a, chlorophyll b, and total chlorophyll content increased by 16.06%, 16.00% and 6.38% in the induced tetraploids, respectively. (Fig. 4j). Next, we observed the leaf surface of the plant by scanning electron microscopy. The epidermal cells with irregularly or polygonal-shaped in tetraploid are more densely than those of diploid plants (Fig. 5).

    Figure 5.  The magnification series of the scanning electron microscope images of leaf morphology in (a) − (c) diploid and (d) − (f), (g) − (i), (j) − (k) tetraploid ‘Dangshansuli’ seedlings. Scale bars represent 100 μm (magnification 500×) in (a), (d), (g), (j), 20.0 μm (magnification 2.00 K×) in (b), (e), (h), (k) and 10.0 μm (magnification 5.00 K×) in (c), (f), (i), (l).

    To further compare the difference between diploid and tetraploid plants, we detected compounds of cuticular wax in the leaf epidermis and performed principal component analysis (PCA). In the PCA score plots, PC1 (46.7%) and PC2 (19.5%), explained 66.2% of the variation (Fig. 6a). Six samples were clearly separated into two groups according to different ploidy levels along PC1, which indicated that, compared to diploid plants, the coverage of cuticular wax compounds of in tetraploid plants substantially differed (Fig. 6a). Then, we focused on the analysis of 10 components of cuticular wax with significant differences between diploid and tetraploid, including four alkane components, two ester components, and four terpenoid components. Alkanes are important aliphatic compounds in the cuticular wax of pear leaves. Compared with diploid plants, the content of three odd carbon atom alkanes (pentacosane, 0.14 ± 0.05 μg/cm2, P = 0.007; heptacosane, 0.21 ± 0.05 μg/cm2, P = 0.009; and hentriacontane, 0.22 ± 0.03 μg/cm2, P = 0.030) decreased significantly in the leaf wax of tetraploid plants and the content of one even carbon atom alkane (hexacosane, 0.19 ± 0.03 μg/cm2) was increased (P = 0.043) significantly in the leaf wax of tetraploid plants (Fig. 6b). In addition, arachic acid benzyl ester (0.25 ± 0.03 μg/cm2, P = 0.004) and cycloartenol acetate (2.51 ± 0.78 μg/cm2, P = 0.006) content were also significantly increased in the tetraploid than diploid, while lanosteryl acetate (0.20 ± 0.09 μg/cm2, P = 0.009) and β-Sitosterol acetate (1.47 ± 0.22 μg/cm2, P = 0.009) content were significantly decreased than in diploids (Fig. 6b). Notably, specific wax compounds were only detected in tetraploid plants, such as 1-monolinolein (0.23 ± 0.05 μg/cm2) and γ-tocopherol (0.09 ± 0.02 μg/cm2) (Fig. 6b).

    Figure 6.  PCA and 10 differentially expressed wax components in diploid and tetraploid 'Dangshansuli' seedlings. (a) PCA of the chemical compositions of the cuticular wax in diploid and tetraploid 'Dangshansuli' seedlings; (b) differentially expressed wax components in diploid and tetraploid 'Dangshansuli' seedlings. Data are the means ± SD of three replicates. P values were determined by student’s two-tailed t-test (***P < 0.001; **P < 0.01; *P < 0.05).

    The efficiency and toxicity of chemicals used for genome doubling are the successful key to induction of polyploidy. The polyploidy induction of seeds treated by colchicine solution has been reported in many flower crops, including Taraxacum kok-saghyz[32], Lilium rosthornii[33], Rosa chinensis[34] and Lavandula angustifolia[35]. In this study, we also successfully obtained polyploidy plants from pear seeds treated with colchicine in vitro. Our results showed that 0.1% colchicine treatment for 12 h was the best treatment condition for pear seeds, which can create the highest induction rate of 6%. The colchicine induction system varied among different species. For example, the seeds of Lilium rosthornii treated by 0.05% colchicine solution for 36 h could obtain the highest induction rate of 27.78%[33]; and the highest efficiency (56.6% induction rate) was obtained by treating the seeds with a concentration of 0.1% colchicine solution for 48 h in Taraxacum kok-saghyz[32]. In addition, we found that in a certain range, with the increase of colchicine concentration, as well as exposure time, the induction efficiency was also positively increased, whereas when the threshold was exceeded, the survival rate of pear seedlings was significantly reduced (Table 1). Similar results have also been identified among other species, such as Taraxacum kok-saphyz[32], kiwifruit[36] and wolfberry[37]. This could be attributed to the highly toxic effect of colchicine in blocking spindle fiber production.

    Numerous reports have shown that the morphological and physiological characteristics, including stomatal cell size, stomatal density, leaf index, etc. have a relationship with the ploidy levels in many plant species[38,39]. In this study, significant morphological differences were observed between diploid and tetraploid plants. The first visible effect of early tetraploid plants induced by colchicine was delayed growth[40]. Similar to the results reported in potato and citrus, tetraploid plants have shorter plant height than diploid plants[41]. This may be due to the effect of somatic cell doubling or colchicine residues damaging new buds[42].

    The stomatal trait has been widely used as a ploidy selection trait. Similar to the results of ploidy level and stomatal characteristics reported in Lilium rosthornii[33], Buddleja lindleyana[43] and Hemerocallis[24], our study also found that stomatal size is positively correlated with ploidy level, whereas the stomatal density is negatively correlated with ploidy level. In addition, leaf length, leaf width and leaf shape index were decreased in tetraploid plants than those of diploid 'Dangshansuli' seedlings (Fig.4h, i). Similar to the results identified in Pyrus communis[1,20]. Previous studies have found that the leaves of the confirmed tetraploid plants were thicker and darker green compared to diploid plants, which was likely to be accompanied by an increased chlorophyll content[44]. By detecting the chlorophyll content of the leaves of diploid and tetraploid plants at the same stage, and found that the chlorophyll content of leaves of tetraploid plants was significantly higher than that of diploid plants, similar to results identified in Lycium ruthenicum and Persian poppy[45,46], which can also explain that tetraploid plants have stronger photosynthetic than diploid plants. Many studies show that a positive correlation between higher ploidy levels and secondary metabolite content has been established in artificially induced tetraploid plants. Similar with the results of Lilium rosthornii[33], Pfaffia glomerata[47], Dracocephalum moldavica[38] and Hyoscyamus reticulatus L.[48], we found that there were significant differences in wax composition between diploid and tetraploid in pear. Qualitative analysis results showed significant changes in the content of 10 wax components, including alkanes, esters, and terpenoids (Fig. 6). Previous studies have shown that changes in wax components and content affect plant stress tolerance. For example, increasing the content of C27, C29 and C31 alkanes enhances plant tolerance to drought[49]. Certain wax components, such as long-chain alkanes, were possibly used for host selection by insects[50,51]. Adding long-chain alkanes to sinigrin and cabbage homogenates can stimulate oviposition by the diamondback moth Plutella xylostella[52]. Therefore, we speculate that there are differences in resistance abilities such as insect resistance and drought resistance between tetraploid and diploid plants, which needs to be verified in subsequent studies.

    This study reported that the pear tetraploids were successfully induced from seeds of diploid 'Dangshansuli' pear with seed coats removed by colchicine treatment Appropriate colchicine concentration and exposure time are essential to increase the tetraploid induction rate. Compared to diploids, tetraploids show significant changes not only in morphoanatomical characteristics but also in secondary metabolites. For example, tetraploid plants have shorter stem nodes, fewer true leaves, larger stomata, longer and narrower guard cells, higher chlorophyll content, and denser irregular or polygonal-shaped epidermal cells than diploid plants. Ten components of cuticular wax with significant differences between diploid and tetraploid. These tetraploids can be used as useful materials for innovative germplasm resources.

    This research was supported by the Natural Science Foundation of Jiangsu Province (BK20221011), The National Natural Science Foundation of China (32202411), the China Postdoctoral Science Foundation (2022TQ0160), This research was supported by the Jiangsu Funding Program for Excellent Postdoctoral Talent (2022ZB338).

  • The authors declare that they have no conflict of interest.

  • [1]

    Siegel RL, Miller KD, Wagle NS, Jemal A. 2023. Cancer statistics, 2023. CA: A Cancer Journal for Clinicians 73:17−48

    doi: 10.3322/caac.21763

    CrossRef   Google Scholar

    [2]

    Siegel RL, Wagle NS, Cercek A, Smith RA, Jemal A. 2023. Colorectal cancer statistics, 2023. CA: a cancer journal for clinicians 73:233−54

    doi: 10.3322/caac.21772

    CrossRef   Google Scholar

    [3]

    Xi Y, Xu P. 2021. Global colorectal cancer burden in 2020 and projections to 2040. Translational Oncology 14:101174

    doi: 10.1016/j.tranon.2021.101174

    CrossRef   Google Scholar

    [4]

    Dekker E, Tanis PJ, Vleugels JLA, Kasi PM, Wallace MB. 2019. Colorectal cancer. Lancet 394:1467−80

    doi: 10.1016/S0140-6736(19)32319-0

    CrossRef   Google Scholar

    [5]

    Kim CH, Huh JW, Kim HR, Kim YJ. 2014. Prognostic comparison between number and distribution of lymph node metastases in patients with right-sided colon cancer. Annals of Surgical Oncology 21:1361−68

    doi: 10.1245/s10434-013-3426-3

    CrossRef   Google Scholar

    [6]

    Lebowitz JJ, Banerjee A, Qiao C, Bunzow JR, Williams JT, et al. 2023. Synaptotagmin-1 is a Ca2+ sensor for somatodendritic dopamine release. Cell Reports 42:111915

    doi: 10.1016/j.celrep.2022.111915

    CrossRef   Google Scholar

    [7]

    Haberman Y, Ziv I, Gorzalczany Y, Hirschberg K, Mittleman L, et al. 2007. Synaptotagmin (Syt) IX is an essential determinant for protein sorting to secretory granules in mast cells. Blood 109:3385−92

    doi: 10.1182/blood-2006-07-033126

    CrossRef   Google Scholar

    [8]

    Wolfes AC, Dean C. 2020. The diversity of synaptotagmin isoforms. Current Opinion in Neurobiology 63:198−209

    doi: 10.1016/j.conb.2020.04.006

    CrossRef   Google Scholar

    [9]

    Chapman ER. 2008. How does synaptotagmin trigger neurotransmitter release? Annual Review of Biochemistry 77:615−41

    doi: 10.1146/annurev.biochem.77.062005.101135

    CrossRef   Google Scholar

    [10]

    Tokuoka H, Goda Y. 2003. Synaptotagmin in Ca2+ -dependent exocytosis: dynamic action in a flash. Neuron 38:521−24

    doi: 10.1016/S0896-6273(03)00290-3

    CrossRef   Google Scholar

    [11]

    Kanda M, Shimizu D, Tanaka H, Tanaka C, Kobayashi D, et al. 2018. Significance of SYT8 for the detection, prediction, and treatment of peritoneal metastasis from gastric cancer. Annals of Surgery 267:495−503

    doi: 10.1097/SLA.0000000000002096

    CrossRef   Google Scholar

    [12]

    Kanda M, Nomoto S, Oya H, Takami H, Shimizu D, et al. 2016. The expression of melanoma-associated antigen D2 both in surgically resected and serum samples serves as clinically relevant biomarker of gastric cancer progression. Annals of Surgical Oncology 23(Suppl 2):S214−S221

    doi: 10.1245/s10434-015-4457-8

    CrossRef   Google Scholar

    [13]

    Wang K, Xiao H, Zhang J, Zhu D. 2018. Synaptotagmin7 is overexpressed in colorectal cancer and regulates colorectal cancer cell proliferation. Journal of Cancer 9:2349−56

    doi: 10.7150/jca.25098

    CrossRef   Google Scholar

    [14]

    Fu Z, Liang X, Shi L, Tang L, Chen D, et al. 2021. SYT8 promotes pancreatic cancer progression via the TNNI2/ERRα/SIRT1 signaling pathway. Cell Death Discovery 7:390

    doi: 10.1038/s41420-021-00779-4

    CrossRef   Google Scholar

    [15]

    Fei Z, Gao W, Xie R, Feng G, Chen X, et al. 2019. Synaptotagmin-7, a binding protein of P53, inhibits the senescence and promotes the tumorigenicity of lung cancer cells. Bioscience Reports 39:BSR20181298

    doi: 10.1042/BSR20181298

    CrossRef   Google Scholar

    [16]

    Pedersen NM, Wenzel EM, Wang L, Antoine S, Chavrier P, et al. 2020. Protrudin-mediated ER-endosome contact sites promote MT1-MMP exocytosis and cell invasion. The Journal of Cell Biology 219:e202003063

    doi: 10.1083/jcb.202003063

    CrossRef   Google Scholar

    [17]

    Bajaj R, Rodriguez BL, Russell WK, Warner AN, Diao L, et al. 2022. Impad1 and Syt11 work in an epistatic pathway that regulates EMT-mediated vesicular trafficking to drive lung cancer invasion and metastasis. Cell Reports 40:111429

    doi: 10.1016/j.celrep.2022.111429

    CrossRef   Google Scholar

    [18]

    Mayorga LS, Tomes CN, Belmonte SA. 2007. Acrosomal exocytosis, a special type of regulated secretion. IUBMB Life 59:286−92

    doi: 10.1080/15216540701222872

    CrossRef   Google Scholar

    [19]

    Kanda M, Shimizu D, Tanaka H, Tanaka C, Kobayashi D, et al. 2018. Synaptotagmin XIII expression and peritoneal metastasis in gastric cancer. The British Journal of Surgery 105:1349−58

    doi: 10.1002/bjs.10876

    CrossRef   Google Scholar

    [20]

    Suo H, Xiao N, Wang K. 2022. Potential roles of synaptotagmin family members in cancers: recent advances and prospects. Frontiers in medicine 9:968081

    doi: 10.3389/fmed.2022.968081

    CrossRef   Google Scholar

  • Cite this article

    Zhu J, Shang J, Li Y, Kulabiek D, Bai L, et al. 2025. Clinicopathological features and prognostic significance of SYT8 in patients with colorectal cancer who received curative surgery. Gastrointestinal Tumors 12: e005 doi: 10.48130/git-0025-0005
    Zhu J, Shang J, Li Y, Kulabiek D, Bai L, et al. 2025. Clinicopathological features and prognostic significance of SYT8 in patients with colorectal cancer who received curative surgery. Gastrointestinal Tumors 12: e005 doi: 10.48130/git-0025-0005

Figures(5)  /  Tables(6)

Article Metrics

Article views(110) PDF downloads(38)

ARTICLE   Open Access    

Clinicopathological features and prognostic significance of SYT8 in patients with colorectal cancer who received curative surgery

Gastrointestinal Tumors  12 Article number: e005  (2025)  |  Cite this article

Abstract: To clarify the clinicopathological and predictive significance of SYT8 expression in patients with colorectal cancer (CRC) who underwent radical tumor resection. The demographic, clinicopathologic, survival outcomes, and SYT8 expression information in CRC patients were extracted from The Cancer Gene Atlas (TCGA) databases. Then we assessed the diagnostic value of SYT8 and determined the underlying prognostic factors of PFI and OS. The SYT8 core genes were identified online based on the Kaplan-Meier Plotter database, and prognostic information was obtained for online analysis. To validate the above results, we retrospectively analyzed 153 CRC patients, and collected their clinicopathological, demographic, and survival information. The clinicopathological features and prognostic value of SYT8 were analysed in patients with colorectal cancer. In total, 643 CRC patients were included from the TCGA database. SYT8 was significantly overexpressed in CRC tissues compared to adjacent tissues (0.84 ± 0.79 vs 0.28 ± 0.30, p < 0.01). ROC curve results indicated that SYT8 performed a satisfactory diagnostic value in CRC (AUC: 0.863). Additionally, SYT8 was an independent prognostic factor affecting patients' OS (p = 0.01) instead of PFI. The results of retrospective validation demonstrated that SYT8 expression is one of the independent prognostic factors to OS (p < 0.05). Moreover, SYT8 expression was positively correlated with lymph node metastasis. SYT8 overexpressed in CRC tissues and could be applied as a diagnostic and prognostic biomarker in these patients after curative surgery.

    • Colorectal cancer (CRC) represents the third most common cancer type and stands as the second leading cause of cancer-associated mortality globally[1]. Surgical and endoscopic resection remain the main curative options with a more than 90% 5-year survival rate, which depends on early diagnosis. In contrast, patients with advanced CRC face a significantly reduced 5-year survival rate of merely 10%, despite the recommendation of chemotherapy and various targeted agents[24]. For borderline curable CRC patients, surgery remains the preferred treatment approach. However, the majority of patients were diagnosed at an advanced stage and missed the opportunity for curative tumor resection. In addition, while adjuvant chemotherapy has presented to lower the risk of cancer recurrence, some postoperative CRC patients still experience disease relapse, resulting in limited overall survival (OS)[5,6]. To date, the underlying mechanisms and risk factors contributing to disease recurrence and patient outcomes remain poorly understood. Therefore, there appears significant interest in identifying critical biomarkers to predict outcomes in CRC patients, aiming to achieve accuracy management.

      SYT8, a member of the calcium-sensitive family, has been demonstrated to facilitate the transport and cytosolization of secretory vesicles in non-neural tissues while inhibiting insulin efflux from permeabilized cells. Recent in vitro studies have indicated that suppressing SYT8 impedes the migration and invasion of gastric cancer cell lines[7,8]. In addition, overexpression of SYT8 has been significantly associated with peritoneal metastasis and was considered a valuable diagnostic and prognostic biomarker in gastric cancer patients[911]. Despite these findings, the clinicopathologic and prognostic significance of SYT8 in CRC patients remains unexplored.

      In this study, we aimed to evaluate the diagnostic and prognostic potential of SYT8 utilizing CRC patient data from the TCGA dataset. To corroborate our findings, we conducted a retrospective analysis of CRC patients who received radical tumor resection at our center.

    • We downloaded colorectal cancer-related data from the TCGA-COADREAD dataset, including demographic information (gender, age, and race), clinicopathologic data (TNM stage, differentiation, body weight, height, and CEA level), survival follow-up, and SYT8 expression. Overall survival (OS) and progression-free interval (PFI) were calculated based on survival follow-up information and defined as the primary endpoints. The above data were organized via R software. We excluded the cases with incomplete follow-up data or lacking SYT8 expression. SYT8 core genes were identified online based on the Kaplan-Meier Plotter database (http://kmplot.com/analysis), and prognostic information was obtained for online analysis.

      The Affiliated Hospital of Nanjing University of Chinese Medicine's Ethics Committee approved this retrospective study (No. 2022NL-137-01), which analyzed 153 CRC patients treated at Jiangsu Provincial Hospital of Chinese Medicine between January 2016 and October 2020. All participants had a pathological diagnosis of adenocarcinoma and received curative tumor resection with lymph node dissection. We collected demographic, clinical, and pathological data, including age, gender, body measurements, tumor stage, margin status, and nerve and vascular invasion. Clinical staging was according to the 8th edition of the AJCC Cancer Staging Manual. We also collected formalin-fixed paraffin-embedded (FFPE) archival specimens. OS was calculated from the date of surgery to death from any cause, while disease-free survival (DFS) was measured from the surgical date to cancer recurrence confirmed by imaging or death. These endpoints were determined through telephone follow-ups or medical record reviews.

    • The inclusion criteria for this study were as follows: (1) pathologically confirmed colorectal cancer; (2) age range of 18−85 years; (3) radical tumor resection; and (4) ECOG score of 0−1. Exclusion criteria comprised: (1) presence of other primary malignant tumors; (2) unavailable pathology slides; (3) incomplete medical records; (4) death in one-month post-surgery; and (5) loss of follow-up.

    • Paraffin-embedded samples of CRC and adjacent tissues were carefully sectioned for slide preparation. The sections were hydrated, and antigen retrieval was performed utilizing citrate buffer. To minimize non-specific binding, the slides were treated with an endogenous peroxidase inhibitor and subjected to a 1-h serum block. Then, the sections were incubated overnight at 4 °C with an anti-SYT8 antibody (1:500 dilution, Abcam). Negative controls were prepared by substituting the primary antibody with PBS buffer. Following this, a secondary antibody (1:5000 dilution) was applied and incubated for 1 h at room temperature. The sections were then stained with DAB and counterstained with hematoxylin for 2 min. After dehydration, the slides were mounted utilizing neutral resin, and the immunohistochemical results were subject to an in-depth analysis under a microscope.

      Two independent pathologists evaluated the slides, considering both the intensity of cell staining and the proportion of stained cells as scoring criteria. Consensus results were accepted, and in instances of discordance, the slides underwent re-evaluation. Staining intensity was graded as follows: 0 (no staining), 1 (weak staining, pale yellow), 2 (moderate staining, tan-yellow), and 3 (strong staining, brown). The cancer cell proportion was scored as 0 for positive cells < 10%, 1 for 10%−25%, 2 for > 25% and ≤ 50%, 3 for > 50% and ≤ 75%, and 4 for > 75%[12]. The final score, calculated by multiplying these two evaluations, was utilized to classify expression as either negative (< 4) or positive (≥ 4).

    • Statistical analyses were performed utilizing SPSS 25.0 and R software (version 4.2.3). For group comparisons, we employed the Wilcoxon signed-rank test or Student's t-test to evaluate variables between groups. The chi-square test was applied to appraise the relationship between SYT8 expression and clinicopathologic features. Survival analysis was performed by Kaplan-Meier assay and univariate analysis utilized Cox regression. Variables deriving p < 0.10 in univariate analysis were then incorporated into multivariate analysis. To ensure similar variable distribution between the training and validation sets, duodenal carcinoma patients were randomly allocated utilizing R software, with distributions compared through the Chi-square test or Fisher's exact test.

    • The analysis included 446 CRC patients, comprising 290 (65.0%) males and 93 (20.9%) Asians, with a mean age of 65.6 years. Patients were categorized into high-expression and low-expression groups based on median SYT8 expression levels. Interestingly, our findings indicated that SYT8 overexpression was only associated with the extent of primary tumor (p = 0.046) (Table 1). Further analysis of SYT8 expression levels in CRC and adjacent tissues demonstrated significantly higher expression in CRC tissues compared to adjacent tissues (0.84 ± 0.79 vs 0.28 ± 0.30, p < 0.01) (Fig. 1a, b). Besides, ROC curve analysis indicated that SYT8 has good diagnostic value for CRC (AUC = 0.836, 95% CI: 0.787−0.886), with an optimal cut-off value of 0.559 (sensitivity 70.63%, specificity 86.28%) (Fig. 1a, b).

      Table 1.  Correlation analysis of clinicopathologic parameters and expression of SYT8.

      Characteristics Total Low expression of SYT8 (%) High expression of SYT8 (%) p-value
      n 644 322(50) 322(50)
      Gender, n (%) 0.477
      Female 301 155 (51.5) 146 (48.5)
      Male 343 167 (48.7) 176 (51.3)
      Race, n (%) 0.649
      White 313 175 (55.9) 138 (44.1)
      Asian and black or African American 81 43 (53.1) 38 (46.9)
      Unknown 250 104 (41.6) 146 (58.4)
      Age, n (%) 0.633
      ≤ 65 276 141 (51.1) 135 (48.9)
      > 65 368 181 (49.2) 187 (50.8)
      Pathologic T stage, n (%) 0.046
      T1 & T2 131 55 (42) 76 (58)
      T3 & T4 510 264 (51.8) 246 (48.2)
      Unknown 3 3 (100) 0 (0)
      Pathologic N stage, n (%) 0.767
      N0 368 181 (49.2) 187 (50.8)
      N1 & N2 272 137 (50.4) 135 (49.6)
      Unknown 4 4 (100) 0 (0)
      Pathologic M stage, n (%) 0.107
      M0 475 228 (48) 247 (52)
      M1 89 51 (57.3) 38 (42.7)
      Unknown 80 43 (53.7) 37 (46.3)
      BMI, n (%) 0.358
      ≤ 25 107 54 (50.5) 53 (49.5)
      > 25 222 124 (55.9) 98 (44.1)
      Unknown 315 144 (45.7) 171 (54.3)
      CEA level, n (%) 0.279
      ≤ 5 261 128 (49) 133 (51)
      > 5 154 84 (54.5) 70 (45.5)
      Unknown 229 110 (48) 119 (52)
      Values in bold are statistically significant.
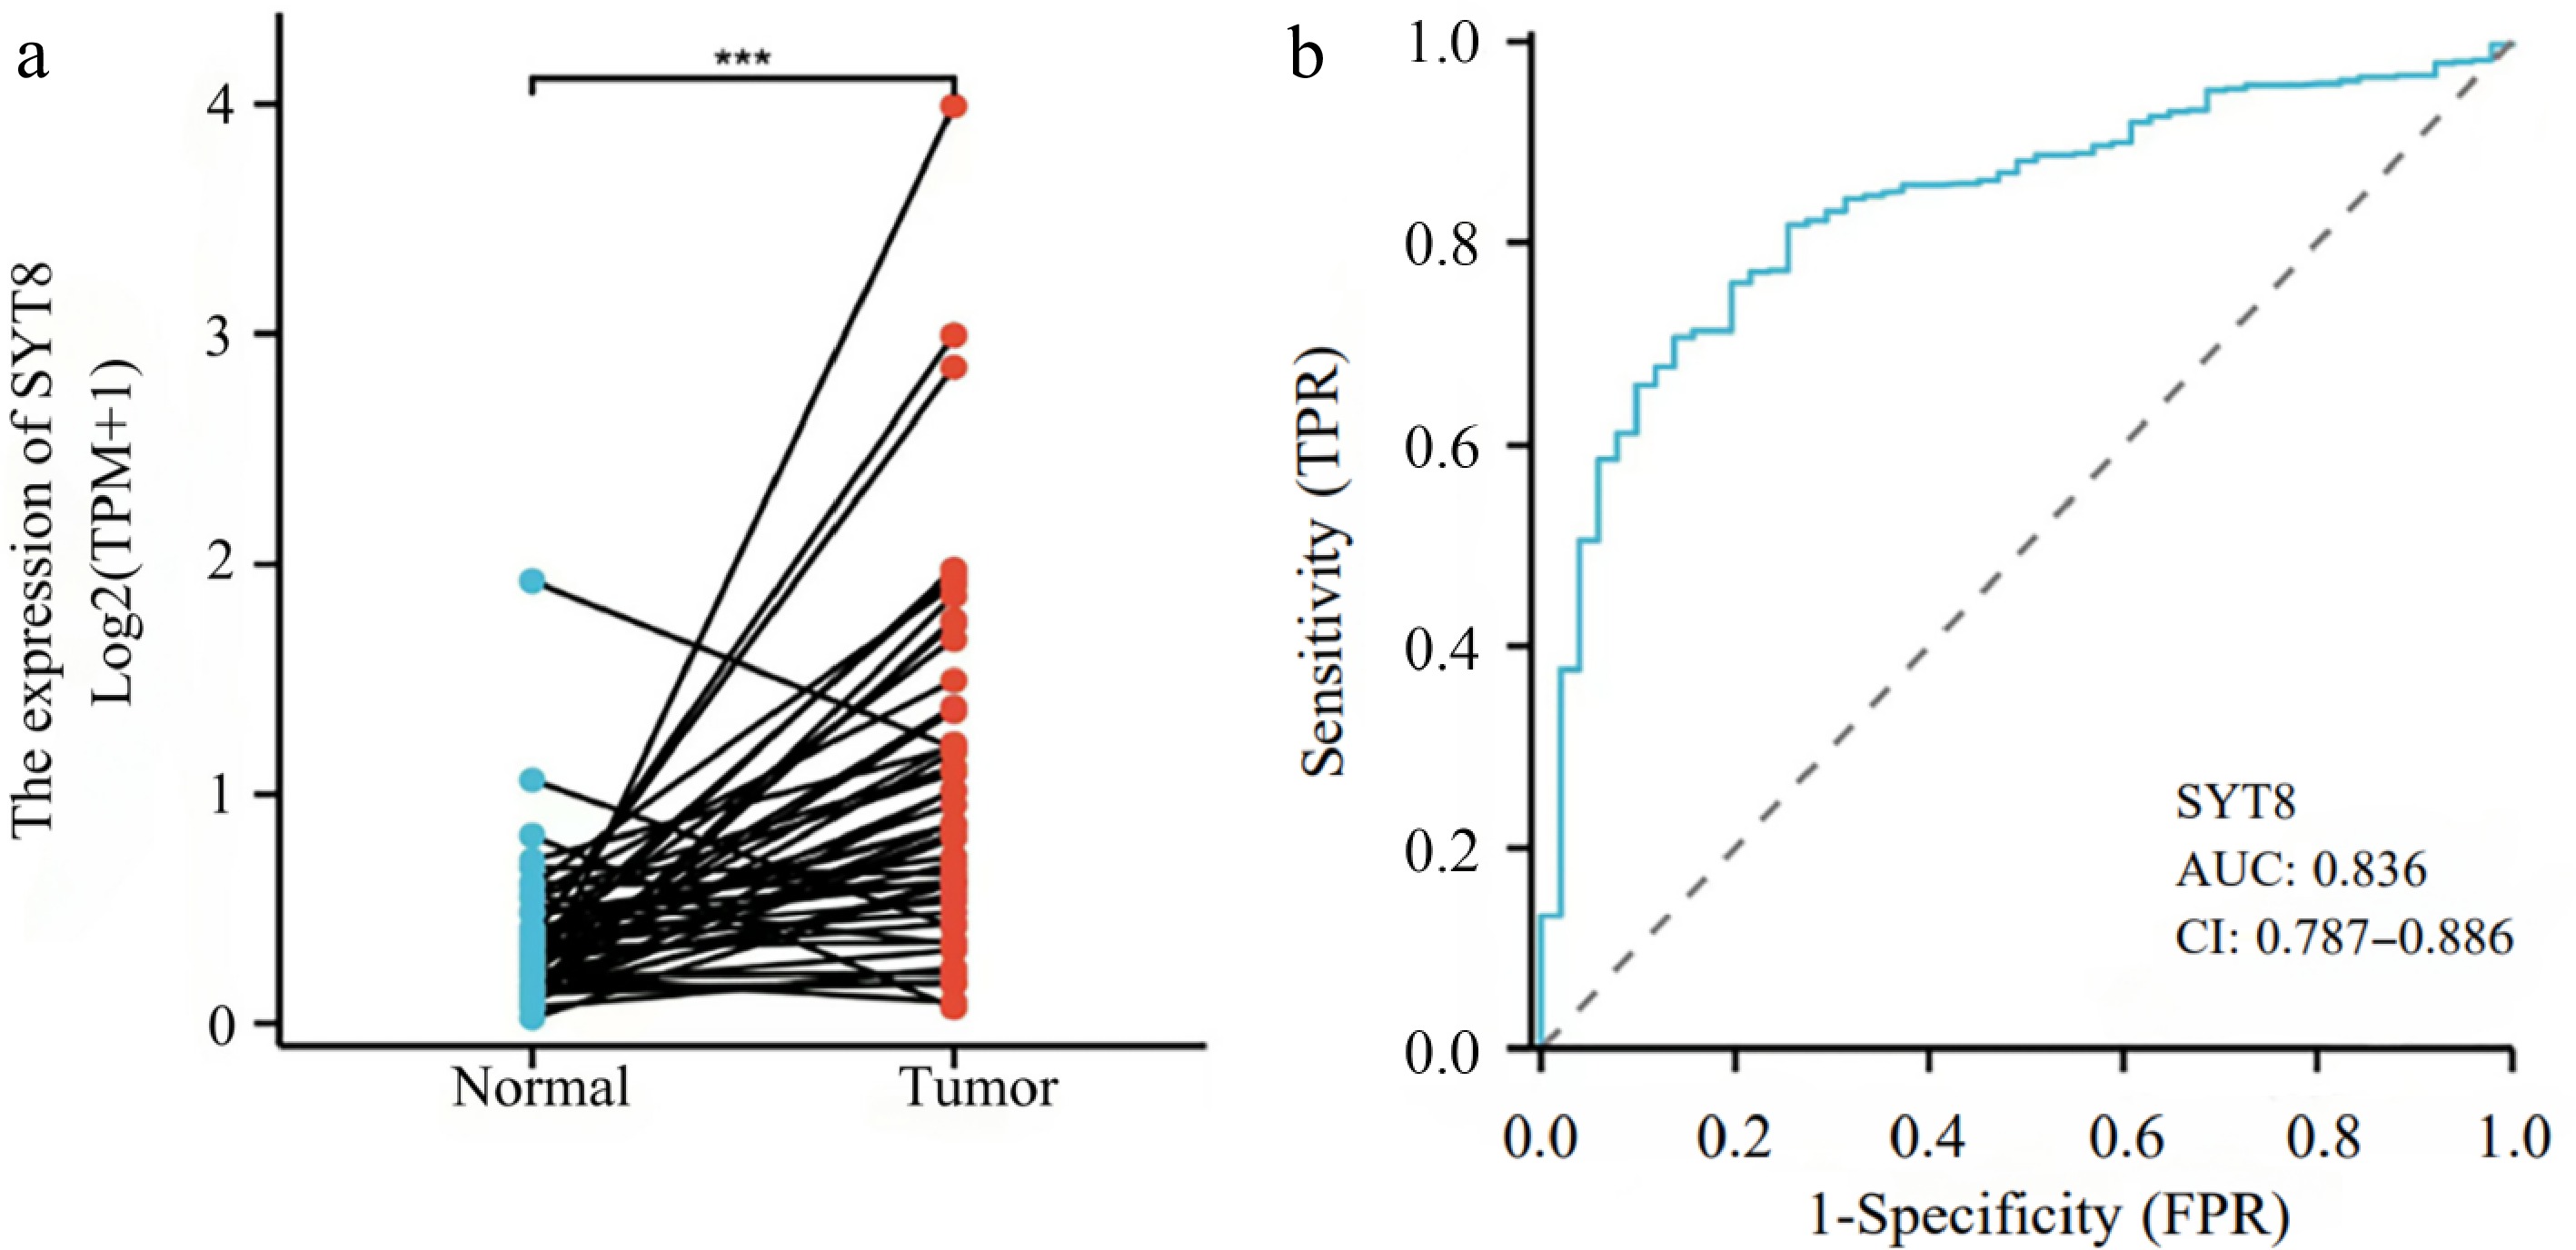
      Figure 1. 

      Expression and diagnostic role of SYT8 in CRC. (a) SYT8 expression assessed by Wilcoxon signed rank test. (b) Diagnostic value analyzed by ROC curve.

    • To further evaluate the performance of SYT8 to predict outcomes in CRC patients, we conducted Kaplan-Meier and Cox regression analyses. The Kaplan-Meier analysis demonstrated that patients with high SYT8 expression had significantly worse PFI and OS (p < 0.05, Fig. 2a, b). Meanwhile, the results of online analysis using the Kaplan-Meier Plotter database showed that OS and PFS in the SYT8 low expression group were significantly higher than those in the SYT8 high expression group (Fig. 3a, b). Therefore, we hypothesized that SYT8 high expression may be one of the factors for poor prognosis in patients with colorectal cancer.
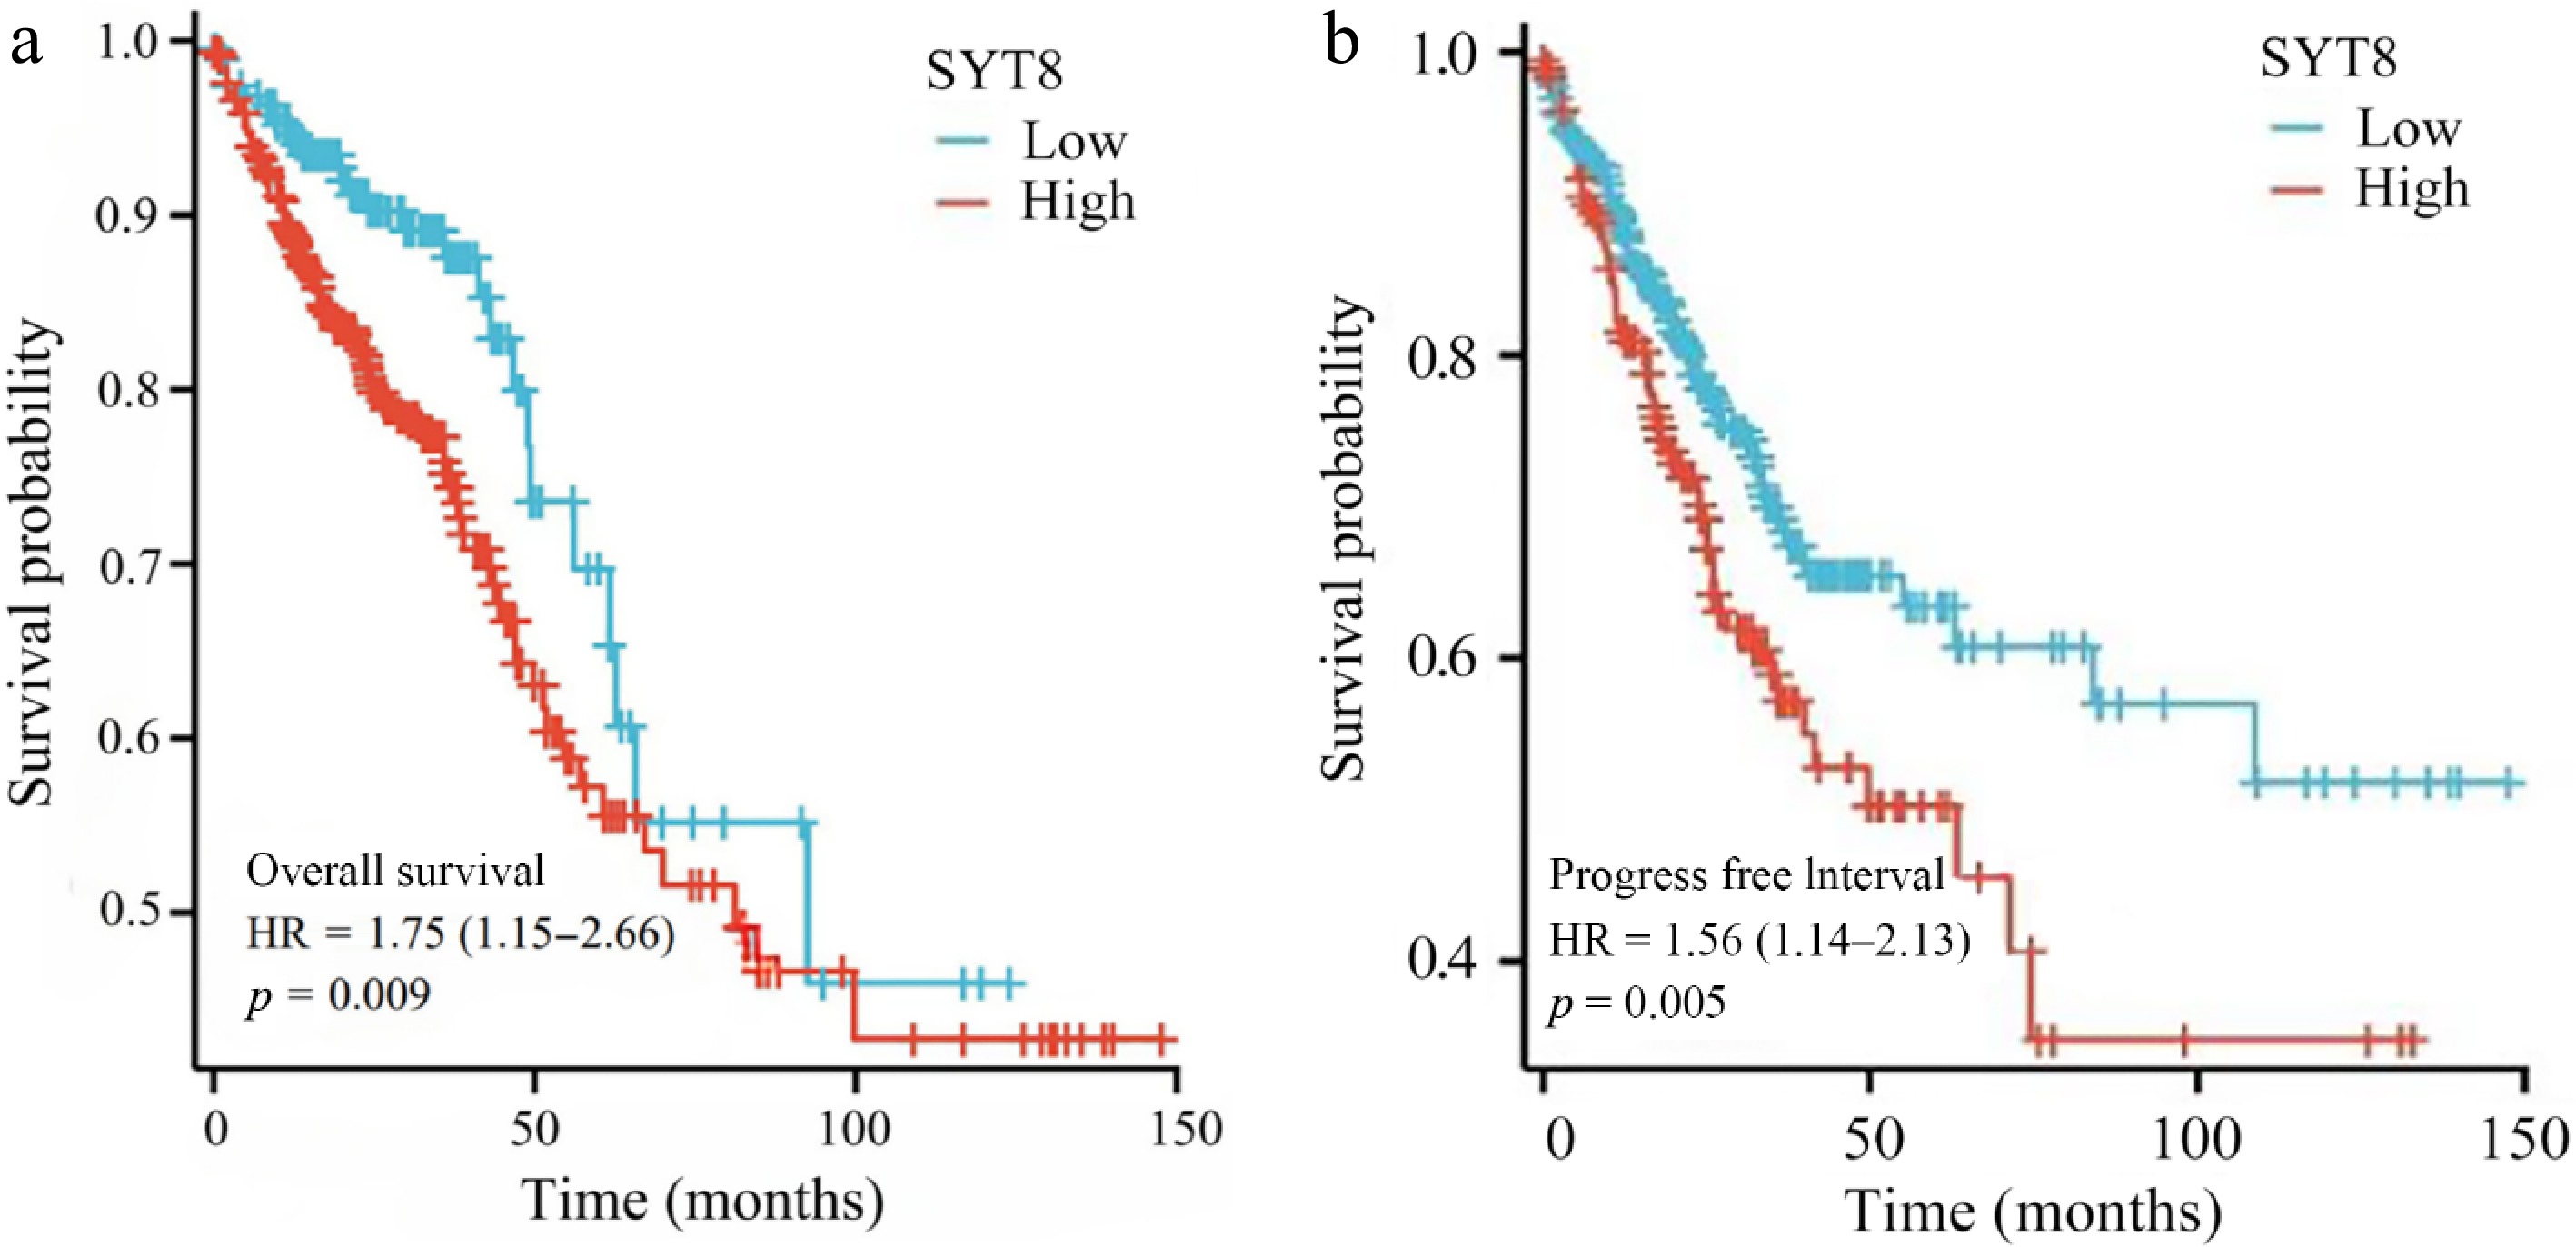
      Figure 2. 

      Survival analysis assessed by Kaplan-Meier analysis. (a) The SYT8-high group was more likely to have a worse overall survival compared with that of the SYT8-low group. (b) The SYT8-high group was more likely to have a worse progress free interval compared with that of the SYT8-low group.
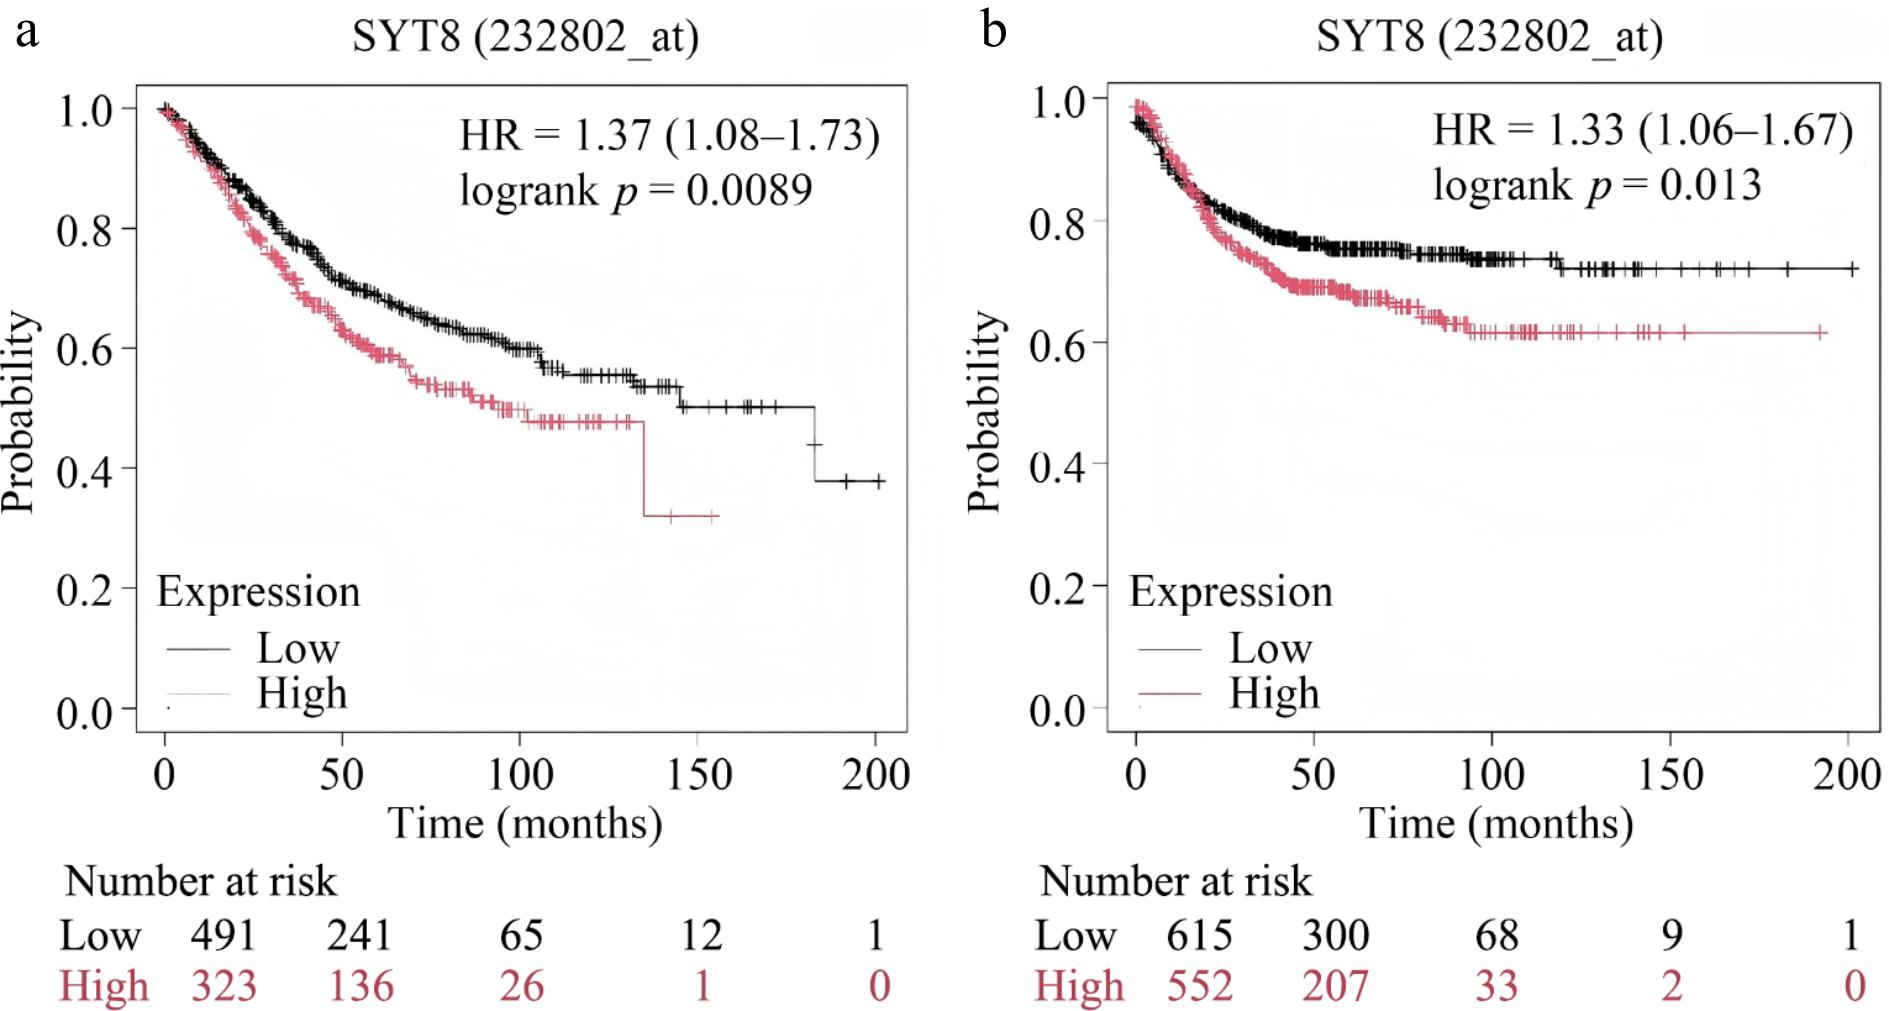
      Figure 3. 

      Survival analysis based on the Kaplan-Meier Plotter database. The Kaplan-Meier curves of patients with SYT8 high expression and SYT8 low expression are shown. (a) OS. (b) PFS.

      In the multivariate analysis, SYT8 expression was identified as an independent prognostic factor for poor OS (p = 0.01), but not for PFI (Tables 2 & 3). Moreover, age (p < 0.001), T stage (p = 0.004), lymph node involvement (p = 0.009), and distant metastasis (p < 0.001) were also found to be independent prognostic indicators of OS in CRC patients.

      Table 2.  COX regression analysis to assess prognostic factors for PFI.

      Characteristics Total (N) Univariate analysis Multivariate analysis
      Hazard ratio (95% CI) p Hazard ratio (95% CI) p
      Gender (male/female) 643 1.217 (0.892−1.660) 0.216
      Race (Asian and black or African American/white) 394 1.547 (0.992−2.412) 0.054 1.322 (0.807−2.168) 0.268
      Age (> 65/≤ 65) 643 1.006 (0.737−1.371) 0.972
      Pathologic T stage 640
      T1 & T2 131 Reference Reference
      T3 & T4 509 3.198 (1.814−5.636) < 0.001 2.073 (0.871−4.933) 0.099
      Pathologic N stage 639
      N0 367 Reference Reference
      N1 & N2 272 2.624 (1.916−3.592) < 0.001 0.963 (0.591−1.570) 0.881
      Pathologic M stage (M1/M0) 563 5.577 (3.945−7.884) < 0.001 6.018 (3.596−10.069) < 0.001
      SYT8 (high/low) 643 1.135 (0.836−1.541) 0.418
      Values in bold are statistically significant.

      Table 3.  COX regression analysis to assess prognostic factors for OS.

      Characteristics Total (N) Univariate analysis Multivariate analysis
      Hazard ratio (95% CI) p Hazard ratio (95% CI) p
      Gender (male/female) 643 1.054 (0.744−1.491) 0.769
      Race (Asian and black or African American/white) 394 1.072 (0.622−1.848) 0.802
      Age (> 65/≤ 65) 643 1.939 (1.320−2.849) < 0.001 2.583 (1.667−4.002) < 0.001
      Pathologic T stage 640
      T1 & T2 131 Reference Reference
      T3 & T4 509 2.468 (1.327−4.589) 0.004 2.277 (1.034−5.011) 0.041
      Pathologic N stage 639
      N0 367 Reference Reference
      N1 & N2 272 2.627 (1.831−3.769) < 0.001 1.842 (1.164−2.916) 0.009
      Pathologic M stage (M1/M0) 563 3.989 (2.684−5.929) < 0.001 3.105 (1.949−4.948) < 0.001
      SYT8 (high/low) 643 1.356 (0.956−1.923) 0.087 1.666 (1.130−2.455) 0.010
      Values in bold are statistically significant.
    • To corroborate these findings, we analyzed 153 postoperative CRC patients. IHC staining results indicated that SYT8 expression was scarcely detectable in adjacent tissues, while the intratumoral positive rate was 38% (58/153) (Fig. 4ac). Specifically, our analysis demonstrated that patients with high SYT8 expression were significantly associated with lymph node metastasis (p = 0.008). However, no significant correlations were discovered between SYT8 expression and age (p = 0.386), gender (p = 0.64), margins (p = 0.201), vascular invasion (p = 0.192), nerve invasion (p = 0.221), T stage (p = 0.283), distant metastasis, or differentiation (p > 0.05) (Table 4).
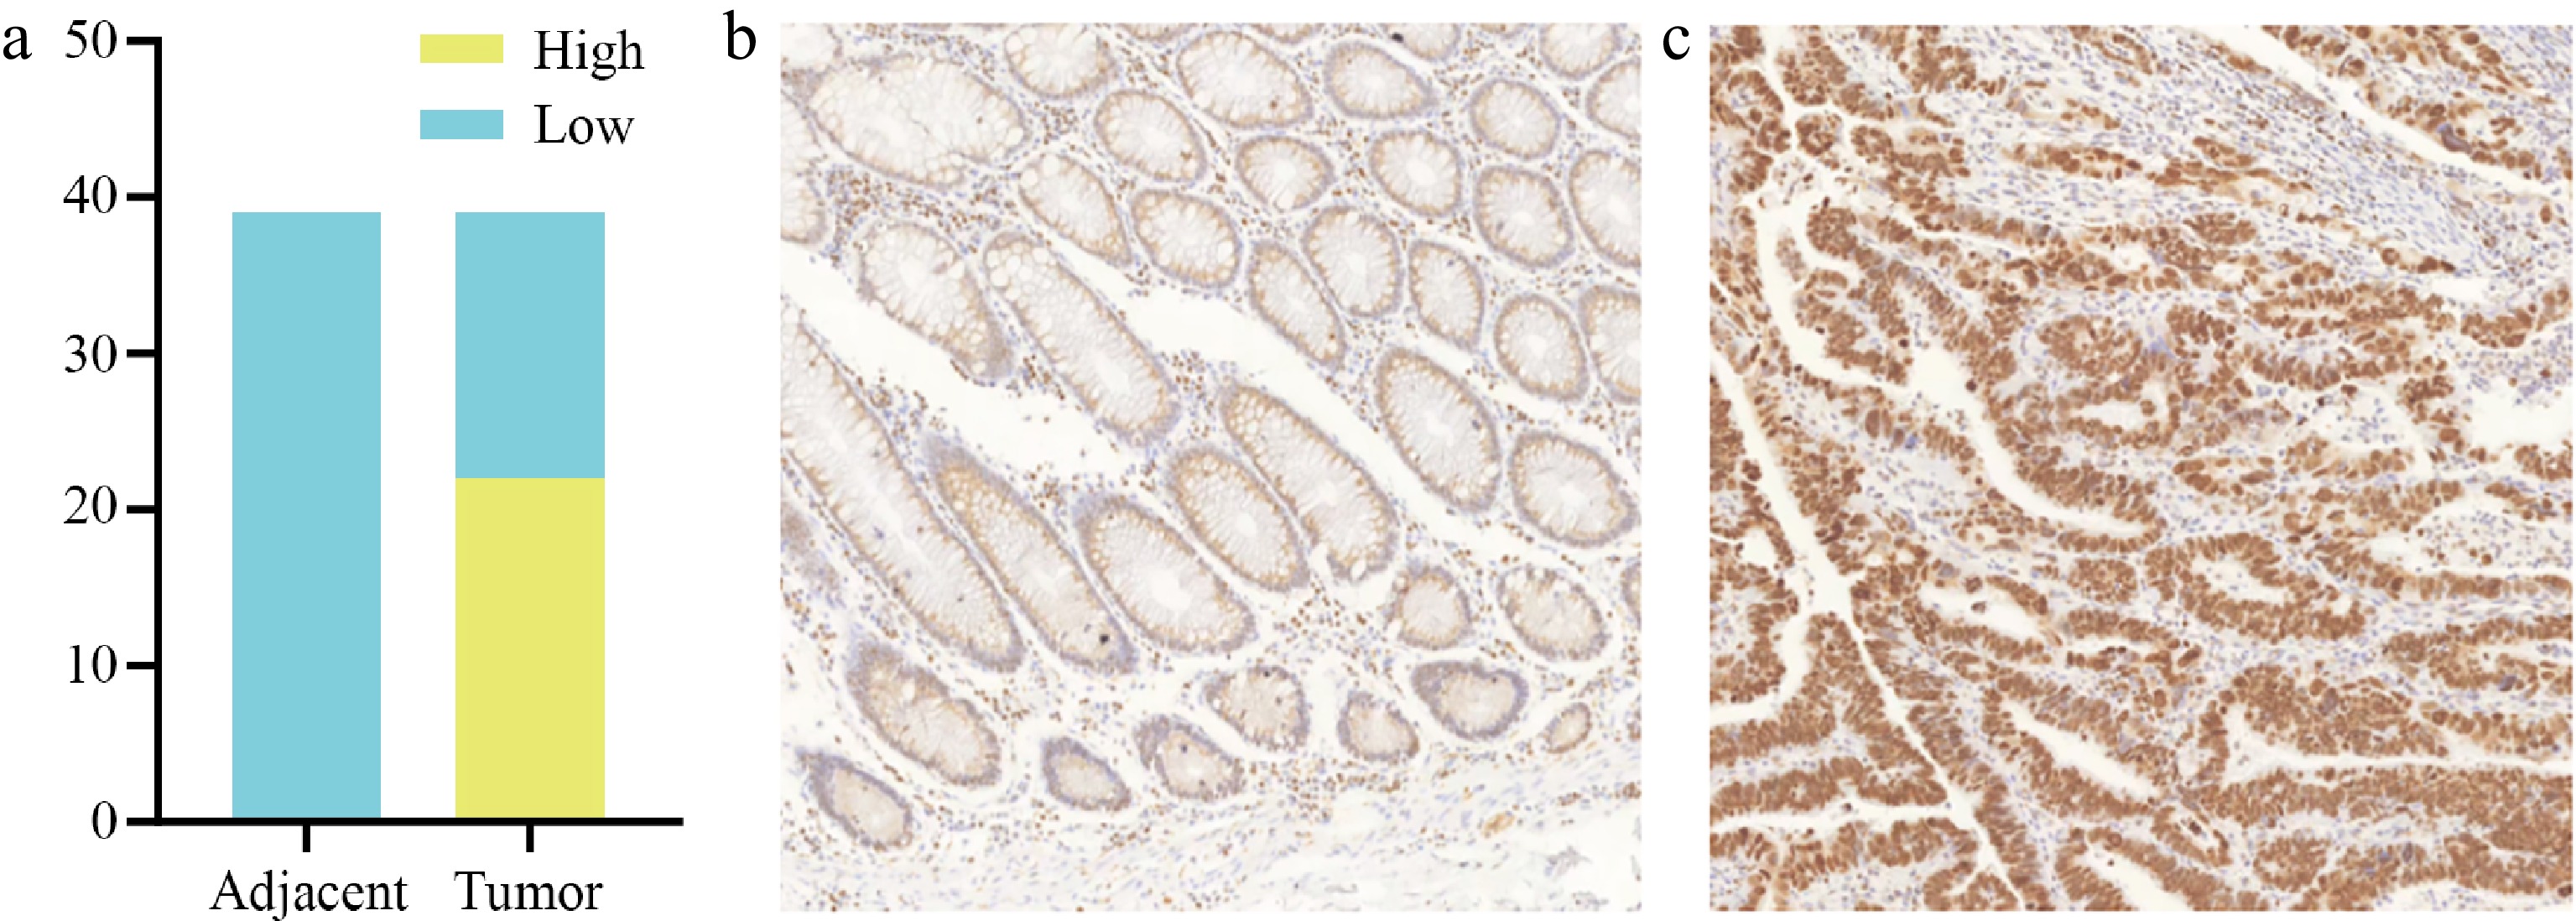
      Figure 4. 

      SYT8 expression in tumor tissues and adjacent tissues of CRC patients. (a) SYT8 expression levels in CRC tissues was higher than adjacent tissues. (b) Immunohistochemical images of CRC adjacent tissue with low SYT8 expression. (c) Immunohistochemical images of CRC adjacent tissue with high SYT8 expression.

      Table 4.  Clinicopathologic parameters and demographic features in CRC patients with or without SYT8 expression in the retrospective validation cohort.

      Characteristics Total Positive Negative P value
      n 153 58(38) 95(62)
      Age, n (%) 0.386
      ≥ 60 58 37(63.8) 21(36.2)
      < 60 95 67(70.5) 28(29.5)
      Gender, n (%) 0.64
      Male 94 37(39.4) 57(60.6)
      Female 59 21(35.6) 38(64.4)
      Margins 0.201
      Present 1 1(100) 0(0)
      Absent 152 57(37.5) 95(62.5)
      N stage 0.008
      N1 74 36(48.6) 38(51.3)
      N0 79 22(27.8) 57(72.2)
      Vascular invasion 0.192
      Present 56 25(44.6) 31(55.4)
      Absent 97 33(34) 64(66)
      Nerve invasion 0.221
      Present 49 22(44.9) 27(55.1)
      Absent 104 36(34.6) 68(65.4)
      T stage 0.283
      T1 2 0(0) 2(100)
      T2 11 3(27.3) 8(72.7)
      T3 122 45(36.9) 77(36.1)
      T4 18 10(55.6) 8(44.4)
      Differentiation 0.41
      Low 34 16(47.1) 18(52.9)
      Middle 108 39(36.1) 69(63.9)
      High 11 3(27.3) 8(72.7)
      M stage 0.571
      M1 5 3(60) 2(40)
      M0 148 55(37.2) 93(62.8)
      Values in bold are statistically significant.
    • The Kaplan-Meier analysis indicated that patients exhibiting high SYT8 expression experienced inferior DFS and OS outcomes (p < 0.05, Fig. 5a, b). Multivariate analysis results demonstrated that increased SYT8 expression and distant metastasis were independent prognostic factors for poor OS (Table 5). Nevertheless, no statistically significant correlation was identified between SYT8 expression and DFS in CRC patients, with distant metastases being the sole prognostic factor for poor DFS (Table 6).
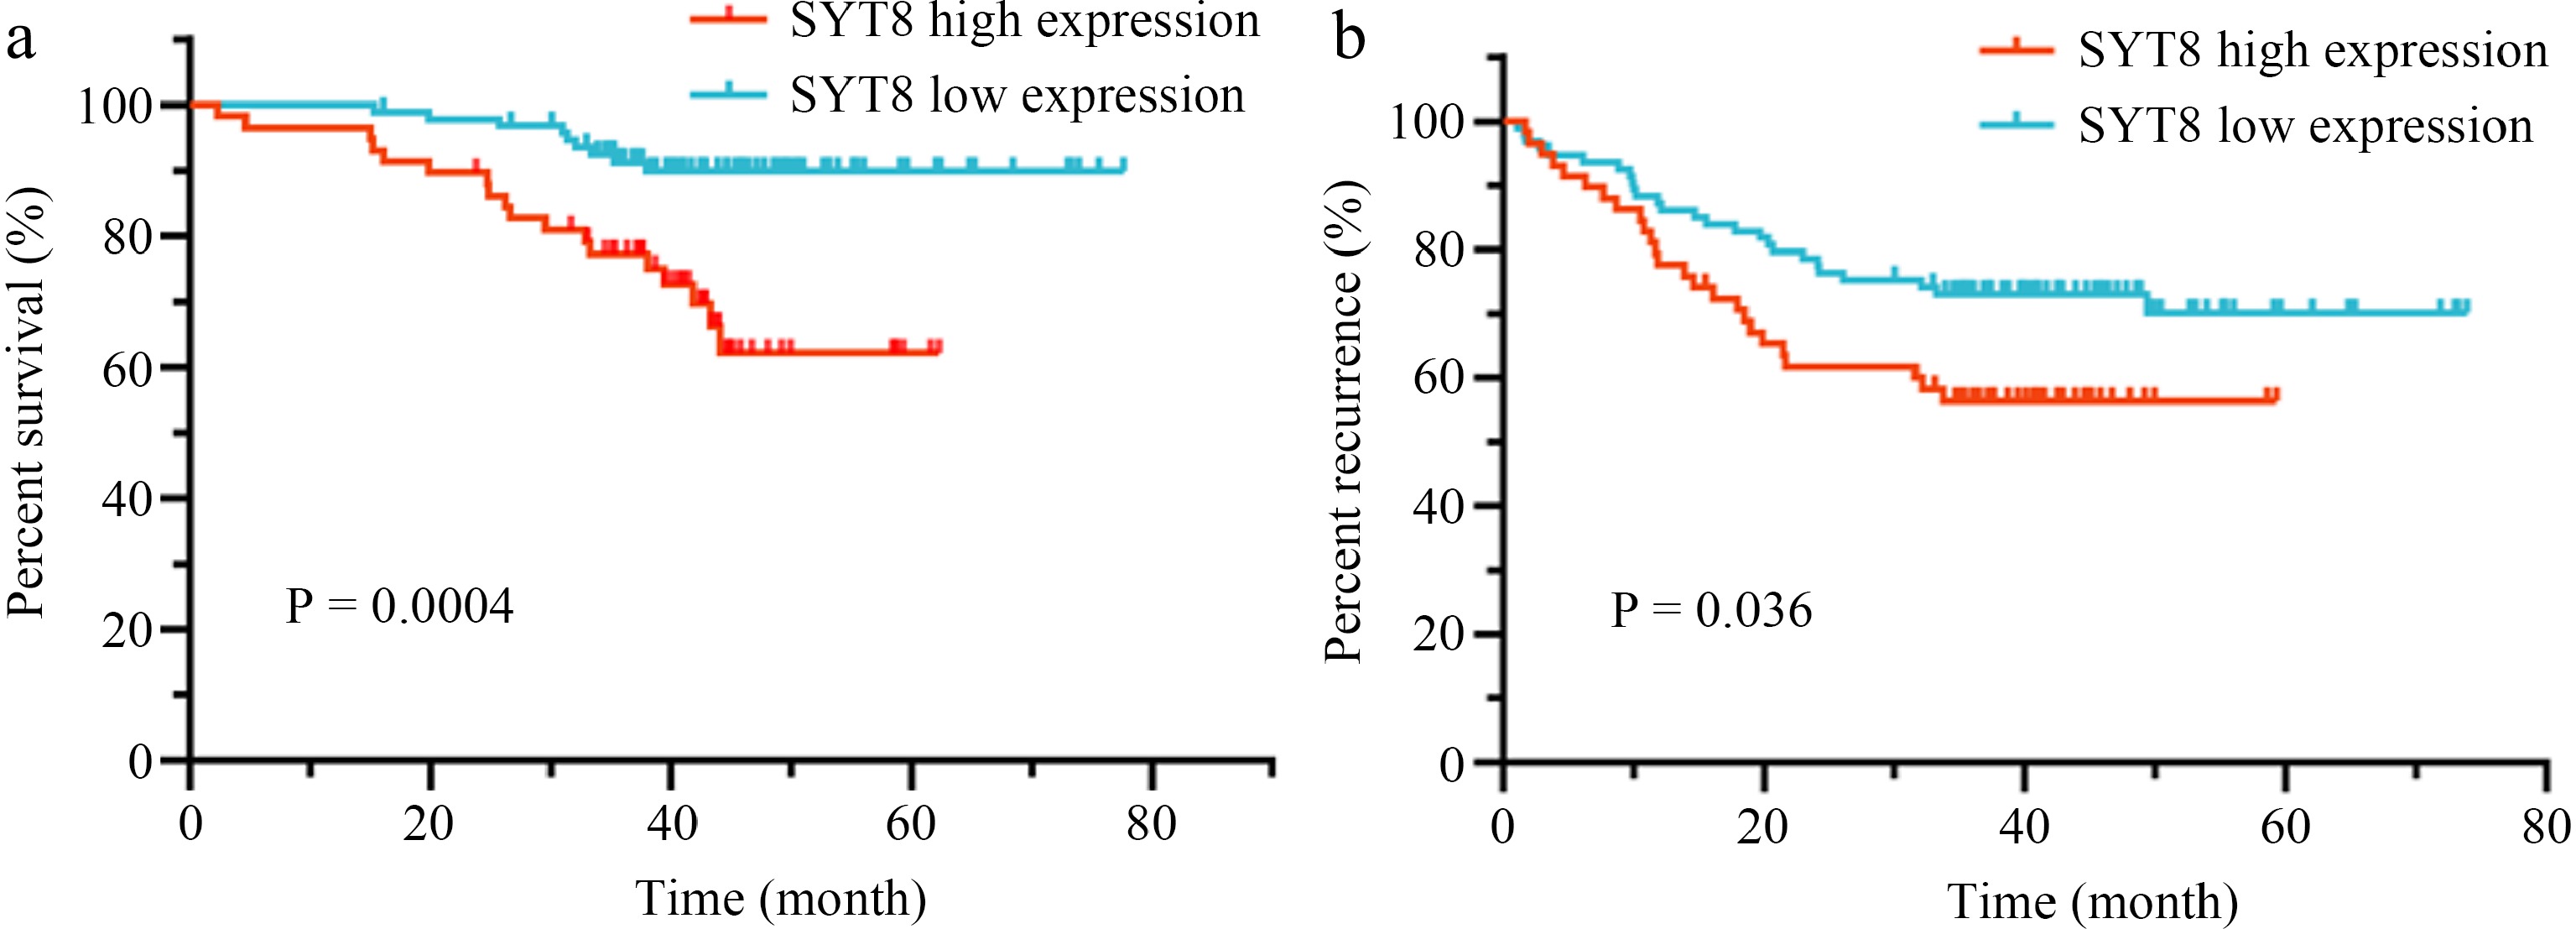
      Figure 5. 

      Survival analysis assessed by Kaplan–Meier analysis in the retrospective validation cohort. (a) The SYT8-high group had a worse overall survival compared with that of the SYT8-low group. (b) The SYT8-high group had a worse disease free survival compared with that of the SYT8-low group.

      Table 5.  COX regression analysis to assess prognostic factors for OS in the retrospective validation cohort.

      Characteristics Univariate analysis Multivariate analysis
      Hazard ratio (95% CI) p Hazard ratio (95% CI) p
      SYT8 (low/high) 3.811 (1.710−8.494) 0.001 3.256 (1.427−7.426) 0.005
      Gender (male/female) 1.265 (0.568−2.815) 0.561
      Age (≥ 60/< 60) 2.006 (0.759−5.298) 0.160
      N stage (N1/N0) 1.460 (0.683−3.120) 0.329
      M stage (M0/M1) 0.139(0.041−0.467) 0.001 0.150 (0.042−0.532) 0.003
      Margins (absent/present) 0.047 (0.006−0.384) 0.004
      Vascular invasion (absent/present) 0.405 (0.190−0.867) 0.020
      Nerve invasion (absent/present) 0.376 (0.177−0.802) 0.011
      T stage 0.035
      T1/T4 0.980
      T2/T4 0.166 (0.020−1.357) 0.094
      T3/T4 0.286 (0.119−0.684) 0.005
      Differentiation 0.197
      Low/high 1.534 (0.331−7.108) 0.584
      Middle/high 0.723 (0.166−3.145) 0.665
      Values in bold are statistically significant.

      Table 6.  COX regression analysis to assess prognostic factors for DFS in the retrospective validation cohort.

      Characteristics Univariate analysis Multivariate analysis
      Hazard ratio (95% CI) p Hazard ratio (95% CI) p
      SYT8 (low/high) 1.790 (1.031−3.108) 0.039 1.571 (0.891−2.770) 0.119
      Gender (male/female) 1.246 (0.696−2.230) 0.459
      Age (≥ 60/< 60) 1.623 (0.833−3.164) 0.155
      N stage (N1/N0) 1.723 (0.986−3.011) 0.056
      M stage (M1/M0) 4.603 (1.643−12.892) 0.004 3.713 (1.304−10.574) 0.014
      Margins (absent/present) 0.143 (0.019−1.064) 0.057
      Vascular invasion (absent/present) 0.805 (0.461−1.407) 0.447
      Nerve invasion (absent/present) 0.523 (0.300−0.910) 0.022
      T stage 0.068
      T1/T4
      T2/T4 0.111 (0.014−0.870) 0.036
      T3/T4 0.466 (0.233−0.932) 0.031
      Differentiation 0.217
      Low/high 0.989 (0.325−3.011) 0.985
      Middle/high 0.594 (0.210−1.678) 0.326
      Values in bold are statistically significant.
    • To assess the diagnostic and prognostic value of SYT8 in GC patients who received curative surgery, we analyzed differential gene expression and conducted Kaplan-Meier analyses utilizing TCGA datasets. Our findings indicated a remarkable diagnostic significance in CRC, while patients exhibiting high SYT8 expression demonstrated poor PFI and OS. To verify these results, we retrospectively analyzed CRC patients who had received curative surgery at our center. We observed significantly higher SYT8 expression levels in CRC tissues compared to adjacent tissues, with increased SYT8 expression strongly correlating with lymph node metastasis. Further Kaplan-Meier and multivariate analyses demonstrated that patients with low SYT8 expression in tumor tissues had a lower risk of disease recurrence and mortality compared to those with high expression. Moreover, distant metastasis and high SYT8 expression were identified as independent prognostic factors influencing patient survival. These findings aligned with the significance of SYT7, another member of the SYT family, which has been demonstrated to be overexpressed in CRC tissue and associated with advanced staging[13]. Previous research has indicated that SYT8 may play a crucial role in gastrointestinal malignant tumors. Kanda et al.[11] clarified that high SYT8 expression was significantly associated with peritoneal metastasis and could be applied as an independent prognostic marker for peritoneal recurrence-free survival in stage II/III GC patients. In addition, SYT8 may affect the sensitivity of GC cells to 5-FU.

      Our study is the first to explain the clinicopathological and prognostic significance of SYT8 in CRC. Nevertheless, the underlying mechanisms by which SYT8 influences patient outcomes in CRC remain less understood. Synaptotagrin (SYT), a transmembrane protein, plays a crucial role in neurotransmission and hormone secretion, while also influencing malignant tumor cell behavior. Previous research[14] has demonstrated that SYT8 levels were upregulated in pancreatic cancer tumors, contributing to increased cell proliferation, migration, and invasion in both in vitro and in vivo studies. This effect was attributed to the TNNI2/ERRα/SIRT1 signaling pathway. Moreover, numerous studies have demonstrated that SYT family molecules involved in carcinogenesis and modulation of the immune infiltration microenvironment[1517].

      The incidence and progression of CRC are closely associated with abnormal protein expression, suggesting that certain proteins could be applied as valuable diagnostic biomarkers and therapeutic targets[1820]. Our research identified SYT8 as a potential diagnostic and prognostic biomarker in CRC patients. These findings may aid in identifying high-risk patients based on SYT8 expression, thereby enabling more accurate clinical management. If SYT8 is overexpressed, it may indicate poor response to treatment and poor prognosis. In terms of treatment, the detection results of SYT8 indicators can provide a reference for doctors to choose treatment options. For patients with lymph node metastasis, the expression level of SYT8 can be positively detected. If SYT8 is highly expressed, closer follow-up is needed after surgery, and doctors may choose more active treatment options. Although there is no specific treatment drug, chemotherapy, radiotherapy, targeted therapy, immunotherapy, and other methods can be considered comprehensively. In addition, SYT8 has higher specificity and sensitivity in evaluating the prognosis of patients with CRC compared to carcinoembryonic antigen (CEA) and carbohydrate antigen 19-9 (CA19-9). SYT8 can be used in combination with traditional tumor markers to evaluate the prognosis of patients and guide treatment. In this study, we first reported the clinicopathological role of SYT8 in CRC patients and evaluated its diagnostic and prognostic significance. However, several limitations should be noted. First, this retrospective study has a limited sample size and offers a modest level of evidence. Besides, all included CRC patients were Chinese, potentially limiting the applicability of our results to other populations. Finally, extended follow-up is necessary to obtain more robust endpoints.

      In conclusion, our research offers a rigorous analysis of the diagnostic and predictive value of SYT8 in CRC patients, indicating a significant correlation between its expression and lymph node invasion and metastasis.

    • This study was approved by the Research Ethics Committee of Affiliated Hospital of Nanjing University of Chinese Medicine (NO.2022NL-137-01). Informed written consents were collected from all the eligible patients and the entire study was conducted in accordance with the principles outlined in the Helsinki Declaration.

      • Our research was supported by grants from Jiangsu Province Graduate Student Research and Practice Innovation Program (SJCX24_0944), Jiangsu Provincial Medical Key Discipline (Laboratory) (No. ZDXYS202208).

      • The authors confirm contribution to the paper as follows: study conception and design, analysis, and interpretation of results: Zhu J, Shang J; data collection: Li Y; draft manuscript preparation: Bai L, Kulabiek D; guidance and support: Zheng X, Zhang Y, Qiao J. All authors reviewed the results and approved the final version of the manuscript.

      • The data that support the findings of this study are available from the corresponding author upon reasonable request.

      • All claims expressed in this article are solely those of the authors and do not necessarily represent those of their affiliated organizations or those of the publisher, editors, and reviewers. Any product that may be evaluated in this article or claim that may be made by the manufacturer is not guaranteed or endorsed by the publisher.

      • # Authors contributed equally: Jin Zhu, Jiarong Shang

      • Copyright: © 2025 by the author(s). Published by Maximum Academic Press, Fayetteville, GA. This article is an open access article distributed under Creative Commons Attribution License (CC BY 4.0), visit https://creativecommons.org/licenses/by/4.0/.
    Figure (5)  Table (6) References (20)
  • About this article
    Cite this article
    Zhu J, Shang J, Li Y, Kulabiek D, Bai L, et al. 2025. Clinicopathological features and prognostic significance of SYT8 in patients with colorectal cancer who received curative surgery. Gastrointestinal Tumors 12: e005 doi: 10.48130/git-0025-0005
    Zhu J, Shang J, Li Y, Kulabiek D, Bai L, et al. 2025. Clinicopathological features and prognostic significance of SYT8 in patients with colorectal cancer who received curative surgery. Gastrointestinal Tumors 12: e005 doi: 10.48130/git-0025-0005

Catalog

  • About this article

/

DownLoad:  Full-Size Img  PowerPoint
Return
Return