


-
Breast cancer is the second leading cause of cancer death among women[1]. Given the detrimental effects breast cancer has on an individual's health, it is imperative to diagnose breast cancer early so that prognosis can be improved. DNA methylation, an epigenetic change, has shown promise as a potential predictor of breast cancer risk. Since DNA methylation often occurs early in carcinogenesis, it can be used to possibly predict breast cancer and improve early diagnosis and overall prognosis[2]. Previous research has established that co-methylation among genes can be used as an indicator to identify candidate genes or pathways that may play a significant role in cancer development. Akulenko & Helms identified 133 genes involved in forming 187 gene pairs whose co-methylation signals were highly correlated with one another[3]. From these genes, they were able to further identify four enriched pathways. Zhang & Huang's pan-cancer analysis of DNA co-methylation patterns identified two co-methylation clusters that separate tumor samples from normal samples in 10 out of the 11 cancer types they studied[4]. These findings can lead to the discovery of potential biomarkers in various cancers, further highlighting the importance of studying DNA methylation in the context of breast cancer.
It is crucial to study the methylation patterns of significant cancer genes. Among these genes, tumor suppressor genes (TSGs) are one of the most important types for preventing breast tumor development. TSGs are involved in preventing cancer by controlling cell division, apoptosis, and metastasis. As a result, silencing of TSGs can result in cancer[5,6]. One way for TSGs to become silenced is through epigenetic alterations such as methylation[7]. Previous studies have been performed to examine specific tumor suppressor genes and their methylation patterns across multiple cancer types[8−11]. However, to the author's best knowledge, a comprehensive analysis of different methylation patterns for all available TSGs has not yet been conducted for breast cancer. The purpose of this study was, therefore, to provide the first-ever comprehensive analysis of methylation patterns for TSGs in breast cancer.
In this study, the authors used publicly available breast cancer methylation data from The Cancer Genome Atlas (TCGA) database[12]. They analyzed the overall methylation patterns using the distribution of methylation states as defined by Tian et al.[13]. They then identified differentially methylated (DM) CG sites and associated genes. They also conducted thorough analyses of the co-methylation patterns between DM sites and all CG sites. Finally, they identified and analyzed genes with various co-methylation changes.
-
To study the methylation patterns of tumor suppressor genes and their associated CG sites, the authors used publicly available data from 53 living and 32 deceased breast cancer patients from TCGA. These datasets will be referred to as 53-Alive and 32-Dead samples throughout the rest of this paper. The Illumina human methylation 450K array data for 53-Alive and 32-Dead samples were used, including the datasets of tumor tissues and adjacent solid normal (or matched normal) tissues (i.e., Alive-Tumor, Alive-Normal, Dead-Tumor, and Dead-Normal data). The vital statuses (Alive or Dead) of all samples were determined according to the classifications provided through the TCGA. The authors will explain the reasons for choosing patients with vital statuses and matched normal (or paired) tissues in the Discussion.
Each Illumina dataset contains the beta-value (β) methylation signals of 485,577 CG sites. These beta-values range from 0 (no methylation) to 1 (full methylation). M-values are the transformation of beta methylation signals at each CG site, i.e., M = log2(β/(1−β)). Methylation signals were processed by removing CG sites that were not useful for further analysis. After processing, 391,459 CG sites were left for each sample to carry out further analyses. The processing steps are listed below.
(1) 8,233 CG sites were removed when the start position and the end position were the same. Of these sites, about 5,120 were control sites, and the remaining 3,113 sites were either single nucleotide polymorphisms or non-CG sites.
(2) 397 CG sites were removed because they were located on the Y chromosome.
(3) There were 21 duplicated CG sites with identical positions. The second of each duplication was removed.
(4) 85,467 CG sites were removed because they had NA for all samples in all four datasets (Alive Normal, Alive Tumor, Dead Normal, and Dead Tumor).
Data 2: tumor suppressor genes and associated CG sites
-
To study the methylation patterns of tumor suppressor genes, the 1,217 TSGs identified by Zhao et al. (i.e., TSGene 2.0)[14] were used. These genes were reported as playing the role of tumor suppressor genes in various previous studies[14]. 1,186 of these genes had at least one CG site associated with each of them. In total, 25,977 unique CG sites were associated with all TSGs. The term 'unique CG sites' meant that CG sites associated with two or more genes were only counted once. The authors also used 3,804 housekeeping (HK) genes identified by Eisenberg & Levanon[15] as a reference to study TSGs' overall methylation distribution. 3,746 of these HK genes had at least one CG site associated with each of them. In total, 67,299 unique CG sites were associated with these HK genes.
Statistical analysis
Analysis 1: methylation distribution
-
For every CG site in each dataset, a methylation state was assigned to be 'Low (L)', 'High (H)', 'Low-Median (LM)', 'High-Median (HM)', 'Median (M)', or 'Rest (R)' based on beta-value methylation signals, as defined by Tian et al.[13]. Figure 1 of Tian et al.[13] can be useful to visualize the definitions of methylation states. A methylation state of 'L' meant that all samples' methylation levels of the specific CG site were below 0.2. 'H' indicated all samples' methylation levels were above 0.8, and 'M' was defined if all samples' methylation levels were between 0.2 and 0.8. If a CG site did not meet any of these definitions, it was assigned to belong to either 'LM' or 'HM', where 'LM' indicated all samples had a methylation level below 0.6, and 'HM' meant all samples had a methylation level above 0.4. If a CG site did not belong to any of these categories, it was assigned a methylation state of 'R', which refers to a site with heterogeneous methylation levels.
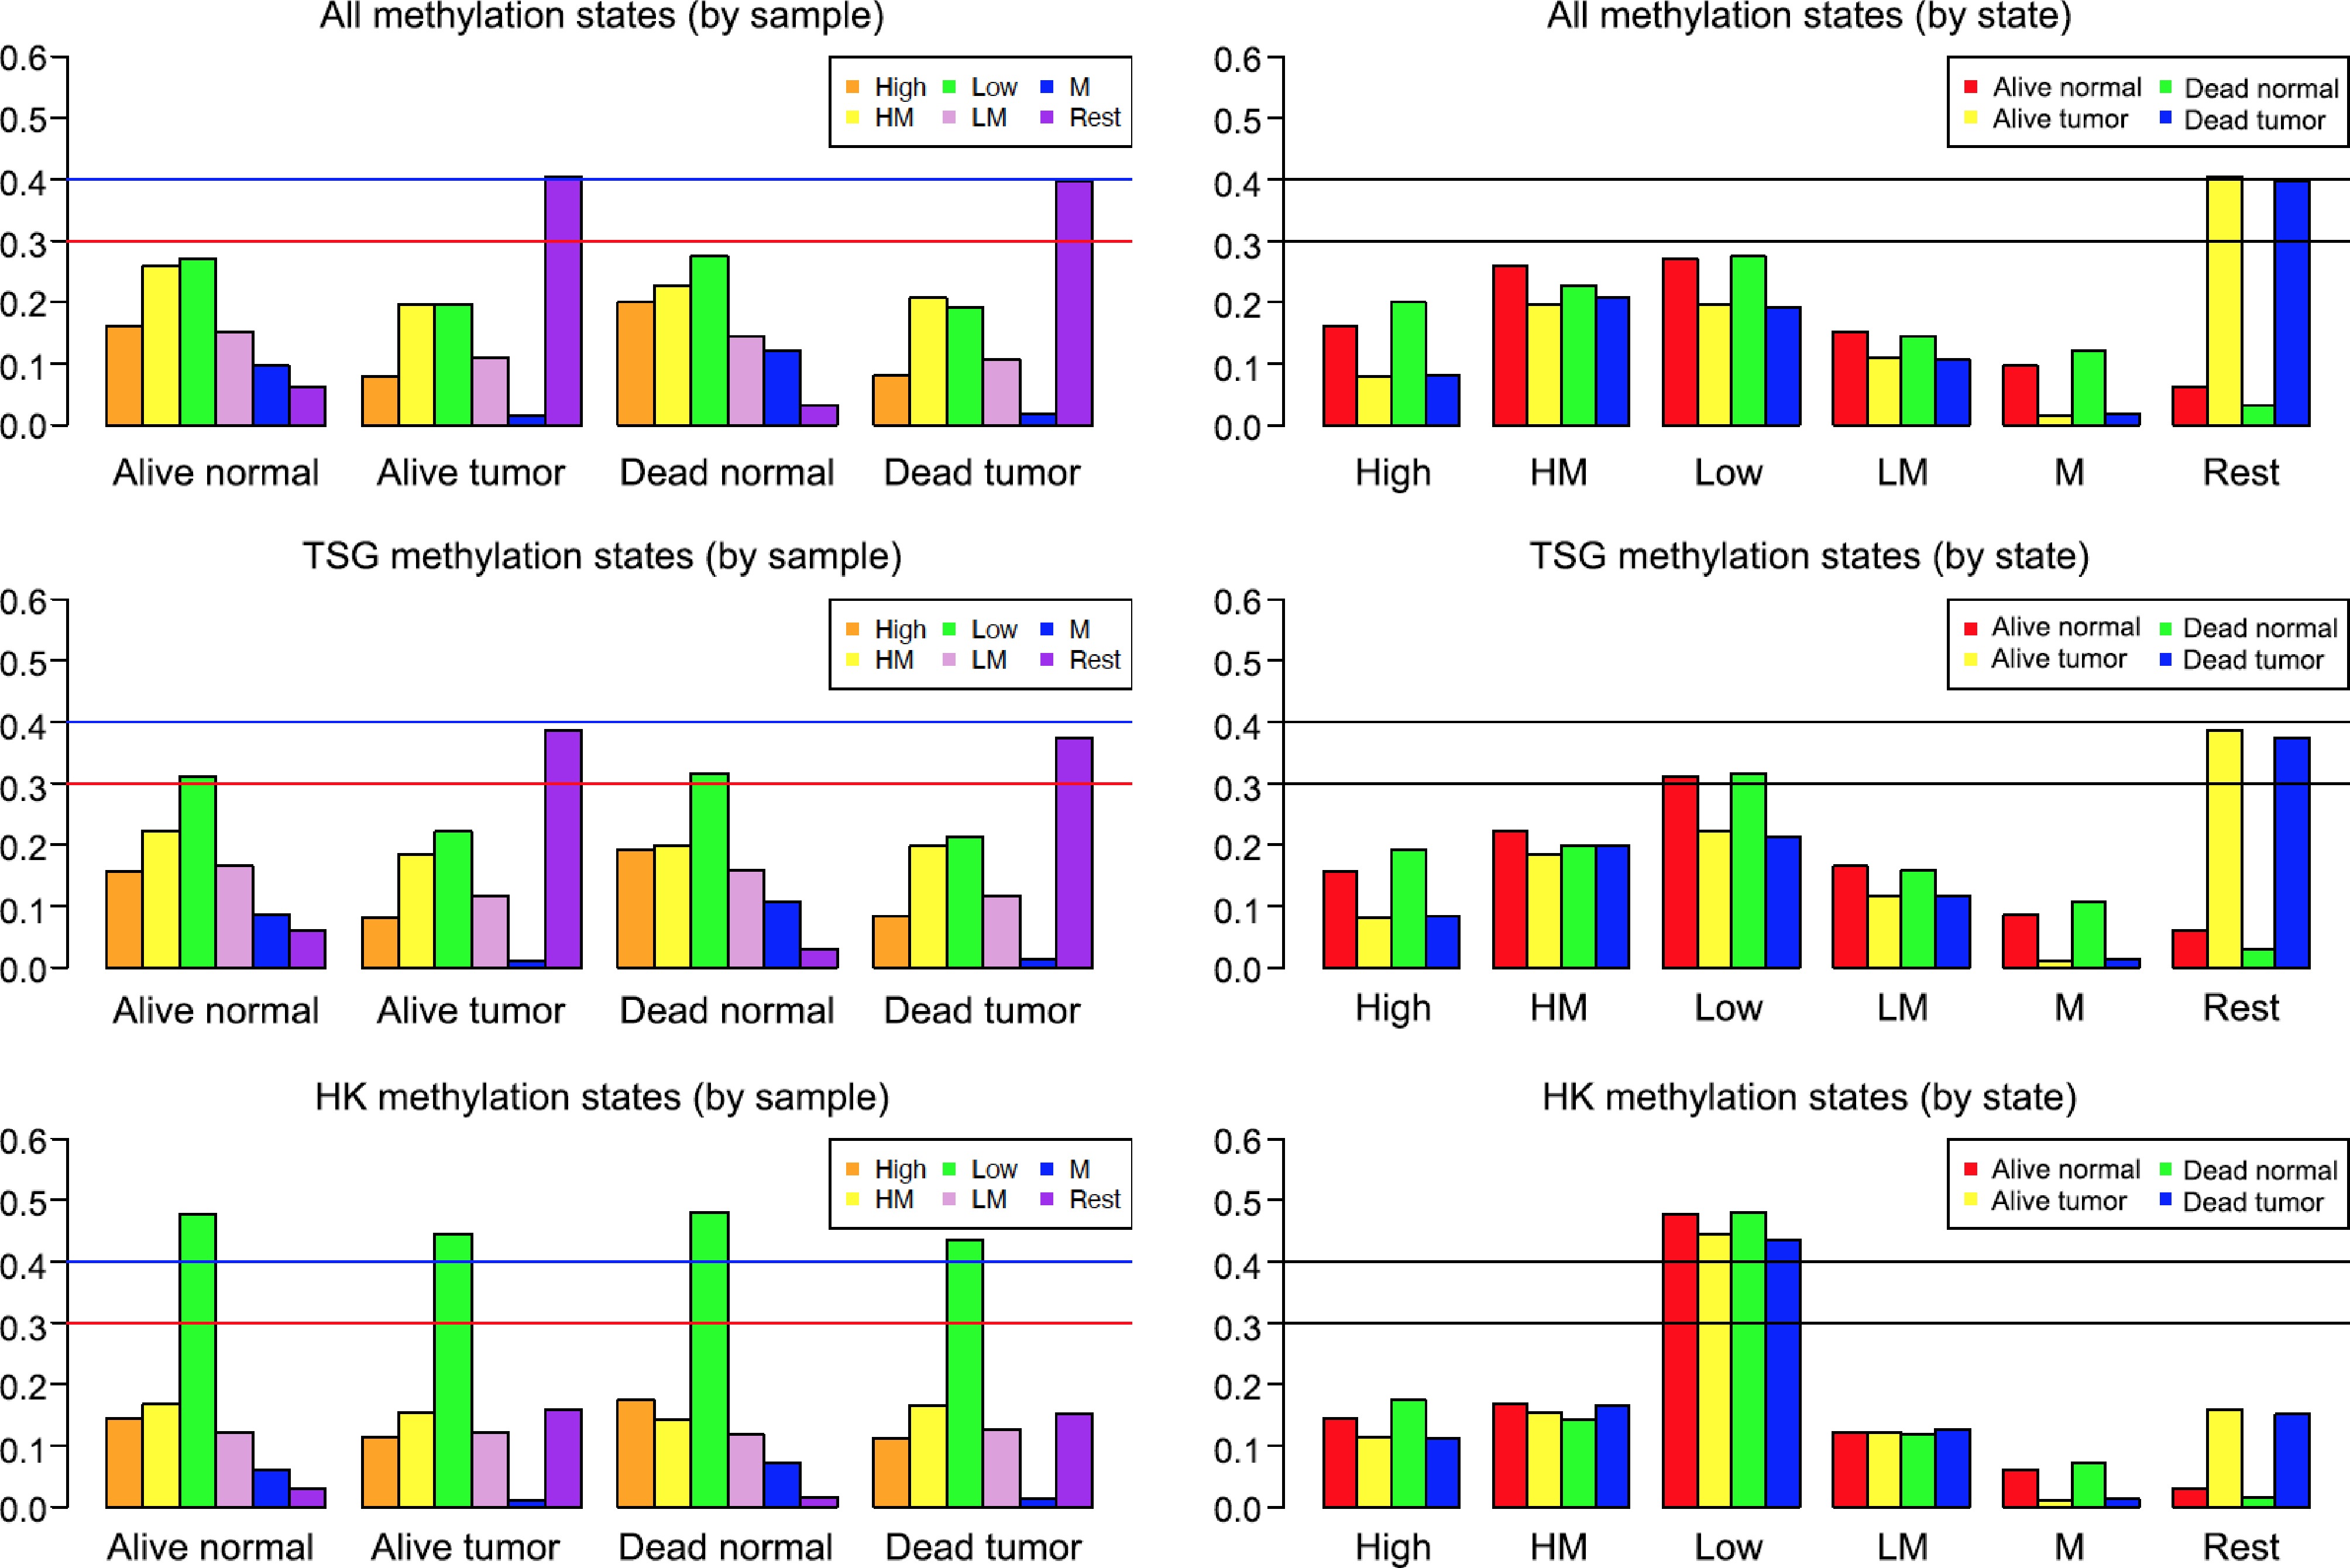
Figure 1.
Methylation states of various breast cancer samples. The vertical axis is proportion (or percentage, e.g., 0.6 means 60%). The left three plots were generated based on samples: Alive Normal, Alive Tumor, Dead Normal, and Dead Tumor. The right three plots were made based on methylation states: High, High-Median (HM), Low, Low-Median (LM), Median (M), and Rest. Two horizontal lines were drawn at 30% and 40% (i.e., 0.3 and 0.4) to make it easy to compare different samples and states.
Analysis 2: differential methylation (DM)
-
To identify DM sites, tumor and matched normal tissues were compared by conducting paired T-tests at each CG site using M-values, which are more statistically valid than beta-values when conducting differential analysis[16]. The mean difference between tumor and normal methylation signals at each CG site was calculated using the original beta-values. A CG site was classified as a DM site if the T-test p-value was < 0.05 and the beta |mean difference| was ≥ 0.2. This was done separately for both the 53-Alive and 32-Dead datasets.
Analysis 3: co-methylation
-
The authors studied the co-methylation patterns by comparing the correlation between each DM site and 391,459 CG sites for different DM categories. They started by categorizing DM sites of TSG genes into three groups based on the overlap between Alive and Dead data: alive-only DM (sites that are only DM in the Alive data), dead-only DM (sites that are only DM in the Dead data), and overlap DM (sites that are DM in both Alive and Dead data). For each of these categories, the correlation was calculated between each DM site and all CG sites using Spearman correlation coefficients. For each DM site, the total number of CG sites that were highly correlated with it was counted. Using the count per DM site and other metrics (e.g., an 8 × 8 matrix detailed later), the co-methylation patterns were compared between normal and tumor tissues as well as between Alive and Dead samples. Different co-methylation changes were identified, and corresponding genes associated with these changes were then analyzed.
-
The overall methylation distribution was studied using methylation states defined in the Methods. Separate bar plots were made to illustrate the distribution by both methylation states and samples for all CG sites, TSG CG sites, and HK CG sites, see Fig. 1. This figure shows the following patterns. First, when comparing based on methylation states (see the top two plots on the right panel), TSG sites and all CG sites had a very similar distribution. The main difference between the two groups was the percentages of 'High-Median' and 'Low', as the 'Low' state had a higher percentage (slightly above 30%) in the TSG plot. Second, the methylation states of Alive Tumor and Dead Tumor were dominated by CG sites classified as 'Rest' (around 40%) in both TSG sites and all CG sites (see the two tall bars above 'Rest' at the right side of the right panels of Fig. 1). This means that the methylation signals of these CG sites have more variation in tumors than in normal tissues (40% vs < 10%). This makes sense considering the heterogeneous nature of tumor tissues. Third, CG sites classified as 'Median' (with methylation signals ranging from 0.2 to 0.8) were much fewer in tumors (far less than 10%) than in normal tissues (at least 10%). That is, normal tissues' partial methylation (i.e., 'Median') patterns were lost or removed in tumor tissues. Finally, there were noticeable differences between the methylation states of the TSG and HK CG sites (second and third panels of Fig. 1). For the TSG sites, the most prevalent methylation state in the Alive Normal and Dead Normal datasets was 'Low' (see green bars on the left panel's middle plot), meaning that the methylation signals across these CG sites are generally low or unmethylated in normal tissues. In the Alive Tumor and Dead Tumor datasets, however, CG sites that were defined as the 'Rest' state made up almost 40% of the TSG sites (see purple bars on the left panel's middle plot). In the HK data, however, over 40% of all four datasets were made up of 'Low' methylation states. That is, for HK CG sites, more than 40% of them remained unmethylated in both Alive and Dead patients' normal and tumor tissues. This shows that most HK CG sites' methylation patterns are relatively stable except for a small percentage of sites that have changed to be more heterogeneous (i.e., the 'Rest' state).
DM patterns
-
DM CG sites were identified by performing paired T-tests using M-values. A CG site was identified as a DM site if its p-value was < 0.05 and its absolute beta-value mean difference was ≥ 0.2. DM sites are summarized in Table 1. This table shows that Dead samples tended to have more DM sites than Alive samples when analyzing all 391,459 CG sites (8.68% vs 6.94%) and all TSG sites (9.34% vs 7.55%). The difference was statistically significant, see p-values shown in the last column of Table 1. As shown in Fig. 2, DM CG sites were then split into three different categories as defined in the previous section: alive-only DM, dead-only DM, and overlap DM. There were 230 alive-only DM sites, 694 dead-only DM sites, and 1,731 overlap DM sites, as shown in Fig. 2.
Table 1. Summary of DM sites and percentages between normal and tumor tissues.
Samples DM sites
(count)DM rates p-value Alive (for all 391,459 CG sites) 27,160 6.94% 2.2e-16
(Compare:
6.94% vs 8.68%)Dead (for all 391,459 CG sites) 33,974 8.68% Alive (for all 25,977 TSG CG sites) 1,961 7.55% 2.746e-13
(Compare:
7.55% vs 9.34%)Dead (for all 25,977 TSG CG sites) 2,425 9.34% 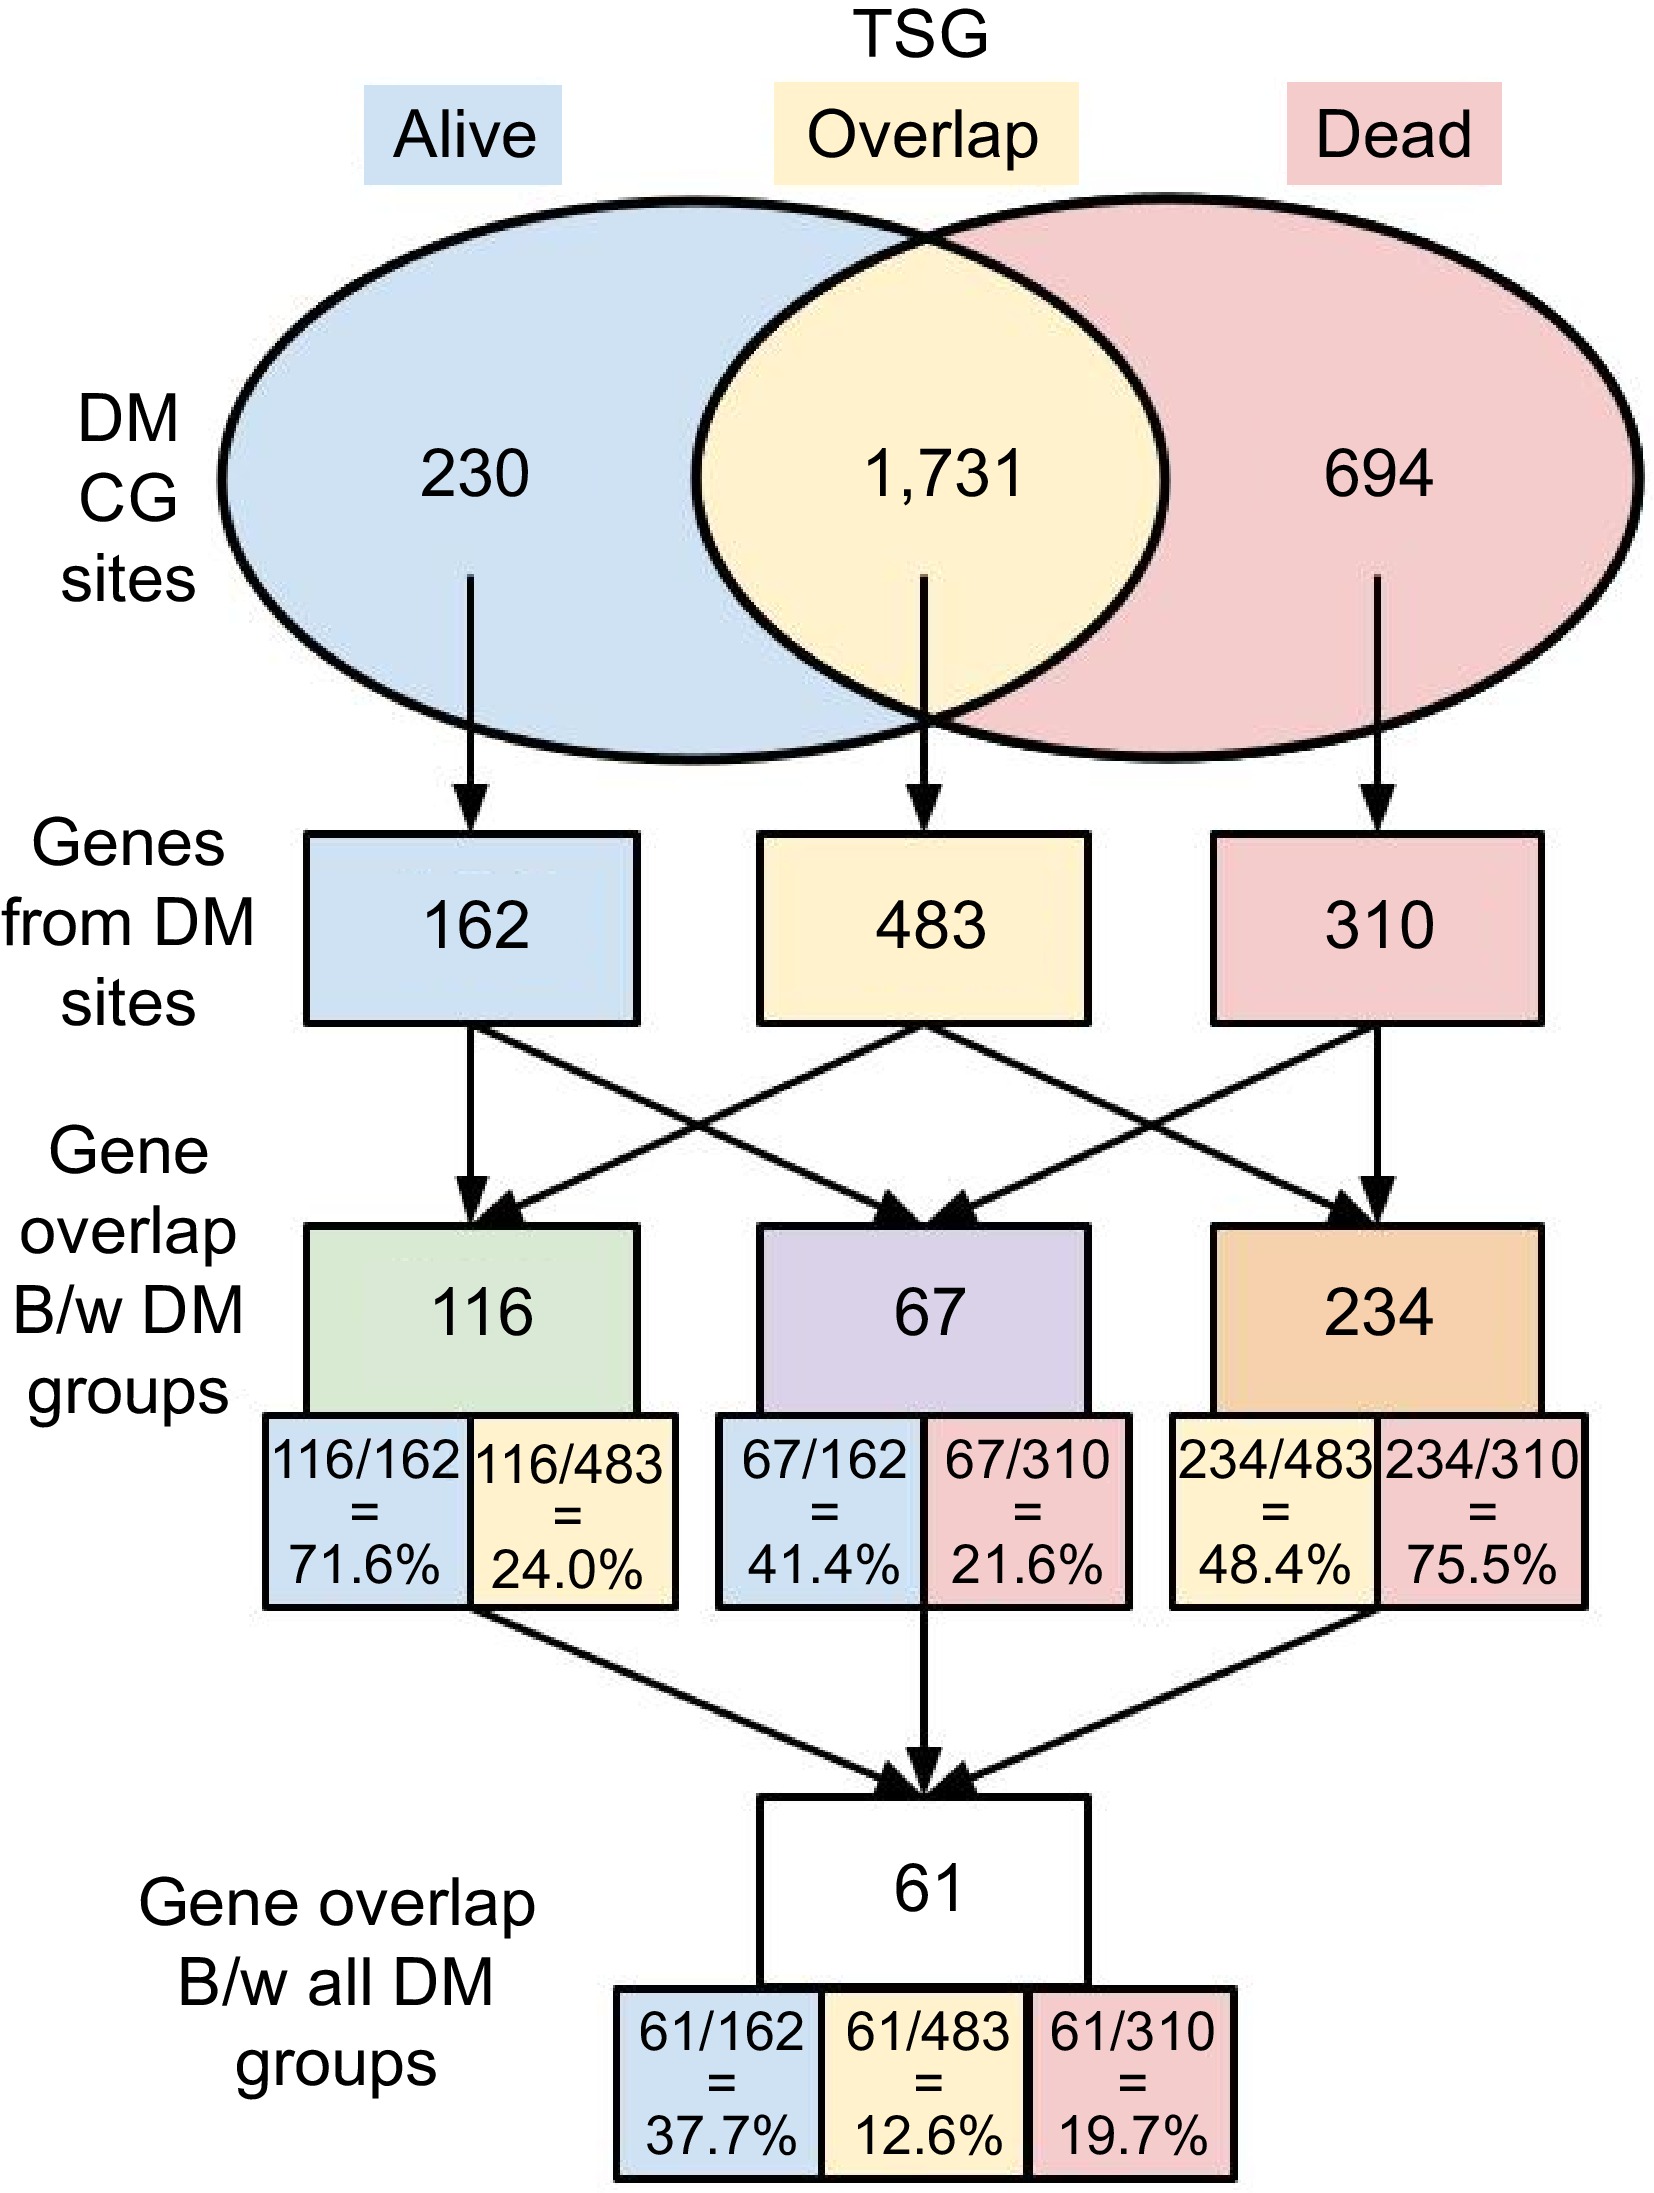
Figure 2.
Numbers of DM sites and associated genes. DM sites were identified between tumor and normal tissues in both 53-Alive and 32-Dead data. DM sites and corresponding genes associated with DM sites in each group were identified, i.e., alive-only, dead-only, and overlap in both Alive and Dead samples.
Unique genes that were associated with DM sites were then found and organized into three groups: 162 genes for alive-only DM sites, 483 genes for overlap DM sites, and 310 genes for dead-only DM sites. As genes can consist of multiple DM sites and a single DM site can be associated with multiple genes, the gene lists for the three DM groups are not mutually exclusive. A shared or common gene between two groups refers to a gene that has at least one DM site in both groups. The shared or common genes between each combination of two DM groups were identified, and the percentage of shared genes from each individual gene list was calculated. One hundred and sixteen genes were shared between alive-only DM and overlap DM (71.6% of Alive and 24% of overlap), 67 genes were shared between alive-only DM and dead-only DM (41.4% of Alive and 21.6% of Dead), and 234 genes were shared between dead-only DM and overlap DM (48.4% of overlap and 75.5% of Dead). Finally, 61 genes were common in all three DM groups (alive-only DM, dead-only DM, and overlap DM). When studying the number of CG sites on these genes, the authors found that the median and mean number of CG sites in these 61 common TSGs were 38 and 59 respectively. However, the median and mean number of CG sites in all TSGs were only 17 and 22 respectively. The 61 shared or common genes had more CG sites, indicating that these genes could be relatively long. These CG sites may have different functions or play different roles due to promoter usage. To have a concise summary, the authors focused on showing the DM results here, and some terms used above will be explained in more detail in the Discussion.
Co-methylation
Co-methylation analysis part 1: high correlation counts
-
To study the co-methylation patterns between DM sites and all CG sites, Spearman correlation coefficients between each DM site and all the 391,459 CG sites were calculated for each of the four datasets: 53 Alive-Tumor, 53 Alive-Normal, 32 Dead-Tumor, and 32 Dead-Normal. There were three categories for the DM sites: alive-only, dead-only, and overlap. In total, 12 different correlation matrices were calculated because there were three DM categories and four types of samples. The CG pairs with absolute correlation coefficients ≥ 0.8 were then further analyzed. These CG pairs were considered highly correlated sites. For each DM CG site, the following four numbers were counted: the number of CG sites that were highly positively correlated with it, the number of CG sites that were highly negatively correlated with it, the number of highly correlated CG sites that were on the same chromosome, and the number of highly correlated CG sites that were on different chromosomes. The authors then compared the co-methylation patterns between normal and tumor tissues as well as between Alive and Dead samples using different figures and tables.
The first four columns of Table 2 show the total number and proportion of highly co-methylated sites for each of the three DM categories (overlap, alive-only, and dead-only) for both 53-Alive and 32-Dead breast cancer patients. The last four columns of Table 2 show the total number and proportion of highly co-methylated pairs that were composed of sites on the same or different chromosomes, positively co-methylated, or negatively co-methylated. To see the patterns, the total number of highly correlated sites was plotted, see Fig. 3. Table 2 and Fig. 3 show that normal tissues had more highly co-methylated pairs than tumor tissues (the green bars are taller than the red bars), and Alive Normal had more highly co-methylated pairs than Dead Normal (two of the three left green bars are taller than the corresponding two of the three right green bars). However, in tumor tissues, there were more highly correlated pairs in Dead Tumor than in Alive Tumor (at least two of the three right red bars are taller than two left red bars). For each combination of DM category and sample type, there were more positive than negative co-methylations (≥ 80% vs ≤ 20%) and more co-methylations on different chromosomes than on the same chromosome (> 85% vs < 15%). These differences may indicate that co-methylation plays a critical role in cancer development.
Table 2. Highly co-methylated pairs on the same and different chromosomes and with positive and negative correlations.
DM sites Samples Total pairs High.cor (%) Same.chr (%) Diff.chr (%) Neg.cor (%) Pos.cor (%) Overlap DM (1731) Alive.Normal 676116483 1108956 (0.164%) 65337 (5.89%) 1043619 (94.11%) 173580 (15.65%) 935376 (84.35%) Alive.Tumor 676116483 61217 (0.00905%) 9068 (14.81%) 52149 (85.19%) 5368 (8.77%) 55849 (91.23%) Dead.Normal 676116483 828833 (0.1226%) 48966 (5.91%) 779867 (94.09%) 50911 (6.14%) 777922 (93.86%) Dead.Tumor 676116483 343043 (0.0507%) 27970 (8.15%) 315073 (91.85%) 27812 (8.11%) 315231 (91.89%) Alive-only DM (230) Alive.Normal 90009005 126721 (0.1408%) 8728 (6.89%) 117993 (93.11%) 7618 (6.01%) 119103 (93.99%) Alive.Tumor 90009005 5760 (0.0064%) 859 (14.91%) 4901 (85.09%) 716 (12.43%) 5044 (87.57%) Dead.Normal 90009005 186396 (0.2071%) 11456 (6.15%) 174940 (93.85%) 5734 (3.08%) 180662 (96.92%) Dead.Tumor 90009005 16785 (0.0186%) 1552 (9.25%) 15233 (90.75%) 1102 (6.57%) 15683 (93.43%) Dead-only DM (694) Alive.Normal 271431381 973059 (0.3585%) 62739 (6.45%) 910320 (93.55%) 194705 (20.01%) 778354 (79.99%) Alive.Tumor 271431381 23288 (0.00858%) 3291 (14.13%) 19997 (85.87%) 3636 (15.61%) 19652 (84.39%) Dead.Normal 271431381 502902 (0.1853%) 32766 (6.52%) 470136 (93.48%) 32206 (6.40%) 470696 (93.60%) Dead.Tumor 271431381 124846 (0.046%) 10087 (8.08%) 114759 (91.92%) 9638 (7.72%) 115208 (92.28%) 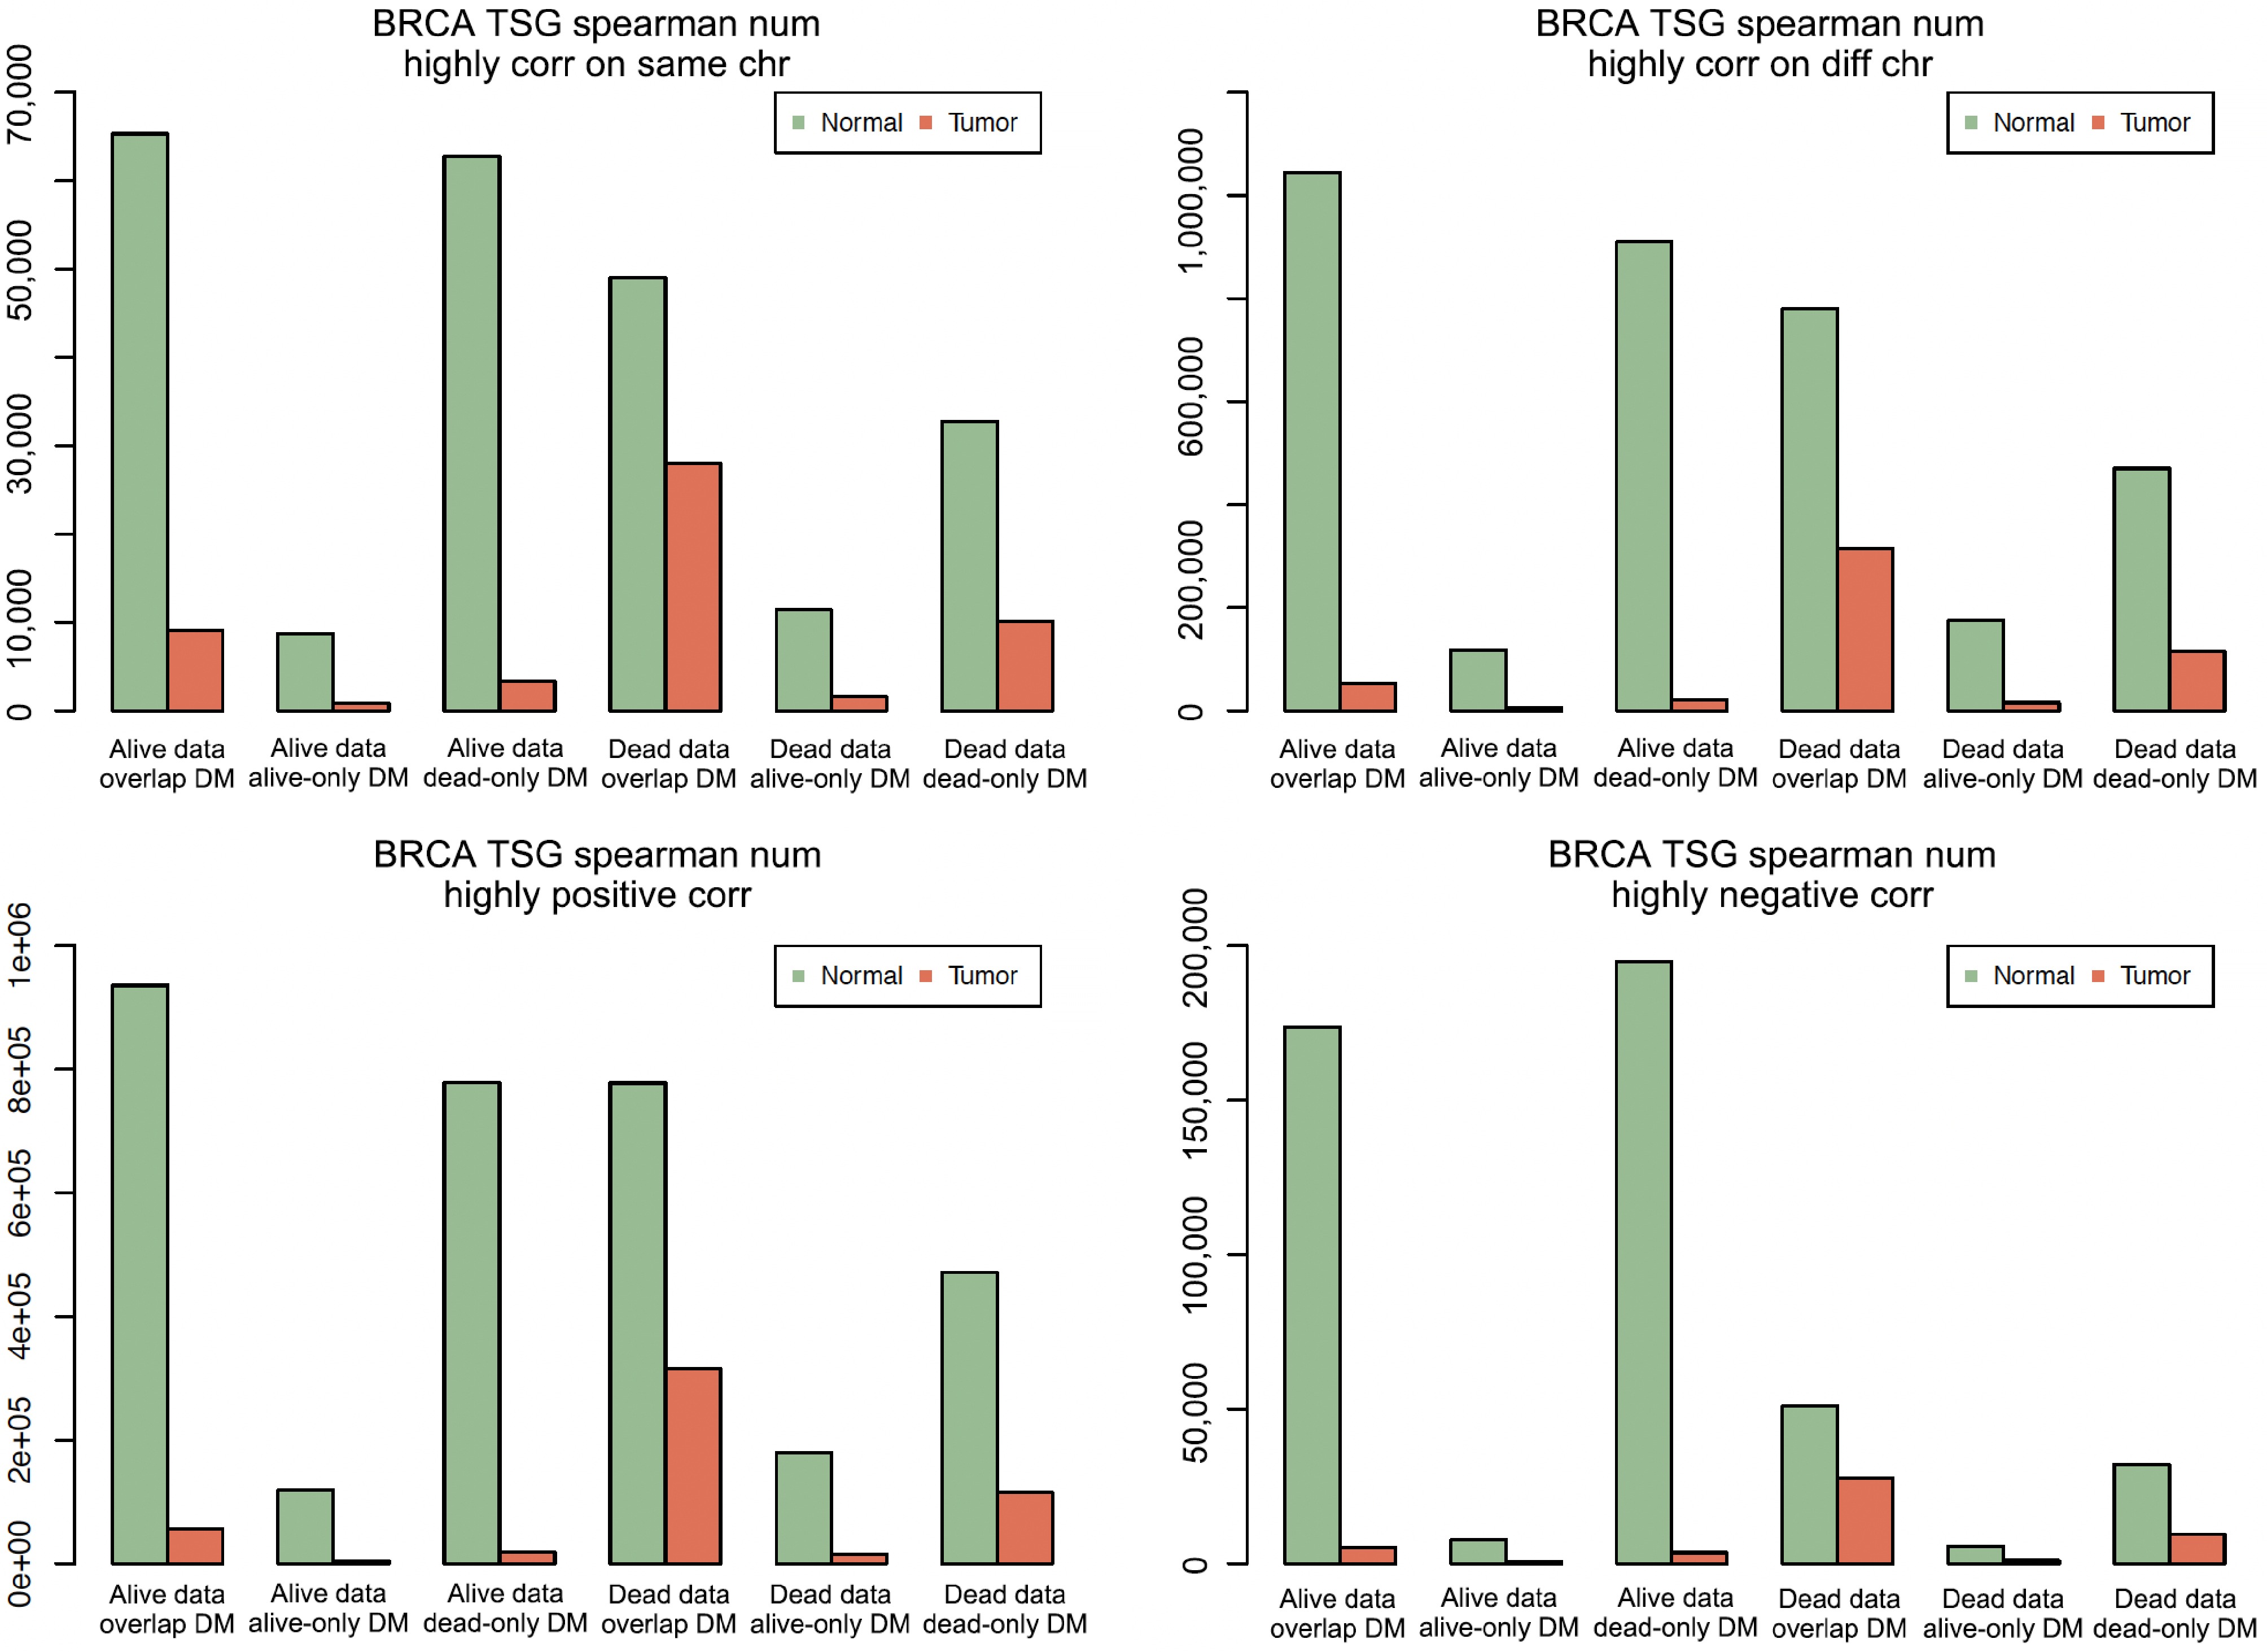
Figure 3.
The total number of highly correlated pairs in different groups. BRCA means breast cancer. In each of the four plots, the first three bar clusters are for 'Alive data, Overlap DM', 'Alive Data, Alive-only DM', and 'Alive Data, Dead-only DM', and the last three bar clusters are for 'Dead Data, Overlap DM', 'Dead Data, Alive-only DM', and 'Dead Data, Dead-only DM'.
Using statistical tests, the following samples were then further compared: 'normal vs tumor' and 'Alive vs Dead' for the proportions on the same (or different) chromosome and with positive (or negative) correlation. This comparison was done for the three groups of DM sites: alive-only DM, dead-only DM, and overlap DM, separately. The test results are listed in Table 3. Only the test p-values of comparing Alive-Normal with Dead-Normal (for dead-only DM and overlap DM sites) were > 0.05 (0.64 and 0.11, respectively). All the other test results were statistically significant with extremely small p-values. In many rows, the percentage differences were at least 3%. For the rows with a percentage difference < 3%, if they still had small p-values in the proportion tests, it could be due to the impact of large counts. A percentage difference of > 5% was considered as biologically significant and meaningful. Figure 4 shows that the co-methylation patterns of the three DM groups and various samples (tumor vs normal, Alive vs Dead) were very different. For example, Fig. 4's top left plot shows that the red bars (for tumors) were taller than the green bars (for normal tissues). This means that tumor tissues tend to have larger percentages of highly correlated sites on the same chromosome than the normal tissues, although the counts are not as large as the normal ones. Figure 4's top left plot shows that the percentage difference between normal and tumor was more obvious in Alive than in Dead samples. Figure 4's bottom right plot shows two (out of three) blue bars (for Alive) were taller than two corresponding black bars (for Dead). This means that there were notably greater counts and percentages of highly negative co-methylation pairs in Alive samples than in Dead samples. All the above differences suggest that differential methylation leads to the change of co-methylation in various samples.
Table 3. Proportion tests for highly co-methylated pairs of different groups.
Alive vs Dead Same.Chr p-value Same.Chr (%) Neg.Cor p-value Neg.Cor (%) Alive Normal vs Dead Normal – Overlap DM 0.64079 5.89% vs 5.91% 0.00 15.65% vs 6.14% Alive Tumor vs Dead Tumor – Overlap DM 0.00 14.81% vs 8.15% 4.16E-08 8.77% vs 8.11% Alive Normal vs Dead Normal – Alive-only DM 1.17E-16 6.89% vs 6.15% 0 6.01% vs 3.08% Alive Tumor vs Dead Tumor – Alive-only DM 4.34E-33 14.91% vs 9.25% 5.17E-45 12.43% vs 6.57% Alive Normal vs Dead Normal – Dead-only DM 0.11344 6.45% vs 6.52% 0.00 20.01% vs 6.4% Alive Tumor vs Dead Tumor – Dead-only DM 3.71E-192 14.13% vs 8.08% 0.00 15.61% vs 7.72% Normal vs Tumor Same.Chr p-value Same.Chr (%) Neg.Cor p-value Neg.Cor (%) Alive Normal vs Alive Tumor – Overlap DM 0.00 5.89% vs 14.81% 0.00 15.65% vs 8.77% Dead Normal vs Dead Tumor – Overlap DM 0.00 5.91% vs 8.15% 0.00 6.14% vs 8.11% Alive Normal vs Alive Tumor – Alive-only DM 0.00 6.89% vs 14.91% 0.00 6.01% vs 12.43% Dead Normal vs Dead Tumor – Alive-only DM 1.52E-55 6.15% vs 9.25% 3.57E-127 3.08% vs 6.57% Alive Normal vs Alive Tumor -- Dead-only DM 0.00 6.45% vs 14.13% 7.42E-62 20.01% vs 15.61% Dead Normal vs Dead Tumor -- Dead-only DM 1.32E-85 6.52% vs 8.08% 1.90E-62 6.4% vs 7.72% 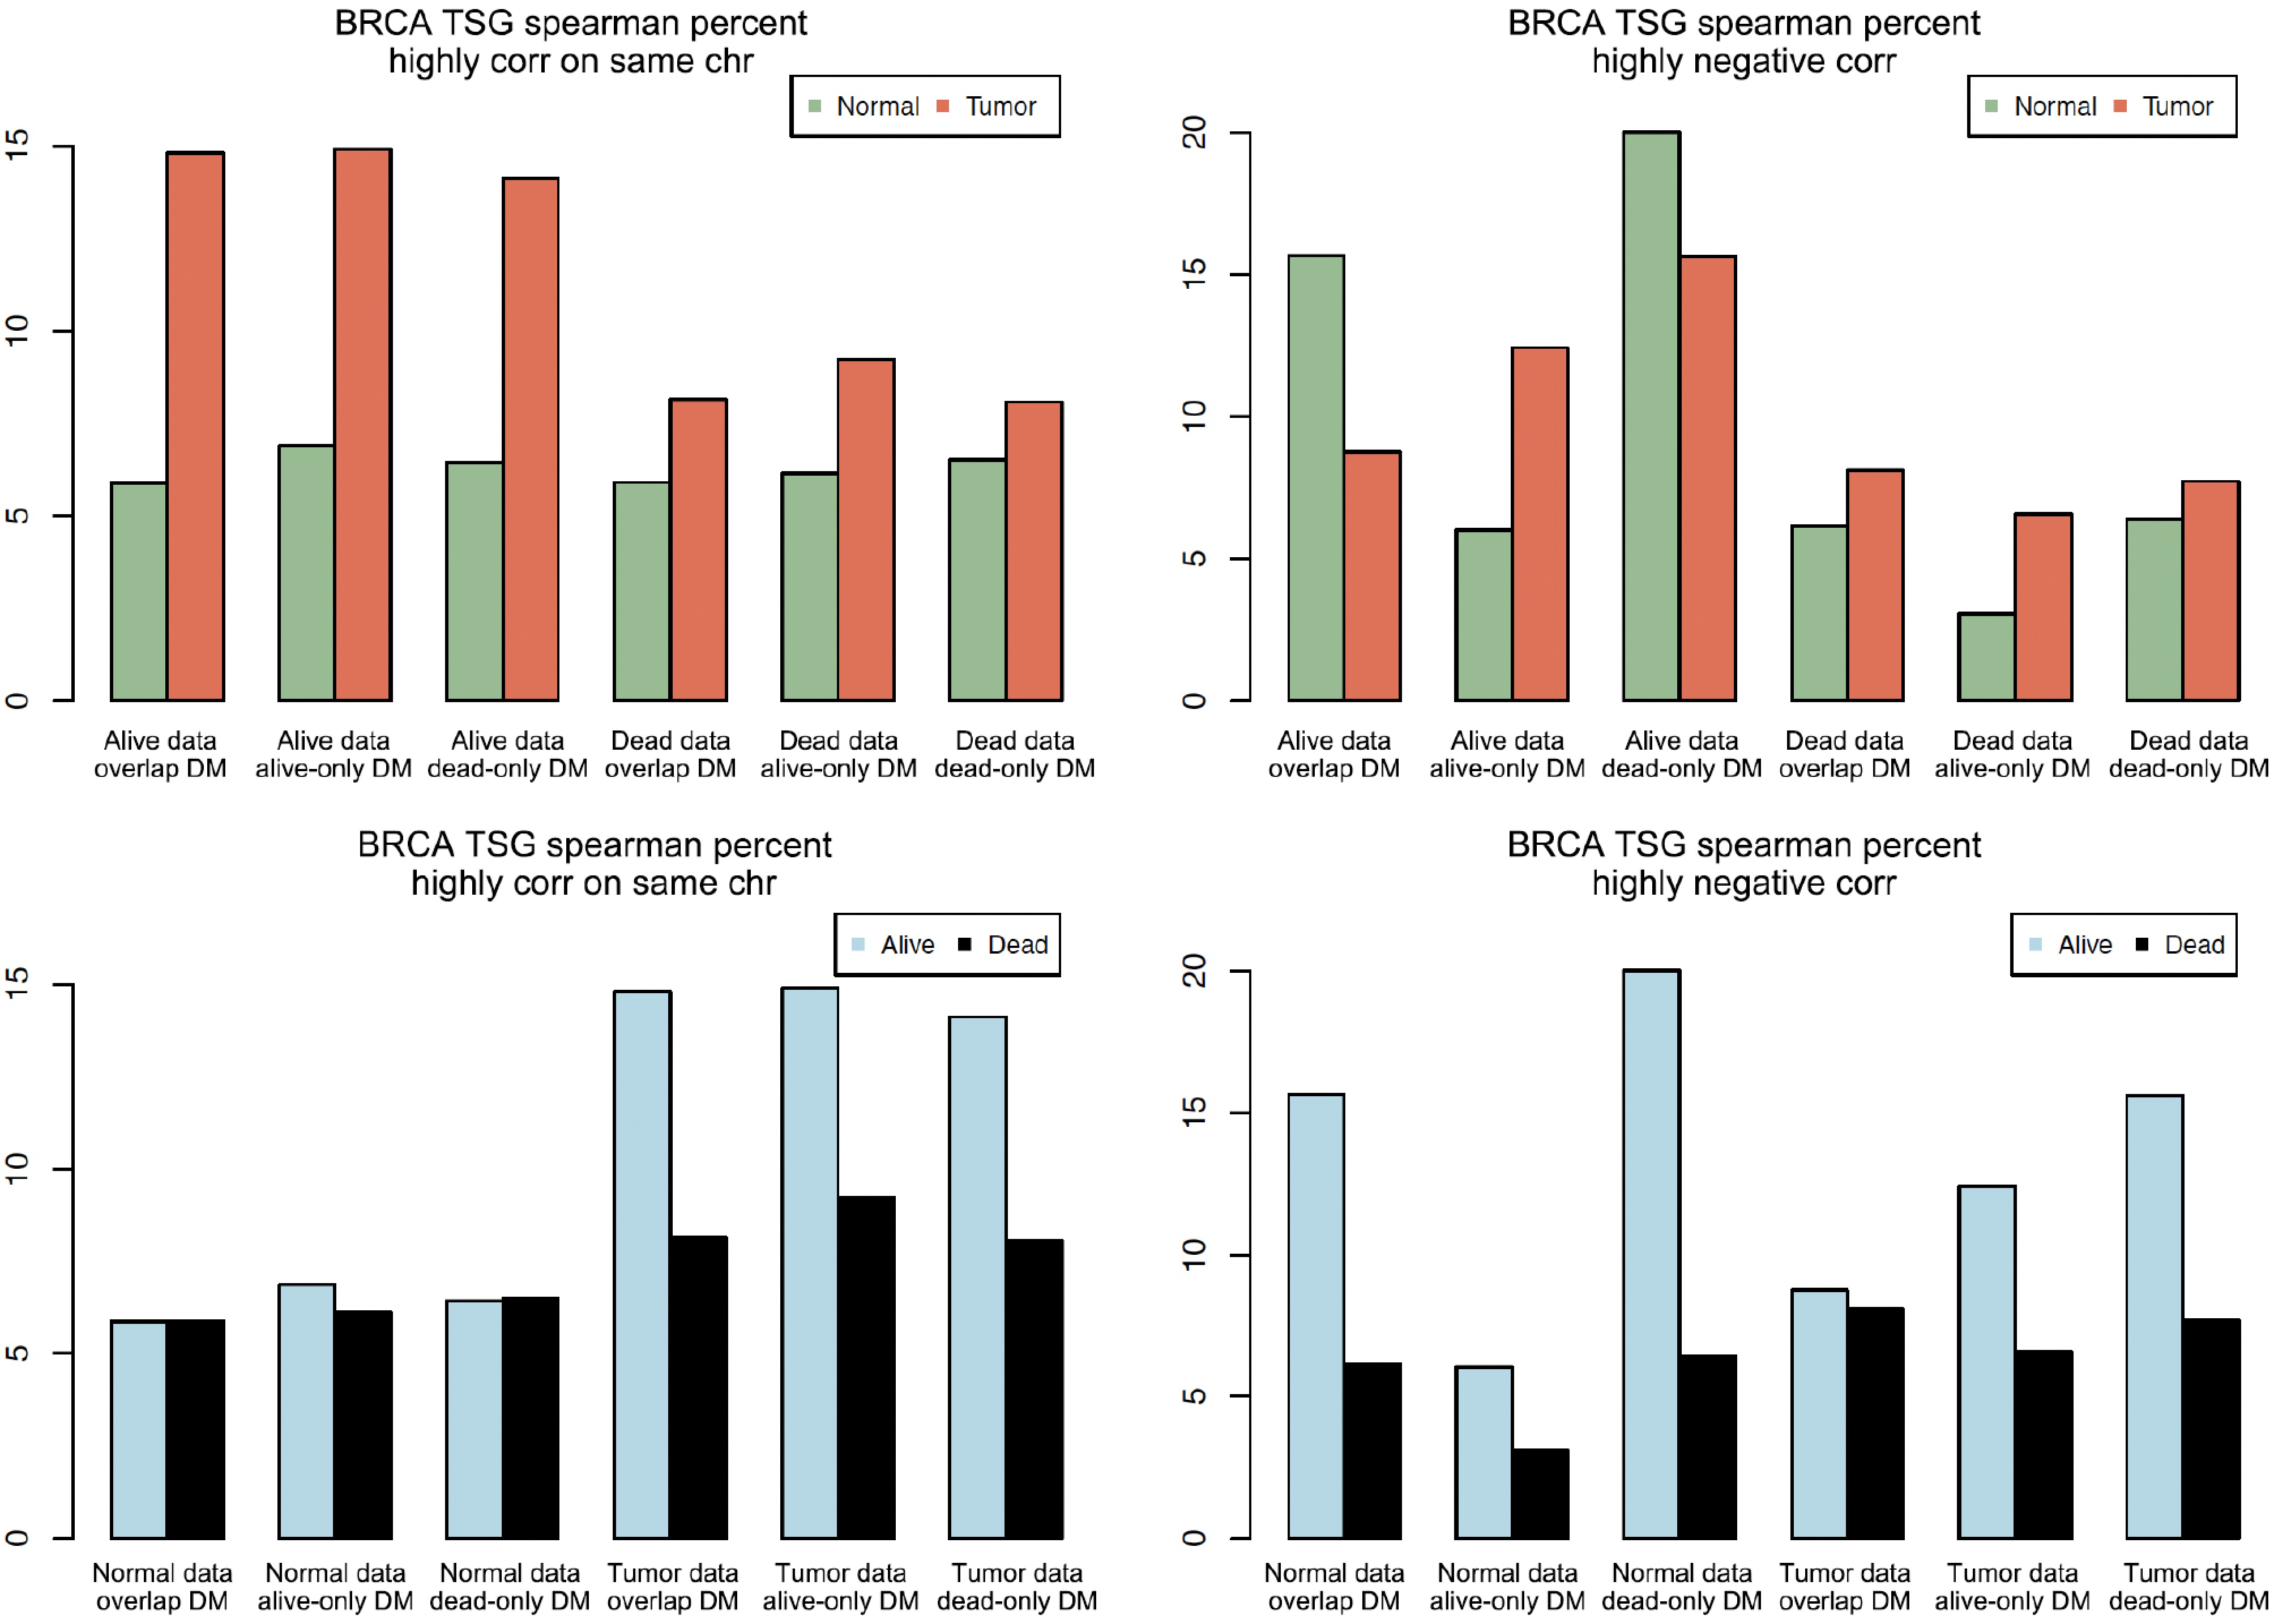
Figure 4.
Bar plots of highly correlated pairs on the same chromosome and with negative correlation. The vertical axis is the percentage (e.g., 15 means 15%).
Although Table 2 and Fig. 3 show the total number (i.e., sum) of highly correlated pairs, they do not show the overall distribution for the co-methylation patterns of all DM sites. To thoroughly compare the co-methylation patterns of different datasets (i.e., normal vs tumor, Alive vs Dead), the authors counted the number of highly correlated (with correlation |r| ≥ 0.8) partners (CG sites) per DM site in each dataset. They then drew the density plots for the counts of all DM CG sites in Alive Normal, Alive Tumor, Dead Normal, and Dead Tumor data, as shown in Fig. 5. This figure shows the distribution of these counts. For the three types of DM sites, different line types were used: solid lines for overlap DM, dashed lines for alive-only DM, and dashed-dotted lines for dead-only DM. Because the counts were extremely large for some CG sites and the distributions were very skewed, the root 4 transformation was used to show a clear pattern. Below is a summary of the key patterns of Fig. 5.
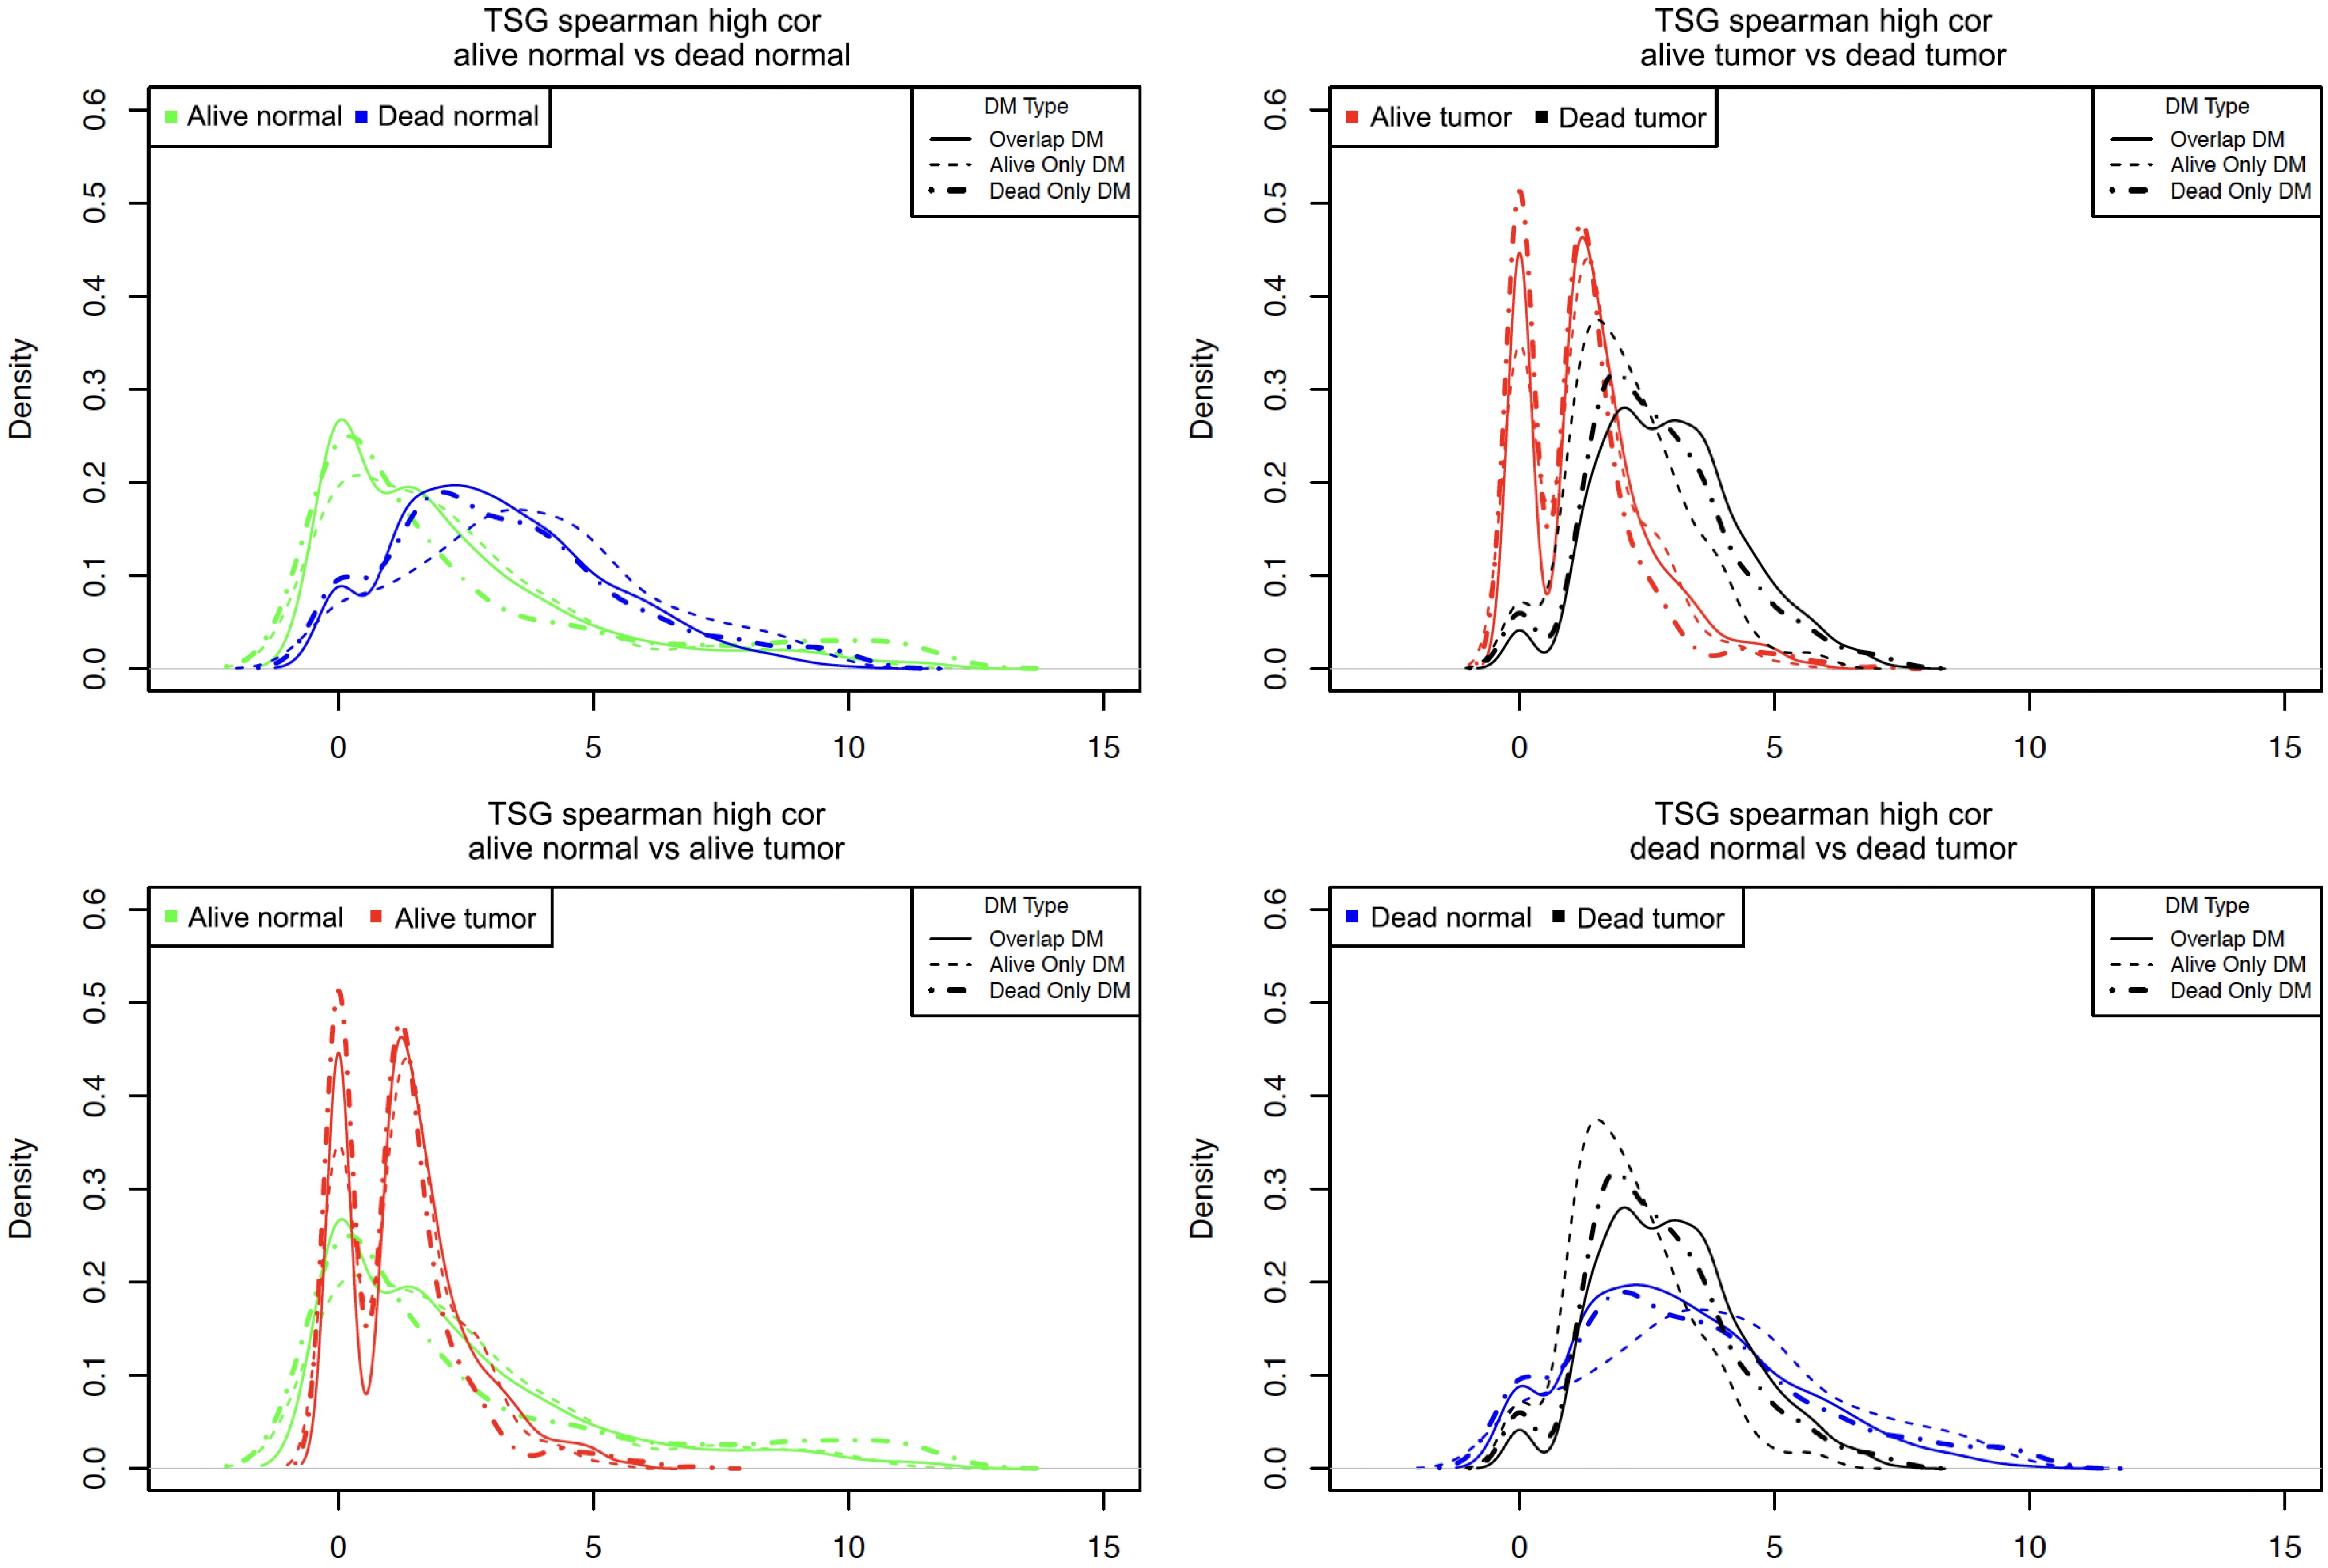
Figure 5.
Density plots for the number of highly correlated sites per DM site in different samples. Note, the count of the highly correlated partners that each DM site had was calculated and then the root 4 transformation of each count was used to generate the above density plots.
First, the top left plot shows the comparison of Alive Normal with Dead Normal (i.e., green vs blue lines). There is a peak around 0 in the Alive Normal (green lines) but not in Dead Normal (blue lines). That is, a larger number of CG sites in Alive Normal than in Dead Normal were not highly correlated with other sites. However, some CG sites were more highly correlated with many sites in Alive Normal (long green tails) than in Dead Normal (no long blue tails). Second, the top right plot shows the comparison of Alive Tumor vs Dead Tumor (i.e., red vs black lines). This plot shows the Alive Tumor had a much smaller number of highly correlated sites than the Dead Tumor (see the two red peaks near 0). On the other hand, the Dead Tumor samples had more CG sites with a high number of correlated partners (black lines). Third, the bottom left plot shows the comparison of normal and tumor tissues in the Alive data (i.e., Alive Normal vs Alive Tumor). It shows that tumor tissues had a larger number of CG sites not highly co-methylated with others (see the two tall red peaks near 0, which were much taller than the green peak around 0). Again, normal tissues had some CG sites highly co-methylated with many CG sites (see the long green tail at the right end). Fourth, the bottom right plot shows the comparison of normal and tumor tissues in the Dead data (i.e., Dead Normal vs Dead Tumor). This plot shows that Dead Tumor samples had more CG sites with certain correlations, but the correlations were not that strong (see the taller black lines between 0 and 5 on the left side). However, Dead Normal samples had more CG sites with strong co-methylations (see the longer blue tails at the right end). Finally, when comparing the three types of lines (solid, dashed, and dashed-dotted), their differences were much less notable than the differences between the two different colors (e.g., Alive Normal green lines vs Dead Normal blue lines). This meant that the co-methylation differences among the three types of DM sites (i.e., different types of lines) were less obvious than the differences between various samples (i.e., lines of different colors).
In summary, in normal tissues, some CG sites tended to be highly co-methylated with many other CG sites. In tumor tissues, some of these co-methylations were lost, and some new co-methylation relationships were developed. These patterns can be seen in both Alive and Dead samples. Meanwhile, the Alive and Dead samples have different co-methylation patterns. The above patterns may indicate that genes tend to maintain certain functions and interactions through co-methylation in normal tissues or in the early stage of cancers (as shown in Alive samples). However, with differential methylation, these co-methylation patterns were lost or weakened in tumor tissues or in the later stage of cancers (as shown in Dead samples).
Co-methylation analysis part 2: investigating co-methylation changes based on 8 × 8 matrices
-
Following previous examples[17,18], the authors calculated several 8 × 8 matrices as explained below. These matrices show in detail how co-methylation patterns of DM sites changed from normal to tumor tissues in both Alive and Dead samples. For both normal and tumor data, the correlation coefficient values were divided into eight intervals: [−1, −0.75), [−0.75, −0.5), [−0.5, −0.25), [−0.25, 0), [0, 0.25), [0.25, 0.5), [0.5, 0.75), and [0.75, 1). Each CG pair in the TSG correlation matrix was mapped to its corresponding category. For example, if a CG pair had a correlation coefficient of 0.4 in the normal tissue and 0.8 in the tumor tissue, it would be counted in the cell with the row name normal [0.25, 0.5) and column name tumor [0.75, 1). For both Alive and Dead samples, 8 × 8 matrices were calculated for each of the three DM categories: alive-only DM, dead-only DM, and overlap DM. That is, in total, there were six of these 8 × 8 correlation matrices. Figure 5 shows that the co-methylation differences among the three types of DM sites were less notable than the differences among various samples (tumor vs normal, Alive vs Dead samples). Therefore, to save some space, only two of these 8 × 8 matrices calculated based on the overlap DM sites were shown in the main text, see Table 4. Each number in the 8 × 8 matrix was a count. The percentage of CG sites for each combination was the count divided by the total number of CG sites in a specific row of the normal correlation range. For example, the count in the first cell was 4,297 (0.757%), which meant 4,297 CG pairs (i.e., 0.757% of the total pairs) had correlation coefficients in the range of [−1, 0.75) in the Alive Normal data, and they remained in [−1, 0.75) in the Alive Tumor data.
Table 4. Two 8 × 8 matrices showing co-methylation changes between normal and tumor tissues.
Normal Eight correlation intervals for tumor tissues (Overlap DM sites) Alive T[−1, −0.75) T[−0.75, −0.5) T[−0.5, −0.25) T[−0.25, 0) T[0, 0.25) T[0.25, 0.5) T[0.5, 0.75) T[0.75, 1) N[−1, −0.75) 4297 73818 182298 201921 88579 16019 785 4 0.7569% 13.0025% 32.1105% 35.5669% 15.6026% 2.8216% 0.1383% 0.0007% N[−0.75, −0.5) 9387 446831 2224635 4629139 3733207 1167473 96376 496 0.0763% 3.6305% 18.0754% 37.6122% 30.3327% 9.4858% 0.7831% 0.0040% N[−0.5, −0.25) 6650 564390 6011579 24309202 26269230 7781659 605428 4656 0.0101% 0.8610% 9.1706% 37.0834% 40.0734% 11.8708% 0.9236% 0.0071% N[−0.25, 0) 3867 526811 10131385 62857780 86421033 26476788 1905978 15584 0.0021% 0.2797% 5.3793% 33.3748% 45.8858% 14.0580% 1.0120% 0.0083% N[0, 0.25) 2414 350385 8278526 66488860 1.20E+08 47972035 4210138 39078 0.0010% 0.1415% 3.3427% 26.8471% 48.5817% 19.3703% 1.7000% 0.0158% N[0.25, 0.5) 897 152662 3177399 26650227 59823925 35385440 4881785 61851 0.0007% 0.1173% 2.4416% 20.4790% 45.9710% 27.1915% 3.7513% 0.0475% N[0.5, 0.75) 255 38374 627733 4235769 11121962 10632349 2638530 65056 0.0009% 0.1307% 2.1381% 14.4270% 37.8813% 36.2137% 8.9868% 0.2216% N[0.75, 1) 4 905 30043 196838 611727 895235 432303 30042 0.0002% 0.0412% 1.3674% 8.9590% 27.8425% 40.7463% 19.6761% 1.3673% Dead T[−1, −0.75) T[−0.75, −0.5) T[−0.5, −0.25) T[−0.25, 0) T[0, 0.25) T[0.25, 0.5) T[0.5, 0.75) T[0.75, 1) N[−1, −0.75) 2157 17975 34195 45471 38048 16498 2191 25 1.3777% 11.4812% 21.8415% 29.0438% 24.3025% 10.5378% 1.3995% 0.0160% N[−0.75, −0.5) 13472 244397 1112990 2657168 2616850 1030260 129771 1918 0.1726% 3.1306% 14.2566% 34.0365% 33.5200% 13.1969% 1.6623% 0.0246% N[−0.5, −0.25) 27130 795739 6105060 19946327 22732054 9355171 1238490 19905 0.0451% 1.3214% 10.1379% 33.1225% 37.7484% 15.5350% 2.0566% 0.0331% N[−0.25, 0) 26559 1184801 10812917 41537423 57090359 27525978 4224644 81291 0.0186% 0.8315% 7.5889% 29.1523% 40.0679% 19.3186% 2.9650% 0.0571% N[0, 0.25) 17384 1084594 11855469 52334484 8.43E+07 47341213 8402419 196268 0.0085% 0.5276% 5.7668% 25.4570% 41.0294% 23.0281% 4.0872% 0.0955% N[0.25, 0.5) 7709 586844 7584976 41334942 81234297 53617788 11292281 347076 0.0039% 0.2994% 3.8698% 21.0886% 41.4448% 27.3552% 5.7612% 0.1771% N[0.5, 0.75) 1510 126824 1643208 9757545 22967367 20208793 6471237 327785 0.0025% 0.2062% 2.6717% 15.8648% 37.3427% 32.8575% 10.5216% 0.5329% N[0.75, 1) 21 3841 48287 234001 590675 863640 561199 57167 0.0009% 0.1628% 2.0471% 9.9202% 25.0410% 36.6131% 23.7914% 2.4235% Table 4's top panel is for Alive samples and the bottom panel is for Dead samples of the overlap DM sites' correlation or co-methylation with all 391,459 CG sites. For each correlation level or interval, there are two rows. One row is the count, and the next row is the corresponding percentage. The first column is for normal tissues' correlation intervals (i.e., 'N' means normal). The other eight columns are tumor tissues' correlation intervals (i.e., 'T' means tumor). To compare the 53-Alive and 32-Dead samples' co-methylation changes between normal and tumor tissues, the authors calculated the percentage differences between corresponding Dead and Alive intervals, '% dead − % alive', for each DM category: alive-only, dead-only, and overlap. They then plotted heatmaps for these three '% dead − % alive' matrices, as shown in Fig. 6. For the three heatmaps, there are a few striking patterns. First, the left heatmap (for alive-only DM) had a lighter overall color. However, the middle and right heatmaps had a much darker red color. This means that the dead-only DM (middle) and the overall DM (right) had a higher percentage of change than the alive-only DM (left). Second, there were darker red and blue colors in the middle rows (i.e., around the [−0.5, 0.5) intervals) of the three heatmaps. These darker colors represented larger '% dead - % alive' differences. That is, the differences in percentages were greatest in the tumor [−0.5, 0.5) intervals. This means that many CG pairs had strong correlations in the normal tissues, but they lost those strong correlations in the tumor tissues. Third, this graph shows two dark red squares on the left side of the right heatmap (for overlap DM). These dark squares meant that the largest percentage of change between Alive and Dead data was from highly negative correlations [−1, −0.75) in normal data to 'sleeping' correlations in tumor data. Note, 'sleeping' meant no/low correlation in the range of −0.5 to 0.5. The above pattern-changes show that when comparing Dead and Alive samples, there were more co-methylation changes between normal and tumor tissues in Dead samples than in Alive samples. This difference may indicate that co-methylation plays a key role in cancer development. The change of the methylation levels (i.e., differential methylation) led to the change of co-methylation in various samples and at different cancer stages.
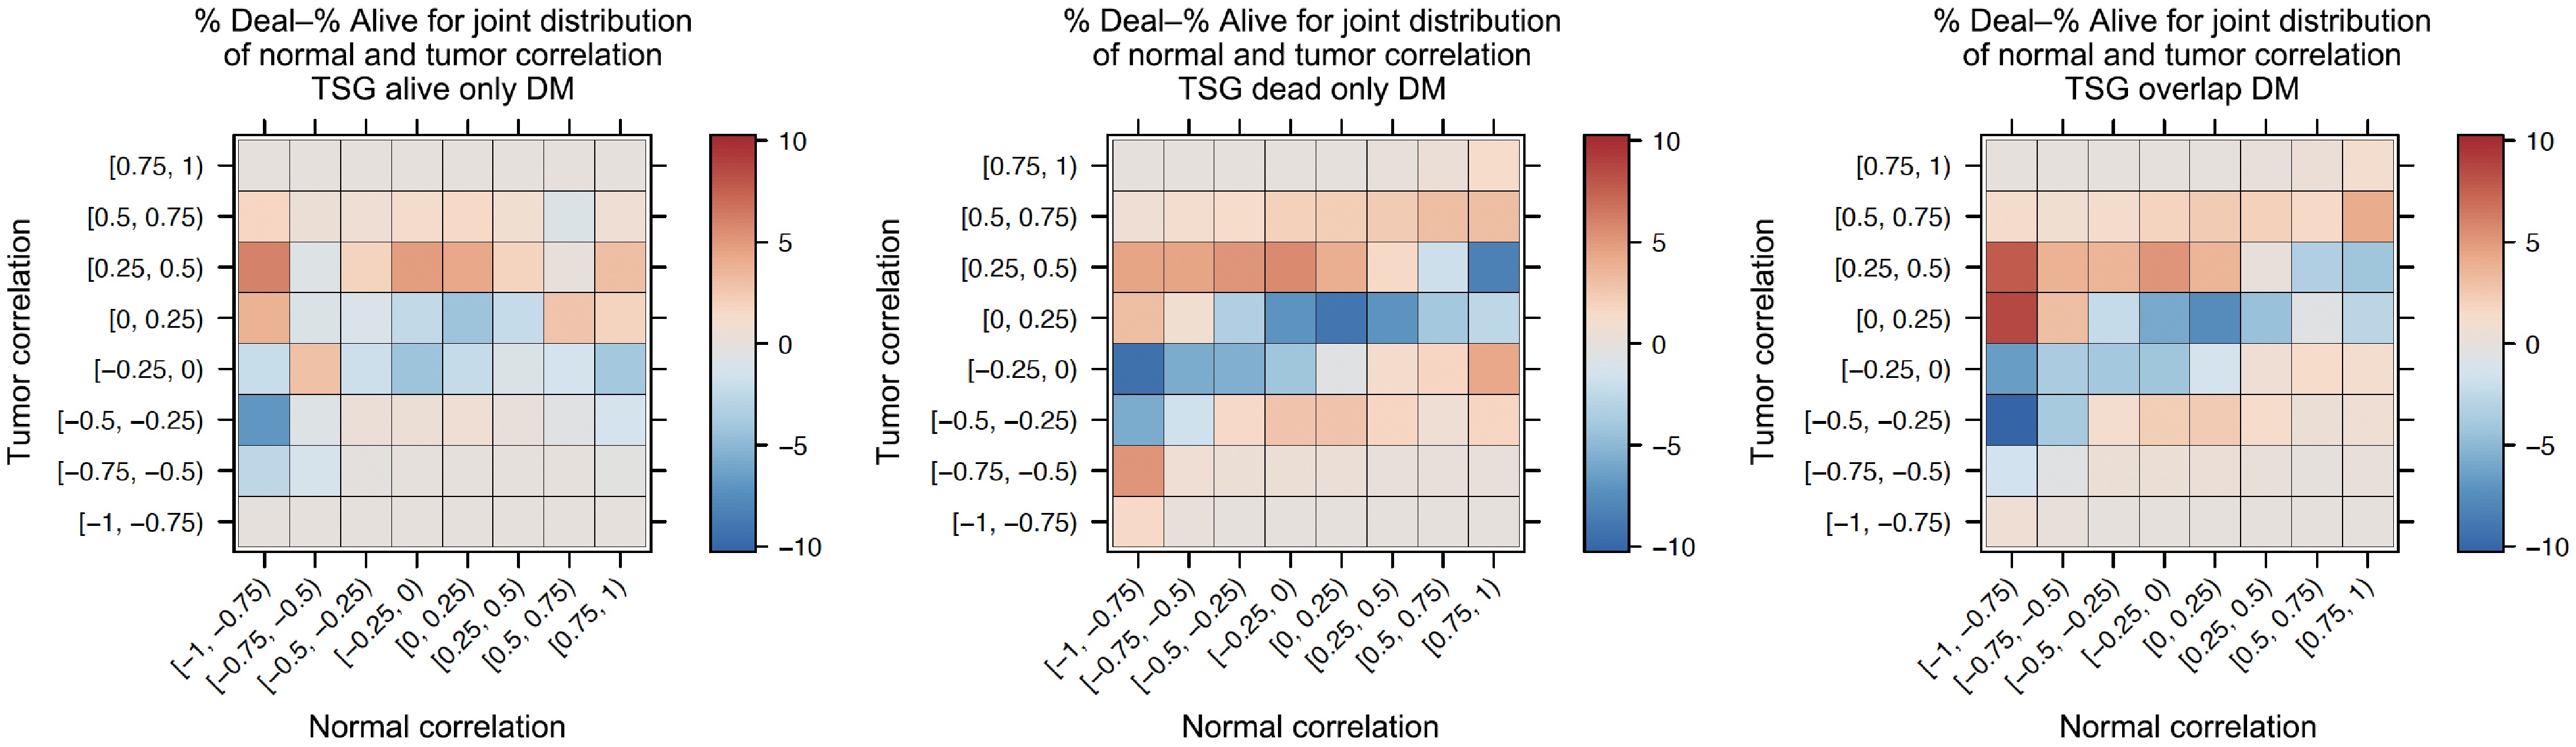
Figure 6.
Heatmaps of comparing co-methylation changes from normal to tumor.
To see the patterns of normal to tumor co-methylation changes, the 8 × 8 matrices were further condensed into 4 × 4 matrices that contained the following four intervals: [−1, 0.5), [−0.5, 0), [0, 0.5), [0.5, 1). Essentially, the authors combined the first two rows and columns, the middle four rows and columns, and the bottom two rows and columns of the 8 × 8 matrices. To modify the 8 × 8 matrices, they took the sum of the raw counts for each corresponding interval and then divided that sum by the total sum of the four rows/columns involved. This gave the percentage of CG pairs in each cell.
Bar plots were created to show the distribution of tumor correlation coefficients for each level of normal correlation, see Fig. 7. This figure shows the co-methylation change from normal to tumor based on the 4 × 4 matrix. These bar plots show that for all DM groups and all normal correlation levels, tumor [−0.5, 0) and tumor [0, 0.5) intervals were the most frequent correlation levels (see the orange and light-green bars). Additionally, for normal [−1, −0.5) and normal [−0.5, 0) intervals (i.e., the top two plots), all DM groups had a higher count in Alive than Dead samples (that is, left bar-clusters were taller than the right bar-clusters). However, for normal [0, 0.5) interval (i.e., the bottom left plot), Alive and Dead data had very similar frequencies, while for normal [0.5, 1) interval (i.e., the bottom right plot), Dead was more frequent than Alive (that is, the bar-clusters of Dead samples were taller than the ones of Alive samples). In all intervals except for the normal [−1, −0.5) interval (i.e., in the top right plot and the bottom two plots), most CG sites tended to fall into the tumor [0, 0.5) interval (i.e., the light-green bars tended to be taller than other bars). As for the normal [−1, −0.5) interval (i.e., the top left plot), most CG sites tended to fall into the tumor [−0.5, 0) interval (orange bars). Within each of the four plots, the overall pattern/distribution of the CG pair intervals was similar among the three different DM types (alive-only DM, dead-only DM, and overlap DM). The above summary shows that the strong negative and positive correlations in the normal tissues tended to be weakened or removed in the tumor tissues (see the top left and bottom right plots). Normal tissues' weak or low correlations tended to remain in the same or nearby intervals, except that some of these were changed to high correlations (see the purple bars on the bottom left plot).
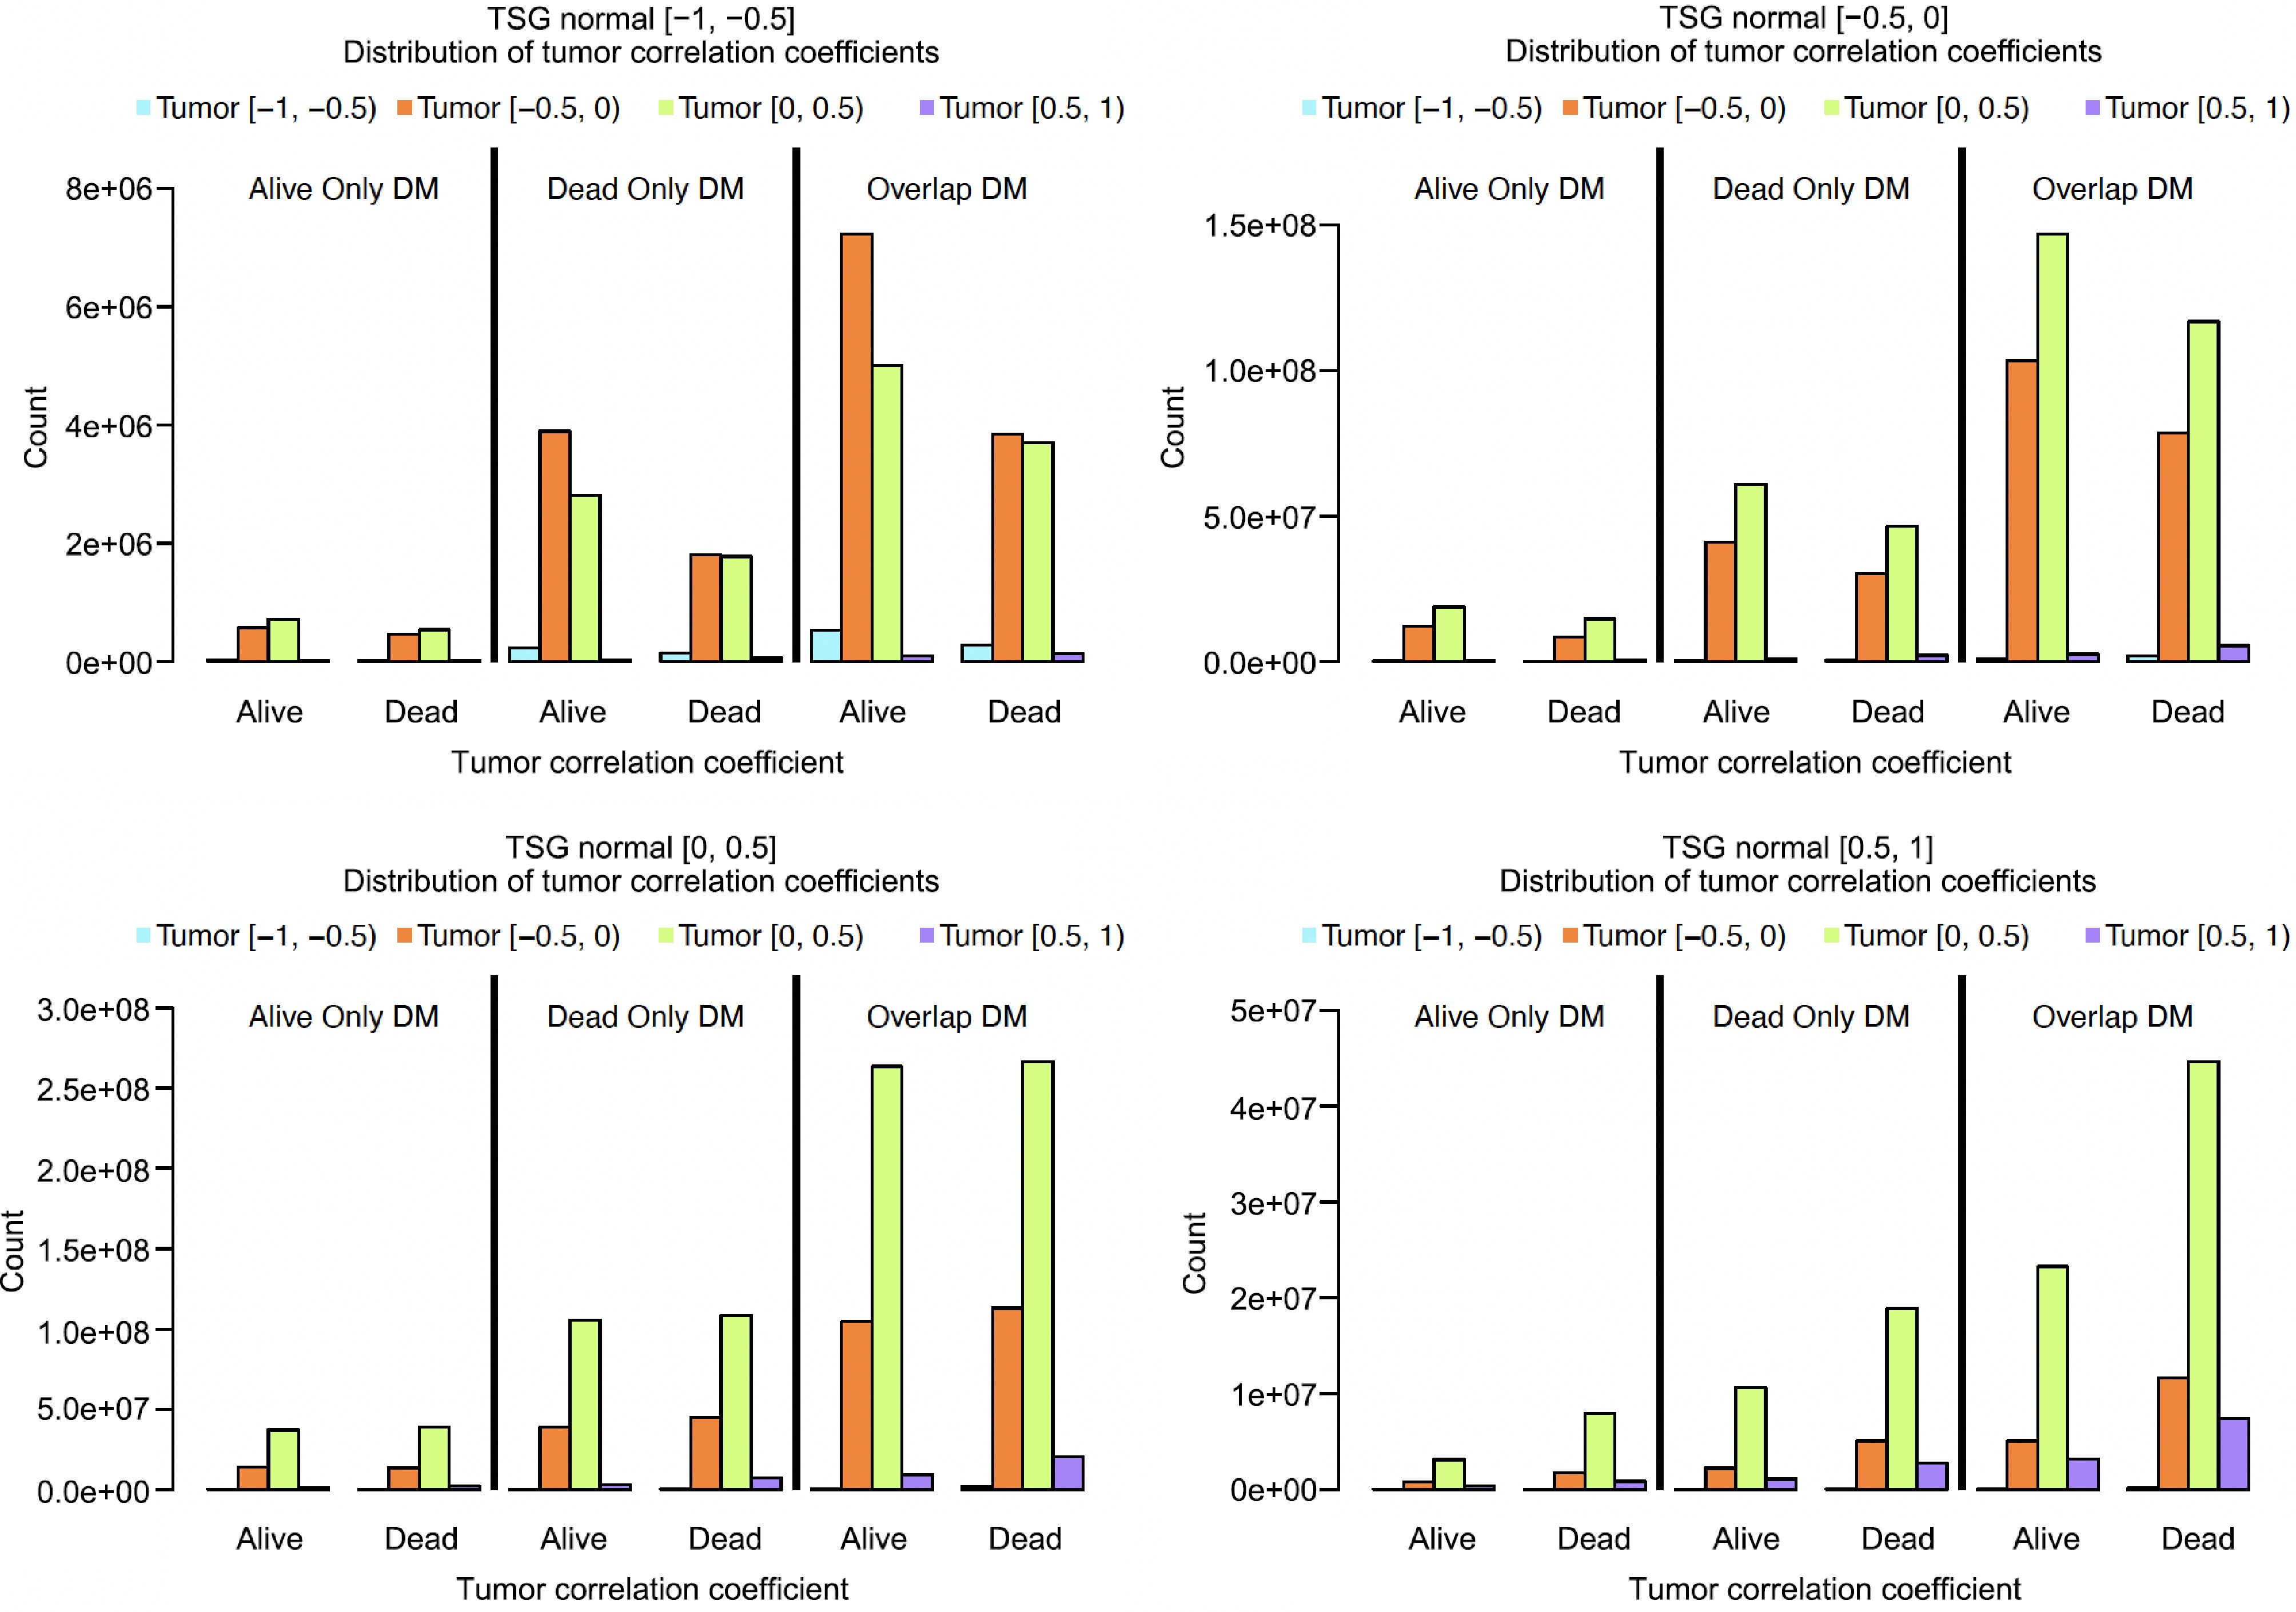
Figure 7.
Comparing the co-methylation changes in Alive and Dead samples based on 4 × 4 matrices.
Co-methylation analysis part 3: identifying genes with complex co-methylation changes
-
To find important genes involved in complex co-methylation changes, the authors identified the genes associated with the CG sites that fell within certain correlation levels (or intervals) shown in the 8 × 8 matrix. This was done for the overlap DM sites in Alive and Dead data separately. A negative to positive CG pair (neg2pos) was defined as one that had a highly negative correlation coefficient in the normal data but a highly positive correlation coefficient in the tumor data. The inverse of that was referred to as a positive to negative (pos2neg) correlation change. A sleeping CG site pair (sleeping.neg or sleeping.pos) was defined as one that had a low or 0 correlation coefficient (i.e., 'sleeping') in the normal data and a highly positive or negative correlation coefficient in the tumor data. Similarly, a shutting-down CG site pair (neg2shutting or pos2shutting) was defined as one that had a highly negative or positive correlation coefficient in the normal data but a low correlation coefficient (i.e., 'shutting') in the tumor data. The specific interval criteria and shorthand notation for the six categories were outlined in Table 5. From this point forward, the categories will be referred to as 'panels', and the indicated shorthand will be used.
Table 5. Definition of co-methylation pattern changes from normal to tumor tissues.
Panel Panel shorthand Normal interval Tumor interval Normal negative to tumor positive neg2pos [−1, −0.75) [0.5, 1) Normal positive to tumor negative pos2neg [0.75, 1) [−1, −0.5) Normal sleeping to tumor negative sleeping.neg [−0.25, 0.25] [−1, −0.75) Normal sleeping to tumor positive sleeping.pos [−0.25, 0.25] [0.75, 1) Normal negative to tumor shutting neg.shutting [−1, −0.75) [−0.1, 0.1] Normal positive to tumor sleeping pos.shutting [0.75, 1) [−0.1, 0.1] Gene analyses were further conducted by looking at the CG sites associated with TSGs and non-TSGs separately. All TSGs and non-TSGs associated with CG sites for each correlation (or co-methylation) change were obtained. The number of CG sites per gene in each of the six correlation changes was used to find genes of interest. For each of those six changes/panels listed in Table 5, Ng.Alive, and Ng.Dead were used to denote the numbers of CG sites associated with a gene (g) in Alive and Dead data, respectively. The four selection methods (A, B, C, and D) were listed below. Essentially, the authors separated the data into four categories: TSG overlap-DM Alive data, TSG overlap-DM Dead data, non-TSG overlap-DM Alive data, and non-TSG overlap-DM Dead data.
A. Only-alive for each change/panel: Ng.Alive ≥ 3 and Ng.Dead = 0.
B. Only-dead for each change/panel: Ng.Alive = 0 and Ng.Dead ≥ 3.
C. Shared in ≥ 4 same panels: the gene had Ng.Alive ≥ 3 and Ng.Dead ≥ 3 in at least four of six common panels (neg2pos, pos2neg, sleeping.neg, sleeping.pos, neg.shutting, pos.shutting). That is, the authors extracted CG sites that were present in the same ≥ 4 panels between the Alive and Dead samples and were also associated with ≥ 3 CG sites.
D. Difference: |Ng.Alive − Ng.Dead| ≥ 3 and both Ng.Alive and Ng.Dead were not zero in at least four panels (neg2pos, pos2neg, sleeping.neg, sleeping.pos, neg.shutting, pos.shutting). That is, the authors obtained CG sites that were present in ≥ 4 same panels between Alive and Dead samples and had an absolute difference of ≥ 3 CG sites when comparing the respective genes/panels between Alive and Dead datasets.
Based on the selection methods A and B (i.e., only-alive or only-dead for each panel), genes were further filtered by only extracting those associated with ≥ 3 CG sites in each panel. The selected TSGs and non-TSGs are shown in Table 6. This table shows that Dead samples (2nd and 4th rows) had more genes associated with co-methylation changes than Alive samples (1st and 3rd rows). For the non-TSG panels (see Table 6 last two rows), there was a notable difference between the raw number of extracted genes in the Alive and Dead samples. In five out of six panels (neg2pos, po2neg, sleeping.neg, sleeping.pos, pos.shutting), the Dead samples contained a larger number of genes. Most notably, for the sleeping.pos and pos.shutting panels, Alive data contained 20 and 67 genes, respectively, while Dead data contained 2,288 and 2,193 genes, respectively. In the neg.shutting category, however, Alive samples contained 605 genes while Dead samples contained 100 genes. When looking at the TSGs (see Table 6 first two rows), the neg.shutting genes in the Alive data were similar to the Dead data (20 vs 23). However, there were also more pos.shutting genes in Dead samples than in Alive samples (61 vs 1). Furthermore, when examining genes found in Alive samples for each change, no genes were found in pos2neg and sleeping.pos panels. The neg.shutting panel had the largest number of TSGs (20 genes). Additionally, the sleeping.pos panel had the most genes (81) associated with it in the Dead data.
Table 6. Summary of number of genes with different co-methylation changes.
Category neg2pos pos2neg sleeping.neg sleeping.pos neg.shutting pos.shutting Total TSG identified by Method A:
only Alive for each change or panel, Ng.Alive ≥ 3 and Ng.Dead = 01 0 2 0 20 1 24 TSG identified by Method B:
only Dead for each change or panel, Ng.Alive = 0 and Ng.Dead ≥311 17 49 81 23 61 242 Non-TSG identified by Method A:
only Alive for each change or panel, Ng.Alive ≥ 3 and Ng.Dead = 04 5 5 20 605 67 706 Non-TSG identified by Method B:
only Dead for each change or panel, Ng.Alive = 0 and Ng.Dead ≥ 338 123 601 2,288 100 2,193 5,343 Based on the selection method C (Alive and Dead shared in ≥ 4 same panels), 33 TSGs and 68 non-TSGs were identified. In the non-TSG data, only EIF2B5 had changes (or were present) in all six panels at high-frequencies. That is, only 1.5% (1/68) of the multiple-panel and high-frequency genes were present in all six panels. In the TSG data, TP73, EPHB3, and MAD1L1 were present in all six panels with high-frequencies. That is, 9% (3/33) of the multiple panel and high-frequency genes were present in all six panels.
Based on the selection method D (Alive and Dead difference), 30 TSGs and 92 non-TSGs were identified. The only gene with changes in all six panels for the TSG dataset was TP73. In the non-TSG dataset, only DIIP2C and EIF2B5 were present in all six panels. In both datasets, the Dead-counts were typically higher than the Alive-counts. The only exceptions to this were pos.shutting counts for the non-TSG DIP2C (difference of −5) and the neg.shutting counts for the non-TSG EIF2B5 (difference of −9).
The above co-methylation analysis shows that multiple CG sites on the same gene can have different and complex co-methylation relationships with other CG sites in the genome. These co-methylation patterns changed between tumor and normal tissues and between Alive and Dead samples (i.e., at different cancer stages). These patterns and changes indicated complex interactions between genes, which might affect tumor growth and thus cancer development. The differences in certain co-methylation changes (e.g., sleeping.pos or pos.shutting) might play an important role in differentiating between Alive and Dead samples and between non-TSGs and TSGs.
Co-methylation analysis part 4: network and pathway analysis
-
The ConsensusPath Database (CPDB) analysis[19−21] was conducted for the 30 TSG and 92 non-TSG lists identified based on method D. These genes were selected based on |Dead – Alive| ≥ 3 and both were non-zero counts in at least four panels. This analysis was to further investigate how the selected significant genes interacted with others. The CPDB analysis shows different interactions and relationships among the genes from this study and other genes in the genome; see Fig. 8 (based on 30 TSGs) and Fig. 9 (based on 92 non-TSGs).
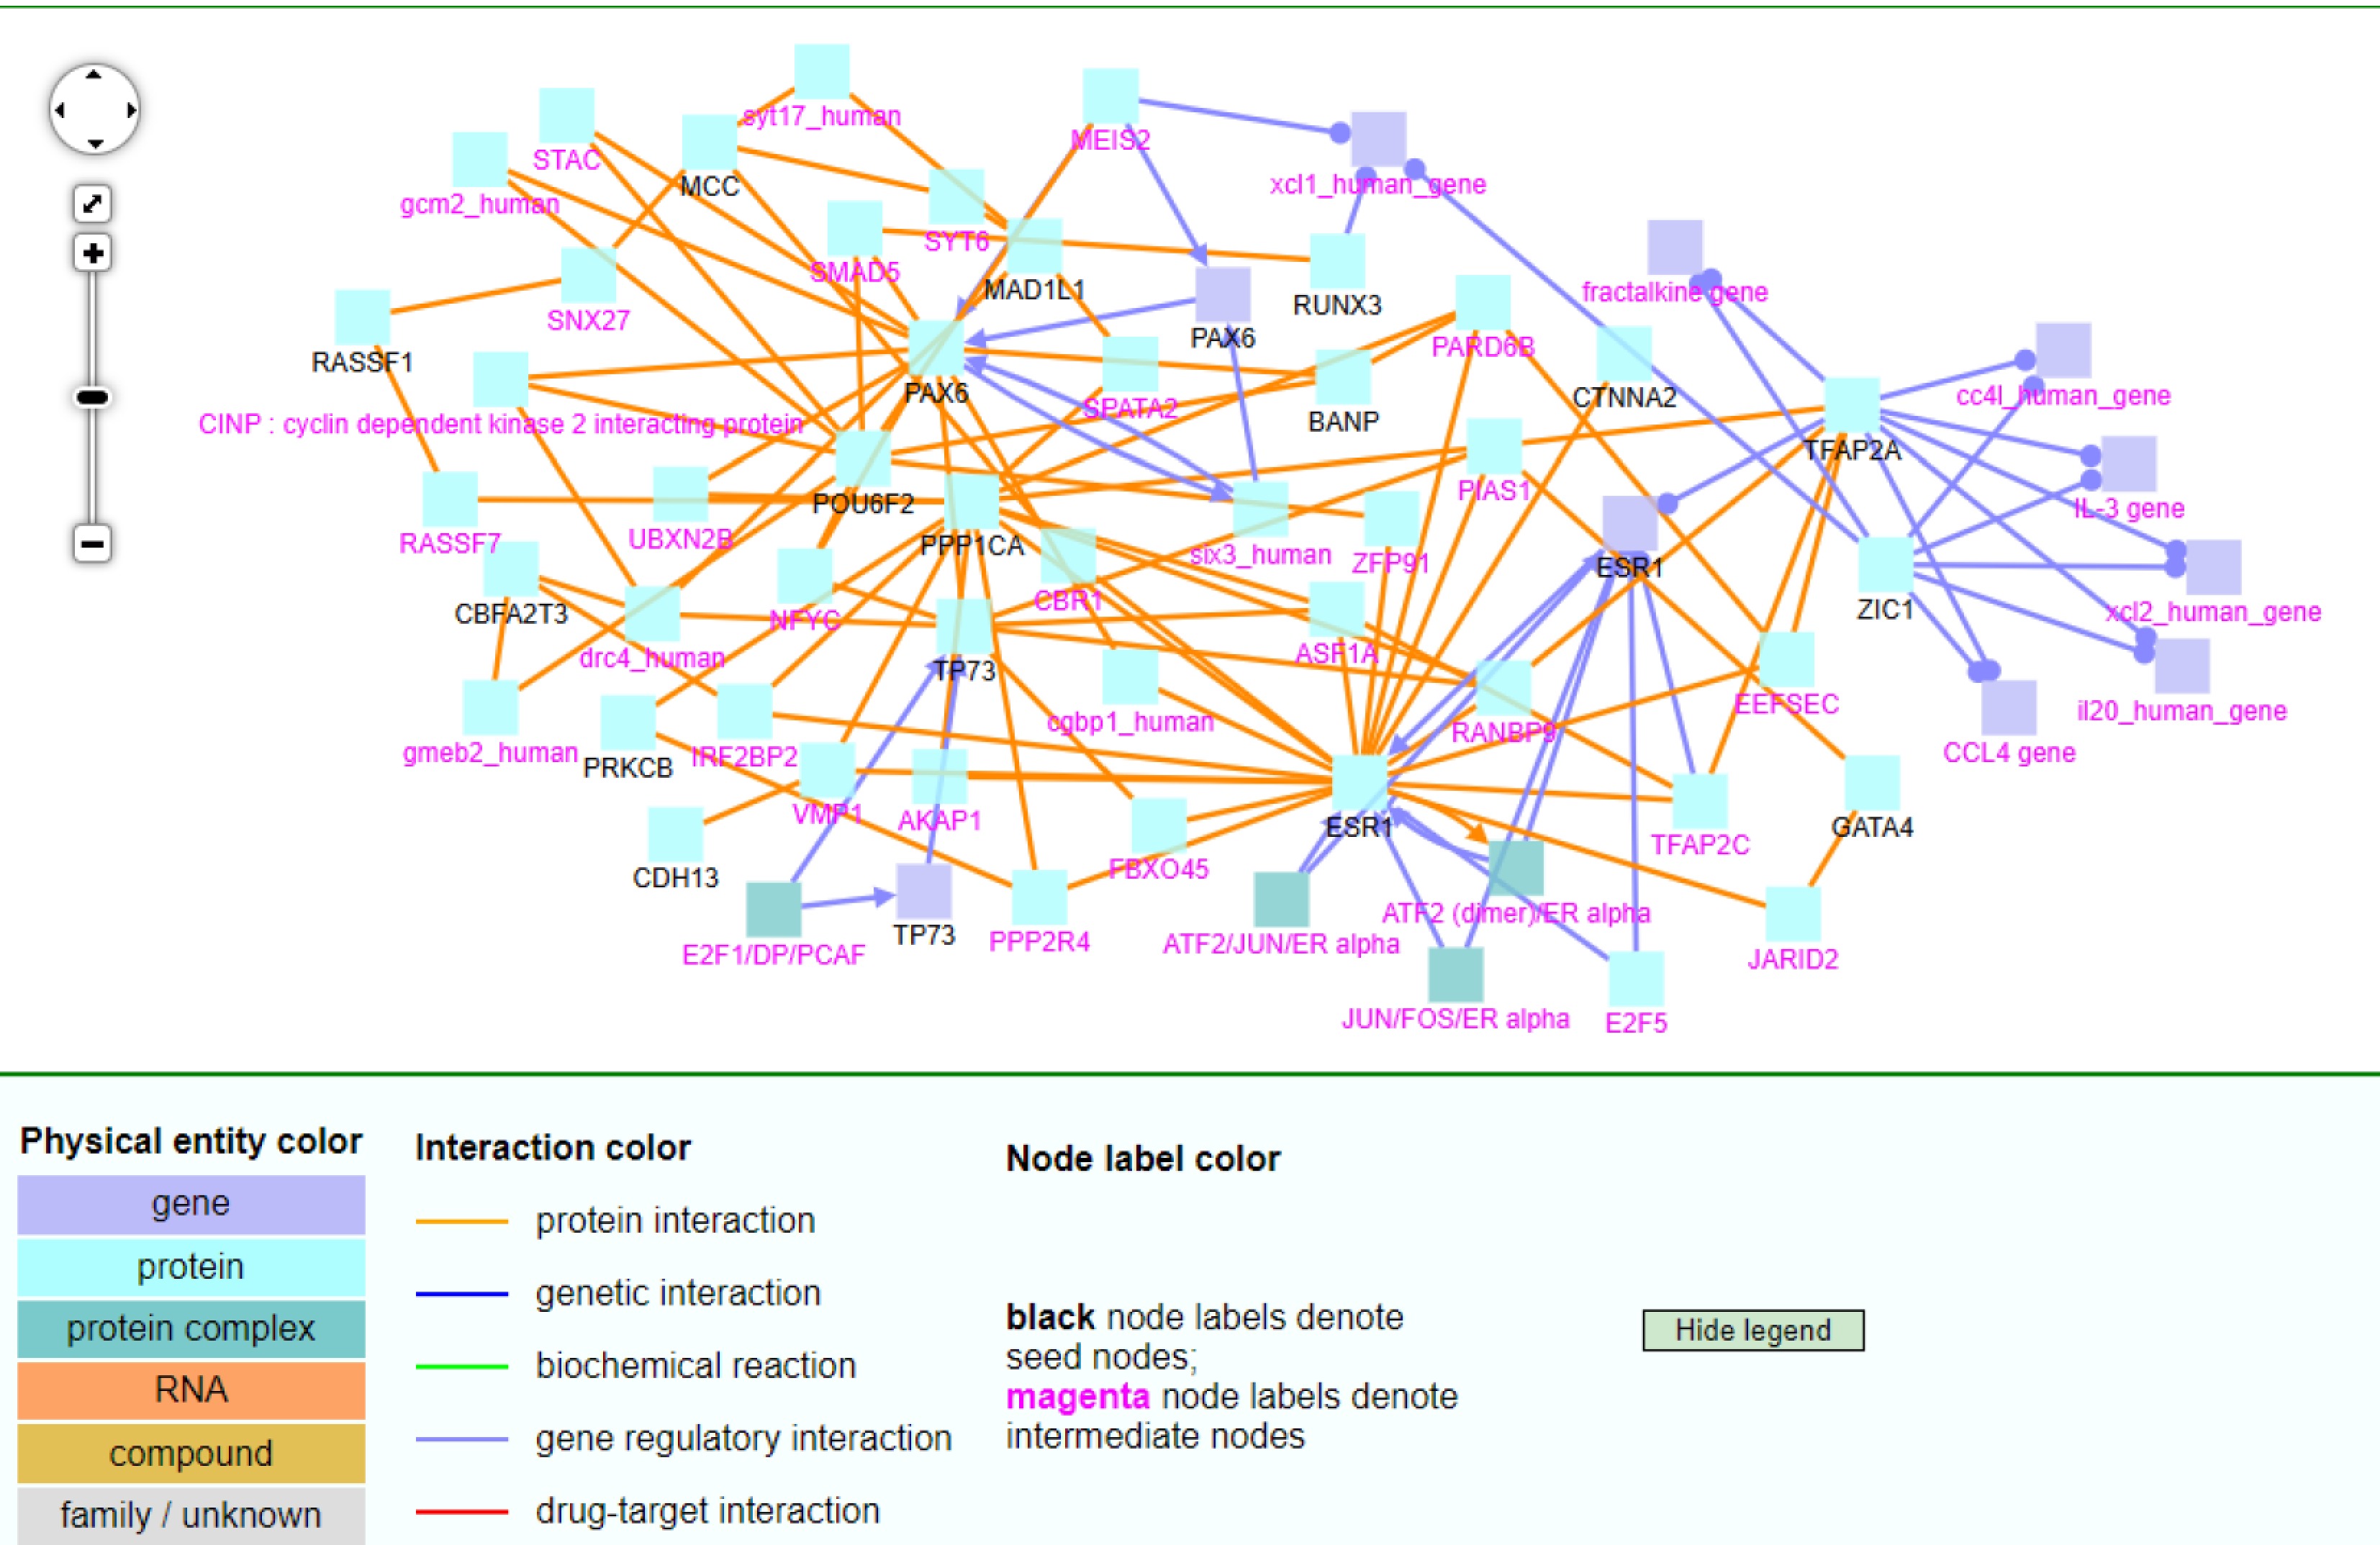
Figure 8.
The CPDB network analysis of 30 TSGs.
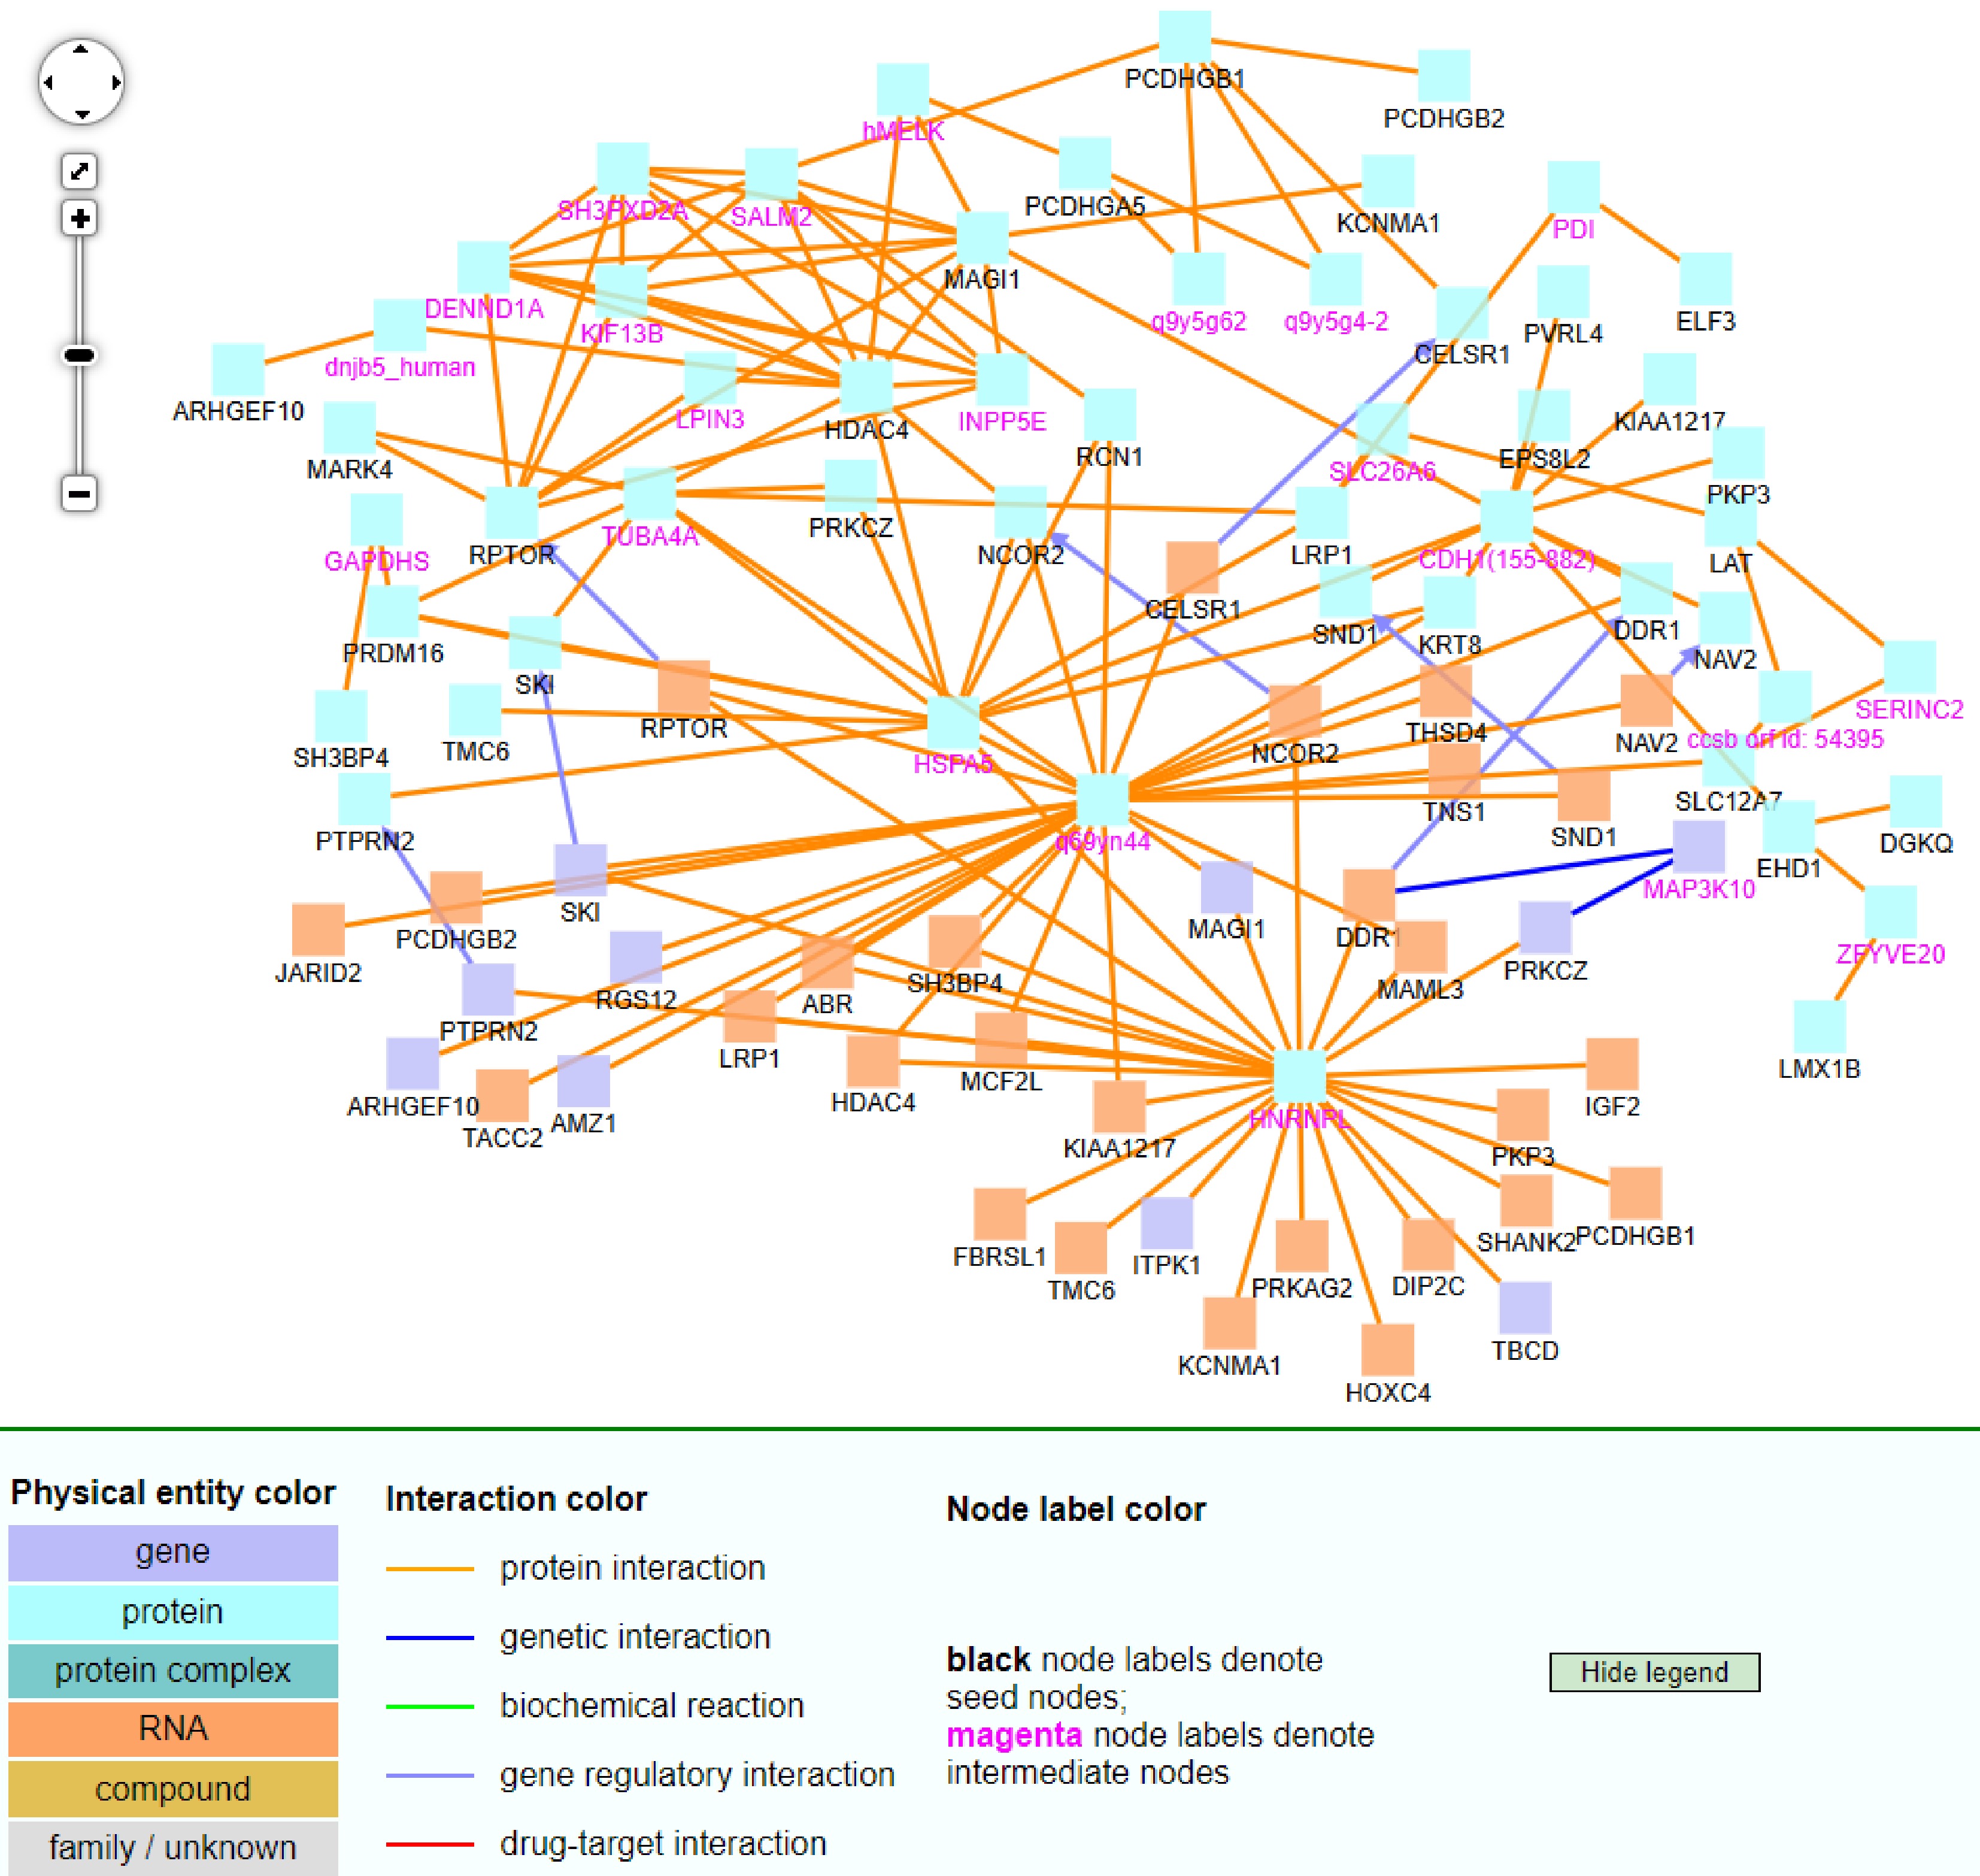
Figure 9.
The CPDB network analysis of 92 non-TSGs.
In the TSG CPDB figure (Fig. 8), TP73, PPP1CA, PAX6, POU6F2, ESR1, TFAP2A, and ZIC1 were notable hub genes (i.e., genes with many interactions). The first five genes mainly had key protein interactions with other genes (see the orange lines). TFAP2A and ZIC1 mainly had gene regulatory interactions with other genes (see the light blue lines). Additionally, most entities were proteins, while a few were genes, and some intermediate nodes were protein complexes. TFAP2A and ZIC1 were extremely interconnected as they shared 6 gene intermediate nodes through gene regulatory interactions (see the right side of Fig. 8). As for the key hub gene ESR1, patients with ESR1 mutant-positive metastases exhibited poor overall survival[22]. PAX6 was also found to be highly expressed in breast cancer tumors and was involved in breast cancer cell proliferation and tumor progression[23]. ZIC1 was found to be negatively correlated with survival. It was an inhibitor of apoptosis in breast cancer. Because it acted as a tumor suppressor, targeting ZIC1's expression might be useful when developing a possible treatment method[24]. TP73-AS1 was upregulated in breast cancer tumors and associated with poorer prognosis[25]. Lastly, PPP1CA might serve as a possible breast cancer biomarker because it plays a prominent role in cancer progression by inhibiting cell proliferation and migration[26].
For the non-TSG CPDB figure (Fig. 9), most entities were proteins and RNAs, while a few were genes. Most of the relationships among these entities were protein interactions (see orange lines). From the 92 gene list, HDAC4, MAGI1, and RPTOR, served as hub genes in this figure. Additionally, q69yn44, HNRNPL, HSPA5, DENND1A, SH3PXD2A, INPP5E, SALM2, and KIF13B were intermediate nodes that served as hub genes, which were not from the 92 non-TSG list. The last five of these genes were in the top left part of this figure. One interesting hub gene is q69yn44, which was not identified by this study, but it had many interactions with other genes. This gene is a protein-coding gene. It is involved in mRNA methylation, mRNA alternative polyadenylation, and RNA binding activity[27,28]. It acted as a key regulator of mammalian mRNA methylation N6-methyladenosine (m6A) methylation. It did so with METTL3 and METTL14, and m6A was linked to mRNA processing and regulates gene expression.
Among these non-TSG hub genes, HNRNPL has been found to affect gene expressions and was related to the occurrence of breast cancer. Silencing of HNRNPL impacted the expression of NSP 5a3a, B23, and reduced interactions with IncRNA[29]. It thus served as an important gene in suppressing tumor invasion. This suggested that HNRNPL could be targeted when looking for breast cancer treatment options. The hypomethylation of CG sites associated with RPTOR in blood was also found to be associated with breast cancer, presenting it as a promising biomarker for breast cancer detection[30]. HDAC4 was also found to play a role in breast cancer growth and invasion[31]. The targeting of HDAC4 could potentially decrease breast cancer cell growth and invasion. MAGI1 was reported as a new potential tumor suppressor gene in estrogen receptor-positive breast cancer[32].
-
To clarify some terms used in the DM analysis results (e.g., 'overlap DM sites' and 'shared genes'), the authors added the following explanation. First, since a single CG site may be associated with multiple genes, and a gene may consist of multiple CG sites, there are many ways genes can be shared between the three groups: alive-only, dead-only, and overlap (i.e., in both Alive and Dead groups). For example, Fig. 10 shows that CG1 is associated with both Gene A and Gene B, and Gene A covers three CG sites (CG1, CG2, and CG3). Second, 'overlap DM sites' refer to CG sites that were identified as differentially methylated in both Alive and Dead data. For example, Fig. 10 shows that CG3 is an overlap DM site as it is identified in both Alive and Dead samples. However, CG1 and CG2 are not 'overlap DM sites', as they are identified in the alive-only and dead-only respectively. Finally, a shared gene between two groups refers to a gene that has at least one DM site in both groups. For example, Figure 10 shows that CG1 is a DM site for alive-only, and CG2 is a DM site for dead-only, but both CG sites are associated with Gene B, a shared gene between alive-only and dead-only. Additionally, a shared gene among three groups refers to a gene that has at least one DM site in all three groups, e.g., Gene A in Fig. 10.
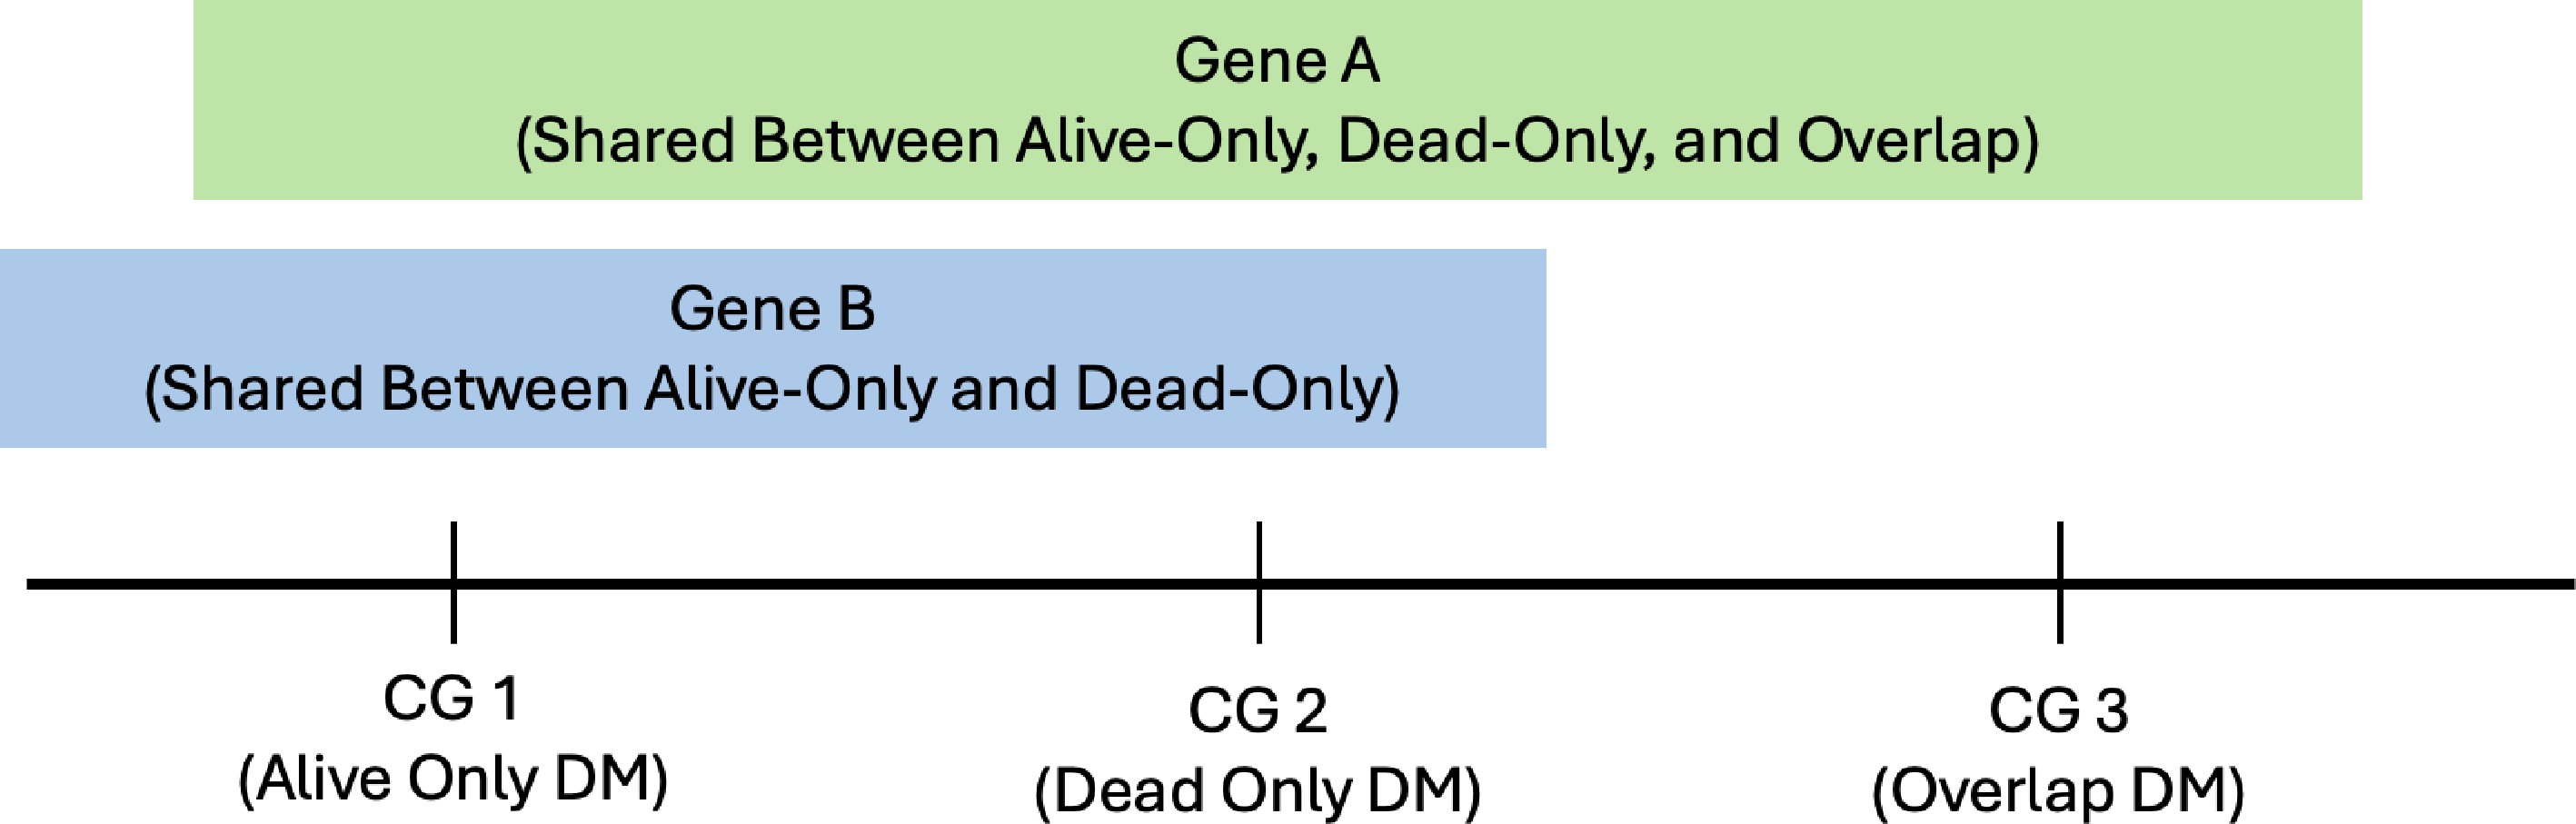
Figure 10.
Visualization or example of overlap DM sites and shared genes.
Pearson's and Spearman's correlations were commonly used. As for which one to use, the authors shared some input. First, when calculating the correlation between CG sites, both Pearson and Spearman methods reached similar conclusions for most CG sites. However, Pearson is sensitive to outliers. A single outlier can cause misleading results for a specific CG site regarding the number of CG sites with which this site is highly correlated. Spearman can counteract the impact of these outliers because it ranks the data and applies Pearson's equation to each rank of the data[33]. Second, Spearman is also more suitable for skewed data. When the distribution is heavily skewed or there are outliers, the Spearman method is more reliable than the Pearson method[34]. Third, overall, when using the Pearson correlation, using beta-values or M-values to calculate correlation did not appear to have a significant difference regarding the main conclusions on the overall co-methylation patterns. However, beta-values appeared to produce slightly high correlations for a small number of CG sites. Spearman correlation, as a rank-based metric, is not affected by the logit transformation. That is, using beta-values or M-values will give the same result. Fourth, while the Pearson method is only able to detect linear relationships, the Spearman method can detect linear and non-linear relationships[35,36]. Since both linear and non-linear correlation were important, the Spearman method was selected to calculate correlation coefficients in this study.
Cao and colleagues reported key genes and important DNA methylation regions in breast cancer[37]. They found that 17 TSGs may be breast cancer biomarkers that are regulated by DNA methylation in key regions. These 17 TSGs were then further compared with the TSG and non-TSG gene lists that had important co-methylation patterns as listed in the six panels (see Table 5). Out of their 17 TSGs, six were found in the TSG list of this study, and these genes were PROX1, CAV1, STAT5A, FAT4, PPARG, and ID4. Five of them (except ID4) were on the selected TSG list, and another five of them were on the selected non-TSG list. These genes and their special co-methylation change patterns are listed in Table 7. The identification of six genes in both studies implied that some non-TSGs identified by this study can be TSGs. Although they were not yet listed in the TSGgene 2.0 list[14], it is likely that they were not yet identified or reported as having TSG functions. Of the 10 genes in Table 7, six of them (STAT5A, FAT4, PPARG, KIT, SOX17, and PREX2) were identified as having co-methylation changes in Dead samples but not Alive samples. This finding might indicate that the co-methylation changes of these genes might be associated with breast cancer death. The genes that were first identified by the authors might play an important role in breast cancer development at different stages, and further biological or experimental validations of these genes and findings need to be done.
Table 7. Genes identified by both this study and a previous study.
Category Gene Samples (Alive/Dead), co-methylation change/panel TSG PROX1 Alive and Dead, shared in ≥ 4 same panels TSG CAV1 Alive, neg.shutting TSG STAT5A Dead, pos2neg TSG FAT4 Dead, sleeping.pos and neg.shutting TSG PPARG Dead, sleeping.pos Non-TSG PRDM16 Alive and Dead difference Non-TSG RYR3 Alive, neg.shutting Non-TSG KIT Dead, sleeping.pos Non-TSG SOX17 Dead, sleeping.pos Non-TSG PREX2 Dead, pos.shutting The first column is the category, i.e., TSG or non-TSG, based on the TSG database used in this study. The second column consists of gene names identified by both this study and Cao et al.[37]. The third column shows in which sample and with which co-methylation change pattern (or panel) each gene was identified. For the 30 TSGs and 92 non-TSGs, further gene analysis was also conducted using the Database for Annotation, Visualization and Integrated Discovery (DAVID)[38−44]. GO functional and KEGG pathway enrichment analyses were conducted, and categories with p-value < 0.05 and gene counts ≥ 5 were selected as being statistically significant. The 30 TSG genes corresponded to 95 DAVID categories, 31 (32.6%) of which were statistically significant. These categories were mainly associated with or enriched in disordered regions, transcription regulations, RNA polymerase II, and nuclei. The 92 non-TSG genes corresponded to 126 total DAVID categories, 51 (40.4%) of which were statistically significant. These categories were mainly associated with or enriched in disordered regions, cytoplasms, plasma membranes, and cadherins. Overall, TSG and non-TSG were associated with different functions or regions, except that both had the highest number of genes associated with disordered regions. This was expected when analyzing breast cancer data.
As for methylation states, Tian et al. used an additional methylation state, 'bimodal', when analyzing breast cancer cell line data[13]. If over 40% of the samples have a methylation level below 0.2 and over 40% of the samples have a methylation level above 0.8, this site is called 'bimodal'. In this study, only a single CG site was classified as 'bimodal', the authors have decided to exclude the bimodal classification to focus on the more significant methylation states. Instead, any CG sites that would have been categorized as bimodal have been classified as 'Rest' (i.e., a heterogeneous state). Note, Tian et al.'s study used methylation sequencing data of breast cancer cell lines, while this study used the Illumina methylation array data of breast cancer patients' primary tissues. That is, the methylation data used in Tian et al.'s study and this study were different, which may explain why it was unnecessary to include a 'bimodal' state in this study.
The Alive and Dead samples were selected using the vital status data directly provided by the TCGA. Using the TCGA web portal, the authors selected available DNA methylation data for breast cancer samples, which provided a total of 1,095 datasets at the time they obtained the data (892 Illumina 450 K, 342 Illumina 27 K, and some patients or samples have both 450 and 27 K data). The authors specifically focused on (a) female patients, (b) samples with Illumina methylation 450 K array data, (c) only samples with matched normal tissue available, and (d) samples with vital status provided. These criteria left the authors with 53 Alive samples and 32 Dead samples, as there were only a small number of patients with matched normal tissues. The authors intentionally chose to use the BRCA patients with matched normal (or paired) data for the following reasons as reported in the literature. First, a paired design with tumors and adjacent normal tissues from the same patient reduces variability and improves the efficiency of identifying differentially expressed genes[45]. Second, using the paired design identified different genes than using the tumor with normal tissues from different patients. Stevens et al. found that the statistical power increased as the proportion of paired samples increased[46]. Third, by only focusing on matched samples, researchers can mitigate the impact patient-to-patient variation may have on the results in detecting somatic mutations. For example, using matched normal samples allowed subtraction of the germline variants shared by all cells in an individual, leaving only acquired somatic mutations[47].
Other factors might affect patients' vital status and the DNA methylation profile. These factors may include age at diagnosis, hormone receptor, tumor stage, treatment modality, and tumor histologic type. These factors may be associated with the differences and patterns that were reported in this paper. For example, the Alive group was generally younger than the Dead group (average ages are 53 for Alive and 64 for Dead samples). There were more patients with estrogen-receptor-positive (ER+) and progesterone-receptor-positive (PR+) in the Alive group than in the Dead group (ER+: 73.1% for Alive and 65.6% for Dead; PR+: 62.3% for Alive and 56.3% for Dead). It is very important to incorporate this information. The authors have been working on a methylation-age estimation project that accounts for the above factors. They also plan to conduct future research on co-methylation using other independent datasets and by building new statistical models that incorporate these factors.
Below is a brief comparison between a previous breast cancer co-methylation paper by Sun et al.[17] and this study. First, in the previous 2022 co-methylation paper, the authors investigated the overall co-methylation patterns in the whole genome using all available CG sites. However, in this study, the focus was TSG sites. Second, in the previous 2022 paper, general co-methylation patterns among all CG sites were studied. However, in this study, the co-methylation patterns were analyzed with a focus on the correlation between each DM site and all available CG sites. That is, the purpose of this study was to investigate the impact of differential methylation on co-methylation. Thus, this new project is a more focused study. Third, in the previous 2022 paper, there was no thorough investigation on the co-methylation changes as the authors did in this study. Therefore, one novel aspect of this study is that complex co-methylation changes were analyzed, and associated TSGs and non-TSGs were identified. This study is important because TSGs play a crucial role in the regulation of breast cancer development. Because TSG sites behave differently from other CG sites, analyzing all CG sites together could nullify some important methylation patterns of TSG sites. By focusing on TSGs, the authors of this study have been able to identify more specific methylation patterns and relevant genes as reported in this paper.
As for the DM identification, because the majority of CG sites in the Illumina methylation microarray data are relatively far away from each other (compared with bisulfite sequencing data), it is not necessary to consider the similarity or spatial correlation of nearby CG sites as many other methods did (e.g., hidden-Markov-model-based methods[48,49]). Instead, the authors chose to use simple paired T-tests and then use p < 0.05 and beta |mean.difference| ≥ 0.2 to identify certain sites with both statistical and biological significance. The purpose of this study was not to identify an accurate number of DM CG sites. Instead, it was to identify some CG sites with relatively or reasonably large DM signals and then see how their overall co-methylation patterns change genome-wide. The simple method used in this study identified a list of sites with certain DM signals for downstream analysis, and it had an easy and simple biological interpretation.
To further understand Alive and Dead tumors' methylation changes, the authors also compared their methylation states, see Table 8. This table shows the following findings: First, most CG sites had the same methylation state between Alive and Dead (see the diagonal numbers, 59%−88%). None of the CG sites changed to a completely different methylation state, such as L to H or H to L. However, some CG sites changed to a similar methylation state, such as L to LM. Second, very few CG sites with L and H states in the Alive tumor dataset became heterogeneous (R) in the Dead tumor dataset (only 1.27% for L states and 1.21% for H states). But a large percentage of CG sites with LM, M, and HM methylation states changed to R (i.e., a heterogenous state) in the Dead samples (22.68% for LM, 36.07% for M, and 15.92% for HM). This change indicated that the methylation states of these CG sites (L, LM, and HM) in the Alive group became more heterogeneous in Dead samples.
Table 8. Methylation state changes from Alive-Tumor to Dead-Tumor.
DT_L DT_LM DT_M DT_HM DT_H DT_R Sum AT_L 67766 (88.06%) 8213 (10.67%) 0 (0%) 0 (0%) 0 (0%) 975 (1.27%) 76954 (100%) AT_LM 6647 (15.5%) 26287 (61.32%) 214 (0.5%) 0 (0%) 0 (0%) 9723 (22.68%) 42871 (100%) AT_M 0 (0%) 177 (3.18%) 3291 (59.2%) 86 (1.55%) 0 (0%) 2005 (36.07%) 5559 (100%) AT_HM 0 (0%) 0 (0%) 364 (0.47%) 55797 (72.57%) 8491 (11.04%) 12240 (15.92%) 76892 (100%) AT_H 0 (0%) 0 (0%) 0 (0%) 7825 (25.72%) 22228 (73.07%) 367 (1.21%) 30420 (100%) AT_R 522 (0.33%) 6911 (4.35%) 3201 (2.02%) 17205 (10.84%) 539 (0.34%) 130385 (82.13%) 158763 (100%) Sum 74935 (19.14%) 41588 (10.62%) 7070 (1.81%) 80913 (20.67%) 31258 (7.98%) 155695 (39.77%) 391459 (100%) In the first column, 'AT' stands for Alive-Tumor. For example, 'AT_L' means Alive Tumor samples' L methylation state. On the top/first row, 'DT' stands for Dead-Tumor. For the CG sites shown in the seventh column of Table 8, they changed to a heterogeneous methylation state (R) in the Dead tumor data. The authors then studied their locations based on the feature type (or location) information provided by the Illumina 450K protocol (see Table 9). More than half of the CG sites with L and LM methylation states were located on CpG islands. That is, for CG sites with L states, 75.18% of them were located within CpG islands, and 52.25% of LM CG sites were also found within CpG islands. This is in stark contrast with the fact that only 13.58%−25.89% of H, HM, and M CG sites were in CpG islands. For CG sites with all other methylation states, open-sea was the most common location. In particular, 34.81%−50.59% of CG sites with H, HM, and M methylation states were located in the open-sea, whereas only 6.15% and 15.66% of CG sites with H and HM methylation states were located in the open-sea. The shelf and open-sea regions became more frequent as the methylation state increased from L to H. The R (heterogenous) state had a feature type distribution similar to the M methylation state.
Table 9. Analysis of locations for CGs whose methylation states changed to R in Dead samples.
Alive methy.state North Shore South Shore Open-Sea Island South Shelf North Shelf Sum L 94 (9.64%) 86 (8.82%) 60 (6.15%) 733 (75.18%) 2 (0.21%) 0 (0%) 975 (100%) LM 1435 (14.76%) 1429 (14.7%) 1523 (15.66%) 5080 (52.25%) 134 (1.38%) 122 (1.25%) 9723 (100%) M 291 (14.51%) 280 (13.97%) 698 (34.81%) 519 (25.89%) 93 (4.64%) 124 (6.18%) 2005 (100%) HM 1419 (11.59%) 1257 (10.27%) 6192 (50.59%) 1662 (13.58%) 863 (7.05%) 847 (6.92%) 12240 (100%) H 32 (8.72%) 20 (5.45%) 188 (51.23%) 63 (17.17%) 31 (8.45%) 33 (8.99%) 367 (100%) R 17577 (13.48%) 16096 (12.34%) 53099 (40.72%) 33522 (25.71%) 5005 (3.84%) 5086 (3.9%) 130385 (100%) For the CG sites that changed from L, LM, M, HM, and H in Alive-Tumor to R in Dead samples (i.e., the 7th column in Table 8), the authors analyzed how many genes these CG sites were associated with (see Table 10). Only several small percentages of CG sites were not associated with any genes (i.e., associated with 0 genes), ranging from 4.92% for L to 18.05% for HM states (see the 2nd column of Table 10). 57.33% to 79.02% CG sites were associated with one gene (see the 3rd column), and 12.53%−37.74% CG sites were associated with two or more genes (see the 4th column). For CG sites associated with two or more genes, their methylation (or co-methylation) pattern changes were likely to have a more significant impact. To further study this impact, the authors analyzed the CG sites associated with just one gene to see how many isoforms these genes had. Analysis results show that a large percentage of them had two or more isoforms (see columns three through six of Table 11). The fact that these genes had many isoforms might suggest that these CG sites were involving promoter usage and alternative splicing significantly. For the associated genes with five to 10 or more isoforms, the impact could be very complex as different BRCA patients might respond to cancer very differently. Without experimental validation in a wet lab, it is challenging to know their specific impact on carcinogenesis or tumor development. However, these patterns can help researchers have new understandings regarding the functions of DNA methylation.
Table 10. Numbers of genes associated with CGs whose methylation states changed to R in Dead samples.
Alive. methy. state Num_CG_w_0_Gene Num_CG_w_1_Gene Num_CG_w_GE2_Gene Total_Num_CG L 48 (4.92%) 559 (57.33%) 368 (37.74%) 975 (100%) LM 944 (9.71%) 6121 (62.95%) 2658 (27.34%) 9723 (100%) M 340 (16.96%) 1301 (64.89%) 364 (18.15%) 2005 (100%) HM 2209 (18.05%) 8153 (66.61%) 1878 (15.34%) 12240 (100%) H 31 (8.45%) 290 (79.02%) 46 (12.53%) 367 (100%) R 24987 (19.16%) 80592 (61.81%) 24806 (19.03%) 130385 (100%) Table 11. Numbers of isoforms for CG sites associated with one gene.
Alive_State 1 isoform 2 ~ 4 isoforms 5 ~10 isoforms 11 ~ 20 isoforms ≥ 21 isoforms Total L 90 (16.1%) 228 (40.79%) 206 (36.85%) 34 (6.08%) 1 (0.18%) 559 LM 1292 (21.11%) 2667 (43.57%) 1723 (28.15%) 379 (6.19%) 60 (0.98%) 6121 M 322 (24.75%) 539 (41.43%) 350 (26.9%) 80 (6.15%) 10 (0.77%) 1301 HM 1996 (24.48%) 3456 (42.39%) 2149 (26.36%) 490 (6.01%) 62 (0.76%) 8153 H 68 (23.45%) 118 (40.69%) 88 (30.34%) 15 (5.17%) 1 (0.34%) 290 R 20933 (25.97%) 34751 (43.12%) 20118 (24.96%) 4169 (5.17%) 621 (0.77%) 80592 -
In this paper, the authors have conducted the first-ever comprehensive analysis of different methylation patterns for 1,217 TSGs using publicly available breast cancer data. The data included methylation signals of tumors and matched normal tissues in 53-Alive and 32-Dead samples. The patterns analyzed in this paper were methylation distribution, differential methylation, and co-methylation. The analysis results show that when comparing tumors with normal tissues for both Alive and Dead samples, there were significantly more DM sites in the Dead group. Many CG sites were DM in both Alive and Dead samples. These DM CG sites tended to be associated with genes that have many CG sites. From normal to tumor tissues, the changes in co-methylation patterns were complex in both Alive and Dead samples. For example, CG sites of one tumor suppressor gene can have several co-methylation changes, and these changes can have different directions. The authors have identified the CG sites and related TSGs and non-TSGs with these significant changes. The top TSGs identified in this study played a key role as hub genes in different networks and pathways. There were more genes involved in the complex co-methylation changes in Dead than in Alive samples. This difference suggests that differential methylation and co-methylation may play a significant role in tumor growth at different cancer stages. The comprehensive analysis of various methylation patterns of TSG CG sites can help researchers to have a new and better understanding of the functions of TSGs and their interactions with other genes. It may thus pave the way to identify novel TSGs and potential biomarkers to enhance breast cancer studies.
This research was partially supported by two NSF-REU grants: DMS-1757233 and DMS-2150205. This project was also supported by the Texas State University Research Enhancement Program (an internal grant for Dr. Sun). The funders did not play any role in the study design, data analysis, interpretation of data, writing the manuscript, or decision to publish. This project was made possible with the use of Texas State University's facilities and resources. The authors are particularly grateful for the help and support from the colleagues at the High-Performance Computing Cluster and the Writing Center. The authors also appreciate the editor and the two reviewers' thoughtful comments and suggestions, which have helped to improve this paper greatly.
-
The datasets used in this study were collected and provided by The Cancer Genome Atlas (TCGA). They are publicly available. Therefore, no ethics committee approval was required for this study. The TCGA web page is www.cancer.gov/ccg/research/genome-sequencing/tcga.
-
The authors confirm their contributions to the paper as follows: study conception and design: Sun S; data collection: Sun S; analysis and interpretation of results: Pritchard A, Tian C, McFall E, Sun S; draft manuscript preparation: Sun S, Pritchard A, Tian C. All authors contributed their expertise and edits. All authors have read and approved the final manuscript.
-
The original or raw datasets supporting the conclusions of this article are publicly available in the TCGA repository https://portal.gdc.cancer.gov/. The datasets (tables and figures) supporting the conclusions of this article are included within the article. All key TSGs and non-TSGs identified in this study and the corresponding R code files (scripts) that generated these genes can be found on the following web page: https://github.com/ss355/TSG.study.
-
The authors declare that they have no conflict of interest.
- Copyright: © 2025 by the author(s). Published by Maximum Academic Press, Fayetteville, GA. This article is an open access article distributed under Creative Commons Attribution License (CC BY 4.0), visit https://creativecommons.org/licenses/by/4.0/.
-
About this article
Cite this article
Sun S, Pritchard A, McFall E, Tian C. 2025. Statistical analysis of DNA methylation patterns of tumor suppressor genes in breast cancer. Epigenetics Insights 18: e004 doi: 10.48130/epi-0025-0003 

Statistical analysis of DNA methylation patterns of tumor suppressor genes in breast cancer
- Received: 16 October 2024
- Revised: 22 February 2025
- Accepted: 19 March 2025
- Published online: 14 April 2025
Abstract: The purpose of this study was to conduct the first-ever comprehensive analysis of methylation patterns of tumor suppressor genes (TSGs) in breast cancer. The authors first identified differentially methylated (DM) sites between tumors and matched normal tissues in both Alive and Dead samples. They then analyzed co-methylation patterns related to these DM sites and reported corresponding TSGs and non-TSGs. First, tumors had more heterogeneous methylation sites than normal tissues (40% vs < 10%) in both Alive and Dead samples. Second, there were significantly more DM sites in Dead than in Alive samples. Third, as for co-methylation patterns, in normal tissues, some DM sites tended to have strong co-methylations with many CG sites. In tumor tissues, some of these strong co-methylations were lost, and some new co-methylation relationships were developed. These patterns were seen in both Alive and Dead data. Fourth, there were more co-methylation changes between normal and tumor tissues in Dead than in Alive samples. Thirty TSGs and 92 non-TSGs were identified as having notable differences between Alive and Dead data. Finally, seven TSGs were involved in many co-methylation changes between normal and tumor tissues. These seven TSGs were hub genes in different networks.
-
Key words:
- Methylation /
- Co-methylation /
- Breast cancer /
- Tumor suppressor genes