


-
Tea originated in China and is one of the three most popular beverages in the world[1]. Environmental stress affects the accumulation of primary and secondary metabolites in tea, influencing its quality[2]. Summer and autumn tea accounts for over half of the annual tea production. However, due to quality issues, low economic returns, and high harvesting costs, a significant amount of summer and autumn tea remains unharvested, leading to considerable resource waste[3,4]. Therefore, developing effective agronomic techniques to enhance the quality of summer and autumn tea is crucial for maximizing the economic value of tea gardens. Shading is one of the traditional agronomic techniques employed in this context. The micro-environmental changes induced by shading can greatly influence tea quality[3]. Among these changes, transcription factors represent a crucial class of regulatory proteins that modulate gene expression by specifically binding to targeted DNA sequences, thereby regulating metabolite alterations in tea plants following shading[5]. Nevertheless, the regulatory role of NAC transcription factors in shading tea plants remains unclear.
NAC transcription factors represent a significant class of plant-specific transcription factors[6]. A typical NAC protein possesses a highly conserved N-terminal DNA-binding domain consisting of approximately 150 amino acid residues; this domain facilitates nuclear localization and the recognition and binding of downstream target gene DNA sequences. Additionally, the NAC protein features a highly variable C-terminal region that exhibits either transcriptional activating or repressing activity[7,8]. This conserved domain can be subdivided into five subdomains (A, B, C, D, and E), with their conservation ranking as follows: A > C > D > B > E[9,10]. NAC genes are widely distributed across various plant species as a complex, plant-specific gene family. Currently, whole-genome analyses have identified numerous NAC family members in multiple species, including 117 NAC genes in Arabidopsis[11], 163 in Poplar[12], 74 in Vitis vinifera[13], 85 in Liriodendron[14], 151 in rice[15], 110 in potato[16], 152 in tobacco[17], 152 in soybean[18], 97 in Medicago truncatula[19], 104 in tomatoes[20], 204 in Chinese cabbage[21], and 152 in corn[22].
Studies have demonstrated that NAC transcription factors play multiple roles in the metabolic processes of plants, being involved not only in fundamental growth and development but also in the synthesis of secondary metabolites and responses to environmental stress[8,23−25]. The transcription level of FcrNAC22 in kumquat fruits is significantly induced under red light irradiation, and its expression is up-regulated as the fruit color changes[26]. Through RNA-Seq and real-time quantitative PCR analysis, PpNAC61/70/172/176/23 may be implicated in the coloration of pear fruits induced by blue light[27]. PpNAC1 directly binds to and activates the expression of the PpAAT1 gene, thereby regulating the synthesis of ester aromatic substances in peach fruits, which significantly impacts the flavor quality of these fruits[28]. ClNAC68 positively regulates sucrose accumulation during the ripening of watermelon fruit by directly inhibiting the expression of the invertase gene ClINV[29]. In tea plants, studies have demonstrated that CsNAC28 is involved in drought tolerance by regulating the expression of ABA-related genes and antioxidant systems[30]. The miR164a-CsNAC1 module may play a negative regulatory role in the cold tolerance of tea plants through the CsCBF-dependent pathway[31]. CsNAC7 positively regulates the tea plant caffeine synthase gene yhNMT1, promoting caffeine accumulation in tea plants[32]. A NAC gene, CsNAC086, was isolated from tea plants, and its regulatory role in the expression of tea flavonol synthase was confirmed[33]. Although the responses of NAC transcription factors to environmental stress and their effects on quality metabolites in plants have been extensively identified and studied, there are currently no studies examining the involvement of NAC transcription factors in the quality metabolites of tea plants under shade treatment.
This study investigates the fundamental characteristics, gene structure, phylogenetic evolution, collinearity analysis, and cis-acting elements of the NAC gene family members in tea plants. Additionally, it measures the contents of photosynthetic pigments, tea polyphenols, free amino acids, flavonoids, and catechin components (including EC, ECG, EGCG, etc.) in tea leaves subjected to shading treatment. The expression levels of eight representative tissues from tea plants were analyzed. RT-qPCR was employed to identify the gene with the highest expression level in tea leaves under shading conditions, namely CsNAC65, which was further analyzed in depth. This study aims to provide a theoretical foundation for a comprehensive understanding of the evolutionary mechanisms of the NAC gene family in tea plants and serves as a reference for elucidating the regulatory role of NAC transcription factors in the tea plant's response to shading.
-
Tea plant genome data and annotation files were downloaded from the tea plant database TPIA (
http://tpia.teaplants.cn/ ). Arabidopsis genome data was downloaded from TAIR (http://arabidopsis.org/ ). The parameters were set to E-value < 1e-20 and the BLAST program was utilized to compare the candidate CsNAC with AtNAC. The hidden Markov model (HMM) file of the NAC conserved domain (PF02365) was obtained from the InterPro database (www.ebi.ac.uk/interpro/download ). TBtools software was used to predict the physicochemical properties of the tea plant NAC family members. Subcellular localization prediction was carried out using WoLF PSORT (https://wolfpsort.hgc.jp/ )[34].Analysis of conserved motifs, conserved domains, and gene structures of tea plant NAC gene family members
-
The Visualize Gene Structure tool in TBtools software was used to predict the tea plant NAC gene protein sequence structure. The MEME online website (
http://meme-suite.org/tools/meme ) was employed to identify the conserved motifs within the CsNAC gene protein sequence. Additionally, the relevant conserved domains from the CsNAC sequence were extracted using the NCBI-CDD database (www.ncbi.nlm.nih.gov/cdd ). Subsequently, TBtools software was used to draw the conserved motifs, structural domains, and the gene structure of the tea plant NAC gene[35].Phylogenetic analysis, chromosomal location, and collinearity analysis of tea plant NAC gene family members
-
ClustalW[36] within the MEGA11 software was used with the default settings, the filtered protein sequences were utilized to construct an evolutionary tree employing the neighbor-joining (NJ) method. The Bootstrap parameter was set to 1,000, with partial deletion and P-distance selected, while all other parameters remained at their default values. The generated phylogenetic tree was imported into the iTOL (
https://itol.embl.de/ ) online platform for further editing and visualization. The chromosome position information for the tea plant NAC gene family was derived from the tea plant gene annotation file, and TBtools software was employed to visualize this chromosome position data. Additionally, TBtools was used to extract chromosome length information, gene density files, and gene position information for the target sequence. Collinearity analysis was conducted using the TBtools OneStep MCScan-SuperFast tool, employing the BLAST program for comparisons, with the E-value set to 1e-5. Furthermore, the TBtools Simple Ka/Ks Calculator (NG) tool was utilized to calculate the Ka/Ks ratio.Analysis of cis-acting elements in promoter regions of tea plant NAC gene family members
-
TBtools was utilized to extract the 2,000 bp sequence upstream of the NAC promoter region from the tea plant gene database. Subsequently, these sequences were submitted to the online database PlantCARE (
https://bioinformatics.psb.ugent.be/webtools/plantcare/html/ ) to predict and analyze the cis-acting elements present in the promoter sequences of the tea plant NAC gene family members. Additionally, cis-acting elements related to environmental factors, metabolites, and plant-specific tissues were screened. The online tool Chiplot (www.chiplot.online ) was used to create graphical representations for visualization.Determination of plant materials, shading treatments, and physiological and biochemical indicators
-
The annual tea plant variety 'Zhuyeqi' seedlings were used as test materials. This experiment was conducted in the artificial climate chamber of the College of Horticulture at Hunan Agricultural University, Hunan, China (longitude 113°08', latitude 28°18'). After three months of transplantation and normal growth, tea seedlings in pots that exhibited good growth and uniform conditions were selected for shading treatment in an artificial climate chamber. The shading was implemented using a black polyethylene net with an 80% shading degree. The specific parameters of the artificial climate chamber were as follows: a light cycle of 16 h during the day at a temperature of 25 °C and 8 h at night at a temperature of 22 °C, with relative humidity maintained at 70%. The light intensity during the day was set at 20,000 lux, which was reduced to 4,000 lux post-shading. In this experiment, cultivation was conducted using black square-mouthed plastic pots with a diameter of 10.2 cm, a height of 13.8 cm, and a bottom diameter of 7.2 cm. The physical and chemical properties of the test soil included 0.994 g/kg total nitrogen, 53.8 mg/kg hydrolyzable nitrogen, 0.930 mg/kg available phosphorus, 52.3 mg/kg available potassium, 16.8 g/kg organic matter, and a pH of 4.72.
The shading treatment commenced on August 26, 2024, and continued until September 24, 2024, lasting a total of 30 d. Four groups were established based on the duration of shading: CK (control group), S5 (shading for 5 d), S15 (shading for 15 d), and S30 (shading for 30 d). Each treatment included three biological replicates. One bud and two leaves from the CK and the shaded plants (5, 15, and 30 d) were collected, frozen in liquid nitrogen, and stored at −80 °C in an ultra-low temperature refrigerator for subsequent experiments.
The ethanol extraction method was employed to quantify the contents of chlorophyll a, chlorophyll b, and carotenoids in fresh tea plant leaves. The second leaf of the tea plant was selected, and the mesophyll tissue was excised while avoiding the veins and edges. The sample was then cut into thin strips and placed into a centrifuge tube containing 5 mL of 95% ethanol solution for extraction. The tube was stored in a dark environment at room temperature for 12 h until the leaf tissue became white. The absorbance of the leachate was measured at 665, 649, and 470 nm using a Shimadzu UV-2550 spectrophotometer. The calculation formulas are as follows: Chlorophyll a content (mg/L) = 13.95 × A665 − 6.88 × A649; Chlorophyll b content (mg/L) = 24.96 × A649 − 7.32 × A665; Carotenoid content (mg/L) = (1,000 × A470 − 2.05 × Chlorophyll a − 114.8 × Chlorophyll b)/245[37]. Three biological replicates were analyzed for each treatment.
The flavonoid content was determined using the aluminum trichloride colorimetric method. Liquid chromatography-mass spectrometry (LC-MS/MS) was employed to analyze the content of free amino acids, tea polyphenols, alkaloids, and catechins. The specific method is as follows: a Nexera X2 LC-30 AD high-performance liquid chromatography system (Shimadzu, Japan) was utilized for analysis. An Acquity BEH C18 column (2.1 mm × 100 mm) was used for separation, featuring 1.7 μm particles sourced from Waters (Milford, MA, USA). The entire separation process was conducted at a temperature of 40 °C. The optimal gradient consisted of eluent A (0.1% formic acid aqueous solution), and eluent B (0.1% formic acid acetonitrile aqueous solution). The injection volume was set to 1 μL, and the flow rate was maintained at 0.3 mL/min. Three biological replicates were measured for each treatment.
Expression analysis of tea plant NAC genes in eight representative tissues
-
The eight representative tissues of the tea plant, which include roots, stems, buds, young leaves, mature leaves, old leaves, flowers, and fruits, were downloaded from the tea plant database TPIA to analyze their expressions. Expression pattern heatmaps were generated using the HeatMap tool in TBtools software.
RT-qPCR expression analysis
-
Total RNA from tea plant roots was extracted using the Fastpure Universal Plant Total RNA Isolation Kit (Vazyme, China). First-strand cDNA for real-time fluorescence quantitative PCR (RT-qPCR) was synthesized from the total RNA using the Evo M-MLV reverse transcription reagent master mix (Agbio, China). RT-qPCR was performed on a QuantStudio 3 quantitative PCR machine (Thermo Fisher Scientific, USA) using the BYBR Green Premix Pro Taq HS qPCR kit (Agbio, China). Three biological replicates were established, and the 2−ΔΔCᴛ method was employed to calculate the relative expression of genes[38], presented as mean ± standard deviation (± SD). Primers were designed using the National Center for Biotechnology Information (NCBI), and the RT-qPCR primers are shown in Supplementary Table S1.
Sequence analysis of tea plant CsNAC65 protein
-
The TMHMM Server v.2.0 (
https://services.healthtech.dtu.dk/services/TMHMM-2.0/ ) was utilized to analyze the transmembrane structure of CsNAC65. The SOPMA tool (https://npsa-prabi.ibcp.fr ) was employed to predict the secondary structure, while the Swiss-Model online platform (www.swissmodel.expasy.org ) was used for tertiary structure prediction of the tea plant CsNAC65 protein. Using the protein sequence of the tea plant CsNAC65 gene as a reference, STRING (https://cn.string-db.org/ ) was applied to conduct protein interaction prediction analysis. Additionally, protein sequences with higher homology to CsNAC65 were retrieved from NCBI, and the Clustal X tool was used for sequence comparison, followed by editing with DANMAN software. MEGA11 software was employed to construct a phylogenetic tree using the neighbor-joining (NJ) method, with a Bootstrap value of 1,000.Analysis of subcellular localization of CsNAC65 in tea plant
-
The full-length coding sequence of CsNAC65 was inserted into the GFP-fused vector pEAQ-GFP to create the pEAQ-CsNAC65-GFP construct. The recombinant plasmid (35S:CsNAC65-GFP) and the control (35S:GFP) were introduced into GV3101 Agrobacterium tumefaciens. The Agrobacterium was cultured in an LB medium containing kanamycin (50 μg/mL) and rifampicin (20 μg/mL) at 28 °C for 48 h. Following this, the culture was centrifuged at 5,000 rpm for 5 min. The pellet was then resuspended in a suspension buffer containing Agrobacterium Resuspension and Acetosyringone (AS), and the optical density (OD) at 600 nm was adjusted to 0.6−0.8. An Agrobacterium strain carrying the construct for green fluorescent protein was subsequently injected into tobacco. The plants were treated under low light conditions at 25 °C for 12 h before being transferred to normal light conditions for 48 h. The GFP signal was detected using an Axio Scope. A1 upright fluorescence microscope (Carl Zeiss AG, Germany). Primers are shown in Supplementary Table S1.
Statistical analysis
-
Statistical analysis was conducted using SPSS (version 27.0), employing one-way ANOVA to analyze variance. The LSD and Duncan methods assessed statistical differences, with a significance level set at p < 0.05. All data are presented as mean ± standard deviation, derived from three independent biological replicates. The results were visualized using GraphPad Prism 9.5 for statistical graphs, while TBtools-II (version 2.136) software was employed for data visualization.
-
Based on the reported protein sequence of the Arabidopsis NAC gene, a BLAST search was conducted within the tea plant genome, resulting in the identification of a total of 100 CsNAC family members. According to their chromosomal positions, these members were designated CsNAC1 to CsNAC100 (Supplementary Table S2). Specifically, the number of amino acids in CsNAC proteins varies from 78 (CsNAC86) to 679 (CsNAC15). The molecular weights range from 9,479.05 Da (CsNAC86) to 77,154.05 Da (CsNAC15). The theoretical isoelectric points span from 4.66 (CsNAC23) to 10.26 (CsNAC66), with 45 proteins classified as essential (PI > 7) and the remainder as acidic (PI < 7). The instability index ranges from 19.62 to 62.95, with 73 CsNAC proteins exhibiting an instability index greater than 40, indicating that most of these proteins are unstable. The fatty index varies between 46.72 and 93.72, while the average hydrophobicity ranges from −0.325 to −0.992, with all values being negative, confirming that CsNAC proteins are hydrophilic. Subcellular localization prediction analysis revealed that 74% of the proteins are localized in the nucleus, with a smaller proportion found in the cytoplasm, chloroplasts, mitochondria, peroxisomes, cell walls, and cytoskeleton (Supplementary Table S2). This study demonstrates that the CsNAC gene family members have differences in the number of amino acids, molecular weight, theoretical isoelectric point, instability index, fatty index, and average hydrophobicity, indicating that CsNAC proteins possess distinct biochemical properties and functions and operate in various cellular locations.
Analysis of conserved motifs and gene structure of tea plant NAC gene family members
-
To further investigate the protein sequence of tea plant NAC, 10 relatively conserved motifs were identified in CsNACs, namely motifs 1~10 (Fig. 1a). Except for CsNAC86 and CsNAC31, all family members contain two conserved motifs, motif 2, and motif 8, suggesting that these proteins share functional similarities. Furthermore, CsNAC proteins within the same branch often exhibit similar motif compositions. For example, members of the NAC2 subfamily display identical motif distributions. However, individual members of specific subgroups may lack motifs that are present in other members. For example, CsNAC89 in the ANAC011 subfamily does not include motif 3, while this motif is retained in other members of the NAC1 subfamily.
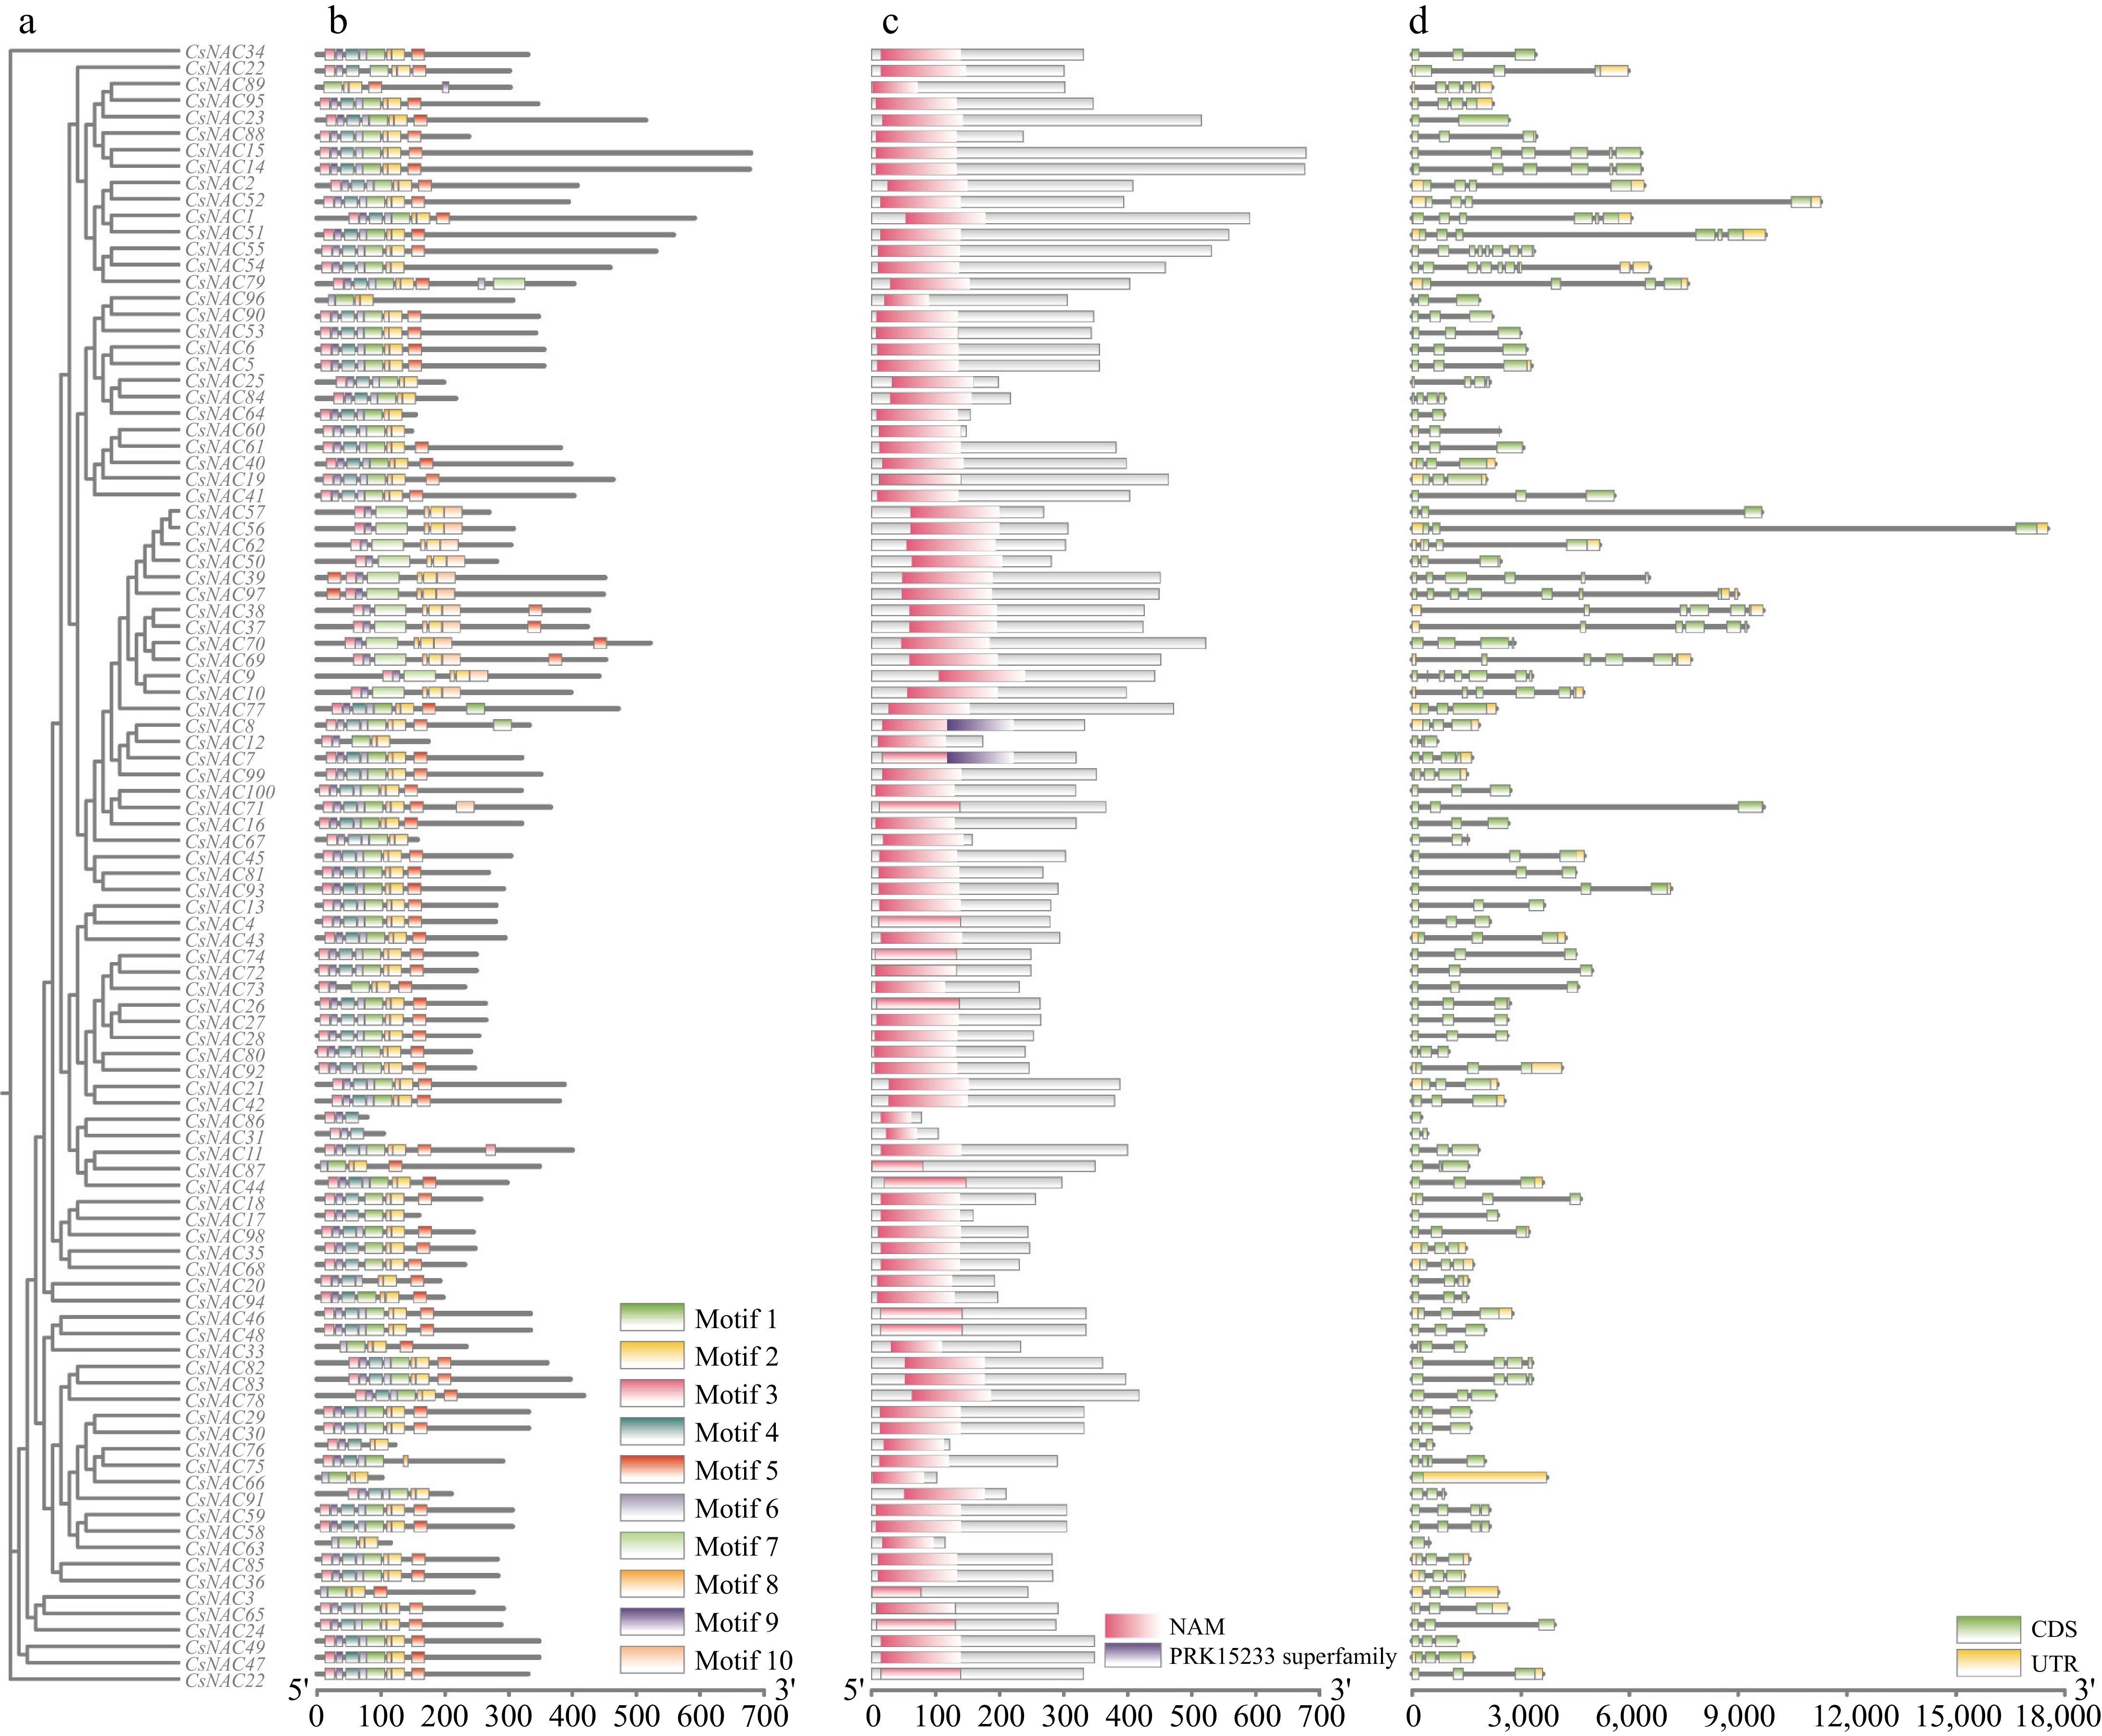
Figure 1.
CsNAC gene phylogenetic tree, gene conserved motifs, conserved domains, and gene structure. (a) A phylogenetic tree was constructed using 100 CsNACs. (b) The distribution of conserved motifs within the CsNAC genes is categorized into 10 distinct motifs, with different colors representing each motif. (c) The distribution of conserved domains in the CsNAC genes. (d) An analysis of the CsNAC gene structure, where green boxes denote exons, yellow boxes represent untranslated upstream and downstream regions, and lines indicate introns.
Conserved domain analysis revealed that all 100 CsNACs contained NAM conserved domains, while only CsNAC7 and CsNAC8 possessed the PRK15233 superfamily conserved domain. In summary, the diversity of motifs and domains distributed across different genes suggests that CsNAC proteins exhibit functional diversity (Fig. 1b).
Analysis of the tea plant NAC gene structure revealed that the CsNAC genes exhibit variation in the number of exons, ranging from one to nine, with most members containing three. The number of introns also varies significantly, ranging from 0 to 8. The CsNAC66 gene has no introns, while the CsNAC54 gene has eight introns (Fig. 1c).
Phylogenetic analysis, chromosomal location, and collinearity analysis of tea plant NAC gene family members
-
To better understand the parentage relationship of NAC genes in plant evolution, a phylogenetic analysis of 100 tea plants and 88 Arabidopsis thaliana protein sequences was conducted using the Neighbor-Joining (NJ) method with MEGA 11 software (Fig. 2). The evolutionary tree reveals that members of the tea plant NAC gene family can be categorized into 16 subfamilies, specifically ANAC063, ONAC003, ANAC001, NAC2, OsNAC8, TIP, ANAC011, ONAC022, TERN, SENU5, ATAF, AtNAC3, NAP, NAC1, NAM, and OsNAC7[39]. The results indicate that, except for the ANAC063 subfamily, which lacks CsNAC family members, all other 15 subfamilies contain CsNAC family members. Notably, the NAP subfamily exhibits the most significant representation of CsNAC members, totaling 14, while both the ANAC001 and OsNAC8 subfamilies have the fewest, with only one member each. Additionally, the UN group comprises three unclassified CsNAC proteins (CsNAC78, CsNAC82, and CsNAC83). These findings demonstrate that the number of NAC gene family members varies across different tea plants and Arabidopsis subfamilies. This variation suggests that each NAC subfamily may have undergone distinct evolutionary events following the divergence of their common ancestor.
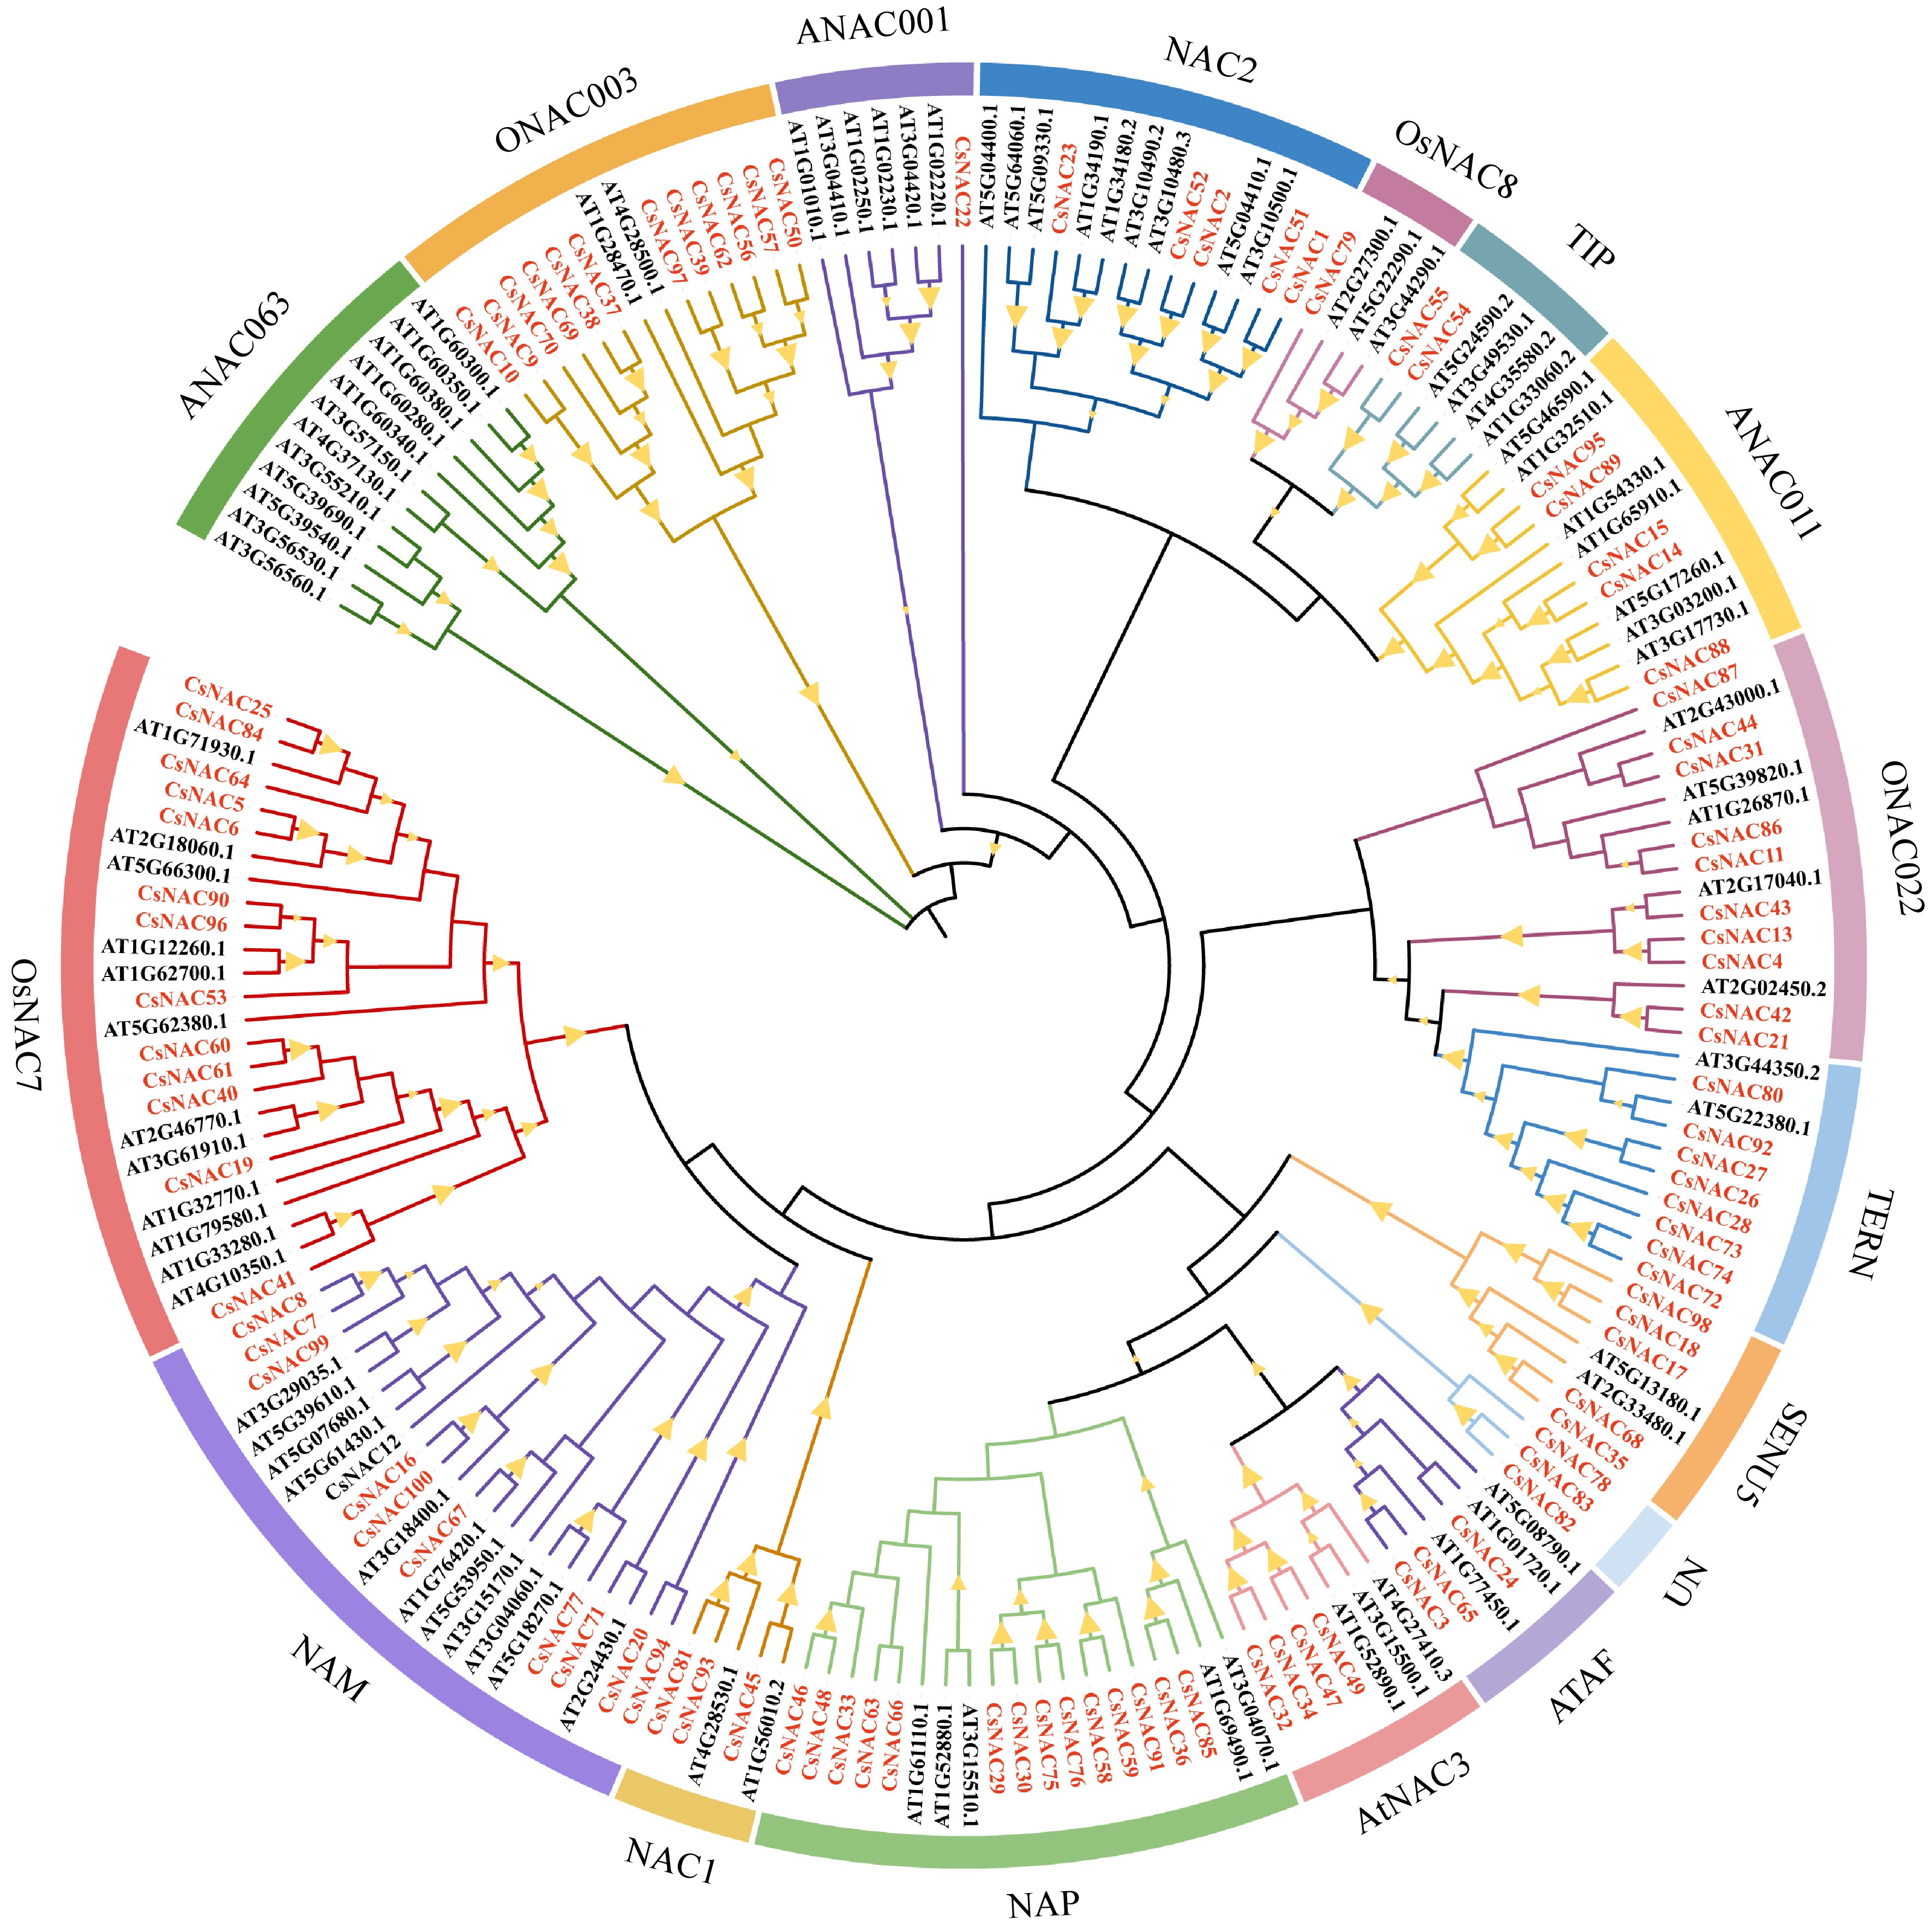
Figure 2.
Phylogenetic relationship of NAC gene family in tea plant and A. thaliana. A phylogenetic analysis was conducted using 100 tea plants and 88 Arabidopsis thaliana protein sequences, employing the Neighbor-Joining (NJ) method with MEGA 11 software. These proteins are categorized into 16 distinct groups, with different colors in the outer ring representing the various groups of NAC proteins. The prefixes Cs and At denote the tea plant and Arabidopsis proteins, respectively, while the CsNAC genes are highlighted in red font. Notably, the Bootstrap values for all branches exceed 50%.
To investigate the genetic differences within the tea plant's NAC gene family, the chromosomal localization of CsNAC genes was analyzed (Fig. 3). The results indicated that 100 CsNAC genes were unevenly distributed across 15 chromosomes, with the number of CsNAC genes on each chromosome ranging from two to 12. Notably, the largest number of CsNAC genes was found on chromosome 7, which contained 12 members, while the smallest number was observed on chromosome 3, with only two members.
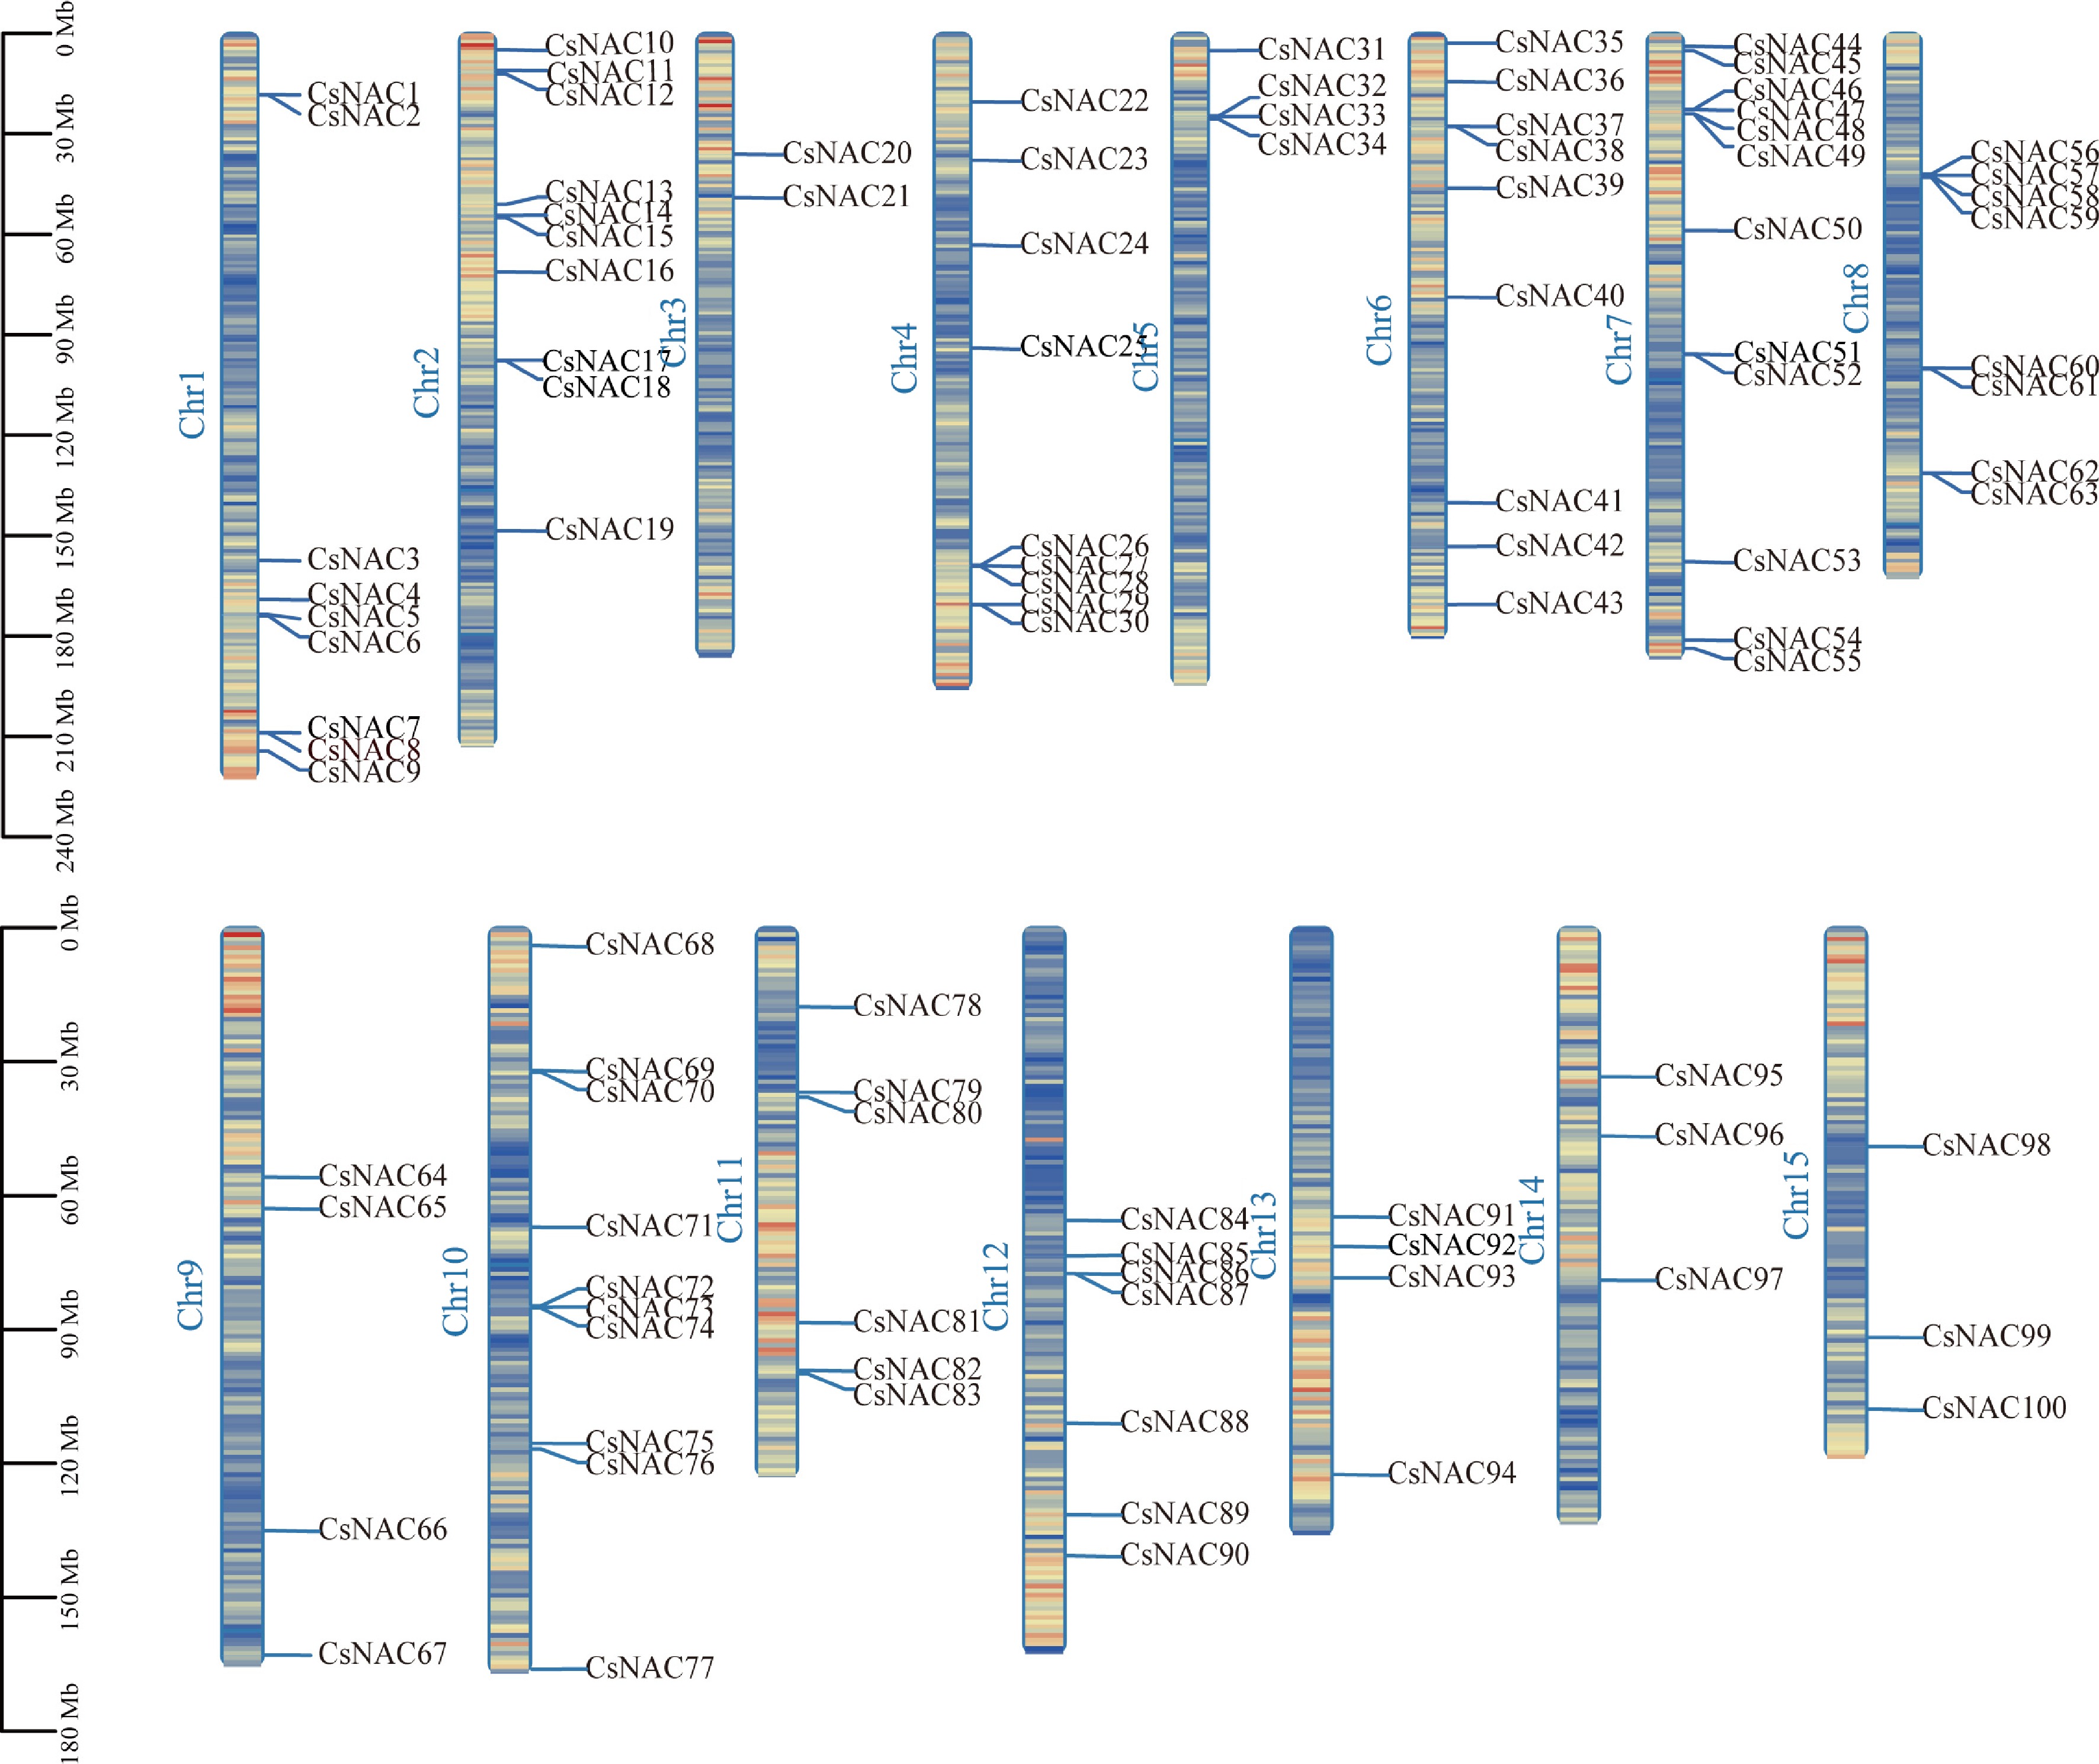
Figure 3.
Chromosomal distribution of CsNAC genes. Scale is in megabytes (Mb). All identified CsNAC genes are displayed on their respective chromosomes, with the chromosome numbers labeled at the top of each band. The lines within the chromosomes indicate gene density.
The intraspecies collinearity analysis of tea plant NAC genes reveals the presence of eight pairs of tandemly replicated NAC genes (Supplementary Table S3), which belong to the TERN, OsNAC7, OsNAC003, NAP, AtNAC3, and NAC2 subfamilies. Additionally, 37 gene pairs were identified as segmental duplications among the 100 CsNAC genes (Fig. 4a). Evolutionary analysis indicates that segmental and tandem duplications are the primary mechanisms driving the expansion of the NAC gene family[40]. Furthermore, we calculated the Ka/Ks values of gene pairs formed by both tandem and segmental duplication patterns. Except for CsNAC9 and CSS0014040.1, which exhibit Ka/Ks > 1, the remaining genes with different replication modes display Ka/Ks < 1, suggesting that the NAC genes in tea plants may have undergone strong purifying selection throughout their evolutionary history (Supplementary Table S3). To investigate potential evolutionary insights regarding the CsNAC genes, we compared the NAC genomes of tea plant and A. thaliana for collinearity (Fig. 4b). A total of 78 collinear gene pairs were identified, with no gene pairs found between Chr3 of tea plant and A. thaliana. Notably, the CsNACs located on tea plants Chr1 and Chr2 are associated with multiple homologous gene pairs, indicating a common ancestor and functional conservation.
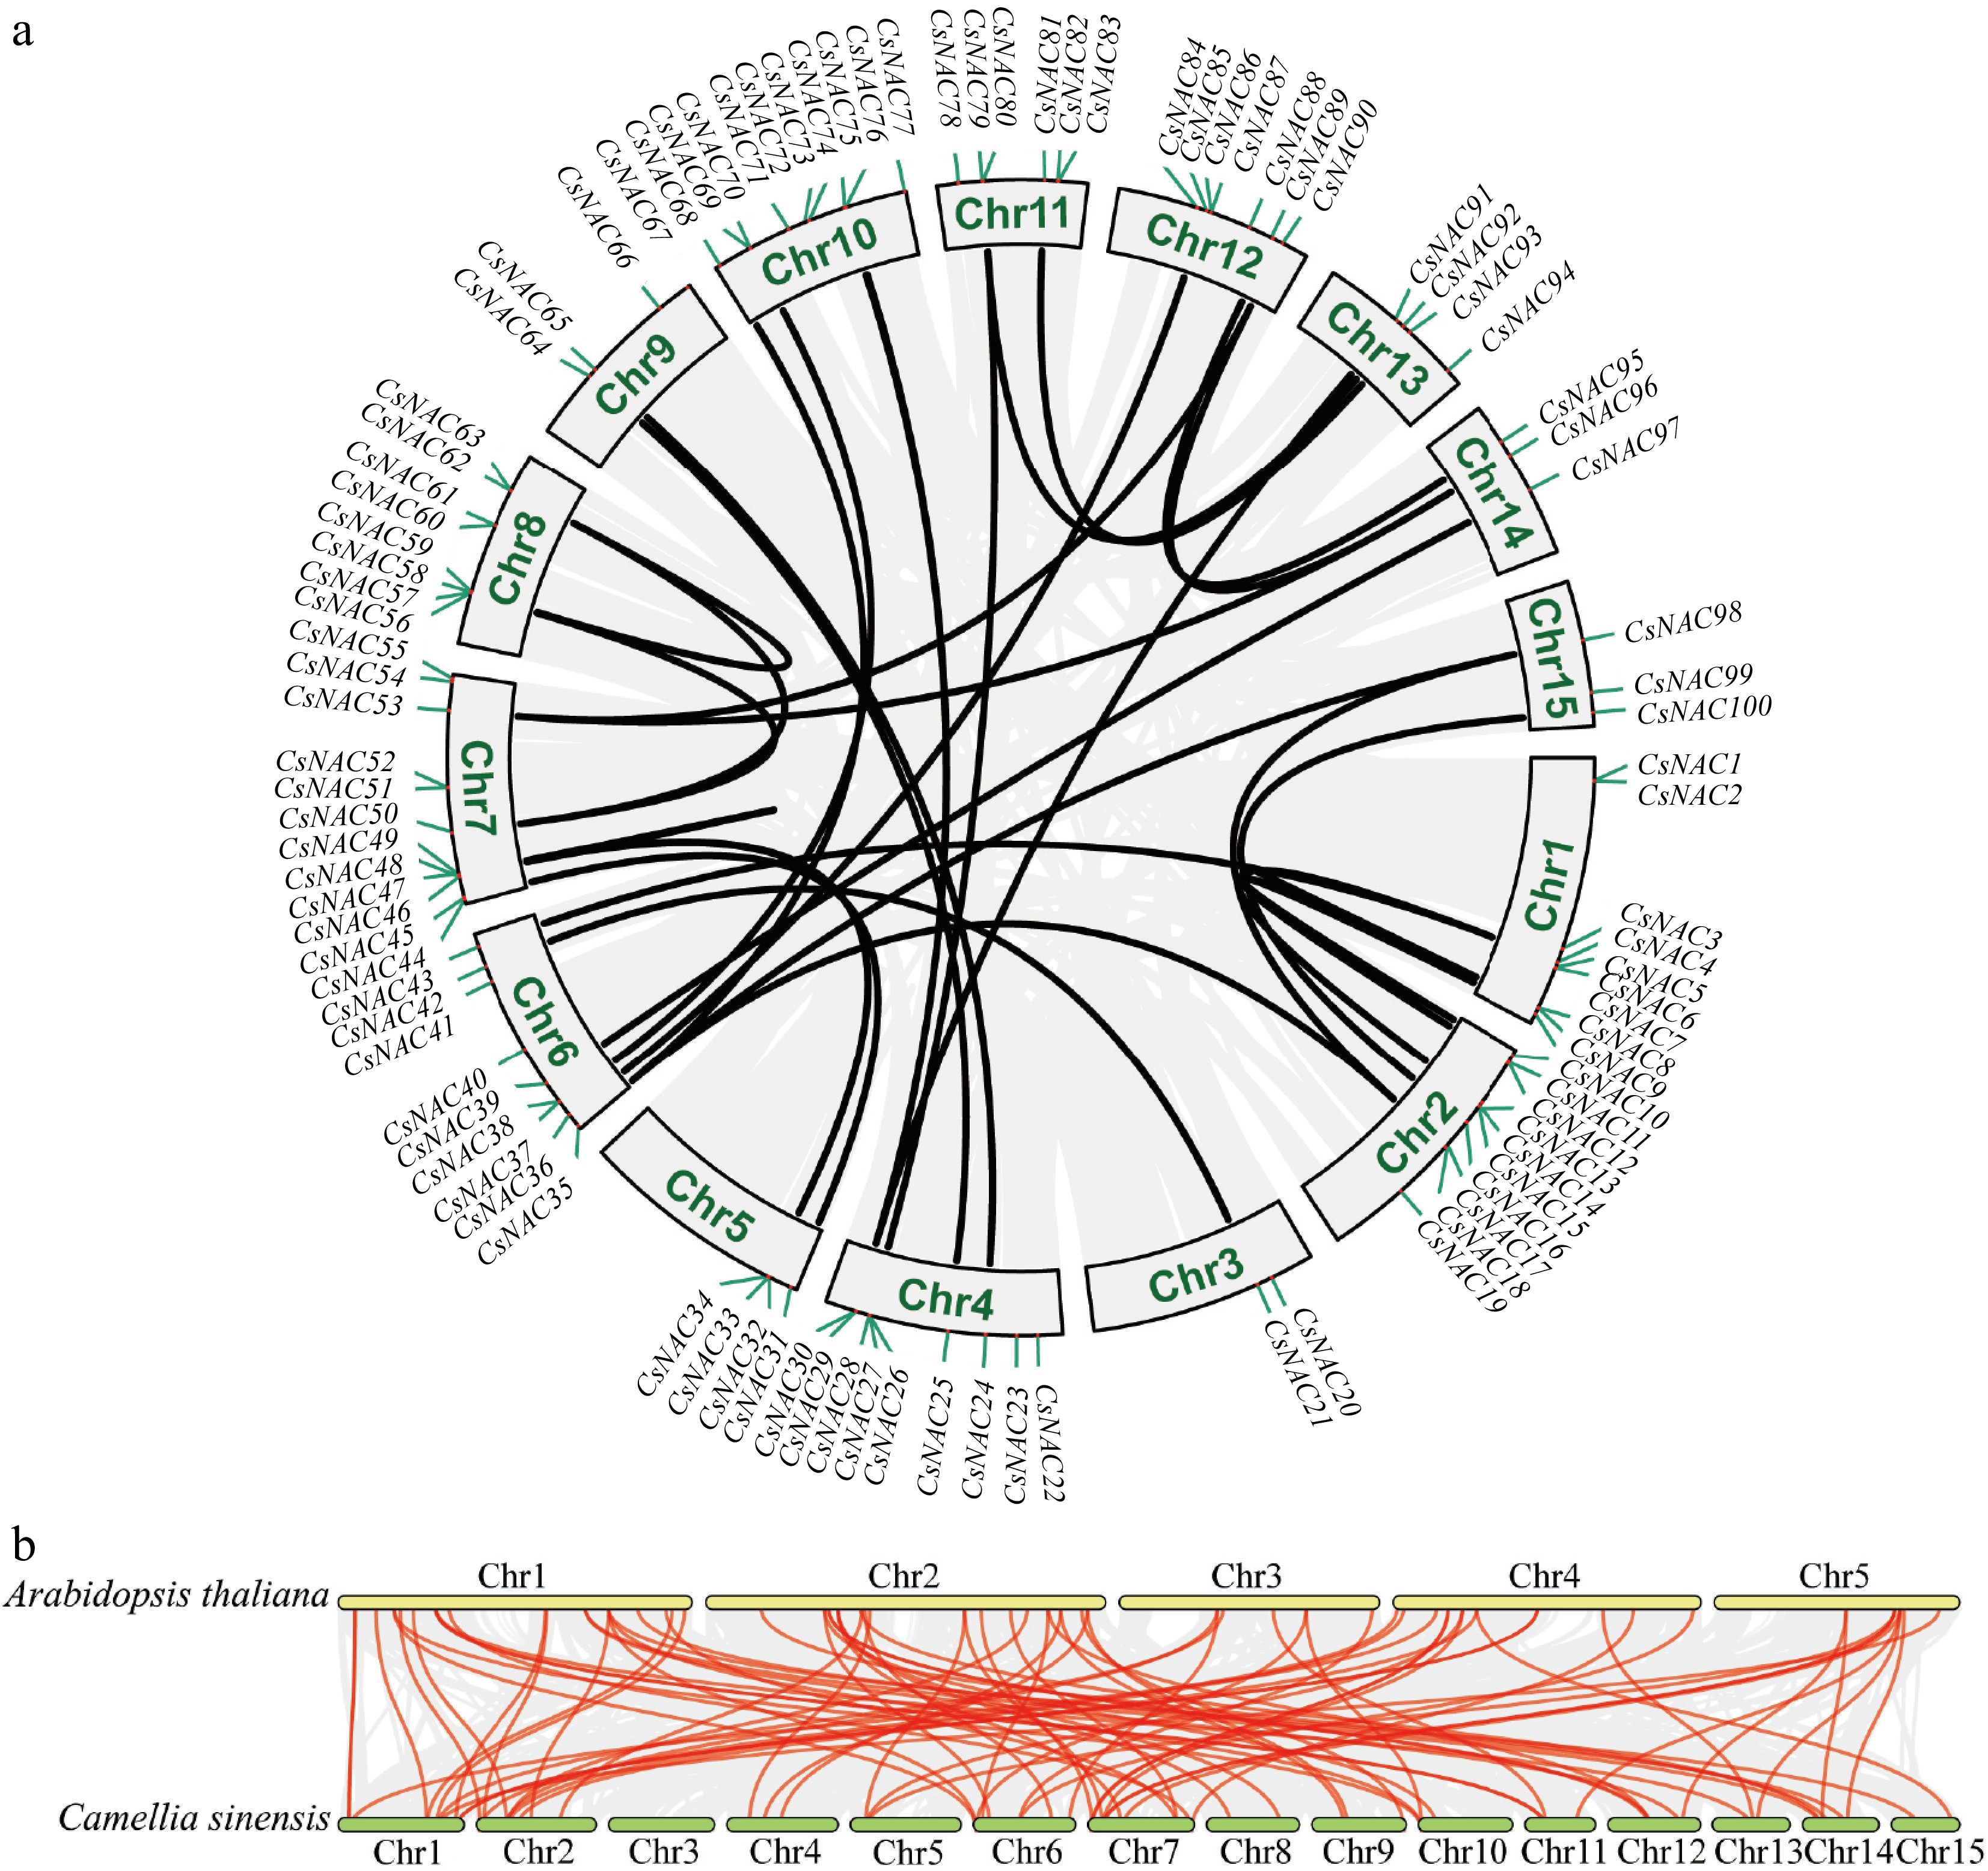
Figure 4.
Collinearity analysis of CsNAC genes. (a) The intra-species collinearity analysis of the CsNAC genes shows 100 CsNAC genes labeled according to their chromosomal distribution in the tea plant genome. The red line indicates the duplication event of the CsNAC genes, while chromosome numbers are marked within gray rectangles. (b) The interspecies collinearity analysis compares the NAC genomes of the tea plant and A. thaliana. In this analysis, the red line represents the homologous gene pairs of the CsNAC genes, whereas the gray line signifies other homologous gene pairs.
Analysis of cis-acting elements in promoter regions of tea plant NAC gene family members
-
To investigate the function of the tea plant NAC gene, we utilized the PlantCARE database to predict potential cis-acting elements within the promoter region of the tea plant NAC gene. A total of 2,289 elements were identified, and the cis-acting elements of the CsNAC genes were categorized into three types: environmental factor cis-acting elements, metabolite cis-acting elements, and plant tissue-specific cis-acting elements, followed by visual analysis (Supplementary Fig. S1). Among all the response elements of the tea plant NAC gene family members, the most abundant were the photoresponsive elements, with 1,171 identified. This suggests that the CsNAC genes may play a role in the response of tea plants to light. CsNAC98 contains the most photoresponsive elements, totaling 22, while CsNAC53 has the fewest, with only three. Additionally, we identified 250 anaerobic response elements, 208 MeJA response elements, and 198 abscisic acid response elements. The wound response elements were the least numerous, with only five identified. These findings indicate that the CsNAC gene family plays a significant role in regulating plant growth, metabolism, responses to environmental stress, and other vital life processes.
Effect of shading treatment on tea quality metabolites
-
To investigate the impact of shading on tea-quality metabolites, we established a control group and groups subjected to 5, 15, and 30 d of shading. As the shading duration increased, the tea leaves color progressively deepened and turned green, indicating that shading significantly influences the coloration of tea leaves, which is closely associated with chlorophyll content. The level of chlorophyll directly affects both the quality and yield of tea[41]. As illustrated in Fig. 5b, shading treatments enhance chlorophyll a, chlorophyll b, total chlorophyll, and carotenoid content in tea leaves, with the S30 treatment showing the most significant increases in total chlorophyll and carotenoids. Furthermore, the chlorophyll a/b ratio decreased with prolonged shading duration. These findings suggest that shading effectively increases tea leaves' chlorophyll and carotenoid content, thereby enhancing the color quality.
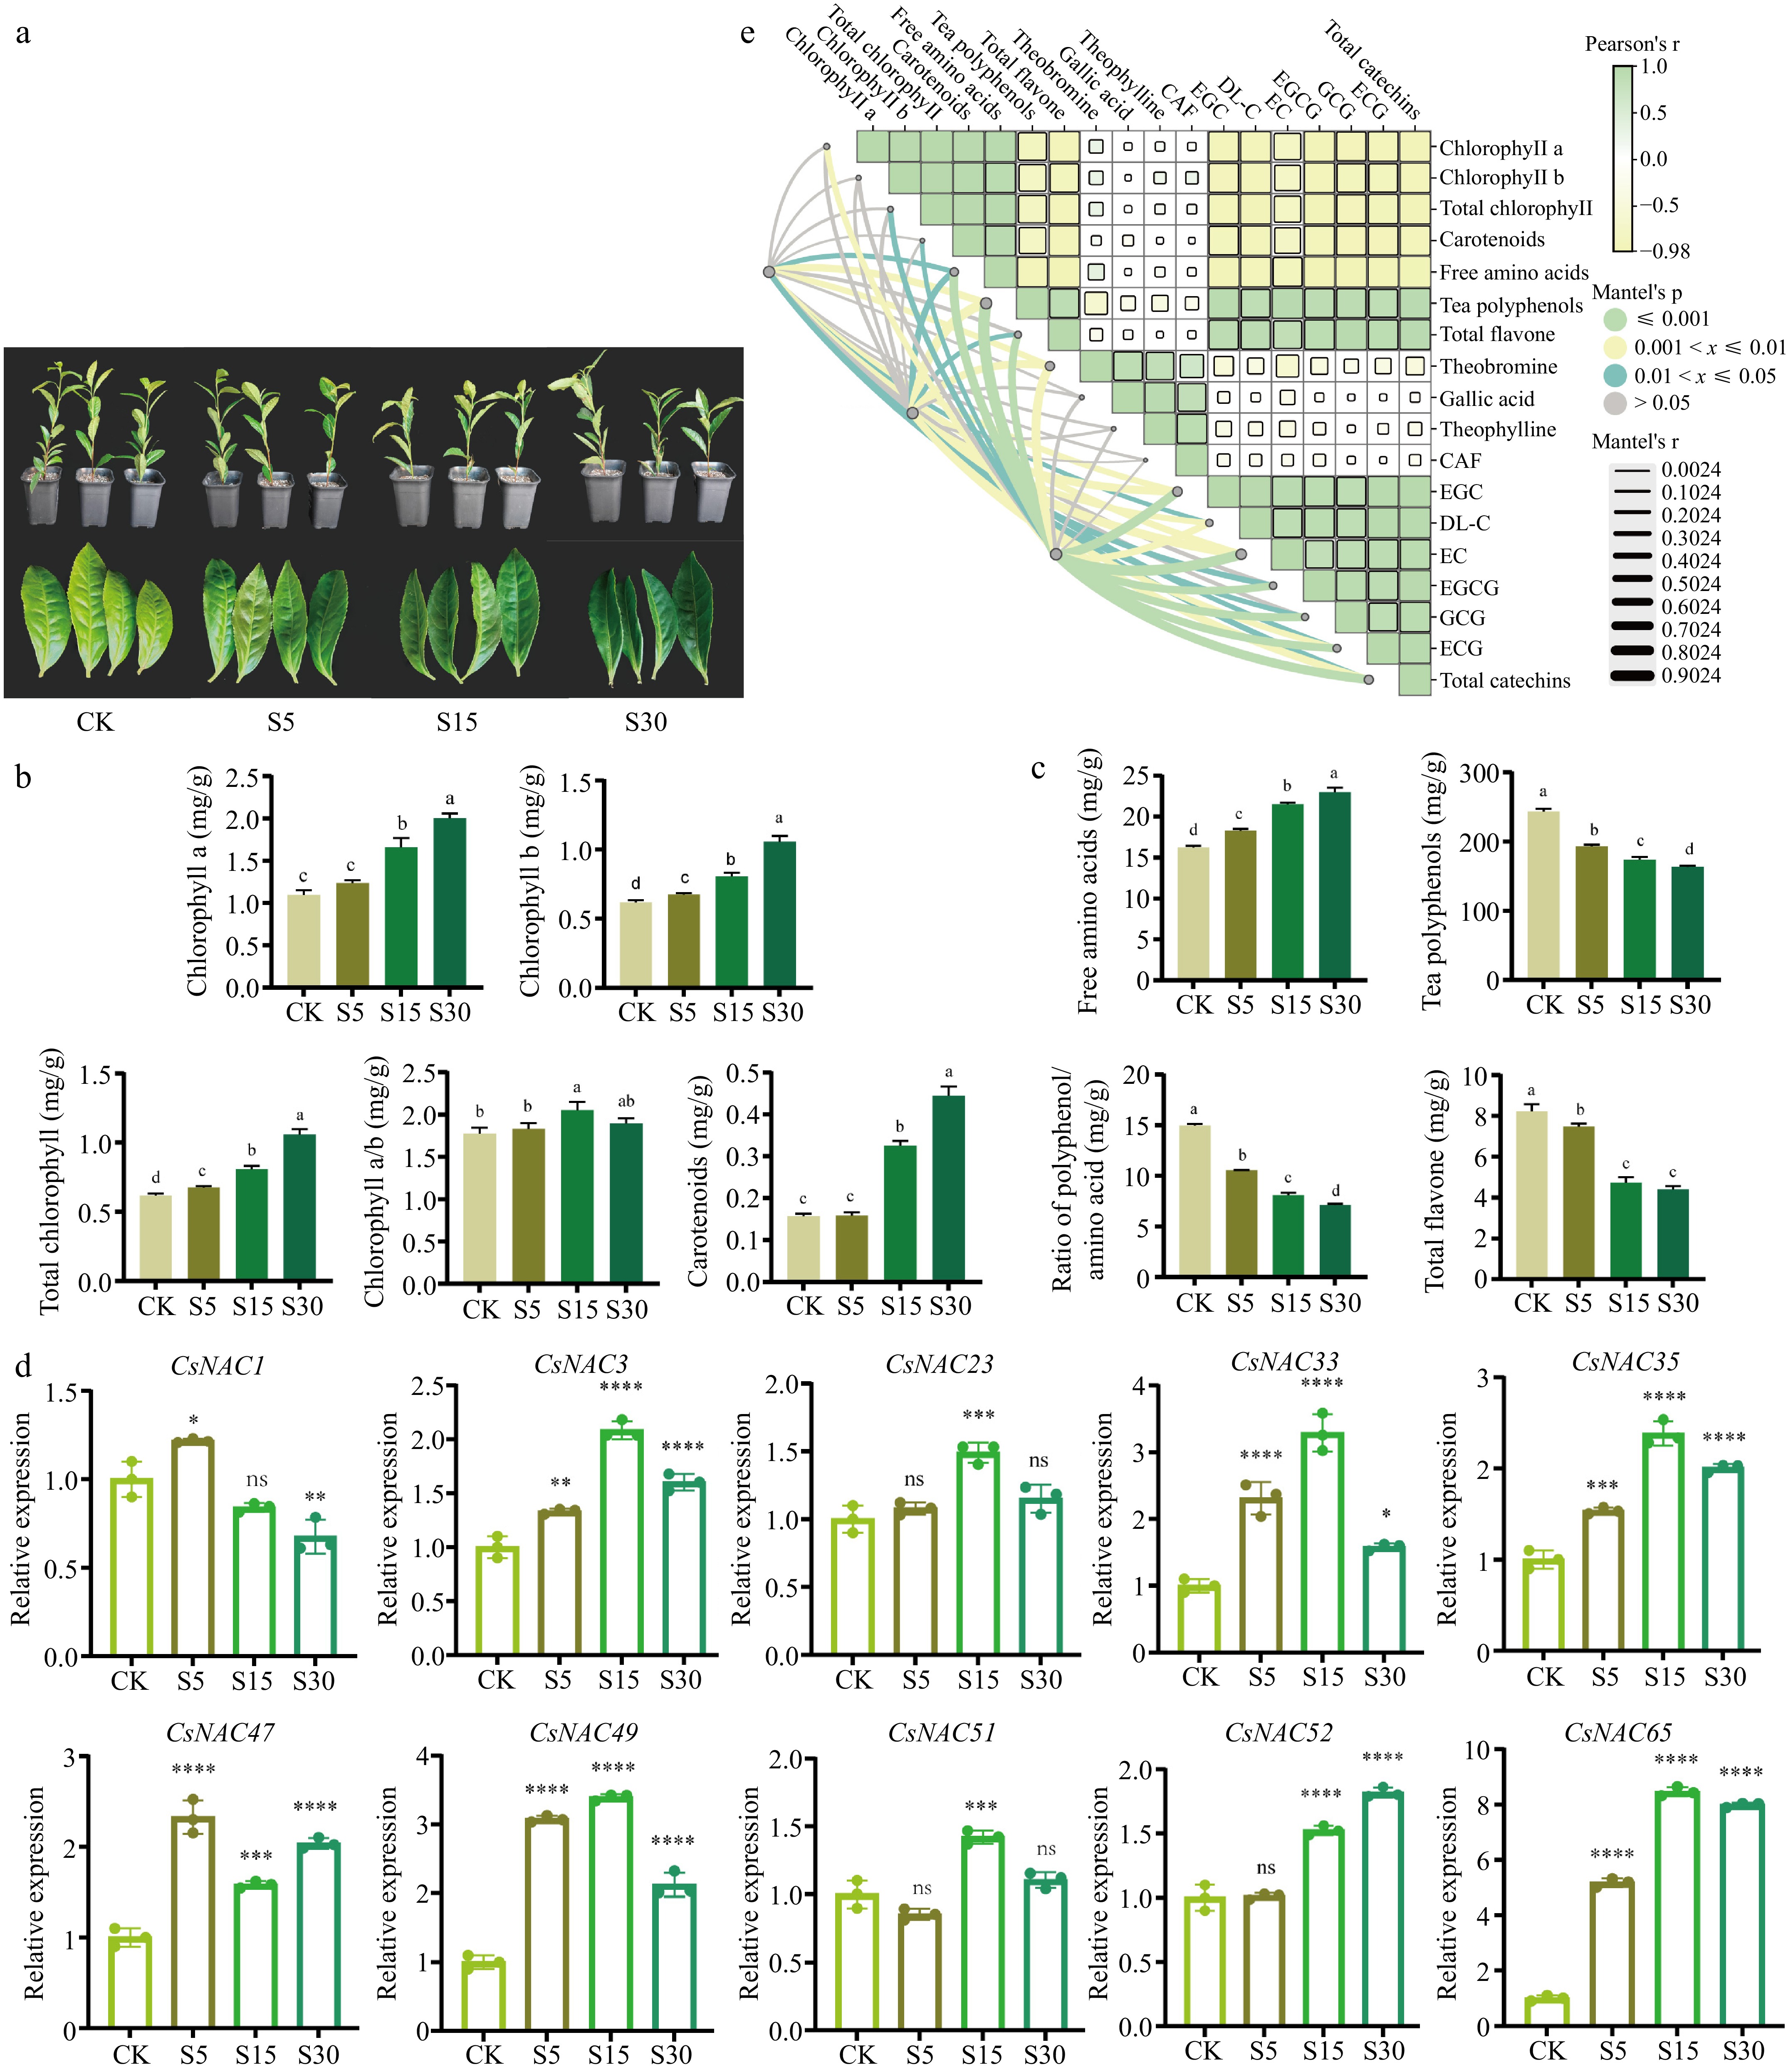
Figure 5.
Changes in the content of photosynthetic pigments, quality chemical components and gene expression analysis of tea leaves under different shade days. (a) Displays the effects of shading treatments on tea plant leaves, highlighting the color changes observed under different shading durations. (b) Shows the alterations in photosynthetic pigment content following shading treatment. (c) Depicts the modifications in quality components of tea leaves resulting from shading treatment. (d) Presents the results of RT-qPCR, which measures the expression levels of genes in tea leaves under various shading conditions. (e) Provides a correlation analysis between the expression levels of CsNAC33, CsNAC49, and CsNAC65 and the physiological indicators of tea plants. CK refers to the control group; S5 indicates shading treatment for 5 d; S15 represents shading treatment for 15 d; and S30 denotes shading treatment for 30 d. Values are expressed as means ± SD (n = 3). Different letters signify significant differences (p < 0.05) as determined by one-way ANOVA and Duncan's test. Asterisks indicate significantly different values for each group compared to the control group (* p < 0.05; ** p < 0.01; *** p < 0.001; **** p < 0.0001).
Non-volatile compounds, such as amino acids, catechins, and flavonoids, are closely related to taste characteristics[42]. Free amino acids play a crucial role in the flavor of tea. The free amino acid content in the shade treatment group was higher than that of the control group, and the free amino acid content of tea leaves increased significantly with prolonged shading duration. This indicates that shading is beneficial for enhancing tea's free amino acid content. Furthermore, tea is rich in phenolic compounds, which are secondary metabolites of the tea plant and are essential for determining tea quality[43]. Tea polyphenols and flavonoids, as important members of phenolic compounds, are one of the main components causing bitterness and astringency in tea. Notably, the tea polyphenol content in the shading treatment group was lower than that of the control group, and it significantly decreased with increased shading duration. As the number of shading days increased, the tea polyphenol content in the leaves decreased. In contrast, the free amino acid content increased, significantly reducing the phenol-to-amino acid ratio compared to the control group (Fig. 5c). Additionally, the shading treatment markedly decreased flavonoid content in tea leaves, with flavonoid levels significantly declining as shading duration increased, reaching their lowest point on the 30th day of shading (Fig. 5c).
To investigate the effect of shading duration on the biochemical components of tea, we determined the contents of theobromine, gallic acid, theophylline, caffeine (CAF), and catechins (C, EC, ECG, GCG, EGC, and EGCG) (Table 1). The primary alkaloids in tea include caffeine, theobromine, and theophylline, with caffeine being the most abundant, comprising approximately 2% to 5% of the dry matter of tea. As shown in Table 1, theobromine content in the shading treatment group was higher than in the control group. Additionally, after 5 and 30 d of shading, the contents of gallic acid, theophylline, and caffeine in the tea leaves exceeded those in the control and 15-d shading groups. Catechins, which are the main contributors to the bitterness and astringency of tea, were observed to be lower in the shading treatment group compared to the control group, particularly after 30 d of shading, when catechin content decreased significantly. Shading may reduce the bitterness and astringency of tea leaves.
Table 1. Presents the effect of shading on the catechin components of tea leaves (mg/g).
mg/g (DW) CK S5 S15 S30 Theobromine 0.65 ± 0.02c 1.59 ± 0.20a 1.09 ± 0.07b 1.28 ± 0.07b Gallic acid 0.16 ± 0.01c 0.37 ± 0.016a 0.18 ± 0.01c 0.25 ± 0.02b Theophylline 0.08 ± 0.01c 0.18 ± 0.01a 0.08 ± 0.01c 0.14 ± 0.01b CAF 32.62 ± 2.56b 42.01 ± 2.02a 29.99 ± 1.33b 39.81 ± 1.35a DL-C 5.77 ± 0.58a 4.85 ± 0.34b 3.96 ± 0.09c 2.56 ± 0.02d EC 12.20 ± 1.53a 8.66 ± 0.54b 7.30 ± 0.31bc 6.51 ± 0.35c ECG 31.55 ± 3.27a 28.21 ± 0.49b 22.88 ± 0.60c 20.15 ± 0.60c GCG 3.36 ± 0.38a 2.78 ± 0.10b 1.56 ± 0.27c 1.26 ± 0.30c EGC 40.36 ± 3.06a 31.93 ± 1.60b 26.95 ± 0.52c 20.85 ± 0.67d EGCG 97.20 ± 4.40a 88.54 ± 2.17b 78.88 ± 1.46c 68.78 ± 2.74d Total catechins 190.42 ± 3.96a 163.29 ± 3.146b 141.53 ± 1.49c 118.06 ± 6.59d The values are expressed as means ± SD (n = 3), with different letters indicating significant differences (p < 0.05) as determined by one-way ANOVA and the Duncan test. DW, dry weight. Expression analysis of tea plant NAC gene in eight representative tissues
-
Gene expression is essential for its biological function. To further investigate the biological role of the CsNAC genes, we examined its expression across various tissues in tea plants. The results demonstrated that CsNAC genes within the same evolutionary branch exhibit distinct tissue expression characteristics, indicating differentiation in spatial expression throughout the long-term evolutionary process. For instance, the ATAF member CsNAC3 shows higher expression levels in roots, while CsNAC65 is predominantly expressed in fruits, terminal buds, young leaves, and old leaves. Additionally, CsNAC35, a member of the SENU5 class, has elevated expression in stems and mature leaves, whereas CsNAC33, belonging to the ONAC003 class, displays higher expression levels in flowers (Supplementary Fig. S2).
Leaves are a plants primary organ for photosynthesis and play a crucial role in their life processes[44]. Therefore, further analysis of the CsNAC genes involved in leaf development is warranted. The expression levels of CsNAC3, CsNAC23, CsNAC35, CsNAC47, CsNAC49, CsNAC51, and CsNAC65 are relatively high in young leaves, with CsNAC65 exhibiting the highest expression level. In mature leaves, the expression levels of CsNAC1, CsNAC23, CsNAC35, CsNAC51, CsNAC65, and CsNAC68 are elevated, among which CsNAC35 has the highest. For old leaves, the expression levels of CsNAC1, CsNAC23, CsNAC33, CsNAC47, CsNAC51, and CsNAC65 are also relatively high, with CsNAC65 again showing the highest expression level. The identification of genes with high expression levels in tea leaves, specifically CsNAC1, CsNAC3, CsNAC23, CsNAC33, CsNAC35, CsNAC47, CsNAC49, CsNAC51, CsNAC52, CsNAC65, and CsNAC68, will be the focus of future research.
Expression analysis of tea plant NAC gene under shading treatment
-
To further verify the expression patterns of the selected 11 CsNAC genes under shading treatment, we used cut seedlings of 'Zhuyeqi' as material. Based on the duration of shading, we established a control group and treatment groups subjected to 5, 15, and 30 d of shading. Subsequently, tea leaves were collected to extract RNA, which was then converted into cDNA for RT-qPCR analysis. As shown in Fig. 5d and Supplementary Fig. S3, we analyzed the differential expression of CsNAC genes under varying shading treatments. The expression of CsNAC1 was up-regulated after 5 d of shading, but it gradually decreased with the extension of shading duration. The expression patterns of CsNAC3, CsNAC23, CsNAC33, CsNAC35, CsNAC49, CsNAC51, CsNAC65, and CsNAC68 were similar; after 15 d of shading, their expressions increased by approximately 2.08, 1.5, 3.29, 2.38, 3.39, 1.42, 8.46, and 1.04 times, respectively, but were down-regulated after 30 d of shading. The expression of CsNAC47 was up-regulated after 5 and 30 d of shading, while it was down-regulated after 15 d. In contrast, the expression of CsNAC52 continued to be up-regulated with the extension of shading time. Notably, CsNAC65 exhibited the most significant expression under shading treatment, suggesting it may be a key candidate gene for tea plant expression in response to shading.
The CsNAC33, CsNAC49, and CsNAC65 genes were selected for correlation analysis with physiological indicators. As illustrated in Fig. 5e, CsNAC65 exhibited a significant positive correlation with free amino acids, tea polyphenols, flavonoids, theobromine, and catechins (EGC, EC, EGCG, GCG, and ECG). These findings suggest that the high expression of CsNAC65 under varying treatment durations of 80% shading may be associated with the synthesis and decomposition of metabolites affecting tea quality.
Sequence analysis of tea plant CsNAC65 protein
-
Transmembrane structure analysis indicates that the probability of each amino acid position in the CsNAC65 protein being located outside the membrane is nearly 1, with high credibility. This finding suggests that the entire polypeptide chain of the CsNAC65 protein is situated outside the cell membrane, indicating the absence of a transmembrane region, thus classifying it as a non-transmembrane protein (Fig. 6a). SOPMA prediction results reveal that among the 291 amino acids constituting the CsNAC65 protein, 27 amino acids may form α-helices (9.28%), 32 amino acids may form extended chains (11%), and 232 amino acids may form random coils (79.73%) (Fig. 6b). A protein tertiary structure model was developed using the Chinese kiwifruit A0A2R6QYP1.1 model, which has the highest degree of similarity (Fig. 6c). The CsNAC65 protein is predicted to have four α-helices and 10 β-sheets, with a similarity of 82.39%. To identify proteins that interact with CsNAC65, STRING online software was employed, using tea plant TEA_008376 as a reference, constructing a protein interaction network (Fig. 6d). The prediction results indicate that TEA_008376 and TEA_015587 exhibit the highest scores and may share certain similarities. To further investigate the evolutionary relationship of the tea plant CsNAC65 protein, sequences from other species with high homology to CsNAC65 were screened using NCBI. A homology comparison was conducted, identifying six species: Humulus lupulus, Cannabis sativa, Ricinus communis, Morus notabilis, and Boehmeria nivea. NCBI was also utilized to predict the conserved domain of the gene, revealing that CsNAC65 possesses a conserved domain. Notably, the length of the homologous protein sequences of CsNAC65 did not vary significantly among these species (Fig. 6e). To further explore the function of this gene and its role, protein sequences from 10 different plants were constructed into a phylogenetic tree in this study (Fig. 6f). The results demonstrate that the CsNAC65 gene is most closely related to Ricinus communis and is most distantly related to Anisodus tanguticus and Gossypium mustelinum.
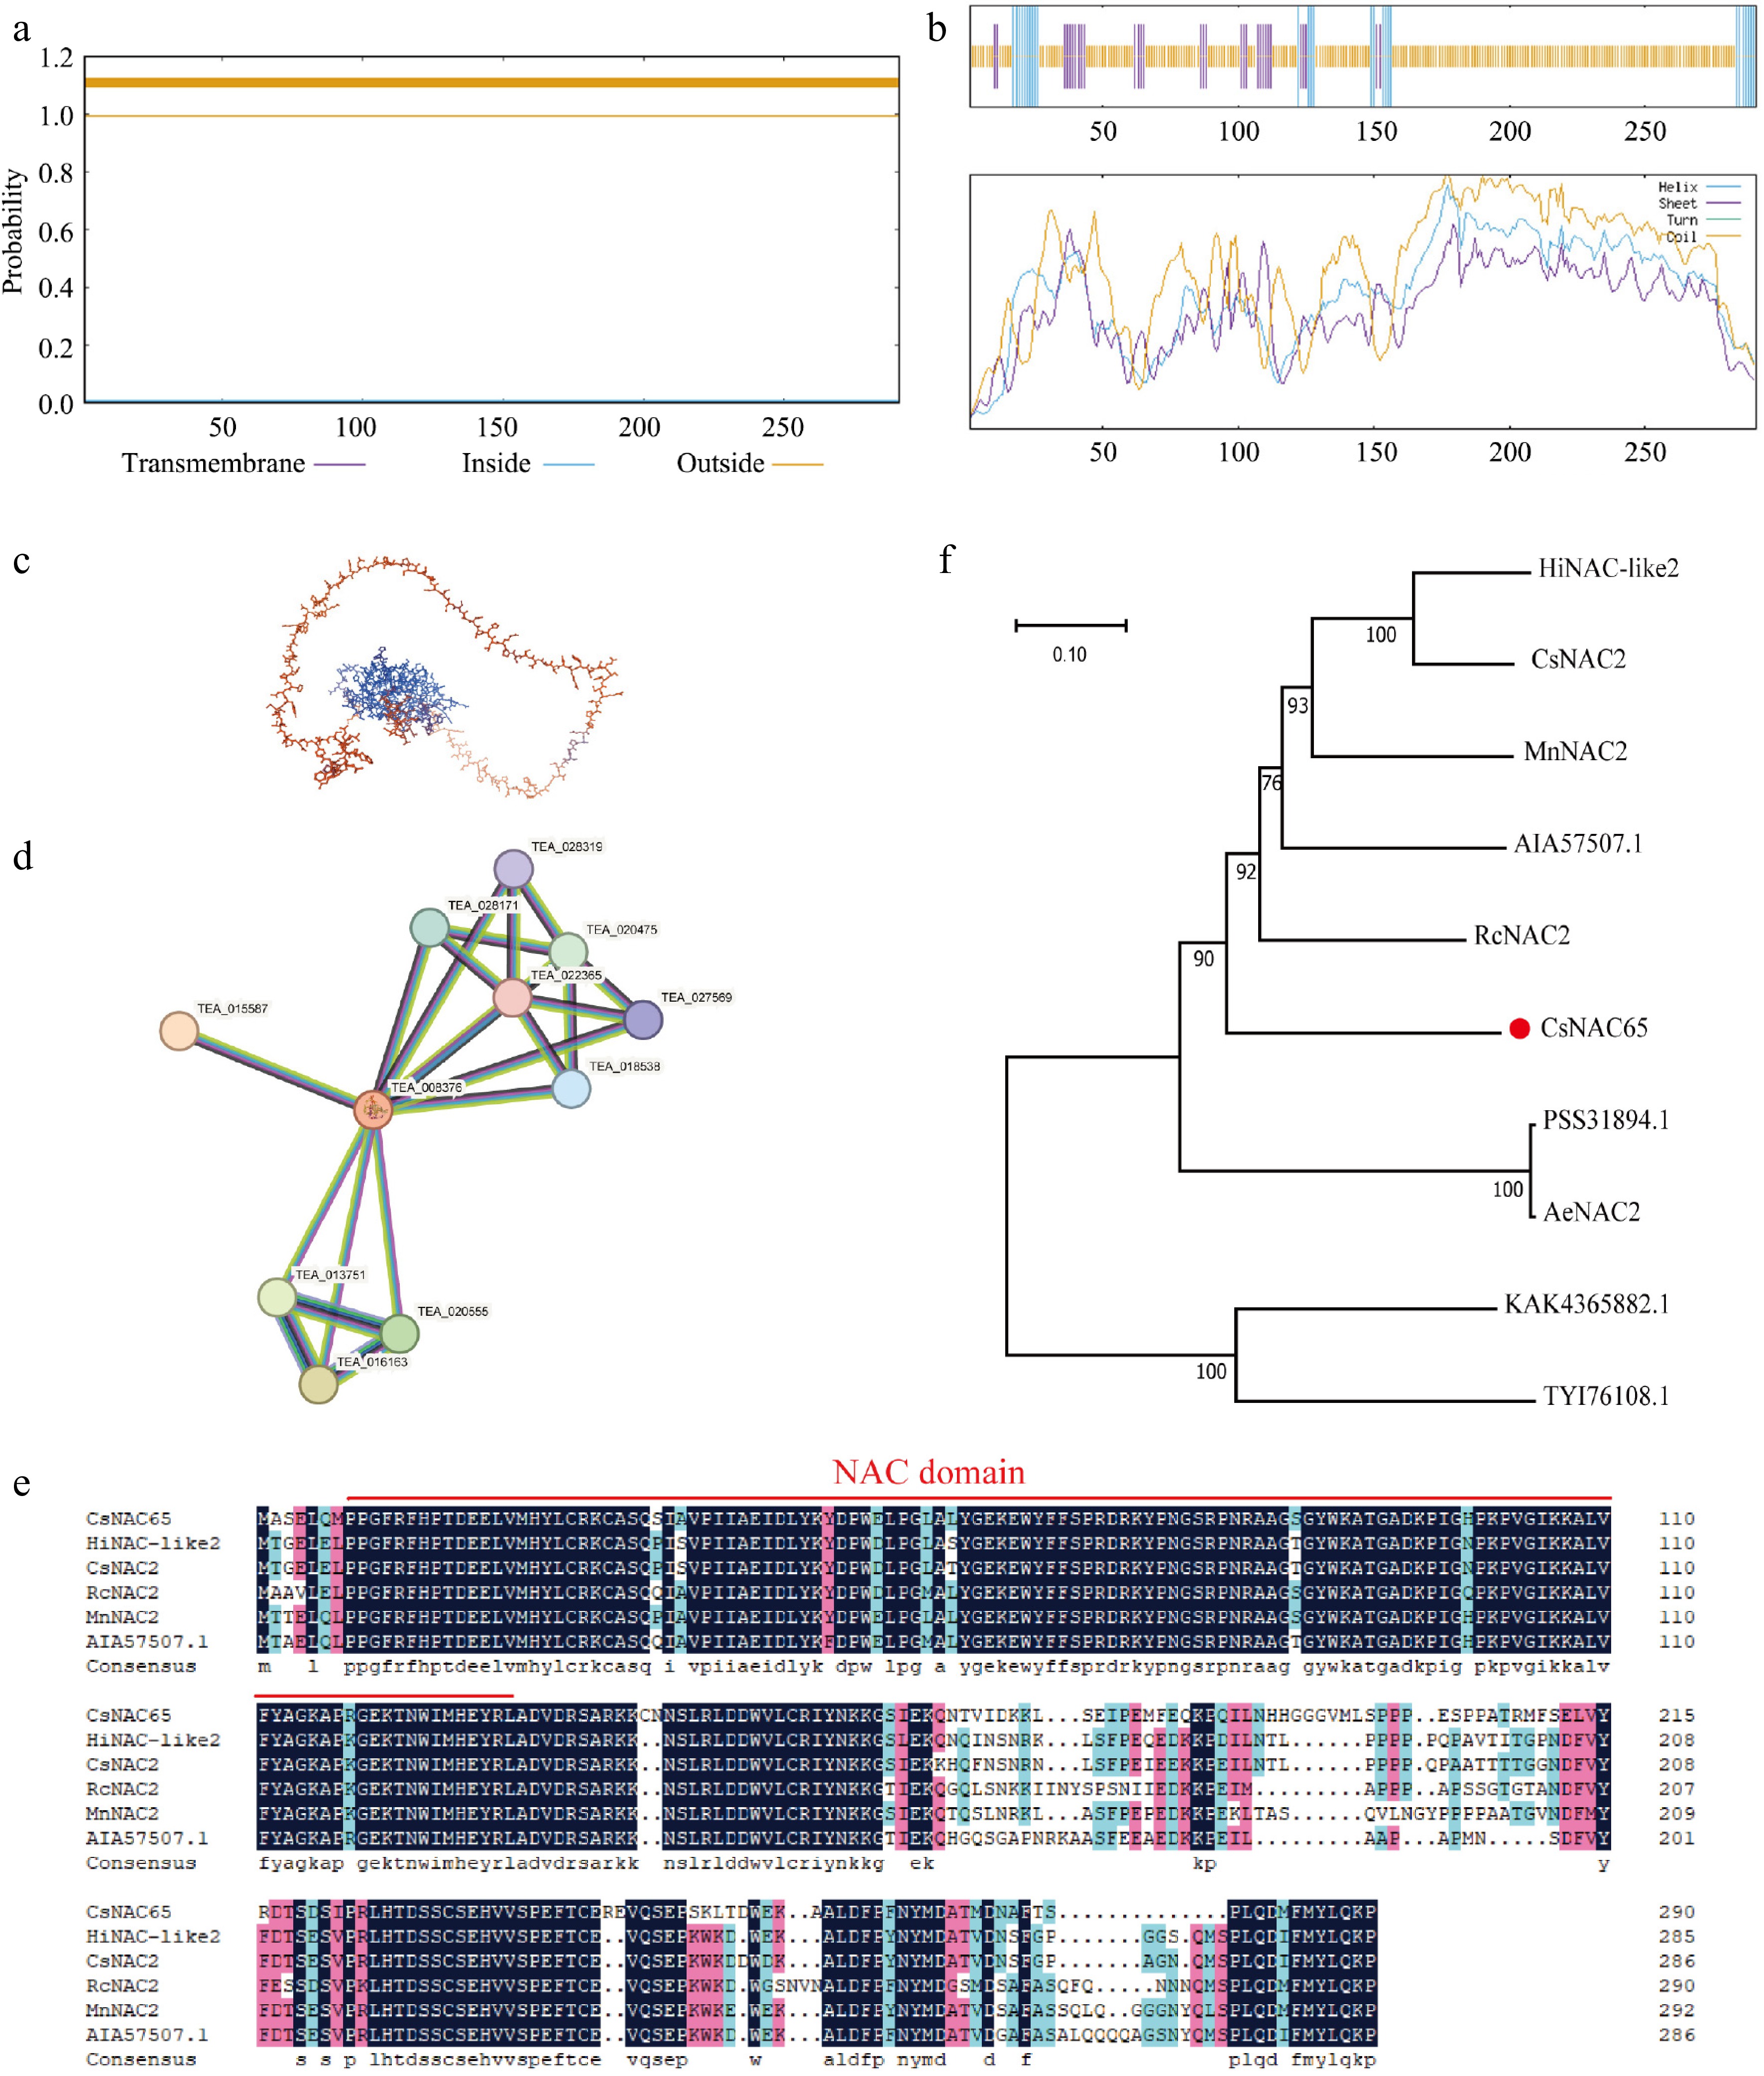
Figure 6.
Protein sequence analysis of CsNAC65. (a) Prediction of the transmembrane domain of CsNAC65. (b) Secondary structure prediction of CsNAC65. (c) Tertiary structure prediction of CsNAC65. (d) Prediction and analysis of protein interactions of CsNAC65. (e) Multiple alignments of the amino acid sequences of CsNAC65 and other plants. The red line indicates the conserved DNA binding domain. (f) Phylogenetic analysis of CsNAC65 (marked by a red dot) and other plants. The control species are: Humulus lupulus: HiNAC-like2, XP_062099271.1; Cannabis sativa: CsNAC2, XP_030493913.1; Ricinus communis, RcNAC2, XP_015575373.1; Morus notabilis, MnNAC2, XP_010095416.1; Boehmeria nivea, AIA57507.1; Actinidia chinensis var. Chinensis, PSS31894.1; Actinidia eriantha, AeNAC2, XP 057490780.1; Anisodus tanguticus, KAK4365882.1; Gossypium mustelinum, TYI76108.1.
Subcellular localization of CsNAC65 in tea plant
-
The subcellular localization of a protein can provide insights into its potential function. To determine the subcellular localization of CsNAC65, the pEAQ-CsNAC65-GFP construct was transiently expressed in tobacco, with pEAQ-GFP serving as a control in the leaf epidermis. Fluorescence signals were detected in the lower epidermal cells of tobacco leaves using a fluorescence microscope (Fig. 7). The results indicated that, in the positive control, green fluorescence was observed throughout the cells of 35S:GFP. In contrast, only green fluorescence signals were detected in the nucleus of tobacco plants transformed with the pEAQ-CsNAC65-GFP fusion plasmid agrobacterium. This finding suggests that CsNAC65 is localized in the nucleus, confirming it as a nuclear protein and aligning with predictions made by software analyses.
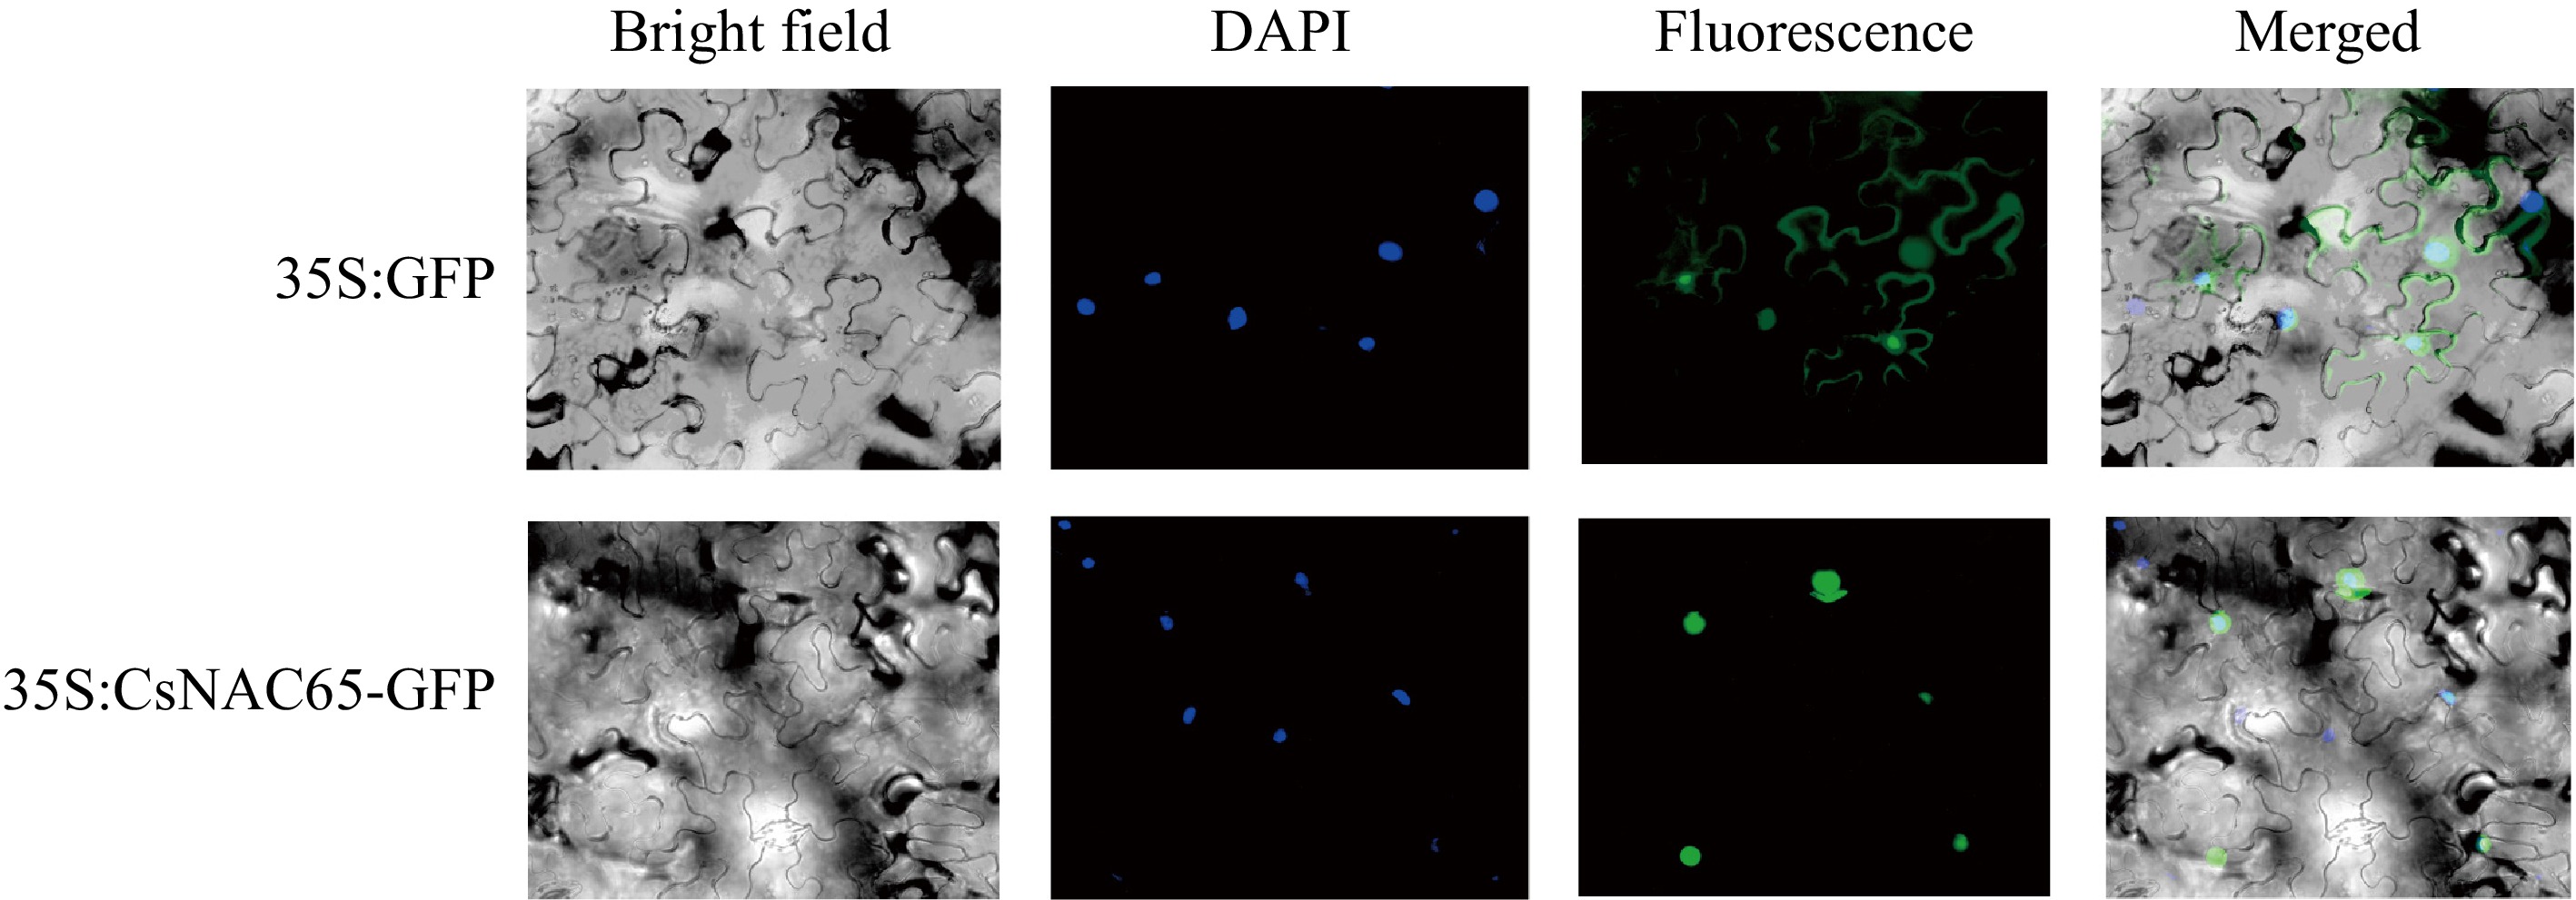
Figure 7.
Subcellular localization of CsNAC65 protein in tobacco epidermal cells. 35S:GFP, the vector used for transformation, in which the 35S promoter drives GFP expression; 35S:CsNAC65-GFP, the vector used for transformation, CsNAC65 is expressed fused to GFP driven by the 35S promoter. The scale bar represents 10 μm.
-
NAC transcription factors represent a significant class of plant-specific transcription factors that play crucial roles in plant responses to biotic and abiotic stresses[45]. The NAC gene family has been identified in a variety of plant species. In this study, we identified 100 CsNAC genes in the tea plant genome, a number that is comparable to that of A. thaliana (117)[11], Medicago truncatula (97)[19], and tomato (104)[20]. However, this number is lower than that found in poplar (163)[12], rice (151)[15], tobacco (152)[17], and soybean (152)[18]. This difference in size may be attributed to variations in whole genome duplication (WGD) and other gene duplication events that occur during species evolution and divergence. Furthermore, the analysis of physicochemical properties indicated that the 100 CsNAC proteins exhibited favorable biological characteristics. Significant differences in amino acid length, relative molecular mass, and theoretical isoelectric point may be related to their pleiotropic biological functions. CsNAC proteins exhibit high motif conservation, and the motif composition of CsNAC proteins within the same subfamily is generally similar. However, a few CsNAC protein motifs cluster together and display different compositions. For instance, CsNAC89 in the ANAC011 subfamily lacks motif 3, which other members share. This may be attributed to the loss of motif 3 by CsNAC89 during evolution, while other consensus sequences of this subgroup were retained. Most CsNAC genes contain two introns, with the conserved domain located at the N-terminus of the protein, consistent with the structural characteristics of NAC genes in other plants[7,8]. Based on phylogenetic analysis, this study categorized them into 16 and 17 subfamilies, revealing an uneven distribution across 15 chromosomes. Notably, the ONAC003 and OsNAC7 subfamilies harbor the highest number of CsNAC members. Gene duplication events are a primary driver of gene number increases within a species, occurring with varying frequencies throughout the evolutionary history of different species. Among the 100 CsNAC genes analyzed, eight pairs of tandemly duplicated NAC genes and 37 pairs of segmentally duplicated NAC genes were identified. Most gene pairs exhibiting different replication patterns have a Ka/Ks ratio of less than 1, indicating that the CsNAC genes have undergone purifying selection throughout the evolutionary process. The evolutionary relationship between NAC genes in tea plants and the model plant A. thaliana was further investigated, revealing 78 collinear gene pairs. This finding suggests these genes share a common ancestor and are evolutionarily closely related. The analysis of cis-acting elements indicates that the promoter region of the CsNAC genes contains numerous cis-acting elements associated with plant growth, metabolism, and environmental stress responses. Among these, the elements with the largest number of responses are light-responsive, suggesting that the CsNAC genes may play a role in the tea plant's response to light.
Tea plant (Camellia sinensis) is a typical perennial evergreen plant, and its growth and development are often influenced by various biotic and abiotic stresses[46]. Abiotic stresses, such as intense light, significantly impact plant growth and development. Under stress conditions, the transcription levels of many genes in plants are activated. NAC transcription factors are crucial in various metabolic pathways during plant growth, development, and stress responses[47−49]. For instance, during the coloring of apples, MdNAC52 is up-regulated by light-induced expression, contributing to the coloring process by stimulating the promoter activity of MdNAC52[50]. The NAC family transcription factor ATAF1 is an important regulatory factor that inhibits hypocotyl elongation under short-day conditions[51]. This indicates that the NAC family is involved in plant responses to light stress.
Additionally, NAC genes are significant in optimizing plant quality. For example, PpNAC1 not only regulates fruit softening and flavor formation by inducing ethylene production but also directly activates the transcription of genes associated with pectin metabolism, volatile organic compound (VOC) synthesis, and sugar transport during fruit ripening, thereby influencing fruit softening and flavor[52]. The citrate accumulation in kiwifruit is closely linked to the transcriptional regulation of citrate transporters by NAC transcription factors[53]. Wheat NAC-A18 regulates the accumulation of starch and seed storage proteins (SSP) and influences grain size, directly affecting wheat grains' processing quality[54].
Tea plant is a subtropical crop and prefers a warm and humid environment. Shading can mitigate the effects of high temperatures, intense light, and drought conditions on tea gardens, significantly enhancing the tea's aroma, taste, and color, thereby improving its overall quality. Studies have demonstrated the role of the NAC family in the model plant Arabidopsis[11], as well as in quality-related research across various crops, including apples[55], peaches[28], bananas[56], watermelons[29], and soybeans[57]. To investigate the effect of the NAC gene on tea leaves subjected to shading treatment, this study established different treatment durations (5, 15, and 30 d) under 80% shading. The focus was on analyzing the impacts on photosynthetic pigments, tea polyphenols, free amino acids, flavonoids, and catechin components, including EC, ECG, and EGCG, in the tea leaves. The results indicated that shading can enhance tea leaves' chlorophyll and free amino acid content while reducing tea polyphenols, flavonoids, and catechins. These findings align with previous studies, demonstrating that shading influences the secondary metabolites of tea and serves as an effective method for improving tea quality[58]. Based on the phylogenetic analysis (Fig. 2), CsNAC65 is a member of the ATAF subfamily and was designated NAC2 based on the genetic and genomic characteristics observed in A. thaliana. The NAC2 gene has been extensively studied across various plant species. For instance, the CiNAC2 gene enhances the drought resistance of pecans by increasing their superoxide dismutase (SOD) activity[59]. OsNAC2 plays a crucial role in rice's drought resistance and salt tolerance through the abscisic acid (ABA)-mediated pathway[60]. However, the current research does not address the effects of shading treatment on the NAC2 gene in plants. In this study, we screened 11 CsNAC genes and employed RT-qPCR to assess their relative expression in response to tea plant shading treatment. Our findings indicate that the expression of CsNAC65 increased by a factor of 8.46 under shading conditions. Simultaneously, we conducted a correlation analysis and found that the quality metabolites (free amino acids, theobromine, EC, EGC, EGCG, etc.) significantly changed in tea plants under shade and exhibited a strong positive correlation with the expression of CsNAC65. This finding suggests that CsNAC65 may be a key gene regulating tea plants' metabolic synthesis and decomposition in shaded environments. Previous studies have indicated that the ANAC078 protein is released from the membrane in response to specific signals, playing a critical role in regulating flavonoid biosynthesis-related gene expression under muscular light stress[61]. This study investigates the potential role of the NAC gene in regulating the quality metabolism of tea plants under shade, thereby providing a foundation for future exploration of CsNAC65 gene function and the investigation of upstream and downstream molecular mechanisms.
-
This study identified 100 CsNAC genes from the tea plant genome and conducted a systematic analysis. The effects of shading treatment on the quality metabolites of tea leaves were discussed. It was found that shading can increase the chlorophyll and free amino acid content of tea leaves while reducing the levels of tea polyphenols, flavonoids, and catechins. Additionally, the expression patterns of CsNAC genes under shading treatment were analyzed, revealing that CsNAC65 was highly expressed under these conditions. This indicates that CsNAC65 has a significant response to shading treatment. The results of this study provide a foundation for further research into the function and regulatory mechanisms of CsNAC65 under shading treatment.
This study was financially supported by the project of the National Key Research and Development Plan (2024YFD1200504, 2022YFD1600801); the key projects from the Nature Science Foundation of Hunan Province (2021JC0007); the project of National Natural Science Foundation of China (32372765); the project of Chenzhou National Sustainable Development Agenda Innovation Demonstration Zone Construction Project (2022SFQ48); and the project of Special Project for the Construction of Modern Agricultural Industrial Technology Systems in Hunan Province (HARS-10).
-
The authors confirm contributions to the paper as follows: study conception and design: Qiu S, Shao C; experiments performed: Xu R, Luo Y; data analysis: Qiu S, Shao C, Xu R, Luo Y; draft manuscript preparation and revision: Hu Q, Guo J, Peng Y, Tang H, Zhao Y; review: Huang J, Liu Z, Shen C. All authors reviewed the results and approved the final version of the manuscript.
-
Coding sequences, protein sequences, and expression data of 100 NAC genes are available in the tea plant information archive (TPIA: http://tpia.teaplants.cn/).
-
The authors declare that they have no conflict of interest.
-
# Authors contributed equally: Shuqi Qiu, Chenyu Shao
- Supplementary Table S1 All primer sequences in this study.
- Supplementary Table S2 Physicochemical properties of CsNACs family members.
- Supplementary Table S3 Ka/Ks values and replication types of tea plant NAC.
- Supplementary Fig. S1 Analysis of cis-acting elements in the promoter of the CsNAC gene family. The cis-acting elements of CsNAC genes are divided into three types: environmental factor cis-acting elements, metabolite cis-acting elements, and plant tissue-specific cis-acting elements.
- Supplementary Fig. S2 Expression analysis of tea plant NAC gene in eight representative tissues.
- Supplementary Fig. S3 The expression level of CsNAC68 in tea leaves under different shading treatments.
- Copyright: © 2025 by the author(s). Published by Maximum Academic Press, Fayetteville, GA. This article is an open access article distributed under Creative Commons Attribution License (CC BY 4.0), visit https://creativecommons.org/licenses/by/4.0/.
-
About this article
Cite this article
Qiu S, Shao C, Xu R, Luo Y, Hu Q, et al. 2025. Identification of the NAC gene family in Camellia sinensis and expression analysis of CsNAC65 under shading treatment. Beverage Plant Research 5: e024 doi: 10.48130/bpr-0025-0010 

Identification of the NAC gene family in Camellia sinensis and expression analysis of CsNAC65 under shading treatment
- Received: 10 January 2025
- Revised: 23 February 2025
- Accepted: 19 March 2025
- Published online: 26 August 2025
Abstract: NAC transcription factors represent a significant class of plant-specific transcription factors that regulate growth, development, and stress responses. To investigate the regulatory effects of NAC transcription factors on tea plant shading, this study identified and analyzed the NAC gene family, revealing 100 CsNAC genes distributed across 15 chromosomes. Based on phylogenetic analysis, these genes were categorized into 16 subfamilies, which identified eight pairs of tandem duplications and 37 pairs of segmental duplications. Cis-acting element analysis indicated that the promoter regions of CsNAC genes are linked to plant growth, metabolism, and environmental stress responses. The 100 CsNAC genes exhibited varying expression levels across different tissues. Additionally, we examined the effects of varying treatment durations (5, 15, and 30 d) under 80% shading on the levels of photosynthetic pigments, tea polyphenols, free amino acids, flavonoids, and catechin components (EC, ECG, EGCG, etc.) in tea leaves. The results demonstrated that shading increased tea leaves' chlorophyll and free amino acid content while decreasing tea polyphenols, flavonoids, and catechins. Furthermore, we identified 11 CsNAC genes for expression analysis under shade treatment, revealing that the expression of CsNAC65 increased by 8.46 times under shading conditions. Consequently, we focused on the CsNAC65 gene and conducted an in-depth analysis, including assessments of its transmembrane structure, secondary structure, tertiary structure, sequence alignment, and subcellular localization. In summary, this study enhances our understanding of the expression patterns of CsNAC genes under shading treatment and provides a foundation for further exploration of their regulatory effects on tea quality metabolites.
-
Key words:
- NAC /
- Gene /
- Family /
- Camellia sinensis /
- Expressions /
- CsNAC65