


-
Teen drivers persist as a long-standing traffic safety concern, as they continue to be disproportionately involved in crashes even when considering their lower levels of driving exposure[1]. Extensive research has been dedicated to discerning the risks associated with teen driver crashes[2−5], aiming to identify prevalent contributing factors attributed to these risks. A deeper understanding of these factors and their relationship to crashes is vital for developing programs to enhance teen driver safety. It is important to note that the definition of teen drivers can vary due to differences in the minimum legal age to obtain a driver's license across different regions. Some age groups are part of larger teen driver groups starting from 10 or 12-years-olds, subjected to special driving permits.
The comprehension of crash contributing factors is critical in developing and implementing the Graduated Driver Licensing (GDL) program, a significant milestone in addressing the issue of teen driver crashes[6]. The success of this structured program, which allows limited driving privileges to inexperienced novice drivers and gradually exposes them to high-risk driving situations through multiple stages followed by integral in-class and behind-the-wheel instructions, led to its widespread adoption, specifically in developed countries such as the US, Australia, and New Zealand. GDL stages usually have a learner's stage/permit, followed by an intermediate stage or provisional license, and finally a full privilege stage/license. A typical GDL program has several restrictions, such as a minimum age requirement for obtaining a learner's permit, a mandatory holding period before advancing to the intermediate stage, restrictions on nighttime driving, limitations on the number of young passengers without adult supervision (often zero or one), and a specific minimum age for obtaining full licensure. The distribution of US states by key GDL components is presented in Table 1.
Table 1. Comparison of GDL components among the US states.
Stage Components Categories States Count Stage 1
(Learner permit)Minimum entry Age < 15 years AK, AR, IA, ID, KS, MT, MI, ND, SD 9 15 years AL, CO, FL, GA, IL, IN, LA, ME, MN, MS, MO, NE, NM, NC, OR, SC, TN, TX, UT, VT, WA, WV, WY 23 15−16 years AZ, CA, HI, MD, NV, NH, OH, OK, VA, WI 10 16 years CT, DE, DC, KY, MA, NJ, NY, PA, RI 9 Holding period 10 d WY 1 4−6 months AL, AK, AZ, AR, CA, CT, DE, DC, HI, ID, IN, KY, LA, ME, MA, MI, MN, MO, MT, NE, NV, NJ, NM, NY, OH, OK, OR, PA, RI, SC, SD, TN, TX, UT, WA, WV, WI 37 9−12 months CO, FL, GA, IA, IL, KS, MD, MS, NC, ND, VA, VT 12 None NH 1 Minimum hours of supervised driving None AR, MS, NJ, SD 4 20-40 h AK, CT, DC, GA, IA, KS, MA, MN, NH, SC, UT, VT, VA, AZ, MO, TX, WI 17 50 h AL, CA, CO, DE, FL, HI, ID, IL, IN, LA, MI, MT, NE, NV, NM, NY, ND, OH, OK, OR, RI, TN, WA, WV, WY 25 60−70 h KY, MD, ME, NC, PA 5 Stage 2 (Intermediate license) Minimum age < 16 years ID, MT, NM, SC, SD 5 16 years AL, AK, AZ, AR, CA, CO, FL, GA, HI, IL, IA, KS, LA, ME, MI, MN, MS, MO, NE, NV, NH, NC, ND, OH, OK, OR, TN, TX, UT, VT, WA, WV, WI, WY 34 16−17 years CT, DE, DC, IN, KY, MD, MA, NJ, NY, PA, RI, VA 12 Unsupervised driving prohibited 10 pm–6 am DE, IL, MI, MS, KS, NC, ND, NV, NY, OK, SD, WV 12 11 pm–5 am AR, CA, CT, HI, IN, LA, MT, NJ, PA, TN, WY 11 Midnight–6 am AL, DC, KY, NE, OH, AZ, CO, GA, IA, ME, MD, MA, MN, NM, OR, TX, UT, VA, WI 19 1 am–5 am AK, FL, MO, NH, RI, WA 6 Sunset–Sunrise ID, SC 2 None VT 1 Passenger restriction No restriction DC, FL, GA, IN, ME, MS, ND, SD, UT, VT 10 No more than one AL, AZ, AR, CO, DE, HI, ID, IL, KS, KY, LA, MI, MO, MT, NE, NH, NJ, NM, NY, NC, OH, OK, PA, RI, TN, TX, VA, WI, WY 29 No passenger younger than 21 years AK, CA, CT, IA, MD, MA, MN, NV, OR, WA, WV 11 No more than two SC 1 Stage 3 (Permanent license) Minimum age 16 years ID, MT, ND, OH, SD 5 16−17 years AK, AZ, KS, ME, MS, NM, NC, OK, PA, SC, VT, WI, WY 13 17 years AL, CA, CO, DE, HI, IA, KY, LA, MI, MN, NE, NY, OR, TN, UT, WA, WV 17 18 years AR, CT, DC, FL, GA, IL, IN, MD, MA, MO, NV, NH, NJ, RI, TX, VA 16 Post-COVID-19 pandemic changes are not taken into account. Although the GDL program has been implemented across the US and in many countries, understanding the factors associated with teen driver crashes remains critically important for the following reasons:
• The need to reduce teen driver crashes, as crash rates associated with this demographic are still disproportionately higher than other groups even after GDL implementation. Teen driver crashes are still among important focus areas to address for many safety agencies.
• Strengthening or devising driver education training initiatives designed exclusively for teenage drivers, offered by various state and local transportation authorities.
• Strengthening the GDL program by transforming it into a comprehensive program that may require smarter policy updates in terms of strategic application of GDL restrictions (nighttime restrictions, passenger restrictions, etc.). For example, the in-class instructions in the GDL program can take advantage of teaching important safety issues to develop safe driving behaviors (using seatbelts, avoiding alcohol intoxication while driving, etc.), which could further be benefitted by the integration of updated facts associated with those issues.
• Countermeasure development outside GDL programs to educate and enforce teen driver safety requires a comprehensive understanding of the underlying safety factors involved.
Scope of the review
-
Research examining the risk factors for teen driver crashes can encompass various disciplines. Due to the intricate nature of crashes, the characteristics of these incidents can be influenced by several factors related to youthful driving behaviors, including driving ability (experience), physical, social, and behavioral development, personality traits, demographic factors, perceptions of the environment, and the driving environment itself[7]. Apart from crash studies, studies focusing on understanding the driving behaviors of teen drivers, particularly in relation to psychological factors within specific situational contexts, represent a distinct area of literature aimed at uncovering the root causes of teen driver crashes. Additionally, a significant body of literature exists on studies utilizing simulators to experimentally explore the heightened risk of crashes associated with teen drivers and the associated risks stemming from their dangerous driving behaviors, as measured by driving performance metrics.
Research on teen drivers has been conducted for many years, encompassing a wide range of literature, including studies conducted before the formal implementation of programs like the GDL. Discussions of those studies will most likely not be applicable to the current context of teen driver safety in the US. Additionally, a considerable amount of research has focused explicitly on GDL programs and their components. However, this paper does not directly focus on the components of the GDL program but rather on reviewing crash factors, such as driver, road, environment, and crash characteristics, typically derived from state-level police-investigated crash reports. Police-investigated crash data often encompasses a wide range of information, such as location, time, vehicle specification, road conditions, and primary contributing factors (e.g., distracted driving, speeding). In contrast, crash data from hospitals primarily centers around injury-related information. If a study requires detailed crash-specific information, police data may be more comprehensive. On the other hand, if the research objective pertains to understanding the public health impact, injury data derived from hospitals becomes more pertinent. The discussions within this paper revolve around the factors that contribute to the risk and severity of crashes involving teenage drivers. It presents contextual factors related to operating conditions, road conditions, vehicles, and driver characteristics. As a result, the research team primarily focuses on reviewing studies that utilize police-investigated crash databases. Nevertheless, it is worth noting that some insights into crash risks associated with crash characteristics have been drawn from literature that did not exclusively examine crash data.
-
Two independent investigators conducted a thorough literature search utilizing various databases, including Scopus, TRID, ProQuest, PubMed, Google Scholar, and Web of Science. To ensure the quality and reliability of the included studies, conference abstracts, dissertations, theses, reports, and articles published in non-peer-reviewed journals were excluded from the review process. In addition, all review articles were excluded. The final assessment focused on peer-reviewed journal articles that addressed teen driver crashes or compared crash characteristics between teen drivers and adult drivers. It should be noted that only research articles utilized the police-investigated crash database in the US (both national and state-level) were included. Additional relevant literature was identified by reviewing the bibliographies of selected articles. In total, 33 peer-reviewed journal articles were chosen for inclusion in the review. The selected studies were published between January 2000 and February 2023.
Figure 1 displays the word cloud generated from the chosen articles for review. This visualization makes it convenient to easily and quickly recognize the crash attributes that have been written about or discussed most frequently. The size of each word in the cloud represents its frequency of occurrence within the articles. The top ten most prevalent words identified in the cloud were 'drivers', 'crashes', 'age', 'teen', 'risk', 'injury', 'passenger', 'vehicle', 'safety', and 'data'. Additionally, within the top 60 frequently appearing words, various crash attributes such as alcohol, rural, urban, male, female, seatbelt, and speed were reflected.
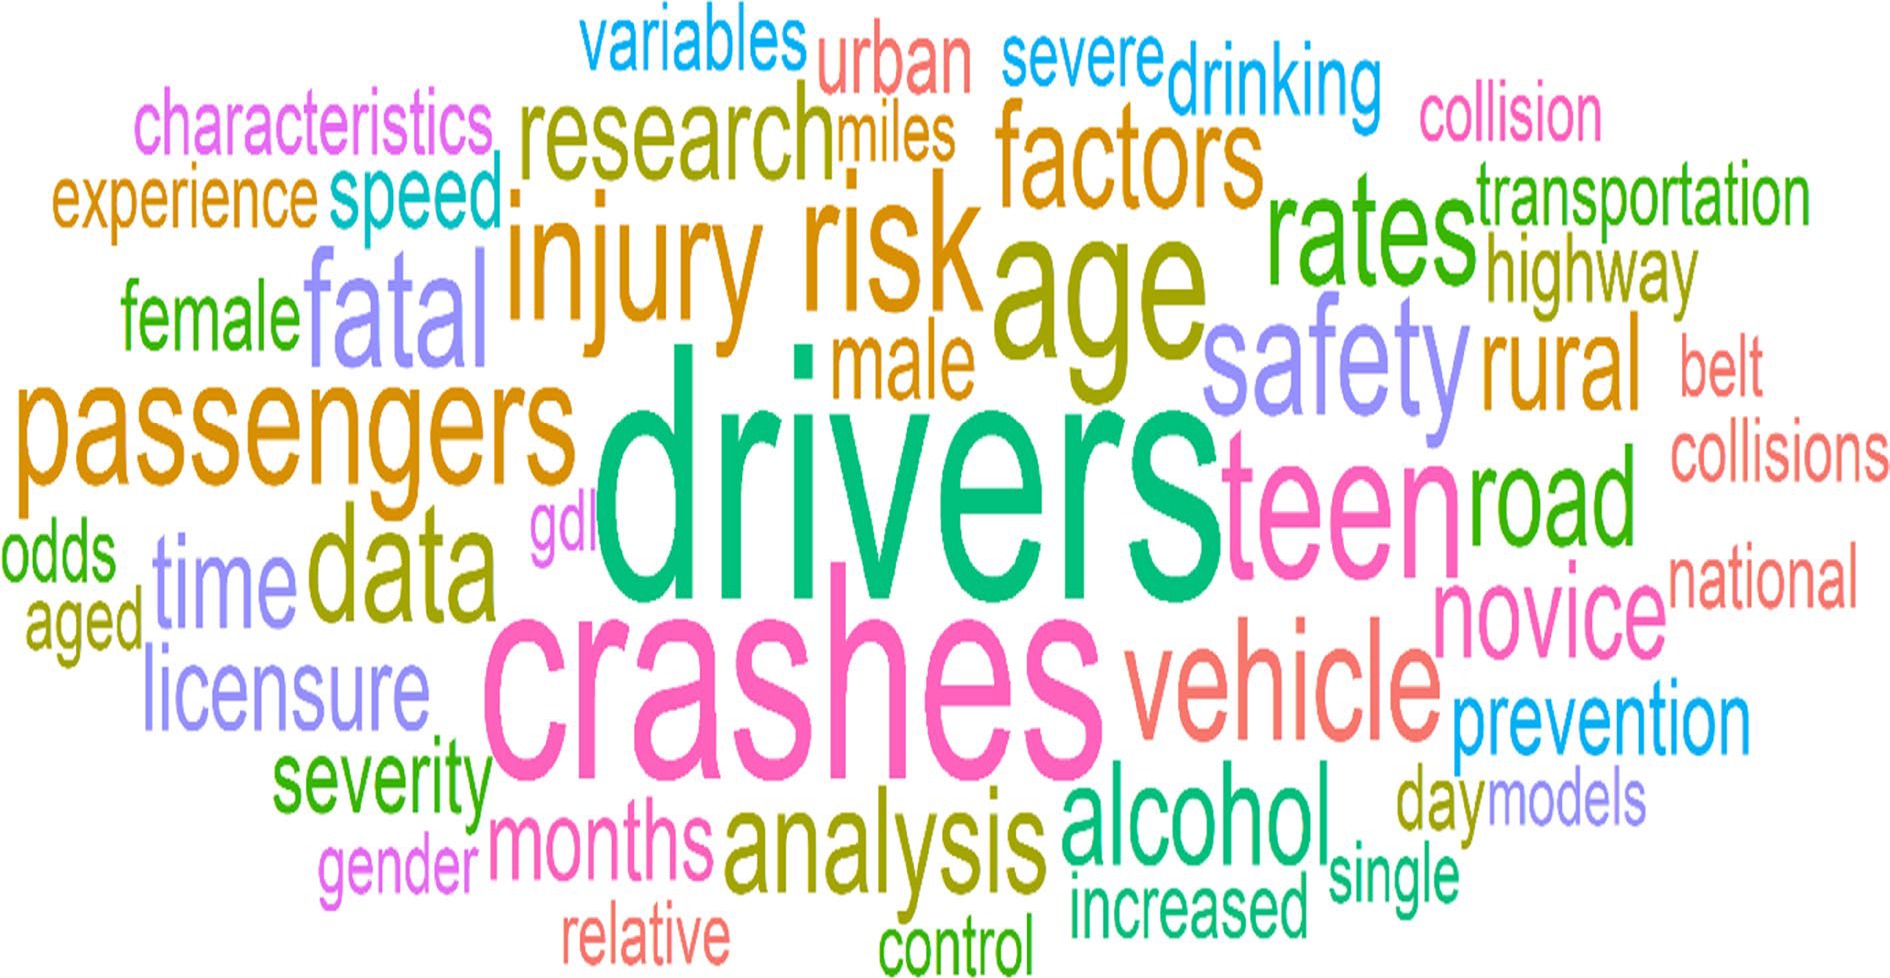
Figure 1.
Word clouds of selected articles.
-
Table 2 presents an overview of crash contributing factors along with selected literature. The table aims to identify the most examined risk factors in crashes involving teen drivers. Each article has been assigned a unique paper ID for easy reference. The variables in the table are arranged in descending order based on the number of studies that considered each risk factor for analysis. The top 17 crash variables included in the table are driver gender, presence of passengers, time of the crash, type of collision, usage of restraints, violation/primary contributing factor, day of the week, weather and surface conditions, lighting conditions, area setting, intoxication, highway type/class, intersection involvement, vehicle type, alignment, posted speed limit, and distraction. It is important to note that in the process of ranking, the research team placed emphasis on all the considered variables in the analysis for each article, rather than solely concentrating on the significant ones, which might be determined through statistical methods. This approach was chosen because the importance of variables can significantly vary based on the chosen methodological approaches. In some cases, using different methods with the same data can yield different sets of significant features.
Table 2. Risk factors used in prior teen driver studies.
Study ID Study ID Variable Paper ID Count Vachal et al.[8] #1 Duddu et al.[9] #18 Driver gender #1-#7, #9−#12, #14, #17-#19, #21−#27, #31, #32, #33 25 Tefft et al.[10] #2 Hossain et al.[11] #19 Passenger presence #1, #4, #5, #7−#9, #11, #13, #16, #18-#22, #24, #26, #27, #29, #31, #32, #33 21 Møller & Janstrup[12] #3 Cvijanovich et al.[13] #20 Crash hour #1-#5, #7, #9, #11, #13, #16, #18−#22, #24, #27, #29, #31, #32, #33 21 Hamann et al.[14] #4 Chen et al.[15] #21 Collision type #2-#5, #7−#9, #12, #14−#16, #17, #19, #20, #22, #27, #32, #33 18 Rahman et al.[16] #5 Kim et al.[17] #22 Restraint usage #1, #5, #9, #10, #12−#14, #16, #19, #20, #22, #23, #26, #27, #31, #32, #33 17 McCartt et al.[18] #6 Lin et al.[19] #23 Violation/primary contributing factor #1, #3−#5, #8-#10, #12, #14, #16, #19, #23, #27, #29, #32, #33 16 Mayhew et al.[20] #7 Pitt et al.[21] #24 Day of the week #2-#5, #7, #9, #12, #14, 316, #18−#20, #27, #31, #32, #33 16 Neyens & Boyle[22] #8 McDonald et al.[23] #25 Weather/Surface condition #1, #3-#5, #8, #9, #16−#19, #22, #23, #27, #31, #32, #33 16 Shults et al.[24] #9 Hutchens et al.[25] #26 Lighting condition #1, #5, #8, #9, #12, #16, #17, #19, #20, #22, #23, #27, #31, #32, #33 15 Chapman et al.[26] #10 Carney et al.[27] #27 Area setting #1-#6, #8, #12, #14, #17, #18, #23, #32, #33 14 Williams[28] #11 Mathew et al.[29] #28 Intoxication #3, #5, #8, #10, #11, #13, #14, #16, #17, #19, #26, #31, #32 13 Adanu et al.[30] #12 Villavicencio et al.[31] #29 Highway type/class #1, #5, #18, #19, #22, #23, #27, #28, #31, #32, #33 11 Williams & Shabanova[32] #13 Weast & Monfort[33] #30 Intersection #1, #3, #8, #12, #19, #22, #23, #31, #32, #33 10 Peek-Asa et al.[34] #14 Weiss et al.[35] #31 Vehicle type #5, #16, #18, #19, #22, #23, #30, #31, #32, #33 10 Carney et al.[27] #15 Hossain et al.[36] #32 alignment #1, #5, #17−#19, #23, #31, #32, #33 9 Gonzales et al.[37] #16 Hossain et al.[38] #33 Posted speed limit #5, #17−#19, #22, #28, #31, #33 8 Wang & Zhang[39] #17 Distraction #5, #8, #10, #15, #19, #27, #32, #33 8 Other variables: first harmful event (#9, #23, #25, #31), movement prior to crash (#22, #25, #31, #32), driver race (#12, #23, #26), driver condition (#18, #26, #31), traffic control (#22, #23, #31), season (#12, #29, #31), ejection (#12, #14), airbag (#1, #30), number of lanes (#12, #28), access control (#18. #28), work zone (#22), vehicle age (#30), surface type (#1), vehicle year (#22), close to home (#12), location type (#28), annual average daily traffic (#28). Understanding the impact of key risk factors
Driver age and gender
-
More than three decades earlier, Mayhew & Simpson[40] analyzed Ontario crash data following the findings of available literature to explicate the relationship between driver age and experience in collision involvement. The results exhibited that the reduction of crash risk was associated with both of them, more strongly with driver age. Later, McCartt et al.[41] performed a review study to explore the independent effects of age and experience followed by years of licensure. They noted older teenagers' (aged 18−19 years) greater engagement in risky driving disposition, which resulted in a higher crash rate than 16−17 years-old-drivers. To be more specific, Mayhew et al.[20] focused on the contribution of driving length after licensure. They utilized four years (1990−1993) of crash information from Nova Scotia, following the drivers who obtained learners' permits. The study revealed that newly licensed teenagers' crash rates were the highest in the first month, dropped steeply through the next six months, and gradually reduced as they gained further driving experience. In 2018, Duddu et al.[9] conducted a North Carolina study to identify the interrelationship between crash contributing factors and teen driver crash risk by severity. Consistent with previous studies, they identified 19 years-old-drivers with a lower likelihood of severe injury crashes because of more hours behind the wheel.
Williams & Shabanova[42] carried out a study to identify the contribution of age and gender in motor vehicle crash incidents by utilizing FARS data from 1996 to 2000. Teen drivers' fatal crash rates are substantial for both male and female drivers compared to any other age group. Later, several studies pointed out the greater risk-taking tendency of male teenagers[43,44], which is attributed to more than two times fatal crash rates than their counterparts[45]. Adanu et al.[30] applied latent class analysis (LCA) to identify the distinct latent patterns among factors by stratifying the crashes in gender subgroups. Considering driving offenses, male adolescents were found to be more involved in speeding with age. However, their associations with drinking and driving were not consistent in a number of studies[46,47].
Passenger presence
-
Doherty et al.[48] conducted a study in Canada to identify the passenger effect on young drivers' crash risk by analyzing the crash involvement rates. The results exhibited outweigh values for teen drivers, elevated with the number of vehicle occupancy. Later, Chen et al.[15] concluded similar observations for novice teen drivers (aged 16 to 17 years) utilizing Fatality Analysis Reporting System (FARS) fatal crash information. They also pointed out higher fatality rates in the presence of male passengers younger than 30 years. Although the study found a greater risk for male drivers, the estimated risk ratio was statistically insignificant. These outcomes justify the existing passenger restrictions for teenagers in several jurisdictions. Fu & Wilmot[49] focused on more combinations of passenger and driver variables. The study used Louisiana police-reported crash information from 1999 to 2004. Young drivers were grouped into 16, 17, and 18−20 years by gender, whereas passengers were divided into two age groups: 15−17 and 18−20 years by gender. The study argued young teenagers high crash risk with similar gender and age group passengers. However, the number of passengers had no significant contribution to crash occurrence. Ouimet et al.[50] reviewed 15 epidemiological studies to address comparable conclusions regarding teenagers' crash risk when accompanied by passengers. The findings supported a positive correlation between the number of passengers and crash severity levels[16]. The study proposed further investigating the interaction of multiple factors, including driver and occupant characteristics.
Crash hour
-
Before devising the GDL program, Rice et al.[51] conducted a study in California to examine the association of night-time driving with injury crash rate of 16−17 years-old-drivers. Driving at night without adult supervision was recognized to be hazardous, especially between 10 pm to midnight. Teen drivers often engaged in risky driving behaviors (e.g., distracted driving, alcohol consumption, or traffic offenses) at night with or without passengers[16,30]. In parallel, Peek-Asa et al.[34] claimed teenagers higher odds of injury between 12 am to 6 am. However, one North Carolina study showed significant associations with peak hour crashes[9].
Collision type
-
Several studies concentrated on the most frequent type of crashes (e.g., right-angle, turning, rear-end, and single-vehicle) and found strong associations with numerous contributory factors, for example, alcohol-intoxication, speeding, and cellphone distraction[22,27]. Teen drivers are less experienced in handling the complexities of turning, especially at intersections. The associated crash risk increases with the number of vehicles on roadways, which results in more severe injury crashes[52]. Also, teenagers are emphasized for rear-end and single-vehicle crashes in rural areas[34]. During the afternoon, rear-end collisions with teenage drivers tend to result in more severe outcomes when they occur on roadways where the posted speed limits exceed 50 mph[38].
Restraint usage
-
Primary seat belt laws authorize the enforcement officers to stop drivers if someone is detected without wearing a seat belt. Dinh-Zarr et al. conducted a review study to recognize the effectiveness of primary seatbelt laws over secondary laws based on the Community Preventive Services' guidelines. The regulation has a substantial contribution in reducing crash injuries involving newly licensed drivers[53]. Multiple studies manifested the severe consequences of driving without buckle up[8,54]. However, teen drivers are still reported for not belted while driving[16]. Williams & Shabanova carried out a study using five years (1995−1999) of FARS data to investigate the rate of seatbelt usage in a variety of circumstances[32]. They identified lower seatbelt usage during night driving hours, under the influence of alcohol, and with peer passengers. However, Peek-Asa et al. concluded that the actual number could be higher as seat belt information is less likely to be reported in lower severity levels[34].
Violation/primary contributing factor
-
Deery & Fildes[55] performed both questionnaire surveys and driving simulations to explore the pre-existing characteristics of newly licensed teenagers. Due to limited driving skills and immature cognitive thinking (e.g., invincibility and a high tolerance for deviance), newly licensed teenagers express lower risk perception, poor judgment of safe driving speed along with stopping distance, and willingness to risky maneuvers. Teen drivers' driving errors become prominent once they shift from supervised driving to self-regulated independent driving. Several prior studies reported their gradual transition of violation types with experiencing more hours behind the wheel, for example, a high probability of violating speed limits and impaired driving laws as progress towards more independent driving expertise[18,26]. Among the violations, speeding and impaired driving are considered critical safety issues for teenagers[56]. Rahman et al.[16] identified three factors related to driving violations, 'failure to yield', 'careless operation', and 'following too closely', which exhibited the highest odds in their model for assessing the severity of teen driver crashes, based on data from the Louisiana crash database. Hossain et al.[11] uncovered some noteworthy behavioral patterns that influence collisions. These patterns include risky driving maneuvers, such as alcohol consumption or cellphone use, especially in pickup trucks, as well as careless driving behaviors associated with motorcycles. The research also pointed out a tendency for speeding on weekends among teenagers in the probationary stages of the GDL program, instances of distracted driving during morning hours, and the participation of female teenagers in driving without fastening their seatbelts on high-speed roads.
Day of the week
-
More than three decades earlier, Schwing & Kamerud investigated the risk of fatalities for day of the week utilizing 1983 FARS data by estimating the rates per person-mile of travel[57]. The chances of fatal crashes are prominent on weekends, especially in the midnight hours of Friday and Saturday. In a later study, Cvijanovich et al.[13] used the hospital emergency department dataset of Utah to determine the effectiveness of GDL in lowering teen driver crash risk. As novice teenagers drive more frequently in high-risk situations (e.g., at night with peer passengers and not belted), the associated risk on weekends is disproportionately higher than adults. In contrast, school hours often contribute to the increased crash rate of teens[58].
Weather
-
Dissanayake & Amarasingha[59] claimed that teen drivers have difficulty in controlling vehicles under inclement weather conditions. Williams[28] compared the rates of teen driver crashes to understand their possible risk patterns. Due to inexperience, teenagers are less likely to drive in bad weather conditions but pose a safety threat when they do so. Duddu et al.[9] illustrated that the degree of hazard could be higher on icy and snowy roads because of inadequate skid resistance to decelerate the operating vehicles. Additionally, such weather conditions impair drivers' vision of the road. However, Hossain et al.[38] noted that while rainy weather conditions were associated with a notable reduction in the severity of injuries, cloudy weather conditions had a significant effect on minor injury crashes when teenagers were driving during the evening to midnight hours on weekends under low-light conditions.
Lighting conditions
-
Street lighting has a significant effect on drivers' visibility that improves road user safety. Yannis et al.[60] investigated the effect of lighting conditions on the risk of collisions by severity in urban and rural areas using 358,485 police-recorded crash information from Greece. Improper lighting during night-time has a strong correlation with the number of fatalities and injuries. Wang & Zhang[39] conducted a teen driver study to identify key crash attributes on Washington State freeways. The likelihood of injury or fatal crashes increased gradually as the road illumination level became lower. However, Dissanayake & Amarasingha[59] reported teenagers' lower risk during dark conditions. One possible explanation can be less exposure to night-time driving because of the restrictions in GDL program.
Area setting and highway class
-
Vachal et al.[8] carried out a study in North Carolina to examine the effect of driving age on 14-17 years-old-drivers crash involvement. The analyses exhibited a higher severe crash likelihood in rural areas compared to urban areas. To be more precise, Peek-Asa et al.[34] aimed to investigate the teen driver risk by rurality. Younger teenagers (aged below 16 years) were more likely to be involved in a crash on rural roads compared to older teenagers (aged 16-18 years). Later, Wu et al.[52] identified the association of multilane roadways with fatal and severe injury crashes. It is important to note that each study considered a distinct age range to describe teen drivers.
Intoxication
-
Due to the minimum legal drinking age (MLDA) and zero-tolerance laws, teen drivers are less exposed to alcohol than adults[59]. More than three decades earlier, Mayhew et al.[61] represented a higher crash risk for drivers aged 16 to 20 years at any BAC level compared to adults. The study also argued a steeper increase in the relative risk curve at elevated BAC levels, although the interactions were statistically insignificant. Zador et al.[62] re-examined alcohol-related crash probability considering age and gender as explanatory variables. Later, several studies were conducted to recognize the severity levels of related crashes by dividing the age group into several categories. The investigations produced significant findings, for example, elevated likelihood of injury crashes[8] and steeper relative crash risk with rising BAC levels[63], especially for novice teenagers. Hossain et al.[64] examined crashes involving underage drivers who were under the influence of alcohol and identified various factors associated with these collisions. For instance, they noted that fatal crashes occurred among unrestrained drivers on high-speed curves in dark conditions without streetlights, single-vehicle crashes involving novice teenagers in light trucks resulting in moderate injuries, collisions with more than one passenger during dusk or dawn, and certain types of crashes, such as right-angle, left-turn, or right-turn incidents, at intersections under low-light conditions with street lighting.
Intersection and alignment
-
The most common geometries of roadways are straight segment, curve segment, intersection, and intersection on curve. Kim et al.[17] conducted a study amassing fatal crash data from FARS to understand the contribution of road characteristics in teenagers' crash risk. Teen drivers were more attributed to crashes on curves compared to straight roads. Often, high posted speed limits on straight segments were more hazardous than negotiating low-speed curves. Besides, several studies outlined the misjudgments of adolescents on intersections due to less experience of driving in complex traffic environments[52, 65] generated from various traffic modes[66].
Vehicle type
-
Several studies affirmed the significance of vehicle choice in teen driving safety by specifying the disproportionate death rates in smaller vehicles[67,68]. Paleti et al.[69] conducted a study to connect aggressive driving behavior with the degree of crash severity. The data was obtained from National Motor Vehicle Crash Causation Study (NMVCCS). The study identified elevated severe crash likelihood among 16 to 17 years-old-drivers while operating pickup vehicles. Elichelberger et al.[70] conducted a telephone survey to understand the parent's perception of vehicle choice for newly licensed teenagers. They argued that parents mostly purchase small cars for their adolescents, although they consider midsize or larger vehicles (other than SUVs and pickups) safer. However, Duddu et al.[9] presented conflicting outcomes; for example, high crash proneness for teenagers in any vehicle other than passenger cars.
Posted speed limit
-
Speeding is a major factor for teen drivers' involvement in road crashes and is considered to be an important determinant of crash risk and crash severity[71]. Young drivers, compared to older drivers, have a more positive attitude toward risk-taking, thus involved in risky driving as well as speeding behavior[72]. Evidence shows that exceeding the posted speed limit is a prevalent risky driving maneuver among teen drivers[73]. They usually do not perceive the risk associated with underestimating or overestimating the roadway speed limits, which results in severe injury crashes. Examination of crash characteristics reveals increasing odds in higher posted speed limits[9]. Roads with posted speed limits between 35 and 64 mph are vulnerable to left or right turns[74].
Distraction
-
Distraction has been described as the diversion of concentration away from tasks critical for safe driving[75]. The prevalent distracted behaviors are- talking to passengers, using electronic devices, and activities inside or outside the vehicle[76]. Teen drivers are more frequent in multi-tasking than any other age group, which increases their chances of related crash involvement[22]. Electronic devices such as cellphones are associated with visual, manual, and cognitive distractions[16,77]. Repeatedly talking or manipulating cellphones impair driving performances by developing risky driving maneuvers such as speeding, frequent lane changing, and overtaking[16,78]. Numerous driving simulators and on-road field studies have been conducted to describe the links between cellphone use and driving performances; however, most of them indirectly evaluate the relative risk of crashes[78,79]. To address the constraints of past literature, researchers utilize data from naturalistic driving studies (NDS) concentrating on the visual-manual interactions with cellphones. Studies reveal significant variations in crash likelihood when talking, texting, or manipulating cellphones behind the wheel[80,81]. However, the analyses have limited control for other contributory factors that might have a significant impact on the crash occurrence. Hossain et al.[36] claimed that crashes involving novice teenagers using cellphones at intersections were significantly linked to talking or listening on the phone rather than activities like texting, browsing, dialing, or reaching for, answering, or locating the device. Furthermore, single-vehicle crashes tended to occur when cellphone manipulation took place while driving on weekends in cloudy weather. On the other hand, sideswipe collisions were more prevalent in the evening hours, particularly during the act of reaching for, answering, or locating cellphones.
Application of crash contributing factor understandings
-
The utilization of insights into crash-contributing factors has a dual purpose: 1) implementing countermeasures based on key factors and their relationships, and 2) integrating these factor-based understandings with the GDL framework to enhance and fortify the GDL system.
Recommendations from factorial understandings
-
The continuation of ongoing education programs on raising awareness of teen drivers against alcohol intoxication targeted at high schools and universities and ongoing enforcement training programs for better prevention of both teenage and underage drinking are strongly recommended. Despite the reduction of underage alcohol crashes over the years and less association with underage young driver groups (21 years or less), the continuation of educational awareness campaigns and enforcement programs targeted at this teen driver demographic is substantially important – since the combination of underage drinking during early years of driving could greatly increase risks and far-reaching negative effects. Special focus can be given on enforcement during the weekend and nighttime targeting teen drivers. Considering the strong linkage of nighttime crashes with all teen driver groups, nighttime driving for both novice teens and post-GDL drivers could still pose unsafe driving conditions. In addition to enforcement in general for preventing unsafe or aggressive driving behavior at nighttime, especially during weekends that could be further compounded by alcohol or drug intoxication, strong enforcement of passenger restrictions for novice teen drivers who are only allowed to drive with adult passengers could further improve safety – as a higher propensity of crashes with novice teen drivers without passengers during nighttime has been identified.
Distraction due to the use of cellphones and electronic devices currently is and will continue to be an important issue in the near future. Therefore, effective enforcement of cellphone and electronic device use laws segregated by GDL stages is important to combat the growing distracted driving issues of teen drivers. The higher propensity of novice teen drivers' involvement in crashes with large vehicles, especially pickup trucks, calls for the possible inclusion of maneuvering large vehicles in the behind-the-wheel instructions for driving skill development. Without knowing the scope of the GDL program participation, it is difficult to investigate the crash pattern by GDL stages. A lack of driver database extractable by driver age and parish also limits the spatial analysis scope[82]. A comprehensive digital resource of citation data would be helpful in understanding the driving behaviors of cellphone use and restraint non-use while driving. Simulators provide a safe and controlled environment for novice drivers to practice without the risks associated with real-world driving. It allows learners to make mistakes and learn from them without endangering themselves or others. Redesigning the curriculum by integrating training materials and knowledge of attitude patterns linked with novice driver crashes can be more strategic (Fig. 2).
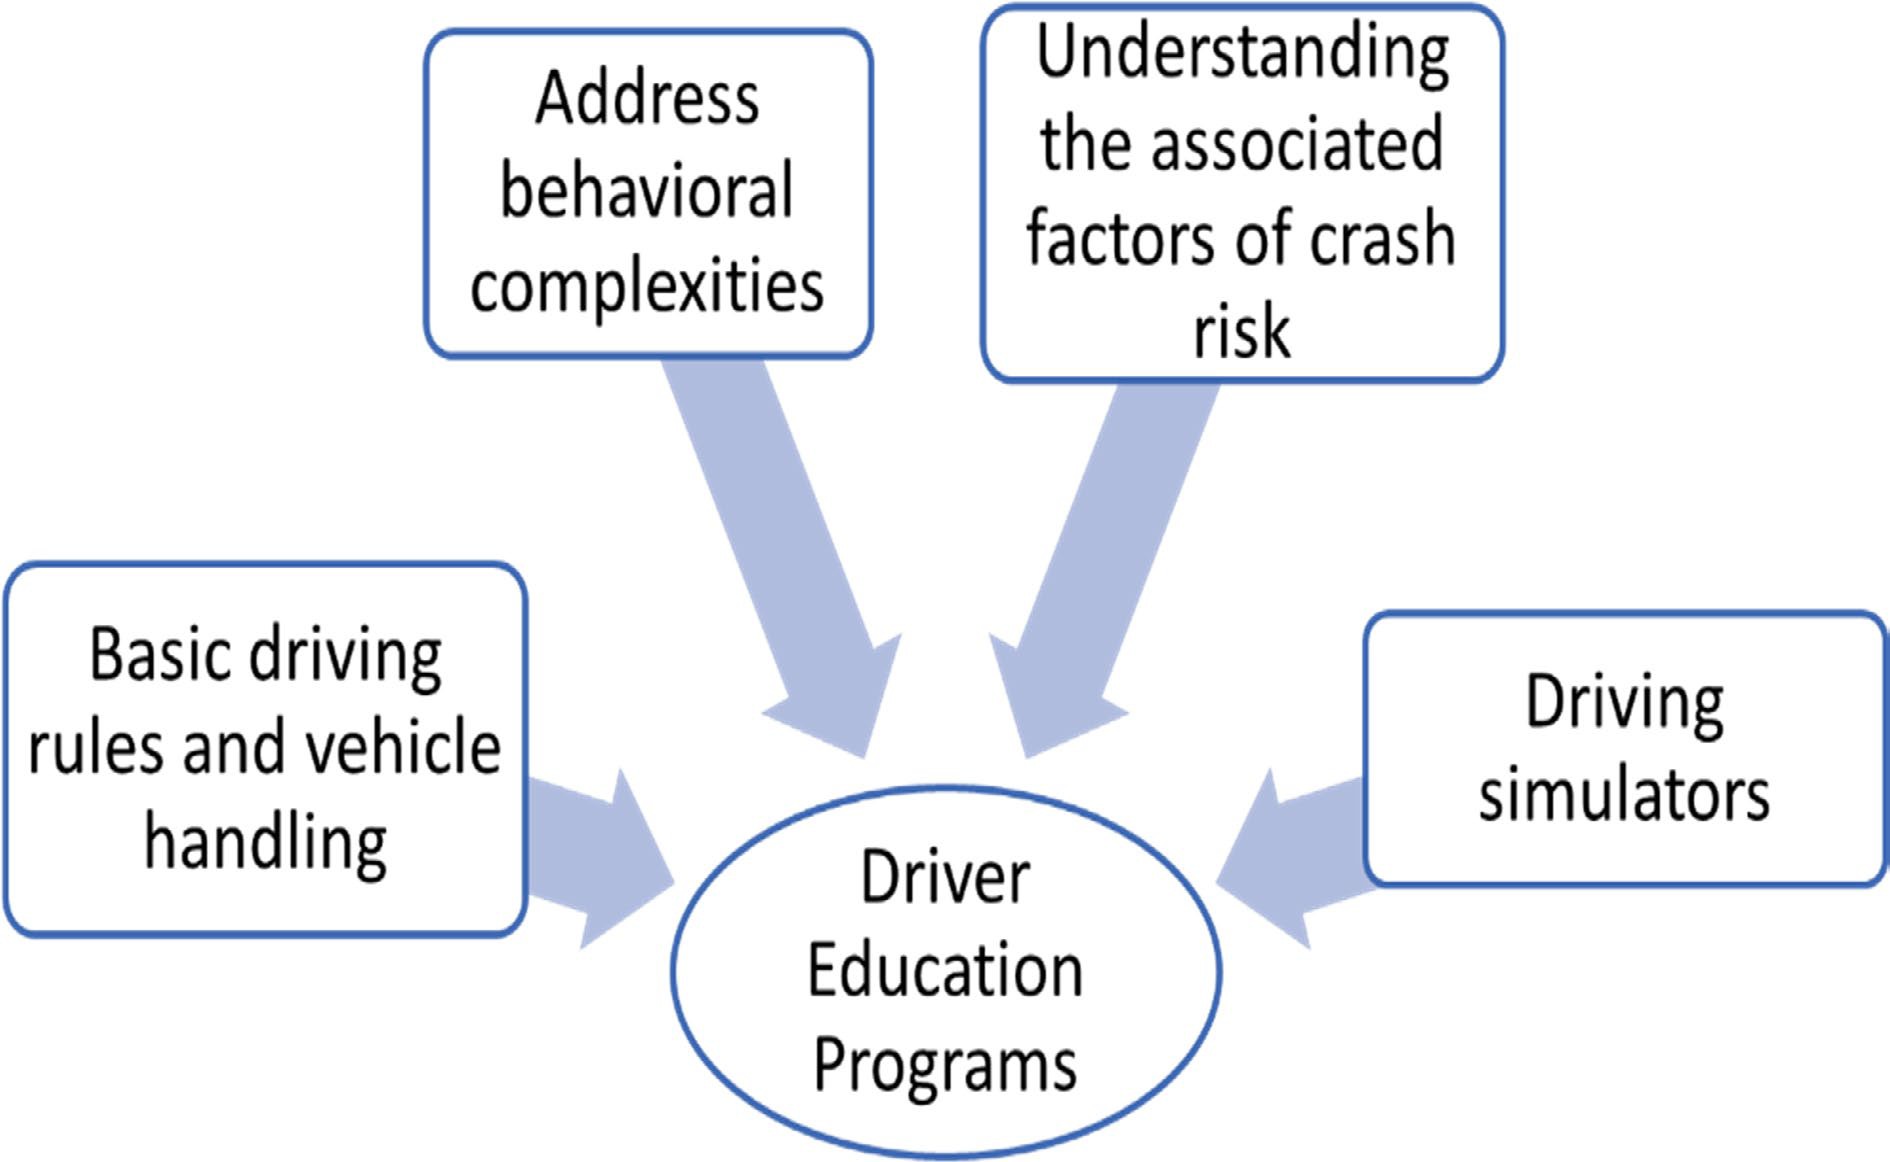
Figure 2.
Improving driver education programs.
Connecting factorial understandings with GDL frameworks
-
Both behind-the-wheel and in-class instructions within GDL can be updated annually to include the teen driver safety issues identified from continuous tracking of crash characteristics. Besides the conventional defensive driving educational courses, the instructions in the classroom as part of the current GDL program can take advantage of teaching the impact of distracted driving, not wearing seatbelts, alcohol and drug intoxication, etc. elaborately. One strategic approach is updating the curriculum by including the knowledge of attitude patterns linked with teen driver crashes and by also accounting for case studies of enhanced education improvement in other states or nations. The large odds of novice teen drivers (who typically are in the GDL program) in driving violation-related factors– 'failure to yield', 'careless operation', and 'following too closely' – imply a continuous need for improvement in road instructions within the GDL program. In addition to the updatable standardized curriculum, the inclusion of updated visual and video materials as in-class instruction supplements and in-depth training for driving instructors in the local area have been suggested.
Considering the high likelihood of driving violation-related crashes, parental involvement can be identified as a critical element for initial driving behavior development. Parental involvement during the provisional phase has the potential to encourage compliance with GDL restrictions and roadway rules (cellphone use, curfew, etc.) more broadly. Parental involvement in driver education including a mandatory parent orientation class, and parental intervention program integrated with active engagement of parents have already shown success in reducing risky driving behavior. Therefore, devising a plan to integrate parental involvement within GDL frameworks is expected to be highly beneficial. Not only the involvement of parents during the orientation of GDL could provide novice drivers information about driver education and GDL requirements in the very early driving phase, but their continuous engagement to ensure their children's safe driving behavior development could further be benefitted from software programs to track and notify about their driving behaviors or by comprehensive informational websites with specific pages for parents.
-
The discussions in this review study could serve as a basis for selection, analysis, and interpretation of crash variables that could be linked to teen drivers. The salient features of the factors can be compared with new results identified from crash data analysis. The research of teen driver crash countermeasures could also be benefitted from the broad discussion of a number of crash characteristics. The understanding of crash factors could be translated into GDL and other teen driver safety programs. Utilization of the knowledge of teen driver crash factors in countermeasure development may additionally require evidence of successful implementation from case studies as well as feasibility analysis in terms of safety benefits and economic benefits. This improved understanding of crash factors from the compilation of findings in this literature review study is also expected to help safety planners and policymakers. While the discussions were grounded in crash studies carried out in the United States, the insights gleaned from these studies hold the potential to offer valuable guidance to other countries. The likelihood of encountering similar fundamental crash-contributing factors makes this knowledge transferable. Furthermore, the insights and discussions can serve as a catalyst for the development and improvement of driver education programs tailored to address the specific requirements and difficulties confronted by their own teenage drivers.
The study exhibits a number of limitations that offer opportunities for future research enhancements. It's important to acknowledge that crash reports often suffer from missing or inaccurate information, particularly concerning crash location and time, severity of incidents, characteristics of participants, and contributing factors[83]. Therefore, a more comprehensive approach could involve merging police-reported crash data with information from hospitalized patients. In future research, a similar review study could be conducted by considering both data sources to link understanding of factors more effectively to the severity of injuries. The current emphasis on 'big data' and 'machine learning' in clinical and research contexts can also bring value to the field of teen driver safety research. Data streams generated by GPS technology embedded in vehicles, smartphones, and other devices can yield rich, detailed exposure data[84]. Data streams from closed-circuit TV cameras, which are installed for traffic monitoring, have already been proven useful in generating data on exposure and collisions. In the future, studies could not only consider these types of data but also explore data captured by SHRP 2 NDS for further insights.
-
The authors confirm contribution to the paper as follows: study conception and design: Hossain MM; Literature review: Hossain MM, Rahman MA; draft manuscript preparation: Hossain MM, Rahman MA. Both of authors reviewed the results and approved the final version of the manuscript.
-
The data that support the findings of this study are available on request from the corresponding author, Hossain MM.
-
The author(s) received no financial support for the research, authorship, and/or publication of this article.
-
The authors declare that they have no conflict of interest.
- Copyright: © 2023 by the author(s). Published by Maximum Academic Press, Fayetteville, GA. This article is an open access article distributed under Creative Commons Attribution License (CC BY 4.0), visit https://creativecommons.org/licenses/by/4.0/.
-
About this article
Cite this article
Hossain MM, Rahman MA. 2023. Understanding the potential key risk factors associated with teen driver crashes in the United States: a literature review. Digital Transportation and Safety 2(4):268−277 doi: 10.48130/DTS-2023-0022 

Understanding the potential key risk factors associated with teen driver crashes in the United States: a literature review
- Received: 28 June 2023
- Accepted: 08 December 2023
- Published online: 28 December 2023
Abstract: This article is a compilation of teen driver crash contributing factors typically extractable from the crash data collection system in the United States. Tremendous research effort has been undertaken over the decades to comprehend teen driver crash risks, as teen drivers continue to be over-involved in crashes even when accounting for the driving exposure. This article presents the contexts of crash factors related to operating conditions, roadway, vehicle, and driver and their unique influences on teen driver crashes in terms of estimated risk, prevalence, and estimated likelihood mainly from descriptive and analytical studies. The key variables are selected based on the number of studies that considered each risk factor for analysis. The understanding of crash factors could be translated into graduated driver licensing and other teen driver safety programs. While the discussions were grounded in crash studies carried out in the United States, the insights gleaned from these studies hold the potential to offer valuable guidance to other countries. For example, the insights and discussions can serve as a catalyst for the development and improvement of driver education programs tailored to address the specific requirements and difficulties confronted by their teenage drivers.
-
Key words:
- Teen driver /
- Crash risk factor /
- Graduated driver licensing /
- Crash studies