


-
Meat is an important source of high-quality protein and essential fatty acids. In recent years, the consumption of meat products has increased greatly. According to the statistical results of the Organization for Economic Co-operation and Development (OECD)[1], the world's per capita meat consumption reached 42.4 kg in 2021, although there is still a large gap between developed and developing countries. Due to different traditions, cultures, religions and other factors, the main types of edible meat differ among countries. However, no matter which kind of meat, consumers' demand always focuses on nutrition, safety and sensory quality[2]. Freshness, long-term storage without deterioration, and no chemical preservatives are the most attractive factors for consumers[3]. pH, color, texture, antioxidant capacity, oxidation degree, microbial composition and other indicators are closely related to meat quality[4]. Maintaining the good quality of meat products could enhance consumers' purchasing desire, maintain the unique nutritional composition of meat products, and avoid food waste and potential economic losses[5,6]. Therefore, meat quality has become the key to restrict the development of the meat industry. The challenge to maintain the quality of meat products brings great interest in using plant extracts in meat products.
There are many bioactive substances from plants, such as polyphenols, carotenoids and alkaloids[7]. The natural plant extract (NPE) refers to something rich in bioactive substances extracted from different organs of plants such as roots, stems, leaves, flowers, fruits and seeds by using different solvents and extraction methods[8,9]. Most of them have special nutritional properties and strong antioxidant activity. Added to the food system, they could ameliorate food quality, improve nutritional quality, inhibit microbial reproduction, prolong shelf life, enhance flavor and control the formation of environmental pollutants. Although many techniques have been studied for food preservation, such as refrigeration[10−12], modified atmosphere storage[13−15] and pickling[16,17], meat products with high fat content inevitably undergo oxidative rancidity. It has led to the widespread use of food additives, especially preservatives. Although the safety has been recognized through long-term research, consumers are worried about the possible safety hazards. Thus, people pay attention to natural plant extracts[18], which have a wide range of sources, and large space for selection, and rarely involve ethical issues. Therefore, the application of natural plant extracts in meat processing has become a hotspot of research.
Many papers have reviewed the advantages of plant extracts for meat products comprehensively and systematically, including the extraction methods and antioxidant properties[19], preservative effect[20], and special effects of a certain or a class of extracts[21−25]. However, most of reviews have certain limitations and subjectivity, and do not fully consider the nature of meat products. They usually focused on storage or nutritional quality, but ignored the impact of natural plant extracts on the sensory and texture of meat. In addition, the lack of quantitative evidence is also one of the weaknesses of traditional reviews. Meta-analysis is a quantitative data mining method, which expands the sample size by reorganizing the data reported in different studies, so as to obtain more reliable results[26]. Meta-analysis accurately explore the source of heterogeneity through group analysis[27,28], which helps to identify potential content that needs further deep study. Meta-analysis is widely used in clinical medicine and biological research[29], but it has not been fully used in food science research. This paper summarizes the application of NPE in meat products in the last three years, and combined with the basic principles of meta-analysis, the purpose was to comprehensively evaluate the impact of NPE addition on the quality of meat products, including physical, chemical, sensory, nutritional and microbial indicators. In addition, we examined the heterogeneity of the response by meta-analysis to determine the factors that lead to the observed variability in the response variables. The findings are expected to contribute to explaining how NPE improve the quality of meat products.
-
A comprehensive literature search was carried out in the databases of 'Web of Science' and 'Elsevier' to determine the research on the application of natural plant extracts in meat processing and its impact on the quality of meat products. The scope of the included research was expanded by the method of reference tracing. In all databases, the keywords 'natural, plant extract, meat' were used. Between 2020 and 2022, 613 scientific publications were published. Referring to the method of Orzuna-Orzuna et al.[27], these publications were screened in two steps. First, the title and abstract were used for selection, excluding articles that raise animals, reviews, and unmeasured variables of interest. Then the following issues were considered[30,31]: (1) natural plant extracts were used in the processing; (2) pH, color, texture, oxidation index and microbial index were measured; (3) the studies have appropriate control and experimental groups; (4) the publications contain figures for analysis; (5) peer-reviewed journal articles were written in English; (6) experimental design was employed (rotating or continuous); (7) least squares means of the control and experimental groups were measured with variability (standard error or standard deviation); and (8) sample size was used.
Data extraction
-
According to the selection criteria, 48 articles were included in the database for final analysis, and the number of articles included in different indicators was different. The response variables extracted for the meta-analysis include pH, L*, a*, b*, antioxidant activity-DPPH, antioxidant activity-AA, antioxidant activity-ABTS, antioxidant activity-FRAP, metal chelating capacity-BHA, peroxide value (PV), total volatile base nitrogen (TVB-N), thiobarbituric acid reactant (TBARS), total bacterial count (TVC), total mesophilic (TMVC), psychrophilic bacteria, lactic acid bacteria, pseudomonas, enterobacteriaceae, yeast and mold , moisture content, moisture activity, water holding capacity (WHC), extrusion loss, cooking loss, hardness, toughness, cohesiveness, elasticity, and chewiness. In addition, in order to investigate which aspects of meat products are more affected by all reported natural plant extracts, the results of different studies are combined through data consolidation.
Other data were collected as much as possible, such as the characteristics of published studies (author, year of publication), the product form of meat, the source of natural extracts, and the number of repetitions. The article references contained in the dataset are listed in Supplemental Table S1. The mean, standard deviation (SD) and number of repetitions of each treatment were extracted from these articles. When the article introduces the SD of each experimental group, these values are directly used in the meta-analysis. If SD is not reported, it is calculated by standard error[32].
Calculation, statistical analysis and heterogeneity test
-
The data involved in meta-analysis were analyzed using Review Manager Software (version 5.4.1). Response variables were analyzed through the standardized mean difference (SMD), also called effect size (ES), the difference between the means of the experimental and control groups was standardized using the SD of the groups with and without NPE[33]. The heterogeneity is tested by formula (1) and the model is selected for meta-analysis[34]. i2 represents the proportion of inter study variation observed (due to real heterogeneity rather than accidental observation), Q is the standardized weighted sum of squares of each study variation, and df is the degree of freedom.
$ {i}^{2}=100{\text{%}}\times \frac{Q-df}{Q} $ (1) i2 range from 0 to 100%. Values close to 25% represent low heterogeneity, close to 50% represent moderate heterogeneity, and close to 75% represent high heterogeneity in the study[35]. When i2 is greater than 50%, the random effect model is used to perform the analysis, otherwise, the fixed effect model is used, and Tukey test was used to detect the difference between the treatment groups[32].
Publication bias
-
The publication bias was evaluated by funnel plot[36]. When it was asymmetric, it was considered that there was a bias (p < 0.10)[37,38]. However, for the index that the number of articles included in the study is less than ten, the test of publication bias is not carried out, which may lead to false positive statements[39].
In-depth analysis and subgroup analysis
-
When the overall effect of a certain type of index is significant (p < 0.05), select an appropriate single index (the number of studies available for analysis is greater than 5) for in-depth analysis, and take the source of meat as the main classification basis for subgroup analysis, which is generally divided into five categories: fish (aquatic products), pork, beef, chicken, lamb[27].
Study attributes and excluded studies
-
From 2019 to 2022, online searches using two databases of scientific publications returned 613 publications. After selecting and excluding duplicate papers according to the criteria, 189 full-text articles were evaluated. Finally, 48 articles (Supplemental Table S1) were used to obtain quantitative data for meta-analysis. Descriptive statistics for meta-analysis are shown in Table 1.
Table 1. Descriptive statistical results of all indicators included in MA.
Parameter MPQ N Mean Median Minimum Maximum SD Con NFE Con NFE Con NFE Con NFE Con NFE pH pH 402 6.14 5.85 5.86 6.10 4.62 4.81 6.89 7.54 0.4419 0.3588 Color a* 150 10.43 11.82 9.22 9.58 −0.97 1.61 33.86 45.27 8.6947 8.9012 b* 149 14.76 14.78 12.49 12.64 −0.43 −2.18 38.54 28.20 7.0030 7.3735 L* 158 49.21 47.09 48.87 47.49 20.18 9.33 76.00 78.06 11.7298 11.4085 Texture Chewiness 20 39.11 24.82 67.20 26.14 14.67 15.10 1654.00 1675.00 28.7290 11.0752 Cohesiveness 17 0.63 0.56 0.57 0.49 0.22 0.18 0.77 0.76 0.0996 0.1320 CL, % 36 34.20 34.07 50.70 48.17 3.82 7.74 77.31 79.24 26.5596 26.3236 Elasticity 23 3.67 3.49 3.45 3.99 0.51 0.49 6.61 6.96 2.5301 2.4518 Hardness, N 19 14.17 14.20 20.63 10.24 2.34 4.89 55.35 67.62 21.9327 22.9578 Moisture, % 33 57.34 49.04 64.37 55.54 31.63 29.43 73.69 73.73 13.8881 11.5185 PL, % 10 22.98 1.33 22.98 20.04 22.98 20.04 22.98 20.04 1.0000 0.2700 Water activity 18 0.95 0.93 0.97 0.94 0.88 0.87 1.00 0.99 0.0398 0.0383 WHC, % 9 46.35 40.87 36.70 26.95 36.70 23.30 65.66 72.37 14.4863 23.6829 Antioxidant capacity DPPH, IC50 (μg) 20 41.51 161.12 21.22 48.74 4.84 11.18 45.17 228.03 10.9558 84.4908 Oxidation index Pv, mmol/kg 18 4.51 1.81 1.13 1.03 1.13 0.53 7.11 4.47 2.6571 1.3670 TBARs, mg/kg 402 6.14 5.85 0.72 1.23 0.14 0.18 19.03 21.98 0.4419 0.3588 TVB-N, mg/100g 32.80 21.02 17.10 32.69 10.95 28.57 31.26 55.76 1.8827 7.6660 Microbial index, log10 cfu/g Enterobacteriaceae 34 5.26 3.36 3.48 2.50 1.34 0.99 5.81 4.20 2.4928 1.4109 Enterococcus 3 1.68 0.00 0.84 0.00 0.00 0.00 1.68 0.00 1.3500 0.0000 LAB 33 6.40 5.99 4.98 3.62 4.07 3.00 6.55 6.54 1.9251 1.6709 Micrococcus/
staphylococcus4 5.19 3.98 5.19 3.98 5.19 3.98 5.19 3.98 0.0400 0.0300 Mold and yeast 7 3.61 2.71 3.43 2.59 2.13 1.71 4.72 3.46 1.3863 0.9415 Pseudomonas 24 7.96 6.70 6.38 6.31 6.38 6.31 6.38 6.31 1.7511 0.7401 Psychrotrophic 13 5.81 4.76 5.10 4.19 1.30 0.00 5.37 5.10 2.3713 1.8038 TAC 12 7.15 6.92 7.15 6.92 7.15 6.92 7.15 6.92 0.1100 0.1200 TAMB 12 7.08 7.05 7.08 7.05 7.08 7.05 7.08 7.05 0.0900 0.0400 TMB 9 6.52 5.29 7.05 6.03 5.97 4.40 7.05 6.08 0.7541 2.1113 TPC 21 7.20 5.89 5.48 3.88 3.35 3.24 6.82 5.37 2.7511 1.9788 MPQ: Meat product quality; N: number of comparisons; SD: standard deviation; Con: control; NFE: Natural plant extracts; CL: cooking loss; PL: press loss; WHC: Water holding capacity; DPPH: DPPH radical scavenging activity; Pv: Peroxide value; TBARs: Thiobarbituric acid reactant; TVB-N, Volatile base nitrogen; LAB: lactic acid bacteria; TAC: Total aerobic cryophage; TAMB: Total aerobic mesophilic bacteria; TMB; Total mesophilic bacteria; TPC: Total plate count. The included studies were conducted in 23 different countries (Supplemental Table S1). The sources of raw meat could be divided into six types, of which pork accounts for 40.0%, beef for 30.4%, chicken for 17.4%, fish for 10.9%, and mutton and rabbit meat for 2.2%. On the other hand, the sources of extracts are diverse, including thyme, rosemary, basil and other plants used as spices, as well as blueberries, grapes and other fruits, broccoli, cabbage and other vegetables, and quebracho Colorado wood. The main bioactive substances in different extracts are different, but they could generally be summarized as polyphenols, flavonoids, anthocyanins, tannins and alkaloids.
-
Figure 1 shows the effects of NPE on the pH, color, texture, antioxidant properties, oxidation degree and microbial growth of meat products. In general, the addition of NPE to meat products had a significant impact on the quality of meat products (SMD −0.73, 95% CI [−1.00, −0.45], sample size = 1682, i2 = 99%, p < 0.00001), but had no significant impact on color (SMD −0.08, 95% CI [−1.84, 1.67], sample size = 457, i2 = 56%, p = 0.93) and texture (SMD −0.20, 95% CI [−0.44, 0.04], sample size = 185, i2 = 82%, p = 0.10). However, it is worth noting that although there is no significant difference between the two indicators on the whole, specific trends could be found according to the forest plot, such as 'chewiness' and 'press loss' are obviously more inclined to the experimental group.
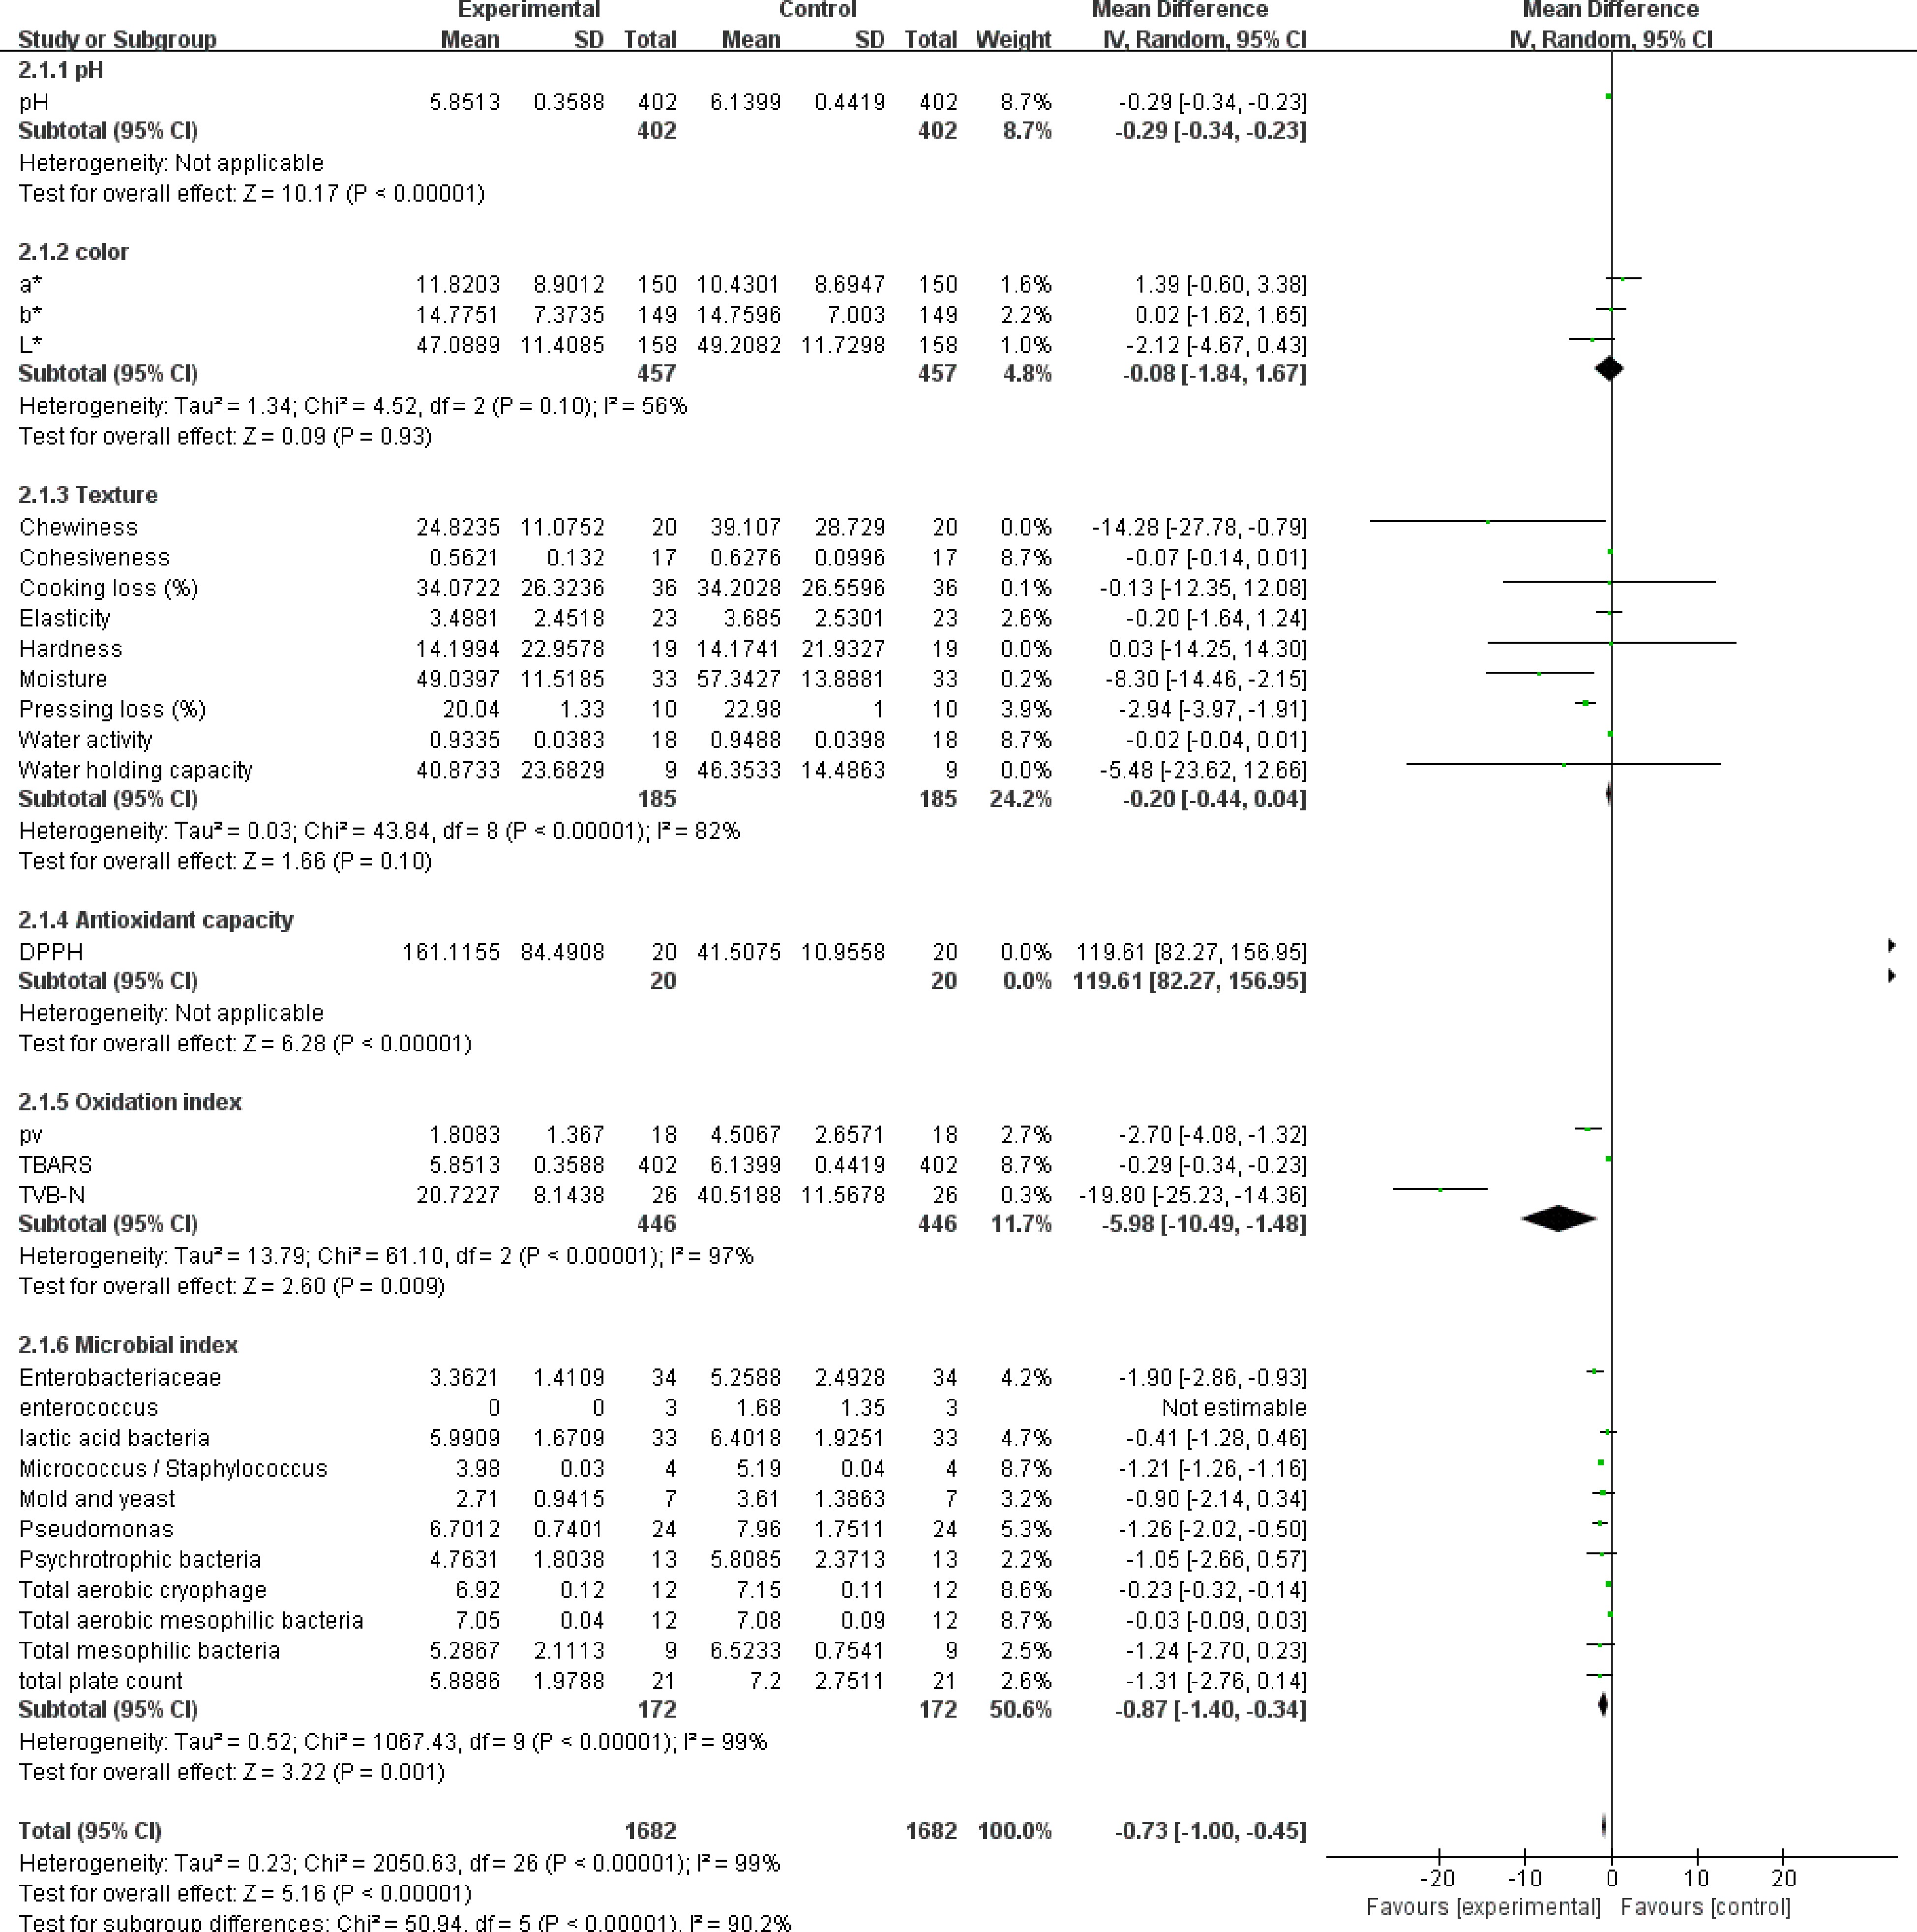
Figure 1.
The forest plot on the effect of NPE addition on the quality of meat products. The forest plot was extracted by RevMan Software (Version 5.4.1). The first author and year of publication is listed in the first column. (Complete list can be referred to from the References). CI, confidence interval; IV, inverse variance; S.D., standard deviation; std, standard. Vertical line in last column indicates no effect line, horizontal line indicates individual study—where the length determined by sample size. Diamond symbol indicates overall effect tendency. p-values following Chi2 stands for heterogeneity, whereas the p-value following Z stands for statistical significance.
Except for color and texture, significant differences were found in all other indicators (p < 0.05). Specifically, adding NPE to meat products can reduce the pH of meat products (SMD -0.29, 95% CI [−0.34, −0.23], sample size = 402, p < 0.00001), improve antioxidant capacity (SMD 119.61, 95% CI [82.87, 156.95], sample size = 20, p < 0.00001), reduce the oxidation degree of meat products (SMD −5.98, 95% CI [−10.49, −1.48], sample size = 446, i2 = 97%, p = 0.009) and inhibit microbial growth (SMD −0.87, 95% CI [−1.40, −0.34], sample size = 172, i2 = 99%, p = 0.001). It is found that the different indicator subgroups are related to redox, which may indicate that the role of NPE in improving the quality of meat products is based on its antioxidant properties.
Effect of NPE on pH of meat products
-
Figure 2 shows the effect of adding NPE on the pH of meat products from different raw materials. The summary results of meta-analysis show that addition of NPE reduces the pH (SMD −0.23, 95% CI [−0.32, −0.13], sample size = 402, study = 51; i2 = 100%; p < 0.00001). Four studies have reported the effect of NPE on the pH of fish meat products. Meta-analysis showed that the pH of all fish meat products decreased after the addition of NPE (SMD −0.26, 95% CI [−0.28, −0.24], sample size = 33, study = 4; i2 = 55%; p < 0.00001).
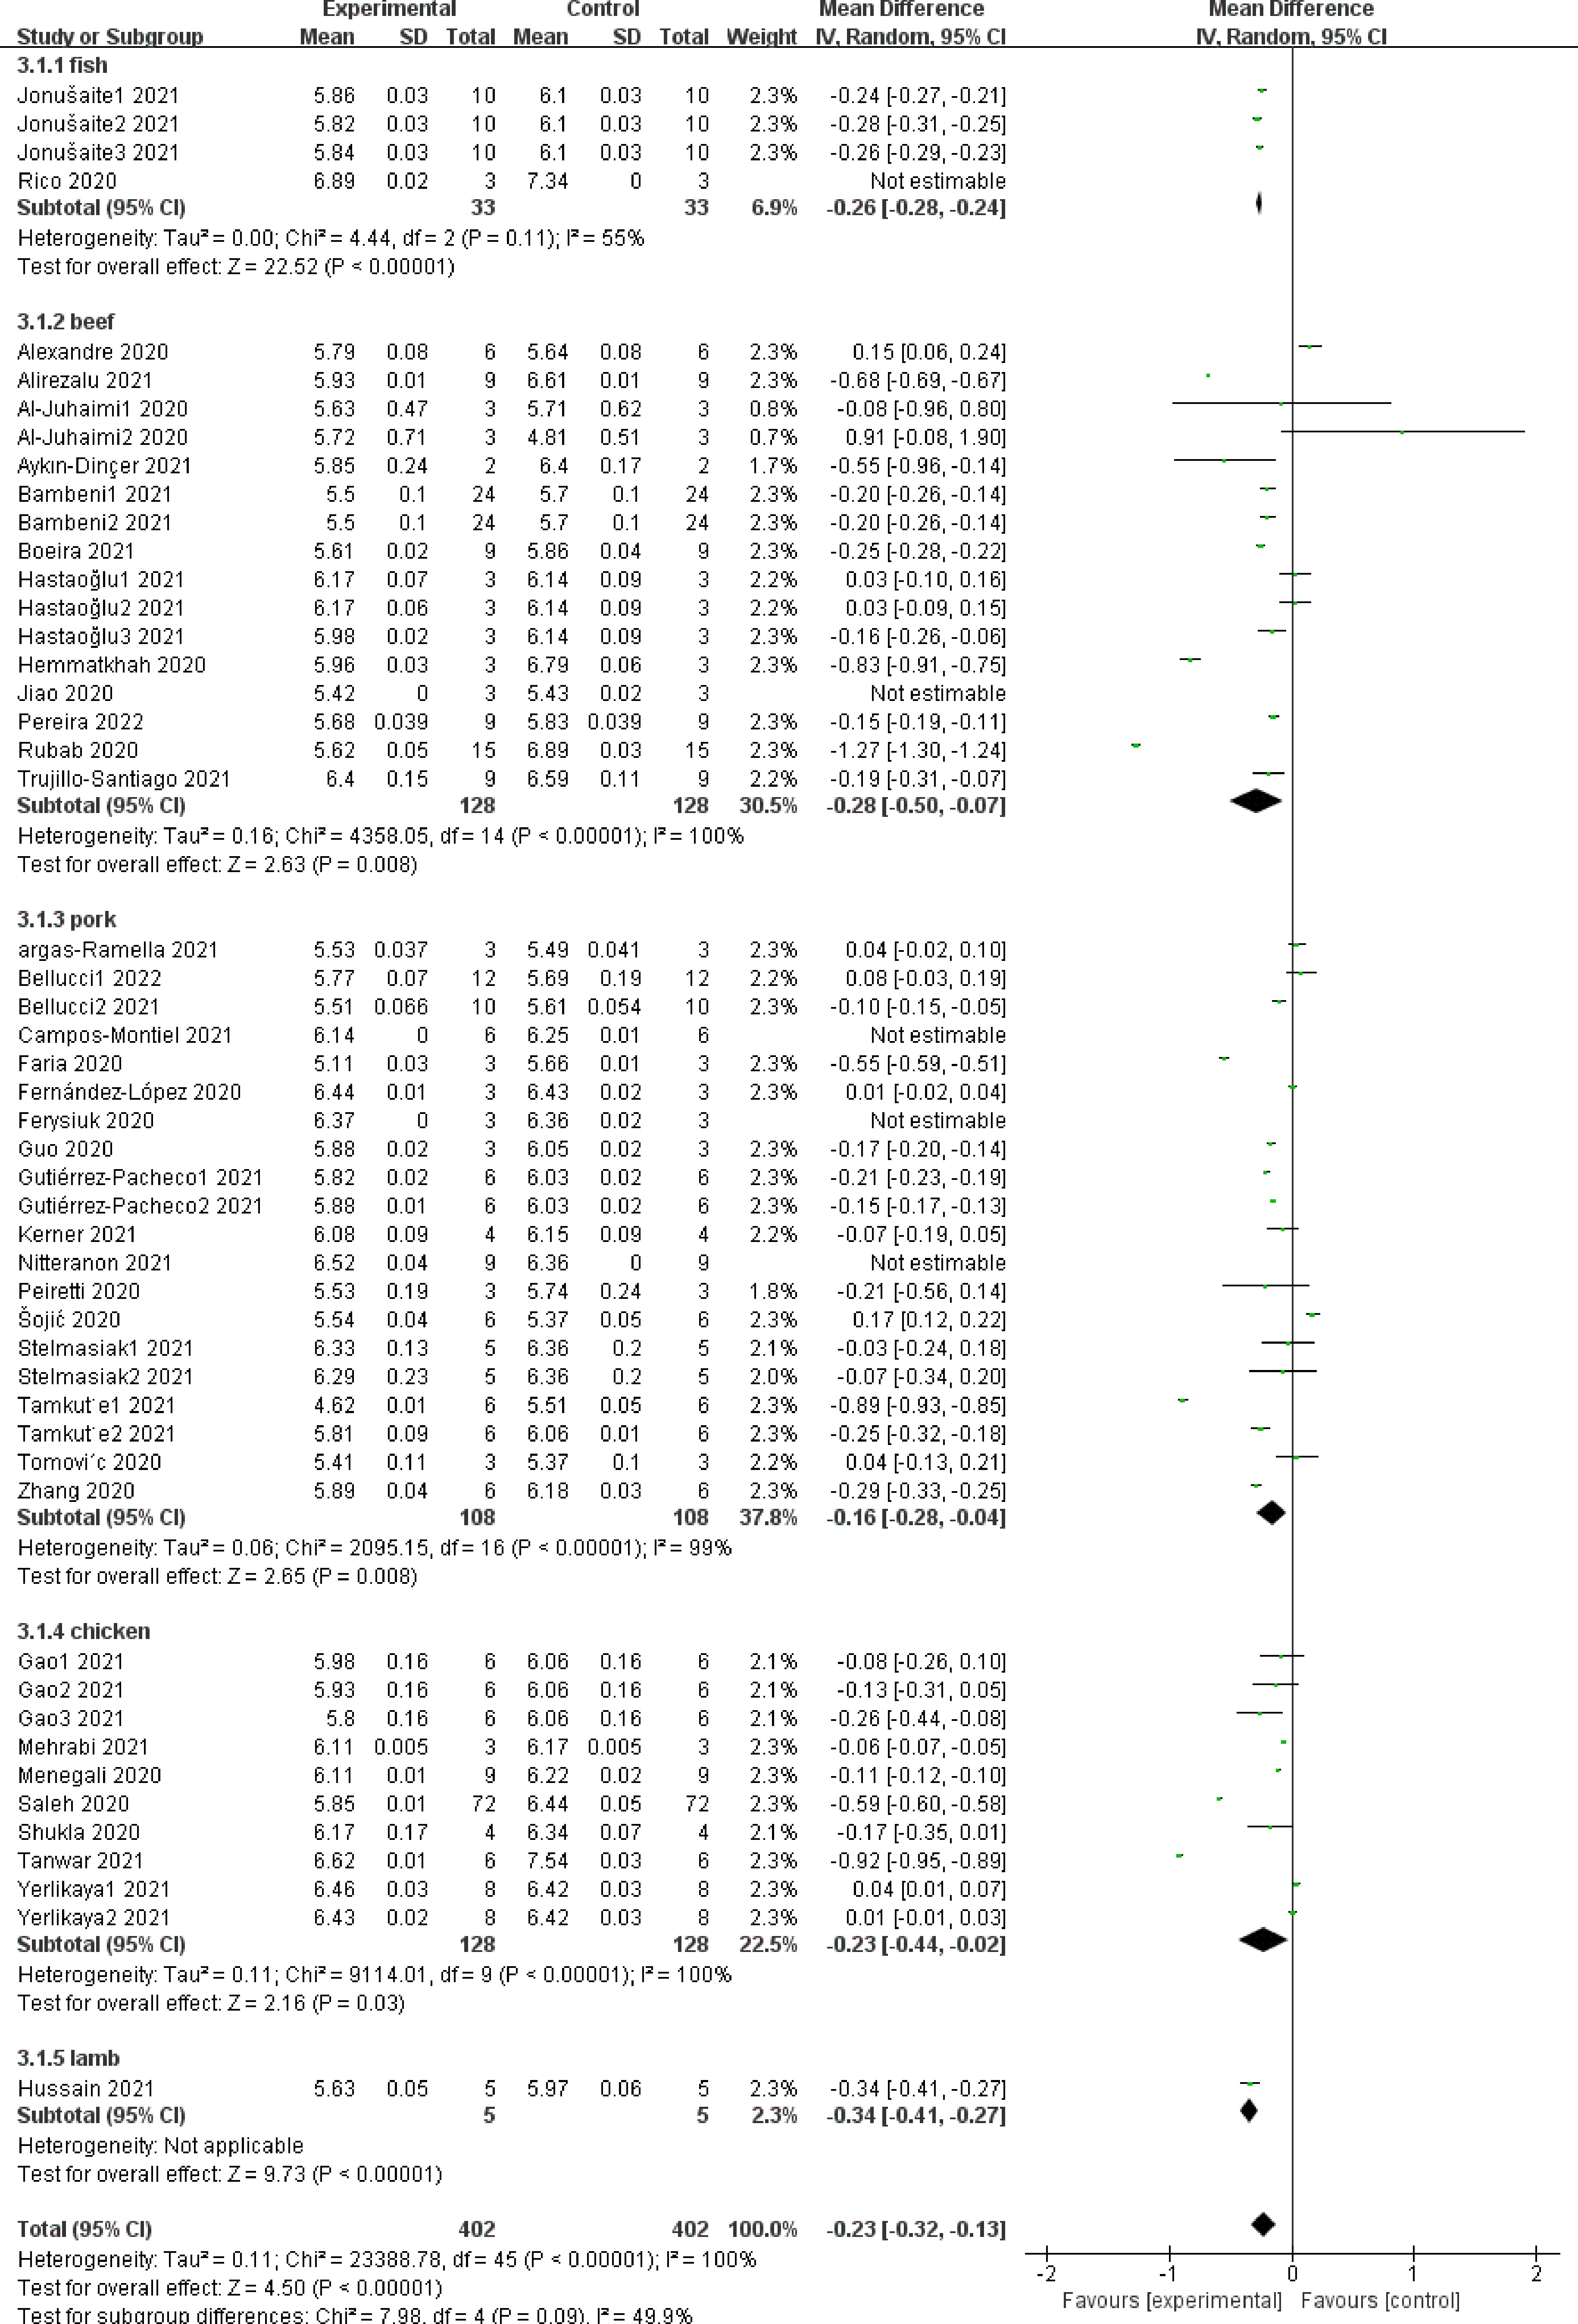
Figure 2.
The forest plot on the effect of NPE on pH of meat products produced with different raw materials.
In the subgroups of pH of products from other raw meat, the addition of NPE significantly reduced the pH of beef products (SMD −0.28, 95% CI [−0.50, −0.07], sample size = 128, study = 16; i2 = 100%; p = 0.008). However, high heterogeneity was observed in the results. Among the 16 studies, the results of Al-Juhaimi et al.[40] and Hastaoğlu et al.[41] showed that the addition of NPE had no significant effect on the pH of beef products, and its weight share was 0.8%, 0.7%, 2.2% and 2.2% respectively, 30.5% of which was the total weight of the subgroup.
In selected studies, the addition of NPE reduced the pH of pork products (SMD −0.16, 95% CI [−0.28, −0.04], sample size = 108, study = 20, i2 = 99%, p = 0.008). The overall effect showed that the addition of NPE had a significant effect on the pH of pork products, but still showed high heterogeneity. Eight studies crossed the invalid boundary.
In the study on the pH of other meat products, the addition of NPE significantly reduced the pH of chicken products (SMD −0.23, 95% CI [−0.44, −0.02], sample size = 128, study = 9, i2 = 100%, p = 0.003), and also significantly affected the pH of mutton products (SMD −0.34, 95% CI [−0.41, −0.27], sample size = 5, study = 1, p < 0.00001).
Taken together, the pH of fish, beef, pork, chicken and mutton products will be significantly reduced after adding NPE. The heterogeneity among different subgroups is low, and there is no significant difference (i2 = 49.9%, p = 0.09), indicating that NPE may delay the oxidation of meat products, thus showing a lower pH, and this effect is independent of the type of meat.
Effect of NPE on oxidation degree of meat products
-
According to the analysis, NPE in meat products are based on their antioxidant properties, so it is necessary to further study their antioxidant properties in different meat products and the oxidation degree with or without NPE. TBARS and TVB-N were selected as the main analysis dimensions according to the number of studies available for analysis.
Figure 3 shows the effect of adding NPE on TBARS values of different meat products. The summary results of meta-analysis showed that NPE had a significant impact on the TBARS value of meat products (SMD −0.93, 95% CI [−1.65, −0.20], sample size = 304, study = 36, i2 = 100%, p = 0.01). However, the results of different subgroups have certain heterogeneity, in other words, the antioxidant capacity of NPE in different raw meat may be different (i2 = 64.5%, p = 0.02).
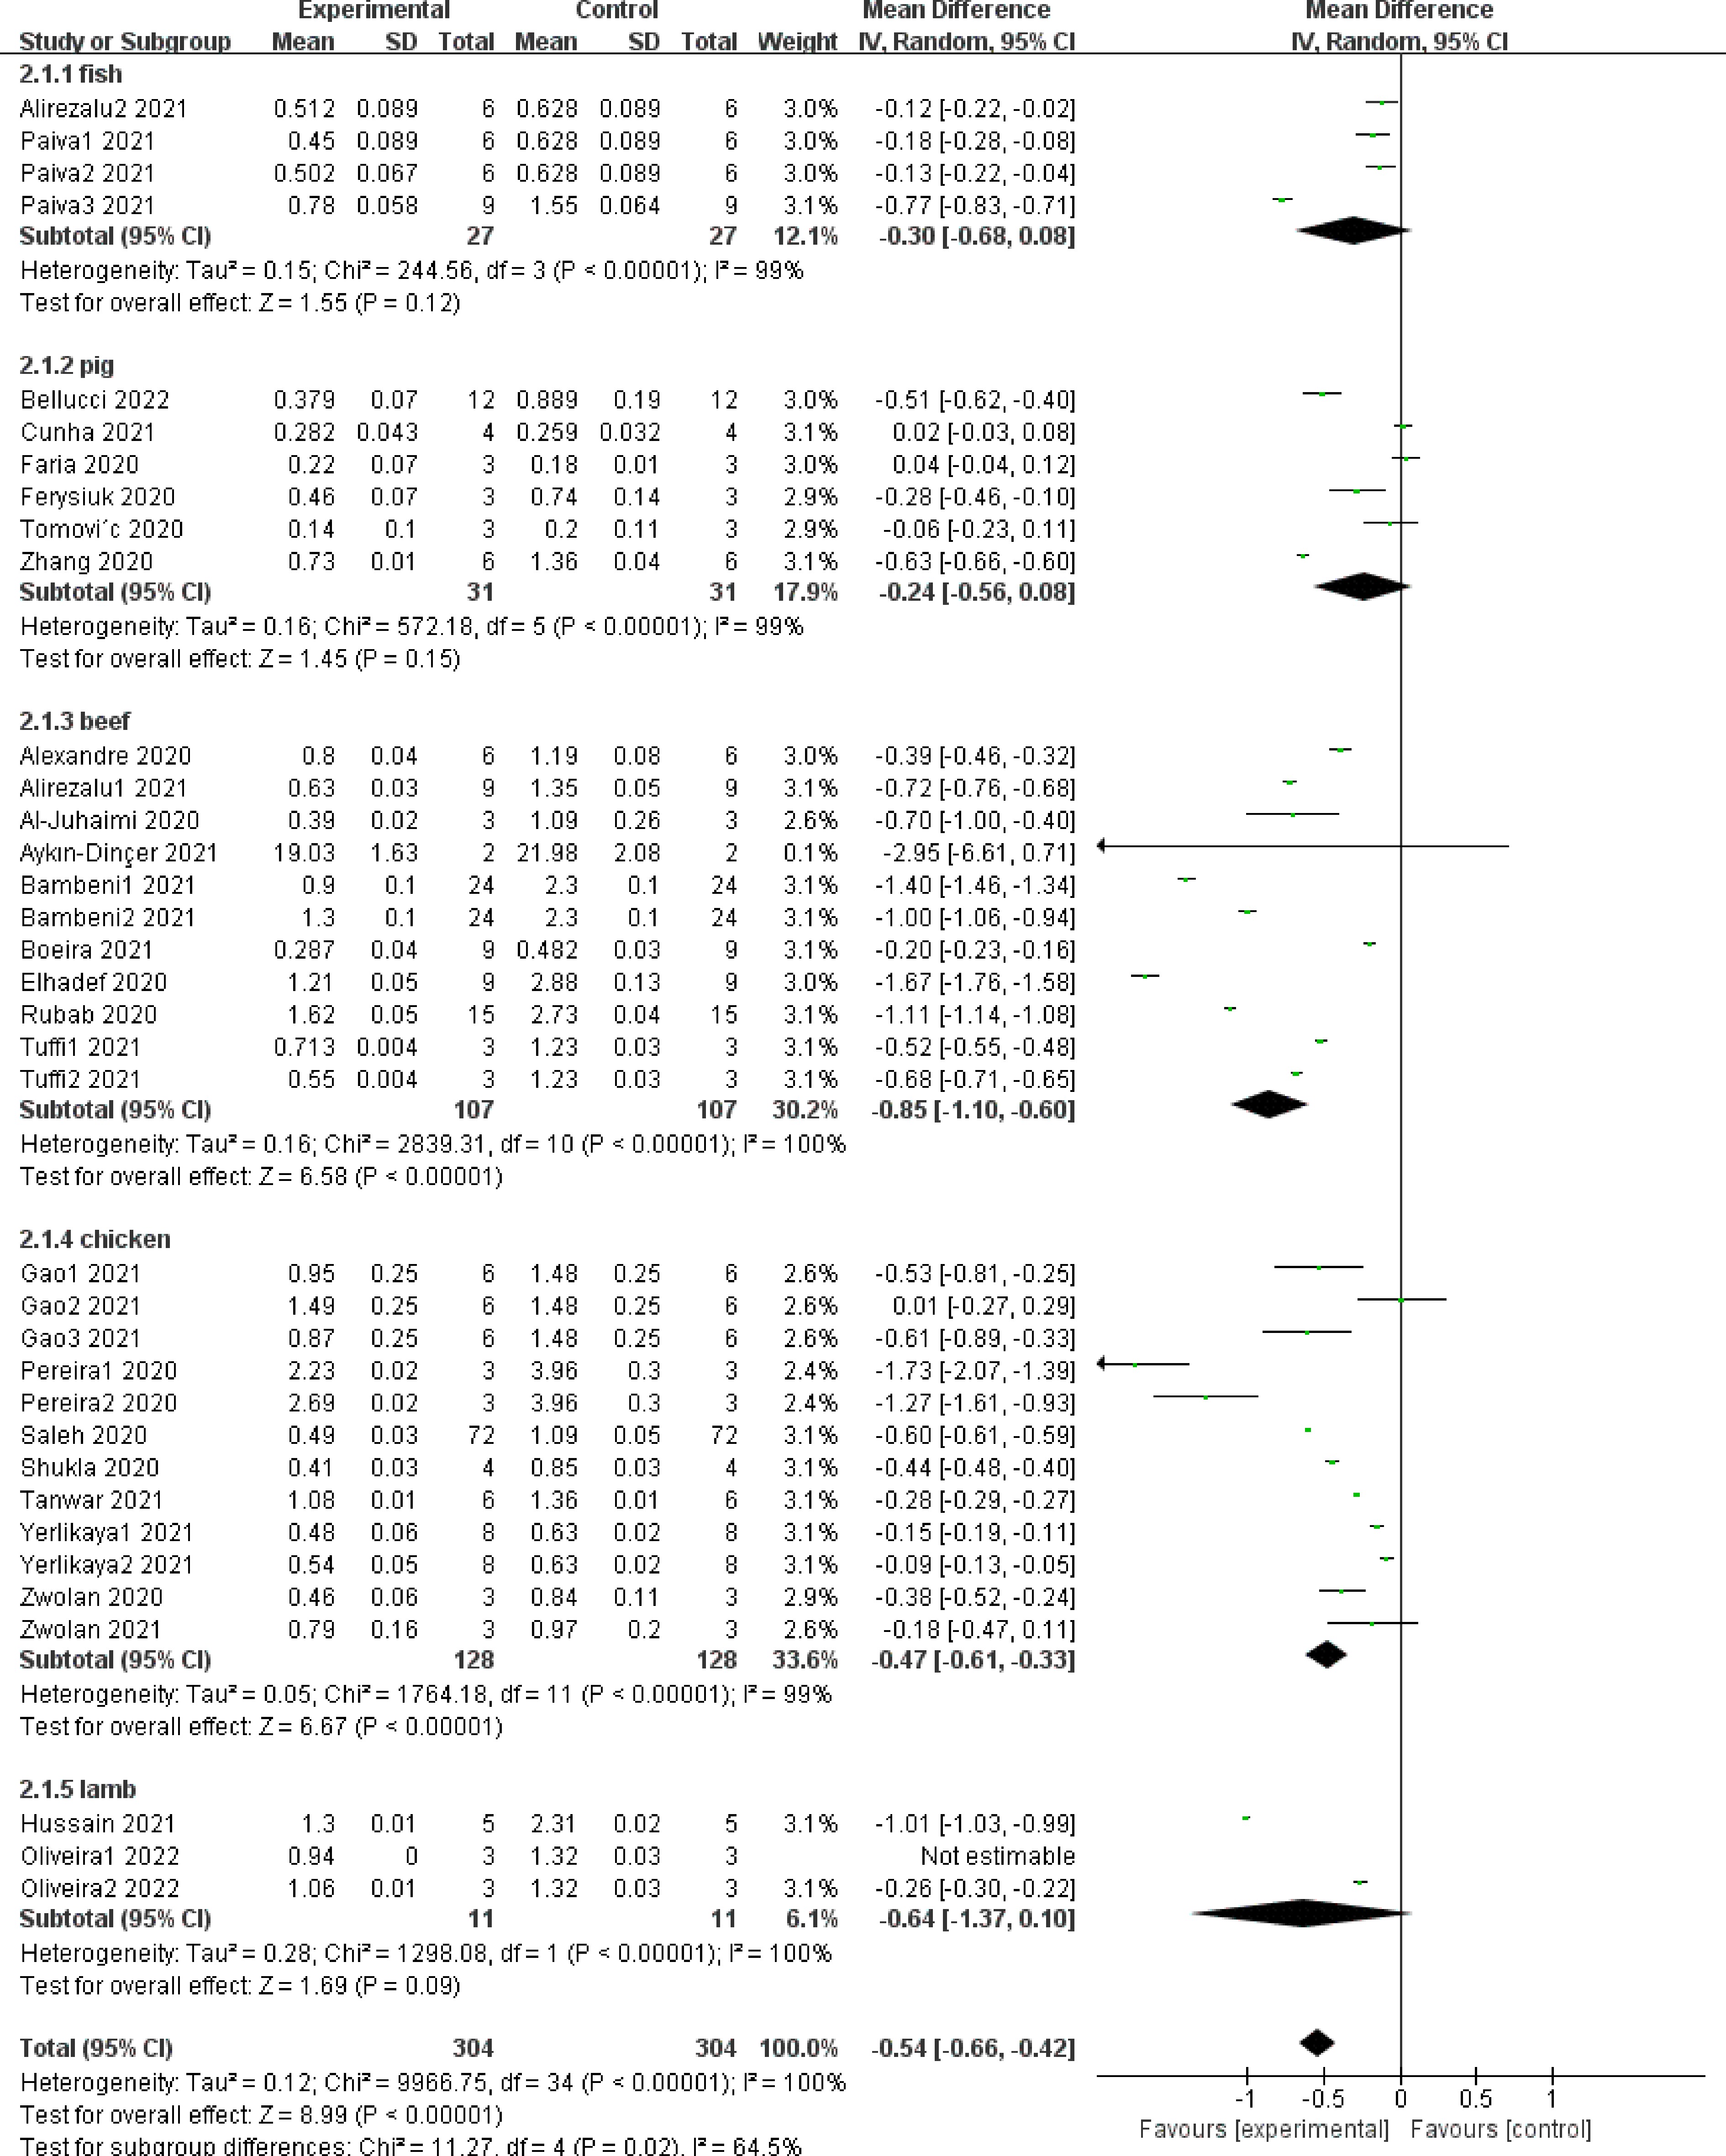
Figure 3.
Forest plot on the effect of NPE on TBARS of meat products produced with different raw materials.
Specifically, in beef products (SMD −0.85, 95% CI [−1.10, −0.60], sample size = 107, study = 11, i2 = 100%, p < 0.00001) and chicken products (SMD −0.47, 95% CI [−0.61, −0.33], sample size =128, study = 12, i2 = 99%, p < 0.00001), addition of NPE has a significant impact on the TBARS value. However, there was no significant difference among meat products prepared with fish (SMD −0.30, 95% CI [−0.68, 0.08], sample size = 27, study = 4, i2 = 99%, p = 0.12), pork (SMD −0.24, 95% CI [−0.56, 0.08], sample size = 31, study = 6, i2 = 99%, p = 0.15) and mutton (SMD −0.64, 95% CI [−1.37, 0.10], sample size = 11, study = 3, i2 = 100%, p = 0.09). The above results may indicate that NPE has different antioxidant capacity in different raw meat, and it may also indicate that some NPE play a role in meat products independent of antioxidant capacity to enhance flavor, color, and taste.
Volatile base nitrogen, another important indicator for the degree of oxidation in meat products is shown in Fig. 4. Subgroup analysis was not conducted due to the small number of studies available for analysis. However, the overall effect showed that the addition of NPE could significantly reduce the TVB-N value of meat products (SMD −18.32, 95% CI [−23.11, −13.54], sample size = 26, study = 4, i2 = 100%, p < 0.00001). The four studies included in the analysis showed consistency. In all studies, the TVB-N values of the groups treated with NPE were lower than control without NPE.
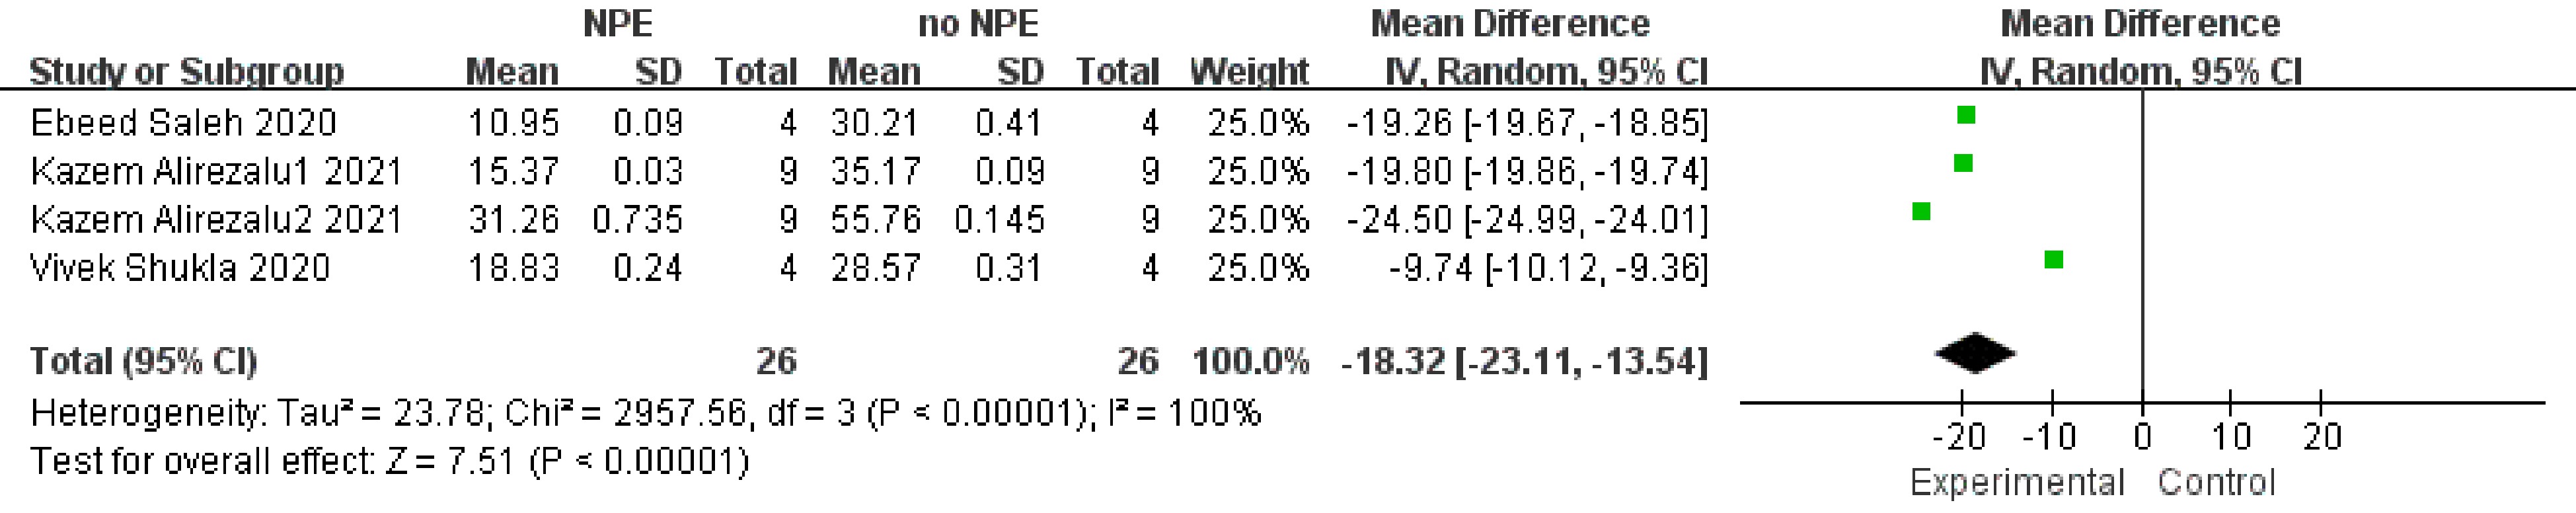
Figure 4.
Forest plot on the effect of NPE on TVBN of meat products produced with different raw materials.
Effect of NPE on the total plate count of meat products
-
The growth of microorganisms has an important impact on the sensory, safety and shelf life of meat products[42]. The analysis includes several indicators closely related to the growth of microorganisms. However, due to the difference in categories of microorganisms in different meat products and storage methods in different studies, there is a small number of studies for further analysis of each indicator, and only the total number of colonies is used for in-depth analysis.
The results of TPC showed that the addition of NPE could inhibit the growth of microorganisms, which was manifested by significantly reduced TPC of meat products (SMD 0.90, 95% CI [0.30, 1.49], sample size = 21, study = 6, i2 = 99%, p = 0.003) (Fig. 5). This result is confirmed by pH results above. NPE may prevent the pH rise of meat products through antioxidant effect, thus creating an adverse growth environment for microorganisms. It may also inhibit the growth of microorganisms through antibacterial effect, so that meat products show a low pH.
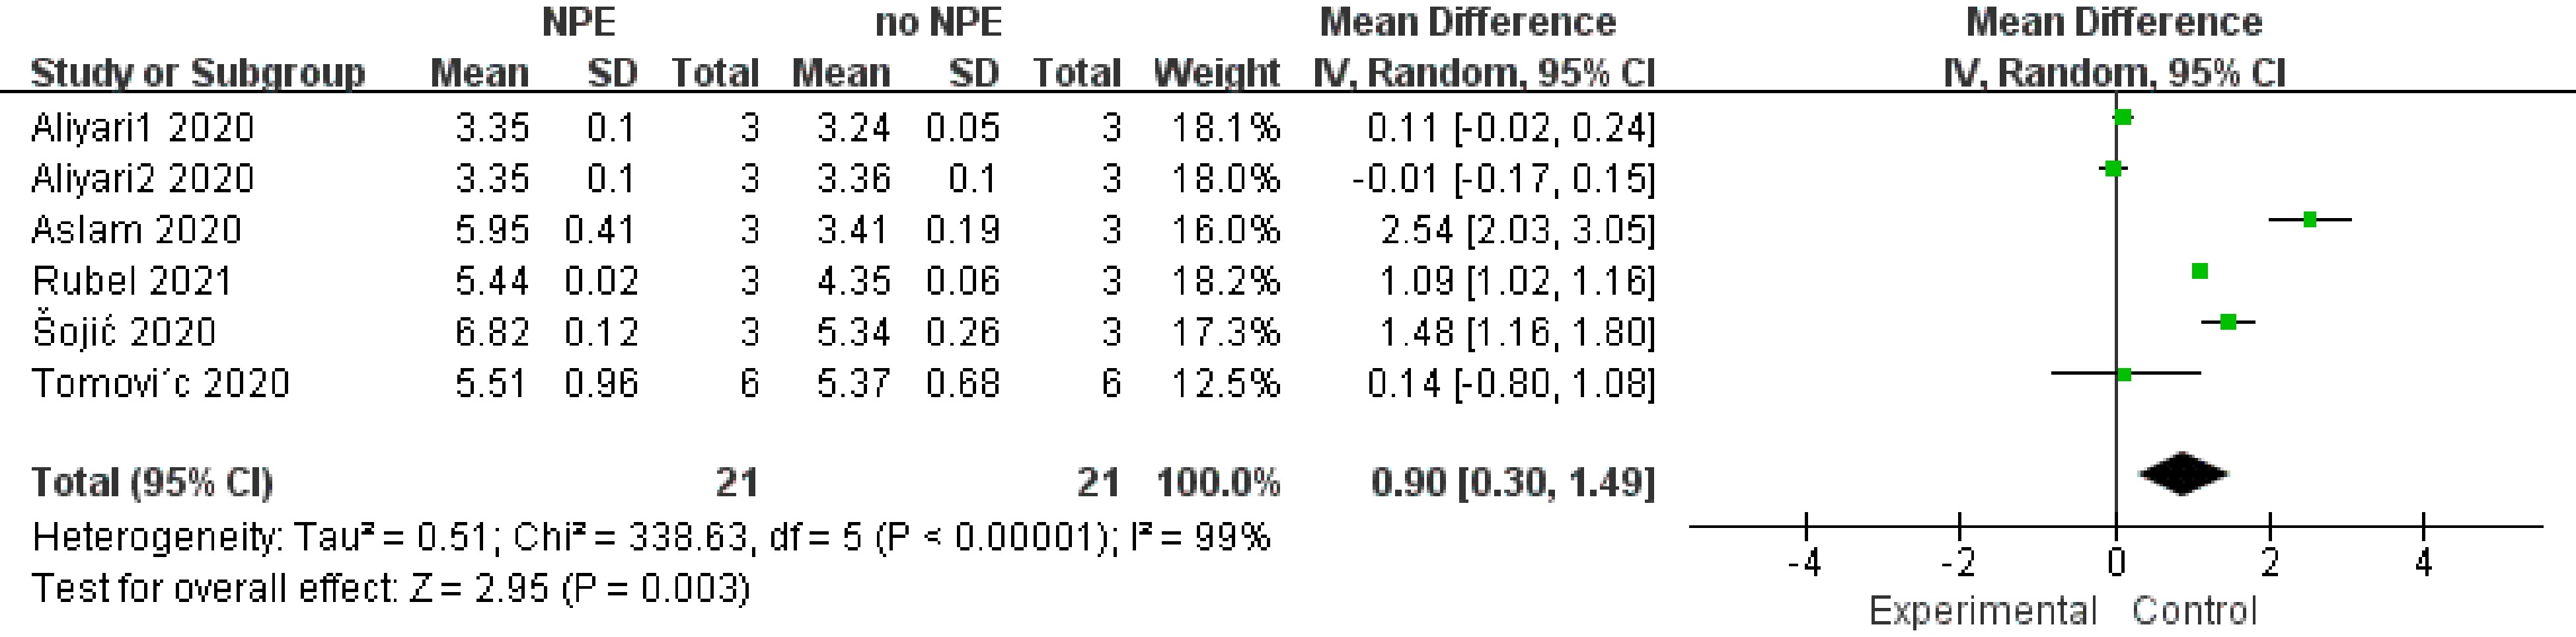
Figure 5.
The forest plot on the effect of NPE on total plate count (TPA) of meat products produced with different raw materials.
Publication bias detection
-
The funnel plot was used to detect the publication bias of indicators. Publication bias is a measure in meta-analysis. The more obvious the processing effect of the study, the easier it is to be published, which leads to publication bias[43]. In addition, poor experimental design, reporting bias and errors also lead to publication bias[34]. Sterne et al.[44] believe that large heterogeneity (i2 > 75%) will affect the detection of publication bias. The publication bias detection of this meta-analysis is shown in Fig. 6. It can be seen from Fig. 6a that the oxidation index shows an obvious asymmetric trend, which may be due to the error effect caused by too few studies available for meta-analysis. The texture index also shows an obvious asymmetric trend, but it is mainly located in the triangle of 95% confidence interval, indicating that the publishing bias is small. The publication bias detection of meta-analysis for pH and TBARS is shown in Fig. 6b & c. The beef and chicken groups show asymmetry, which may be caused by the high heterogeneity. In addition, the points of the funnel plot accumulate at the top of the plot, indicating a low-risk bias.
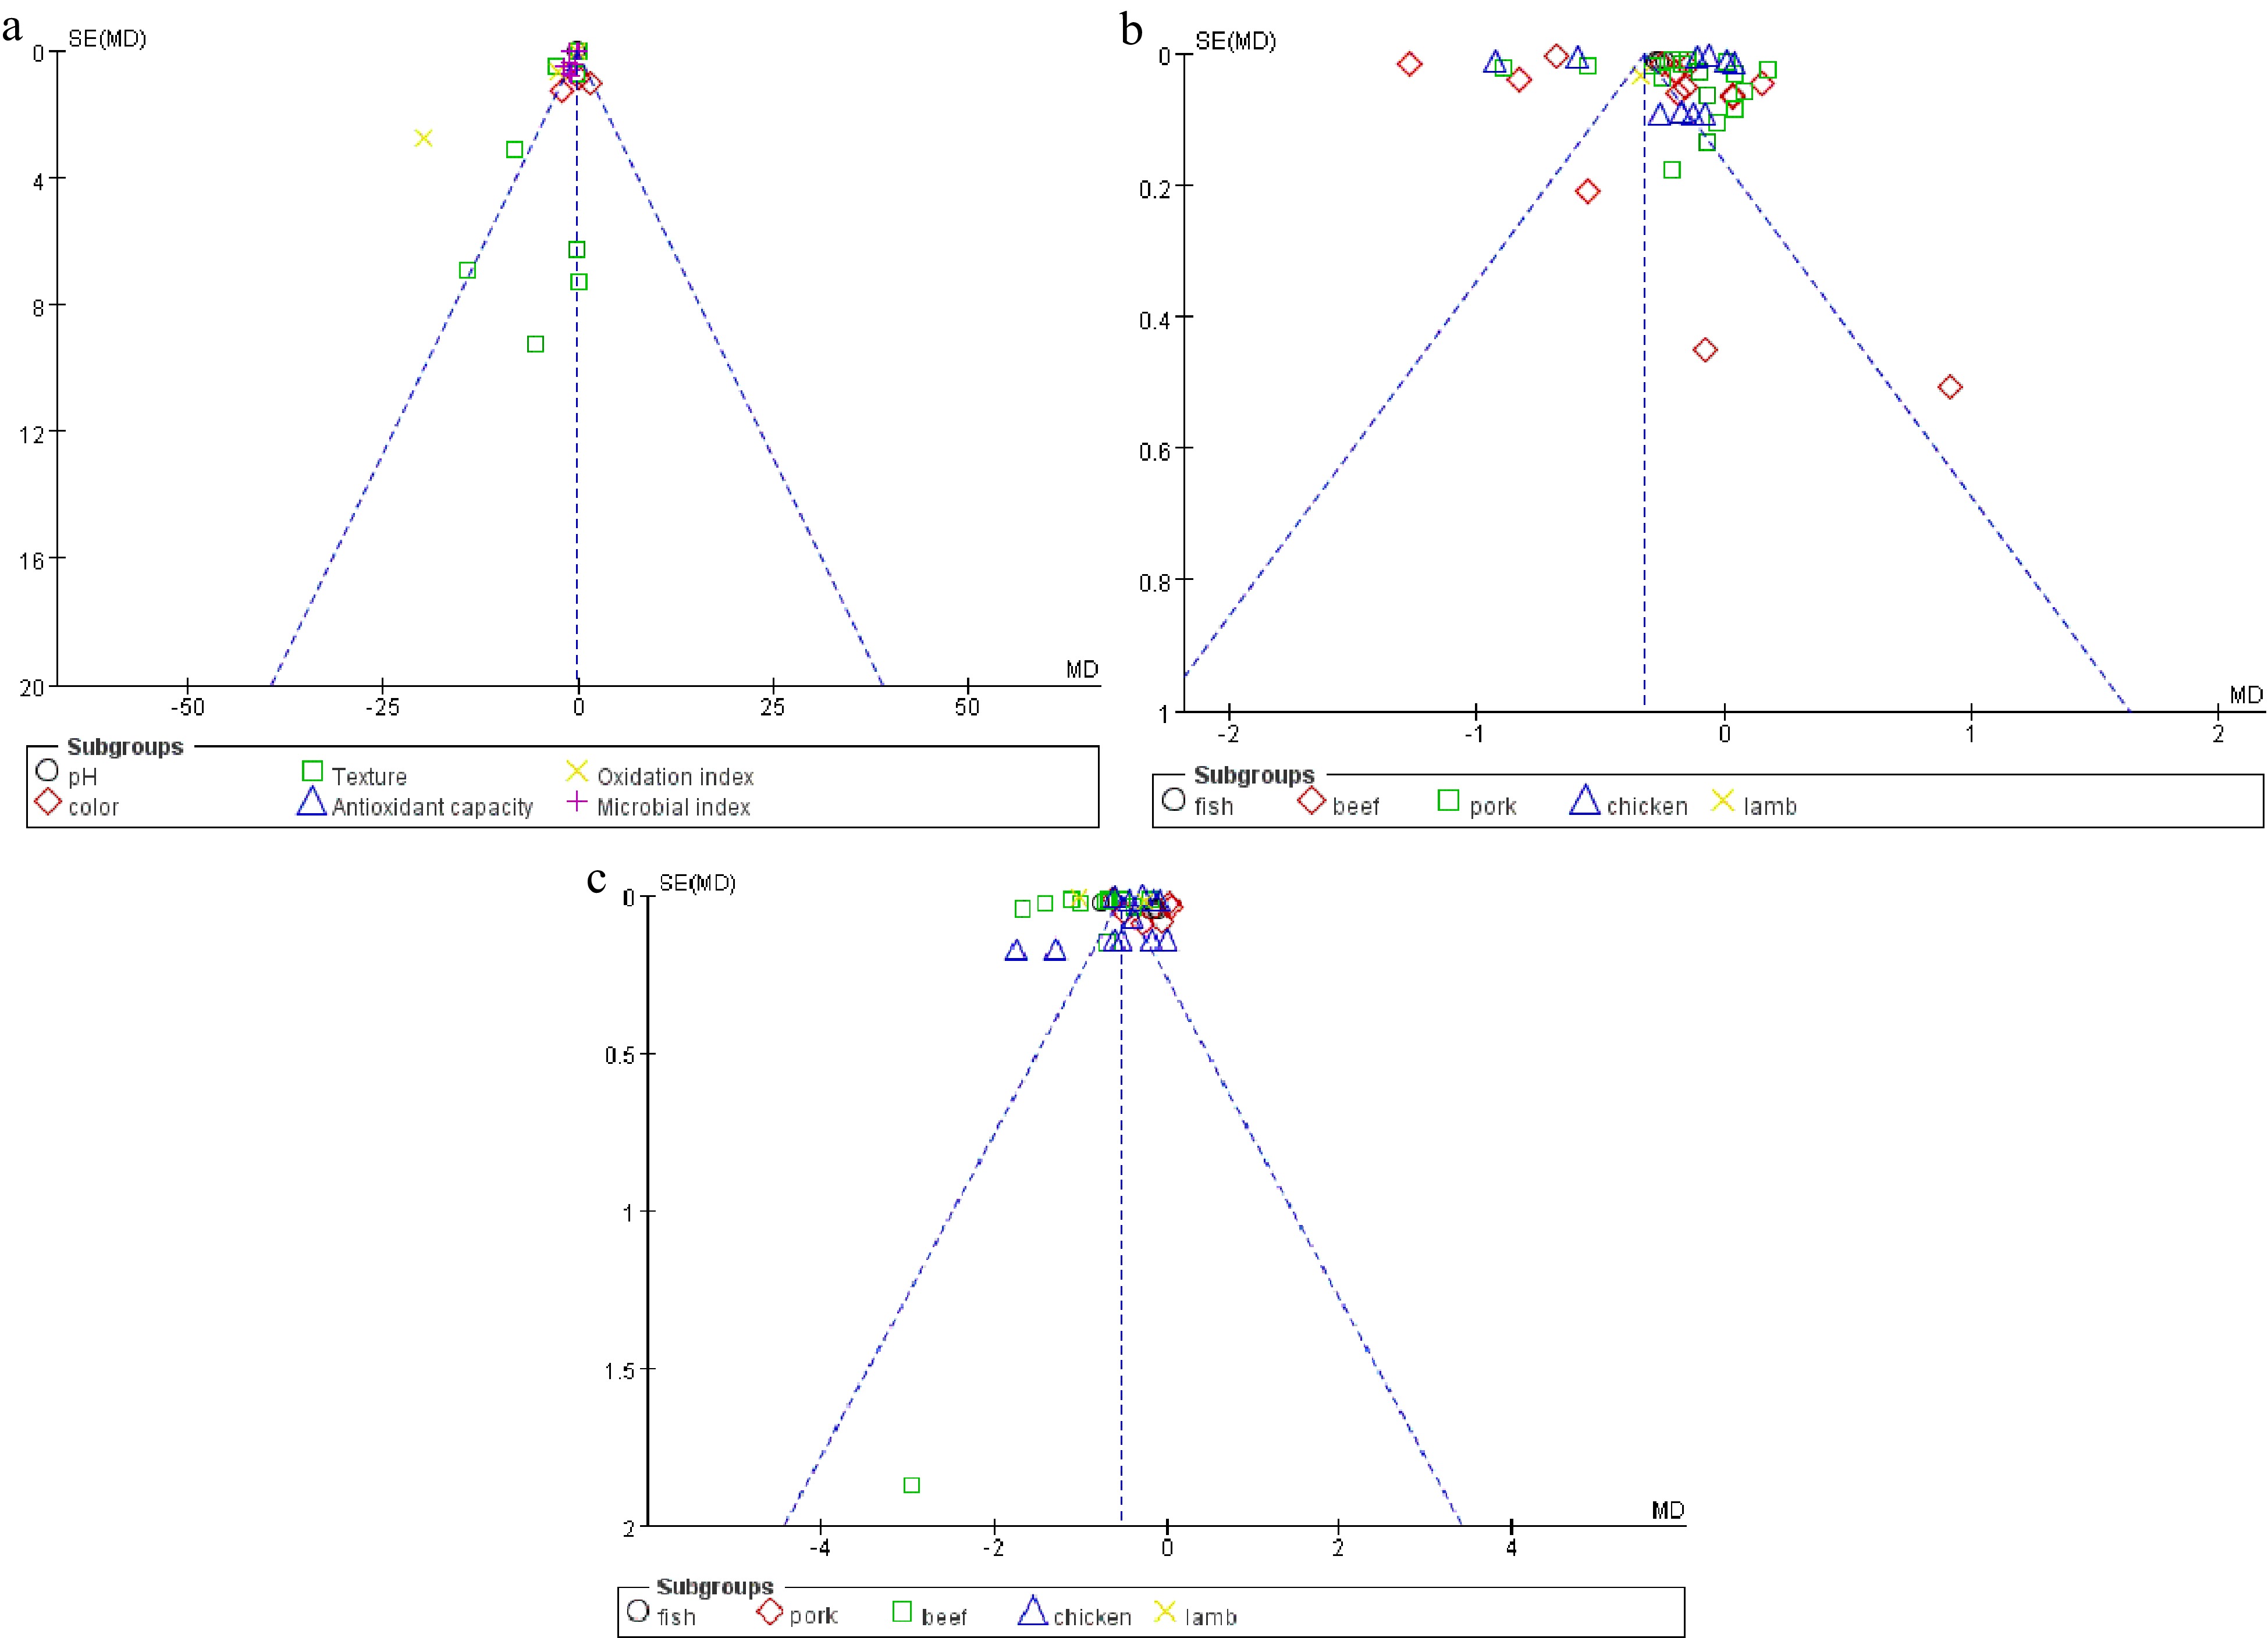
Figure 6.
Funnel plot of studies to detect the publication bias for the selected parameters. (a) Overall effect. (b) pH. (c) TBARS.
-
NPE come from a wide range of sources and are rich in active ingredients. Rational use of NPE extracted from low value parts such as pericarp, seeds and rhizomes is of great significance to the food industry[19,45]. Most of the isolated NPE with antioxidant effect are polyphenols with metastable antioxidant properties or secondary metabolites with conjugated double bonds[46]. Their main active components are polyphenols, flavonoids, phenolic diterpenes and tannins[47]. Many studies have been done on the extraction, separation, identification and application of NPE in meat products[48,49]. The results showed that based on its antioxidant properties (Fig. 7), it played a role in delaying oxidation, controlling pollutants, inhibiting microorganisms, alternating nitrate, enhancing flavor and improving quality in meat products[19]. However, relevant studies also show some heterogeneity, which indicates that the effect of NPE on meat products may be diversified. In addition, few qualitative or descriptive review articles are reported in peer-reviewed computable journals. There is no statistical review on the comprehensive quality impact of NPEs on different meat products. The present study evaluated the impact on different indicators, the consistency of evaluation results and their relationship.
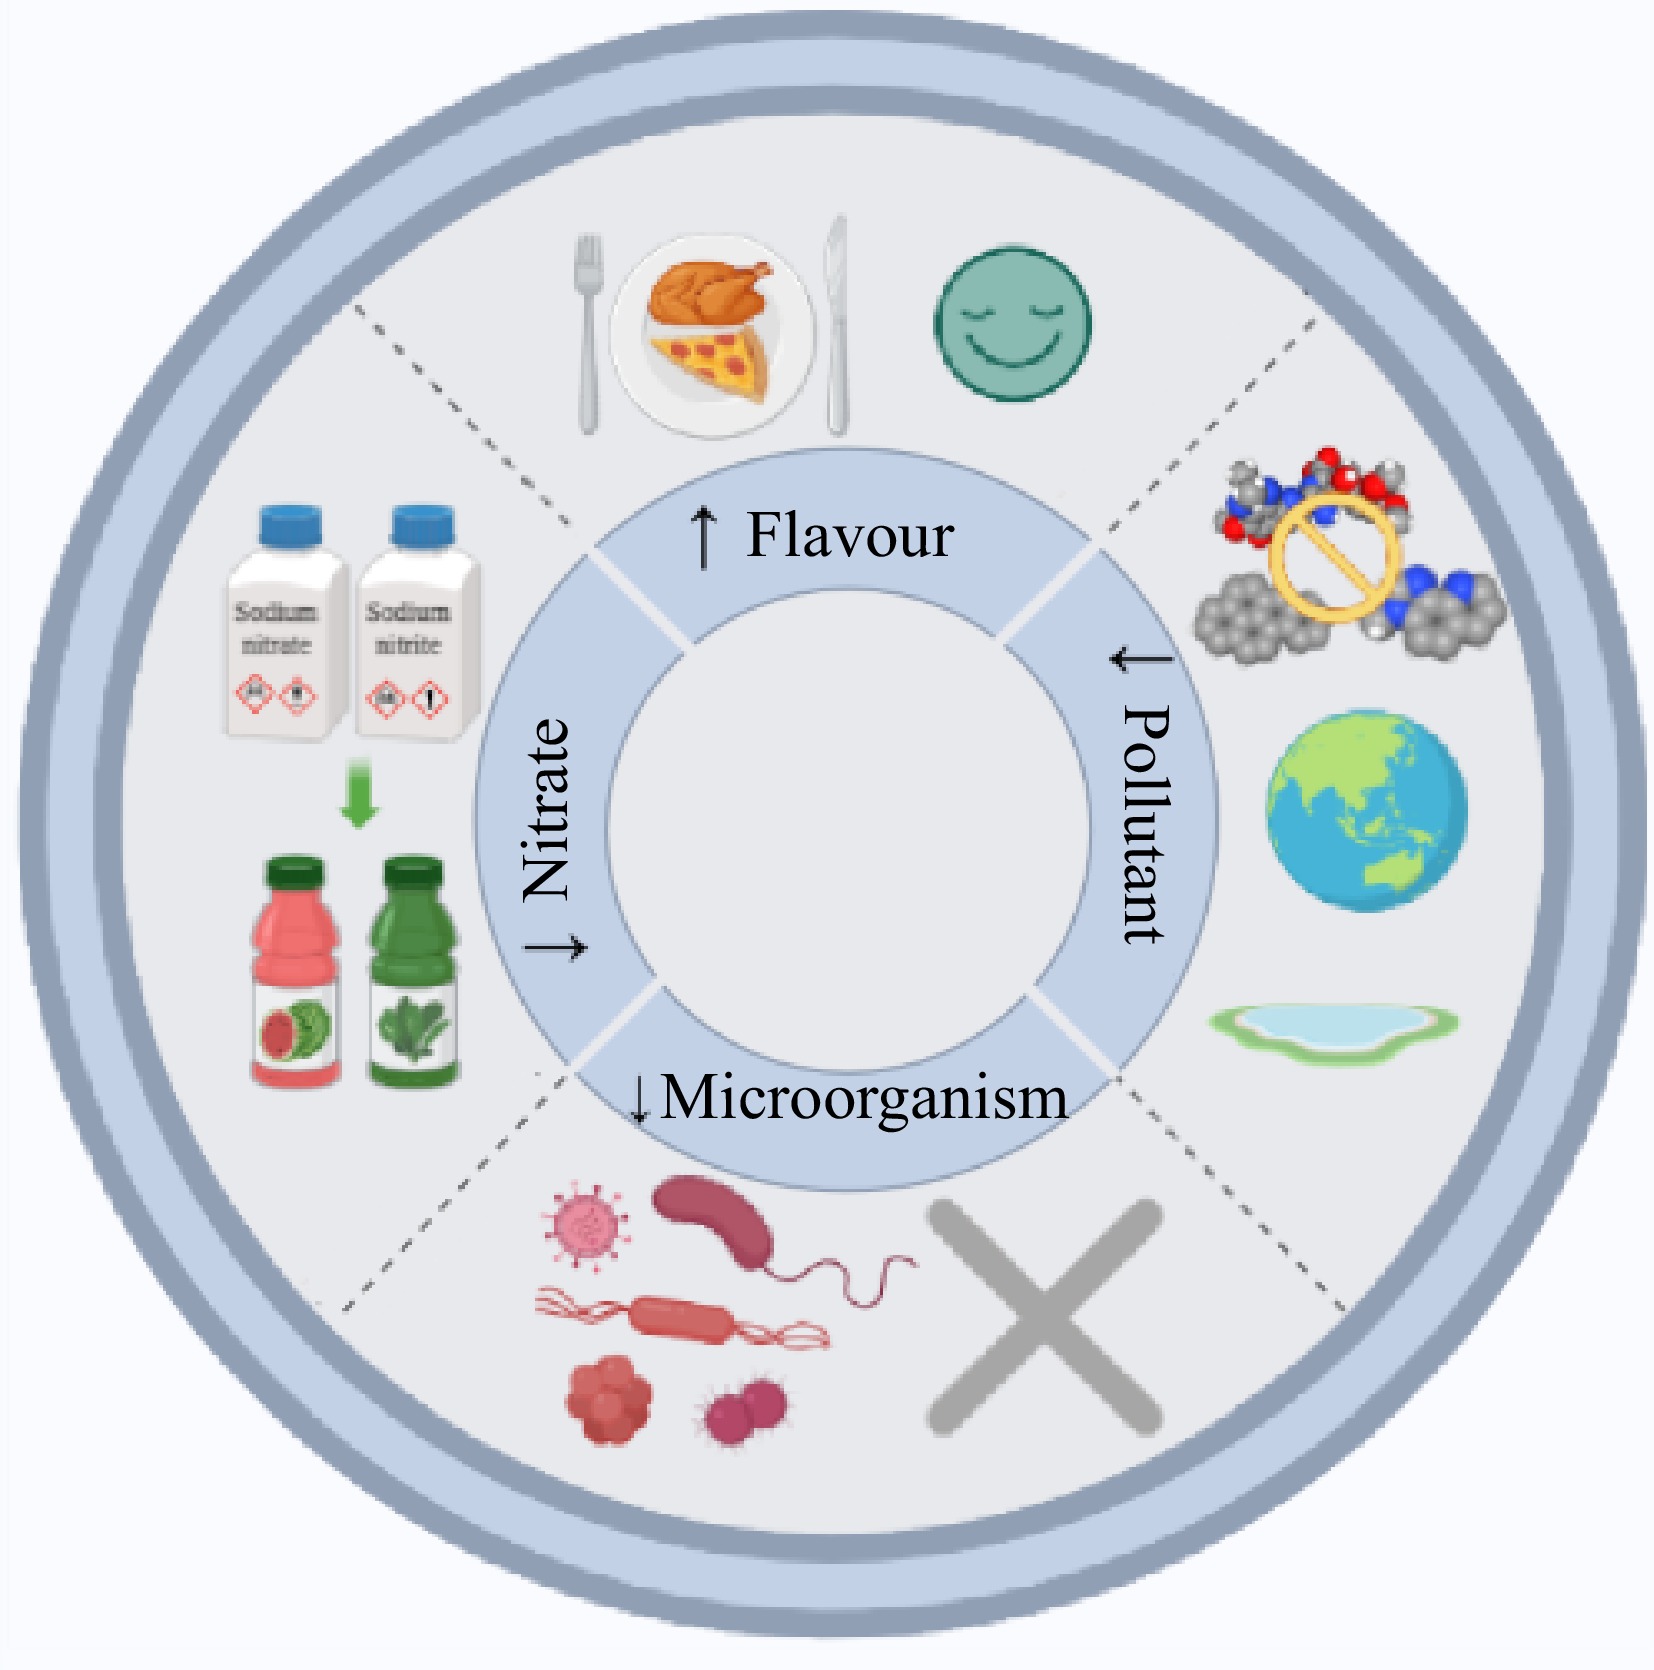
Figure 7.
Effect of NPE based on antioxidant properties on meat product quality.
With high nutritional value, meat products provide human beings with proteins, lipids, minerals, vitamins and other trace elements necessary for growth and development[45,50]. However, rich nutrients also make it easy to deteriorate. It is generally believed that bacterial growth and lipid oxidation are the main reasons for the degradation of meat quality[51]. Storage and processing are the critical points to control the quality of meat. However, the potential safety hazards of using artificial preservatives, the cumbersome and uneconomical treatment of freezing, curing, air drying and other treatments, as well as the impact on the sensory quality of meat, have led people to focus on NPE[52].
As for the mechanism of NPE in meat products, inhibition of lipid and protein oxidation is the basis (Fig. 8). Due to the free radical chain reaction, the reactive oxygen species and metal ions cause oxidative damage to meat protein[53], and also produce unpleasant flavour substances such as malondialdehyde through oxidation reaction[54,55]. In addition, hemoglobin and myoglobin also promote lipid oxidation in meat products[56]. Here, antioxidants react with free radicals to form stable inactive products[57]. According to relevant studies, antioxidants could be divided into two categories according to their action modes. One is called broken chain antioxidant compounds, which react directly with lipid free radicals by providing hydrogen atoms, and the other loses catalytic function by combining with metal ions[58]. NPE might have the function of two kinds of antioxidants at the same time because it contains a variety of active ingredients (Fig. 9). For example, phenolic acids and phenolic diterpenes have a strong ability to provide hydrogen atoms, while flavonoids and other phenolic compounds are considered to be able to chelate with metal ions[59−61].
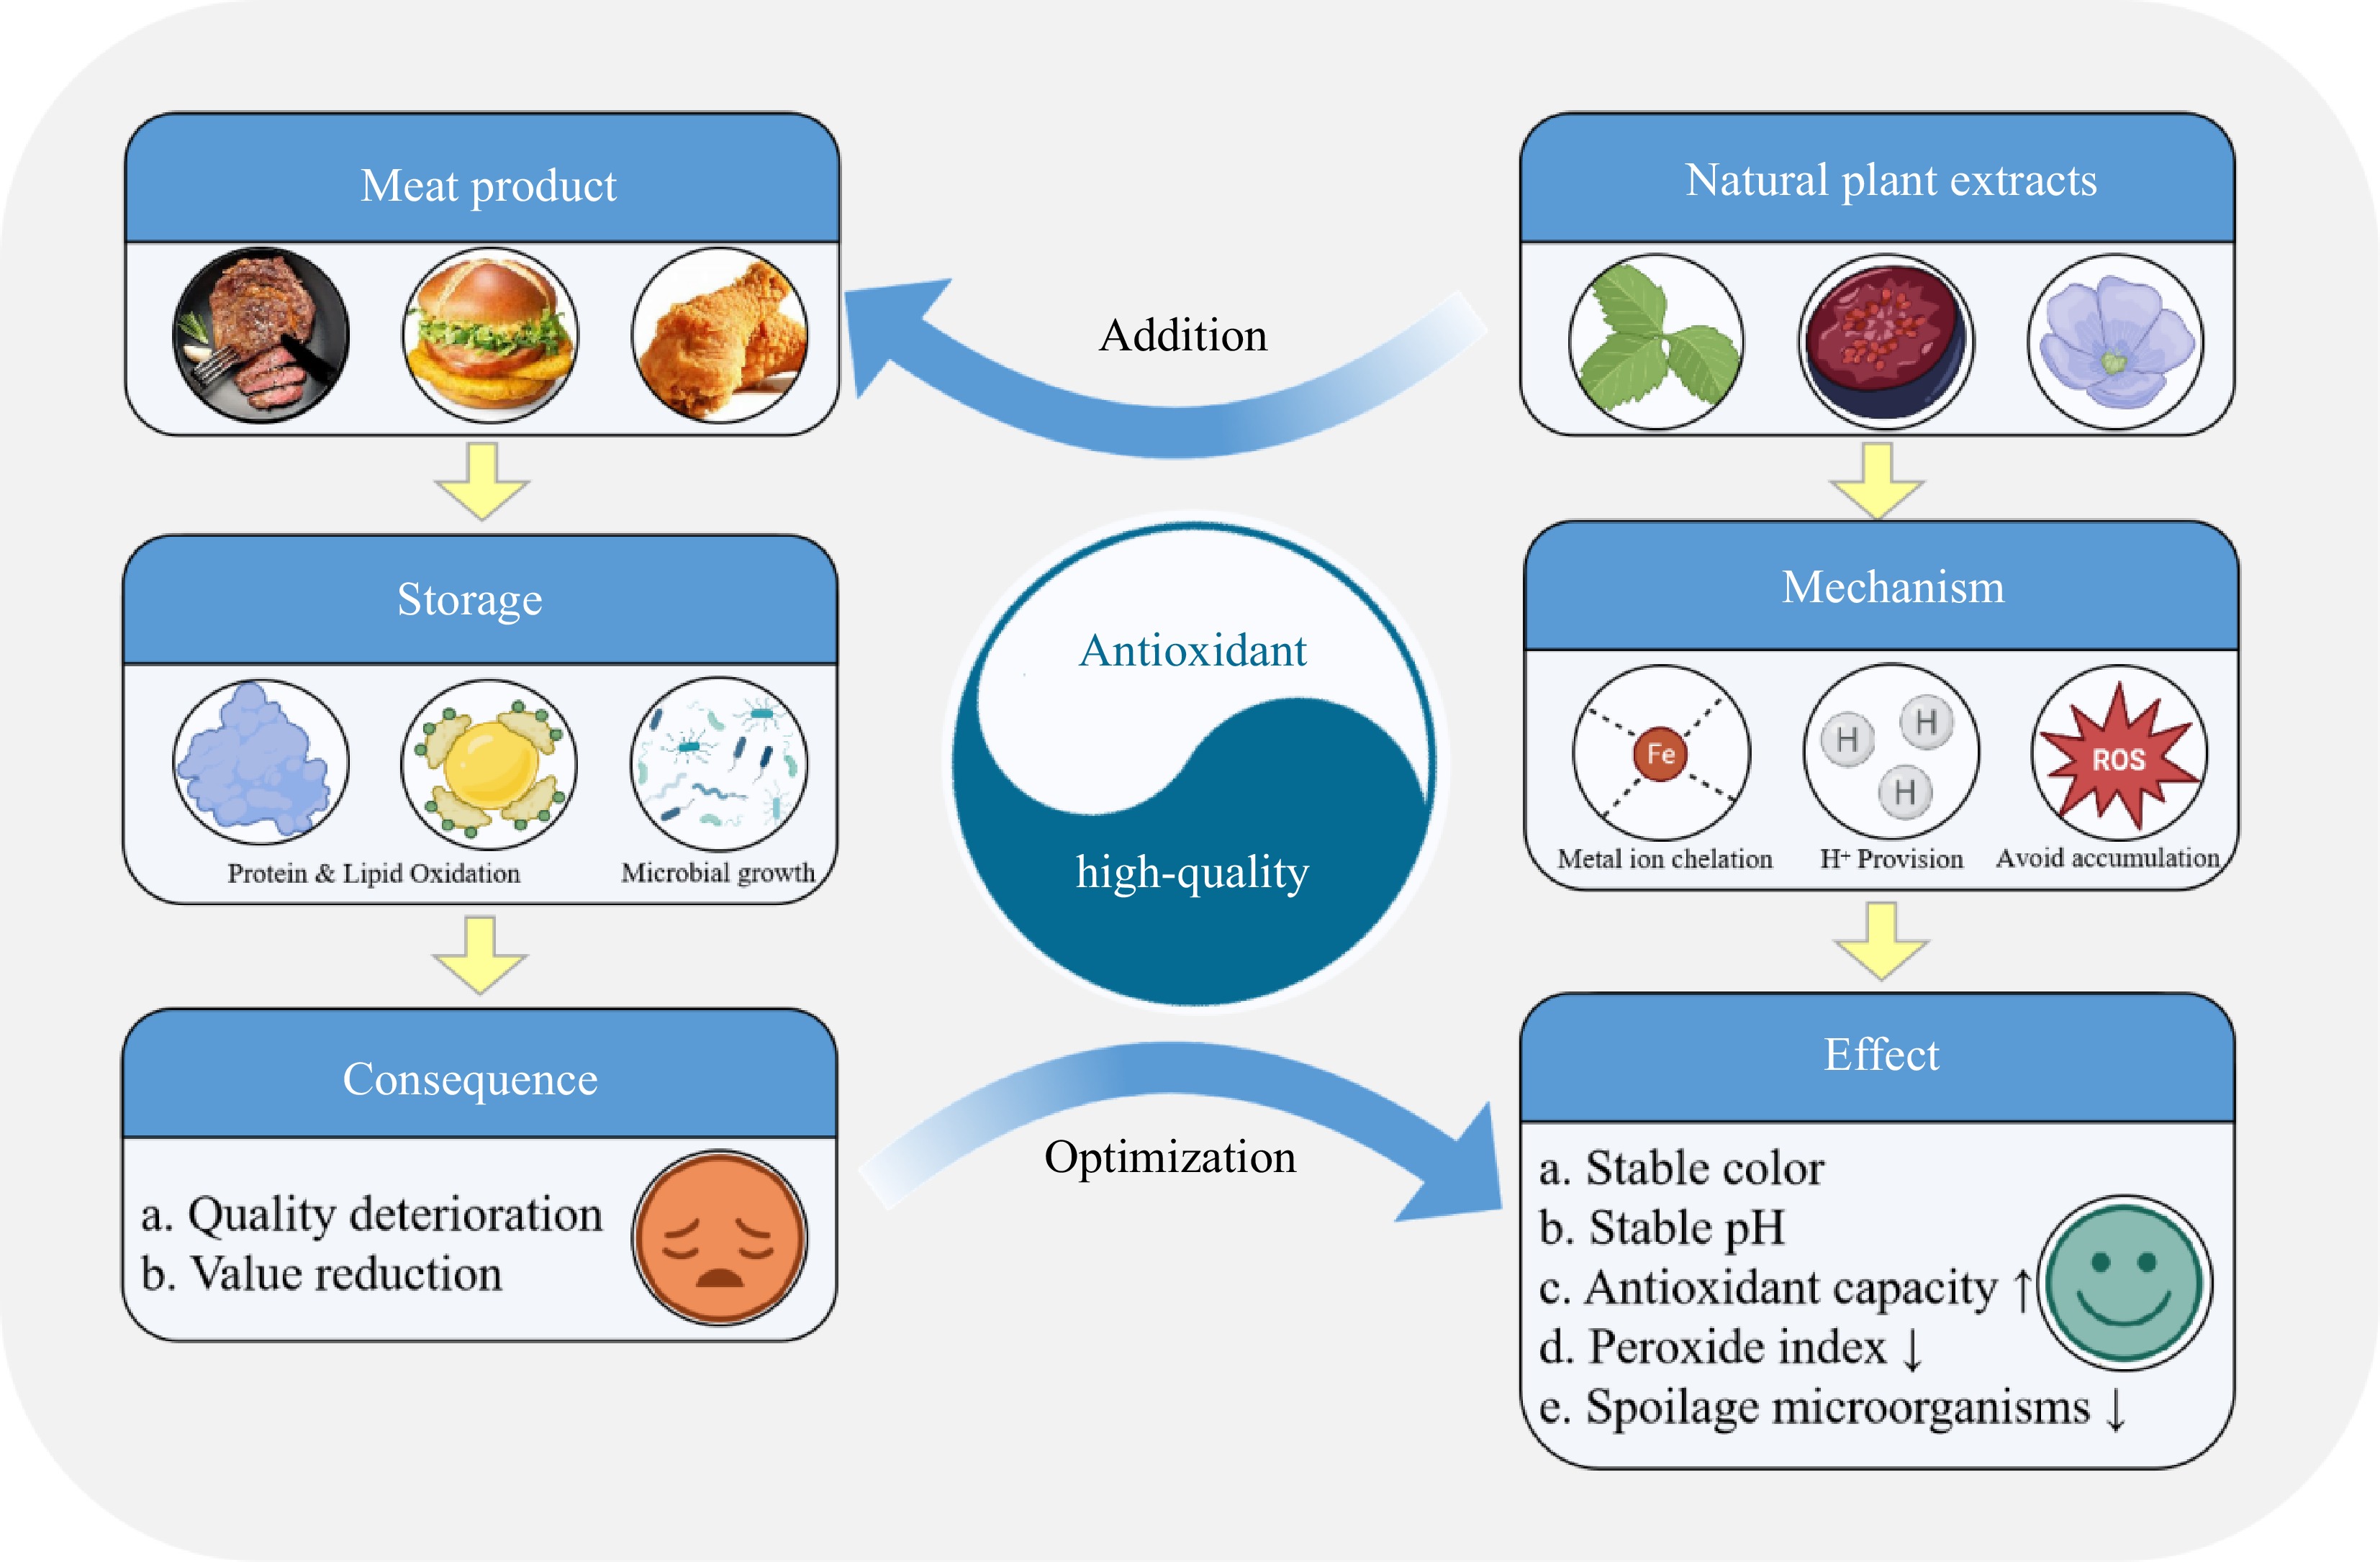
Figure 8.
Possible mechanism of NPE improving meat product quality.
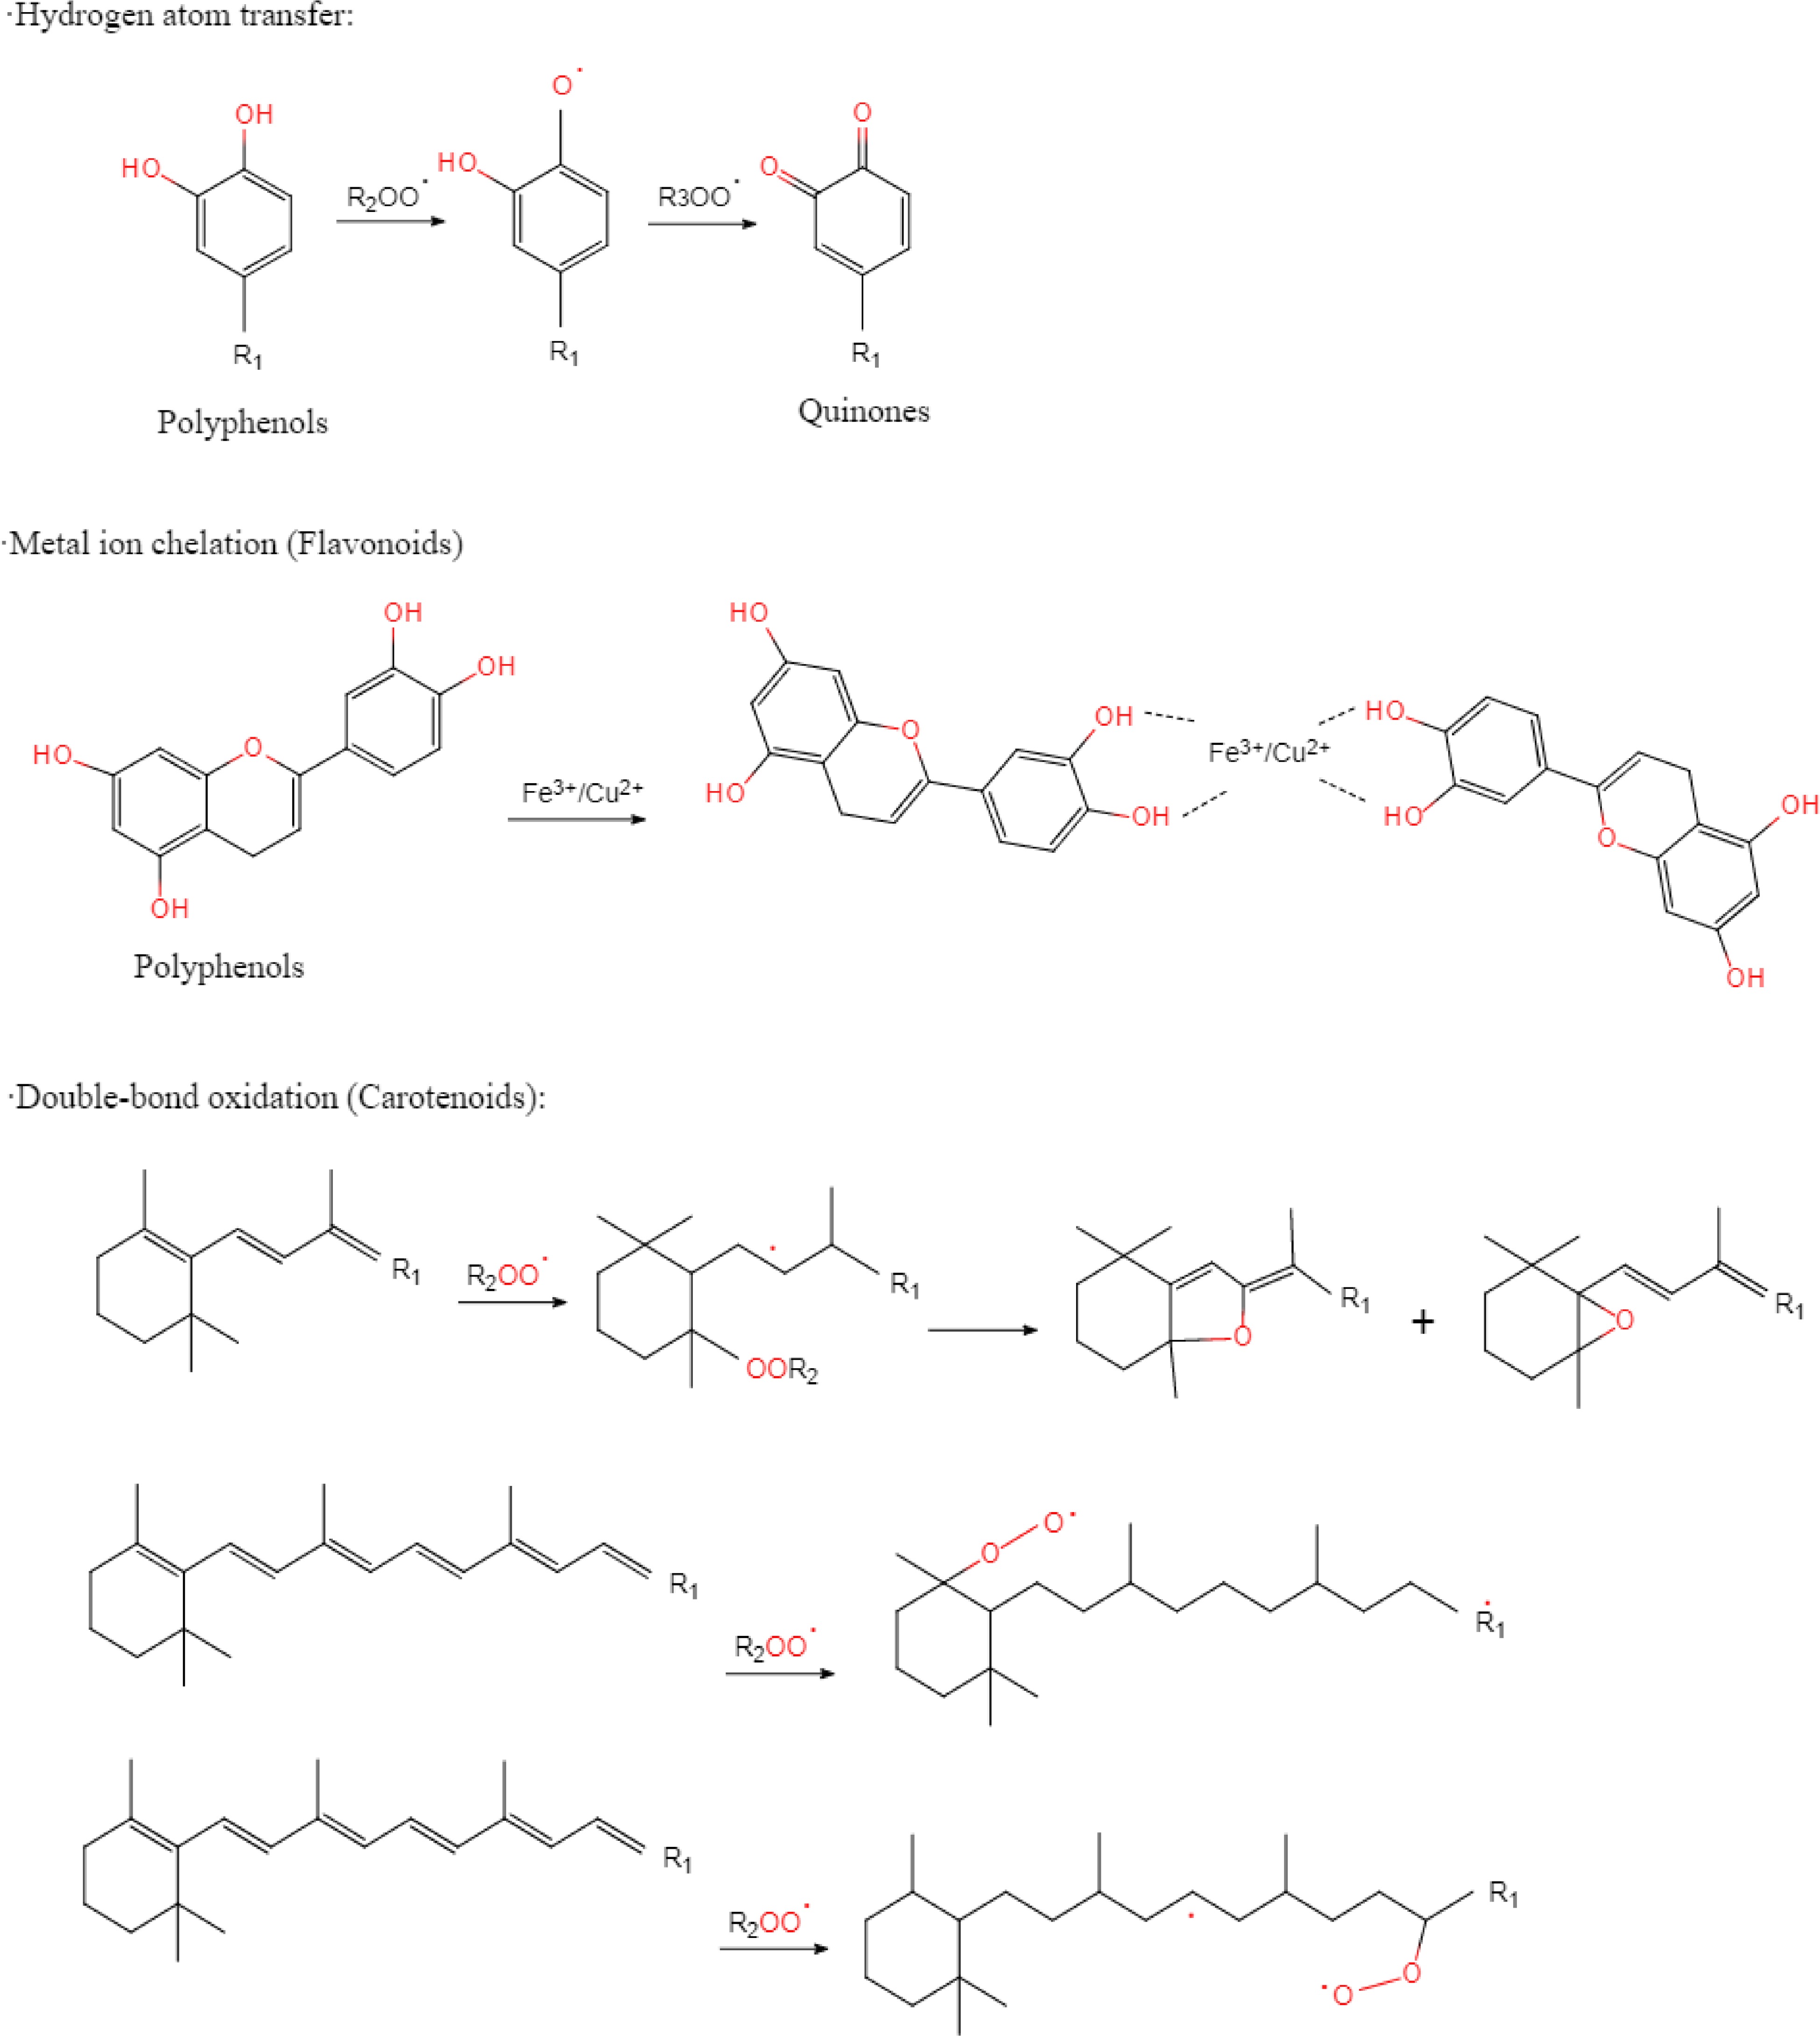
Figure 9.
Antioxidant mechanism of common bioactive substances in NPE.
Evidence has shown that synthetic antioxidants (butyl hydroxyanisole, butyl hydroxytoluene, propyl gallate and tert butyl hydroquinone) have potential genotoxicity, and high-dose use might even cause cancer[62]. However, there is little evidence that NPE has adverse effects on meat products or human body. NPE could not only prevent the oxidation of lipids and proteins, but also maintain the normal texture, color, taste and flavor of meat products, and avoid the destruction of vitamins and the formation of toxins[63,64]. In particular, ascorbic acid, anthocyanins, carotenoids, dehydroascorbic acid, glutathione, phenols and flavonoids in NPE are recognized antioxidants[65,66]. Some studies showed that addition of NPE to the formula has excellent antioxidant potential. If appropriate NPE were supplemented, and appropriate treatment or processing methods were applied, meat products will show strong antioxidant properties[67].
In this meta-analysis, the summary results of pH, antioxidant properties, oxidation degree and microbial growth showed that the addition of NPE significantly delayed the oxidation of meat products but had no effect on color and texture. Some earlier studies indicate that NPE can protect the color of meat products by delaying the oxidation of hemoglobin[68]. However, after processing, the effect of its ingredients on color may be greater than that of hemoglobin. As for the impact on texture, earlier studies indicated that NPE changed the water retention capacity of meat products, thereby affecting other texture indicators[69]. The difference among these studies could be due to the fact that the antioxidant properties of NPE are not as strong as those of natural active substances artificially separated and purified, or that the color and texture of meat products themselves do not change significantly during the reported storage period.
NPE based on phenols, flavonoids and tannins show the ability to limit and scavenge reactive oxygen species[70,71], and are fully used in different forms of meat products. For example, olive leaf essential oil rich in polyphenols can inhibit the microbial growth of fresh poultry and prolong its shelf life[72]. Garlic extract containing flavonoids and sulfur compounds can effectively inhibit lipid oxidation of sausage[10]. Rosemary extract rich in rat tail oxalic acid and terpene dienes can effectively reduce the TBARS value of beef balls during 12 d of storage[73]. When NPE with strong antioxidant capacity are added to meat products, they still have antioxidant potential, and based on their antioxidant properties.
Different NPE extraction methods might have an impact on its antioxidant effect. Awad et al.[19] summarized the common NPE extraction schemes, including traditional water extraction, alcohol extraction, soxhlet extraction and emerging supercritical fluid extraction, ultrasonic assisted extraction, subcritical water extraction, microwave-assisted extraction and real-time pressure drop extraction. The application of various extraction technology combinations can play a synergistic effect.
Many studies have analyzed the impact of NPE on human health. Rosemary extract (rosmarinic acid) has anti-inflammatory activity by stimulating the secretion of interleukin-10[74]. Origanum extract controls stress gastritis and hypersensitivity by inhibiting the secretion of cyclooxygenase-2 (COX-2) in epithelial cancer cells[75,76]. Kaempferol, a aglycone flavonoid abundant in Aloe Vera and peaking spurge, could prevent hepatocellular carcinoma by controlling oxidative stress caused by reactive oxygen species[77]. In addition, some flavonoids from moss can upregulate caspase-3/cleaved-caspase-3 and induce apoptosis of A549 cells by inhibiting the expression of XIAP and Survivin[78]. Luteolin and other flavonoids could selectively reduce the vitality of cancer cells and change some signal pathways, thus playing an anti-cancer effect in the human body[79]. The health effects of these NPE on human body have been very clear, but considering that they are often added to meat products, whether the final products are still beneficial to human health remains to be further studied.
Consumer demand for natural preservatives is the main driving force for the research on the application of NPE in meat products. However, the bad taste and color of some NPE might adversely affect the sensory properties of products, so the combination of multiple NPE may be a feasible way. In addition, another challenge in the application of NPE is interaction with different meat products, which leads to the fact that some compounds play an effective antioxidant effect in vitro even at low concentrations, but they need to be used in high concentrations in meat products[80]. In particular, phenols and carotenoids can bind to meat protein or lipids, so the structure-activity relationship and dose effect are worthy of attention[23].
-
Consumers' preference for natural ingredients makes them prefer meat products that use NPE as preservatives and nutritional enhancers rather than synthetic compounds. Therefore, many studies have applied NPE to improve the quality of meat products. The present study indicates that NPE has a positive effect on the quality of meat products. The addition of NPE reduces the pH of meat products, improves antioxidant capacity, delays product oxidation and inhibits microbial reproduction. Specifically, NPE reduce the pH, peroxide value, TBARS and TVB-N value of meat products, inhibit the growth of bacteria such as Enterobacteriaceae, Enterococcus, micrococcus/staphylococcus and Pseudomonas, reduce total microbial cryophase and total plate count, and increase DPPH free radical scavenging activity. NPE effectively protect meat products, reduce the degree of lipid and protein oxidation, and prolong the shelf life without changing the basic properties of meat products, such as color and texture. The results might help to better understand the role of NPE in meat processing and it offers an advantageous method to quantitatively analyze how food components affect food matrix. Given the numerous and intricate sources of NPE, it is essential to classify it based on biochemical makeup and do a thorough investigation. The dose-effect relationship between the addition of NPE and the quality of meat products still need more study. Further investigation should be done in the future on the association between meat products containing NPE and human health from the standpoint of metabolic pathways, taking food safety concerns into consideration.
This study was funded by the Jiangsu Innovative Group of Meat Nutrition and Biotechnology.
-
The authors declare that they have no conflict of interest. Chunbao Li is the Editorial-Board member of Food Materials Research, who was blinded from reviewing or making decisions on the manuscript. The article was subject to the journal's standard procedures, with peer-review handled independently of this Editorial-Board member and his research groups.
- Supplemental Table S1 Details of meta-analysis.
- Copyright: © 2023 by the author(s). Published by Maximum Academic Press on behalf of Nanjing Agricultural University. This article is an open access article distributed under Creative Commons Attribution License (CC BY 4.0), visit https://creativecommons.org/licenses/by/4.0/.
-
About this article
Cite this article
Zhou T, Wu J, Zhang M, Ke W, Shan K, et al. 2023. Effect of natural plant extracts on the quality of meat products: a meta-analysis. Food Materials Research 3:15 doi: 10.48130/FMR-2023-0015 

Effect of natural plant extracts on the quality of meat products: a meta-analysis
- Received: 12 December 2022
- Accepted: 16 June 2023
- Published online: 04 August 2023
Abstract: Natural plant extracts (NPE) from some organs of plants are rich in bioactive substances. They have special nutritional characteristics with strong antioxidant and antimicrobial activities. The potential of NPEs to maintain and improve the quality of meat products has attracted attention due to concerns about the safety hazards of synthetic food additives. This paper extensively reviewed the application of NPE in meat processing, and systematically analyzed the comprehensive effects of different NPE using meta-analysis. Fourty-eight articles from 23 countries were studied with standard mean deviation (SMD) using random effect model, and 28 indexes were isolated. Results showed that NPE can reduce the pH value of meat products, improve antioxidant capacity, reduce the degree of oxidation and inhibit microbial growth. In addition, it was found that NPE had a significant impact on the quality of meat products. This meta-analysis provides quantitative evidence to explain how NPE affects meat quality, and helps to better understand the role of NPE in meat processing.
-
Key words:
- Meta-analysis /
- Natural plant extracts /
- Meat processing /
- Oxidation resistance /
- Quality