-
Traditionally processed meat products consist of meat protein (especially myofibrillar protein (MP)), fat, and other ingredients. Animal fat mainly forms stable meat emulsions and improves cooking properties (unique flavor, texture, and juiciness)[1]. The increasing concerns about healthier meat products, however, have induced a growing demand for low-fat products. Thus, how to reduce the fat content and maintain the quality of meat products has received considerable attention. The main method used to reduce the cholesterol content and modify the fatty acid composition in emulsified meat products is adding vegetable/plant oils pre-emulsified with the non-meat proteins (e.g., sodium caseinate (SC)[2,3], whey protein isolate[4], egg-white protein isolate (EPI)[5], and porcine plasma protein (PPP)[1]). The incorporation of pre-emulsified vegetable/plant oils may reinforce the physical stability of the emulsions and subsequently improve the textural and rheological properties of emulsified meat products.
The proteins would spontaneously be adsorbed at the interface due to their amphiphilic nature[6], reducing the interfacial tension (IFT) that contributes to a large interface area and forming a steric and highly viscoelastic layer[7]. It is beneficial to form the viscoelastic films around the oil droplets through non-covalent intermolecular interactions and covalent disulfide cross-link. Eventually, the droplets could be protected to resist the destabilization phenomenon. The adsorption of proteins at the oil/water (O/W) interface is important for the stability of emulsions. Hence, the interfacial adsorption of protein and the interfacial rheological properties of the adsorption film at the O/W interface have become a central issue that has been studied by many scholars. Simultaneously, they are important factors affecting food dispersion stability[8].
The salt-soluble MP exhibits interfacial properties and reduces the IFT at the O/W interface[9]. MP also has a high-quality emulsifying capacity to stabilize soybean O/W emulsions[10]. Meat proteins or non-meat proteins, perceived by consumers as natural ingredients, are healthier and sustainable compared with synthetic ingredients (e.g., Tweens and Span)[11]. Their molecular weights, surface hydrophobicity (H0), conformations, and electrical charge characteristics are widely different[12]. The interfacial properties would be influenced by the structural properties of protein (e.g., conformational flexibility, H0, and reactive sulfhydryl (R-SH) content), the conditions of aqueous phase (e.g., ionic strength, pH, temperature, protein concentrations, and interactions with other components), and the operation during food processing (e.g., shear and stress)[13,14]. The types and concentrations of emulsifiers impact the interfacial adsorption and rearrangement of emulsifiers by changing the composition and structure of the interfacial layers, which impact emulsion formation and stability[15]. The protein conformational changes and the interfacial adsorption behaviors of proteins have been previously studied[16]. The protein aggregation rate could affect the protein adsorption behavior during preheating[17]. For instance, the H0 influences the interfacial adsorption capacity of proteins[18]. Active sulfhydryl groups have a great impact on promoting interfacial adsorption properties of proteins[19]. The unfolding of MP is exposed to substantial binding sites to the surface of the MP molecules, increasing the adsorption ability[20]. The molecular weight of surfactants exerts a certain influence on the competitive adsorption of proteins[21]. Actually, the interfacial properties could also be influenced by the co-adsorption of binary emulsifiers and the displacement of one emulsifier by another[22]. Meanwhile, the interfacial properties may be affected by the competitive adsorption of proteins in the continuous phase. The high affinity of proteins toward the interface would displace the lower one. The filamentous structure and balanced H0 of MP tend to form the interfacial films in the emulsions[23]. The emulsion stability can be predicted by the interfacial viscoelasticity of protein[15]. The persistent interfacial viscoelastic adsorption film is the basis of a stable emulsion. Nevertheless, the distinct complex structure of protein has led to limited studies on the interfacial properties influenced by their conformational changes. The study of kinetics adsorption of proteins at O/W interfaces, as well as their interfacial rheological properties for the stable emulsion, is relevant to pharmaceuticals and food areas. The conformation–effect relationships remain uncertain. There are few studies on the dynamic aqueous phase rephase substitution and the order of adsorption and desorption of surface-active substances. There also has been scant information on the mechanism of the film formation ability of MP in comparison with typical non-meat protein.
This research aimed to investigate the difference between meat proteins and non-meat proteins in physical stability in the aqueous phase and interfacial properties (including surface adsorption and interfacial rheological properties). Dynamic aqueous phase rephase substitution was used to focus on the film formation ability. This information was useful for a better understanding of the interfacial composition of the mixed layer and the strength of interaction between the adsorbing species. The results may provide a theoretical basis for the interfacial properties of meat proteins in comparison with non-meat proteins.
-
The H0 of proteins that refers to surface particle[24] is extremely important to the interfacial adsorption rate and emulsification activity[25,26]. ANS, as a non-polar dye of external probes[27], combined with the hydrophobic group of protein, and the fluorescence intensity increased significantly with a blue shift. Different proteins possess various surface hydrophobic properties, which may be attributed to their diverse amino acid composition, subunit composition, and protein conformation. In addition to the composition of amino acid, the stability of the O/W interface also depended on the exposure degree of the amino acid to the interface when protein attached to the interface. Figure 1a shows the H0 of the meat protein (MP) and non-meat proteins (PPP, EPI, and SC). The highest hydrophobicity of SC may be associated to its unique amino acid composition. The presence of proline in SC resulted in the change in secondary structure and the uneven distribution of the hydrophobic groups. The H0 of MP was higher than those of two other proteins (PPP and EPI). The distinct initial structural conformations would be the reason for the variation among proteins[28]. Kato et al.[29] manifested that the H0 of protein was related to its ability to reduce IFT and emulsification, which will also be explored in our following research. High surface hydrophobicity could improve the adsorption of proteins at the interface, thereby inhibiting the droplets flocculation and coalescence[30], which is probably suitable for specific emulsion product applications.
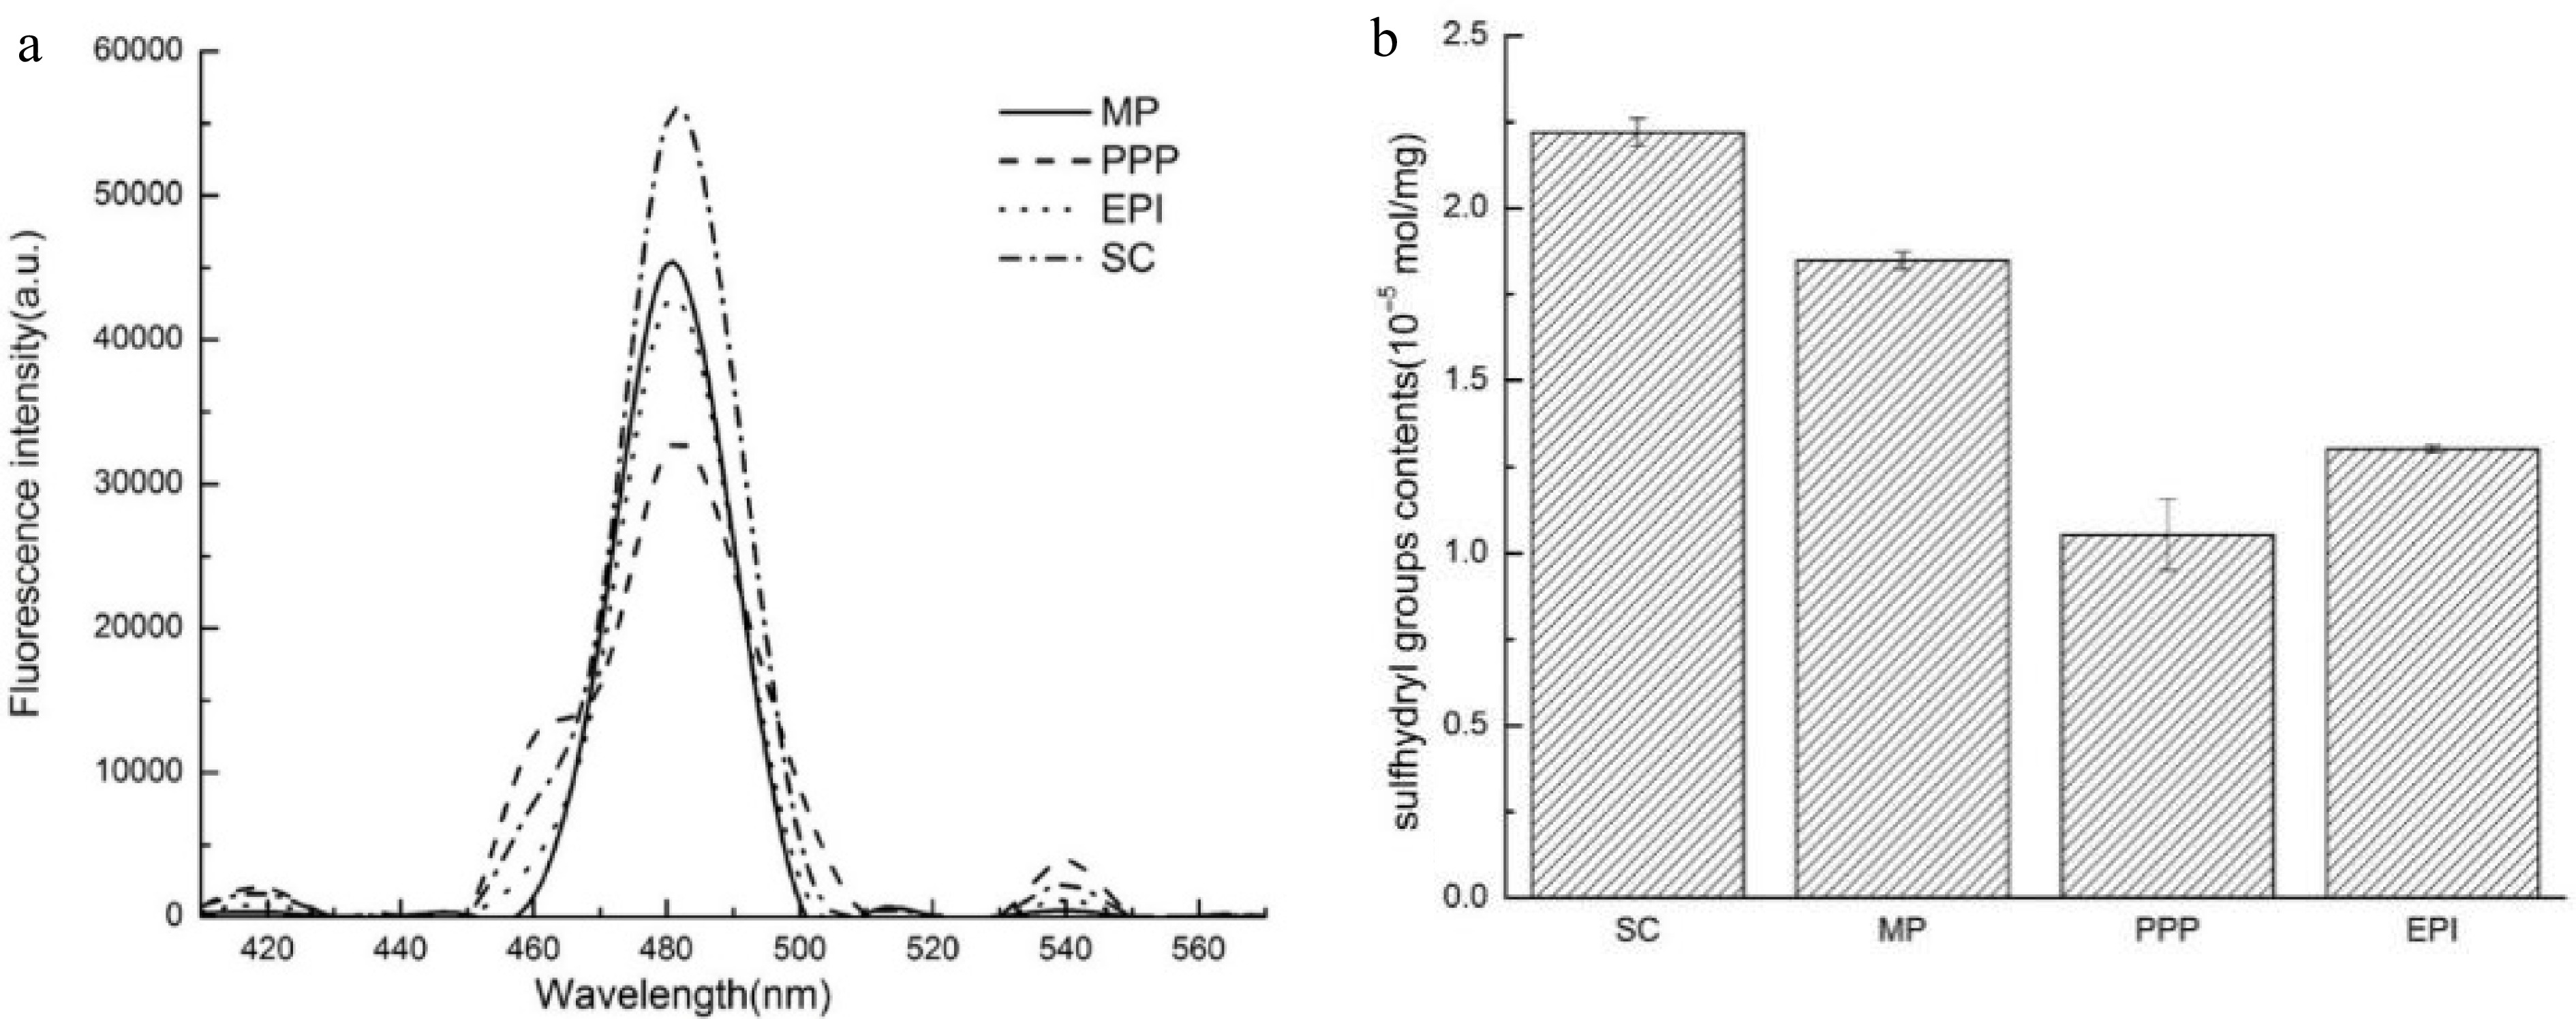
Figure 1.
(a) H0 of different proteins (MP, PPP, EPI, and SC). (b) R–SH contents (10−5 mol·mg−1) of different proteins (SC, MP, PPP, and EPI).
R-SH groups
-
Many protein functions can be expressed in terms of the balance between sulfhydryl and disulfide bonds. Especially for R-SH, it tends to be associated with protein reaction, forming macroaggregates and coalescence of oil droplets[28]. The polymerization of adsorbed proteins can be improved by the sulfhydryl–disulfide interchange reaction at the interface. In such a case, the proteins irreversibly adsorb to the O/W interface, and a highly viscoelastic film is formed to resist coalescence[16,31]. Figure 1b shows the R-SH content of the meat protein (MP) and non-meat proteins (PPP, EPI, and SC). PPP possessed a low R-SH group content, probably because of the SH–SS exchange reactions and/or oxidation of the R-SH groups into disulfide bonds. Traditionally, protein molecules with their high SH value are more likely to associate with one another and form aggregates. The R-SH group content of MP was lower than that of SC but higher than those of PPP and EPI, in agreement with the results of H0, which indicated that MP exhibited more flexible conformation.
Conformational flexibility
-
For the surface properties of proteins, the surface hydrophobicity (static factor) and the conformational flexibility (dynamic factor) play a governing role in the emulsification[29]. Flexible protein molecules are susceptible to desaturate and adapt to the O/W interface. The addition of guanidine hydrochloride (Gu-HCl) may destroy the hydrogen and hydrophobic bonds of proteins, resulting in the loss of the advanced structures of proteins. The absorbance of various active proteins at different times in 4 M Gu-HCl is shown in Fig. 2. At 285 nm, the absorbance values of the meat proteins (MP) and non-meat proteins (PPP, EPI, and SC) all decreased gradually from 0 to 30 min and subsequently increased from 30 to 60 min. The absorbance values of PPP and SC reached the maximum at 60 min. During 60–120 min, the absorbance values of EPI and MP continuously increased and reached the maximum at 120 min, suggesting that the tertiary structure of proteins changed and rearranged. The absorbance peak value change rates of MP and SC were 17.39% and 30%, respectively, which were significantly higher than those of PPP and EPI (p < 0.05) (only near 10%). These results demonstrated that the structures of MP were more flexible than those of PPP and EPI. The protein flexibility decreased with the increasing aggregates of the protein[32]. The low conformation flexibility of the protein could lead to difficulties in adsorbing and forming a viscoelastic film, and could even cause rupture of the interfacial film[33].
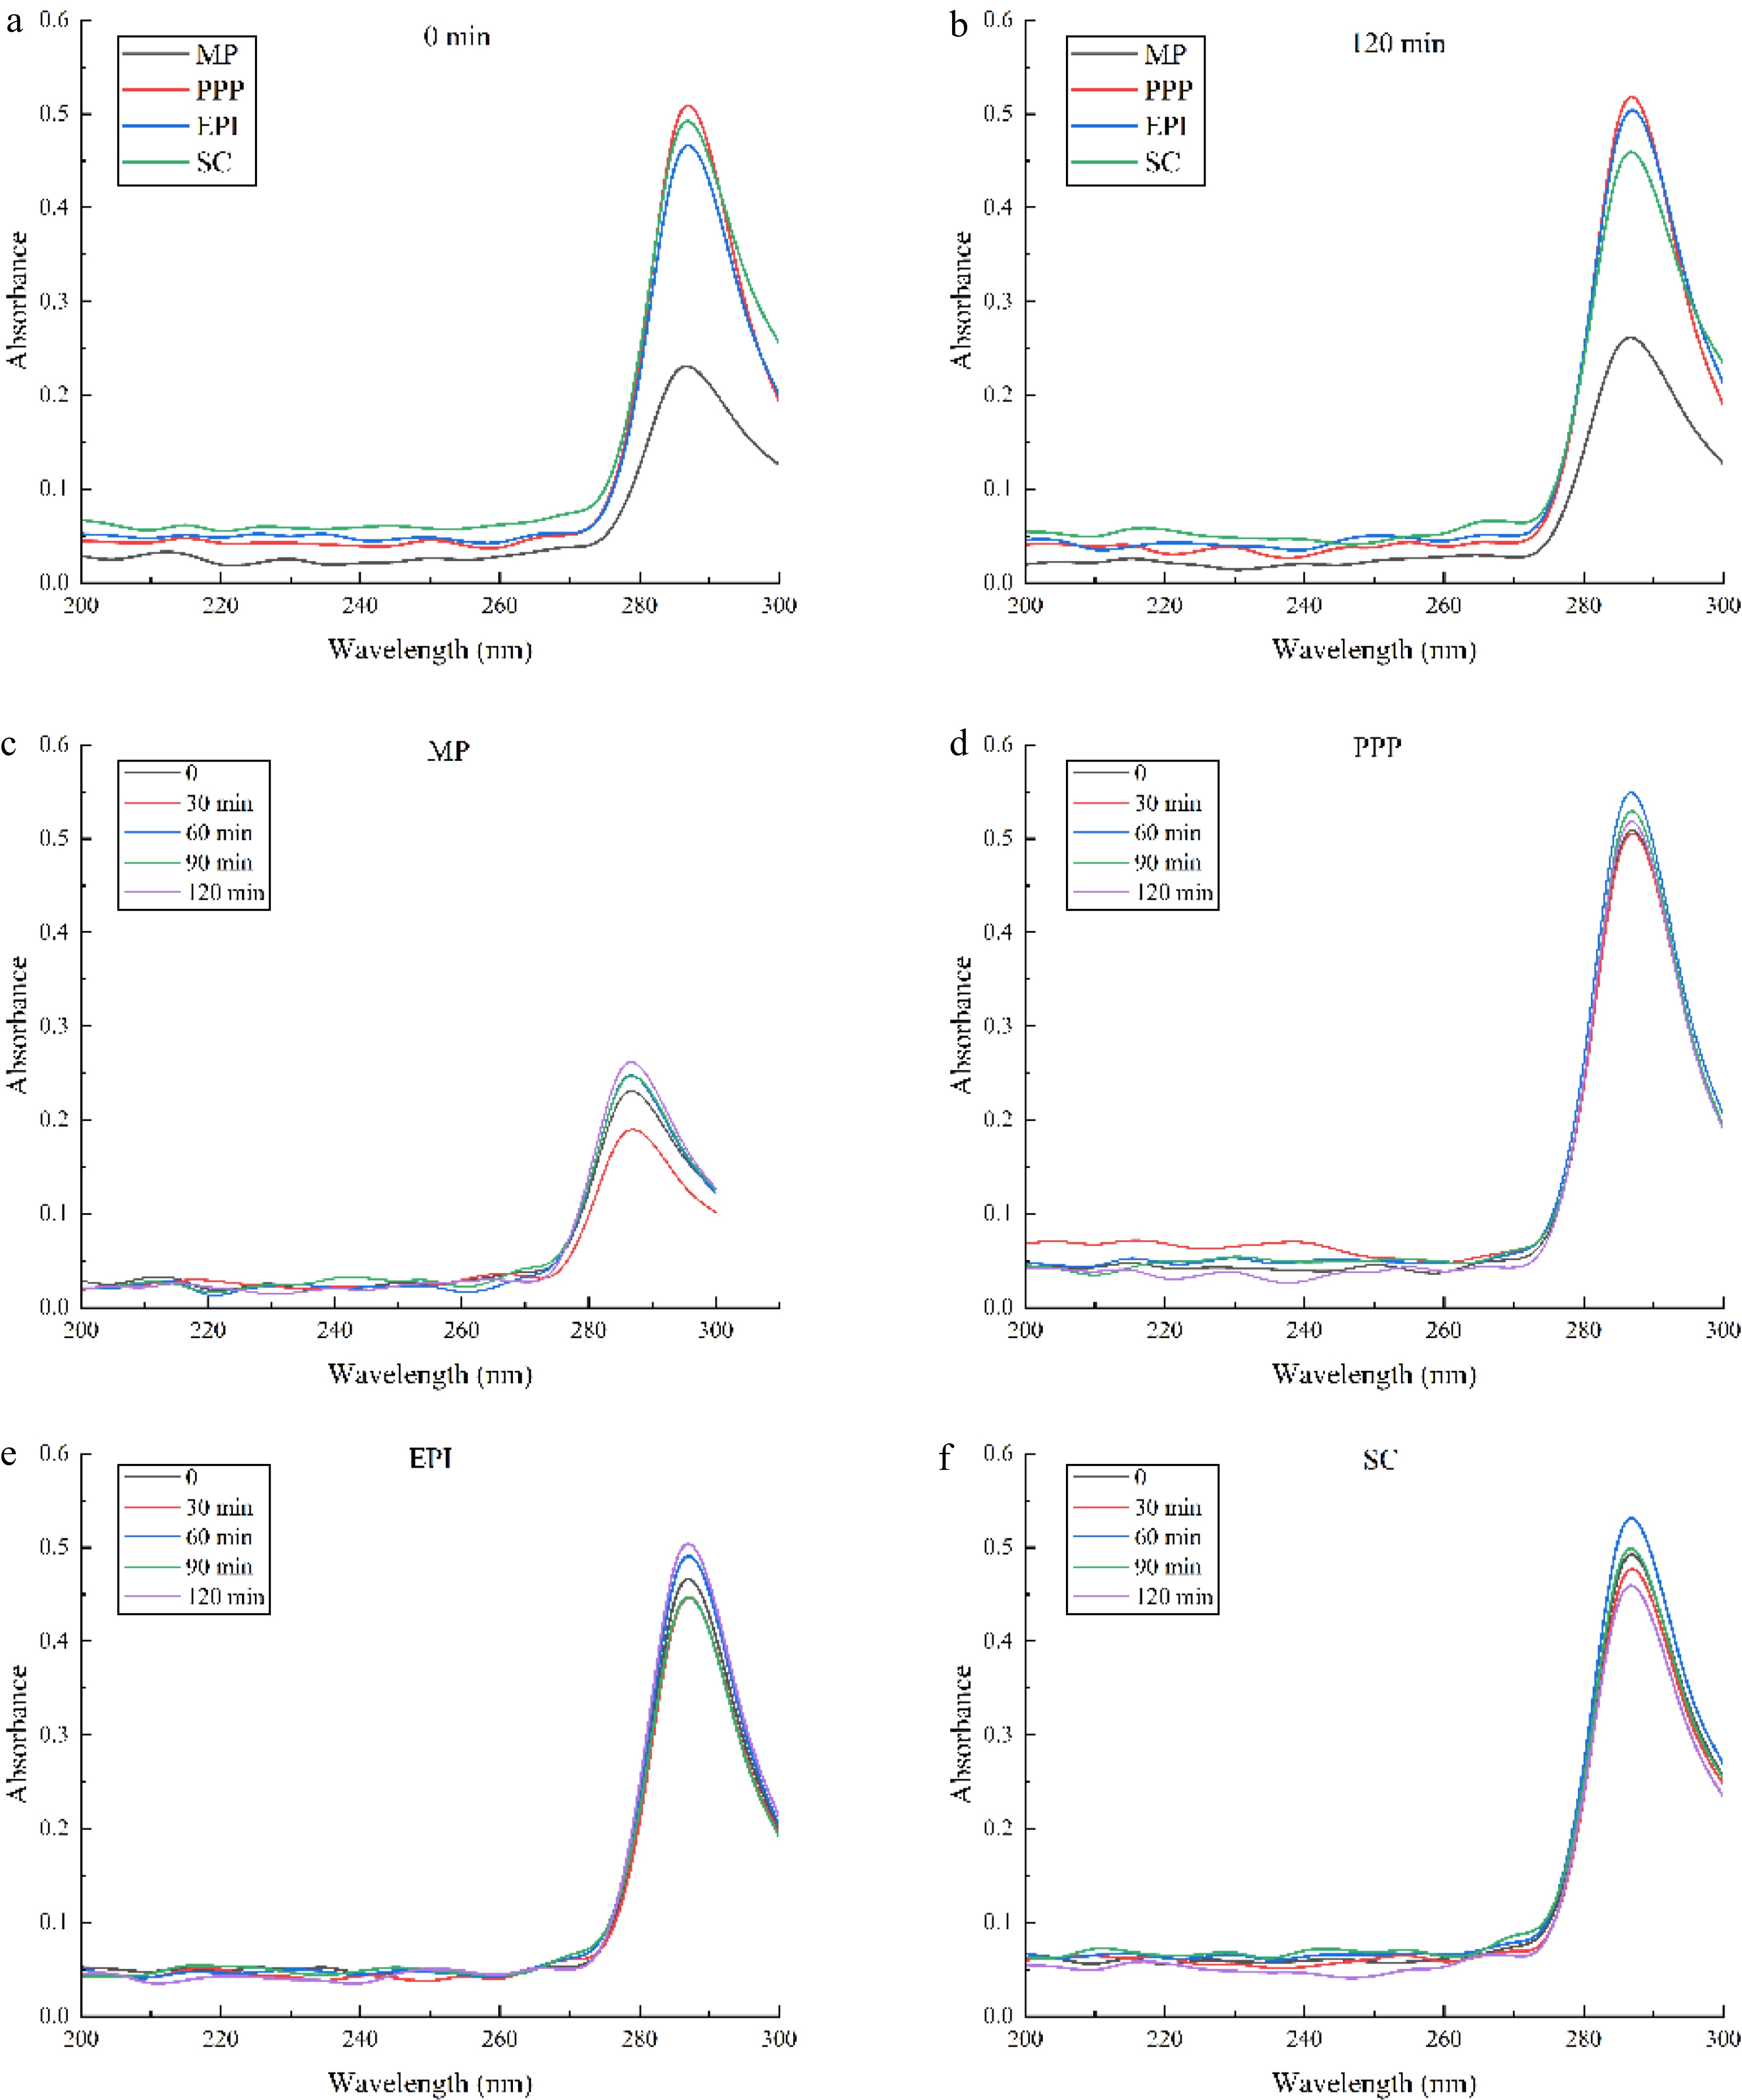
Figure 2.
The absorbance of different active proteins monitored at different times ((a) 0 min, (b) 120 min). The absorbance of (c) MP, (d) PPP, (e) EPI, (f) SC changed at different times (0, 30, 60, 90, 120 min).
IFT
-
The adsorption and desorption kinetics of the proteins at the O/W interface are characterized by measuring the IFT[34]. Generally, the adsorption kinetics of proteins is divided into three main stages at the O/W interface[35−37]: (i) Macromolecules diffuse to the interface. At this moment, the molecules do not actually absorb on the interface. (ii) Macromolecules absorb on the interface. The molecules expose hydrophobic groups, and then the IFT values decrease. (iii) Protein rearranges at the interface. The changes in protein conformation at the O/W interface induce the complete exposure of hydrophobic groups. The absorption of proteins at the O/W interface is not only controlled by the diffusion processes but also absolutely necessary to the rearrangement as the molecules unfold. Commonly, more flexible proteins exhibit better interfacial properties, and the interfacial adsorption characteristics could be limited by the inherent rigid structure of proteins[38,39]. Precisely understanding the interfacial absorption mechanism is challenging, and the protein conformational changes at the O/W interface require further research. As shown in Fig. 3a, the IFT of MP, PPP, EPI, and SC decreased with time. This phenomenon could be explained by the fact that proteins underwent flexible stretching and long-lasting adsorption at the O/W interface, which is inline with the studies by Lian et. al[38]. The IFT values for all the protein groups decreased rapidly after 5 min, but slowly before the equilibrium was reached. In the initial measurement phase, the IFT value of SC was the lowest, whereas the value of MP was the highest. Nevertheless, at the end of the measurement, the order of IFT changed to PPP, EPI, MP, and SC, which corresponds with the results of H0. The initial values for the IFT of PPP, EPI, and MP ranged from 9.40 to 12.33 mN/m, with the final values of 1.75, 2.53, and 3.88 mN/m, respectively. The IFT values of PPP, EPI, and MP were all lower than that of SC (4.04 mN/m), and there was no significant difference between SC and MP.
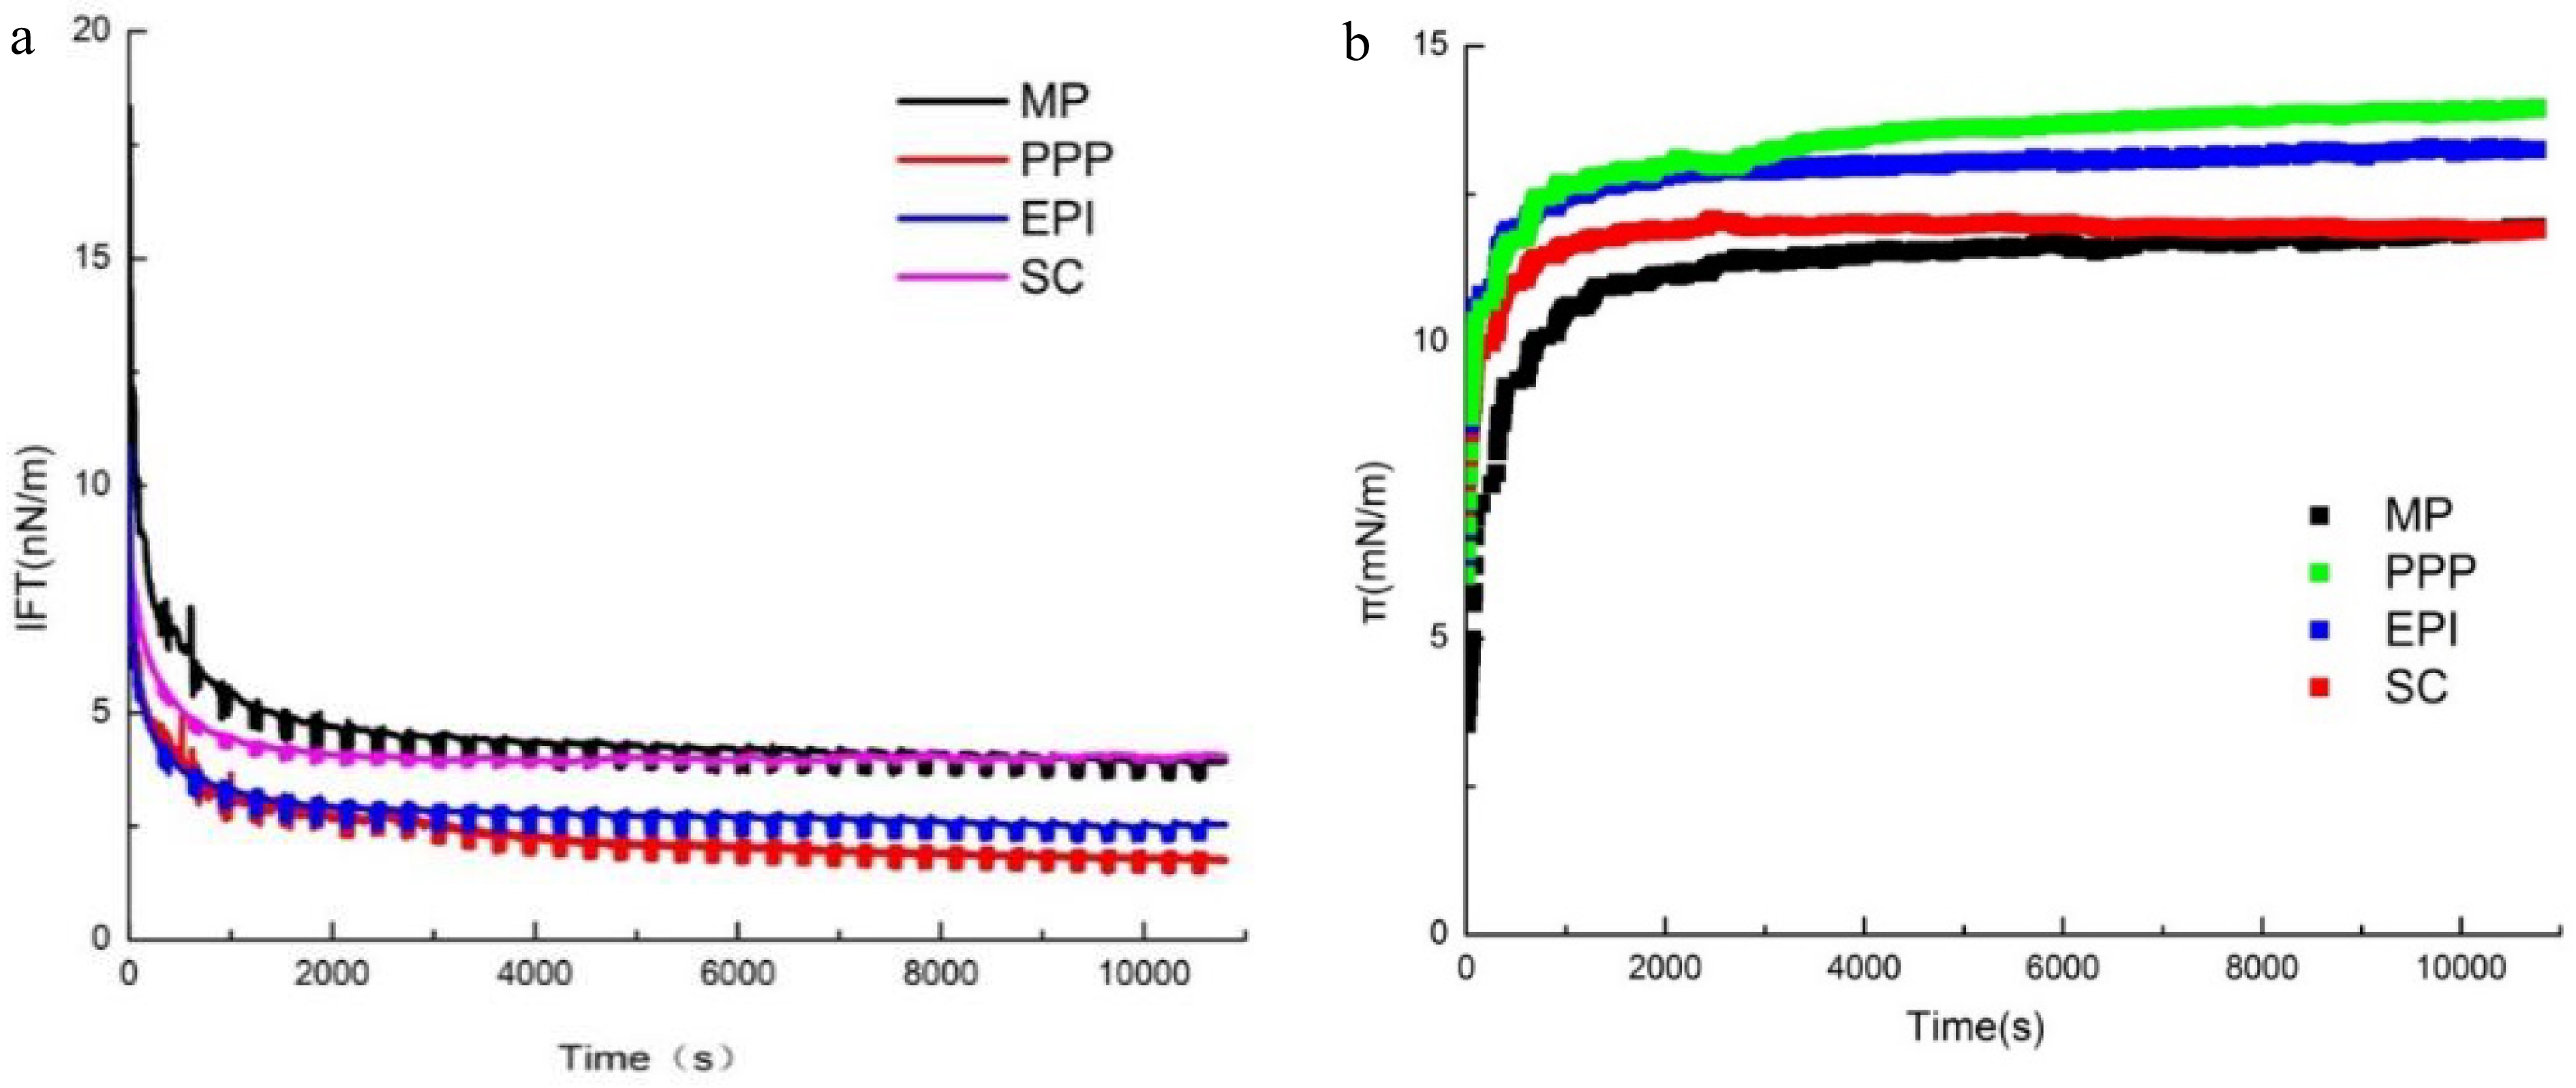
Figure 3.
(a) IFT and (b) dynamic interfacial pressure of O/W interface coated with different proteins (MP, PPP, EPI, and SC).
Dynamic interfacial pressure (π)
-
Figure 3b illustrates that the interfacial pressure (π) of the proteins (MP, PPP, EPI, SC) increased with adsorption time at the O/W interface. From 0 to 1,000 s, the π value increased rapidly. Subsequently, π increased slowly and achieved the relative equilibrium at the end of the experiment. The π value increased rapidly due to many available sites at the O/W interface for proteins to attach to. Then, the interfaces that were saturated with protein molecules induced the π value to reach the equilibrium, indicating a decrease in the adsorption rate owing to the presence of a surface pressure barrier and an electrostatic energy barrier. This process suggested that the protein molecules were absorbed constantly at the O/W interface, and finally the progress reached saturation[40]. As the absorption time extended, π increased with the increasing concentrations of interfacial proteins. π could not reach equilibrium until 1,000 s on account of the high molecular weight of the proteins. When the progress reached the relative equilibrium, the π values of PPP, EPI, SC, and MP decreased. The difference of the final π values of MP and SC was only 0.05 mN/m. The π values of the meat proteins (MP) and non-meat proteins (PPP, EPI, and SC) were significantly different at the beginning of the adsorption. In the first 2,000 s, the π of MP increased from 3.5 to about 11 mN/m. Meanwhile, the non-meat proteins increased in the range from 4.5 to 6 mN/m. The results of H0 showed that the increase rate of the π of MP in the initial stage was significantly higher than those of PPP, EPI, and SC, and this phenomenon might be affected by the hydrophobicity interaction and conformation flexibility of MP. The π values were different because of the diverse structural features of proteins. The adsorption behavior and structural changes of proteins at the O/W interface during the formation of emulsion are closely related to the IFT, the changes of IFT were coincident with the previous studies[38]. Within a certain range, the higher hydrophobicity and flexibility of the proteins made them easier to stretch and adsorb at the O/W interface and better emulsion stability. It could be explained by the previous studies that the changes in proteins conformation and interaction could decrease the energy barrier at the interfaces that proteins need to overcome during the actual adsorption[41].
Dynamic elastic modulus (Ed)
-
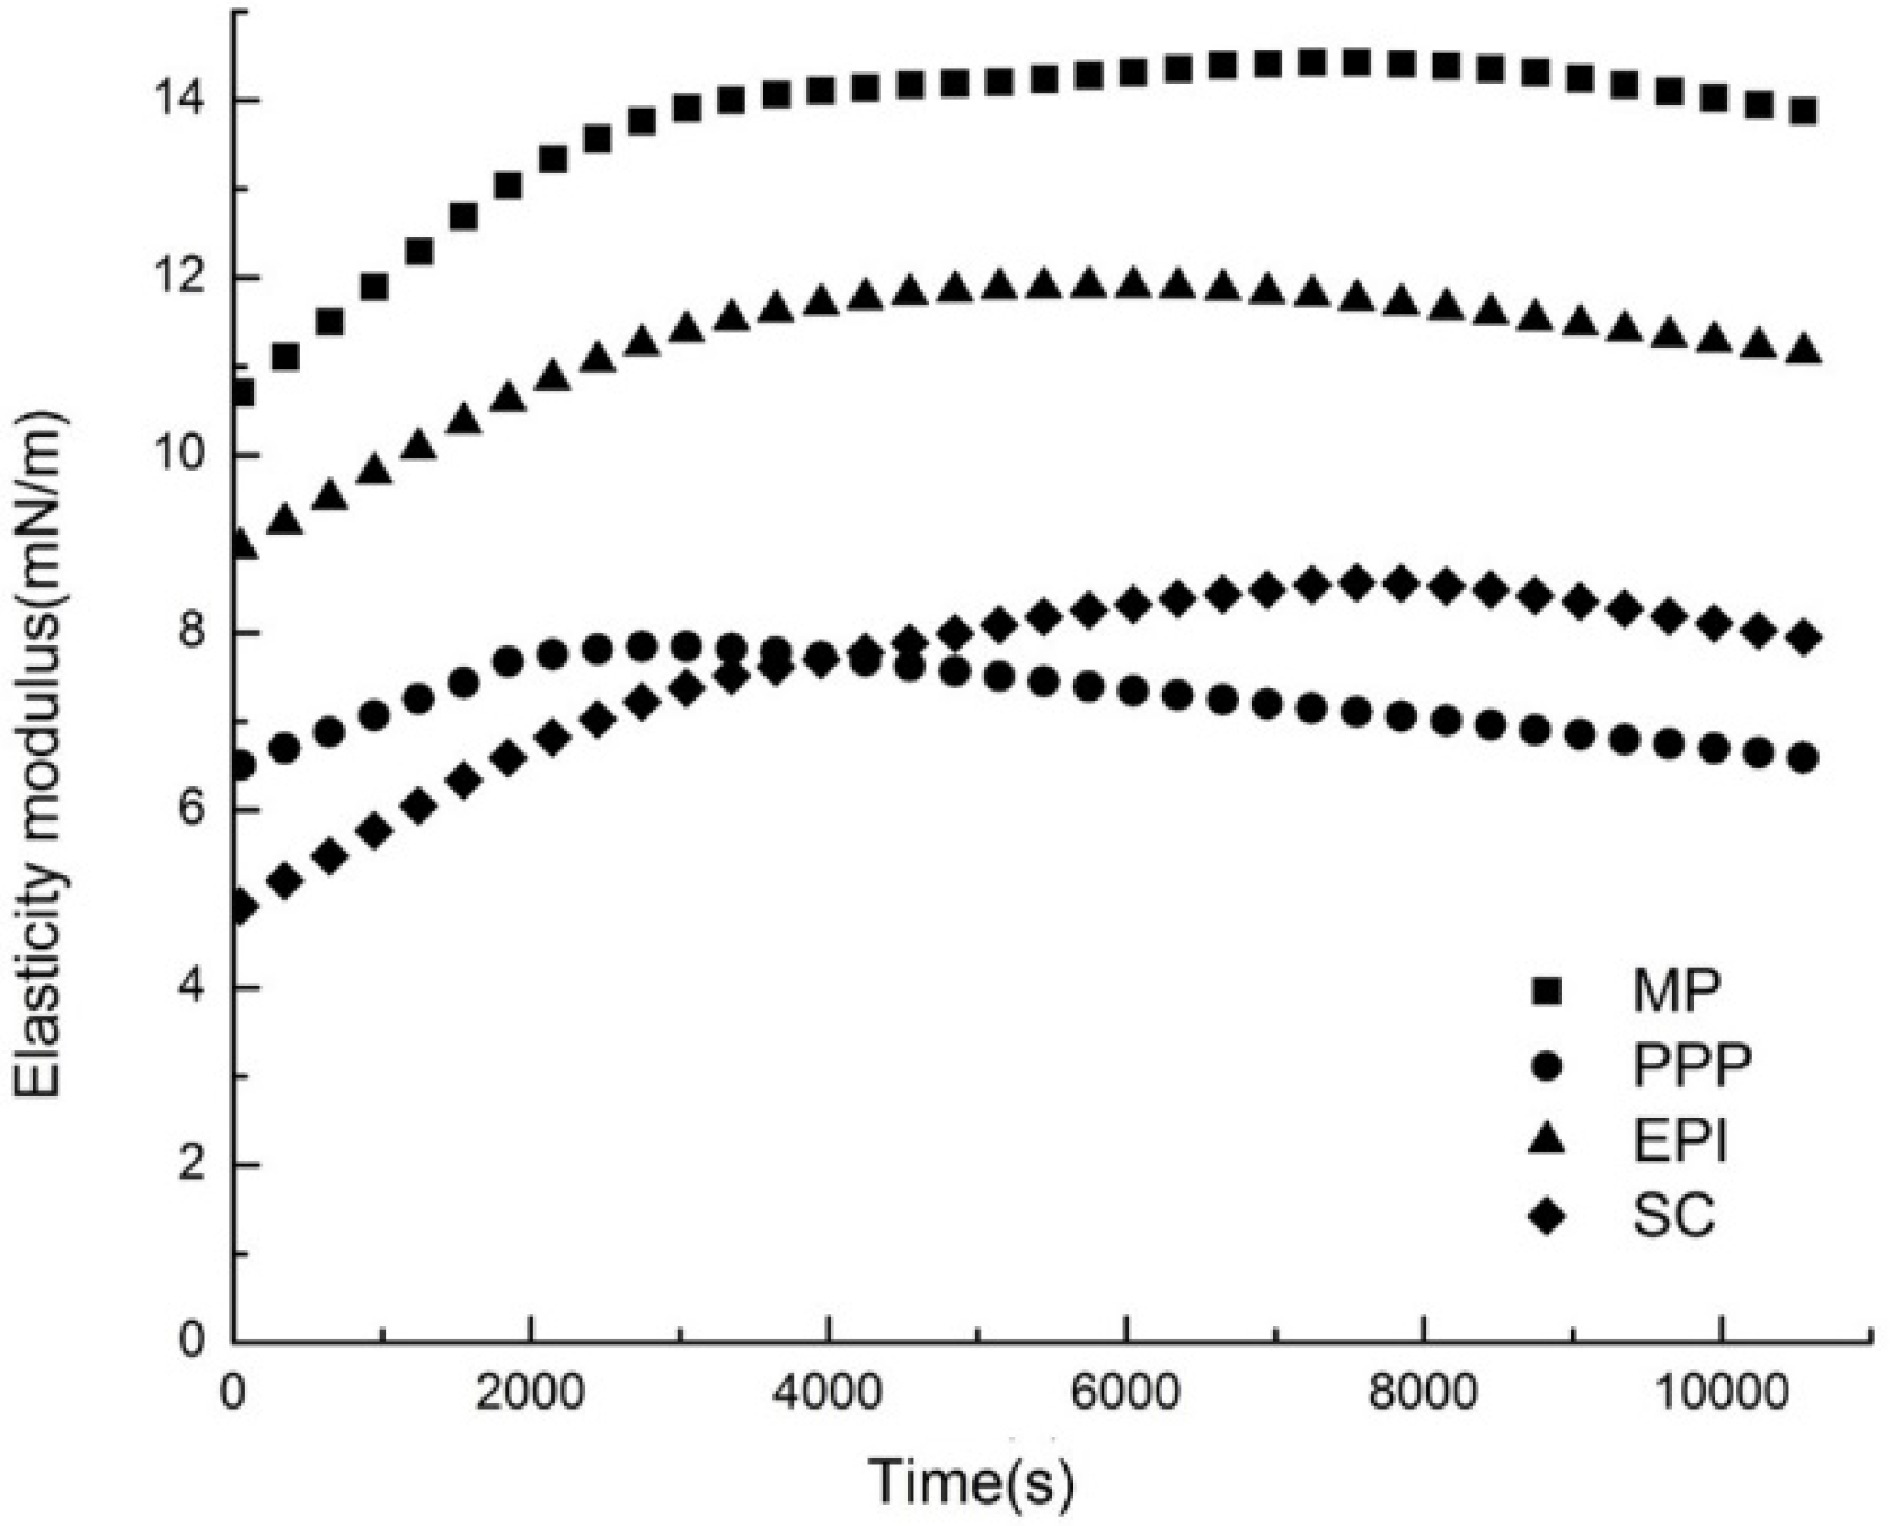
The interfacial rheological properties of proteins reflected the molecular structures and intermolecular interactions of adsorbed proteins at the O/W interface[42]. In all cases, the value of elastic modulus (Ed) gradually increased with time on account of a high number and strength interactions between protein molecules[43]. The appearance of maximum Ed indicated the transition of the interfacial film from the thin, almost 2D structure to the thick 3D structure, and the unfolding and rearrangement of proteins are extremely important during this period[41]. The Ed of different proteins (MP, PPP, EPI, and SC) is demonstrated in Fig. 4. When the oil droplets were compressed, the surfactants that had been adsorbed desorbed at the O/W interface. On the contrary, the surfactants reabsorbed at the O/W interface as the oil droplets expanded. In the oil or water phase, interfacial viscoelasticity properties could be measured by the pendent drop method[44]. In general, proteins unfold and rearrange as the adsorption process proceeds. At the same time, non-covalent bond interaction is produced by adjacent amino acid residues (i.e., hydrogen bond interaction, electrostatic interaction, and hydrophobic interaction) or cross-linking of covalent disulfide bonds, leading to molecular repolymerization and interface protein network formation[35]. The adsorbed layer exhibited certain viscoelastic properties. Because of the high molecular weight and complex structure of the proteins, the adsorption process at the O/W interface was complex and slow, and the equilibrium could not be reached within a few days. Figure 4 shows that the Ed of all proteins first increased and then decreased with increasing adsorption time. The time for MP and EPI to reach their maximum Ed values was 7,250 and 6,048 s, respectively, which was 3.72 and 2.94 mN/m higher than the initial values, respectively. SC was the slowest one, up to 7,548 s; the Ed value of SC increased from 4.92 to 8.56 mN/m. At 3,048 s, the Ed value of PPP reached the maximum of 7.84 mN/m, which was 2.32 mN/m higher than the initial value. The increasing value of Ed with the adsorption time confirmed that strong interactions occurred. As the adsorption time increased, the Ed of proteins decreased. π reached the saturation at this point, and protein adsorption and interactions would be inhibited as the adsorbed protein layers exceeded the O/W interface load[45]. The protein conformation, structures, and characteristic morphologies induced the difference in the interfacial films. The main probable reason for the decrease in Ed could be the existence of a compact packed layer after the adsorption of protein at the O/W interface. These results confirmed that the content of PPP was the first one to reach a dynamic saturation state at the O/W interface. A previous study discovered that globular lysozyme resisted compression with a high Ed value when it was adsorbed[46]. The aggregation and the low conformation flexibility of the protein induced low Ed of the interfacial film, thereby resulting in the mutual movement of the droplets, inducing an unstable emulsion. The high conformation flexibility of the proteins could be arranged into the O/W interface film with high Ed and keep the emulsion stable[32]. These findings of Ed indicated that the native-like conformations of MP facilitated the interactions of proteins and the excellent formation of interfacial films at the O/W interface.
Adsorption kinetics
-
The conformational changes in protein molecules have an important consequence for the adsorption kinetics. From the kinetic point of view, the adsorption of proteins that are from the liquid to the interface mainly goes through three processes[47]: (1) Diffusion process. The protein molecules diffuse to the interface. (2) Unfolding process. The protein molecules adsorb at the interface and subsequently unfold at the interface. The exposed hydrophobic bonds induce the interface tension decreases. (3) Rearrangement process. The protein molecules aggregate and rearrange with conformation changes at the interface and form an interfacial multilayer film[48].
At the beginning of the experiment, the concentration of the protein is relatively low at the O/W interface. The adsorption kinetics followed the change in π with increasing adsorption time, which was described using the modified Ward–Tordai diffusion model[37,49]:
$ \pi = 2{C_0} \times K \times T \times {\left(D \times \frac{1}{{3.14}}\right)^{\frac{1}{2}}} $ (1) where C0 is the initial concentration, K is the Boltzmann constant, T is the absolute temperature, and D is the diffusion coefficient.
The adsorption process at the O/W interface was governed by the diffusion interaction of proteins. The slope of the line was the diffusion rate constant that could be characterized with the diffusion rate of proteins. The diffusion rate of proteins at the interface was further influenced by the size and concentration of proteins. Table 1 presents that the diffusion rate (Kdiff) of MP was the fastest one (p < 0.05), indicating that MP could quickly diffuse from the bulk solution to the O/W interface and exhibited a greater interfacial activity than the non-meat proteins. More hydrophobic groups exposed on the O/W surface due to the high flexibility of MP, thereby reducing the energy barrier and facilitating the diffusion of proteins to the O/W interface. On the contrary, lower flexibility induced the hydrophobic groups to be buried inside the protein, thus limiting the diffusion of proteins to the O/W interface[50]. A previous study by Li et al.[50] indicated that enzymatic modifications could enhance protein interfacial adsorption properties and emulsifying properties by enhancing the flexibility and unfolding degree of protein. However, the Kdiff of SC was significantly lower than those of PPP, EPI, and MP. This result might be ascribed to the extremely high H0, which might lead to less surface activity, and SC needed more time to diffuse to the interface. The interfacial adsorption processes and stable emulsion need a more balanced polar and non-polar group distribution[51].
Table 1. The Kdiff of meat protein and non-meat proteins.
Protein Kdiff /mN·m−1·s−1/2 PPP 0.5549 ± 0.0084b EPI 0.5636 ± 0.0103b SC 0.2956 ± 0.0077c MP 0.5969 ± 0.0171a Values are means ± SD. Different letters (a-c) represent means of Kdiff in same line with differ significantly (p < 0.05). Dynamic aqueous phase rephase substitution
-
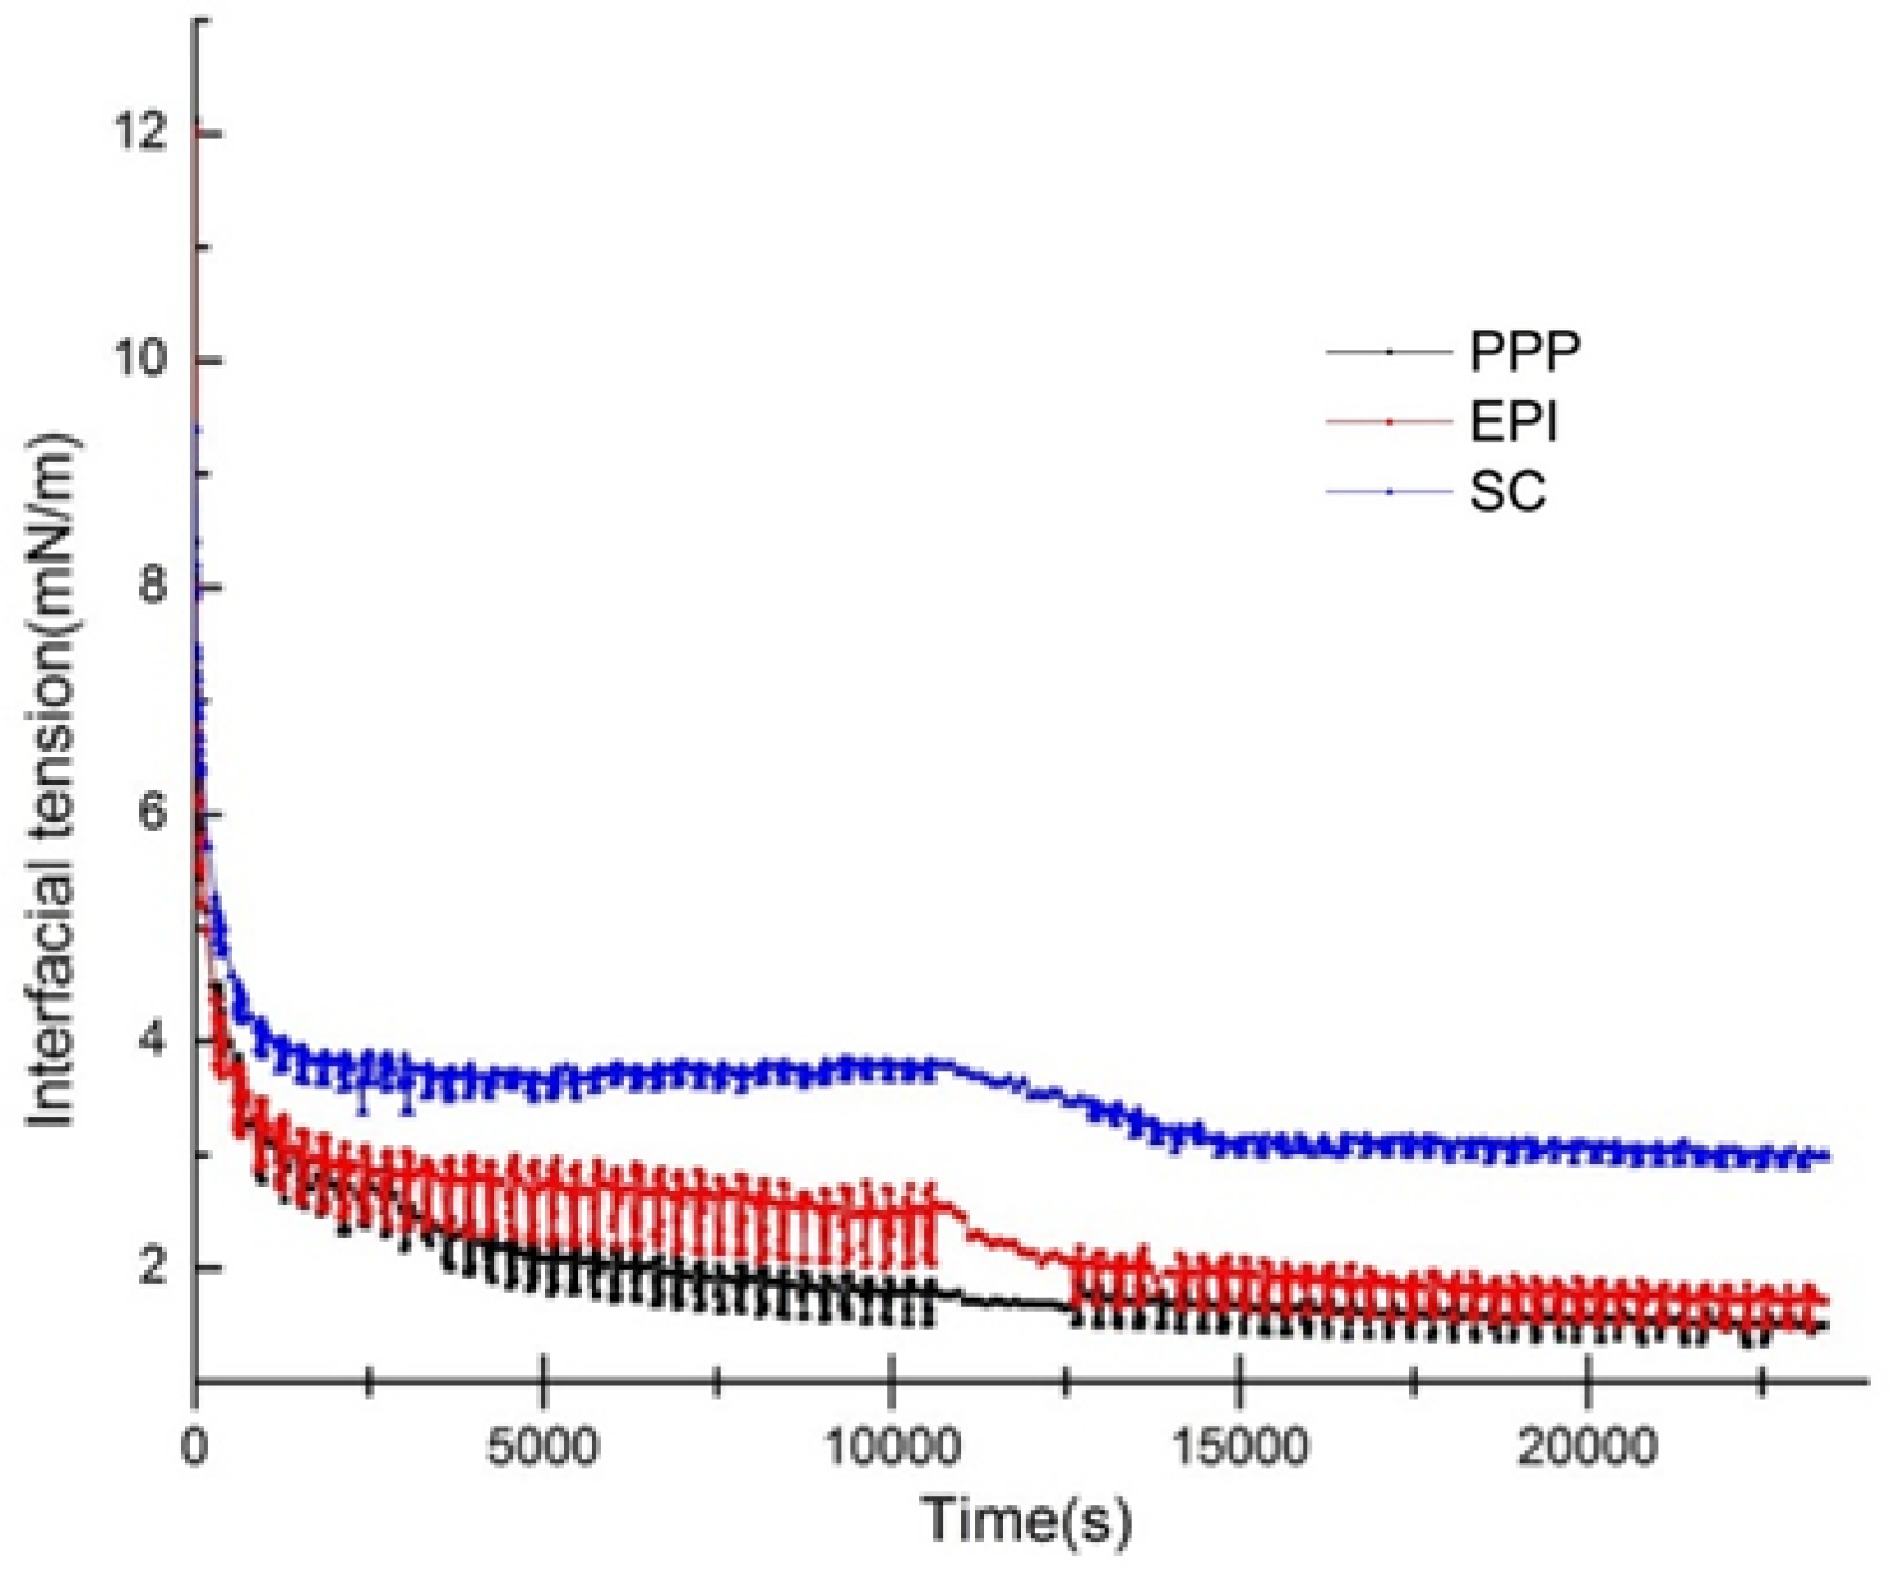
There is competitive adsorption in various proteins, such as SC or whey protein concentrate[52]. When two proteins are present in approximately equal amounts, the initially adsorbed protein molecules may be replaced by another protein with the dominant interfacial activity. This process is likely to be largely influenced by the interfacial adsorption rate and the available areas at the time of arrival at the interface. The IFT values of the non-meat proteins (PPP, EPI, and SC) that were exchanged with the meat protein (MP) were monitored in Fig. 5. This process can be used to represent the interaction between non-meat proteins and meat proteins at the O/W interface. When PPP, EPI, and SC were exchanged with MP, the IFT values decreased significantly from 1.76, 2.53, and 3.79 mN/m to 1.49, 1.71, and 2.99 mN/m, respectively (p < 0. 05). The final IFT values of PPP, EPI, and SC were lower than that of MP (3.88 mN/m), which indicated that the conformational rearrangement between non-meat proteins and meat proteins existed, and the adsorption processes of the non-meat proteins were reversible. After the replacement with MP, the non-meat proteins still adsorbed at the interface, only part of the proteins desorbed, and the structure of the interfacial film hardly changed[53]. The non-meat proteins (PPP, EPI, and SC) formed relatively rigid interfacial films on the O/W surface during the first 10,800 s. MP only exchanged a small amount of outer layer proteins. SC usually formed a concentrated inner and dispersive outer interface[54,55]. The possible reason for this result could be that the higher steric hindrance of MP led to weak spatial repulsion and tended to decrease the IFT compared with the relatively loose structure of SC. Consequently, MP partially displaced the incompact SC film and formed a more stable interfacial film with a low interfacial energy. Meanwhile, MP demonstrated high conformation flexibility and Kd, exhibiting a more favorable interfacial adsorption activity than non-meat proteins. Thus, MP could displace the non-meat proteins from the O/W surface and further decrease the IFT.
-
In this research, we reveal the mechanism by which MP affects the interfacial properties from the perspective of flexibility and elucidate the structural effect relationship between the protein confirmation and interfacial adsorption properties in comparison with non-meat proteins. First, the H0 and reactive R-SH content of MP were higher than those of PPP and EPI. Second, with the highest conformational flexibility and relatively high hydrophobicity made the excellent interfacial adsorption properties. The excellent interface elastic films of MP were formed at the O/W interface. Finally, the conformational rearrangement of the two proteins occurred indicating that the conformational changes of proteins could influence the interfacial properties. An essential extension of this research provided a theoretical basis for regulating the properties of protein-based emulsions from the protein’s conformation flexibility perspective in the formulation innovation of emulsified foods.
-
Chicken breast meat and soy oil were purchased at a local supermarket (Nanjing, Jiangsu, China). Before the experiment, the soy oil was purified without surface-active substances in accordance with the method of Gaonkar[56]. PPP powder (crude protein concentration ≥ 78%) was purchased from Tianjin Baodi Agri (Tianjin, China). SC powder (crude protein concentration ≥ 82%) was purchased from Jilin Houde Food (Jilin, China). EPI powder (crude protein concentration ≥ 81%) was purchased from Jiangsu Bomeida Biotech (Jiangsu, China).
MP extraction
-
The MP was extracted according to our previous study[57]. The MP concentration was determined with reference to bovine serum albumin using the Biuret method[58].
Preparation of samples
-
PPP, EPI, SC, and MP were dissolved in phosphoric buffer solution (PBS, 50 mM, pH 6.25) of 0.6 M NaCl. The final protein concentration was 4%. The samples were stirred at 4 °C overnight to mix fully.
H0
-
H0 was observed by 8-anilino-1-naphthalene sulphonic acid (ANS, 15 mM in 0.1 M PBS, pH 7) in accordance with a previous method of Guo et al.[59], with some modification. In short, 20 μL of the ANS was added to 4 mL of the protein sample solution (1 mg/mL). They were placed at 25 °C in a dark room for 20 min after being fully mixed, and the fluorescence spectra of the above samples were recorded through the SpectraMax M2 microplate reader (Molecular Devices Limited, San Francisco, CA, USA). The excitation wavelength was 375 nm and the emission wavelength ranged from 410 to 570 nm.
R–SH group
-
R-SH was conducted according to the previous method described by Ellman[60]. Twenty μL of 5,5-dithiobis-2-nitrobenzoic acid (DTNB) was added to 5 mL of each sample solution (2 mg/mL). All samples were incubated after mixing fully at 4 °C for 1 h. The absorbance of the above samples was determined at 412 nm through the SpectraMax M2 microplate reader.
Conformational flexibility
-
The conformation flexibility of proteins was monitored in accordance with the method of Kristinsson & Hultin[61], with some appropriate modifications. Briefly, 4 M Gu-HCl was added to the protein solution (MP, PPP, EPI, and SC). All prepared protein samples were stored at 5 °C, and the spectrum was determined using a microplate reader at different intervals (0, 30, 60, 90, and 120 min) with the wavelength range of 200–300 nm. On the basis of the 290 nm absorbance value change during 0–120 min, conformational flexibility was determined using Eqn (2); a larger percentage means higher protein flexibility.
${\rm{ Protein}}\;{\rm{flexibility}}=\frac{{OD}_{\max}-{OD}_{\min}}{{OD}_{0}}\times 100{\text{%}} $ (2) where OD0 is the initial absorbance at 290 nm, ODmax is the maximum absorbance at 290 nm, and ODmin is the minimum absorbance at 290 nm.
Interfacial properties
-
The dynamic IFT of different proteins was observed by a drop profile tensiometer (Teclis Tracker, France) in accordance with a modified method[13]. With an optical contact angle meter (OCA-25), the tension of different proteins at the purified soy O/W interface was evaluated. σ was calculated in accordance with the fundamental Laplace equation. Different protein solutions (0.1 mg/mL MP, PPP, EPI, and SC) loaded into a test cell rapidly. A 3 μL oil droplet was monitored for 180 min continuously to evaluate the interfacial adsorption of proteins. The π was expressed as π = σPBS−σ, where σPBS is the IFT of PBS, and σ is the IFT of proteins solution. The average of five periods (20 s in one period) was a measurement point. Each group was repeated five times at room temperature. Through combining dynamic drop analysis with the oscillating drop technique, the change in the Ed of different proteins with time was calculated.
Dynamic aqueous phase rephase substitution
-
In accordance with the method above, the IFT was monitored. The oscillation was stopped at 12,600 s, and non-meat protein solutions were replaced with an MP protein solution with a capillary before continuous testing. The above oscillation operations were repeated from 12,600 s until the end. The total test time was 23,400 s.
Statistical analysis
-
All experiments were replicated at least in triplicate. The results were reported as the mean ± SD of these measurements. Statistical analysis was determined by SAS with one-way ANOVA and Duncan’s multiple range tests (SAS Institute Inc., Cary, NC, USA), with p < 0.05 being considered statistically significant.
-
The authors declare that they have no conflict of interest.
-
These authors contributed equally: Ruying Cai, Zongyun Yang
- Copyright: © 2023 by the author(s). Published by Maximum Academic Press on behalf of Nanjing Agricultural University. This article is an open access article distributed under Creative Commons Attribution License (CC BY 4.0), visit https://creativecommons.org/licenses/by/4.0/.
-
About this article
Cite this article
Cai R, Yang Z, Li Z, Wang P, Xu X. 2023. Mechanism of the excellent oil/water interface elastic film formation ability of myofibrillar protein compared with typical non-meat protein. Food Materials Research 3:18 doi: 10.48130/FMR-2023-0018
Mechanism of the excellent oil/water interface elastic film formation ability of myofibrillar protein compared with typical non-meat protein
- Received: 25 February 2023
- Accepted: 27 April 2023
- Published online: 14 August 2023
Abstract: This paper focuses on the mechanism of the excellent oil/water (O/W) interface elastic film formation ability of meat protein (myofibrillar protein (MP)) compared with proteins (porcine plasma protein (PPP), egg-white protein isolate (EPI), and sodium caseinate (SC)). The conformation–effect mechanism was further analyzed between the conformational flexibility and the interfacial properties. The surface hydrophobicity (H0) and reactive sulfhydryl (R-SH) content of MP were higher than those of PPP and EPI. The conformation change rate results demonstrated that MP exhibited the best protein flexibility (p < 0.05). During dynamic interfacial tension (IFT) testing, among the four proteins, MP exhibited the highest diffusion rate (Kdiff) in the first phase of adsorption (p < 0.05), and it presented the strongest elastic modulus (Ed) of the interfacial film despite the relatively higher IFT. In addition, dynamic aqueous phase rephase substitution was conducted to replace PPP, EPI, and SC with MP to discover the O/W interfacial film restructuring ability induced by protein interaction. After the above three non-meat proteins were substituted with MP, the final IFT values decreased significantly (p < 0.05) compared with the corresponding values before substituting. In summary, the highest Kdiff, Ed values, and interfacial film restructuring ability for MP should be attributed to its highest conformational flexibility, excellent surface hydrophobicity, and relatively high R-SH content. These results provide a technical reference for the regulation of interfacial adsorption for protein conformation and the colloidal stability of protein products with applications in the food industry.
-
Key words:
- Myofibrillar protein /
- Interfacial properties /
- Flexibility /
- Oil/water interface


