ARTICLE   Open Access    

Transcriptome analysis revealed MAPK and hormone pathway involving in exogenous melatonin-regulated salt tolerance in sour jujube

  • # These authors contributed equally: Wenhui Zhu, Haonan Cao

More Information
  • Melatonin (MT) plays an important role in plant growth and development, and response to biotic and abiotic stresses. Salt stress is one of the major abiotic stresses affecting plant growth and distribution. Sour jujube mainly grows in mountainous sandy land and faces the threat of salt stress. Thus, to explore whether exogenous MT application could improve the salt stress tolerance of sour jujube and reveal the molecular mechanism behind it, the phenotypic and transcriptomic analyses of different concentrations of MT treatments prior to sodium chloride (NaCl) treatment to sour jujube was investigated. Firstly, exogenous MT treatment has a certain alleviating effect on salt stress induced damage of sour jujube. Transcriptome analysis showed that 6,292, 2,795, and 4,198 differentially expressed genes (DEGs) were identified in water treatment (W) vs 400 mmol/L NaCl treatment (Na), W vs 10 µmol/L MT plus 400 mmol/L NaCl treatment (MNa), and Na vs MNa comparative groups, respectively. KEGG enrichment analysis of DEGs showed that multiple metabolic pathways were involved in MT regulated effect on salt stress, including mitogen-activated protein kinase (MAPK) signaling pathway, phosphatidylinositol signaling system, and plant hormone signal transduction pathways etc. In addition, some transcription factor families, such as MYB, WRKY, and NAC, were also activated by exogenous MT treatment under salt stress. The results suggest that MT can improve the tolerance of sour jujube to salt stress mainly through the regulation of MAPK, hormone signaling pathways, and related transcription factors, which could lay the foundation for further study on the molecular mechanisms of how exogenous MT regulates salt stress tolerance in sour jujube.
  • Sweet cherries (Prunus avium L.) are a major focus of agriculture in the Okanagan region of British Columbia (BC), Canada. A large portion of the cherries grown in BC are exported and undergo up to four weeks of storage during transportation before delivery and consumption[1]. In 2022, sweet cherries accounted for 11.6% of the revenue of exported fruit from Canada and have an export value of nearly CAD$130 million[2]. As such, sweet cherry is an important fruit with high commercial importance for Canada. Although the application of cold storage is a necessary postharvest tool to maintain fruit quality up to consumption, there are preharvest factors that impact quality after longer-term storage. The work of Serrano et al.[3] noted that the maturity stage at harvest determined the fruit quality of sweet cherries after storage. For this reason, producers use several parameters to establish the optimum time for harvesting. Producers have long used colour as a marker for maturity, yet the concept of fruit dry matter (DM) at harvest affecting post-storage quality has advanced[46]. In fact, Toivonen et al.[6] developed a predictive model for 'Lapins' sweet cherry DM content using a visible/near-infrared spectrometer and noted its potential application to other cultivars to provide a rapid and non-destructive means of determining DM linked to cherry fruit quality. If sweet cherries are harvested at the wrong time or stored improperly during transit the quality of the cherries at their final destination does not compare to that at the time of harvest. Therefore, it is of the utmost importance to harvest cherries at their optimal time to ensure quality retention. Cherry fruits have minimal reserve carbohydrates so respiration relies primarily upon organic acids[7]. Additionally, cherries have a high susceptibility to physical damage making them highly perishable, so it is imperative to store them properly to maintain their flavour profile and overall quality[811]. Lower respiration rates help to maintain higher titratable acidity (TA) levels, thereby retaining flavour quality[11,12]. Decreased respiration rates are achieved through low-temperature storage and shipping.

    Previous research linking cherry fruit maturity to flavour quality indicated early-harvested cherries with low soluble solids (SS) levels showed low consumer acceptance due to perceived low sweetness, while late-harvested cherries showed low consumer acceptance due to poor texture[13,14]. This information underscores the challenge growers face when determining picking date. Additionally, once cherries are harvested, quality changes occur which include changes in the balance of SS to TA levels. Previous work has shown that SS levels remain relatively constant while malic acid levels (the predominant acid in sweet cherries) decreased by 20% when stored for 4 d at 20 °C[8,14]. Further, SS, TA, and the SS/TA ratio are key parameters in defining flavour quality[15] and consumer acceptance[14] as SS and TA have been reported to be measures of the cherry fruit attributes of sweetness, and sourness, respectively. Additionally, the SS/TA ratio is regarded as an overall taste attribute determining sweet cherry acceptability[14,16,17].

    Depending on cultivar and growing location, SS values for sweet cherries have been reported to range from 12.3 to 23.7 °Brix[14]. Rootstock and storage conditions have also been reported to affect SS, TA, and SS/TA values[18]. Depending on rootstock, for 'Regina' sweet cherries, harvest SS values ranged from 14.8 to 16.6 °Brix and TA values ranged from 5.7 to 7.4 g·L−1, while SS values after storage ranged from 14.6 to 18.2 °Brix and TA values ranged from 4.4 to 6.0 g·L−1. The harvest SS/TA ratio ranged from 2.0 to 2.91 and the SS/TA ratio after storage ranged from 2.47 to 3.77 depending on rootstock. Based on sensory studies using various cherry cultivars and breeding selections to gauge flavour quality and consumer acceptance, the optimal SS/TA ratio was reported to be between 1.5 and 2.0, with SS values ranging between 17 and 19 °Brix[19].

    Unfortunately, members of British Columbia's sweet cherry industry have noted that while their cherries arrive at their export locations with good condition in terms of appearance (i.e. firm, shiny, with green stems), issues have been reported concerning flavour. Poor flavour has been associated with lower levels of TA and lower oxygen in the storage atmosphere. Our previous work noted that BC cherry growers tend to pick their cherries at lighter colours in an attempt to harvest the crop as soon as possible to avoid any weather or pest issues and achieve the highest yield possible[1]. Staccato (SC) is a late maturing economically important cultivar with little research data available. It has been reported that SC cherries have a respiration rate that is negatively correlated with colour when collected between a 2 to 6 colour level as determined with CTFIL (Centre Technique Interprofessionnel des Fruit et Legumes, Paris, France) colour chips[1], which have been typically used as a marker of maturity. For SC cultivars, data showed the lowest respiration levels with cherries harvested at CTFIL colour standards 4-5, and may potentially have better flavour quality retention due to these lower respiration rates[1]. The aim of the work was to: 1) examine indicators of maturity/readiness for harvest (colour, SS, DM, TA, and the ratio of soluble solids to titratable acidity (SS/TA)); and 2) determine whether colour at harvest or other parameters (SS, TA, SS/TA, and DM) better predict flavour quality retention after storage.

    Sweetheart (SH), Staccato (SC), and Sentennial (SL) sweet cherries were sourced from research plots located at the Summerland Research and Development Center (SuRDC, Summerland, BC, Canada) in the Okanagan Valley region of British Columbia over three growing seasons (2018, 2019, and 2021). In the 2018 growing season, two cherry cultivars (SH and SC were collected, in the 2019 growing season, in response to BC Cherry Association interest, three cherry cultivars (SH, SC, and SL) were collected. Due to COVID, data was not collected during the 2020 growing season. In the 2021 growing season, full data (SS, TA, DM, and respiration rate) was only collected on the SC cherry cultivar, while DM and respiration values at harvest were also collected for SH and SL cultivars.

    To collect fruit at different maturity levels, cherry fruits were collected at three different color levels using the CTFIL (Centre Technique Interprofessionnel des Fruit et Legumes, Paris, France) colour standard series at three harvest dates for each cultivar which corresponded to the 3-4, 4-5, and 5-6 colour levels.

    To collect environmental data, two trees were chosen in each orchard block and Onset HOBO (Bourne, MA, USA) temperature and humidity loggers were mounted in these trees as described by Ross et al.[1] and captured data at 10 min intervals. The temperature and humidity data were used to calculate average temperature (AT), average high temperature (AHT), average low temperature (ALT), and average relative humidity (ARH) for 28 d preceding the cherry harvest date.

    Cherries were generally harvested before 11:00 h on each harvest day. Harvested cherries were transported back to the lab for sorting, sampling, and storage. Upon arrival, cherries were placed into a walk-in cooler at 0.5 °C to mimic rapid hydro-cooling capabilities that the industry uses. In the afternoon of each harvest day, cherries were removed from the cooler and sorted following British Columbia Tree Fruits Company protocol: (i) size was greater than 25.4 mm (< 10.5 row size); (ii) stemless cherries were removed; and (iii) cherries with defects such as blemishes, splits, pitting, disease (rot, fungi), hail damage and insect damage were removed. Again, the colour of the cherries was assessed using the CTFIL colour standard series. Based on the harvest period, cherries were separated into different colour levels: 3-4, 4-5, and 5-6. For each colour category, quality assessments (DM, SS, TA, SS/TA ratio, firmness, size, stem pull force, stem shrivel, stem browning, pitting, and pebbling) were performed before and after storage.

    Maintaining the quality of sweet cherries undergoing long distance ocean container shipment (up to 28 d/4 weeks) is important for securing a successful export market for Canadian sweet cherries and for ensuring that current market demand is met[1]. For cherries to be marketable after storage, they must pass several quality attributes. Attributes of firmness, size, stem pull force, stem shrivel, stem browning, pitting, and pebbling were assessed using previously described methods[1,20] to assess fruit quality at harvest and after storage for 28 d at 0.5 °C, ideal refrigerated storage temperature, for all cherry cultivars, and also storage for 28 d at 3 °C, non-ideal refrigerated storage temperature, for SC cherries. The values of these parameters are provided in Supplementary Tables S1S6. As the focus of this work was to examine how maturity level at harvest influenced the flavour quality of SC, SH, and SL sweet cherry cultivars, SS, DM, TA, and respiration rate values were the focus for discussion. Respiration analysis was performed using methods described by Ross et al. on freshly harvested cherries[1]. Rates of CO2 production were expressed as mg CO2 kg−1·h−1.

    DM of the cherries was determined using a Felix F750 handheld spectrometer (Felix Instruments, Inc., Camas, WA, USA) loaded with a valid model developed at the Summerland Research and Development Centre for cherries[6]. DM was measured on 25 fruits that were randomly selected from each sample replicate (i.e. 50 cherries). For SS and TA analyses, the methods of Ross et al.[1,20] were used to test 25 fruits that were randomly selected from each sample replicate (i.e. 50 cherries). Briefly, de-stemmed cherries were transferred into a 15.2 cm × 22.9 cm polyethylene Ziplock bag. The bag was left partially open, and the cherries were pressed by hand to obtain juice. The juice was strained and collected into 60 mL polypropylene screw cap containers. The resulting filtrate was tested for SS (°Brix), and TA (g·L−1 malic acid). For SS determination, the refractive indices of the solutions were observed in °Brix temperature-corrected mode on a digital refractometer (Mettler-Toledo, Refracto 30PX, 13/02, LXC13237, Japan). An automated titrator (Metrohm 848 Tritrino Plus; Mississauga, ON, Canada) was used to measure the TA of 10 mL of the juice with 65 mL distilled water to an endpoint of 8.1 with 0.1 mol·L−1 NaOH.

    At each colour level (3-4, 4-5, or 5-6) 10 kg of cherry samples were cooled to either 0.5 or 3 °C (for SC in 2021) and then packed into cardboard boxes with a polyethylene liner, an absorbent pad, and an iButton (Thermodata, Whitewater, WI, USA), which measured temperatures experienced by the cherries in the cardboard boxes during storage. After 28 d, the same quality assessment tests were performed to see if values varied throughout storage time at each temperature.

    Statistical analysis was conducted using SAS Institute Inc. software version 9.3 (SAS Institute, Cary, NC, USA). Data were subjected to a four-way analysis of variance (ANOVA) using the SAS PROC GLM procedure. The four factors tested were colour level (3-4, 4-5, and 5-6), cultivar (SH, SC, and SL), growing year (2018, 2019, and 2021), and time (harvest or storage (0.5 °C)). The significance of the main effects and interaction of the four factors was determined using Type III sum of squares via the ANOVA test. Additionally, ANOVA using the SAS PROC GLM procedure was performed on data collected for SC cultivar in the 2021 growing year to assess the influence on storage temperature (0.5 and 3 °C) on quality parameters. Statistical significance was determined by least significant difference (LSD) Fisher's test at 5% significance level. Principal Component Analysis (PCA) was performed using SAS version 9.3 PROC PRINCOMP (SAS Institute Inc., Cary, NC, USA) on data collected from the three cultivars over the tested growing years at three colour levels (i.e., up to nine samples per cultivar) and 10 variables for each investigation. Variables included: AT, AHT, ALT, ARH, colour at harvest (ColourH), SS at harvest (SSH), SS after 28 d of storage at 0.5 °C (SS05), TA at harvest (TAH), TA after 28 d of storage at 0.5 °C (TA05), and DM of cherry fruit at harvest (DMH). Microsoft Excel was used to generate PCA plots from the data provided by SAS. Only data available for every growing year were included in the PCA. Correlation coefficients were determined using Pearson's correlation coefficient statistical function in Excel (version 2306, Microsoft, Redmond, WA, USA). Histograms and frequency data were generated using the statistical function in Excel (version 2306, Microsoft, Redmond, WA, USA). Dry matter bin sizes of 1.5% increments were used to present and analyze the histogram and frequency data.

    Tables 14 present data on flavour attributes via values of soluble solids (SS), titratable acidity (TA), SS/TA ratio, and dry matter (DM) as affected by cultivar, growing year, storage and colour level at harvest and after storage, respectively. The most influential parameters in sweet cherry flavour have been found to be SS, TA, and the SS/TA ratio[15]. Additionally, SS and TA values have been found to be related to DM values in kiwis[2124], apples[25], and cherries[6,26]. DM is a measure of solids which includes both soluble sugars and acids along with insoluble structural carbohydrates and starch. Crisosto et al.[4] proposed using DM as an additional quality parameter as DM was determined not to change during cold storage[22]. Toivonen et al.[6] have performed research linking dry matter measurements with sweet cherry quality. As cold storage is also used to maintain cherry quality, assessing DM at harvest and upon storage was of relevance, and a key aspect of this work was to examine how DM values relate to sweet cherry respiration rates and cherry quality parameters.

    Table 1.  Soluble solids values as affected by cultivar, growing year, storage, and colour level at harvest.
    Cultivar Colour level Soluble solids (SS, °Brix)
    2018 2019 2021
    Harvest Storage (0.5 °C) Harvest Storage (0.5 °C) Harvest Storage (0.5 °C) [3 °C]
    Sweetheart 3-4 18.1aA1 17.7aA1 18.1aA1 18.2aA1
    4-5 20.0bA1 19.8bA1 19.4bA1 18.8bA1
    5-6 21.9cA1* 21.1cA1* 19.9bA1* 19.6cA1*
    Staccato 3-4 17.2aA2 17.2aA1 17.1aA2 17.2aA1 18.8aA* 18.9aA*
    18.4a
    4-5 17.8aA2 17.9aA2 18.3bA23 18.1bA1 19.9bA* 18.6aB
    18.9ab
    5-6 20.2bA2 17.9aB2* 20.2cA1 20.3cA13 20.1bA 19.5aA
    19.7b
    Sentennial 3-4 18.1aA1 18.1aA1
    4-5 18.9bA13 18.5aA1
    5-6 20.8cA2 20.6bA23
    Main effects Significance F-value Degrees of freedom
    Cultivar p < 0.0001 36.90 2
    Colour level p < 0.0001 125.76 2
    Year p < 0.0001 9.26 2
    Time (harvest or storage at 0.5 °C) p = 0.0002 13.68 1
    Colour differences: within common time and cultivar, values followed by different lower case letters indicate significant differences (p ≤ 0.05); Cultivar differences: within common colour level and time, values followed by different numbers indicate significant differences (p ≤ 0.05); Growing year differences: within common time, colour level and cultivar, values followed by * indicate significant differences (p ≤ 0.05); Storage differences (Harvest versus 0.5 °C storage): within common cultivar, colour level and growing year, values followed by different uppercase letter indicate significant differences (p ≤ 0.05); Temperature differences: within Staccato cultivar at 28 d storage and at common colour level, bolded values indicate significant differences (p ≤ 0.05) between storage temperatures (0.5 °C vs 3 °C). (N.B. no bolded values appear in this table).
     | Show Table
    DownLoad: CSV
    Table 2.  Titratable acidity values as affected by cultivar, growing year, storage and colour level at harvest.
    Cultivar Colour level Titratable acidity (TA, g·L−1 malic acid)
    2018 2019 2021
    Harvest Storage (0.5 °C) Harvest Storage (0.5 °C) Harvest Storage (0.5 °C) [3 °C]
    Sweetheart 3-4 8.99aA1* 7.11aB1* 7.31aA1* 6.31aB1*
    4-5 9.55bA1* 7.57bB1* 7.14aA1* 6.13aB1*
    5-6 10.56cA1* 8.57cB1* 7.56aA1* 6.50aB1*
    Staccato 3-4 8.53aA2* 6.65aB2* 6.96aA1* 5.51aB2* 12.0aA* 10.5aB*
    9.7a
    4-5 8.87abA2* 7.04bB2* 7.30aA1* 6.21bB1* 12.8aA* 10.2aB*
    9.3a
    5-6 8.91bA2* 6.91abB2 7.18aA1* 6.46bB1 10.6bA* 9.5b*
    8.5b
    Sentennial 3-4 9.21acA2 7.60aB3
    4-5 9.33aA2 7.89aB2
    5-6 8.79bcA2 7.66aB2
    Main effects Significance F-value Degrees of freedom
    Cultivar p < 0.0001 193.58 2
    Colour level p = 0.0023 5.49 2
    Year p < 0.0001 1,007.20 2
    Time (harvest or storage at 0.5 °C) p < 0.0001 474.18 1
    Colour differences: within common time and cultivar, values followed by different lower case letters indicate significant differences (p ≤ 0.05); Cultivar differences: within common colour level and time, values followed by different numbers indicate significant differences (p ≤ 0.05); Growing year differences: within common time, colour level and cultivar, values followed by * indicate significant differences (p ≤ 0.05); Storage differences (Harvest versus 0.5 °C storage): within common cultivar, colour level and growing year, values followed by different uppercase letter indicate significant differences (p ≤ 0.05); Temperature differences: within Staccato cultivar at 28 d storage and at common colour level, bolded values indicate significant differences (p ≤ 0.05) between storage temperatures (0.5 °C vs 3 °C).
     | Show Table
    DownLoad: CSV
    Table 3.  Soluble solids to titratable acidity ratio values as affected by cultivar, growing year, storage and colour level at harvest.
    Cultivar Colour level Soluble solids to titratable acidity ratio (SS/TA)
    2018 2019 2021
    Harvest Storage (0.5 °C) Harvest Storage (0.5 °C) Harvest Storage (0.5 °C) [3 °C]
    Sweetheart 3-4 2.02a1A* 2.49a1B* 2.49a1A* 2.78a1B*
    4-5 2.09a1A* 2.61a1B* 2.71b1A* 3.06b1B*
    5-6 2.07a1A* 2.46a1B* 2.63b1A* 3.02b1B*
    Staccato 3-4 2.01a1A* 2.58a1B* 2.46a1A* 3.11a2B* 1.57aA* 1.79aB*
    1.89a
    4-5 2.0a1A* 2.54a1B* 2.51a2A* 2.91b1B* 1.55aA* 1.83aB*
    2.04a
    5-6 2.27b2A* 2.58a1B* 2.81b1A* 3.14a1B* 1.89bA* 2.06bB*
    2.32b
    Sentennial 3-4 1.97a2A 2.38a3B
    4-5 2.02a3A 2.34a2B
    5-6 2.37b2A 2.69b2B
    Main effects Significance F-value Degrees of freedom
    Cultivar p < 0.0001 94.79 2
    Colour level p < 0.0001 22.04 2
    Year p < 0.0001 361.13 2
    Time (harvest or storage at 0.5 °C) p < 0.0001 134.15 1
    Colour differences: within common time and cultivar, values followed by different lower case letters indicate significant differences (p ≤ 0.05); Cultivar differences: within common colour level and time, values followed by different numbers indicate significant differences (p ≤ 0.05); Growing year differences: within common time, colour level and cultivar, values followed by * indicate significant differences (p ≤ 0.05); Storage differences (Harvest versus 0.5 °C storage): within common cultivar, colour level and growing year, values followed by different uppercase letter indicate significant differences (p ≤ 0.05); Temperature differences: within Staccato cultivar at 28 d storage and at common colour level, bolded values indicate significant differences (p ≤ 0.05) between storage temperatures (0.5 °C vs 3 °C).
     | Show Table
    DownLoad: CSV
    Table 4.  Dry matter values as affected by cultivar, growing year, storage and colour level at harvest.
    Cultivar Colour level Dry matter (DM, %)
    2018 2019 2021
    Harvest Storage (0.5 °C) Harvest Storage (0.5 °C) Harvest Storage (0.5 °C) [3 °C]
    Sweetheart 3-4 20.9aA1* 20.6aA1* 18.6aA1* 18.6aA1* 22.1aA1*
    4-5 21.9bA1 22.0bA1* 19.9bA1* 19.8acA1* 22.5bA1
    5-6 25.2cA1* 23.5cB1* 21.1cA1* 20.6bcA1* 23.6cA1*
    Staccato 3-4 20.2aA1* 19.5aA2* 18.4aA2* 18.1aA23* 21.0aA2* 20.6aA*
    19.8a
    4-5 20.4aA2* 20.8bA2* 19.1aA1* 18.8aA2* 22.0bA2* 21.6bA*
    21.9b
    5-6 22.4bA2 22.3cA2 22.9bA2* 21.6bA23 23.0cA2 22.2bA
    22.4b
    Sentennial 3-4 18.2aA2 18.4aA13 20.5aA2*
    4-5 19.3bA1 18.8bA2 22.6bA12*
    5-6 22.9cA2 20.9bA13 23.5cA12
    Main effects Significance F-value Degrees of freedom
    Cultivar p < 0.0001 11.36 2
    Colour level p < 0.0001 130.99 2
    Year p < 0.0001 56.64 2
    Time (harvest or storage at 0.5 °C) Not significant, p = 0.0922 2.97 1
    Colour differences: within common time and cultivar, values followed by different lower case letters indicate significant differences (p ≤ 0.05); Cultivar differences: within common colour level and time, values followed by different numbers indicate significant differences (p ≤ 0.05); Growing year differences: within common time, colour level and cultivar, values followed by * indicate significant differences (p ≤ 0.05); Storage differences (Harvest versus 0.5 °C storage): within common cultivar, colour level and growing year, values followed by different uppercase letter indicate significant differences (p ≤ 0.05); Temperature differences: within Staccato cultivar at 28 d storage and at common colour level, bolded values indicate significant differences (p ≤ 0.05) between storage temperatures (0.5 °C vs 3 °C). (N.B. no bolded values appear in this table).
     | Show Table
    DownLoad: CSV

    Data in Table 1 shows the SS levels at each colour level for each sweet cherry cultivar. Overall, SH cherries at harvest had ranges of 18.1%−21.9% over the 2018 and 2019 growing seasons. SC cherries at harvest had levels between 17.1%−20.2% over the three growing years (2018, 2019, and 2021), while SL cherries at harvest had levels of 18.1%−20.8% in 2019. Statistical analysis showed that the main effects of Cultivar (p < 0.0001; F-value = 36.90; degrees of freedom (df) = 2), Colour (p < 0.0001; F-value = 125.76, df = 2), Time (p = 0.0007; F-value = 13.68; df = 1), and Year (p < 0.0001; F-value = 9.26; df = 2) were all significant. Additionally, the interactions of Cultivar * Year (p < 0.0001, F-value = 26.37; df = 1), Colour * Year (p < 0.0069; F-value = 4.19; df = 4), Cultivar * Colour * Year (p < 0.0003; F-value = 10.28; df = 2) and Colour * Time * Year (p < 0.0131; F-value = 3.67; df = 4) were all significant.

    With respect to growing year differences, in 2018, SS levels in SH were greater than those of SC at all colour levels. In 2019, again at the 3-4 colour level SC, cherries exhibited lower SS levels than SH and SL cherries. At the 4-5 colour level, SH cherries again showed higher SS levels compared to SC cherries. At the 5-6 colour level, SL cherries showed higher SS levels compared to SC and SH, while SC and SH cherries showed comparable SS levels at the 5-6 colour level. The SS values of SC cherries at 3-4 and 4-5 colour levels from the 2021 growing year were higher than values observed at the same colour levels in 2018 and 2019 growing year samples. There was no difference observed in SS levels of SC cherries at the 5-6 colour level between growing years. The data shows that colour level, cultivar, and growing year all affected SS levels.

    Within cultivars, for SH in the 2018 growing season, as colour level increased, SS level increased. An increase in SS as colour at harvest increased for SH cultivar was reported by Puniran et al.[27]. In the 2019 growing year for SH cherries and in the 2021 growing year for SC cherries, SS levels plateaued at the 4-5 colour level. For SC (2018 and 2019 growing year) and SL cherries (2019 growing year) as colour level increased, SS level increased. Ross et al.[1] reported this same trend for SC cultivar on data collected from 2015, 2016, and 2017 growing years. This data demonstrates the influence of growing conditions on SS levels.

    In general the SS levels at each colour level for each sweet cherry cultivar did not change over the 28 d storage at 0.5 °C. It should be noted that SC cherries from the 2018 growing year at the 5-6 colour level and SC cherries from the 2021 growing year at the 4-5 colour level did show a significant (p ≤ 0.05) decrease in soluble solids after 28 d of storage at 0.5 °C. SS values for 2018 SC cherries at the 5-6 colour level harvest was 20.2 °Brix, while SS values after 28 day storage at 0.5 °C was 17.9 °Brix. SS values for 2021 SC cherries at the 4-5 colour level harvest was 19.9 °Brix, while SS values after 28 d of storage at 0.5 °C was 18.6 °Brix. In 2021 the effect of storage temperature (0.5 °C vs 3 °C) was investigated. SS levels in the SC cherries at the different colour levels were not affected by the different storage temperatures. This result was consistent with other findings[1,8,14], which suggested that under typical low temperature storage conditions and proper shipping conditions, the change in flavour profiles were likely not due to major changes in SS levels. It is important to note that Alique et al.[8] found that while SS values were consistent, the levels of glucose and fructose decreased by 13% and 10%, respectively, after 4 d under ambient conditions. It may be worth investigating if under a lower temperature environment, the levels of key monosaccharides would remain constant or change.

    This moves the focus of flavour retention to TA values. Table 2 shows the TA levels at each colour level for each sweet cherry cultivar. Statistical analysis showed that the main effects of Cultivar (p < 0.0001; F-value = 193.58; df = 2), Colour (p = 0.0023; F-value = 5.49, df = 2), Time (p < 0.0001; F-value = 474.18; df = 1), and Year (p < 0.0001; F-value = 1007.20; df = 2) were all significant. The interactions of Cultivar * Colour (p < 0.001; F-value = 5.81; df = 4); Cultivar * Year (p < 0.0001; F-value = 19.9; df = 1); Colour * Time (p = 0.0431; F-value = 3.44; df = 2); Colour * Year (p < 0.0001; F-value = 18.01; df = 4); Time * Year (p < 0.0001; F-value = 17.21; df = 2); Cultivar * Colour * Year (p = 0.0009; F-value = 8.63; df = 2); Colour * Time * Year (p = 0.0127; F-value = 3.70; df = 4) were all significant.

    SH cherries at harvest had TA value ranges of 8.99−10.56 g·L−1 in 2018, and 7.31−7.56 g·L−1 in 2019. In 2018, the highest TA value was at the 5-6 colour level for SH cherries, while for the 2019 SH cherries there was no difference between colour levels for the TA values. After storage SH cherries at the various colour levels showed TA levels of 7.11−8.57 g·L−1 and 6.31−6.50 g·L−1 for 2018 and 2019, respectively. Again the stored 2018 SH cherries at the 5-6 colour level showed the highest TA values, while the TA values for the stored 2019 SH cherries were not affected by colour level. SC cherries at harvest showed TA value ranges of 8.53−8.91 g·L−1 in 2018, 6.96−7.18 g·L−1 in 2019, and 10.6−12.8 g·L−1 in 2021. After storage SC cherries had lower TA values at all colour levels for all growing years. In 2018, 2019, and 2021, TA values for SC cherries after storage ranged from 6.65–7.04 g·L−1, 5.51−6.46 g·L−1 and 8.5−10.5 g·L−1, respectively. In 2021, for the SC cherries, the higher storage temperature (3 °C) resulted in a greater loss of TA values for all colour levels compared to the lower temperature of 0.5 °C. SL cherries at harvest had TA levels of 8.79−9.33 g·L−1 in 2019 and after storage at 0.5 C, TA values ranged from 7.60−7.89 g·L−1, with the highest value of TA at the 4-5 colour level. Therefore for all cultivars over all growing years, TA values decreased upon storage, which was expected. The data from Table 2 shows the magnitude of the decrease in TA values after storage varied by growing year. Additionally, trends for differences of TA magnitude change with respect to cultivar and colour level were not obvious. The magnitude of the decrease in TA values between harvest and storage was higher for the SC cherries stored at 3 °C compared to those stored at 0.5 °C.

    Comparing the effect of colour level on TA level within cultivar for SH cherries, TA values increased as colour level at harvest increased in 2018, but the trend did not continue in 2019, possibly due to different growing conditions such as orchard temperature and relative humidity values, which will be further discussed. For SC cherries, TA values peaked at the 4-5 colour level for 2018 and 2021 growing years, but were not significantly different between colour levels in 2019 (p ≤ 0.05). In the 2019 growing year, SL cherries also had the highest TA values at the 4-5 colour level. Comparing the effect of cultivar on TA level within comparable colour level, 2018 harvest SH cherries showed higher TA values than SC cherries. In the 2018 growing year, upon storage and at comparable colour level, SH cherries again showed higher TA values than SC cherries. In the 2019 harvest, SC cherries exhibited the same TA values as SH cherries, while SL cherries had higher TA values than SC and SH. In the 2019 growing year SL cherries harvested at the 3-4 colour level showed greater TA values after storage compared to SH and SC cherries; SC cherries had the lowest TA values at this colour level. When harvested at the 4-5 and 5-6 colour levels, SL cherries had higher TA values upon storage compared to SH and SC cherries.

    The data suggests that different cultivars tend to peak TA values, which may be affected by growing conditions/growing year and maturity level/colour level. This is further supported by the work of Miloševic & Miloševic[28] that indicated TA levels of sour cherries are affected by level of ripeness. Puniran et al.[27] also indicted that finding where peak TA values occur at harvest can help negate the decrease in values that occurs during storage and therefore promote flavour quality retention.

    In 2021 the effect of storage temperature (0.5 °C vs 3 °C) was investigated as 0.5 °C represents ideal storage temperature while 3 °C represents a storage temperature where quality deterioration would be promoted, and may be a more realistic temperature experienced during overseas/export shipping (personal communication, Dr. Peter Toivonen, May, 2021). TA levels in the SC cherries harvested at the different colour levels were affected by the different storage temperature as seen in Table 2. At common colour level, SC cherries from the 2021 growing season stored at 3 °C showed lower TA values than samples stored at 0.5 °C. The SC cherries at the 5-6 colour level stored at 3 °C showed the lowest TA values upon storage. As higher TA values are associated with flavour quality[11,12], the SC cherries harvested at the 5-6 colour level and stored at 3 °C would show poorer flavour quality.

    Table 3 shows the SS/TA ratio values as affected by cultivar, growing year, storage and colour level at harvest. Statistical analysis showed that the main effects of Cultivar (p = 0.0001; F-value = 94.79; df = 2), Colour (p < 0.0001; F-value = 22.04; df = 2), Time (p < 0.0001; F-value = 134.15; df = 1), and Year (p < 0.0001; F-value = 361.13; df = 2) were all significant. The interactions of Cultivar * Colour (p = 0.0009; F-value = 5.91; df = 4) and Time * Year (p = 0.0059; F-value = 5.95; df = 2) were significant. The SS/TA ratio values over all cultivars, colour levels and growing years ranged from 1.55 to 2.81 at harvest and 1.79 to 3.14 after storage at 0.5 °C for 28 d. SC cherries in the 2021 growing year were tested to determine the effect of storage temperature (0.5 or 3 °C) on flavour quality. The SS/TA ratio for the 2021 SC cherries stored at 0.5 °C for 28 d ranged from 1.79 to 2.06 while the SS/TA ratio for the 2021 SC cherries stored at 3 °C for 28 d ranged from 1.89 to 2.32. SS/TA ratios for the 3 °C stored cherries at the 4-5 and 5-6 colour levels were significantly higher (p ≤ 0.05) compared to corresponding SS/TA ratios for the 0.5 °C stored cherries at the 4-5 and 5-6 colour levels. Higher SS/TA ratio are due to lower TA values (data in Table 3) and impact flavour quality and therefore lower storage temperatures are preferable, which was expected.

    Comparing between growing years, for SH and SC cherries, the SS/TA ratio at harvest was higher in the 2019 growing year compared to the 2018 growing year. SC cherries from the 2021 growing year showed the lowest at harvest SS/TA ratio. Within cultivar, the SH cherries from the 2018 growing year showed no difference in harvest SS/TA ratio at the different colour levels. SH cherries from the 2019 growing year showed higher harvest SS/TA ratios at the 4-5 and 5-6 colour levels compared to the 3-4 colour level. The SC cherries at all growing years showed highest harvest SS/TA ratio levels at the 5-6 colour level and comparable harvest SS/TA ratio levels at the 3-4 and 4-5 colour levels. SL cherries also showed the highest harvest SS/TA ratio at the 5-6 colour level and comparable harvest SS/TA ratios at the 3-4 and 4-5 colour levels.

    Comparing cultivars at common colour level, in 2018 growing year SC cherries at the 5-6 colour level showed a higher harvest SS/TA ratio compared to SH cherries at the corresponding colour level. In the 2019 growing year SH and SC cherries showed higher harvest SS/TA ratios at the 3-4 colour level compared to SL cherries. At the 4-5 colour level, SH cherries showed the highest harvest SS/TA ratio value and SL cherries showed the lowest harvest SS/TA ratio value. At the 5-6 colour level, SH and SC cherries showed comparable SS/TA ratios while SL cherries showed the lowest SS/TA ratio.

    Overall, this data indicates that ensuring cherry flavour quality is complex as SS/TA ratio varied by growing year, colour level and cultivar. Comparing SS/TA ratio data for all cultivars over all growing years did not show an observable trend between colour level and SS/TA ratio. As such, colour is not a reliable indicator of flavor quality.

    Table 4 shows the DM values as affected by cultivar, growing year, storage and colour level at harvest. Statistical analysis showed that the main effects of Cultivar (p = 0.0001; F-value = 11.36; df = 2), Colour (p < 0.0001; F-value = 130.99; df = 2), and Year (p < 0.0001; F-value = 56.64; df = 2) were all significant. Notably, the main effect of Time (harvest vs stored) was not significant (p = 0.0922). The interactions of Cultivar * Year (p = 0.001; F-value = 6.45; df = 3); Colour * Year (p = 0.0004; F-value = 6.38; df = 4); Cultivar * Colour * Year (p = 0.0018; F-value = 4.64; df = 5) were all significant. Although SS and TA values were not obtained for all three cultivars in 2021, DM values at harvest were obtained for all three cultivars in 2021. Data in Table 4 show, in general, DM levels did not change over 28-d storage, which was expected. Additionally, data in Table 4 shows that in most cases, at common cultivar and colour level, DM values measured in 2021 were greater than DM values measured in 2018 and 2019 for all cultivars (SH, SC, and SL).

    Within each cultivar, over all growing years, the harvest DM values were significantly different (p < 0.05) at each colour level, except for SC cherries in the 2018 and 2019 growing years. 2018 and 2019 DM values were not significantly different from colour level 3-4 to colour level 4-5. At the 5-6 colour level, over all growing years, SH cherries showed higher DM values compared to dry matter values observed for SC cherries (p < 0.05). At the 3-4 colour level, over all growing seasons, the DM values for SL and SC cherries were not significantly different (p < 0.05). At the 4-5 colour level, over all growing seasons, the DM values for SL were not significantly different than the DM values exhibited by SH and SC cherries (p < 0.05). In 2021 the effect of storage temperature (0.5 °C vs 3 °C) was investigated. DM levels in the SC cherries at the different colour levels were not affected by the different storage temperature. Overall, DM levels ranged from 18.1 to 25.2 depending on cultivar, colour level, growing year, and storage.

    Figure 1ac shows the distribution of the three cherry cultivars relative to DM value ranges over all three growing years via histograms. Cherries at the same colour level did not all have the same DM; this was observed both within and between cultivars (Fig. 1ac). DM data, compiled over all available growing years, for each cultivar in the 3-4, 4-5, and 5-6 colour levels had considerable overlap. However, it is noted there is consistent shift to a higher DM at the 5-6 colour level.

    Figure 1.  Histogram representing distribution of dry matter data for: (a) Sweetheart (SH) cherries over the 2018, 2019, and 2021 growing years; (b) Staccato (SC) cherries over the 2018, 2019, and 2021 growing years; and (c) Sentennial (SL) cherries over the 2019 and 2021 growing years. For all parts, the 3-4 colour level is solid black, the 4-5 level is black stripes, and the 5-6 level is solid grey. On the horizontal axis different dry matter value (DM) ranges are shown via bins and on the vertical axis the frequency or proportion (%) of cherries within the DM bins/ranges are shown. Data was generated from two replicates of samples of 25 cherries (i.e. 50 cherries) from all available growing years.

    Over all growing years, DM values for SH cherries ranged from 14%−27%, 14%−28.5%, and 16.5%−33%, at the 3-4, 4-5, and 5-6 colour levels, respectively (Fig. 1a). SH cherries at the 3-4 and 4-5 colour levels showed the highest proportion (26% and 26%, respectively) of cherries resided in the 22.5 and 22.5% DM bins indicating the highest percentage of SH cherries in these colour levels exhibited a DM of 21% to 22.5%, while the highest proportion (21%) of cherries at the 5-6 colour level resided in the 24% DM bin indicating the highest percentage of SH cherries at this colour level exhibited a DM of 22.5% to 24% (Fig. 1a).

    For SC cherries over all growing years, DM values ranged from 14%−25.5%, 14%−30%, and 16.5%−30%, at the 3-4, 4-5, and 5-6 colour levels, respectively (Fig. 1b). SC cherries at the 3-4 colour level showed the highest proportion of cherries (27%) resided in the 19.5% DM bin which indicated the highest percentage of SC cherries at this colour level exhibited a DM of 18 to 19.5%. SC cherries at the 4-5 colour level showed the highest proportion of cherries (25%) resided in the in the 21% DM bin which indicated the highest percentage of SC cherries at this colour level exhibited a DM of 19.5% to 21 %. At the 5-6 colour level, the highest proportion (35%) of SC cherries resided in the 22.5% DM bin which indicated the highest percentage of SC cherries exhibited a DM of 21%−22.5% (Fig. 1b).

    Over the 2019 and 2021 growing years, SL cherries DM values ranged from 15%−25.5%, 15%−28.5%, and 16.5%−33% at the 3-4, 4-5 and 5-6 colour levels, respectively (Fig. 1c). SL cherries at the 3-4 colour level showed the highest proportion of cherries (36%) resided in the 21% DM bin which indicated the highest percentage of SL cherries at this colour level exhibited a DM of 19.5% to 21%. SL cherries at the 4-5 colour level showed the highest proportion of cherries (28%) resided in the in the 21% DM bin which indicated the highest percentage of SL cherries at this colour level exhibited a DM of 19.5% to 21 %. At the 5-6 colour level, the highest proportion (26%) of SC cherries resided in the 22.5% DM bin which indicated the highest percentage of SL cherries exhibited a DM of 21%−22.5% (Fig. 1c).

    In all, the data in Tables 14 and Fig. 1 indicate that colour is not a reliable indicator of maturity or flavor quality. Cherries of the same colour may differ in DM, SS, TA, and SS/TA ratio due to cultivar and growing conditions. The implication of these results are discussed in subsequent sections.

    Temperature, relative humidity and harvest date for the 2018, 2019, and 2021 growing years are detailed in Table 5. Environmental variations between years impacted colour development, which resulted in yearly variations in our harvest dates as cherry picks were based on cherry colour levels: 2018, July 16 to August 9; 2019, July 18 to August 6; and 2021, July 5 to July 27, nearly two weeks earlier than in previous years (Table 5). In terms of environmental data, the average temperature (AT), average high temperature (AHT), and average low temperature (ALT) values measured in 2021 were greater than the values determined in 2018 and 2019, while the average relative humidity (ARH) values determined in 2021 were lower than the values measured in 2018 and 2019 (Table 5). Depending on growing year and harvest date, average temperature values ranged from 17.17 to 24.28 °C, average high temperature values ranged from 28.59 to 50.68 °C, average low temperatures ranged from 7.17 to 10.68 °C, and average relative humidity values ranged from 40.68% to 66.16% (Table 5).

    Table 5.  Temperature and relative humidity environmental data for 2018, 2019, and 2021 growing years.
    Growing year Colour level Harvest date Average
    temperature
    (AT) (°C)
    Average relative humidity (ARH) Average low temperature (ALT) (°C) Average high temperature (AHT) (°C)
    2018 Sweetheart 3-4 July 16 18.96 61.5% 7.17 32.14
    4-5 July 23 18.85 59.8% 7.17 32.13
    5-6 July 30 20.45 56.85% 7.49 32.05
    Staccato 3-4 July 30 19.74 59.17% 7.42 32.04
    4-5 August 9 21.14 54.46% 7.42 32.77
    5-6 August 9 21.14 54.49% 7.42 32.77
    2018 overall average 20.05 57.71% 7.35 32.32
    2019 Sweetheart 3-4 July 18 17.86 66.04% 7.22 28.79
    4-5 July 24 18.39 66.1% 7.22 28.59
    5-6 July 24 18.39 66.1% 7.22 28.59
    Staccato 3-4 July 22 18.03 66.16% 7.22 28.59
    4-5 July 29 19.19 62.92% 8.67 29.39
    5-6 July 31 19.19 62.92% 8.67 29.39
    Sentennial 3-4 July 22 18.03 66.16% 7.22 28.59
    4-5 July 29 18.99 63.77% 8.67 29.39
    5-6 August 6 19.79 59.94% 8.67 29.39
    2019 overall average 18.87 63.65% 8.19 28.96
    2021 Sweetheart 3-4 July 5 24.01 40.68% 8.51 50.68
    4-5 July 12 24.28 40.68% 10.68 49.23
    5-6 July 20 24.10 40.68% 9.66 47.47
    Staccato 3-4 July 13 24.01 40.68% 8.51 50.68
    4-5 July 21 24.28 40.68% 10.68 49.23
    5-6 July 27 24.10 40.68% 9.66 47.47
    Sentennial 3-4 July 12 24.01 40.68% 8.51 50.68
    4-5 July 19 24.28 40.68% 10.68 49.23
    5-6 July 26 24.10 40.68% 9.66 47.47
    2021 overall average 24.12 40.68% 9.62 49.13
     | Show Table
    DownLoad: CSV

    Principal component analysis (PCA) was performed on all cultivars over all growing seasons to best resolve cultivar specific relationships between variables affecting flavour quality parameters: colour, DM, SS and TA (Fig. 2).

    Figure 2.  Principal component analysis (PCA) plot for: Sweetheart (SH) cherries with data from 2018 and 2019 growing years at the 3-4, 4-5, and 5-6 colours levels (SH34-2018, SH45-2018, SH56-2018, SH34-2019, SH45-2019, and SH56-2019; Staccato (SC) cherries with data from 2018, 2019 and 2021 growing years at the 3-4, 4-5, and 5-6 colour levels (SC34-2018, SC45-2018, SC56-2018, SC34-2019, SC45-2019, SC56-2019, SC34-2021, SC45-2021, and SC56-2021); and Sentennial (SL) cherries with data from 2019 growing year (SL34-2019, SL45-2019, and SL56-2019). PC1 and PC2 accounted for 84.75% variation. The variables include: average temperature (AT), average high temperature (AHT), average low temperature (ALT), average relative humidity (ARH), colour at harvest (ColourH), SS at harvest (SSH), SS after 28 d of storage at 0.5 °C (SS05), titratable acidity at harvest (TAH), titratable acidity after 28 d of storage at 0.5 °C (TA05) and dry matter of cherry fruit at harvest (DMH). Orchard growing factors, flavour quality attributes (loading factors), along with sweet cherry cultivars from each growing season (component scores) were presented as lines with arrows, lines with circles, and squares, respectively. Variables close to each other with small angles between them are strongly positively correlated; variables at right angles are likely not correlated; variables at large angles (close to 180°) are strongly negatively correlated.

    Figure 2 shows that principal components 1 and 2 described most of the variation (84.75%) in the model. SS at harvest (SSH) and SS at 28-d storage at 0.5 °C (SS05) along with DM at harvest (DMH) were positively correlated with colour at harvest (ColourH). TA at harvest (TAH) and TA at 28-d storage at 0.5 °C (TA05) were positively correlated with average high temperature (ATH). AHT, average low temperature (ALT) and average temperature (AT). DMH was more strongly correlated with TAH and TA05 compared to ColourH. TAH and TA05 were positively correlated, yet negatively correlated with average relative humidity (ARH). The 2021 SC samples at the 3-4, 4-5, and 5-6 colour levels (SC34-2021, SC45-2021, and SC56-2021) were clustered with TAH, TA05, ALT, AHT, and AT variables and located in a quadrant opposite of ARH. In late June 2021 a heatwave of unprecedented magnitude impacted the Pacific Northwest region of Canada and the United States; the Canadian national temperature record was broken with a new record temperature of 49.6 °C[29]. Also, the relative humidity levels during this period were also extremely low[30]. As the location of this study was impacted by this heatwave, the data shown in Table 6 shows higher temperatures and lower relative humidity values for the 2021 growing year. The TA values measured in the 2021 growing year were nearly two times the levels measured in the 2018 and 2019 growing years (Table 2). This shows an impact of growing conditions on flavor quality; both the negative correlation between ARH and TA and positive correlations of AT, AHT, and ALT with TA are notable. However, it is noted that correlation does not mean causation. The SH and SC cultivars from the 2018 growing year at the 5-6 colour level were clustered together, and were located in the same quadrant as ColourH, SSH, SS05, and DMH variables (Fig. 2). This indicates these samples were characterized by high values of SSH, SS05, and DMH. All cultivars at the 3-4 colour level from the 2018 (SH and SC), and 2019 (SH, SC, and SL) growing years along with all cultivars at the 4-5 colour level from the 2019 (SH, SC, and SL) growing year were clustered in quadrants opposite of the SSH, SS05, DMH, ColourH, TAH, and TA05 variables while near the ARH variable. The clustering of the samples indicates similarity and lower levels of SSH, SS05, DMH, TAH, and TA05.

    Table 6.  Average colour level and respiration rate of sweet cherries at harvest.
    Growing year Colour
    level
    Average colour measured at harvest
    [average dry matter at harvest]
    Dry matter bin (%), highest
    proportions of cherries
    Respiration rate (mg CO2 kg−1·h−1)
    assessed at 0.5, 5 or 10 °C
    0.5 °C 5 °C 10 °C
    2018 Sweetheart 3-4 3.74a1 [20.9%] 21, 38% 2.87a1 * 5.99a1* 9.75a1*
    4-5 4.66b1 [21.9%] 22.5, 38% 3.57b1* 5.53b1* 9.06a1*
    5-6 5.54c1 [25.2%] 25.5, 26% 3.50b1* 5.18b1* 9.58a1*
    Staccato 3-4 3.58a1 [20.2%] 19.5, 44% 4.43a2* 7.08a2* 9.90a1*
    4-5 4.62b1 [20.4%] 21, 36% 4.58a2* 8.05b2* 11.22b2*
    5-6 5.64c1 [22.4%] 22.5, 50% 4.12b2* 6.43c2* 9.78a1*
    2019 Sweetheart 3-4 3.76a1 [18.6%] 18, 26%; 19.5, 26% Nd 6.04 13.7
    4-5 4.42b1 [19.9%] 21, 32% Nd Nd 8.3
    5-6 5.42c1 [21.1%] 22.5, 28% Nd 6.95 13.5
    Staccato 3-4 3.46a1 [18.4%] 19.5, 32% Nd 5.8 12.47
    4-5 4.40b12 [19.1%] 19.5, 40% Nd 6.14 Nd
    5-6 5.40c1 [22.9%] 22.5, 26% Nd Nd Nd
    Sentennial 3-4 3.62a1 [18.2%] 18, 28% Nd 6.5 12.80
    4-5 4.22b2 [19.3%] 21, 40% Nd 3.76 Nd
    5-6 5.20c2 [22.9%] 22.5, 24% Nd Nd Nd
    2021 Sweetheart 3-4 Nd [22.1%] 22.5, 40% 3.18a1* 5.86a1* 8.8a1*
    4-5 Nd [22.5%] 22.5, 28% 2.78a1* 5.08b1* 8.1a1*
    5-6 Nd [23.6%] 24, 30% 2.65a1* 4.32c1* 9.19a1*
    Staccato 3-4 3.50a1 [21.0%] 19.5, 28% 2.72a1 4.65ab2 10.94a2*
    4-5 4.80b1 [22.0%] 21, 24%; 22.5, 20% 3.27a1* 4.38a2* 8.22b1*
    5-6 5.60c1 [23.0%] 24, 30% 3.05a1* 5.07b2* 9.57ab1*
    Sentennial 3-4 Nd [20.5%] 21, 48% 2.71a1* 4.77a2* 7.84a1*
    4-5 Nd [22.6%] 22.5, 28%; 24, 24% 2.78a1* 4.81a12* 8.28ab1*
    5-6 Nd [23.5%] 22.5, 28%; 24, 24% 4.23b2 4.47a12 9.88b1*
    Within common cultivar and growing year, values followed by different letters indicate significant differences (p ≤ 0.05)-shows colour differences; Within common colour level and growing year, values followed by different numbers indicate significant differences (p ≤ 0.05)-shows cultivar differences; Within common cultivar, growing year and colour level, values followed by * indicate significant differences (p ≤ 0.05)-shows respiration rate differences at the different temperatures. Due to incomplete data, statistical analysis was not performed on 2019 data. Nd = Actual colour was not calculated for Sweetheart and Sentennial cherries in 2021 although cherries were collected 3-4, 4-5, 5-6 colour levels as in previous years and can be considered to have colour levels of approximately 3.5, 4.5, and 5.5, respectively.
     | Show Table
    DownLoad: CSV

    High respiration rates have long been associated with rapid fruit quality deterioration[11]. Lower respiration rates help to maintain higher TA levels, thereby retaining flavour quality[11,12]. This work aimed to provide information on assessing whether rapid and non-invasive dry matter measurements can serve as a surrogate for respiration rate measurements and/or TA measurements to predict fruit quality as this information is essential for developing recommendations to optimize cherry quality retention upon long distance transport. Although it is well known that quality deteriorates more quickly in fruit with higher respiration rates, the respiration rate data for the SH, SC, and SL cherries was collected and analyzed with respect to the different colour levels and corresponding DM values to investigate a link between respiration rate and DM value. Examining the data with this perspective is very novel and additionally very little information on respiration rates is available for SC and SL sweet cherries cultivars in the literature.

    Table 6 shows the respiration rates for a) SH and b) SC cherries at different colour levels for the 2018 growing year and how they were affected by respiration rate assessment temperature (0.5, 5, and 10 °C). Table 6 also shows the respiration rates for a) SH, b) SC, and c) SL cherries at different colour levels for the 2021 growing year and how they are affected by respiration rate assessment temperature. Please note respiration data is incomplete for the 2019 growing year because of data constraints due to equipment difficulties and therefore no statistical analysis was performed on the available 2019 respiration data. As little information exists in the literature for SC and SL cherries, we have included the incomplete respiration data. Table 6 also shows average color data and average DM data for the cherries collected at the different colour levels. Additionally, Table 6 shows data on the DM (%) bins containing the highest proportion of cherries for each cultivar in each growing year at each colour level (histograms for each cultivar for individual growing year not shown).

    Table 6 shows the average colour measured for the cherries harvested at the 3-4, 4-5, and 5-6 colour levels all varied slightly depending on growing year and cultivar. In both the 2018 and 2019 growing years there was no difference in color levels between SH and SC at harvest. In the 2019 growing year, the SL cherries showed lower average colour values at the 4-5 and 5-6 colour levels compared to the average colour levels of SH and SC cherries at the same level. Nevertheless, results indicated the cherries were harvested and sorted to the desired colour levels. In 2021, average colour was not calculated for SH and SL cherries, although cherries were collected at the 3-4, 4-5, and 5-6 colour levels, as in previous years, and can be considered to have been within range. The average colour level was calculated for SC cherries in 2021, as SC cultivar received comprehensive study over all growing years (2018, 2019 and 2021). The calculated colour level values for SC cherries in the 2021 growing year at the 3-4, 4-5, and 5-6 colour levels were 3.5, 4.8, and 5.6, respectively.

    Table 6 shows the lower the respiration rate assessment temperature, the lower the respiration rate, which was expected as cherries are recommended to be stored at 0.5 °C to ensure quality retention due to this fact[1]. In 2018, SH respiration rate values were consistently lower than SC cherries at 0.5 and 5 °C. However, at 10 °C the respiration rate values become comparable between cultivars (Table 6). Comparing between colour level, SH at colour level 3-4 showed the lowest respiration rate at 0.5 °C but had the highest respiration rate when assessed at 5 °C (Table 6). While SC 5-6 cherries at the 5 °C respiration rate assessment temperature showed a significantly lower respiration rate compared to respiration rates measured for SC 3-4 and SC 4-5 cherries at 5 °C (Table 6).

    In 2021, SH and SC respiration rates were more comparable at 0.5 and 10 °C, but at 5 °C, SH respiration rates were higher than SC at the 3-4 and 4-5 colour levels while SC cherries showed a higher respiration rate when assessed at 5 °C compared to the SH cherries at the 5-6 colour level (Table 6). SH respiration rates in 2021 were consistent at 0.5 and 10 °C for all colour levels (Table 6). However, at 5 °C SH cherries at the 5-6 colour level had the lowest respiration rate for all three of the colour levels and the SH cherries at the 3-4 colour level showed the highest respiration rate. This occurred in both 2018 and 2021 (Table 6). The respiration rates of SC cherries were not affected by colour level when assessed at 0.5 °C, but at the 5 °C respiration rate assessment temperature, 2018 SC cherries at 5-6 colour level had lower respiration values (Table 6), while 2021 SC cherries at the 4-5 colour level showed a lower respiration rate value (Table 6). Comparing colour levels, SL cherries at the 5-6 colour level had the highest respiration rates at 0.5 and 10 °C (Table 6). However, at 5 °C, all SL colour levels had comparable respiration values (Table 6). Further, in 2021, all cultivars at 0.5 °C assessment temperature showed respiration rates that were comparable between all colour levels except for SL 5-6. This respiration rate value was significantly higher than the respiration rates measured for the SL 3-4 and 4-5 colour levels and was also higher than the respiration rates determined for SH and SC at the 5-6 colour level. Interestingly, the respiration rate assessed at 0.5 °C for SL at the 5-6 colour level was not significantly different than the respiration rate assessed at 5 °C for SL at the 5-6 colour level (Table 6).

    To further discuss the results presented above, a main source of decreasing TA values in cherries is high respiratory activity[11]. Therefore, linking flavour quality, which is affected by TA levels, to differences in respiration rates is reasonable. Higher respiration rate assessment temperatures were related to higher respiration rates of cherries as seen in Table 6, which was not unexpected and again points to the importance of keeping temperature near 0.5 °C during storage. Additionally, the temperature cherries experience during a growing season affects the respiration rate of the harvested fruit, as Ross et al.[1] found the average temperature and the average high temperature measured in an orchard was positively correlated with the cherry respiration rate at both 5 and 10 °C. Therefore, understanding factors that impact respiration rate, and ensuring cherries are harvested under conditions that ensure a low respiration rate is of significant importance. Table 6 (2021 data) suggests the colour level with the lowest respiration rates for SC cherries is 4-5, which is supported by previous work[1]. While Table 6 (2018 data) suggests the 5-6 colour level gives the lowest respiration rates for SC cherries. When this information is combined with the TA value data, the peak TA values for SC cherries occurs at the 4-5 level and 5-6 colour levels. SH cherries showed that for respiration rate assessed at 0.5 °C, the colour level with the consistently lowest respiration rate was 3-4, but at the 5 °C respiration rate assessment temperature, which is a more abusive temperature, the 5-6 colour level showed the lowest respiration rate in both 2018 and 2021. The highest TA values were seen at the 5-6 colour level for SH cherries. SL cherries show highest TA values at the 3-4 and 4-5 colour level in the 2019 growing year, but insufficient respiration rate data is available in 2019 to comment further. However, the data in Tables 14 indicate that colour is not a reliable indicator of maturity and/or flavor quality. Cherries of the same colour may differ in DM, SS and TA due to cultivar and growing conditions. Figure 1 shows that not all cherries at the same colour level are at the same DM both within and between cultivars. There is a range of DM values for each cultivar in the 3-4, 4-5, and 5-6 colour ranges. However, it is noted the distribution of DM shifted to the right (higher levels) in the 5-6 colour cherries. The work of Palmer et al.[25] and Toivonen et al.[6] have indicated the importance of DM as a fruit quality metric. The implications of colour, DM, and respiration rate results on flavour quality and DM standards are discussed below.

    Associations between colour and DM at harvest with sweet cherry flavour quality attributes and respiration rates were statistically examined using Pearson's correlation coefficient from all available data over all growing years to investigate whether there may be colour/DM levels that are associated with lower respiration rates (Table 7) and could be indicative of when harvest should be performed (i.e. maturity). It was found that colour at harvest was positively correlated with SS at harvest and SS after storage (r = 0.845, p ≤ 0.0005, and r = 0.684, p ≤ 0.005, respectively). Colour at harvest was also positively correlated with DM at harvest (r = 0.768, p ≤ 0.0005). This was expected as darker cherries of a certain cultivar are generally more developed or mature; sugar content (main contributor to DM) and TA increases upon fruit development[1,6,22]. Neither colour or DM at harvest were correlated with SS/TA ratio at harvest or after storage (Table 7). Over all cultivars, no correlation was seen between respiration rate at any assessment temperature and colour level (Table 7). No significant correlations were found between respiration rate assessed at 0.5 and 10 °C and DM (Table 7). A significant negative correlation (r = −0.514, p ≤ 0.025) was found between respiration rate at 5 °C and DM. It was speculated that a correlation between respiration rate and DM was not observed when assessed at 0.5 °C, as this temperature is very low and effectively slows metabolic activity regardless of physiological status of the cherry. No observed correlation between respiration rate assessed at 10 °C and DM was speculated to be due to 10 °C being such an abusive temperature that even physiologically healthy cherries show elevated respiration rates when stored at 10 °C, and likely experienced increased flavour quality deterioration, which could be tested by measuring SS and TA values. Over all cultivars at 5 °C, cherries with lower DM tended to have higher respiration rates, and may be susceptible to more rapid quality deterioration at non-ideal temperatures such as 3−5 °C, which can be encountered in the cherry industry, particularly during export shipping (personal communication, Dr. Peter Toivonen, May, 2021). This points to the importance of good temperature control during storage and diverting lower DM cherries to the domestic and/or rapid consumption market vs export market. Colour was not correlated with TA, while DM at harvest was positively correlated with TA at harvest and upon storage (Table 7), which is relevant for flavour quality. These results indicate that DM has a greater influence on flavour quality attributes than cherry colour.

    Table 7.  Correlations between colour and dry matter at harvest with sweet cherry flavour quality attributes and respiration rate.
    Relationship assessed for Sweetheart*,
    Staccato, and Sentennial**
    cultivars over 2018, 2019,
    and 2021 growing seasons
    Pearson's
    correlation
    coefficient
    Significance
    level
    (p value)
    Colour correlated with
    Soluble solids at harvest r = +0.845 p ≤ 0.0005
    Soluble solids at 28-d storage r = +0.684 p ≤ 0.005
    Dry matter at harvest r = +0.768 p ≤ 0.0005
    Dry matter correlated with
    Soluble solids at harvest r = +0.871 p ≤ 0.0005
    Soluble solids at 28-d storage r = +0.776 p ≤ 0.0005
    Colour at harvest r = +0.769 p ≤ 0.0005
    Titratable acidity at harvest r = +0.439 p ≤ 0.05
    Titratable acidity at 28 d storage r = +0.398 p ≤ 0.10
    Respiration rate at 5 °C r = −0.514 p ≤ 0.025
    Insignificant correlations
    Colour and titratable acidity at harvest r = +0.099 p = 0.696
    Colour and titratable acidity at 28 d storage r = +0.100 p = 0.692
    Colour and soluble solids to titratable
    acidity ratio at harvest
    r = +0.218 p = 0.383
    Colour and soluble solids to titratable
    acidity ratio at 28 d storage
    r = +0.073 p = 0.774
    Colour and respiration rate at 0.5 °C r = +0.252 p = 0.364
    Colour and respiration rate at 5 °C r = −0.206 p = 0.462
    Colour and respiration rate at 10 °C r = +0.084 p = 0.766
    Dry matter and soluble solids to titratable
    acidity ratio at harvest
    r = −0.135 p = 0.595
    Dry matter and soluble solids to titratable
    acidity ratio at 28 d storage
    r = −0.227 p = 0.365
    Dry matter and respiration rate at 0.5 °C r =−0.125 p = 0.657
    Dry matter and respiration rate at 10 °C r = −0.181 p = 0.519
    *Only 2018 and 2019 growing season data available; **only 2019 growing season data available.
     | Show Table
    DownLoad: CSV

    Further, specific cultivar respiration rate and DM relationships were also examined (data not shown). For SH cherries, a negative correlation was determined between respiration rate assessed at 5 °C and DM (p ≤ 0.1), yet this correlation was not seen for SL cherries. Based on statistical parameters SC cherries only showed a negative correlation between respiration rate assessed at 5 °C and DM if a higher p value > 0.1 was used which signifies evidence is not strong enough to suggest a relationship exists. Nevertheless, the statistically significant negative correlation between respiration rate assessed at 5 °C and DM over all cultivars was identified (Table 7).

    Although colour was positively correlated with DM (Table 7), a higher colour may not necessarily indicate a low respiration rate as no significant correlation was observed between colour and respiration rate at any assessment temperature when examined over all cultivars over the growing years tested. Although this highlights the importance of DM in overall quality rather than colour, the data presented thus far suggests certain cultivars achieve different optimal DM values or ranges at maturity that are related to quality retention. In general, higher DM is positive, but is there an upper limit/threshold in terms of higher respiration rate. The lack of correlation between respiration rate assessed at 5 °C and DM for SC and SL cherries seems to indicate a lower optimal DM level for these cultivars compared to SH cherries, as a negative correlation between respiration rate assessed at 5 °C and DM was observed for SH cherries. Again, non-ideal temperatures such as 3−5 °C, can be encountered in the cherry industry, particularly during export shipping, which makes these results extremely relevant to help ensure cherry growers deliver high quality fruit for the export market.

    In 2018, the respiration rate at 5 °C was lowest at the 4-5 and 5-6 colour levels for SH cherries, and the average DM values were ~22% and 25%, respectively. Information from Table 6 shows that 38% of SH fruit were in the 22.5% DM bin indicating the highest percentage of SH cherries at the 4-5 colour level had a DM of 21% to 22.5% while 26% of SH cherries at the 5-6 colour level resided in the 25.5% DM bin indicating the highest percentage of cherries at this colour level had a DM of 24% to 25.5%. For SH cherries in 2021, the lowest respiration rate at 5 °C was at the 5-6 colour level and average DM value was ~23.6%. Information from Table 6 shows that 30% of SH at the 5-6 colour level resided in 24% DM bin indicating the highest percentage of SH cherries at this colour level had a dry mater of 22.5% to 24%. For 2018 SH cherries, titratable acidity, which is important for flavour quality, was highest at the 5-6 colour level where respiration rate assessed at 5 °C was lower. These results imply, that at maturity, cherries tend to a certain DM value or range that corresponds to reduced respiratory activity and promotes quality retention, and would therefore be considered optimal. Based on this data (lower respiration rate (2018 and 2021) and peak TA (2018)), an optimal DM range for SH may be between 22.5%−25% DM or around 23% DM. This optimal DM corresponded to cherries in the 4-5 colour level (21.9%) in 2018, and in the 5-6 colour level (25.2%, 23.6% respectively) in 2018 and 2021.

    2018 respiration rate (assessed at 5 °C) was lowest at the 5-6 colour level for SC cherries and the average DM value was ~22%, respectively. Information from Table 6 shows that 50% of SC cherries resided in the 22.5% DM bin indicating the highest percentage of SC cherries at the 5-6 colour level had a DM of 21% to 22.5% The 2021 respiration rate (assessed at 5 °C) was lowest for SC cherries at the 4-5 colour level and average DM value was ~22% while the highest respiration rate was measured at the 5-6 colour level and the average DM value was ~23.0%. Information from Table 6 shows that 24% and 20% of SC cherries resided in each the 21% and 22.5% DM bins, respectively, indicating the highest percentage of SC cherries at the 4-5 colour level had a DM of 19.5% to 22.5%. For 2021 SC cherries, TA was higher at the 4-5 colour levels, where respiration rate assessed at 5 °C was lowest. Again, these results imply that at maturity cherries tends to a certain DM value or range (optimal) that corresponds to reduced respiratory activity and promotes quality retention. Based on this data (lower respiration rate (2018 and 2021) and peak TA (2018 and 2021)) an optimal DM range for SC may be between 19.5%−22.5% DM or around 22% DM. This optimal DM corresponded to cherries in the 4-5 colour level (22.0%) in 2021, and in the 5-6 colour level (22.4%) in 2018. The data also shows the optimal DM range for SH cherries is higher than the optimal DM range for SC cherries.

    In 2021, for the SL cherries, all colour levels showed the same respiration rate (assessed at 5 °C) and average DM values were 20.5%, 22.6% and 23.5% for the 3-4, 4-5 and 5-6 colour levels, respectively. Information from Table 6 shows that SL cherries at both the 4-5 and 5-6 colour levels, 28% and 24% of the cherries resided in the 22.5% and 24% DM bins indicting the highest percentage of cherries at these colour stages ranged from 21% to 24% DM. For SL, based on the one year of respiration data (2021), determining optimum DM was not as clear. At lower storage temperature (0.5 °C), lower average DM (20.5%−22.6% vs 23.5%) maintained lower respiration rates, but at higher storage temperature (5 and 10 °C) respiration rate did not appear to be affected by DM level. These lower DM values occurred at the 3-4 and 4-5 colour levels.

    Available DM, TA and respiration rate data as discussed suggests the optimal DM range for SH may be between 22.5%−25% DM or around 23% and an optimal dry matter range for SC may be between 19.5%−22.5% DM or around 22% DM, The histogram data over all growing years does further strengthen the justification for suggesting different optimal DM values for different cultivars (Fig. 1). The data over all growing years shows higher proportions of cherries in the 24 % DM bin for SH cherries at the 5-6 colour level which indicated highest proportion of cherries with a DM of 22.5% to 24%. The SC cherries at the 5-6 colour level showed the highest proportion of cherries in the 22.5% DM bin, which indicates the highest percentage of cherries have a DM of 21% to 22.5%; again these DM ranges have been suggested as optimal DM values based on previously discussed respiration data.

    In psychology self-actualization is a concept regarding the process by which an individual reaches their full potential[31]. The data suggests that sweet cherries self-actualize, with the majority of cherries reaching maturity with a DM range that promotes quality retention during storage when growing conditions are favourable. This optimal DM range is different for different cultivars, and growing conditions would be expected to influence the rate and/or ability of this 'self-actualization', as this work and our previous research has shown that environmental factors are correlated with these important quality characteristics[1]. Placing highest importance on distribution of DM levels at the 5-6 colour levels (Fig. 1) is justified as the cherries are the most physiologically mature and will likely exhibit the highest proportion of cherries with optimal DM; however, the optimal DM can occur at other colour ranges and should be used as the primary indicator of maturity. Maturity at harvest is the most important factor that determines storage-life and final fruit quality assweet cherries produce very small quantities of ethylene and do not respond to ethylene treatment; they need to be picked when fully ripe to ensure good flavour quality[32]. It is noted the CTFIL colour standard series goes up to colour level 7, yet a balance needs to be reached between flavour quality optimization vs other quality parameters such as firmness and stem pull force. Supplementary Tables S1S6 provide values of the quality parameters of firmness, stem pull force, stem shrivel, stem browning, pebbling and pitting levels at harvest and after storage for the SH, SC and SL cherries. All of these cherry cultivars exhibited good quality attributes at the 5-6 colour level, as well as lighter colour ranges.

    It is noted that the development of DM standards for different cultivars is a novel concept. This work was positioned as field work that collected cherry data for three cultivars over three growing years in adjacent orchards using the same management practices. Equipment constraints limited respiration rate data collection. As such absolute optimal DM values and/or ranges could not be determined nor was the goal of this study. The goal of this work was to further the concept that different cultivars may reach maturity at different DM levels, which would result in lower respiration rates and higher TA levels at harvest, and after storage, achieving enhanced quality retention. In this regard, absolute optimal DM would be the DM achievable by a cherry cultivar that maximizes flavour attributes and minimizes respiration under ideal conditions. In reality, the absolute optimal DM may or may not be reached during a growing season depending on environmental conditions and orchard management practices; however, cherry cultivars will reach a DM that will be optimal for the growing conditions at harvest maturity, as the present research demonstrates. Developing definitive DM standards to determine optimal harvest points for different cultivars under different environmental conditions should be a direction of research to be further pursued to ensure cherry quality, particularly for cherries subjected to longer term storage and/or cherries destined for the overseas export market.

    The present work is not the first to point to the importance of DM and cherry flavour retention, as an anecdotal report[33] indicated that SH cherries should be harvested at a DM of no higher than 20% or the fruit will lose both sugar and acidity more rapidly during shipping storage. Although this DM value is lower than the DM recommended for SH in the current work, it indicates the importance of DM level and flavour quality in relation to a specific cultivar. The differences between optimal DM for flavour retention in our work and the anecdotal report signifies the complexity of determining DM standards and the impact of growing year/environmental conditions and orchard management practices on optimal DM. Growers will continue to face these complex issues but the present work provides valuable information to growers regarding DM standards for three cultivars.

    It must be noted again that development of absolute DM standards for different cherry cultivars requires more study under rigorous controlled environmental conditions. Additionally, given the impact of environmental conditions on optimal DM, cultivars of interest must be studied over many growing years and orchard conditions to collect a robust data set. Nevertheless, the present research indicates that SH, SC, and SL cultivars have different dry matter values at maturity. The data also shows the DM range for SH cherries at maturity is higher than the DM range for SC cherries at maturity and that for SL, lower DM levels maintained lower respiration rates at lower temperatures, potentially improving ability to maintain quality after harvest.

    Overall, this research showed that DM was a better indicator of flavour quality than colour, as DM was related to both sugars and TA, while colour was only related to sugar. Therefore, this work identified that colour may not be a reliable indicator of maturity and/or flavor quality. This work indicated that cherries of the same colour may differ in DM, SS, and TA due to cultivar type and growing conditions as influenced by growing year. Relative humidity encountered by cherries during the growing season was negatively correlated with TA and higher growing temperatures were positively correlated with TA. This work discovered that sweet cherries may self-actualize, in that when growing conditions are favourable, DM levels may tend towards a certain level at maturity (optimal DM) resulting in superior flavour quality attributes and lower respiration, allowing cherries to reach their full quality potential and ensure quality retention in storage. Therefore, optimal DM can be reached at maturity despite colour. Remaining challenges include development of DM standards for various sweet cherry cultivars and further understanding the impact of growing conditions to better allow for self-actualization and prediction of the optimal DM under those conditions to optimize timing of harvest from year-to-year. Nevertheless, this research based on field work for three sweet cherry cultivars over three growing years, indicated an optimal DM range for SH between 22.5%−25% DM and an optimal DM range for SC between 19.5%−22.5% DM. Interestingly, under the same field conditions, the optimal DM range for SH cherries was higher than the optimal DM range for SC cherries. More analysis is required for determining optimal DM for SL, but the initial data indicates DM in the range of 20.5% to 22.6% maintained lower respiration rates at lower temperature potentially improving ability to maintain quality after harvest.

    The authors confirm contribution to the paper as follows: study conception and design: Ross KA, DeLury NC, Fukumoto L; data collection: Ross KA, DeLury NC, Fukumoto L; analysis and interpretation of results: Ross KA, DeLury NC, Fukumoto L; draft manuscript preparation: Ross KA, DeLury N, Fukumoto L, Forsyth JA. All authors reviewed the results and approved the final version of the manuscript.

    The datasets generated during and/or analysed during the current study are available from the corresponding author on reasonable request.

    We are grateful to the BC Cherry Association for financial support of this research project. We acknowledge Manon Gentes, Gillian Beaudry, and Duncan Robinson for their technical assistance. We are grateful to Brenda Lannard for providing her expertise on using the Felix F750 handheld spectrometer (Felix Instruments, Inc.) to obtain dry matter values and obtaining respiration data. Kelly A. Ross would like to thank and acknowledge Dr. Peter Toivonen for his mentorship, valuable scientific discussions and consistently kind support.

  • The authors declare that they have no conflict of interest.

  • Supplemental Fig. S1 Overall observation of phonotypical changes of sour jujube seedlings after192 h NaCl (a) and MT plus NaCl (b) treatments, respectively.
  • [1]

    Zamljen T, Medic A, Hudina M, Veberic R, Slatnar A. 2022. Salt stress differentially affects the primary and secondary metabolism of peppers (Capsicum annuum L.) according to the genotype, fruit part, and salinity level. Plants 11:853

    doi: 10.3390/plants11070853

    CrossRef   Google Scholar

    [2]

    Ma J, Wang Y, Wang L, Lin D, Yang Y. 2022. Transcriptomic analysis reveals the mechanism of the alleviation of salt stress by salicylic acid in pepper (Capsicum annuum L.). Molecular Biology Reports 50:3593−606

    doi: 10.1007/s11033-022-08064-y

    CrossRef   Google Scholar

    [3]

    Kumar A, Yadav A, Dhanda PS, Delta AK, Sharma M, et al. 2022. Salinity stress and the influence of bioinoculants on the morphological and biochemical characteristics of faba bean (Vicia faba L.). Sustainability 14:14656

    doi: 10.3390/su142114656

    CrossRef   Google Scholar

    [4]

    van Zelm E, Zhang Y, Testerink C. 2020. Salt tolerance mechanisms of plants. Annual Review of Plant Biology 71:403−33

    doi: 10.1146/annurev-arplant-050718-100005

    CrossRef   Google Scholar

    [5]

    Deinlein U, Stephan AB, Horie T, Luo W, Xu G, et al. 2014. Plant salt-tolerance mechanisms. Trends in Plant Science 19:371−79

    doi: 10.1016/j.tplants.2014.02.001

    CrossRef   Google Scholar

    [6]

    Zhu Y, Wang Q, Gao Z, Wang Y, Liu Y, et al. 2021. Analysis of phytohormone signal transduction in Sophora alopecuroides under salt stress. International Journal of Molecular Sciences 22:7313

    doi: 10.3390/ijms22147313

    CrossRef   Google Scholar

    [7]

    Wang G, Ren X, Liu J, Yang F, Wang Y, et al. 2019. Transcript profiling reveals an important role of cell wall remodeling and hormone signaling under salt stress in garlic. Plant Physiology and Biochemistry 135:87−98

    doi: 10.1016/j.plaphy.2018.11.033

    CrossRef   Google Scholar

    [8]

    Yue Y, Wang J, Ren W, Zhou Z, Long X, et al. 2022. Expression of genes related to plant hormone signal transduction in Jerusalem artichoke (Helianthus tuberosus L.) seedlings under salt stress. Agronomy 12:163

    doi: 10.3390/agronomy12010163

    CrossRef   Google Scholar

    [9]

    Dou J, Wang J, Tang Z, Yu J, Wu Y, et al. 2022. Application of exogenous melatonin improves tomato fruit quality by promoting the accumulation of primary and secondary metabolites. Foods 11:4097

    doi: 10.3390/foods11244097

    CrossRef   Google Scholar

    [10]

    Li Z, Zhang S, Xue J, Mu B, Song H, et al. 2022. Exogenous melatonin treatment induces disease resistance against Botrytis cinerea on post-harvest grapes by activating defence responses. Foods 11:2231

    doi: 10.3390/foods11152231

    CrossRef   Google Scholar

    [11]

    Li J, Yang Y, Sun K, Chen Y, Chen X, et al. 2019. Exogenous melatonin enhances cold, salt and drought stress tolerance by improving antioxidant defense in tea plant (Camellia sinensis (L.) O. kuntze). Molecules 24:1826

    doi: 10.3390/molecules24091826

    CrossRef   Google Scholar

    [12]

    Chen X, Sun C, Laborda P, He Y, Zhao Y, et al. 2019. Melatonin treatments reduce the pathogenicity and inhibit the growth of Xanthomonas oryzae pv. oryzicola. Plant Pathology 68:288−96

    doi: 10.1111/ppa.12954

    CrossRef   Google Scholar

    [13]

    Li J, Huang T, Xia M, Lu J, Xu X, et al. 2023. Exogenous melatonin mediates radish (Raphanus sativus) and Alternaria brassicae interaction in a dose-dependent manner. Frontiers in Plant Science 14:1126669

    doi: 10.3389/fpls.2023.1126669

    CrossRef   Google Scholar

    [14]

    Wang M, Gong J, Song C, Wang Z, Song S, et al. 2022. Exogenous melatonin alleviated growth inhibition and oxidative stress induced by drought stress in apple rootstock. BIOCELL 46:1763−70

    doi: 10.32604/biocell.2022.018934

    CrossRef   Google Scholar

    [15]

    Xia H, Ni Z, Pan D. 2017. Effects of exogenous melatonin on antioxidant capacity in Actinidia seedlings under salt stress. IOP Conference Series: Earth and Environmental Science 94:012024

    doi: 10.1088/1755-1315/94/1/012024

    CrossRef   Google Scholar

    [16]

    Liu J, Yue R, Si M, Wu M, Cong L, et al. 2019. Effects of exogenous application of melatonin on quality and sugar metabolism in 'zaosu' pear fruit. Journal of Plant Growth Regulation 38:1161−69

    doi: 10.1007/s00344-019-09921-0

    CrossRef   Google Scholar

    [17]

    Wang Y, Zhang J, Ma Q, Zhang X, Luo X, et al. 2022. Exogenous melatonin treatment on post-harvest jujube fruits maintains physicochemical qualities during extended cold storage. PeerJ 10:e14155

    doi: 10.7717/peerj.14155

    CrossRef   Google Scholar

    [18]

    Sun Y, Li M, Ji S, Cheng S, Zhou Q, et al. 2022. Effect of exogenous melatonin treatment on quality and softening of jujube fruit during storage. Journal of Food Processing and Preservation 46:e16662

    doi: 10.1111/jfpp.16662

    CrossRef   Google Scholar

    [19]

    Liu M, Wang J. 2019. Fruit scientific research in New China in the past 70 years: Chinese jujube. Journal of Fruit Science 36:1369−81

    doi: 10.13925/j.cnki.gsxb.Z11

    CrossRef   Google Scholar

    [20]

    Liu M, Wang J, Wang L, Liu P, Zhao J, et al. 2020. The historical and current research progress on jujube - a superfruit for the future. Horticulture Research 7:119

    doi: 10.1038/s41438-020-00346-5

    CrossRef   Google Scholar

    [21]

    Wu H, Su W, Shi M, Xue X, Ren H, et al. 2023. Genomic C-value variation analysis in jujube (Ziziphus jujuba mill.) in the middle Yellow River Basin. Plants 12:858

    doi: 10.3390/plants12040858

    CrossRef   Google Scholar

    [22]

    Hu X. 2021. Genetic diversity phylogeography and population demography of Ziziphus jujuba var. spinosa. Shanxi Agricultural University. https://doi.org/10.27285/d.cnki.gsxnu.2021.000007

    [23]

    Gao M, Wang L, Li M, Sun P, Sadeghnezhad E, et al. 2021. Physiological and transcriptome analysis accentuates microtubules and calcium signaling in Ziziphus jujuba Mill 'Dongzao' autotetraploids with sensitive cold tolerance. Scientia Horticulturae 285:110183

    doi: 10.1016/j.scienta.2021.110183

    CrossRef   Google Scholar

    [24]

    Langmead B, Salzberg SL. 2012. Fast gapped-read alignment with Bowtie 2. Nature Methods 9:357−59

    doi: 10.1038/nmeth.1923

    CrossRef   Google Scholar

    [25]

    Li B, Dewey CN. 2011. RSEM: accurate transcript quantification from RNA-Seq data with or without a reference genome. BMC Bioinformatics 12:323

    doi: 10.1186/1471-2105-12-323

    CrossRef   Google Scholar

    [26]

    Love MI, Huber W, Anders S. 2014. Moderated estimation of fold change and dispersion for RNA-seq data with DESeq2. Genome Biology 15:550

    doi: 10.1186/s13059-014-0550-8

    CrossRef   Google Scholar

    [27]

    McKenna A, Hanna M, Banks E, Sivachenko A, Cibulskis K, et al. 2010. The Genome Analysis Toolkit: a MapReduce framework for analyzing next-generation DNA sequencing data. Genome Research 20:1297−303

    doi: 10.1101/gr.107524.110

    CrossRef   Google Scholar

    [28]

    Shannon P, Markiel A, Ozier O, Baliga NS, Wang JT, et al. 2003. Cytoscape: a software environment for integrated models of biomolecular interaction networks. Genome Research 13:2498−504

    doi: 10.1101/gr.1239303

    CrossRef   Google Scholar

    [29]

    Tian F, Yang D, Meng Y, Jin J, Gao G. 2020. PlantRegMap: charting functional regulatory maps in plants. Nucleic Acids Research 48:D1104−D1113

    doi: 10.1093/nar/gkz1020

    CrossRef   Google Scholar

    [30]

    Jin J, Tian F, Yang D, Meng Y, Kong L, et al. 2017. PlantTFDB 4.0: toward a central hub for transcription factors and regulatory interactions in plants. Nucleic Acids Research 45:D1040−D1045

    doi: 10.1093/nar/gkw982

    CrossRef   Google Scholar

    [31]

    Zhao C, Yang M, Wu X, Wang Y, Zhang R. 2021. Physiological and transcriptomic analyses of the effects of exogenous melatonin on drought tolerance in maize (Zea mays L.). Plant Physiology and Biochemistry 168:128−42

    doi: 10.1016/j.plaphy.2021.09.044

    CrossRef   Google Scholar

    [32]

    Chen Y, Chen Y, Shi Z, Jin Y, Sun H, et al. 2019. Biosynthesis and signal transduction of ABA, JA, and BRs in response to drought stress of Kentucky bluegrass. International Journal of Molecular Sciences 20:1289

    doi: 10.3390/ijms20061289

    CrossRef   Google Scholar

    [33]

    Bachani J, Mahanty A, Aftab T, Kumar K. 2022. Insight into calcium signalling in salt stress response. South African Journal of Botany 151:1−8

    doi: 10.1016/j.sajb.2022.09.033

    CrossRef   Google Scholar

    [34]

    Shan X, Li Y, Jiang Y, Jiang Z, Hao W, et al. 2013. Transcriptome Profile Analysis of Maize Seedlings in Response to High-salinity, Drought and Cold Stresses by Deep Sequencing. Plant Molecular Biology Reporter 31:1485−91

    doi: 10.1007/s11105-013-0622-z

    CrossRef   Google Scholar

    [35]

    Wei J, Liang J, Liu D, Liu Y, Liu G, et al. 2022. Melatonin-induced physiology and transcriptome changes in banana seedlings under salt stress conditions. Frontiers in Plant Science 13:938262

    doi: 10.3389/fpls.2022.938262

    CrossRef   Google Scholar

    [36]

    Rushton PJ, Somssich IE, Ringler P, Shen QJ. 2010. WRKY transcription factors. Trends in Plant Science 15:247−58

    doi: 10.1016/j.tplants.2010.02.006

    CrossRef   Google Scholar

    [37]

    Mahmood K, El-Kereamy A, Kim SH, Nambara E, Rothstein SJ. 2016. ANAC032 positively regulates age-dependent and stress-induced senescence in Arabidopsis thaliana. Plant and Cell Physiology 57:2029−46

    doi: 10.1093/pcp/pcw120

    CrossRef   Google Scholar

    [38]

    Tan X, Long W, Zeng L, Ding X, Cheng Y, et al. 2019. Melatonin-induced transcriptome variation of rapeseed seedlings under salt stress. International Journal of Molecular Sciences 20:5355

    doi: 10.3390/ijms20215355

    CrossRef   Google Scholar

    [39]

    Das A, Singh S, Islam Z, Munshi AD, Behera TK, et al. 2022. Current progress in genetic and genomics-aided breeding for stress resistance in cucumber (Cucumis sativus L.). Scientia Horticulturae 300:111059

    doi: 10.1016/j.scienta.2022.111059

    CrossRef   Google Scholar

    [40]

    Brengi SH, Khedr AAEM, Abouelsaad IA. 2022. Effect of melatonin or cobalt on growth, yield and physiological responses of cucumber (Cucumis sativus L.) plants under salt stress. Journal of the Saudi Society of Agricultural Sciences 21:51−60

    doi: 10.1016/j.jssas.2021.06.012

    CrossRef   Google Scholar

    [41]

    Othman YA, Hani MB, Ayad JY, St Hilaire R. 2023. Salinity level influenced morpho-physiology and nutrient uptake of young citrus rootstocks. Heliyon 9:E13336

    doi: 10.1016/j.heliyon.2023.e13336

    CrossRef   Google Scholar

    [42]

    Simpson CR, Nelson SD, Melgar JC, Jifon J, King SR, et al. 2014. Growth response of grafted and ungrafted citrus trees to saline irrigation. Scientia Horticulturae 169:199−205

    doi: 10.1016/j.scienta.2014.02.020

    CrossRef   Google Scholar

    [43]

    Nawaz MA, Huang Y, Bie Z, Ahmed W, Reiter RJ, et al. 2015. Melatonin: current status and future perspectives in plant science. Frontiers in Plant Science 6:1230

    doi: 10.3389/fpls.2015.01230

    CrossRef   Google Scholar

    [44]

    Arnao MB, Hernández-Ruiz J. 2015. Functions of melatonin in plants: a review. Journal of Pineal Research 59:133−50

    doi: 10.1111/jpi.12253

    CrossRef   Google Scholar

    [45]

    Ahmad R, Manzoor M, Muhammad HMD, Altaf MA, Shakoor A. 2023. Exogenous melatonin spray enhances salinity tolerance in Zizyphus germplasm: a brief theory. Life 13:493

    doi: 10.3390/life13020493

    CrossRef   Google Scholar

    [46]

    Duan W, Lu B, Liu L, Meng Y, Ma X, et al. 2022. Effects of exogenous melatonin on root physiology, transcriptome and metabolome of cotton seedlings under salt stress. International Journal of Molecular Sciences 23:9456

    doi: 10.3390/ijms23169456

    CrossRef   Google Scholar

    [47]

    Li L, Shao T, Yang H, Chen M, Gao X, et al. 2017. The endogenous plant hormones and ratios regulate sugar and dry matter accumulation in Jerusalem artichoke in salt-soil. Science of The Total Environment 578:40−46

    doi: 10.1016/j.scitotenv.2016.06.075

    CrossRef   Google Scholar

    [48]

    Fahad S, Hussain S, Matloob A, Khan FA, Khaliq A, et al. 2015. Phytohormones and plant responses to salinity stress: a review. Plant Growth Regulation 75:391−404

    doi: 10.1007/s10725-014-0013-y

    CrossRef   Google Scholar

    [49]

    Yu Z, Duan X, Luo L, Dai S, Ding Z, et al. 2020. How plant hormones mediate salt stress responses. Trends in Plant Science 25:1117−30

    doi: 10.1016/j.tplants.2020.06.008

    CrossRef   Google Scholar

    [50]

    Umezawa T, Sugiyama N, Mizoguchi M, Hayashi S, Myouga F, et al. 2009. Type 2C protein phosphatases directly regulate abscisic acid-activated protein kinases in Arabidopsis. Proceedings of the National Academy of Sciences of the United States of America 106:17588−93

    doi: 10.1073/pnas.0907095106

    CrossRef   Google Scholar

    [51]

    Di T, Zhao L, Chen H, Qian W, Wang P, et al. 2019. Transcriptomic and metabolic insights into the distinctive effects of exogenous melatonin and gibberellin on terpenoid synthesis and plant hormone signal transduction pathway in Camellia sinensis. Journal of Agricultural and Food Chemistry 67:4689−99

    doi: 10.1021/acs.jafc.9b00503

    CrossRef   Google Scholar

    [52]

    Wang J, Qin H, Zhou S, Wei P, Zhang H, et al. 2020. The ubiquitin-binding protein OsDSK2a mediates seedling growth and salt responses by regulating gibberellin metabolism in rice. The Plant Cell 32:414−28

    doi: 10.1105/tpc.19.00593

    CrossRef   Google Scholar

    [53]

    Negi S, Bhakta S, Ganapathi TR, Tak H. 2023. MusaNAC29-like transcription factor improves stress tolerance through modulation of phytohormone content and expression of stress responsive genes. Plant Science 326:111507

    doi: 10.1016/j.plantsci.2022.111507

    CrossRef   Google Scholar

    [54]

    Wang X, Song Z, Ti Y, Liu Y, Li Q. 2022. Physiological response and transcriptome analysis of Prunus mume to early salt stress. Journal of Plant Biochemistry and Biotechnology 31:330−42

    doi: 10.1007/s13562-021-00680-2

    CrossRef   Google Scholar

    [55]

    Zhang X, Liu W, Lv Y, Bai J, Li T, et al. 2022. Comparative transcriptomics reveals new insights into melatonin-enhanced drought tolerance in naked oat seedlings. PeerJ 10:e13669

    doi: 10.7717/peerj.13669

    CrossRef   Google Scholar

    [56]

    Jing X, Cai C, Fan S, Wang L, Zeng X. 2019. Spatial and temporal calcium signaling and its physiological effects in moso bamboo under drought stress. Forests 10:224

    doi: 10.3390/f10030224

    CrossRef   Google Scholar

    [57]

    Baillo EH, Kimotho RN, Zhang Z, Xu P. 2019. Transcription factors associated with abiotic and biotic stress tolerance and their potential for crops improvement. Genes 10:771

    doi: 10.3390/genes10100771

    CrossRef   Google Scholar

    [58]

    Gao Y, Liu J, Yang F, Zhang G, Wang D, et al. 2020. The WRKY transcription factor WRKY8 promotes resistance to pathogen infection and mediates drought and salt stress tolerance in Solanum lycopersicum. Physiologia Plantarum 168:98−117

    doi: 10.1111/ppl.12978

    CrossRef   Google Scholar

  • Cite this article

    Zhu W, Cao H, Wang Q, Niu Y, Sadeghnezhad E, et al. 2023. Transcriptome analysis revealed MAPK and hormone pathway involving in exogenous melatonin-regulated salt tolerance in sour jujube. Fruit Research 3:19 doi: 10.48130/FruRes-2023-0019
    Zhu W, Cao H, Wang Q, Niu Y, Sadeghnezhad E, et al. 2023. Transcriptome analysis revealed MAPK and hormone pathway involving in exogenous melatonin-regulated salt tolerance in sour jujube. Fruit Research 3:19 doi: 10.48130/FruRes-2023-0019

Figures(10)  /  Tables(1)

Article Metrics

Article views(4247) PDF downloads(554)

ARTICLE   Open Access    

Transcriptome analysis revealed MAPK and hormone pathway involving in exogenous melatonin-regulated salt tolerance in sour jujube

Fruit Research  3 Article number: 19  (2023)  |  Cite this article

Abstract: Melatonin (MT) plays an important role in plant growth and development, and response to biotic and abiotic stresses. Salt stress is one of the major abiotic stresses affecting plant growth and distribution. Sour jujube mainly grows in mountainous sandy land and faces the threat of salt stress. Thus, to explore whether exogenous MT application could improve the salt stress tolerance of sour jujube and reveal the molecular mechanism behind it, the phenotypic and transcriptomic analyses of different concentrations of MT treatments prior to sodium chloride (NaCl) treatment to sour jujube was investigated. Firstly, exogenous MT treatment has a certain alleviating effect on salt stress induced damage of sour jujube. Transcriptome analysis showed that 6,292, 2,795, and 4,198 differentially expressed genes (DEGs) were identified in water treatment (W) vs 400 mmol/L NaCl treatment (Na), W vs 10 µmol/L MT plus 400 mmol/L NaCl treatment (MNa), and Na vs MNa comparative groups, respectively. KEGG enrichment analysis of DEGs showed that multiple metabolic pathways were involved in MT regulated effect on salt stress, including mitogen-activated protein kinase (MAPK) signaling pathway, phosphatidylinositol signaling system, and plant hormone signal transduction pathways etc. In addition, some transcription factor families, such as MYB, WRKY, and NAC, were also activated by exogenous MT treatment under salt stress. The results suggest that MT can improve the tolerance of sour jujube to salt stress mainly through the regulation of MAPK, hormone signaling pathways, and related transcription factors, which could lay the foundation for further study on the molecular mechanisms of how exogenous MT regulates salt stress tolerance in sour jujube.

    • Abiotic stresses widely affect plant growth and development[1]. Salt stress is one of major abiotic stresses which affects plant cellular and physiological changes, resulting in ion imbalances and toxicity[2], causing osmotic stress, reducing nutrient balance, stomatal activity, hydraulic conductivity, and ability of photosynthesis[3]. Thus, to survive, plants must respond in a timely manner to improve their adaptation and tolerance to salt stress. However, the process of adaptation is complex, with changes in gene expression, proteins, and metabolites, etc[4, 5]. In addition, the hormones maintain a balance between normal growth and resistance of plants under salt stress by interacting with each other[6], and changes of plant hormone-related signaling and regulatory pathways affect plant adaptation to salt stress[7], which involves significant changes in specific transcription factors and expression of related genes[8]. Therefore, hormones play an important role in response to salt stress.

      Melatonin (MT) is an important class of indole-like compound that are widely existed in animals[9]. In higher plants, the content of it is in minute amounts but varies in different tissue organs[10]. Recently, the function of exogenous application of MT has been widely studied in tree plants, including regulation of flowering, fruit quality, stress resistance, etc. Among them, the most widely studied is that MT plays a critical role in response to both biotic and abiotic stresses[1113]. For example, exogenous treatment of MT could reduce drought-induced growth inhibition and the production of superoxide (O2) and hydrogen peroxide (H2O2) in apple rootstocks with alleviating damage to photosynthesis by protecting the integrity of membranes[14]. In addition, application of exogenous MT could significantly increase the accumulation of antioxidant substances which enlarge the antioxidant capacity of mitigating the oxidative damage caused by salt stress[15]. In pear, MT could increase the maximum photosynthetic rate in the later stage of fruit development by increasing the content of soluble sugar[16]. In jujube, during the process of cold storage, application of exogenous MT could delay the degradation of jujube fruit nutrients by inhibiting the related enzyme activity and gene expression, and improve the antioxidant capacity to maintain the quality of postharvest jujube fruits[17, 18].

      Jujube (Ziziphus jujuba Mill.) is native to China, belonging to the Ziziphus (Ziziphus Mill.) genus in the family of Rhamnaceae, and has important economic and ecological values[19, 20]. Sour jujube (Ziziphus jujuba var. spinose), as a rootstock of jujube, is also one of the dominant fruit trees in China[21]. The fruit of sour jujube is specifically rich in vitamin C, flavonoids, triterpenoids, and has special nutritional composition and medicinal values. In addition, the seedlings of sour jujube are highly resistant to drought and salinity stress. However, in response to salt stress, the growth of seedlings and seed germination could be negatively affected[22]. Thus, improving the ability of sour jujube to salt stress is still necessary and whether the exogenous application of MT could regulate the salt resistance ability of jujube tree has not been reported.

      In the current study, sour jujube seedlings were used as plant materials with different concentration treatments of sodium chloride (NaCl) and MT, water treatment was used as control, phenotypic observation, and transcriptome analysis were performed to determine the potential molecular mechanisms behind them. The results could provide the theoretical reference for application of MT to regulate salt stress in sour jujube.

    • Sour jujube seeds were sown in nutritional bowls and grown in a laboratory cultivating room with a 12 h light/12 h dark photoperiod and constant temperature (23 °C) and humidity (70%). When the seedling grew seven to nine leaves, the healthy and consistent growth seedlings were selected and divided into five treatment groups: water treatment (W), 200 mmol/L, and 400 mmol/L NaCl treatment (Na), 10 µmol/L MT treatment for 6 d (root application once every two days, three times in total) prior to 200 mmol/L NaCl treatment, 10 µmol/L MT treatment for 6 d (root application once every 2 d, three times in total) prior to 400 mmol/L NaCl treatment (MNa), three biological replicates for each treatment were performed. The phenotypic observation was conducted on day 1, 3, and 8. Meanwhile, at the corresponding time, the leave samples were collected and stored at −80°C for transcriptome sequencing analysis.

    • Total RNA was extracted from the leaves of sour jujube which were selected from water treatment (W), 400 mmol/L NaCl treatment (Na), and 10 µmol/L MT plus 400 mmol/L NaCl treatment (MNa) groups at 0 and 192 h by using RIzol® Reagent kit. After checking of RNA concentration and quality, 1 μg of total RNA was used to construct the RNA-seq transcriptome library with TruSeqTM RNA sample preparation Kit and RNA-seq transcriptome library was sequenced by Illumina HiSeq xten/NovaSeq 6,000 sequencer (2 × 150 bp read length) at the Shanghai Majorbio Bio-pharm Biotechnology Co. (Shanghai, China)[23].

    • The raw data obtained by sequencing were filtered to obtain high-quality sequences. Firstly, the raw paired end reads were trimmed and quality controlled by SeqPrep (https://github.com/jstjohn/SeqPrep) and Sickle (https://github.com/najoshi/sickle) with default parameters. After filter out adapters and low-quality sequences, the clean reads were separately mapped using TopHat (http://tophat.cbcb.umd.edu/, version 2.0.0)[24]. Then using RSEM (http://deweylab.biostat.wisc.edu/rsem/)[25] to calculate gene expression levels as transcripts per million reads (TPM). Majorbio cloud platform (www.majorbio.com) was used to summarize and describe gene function annotation.

    • Using DESeq2[26] software to analyze the differential expression genes (DEGs) between groups of transcriptome data of different treatments in sour jujube seedlings, and the screening threshold was set as |log2 FC| ≥ 1 and p-adjust values < 0.05. The software Goatools (https://github.com/tanghaibao/GOatools)[27] and KOBAS (http://kobas.cbi.pku.edu.cn/home.do) was further used for Gene Ontology (GO) and Kyoto Encyclopedia of Genes and Genomes (KEGG) enrichment analysis, respectively. In addition, the STRING database (http://string-db.org/) was used for protein interactions analysis and their orthologs in Arabidopsis were used as references. The figures were drawn using cytoscape software[28].

    • The transcription factor database PlantTFDB (Plant, http://planttfdb_v4.cbi.pku.edu.cn/)[29, 30] was used to predict transcription factors. According to the prediction results, the transcription factor families were counted and stress-related transcription factors were screened.

    • To gain insight to whether MT treatment could rescue the damage caused by salt stress, different concentration of NaCl and combination of NaCl and MT were applied to sour jujube. Compared to the control, 200 mmol/L NaCl treatment could not induce the damage within 8 d. However, under 400 mmol/L NaCl treatment, the leaves of sour jujube seedlings appeared yellowing, curling, and gradually wilting within 8 d compared to the control (Fig. 1a & b). While the symptoms of sour jujube under the MT + NaCl group were also yellowing and curling, but not as severe as with only NaCl treatment (Fig. 1b & c, Supplemental Fig. S1). The phenotypical results indicated that 400 mmol/L NaCl treatment could induce leaf damage of sour jujube, while 10 µmol/L MT treatment had some alleviating effect on NaCl induced leaf damage. Therefore, for the next transcriptome analysis, the 400 mmol/L NaCl and MT + NaCl treatments were selected subsequently.
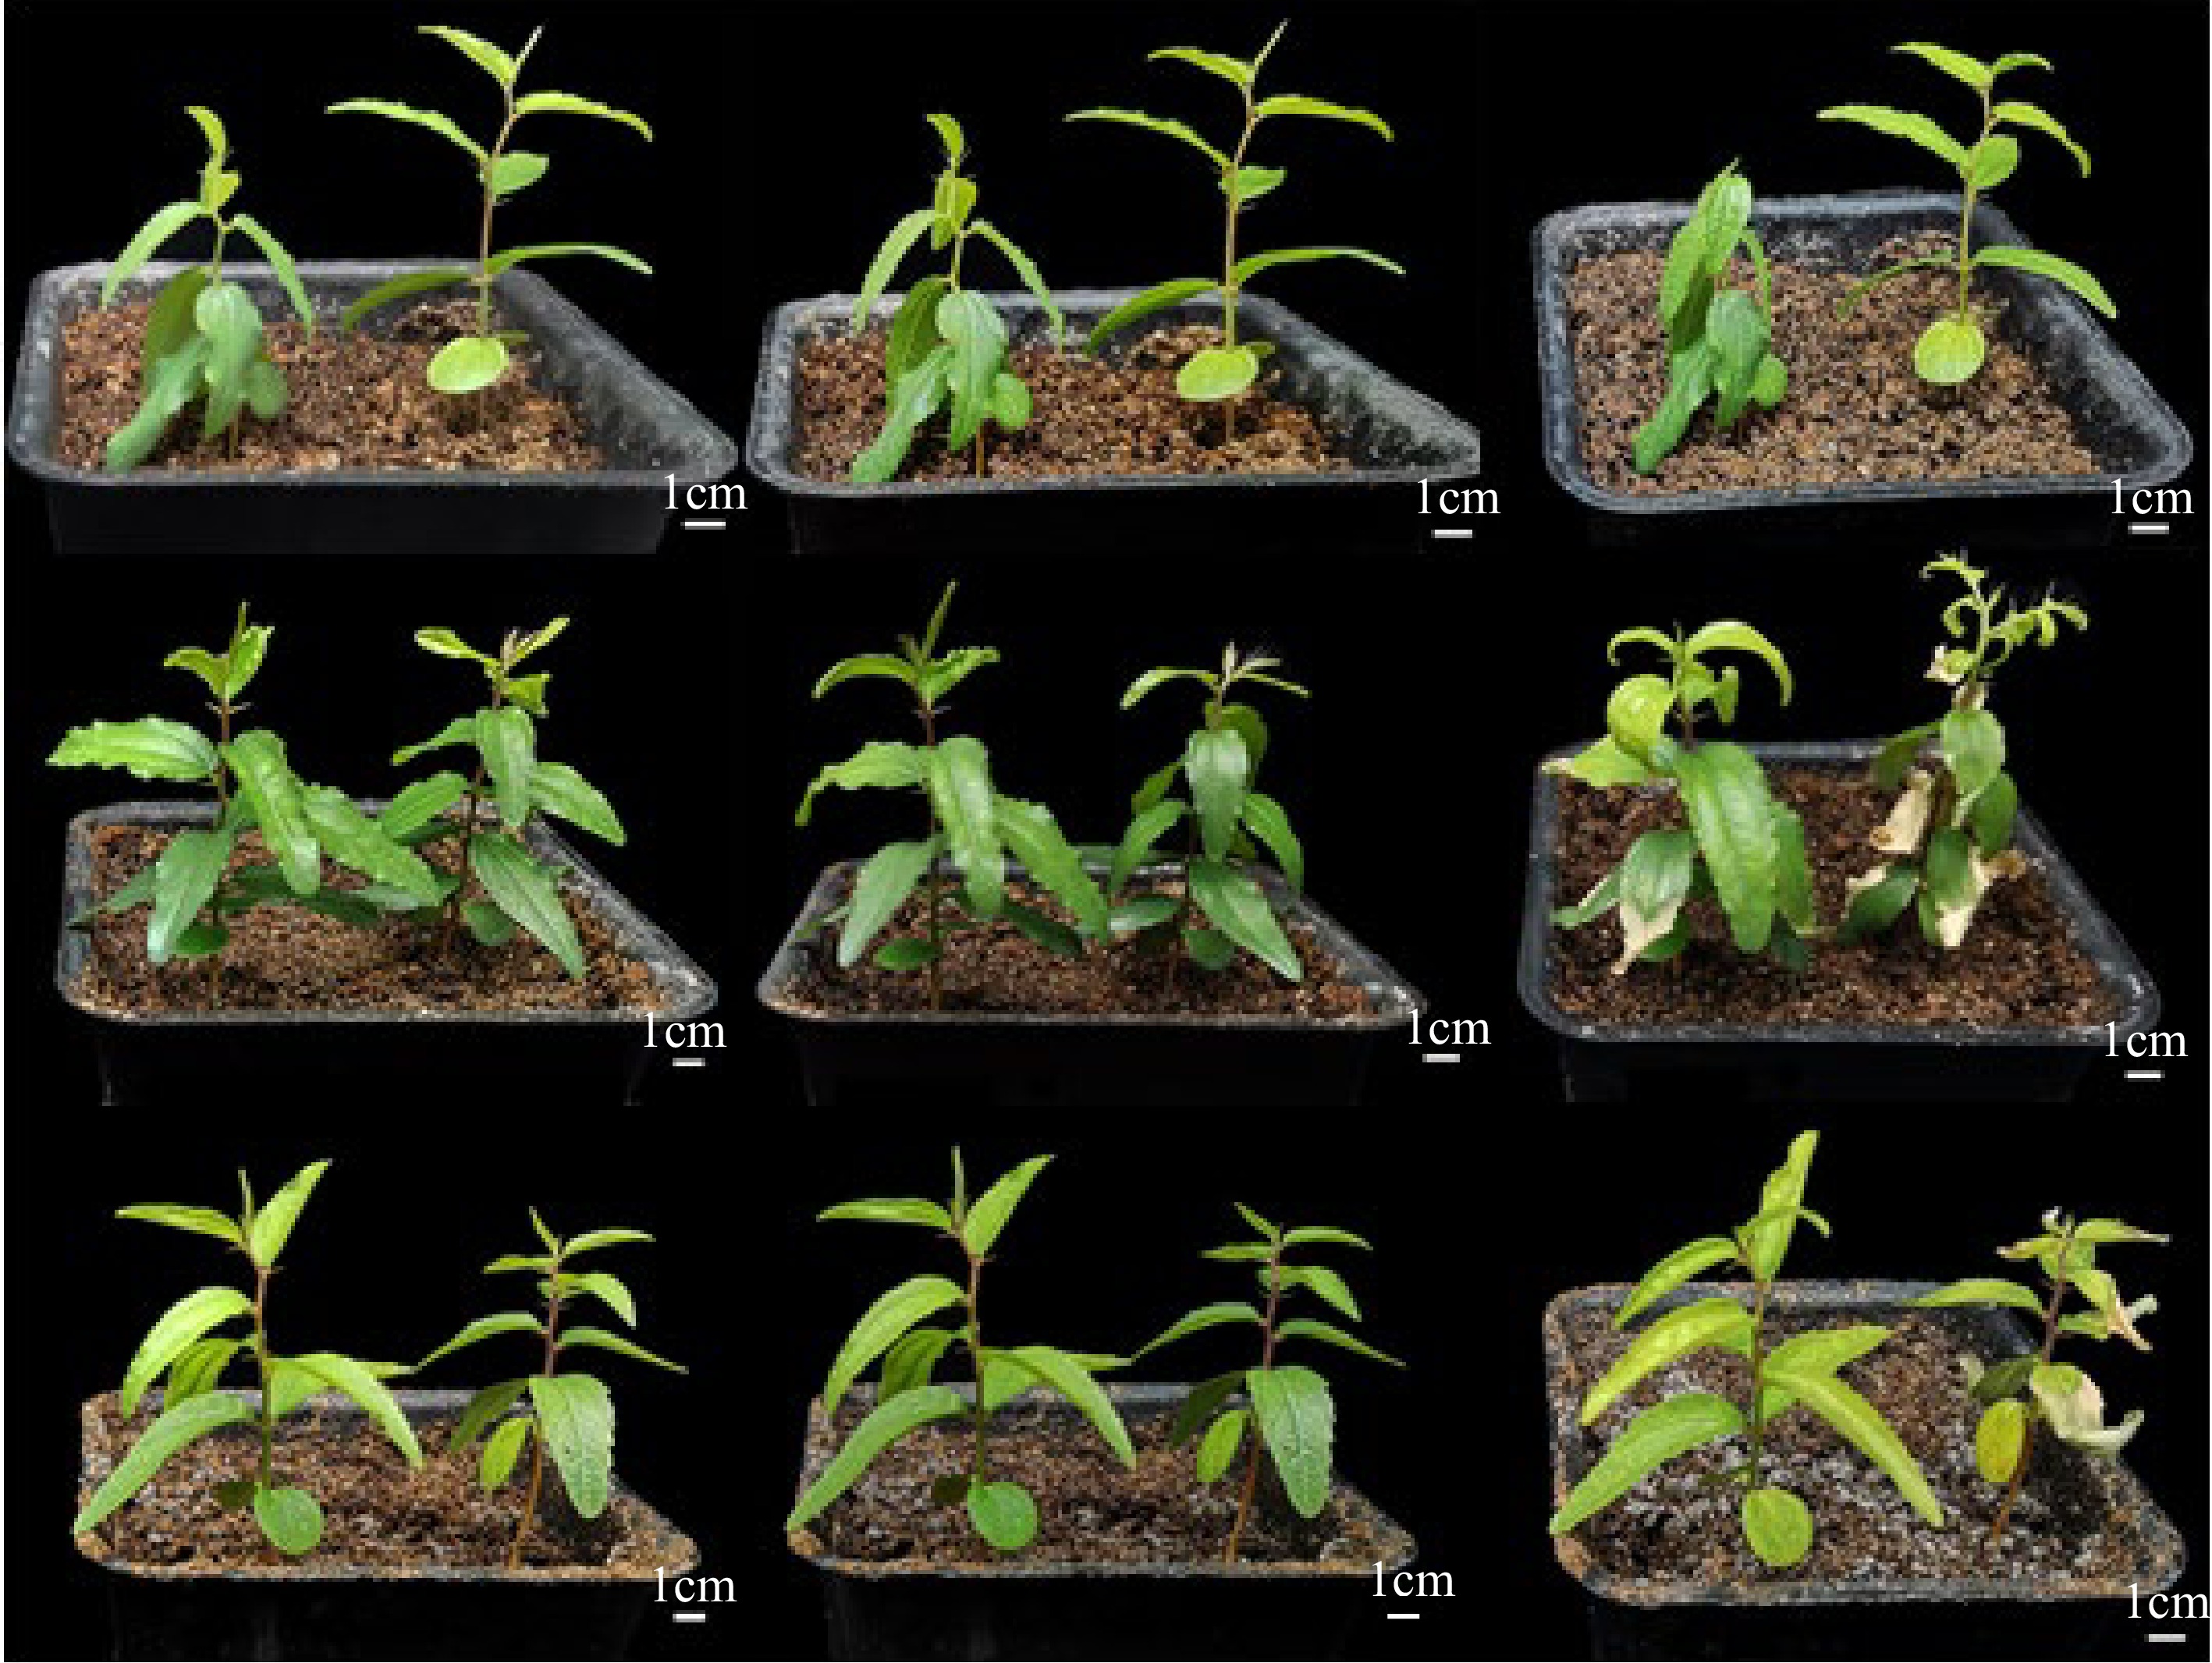
      Figure 1. 

      Time course of phenotypic characteristics of sour jujube seedlings under (a) control group, (b) 400 mmol/L NaCl treatment group, and (c) 10 µmol/L MT + 400 mmol/L NaCl treatment group respectively, within 0 h, 24 h, and 192 h from left to right. Bar: 1 cm.

    • In order to initially reveal the molecular mechanism of how exogenous MT treatment alleviates the salt stress induced damage in sour jujube seedlings, transcriptome analysis was performed and the sequencing data were obtained (Table 1). Among them, the raw reads obtained from each treatment were higher than 44.5 million reads, while the clean reads obtained after filtering and quantization, were higher than 44.1 million reads. In addition, error rates ranged from 0.0243% to 0.0251%, GC content was from 44.43% to 44.97%, and base scoring Q30 was above 93.96 %. The comparison efficiency of clean reads matching with the jujube reference genome for each sample ranged from 83.08% to 89.08%, among which 11.66% to 12.32% were matched to multiple positions and 71.00% to 77.35% were matched to the unique position, indicating that the data obtained by transcriptome sequencing were of high quality and could be used for subsequent analysis.

      Table 1.  Statistical analysis of transcriptome sequencing data.

      SamplesRaw readsClean readsError rate (%)GC content (%)Q30 (%)Total mappedMultiple mappedUniquely mapped
      W145076920445095540.025044.5494.1339226588 (88.13%)5230113 (11.75%)33996475 (76.38%)
      W245847360454074900.025144.6593.9640451096 (89.08%)5338687 (11.76%)35112409 (77.33%)
      W344540110440919060.025044.4394.0939056270 (88.58%)5141396 (11.66%)33914874 (76.92%)
      Na155405174549105440.024744.8394.3448658620 (88.61%)6669193 (12.15%)41989427 (76.47%)
      Na251733218511909040.024744.6594.3245581570 (89.04%)6270880 (12.25%)39310690 (76.79%)
      Na348546886480839220.024344.9294.7341217079 (85.72%)5925798 (12.32%)35291281 (73.40%)
      MNa153456026529925860.024744.9794.4044028697 (83.08%)6403570 (12.08%)37625127 (71.00%)
      MNa247546416471391860.024744.4794.4041628008 (88.31%)5603741 (11.89%)36024267 (76.42%)
      MNa355938524554309440.024944.5094.1249350021 (89.03%)6474285 (11.68%)42875736 (77.35%)
    • To confirm the relationship of all samples, the correlation and principal component analysis (PCA) analysis were performed. As shown in Fig. 2, the R2 values among the three replicates of the same treatment were all larger than 0.856 and most of them were above 0.913, while the correlation among the three treatment groups were significantly different. For the PCA analysis, three replicates of the same treatment clustered together, indicating high reliability among the samples. In addition, the three treatment groups scattered and distributed separately in different areas implied weak correlation and more DEGs existed among them.
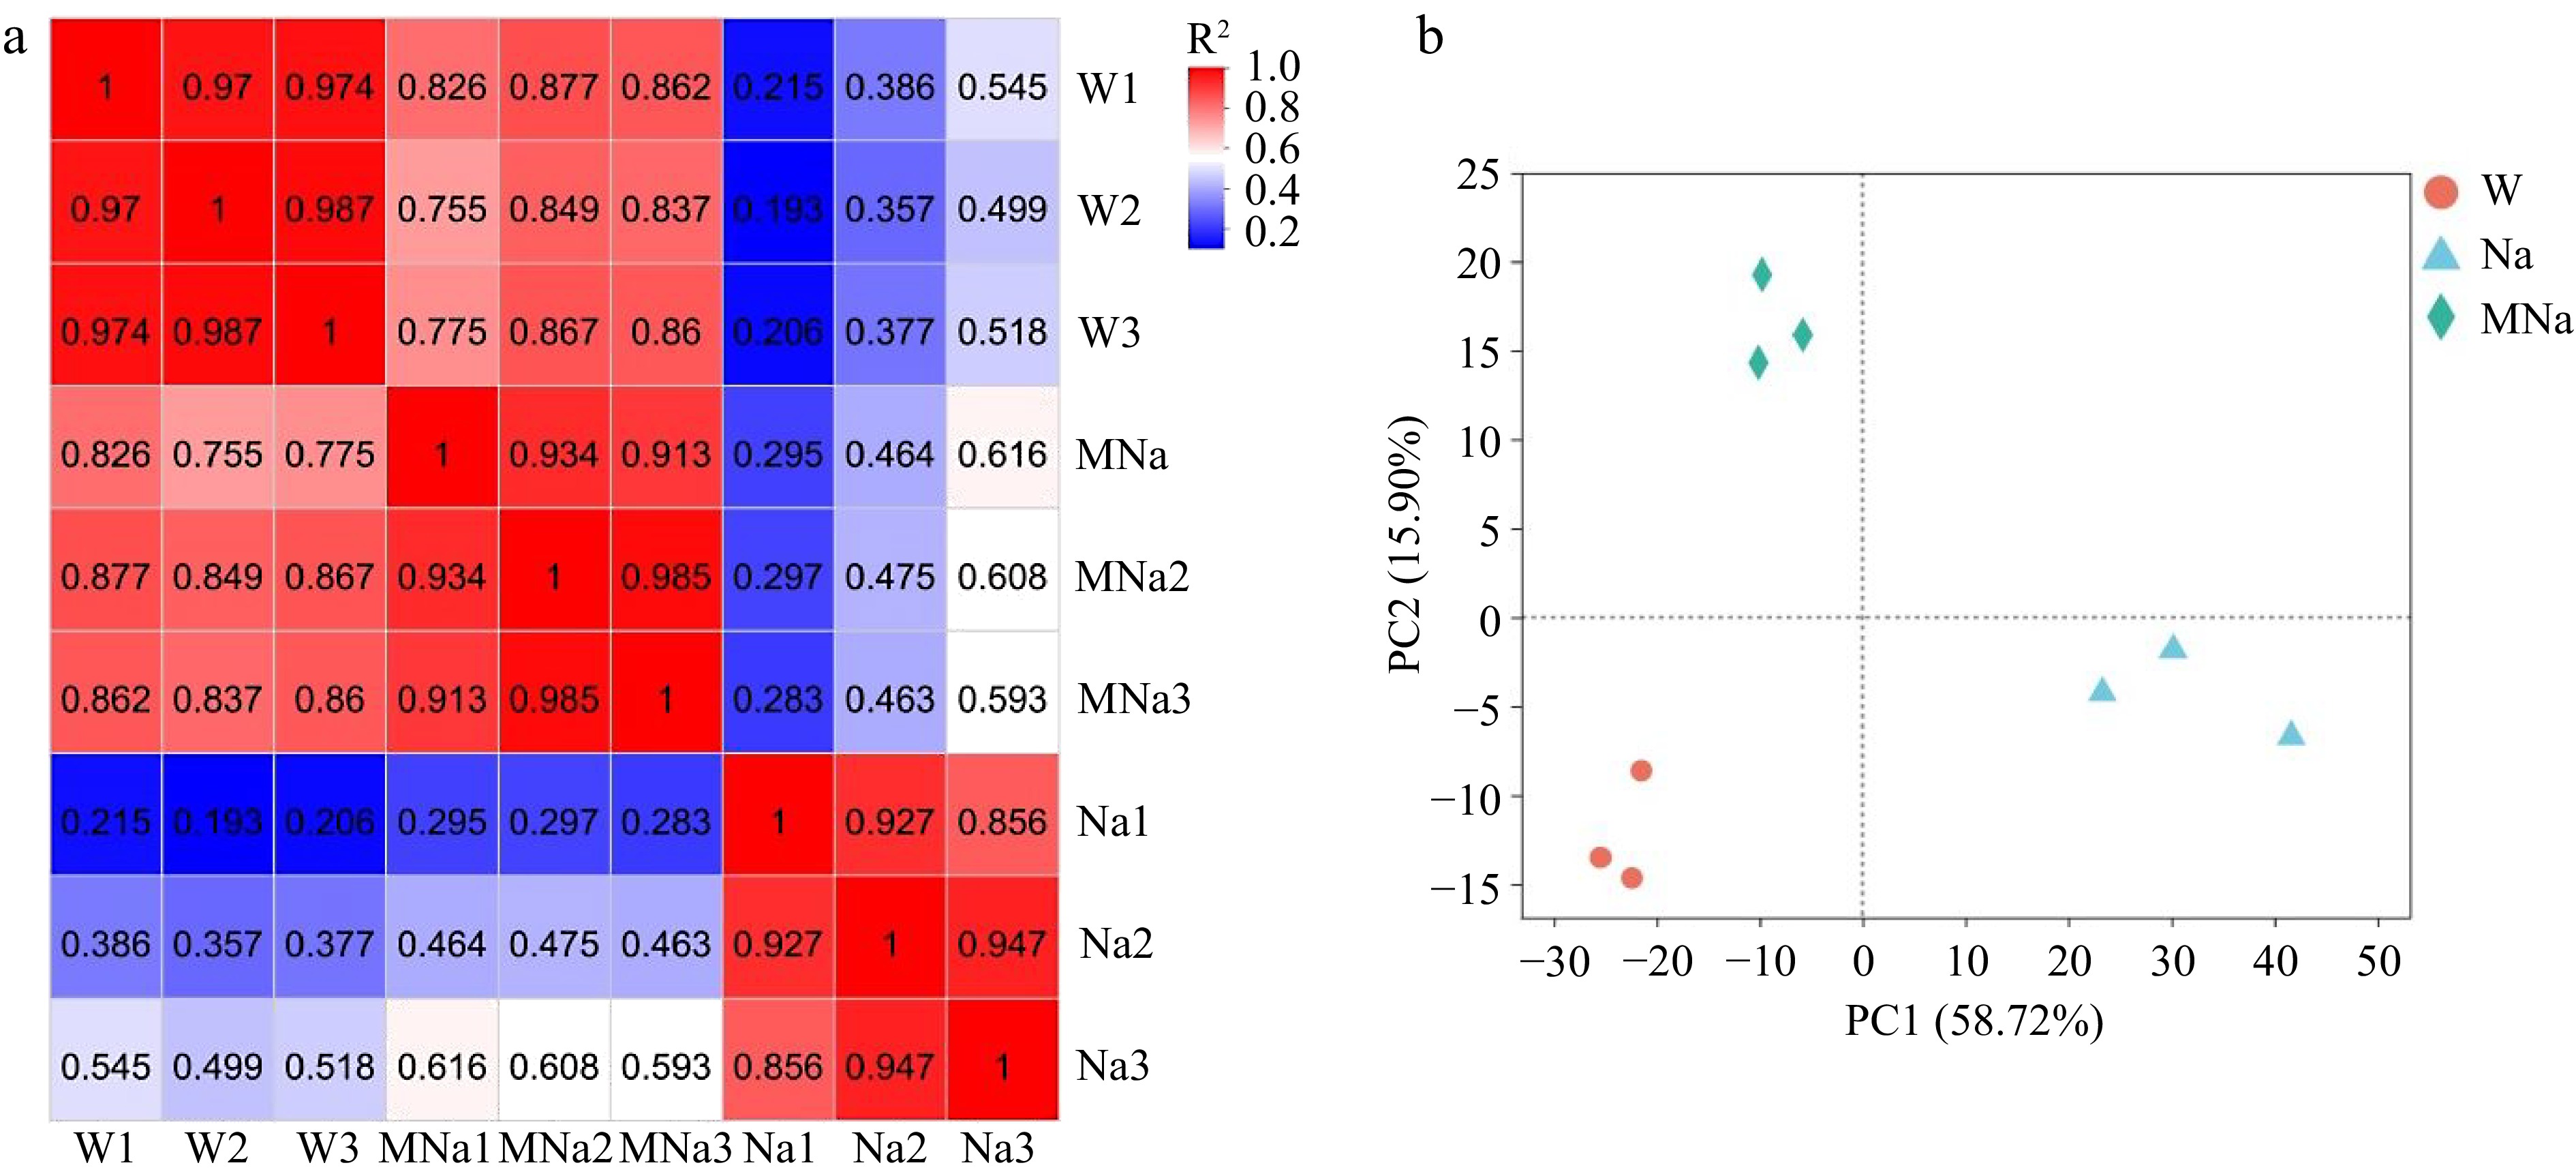
      Figure 2. 

      Overview of the transcriptome samples. (a) Heat map of pearson correlation analysis. (b) Principal component analysis plot. W, Na, and MNa represented water, NaCl, and MT + NaCl treatment, respectively.

    • To identify the number of DEGs that were significantly regulated among different groups, firstly we constructed the volcano map of DEGs, as shown in Fig. 3a & b, in the three comparative groups (W vs Na, W vs MNa, and Na vs MNa), the number of DEGs which were upregulated decreased and more were downregulated in Na vs MNa group. Compared with the W group, 6,292 (3,564 upregulated and 2,728 downregulated) and 2,795 (1,455 upregulated and 1,340 downregulated) DEGs were identified in the Na and MNa treatment groups, respectively. While 4,198 (1,363 upregulated and 2,835 downregulated) DEGs were identified in the MNa treatment group compared with the Na treatment group. Further comparison of the proportion of DEGs in different treatments by Venn diagram (Fig. 3c) showed that there were 523 DEGs co-expressed in the three treatment groups and more DEGs were identified in MNa vs Na than that in MNa vs W group, suggesting that melatonin could alleviate the salt stress induced damage might by inducing more stress-related DEGs.
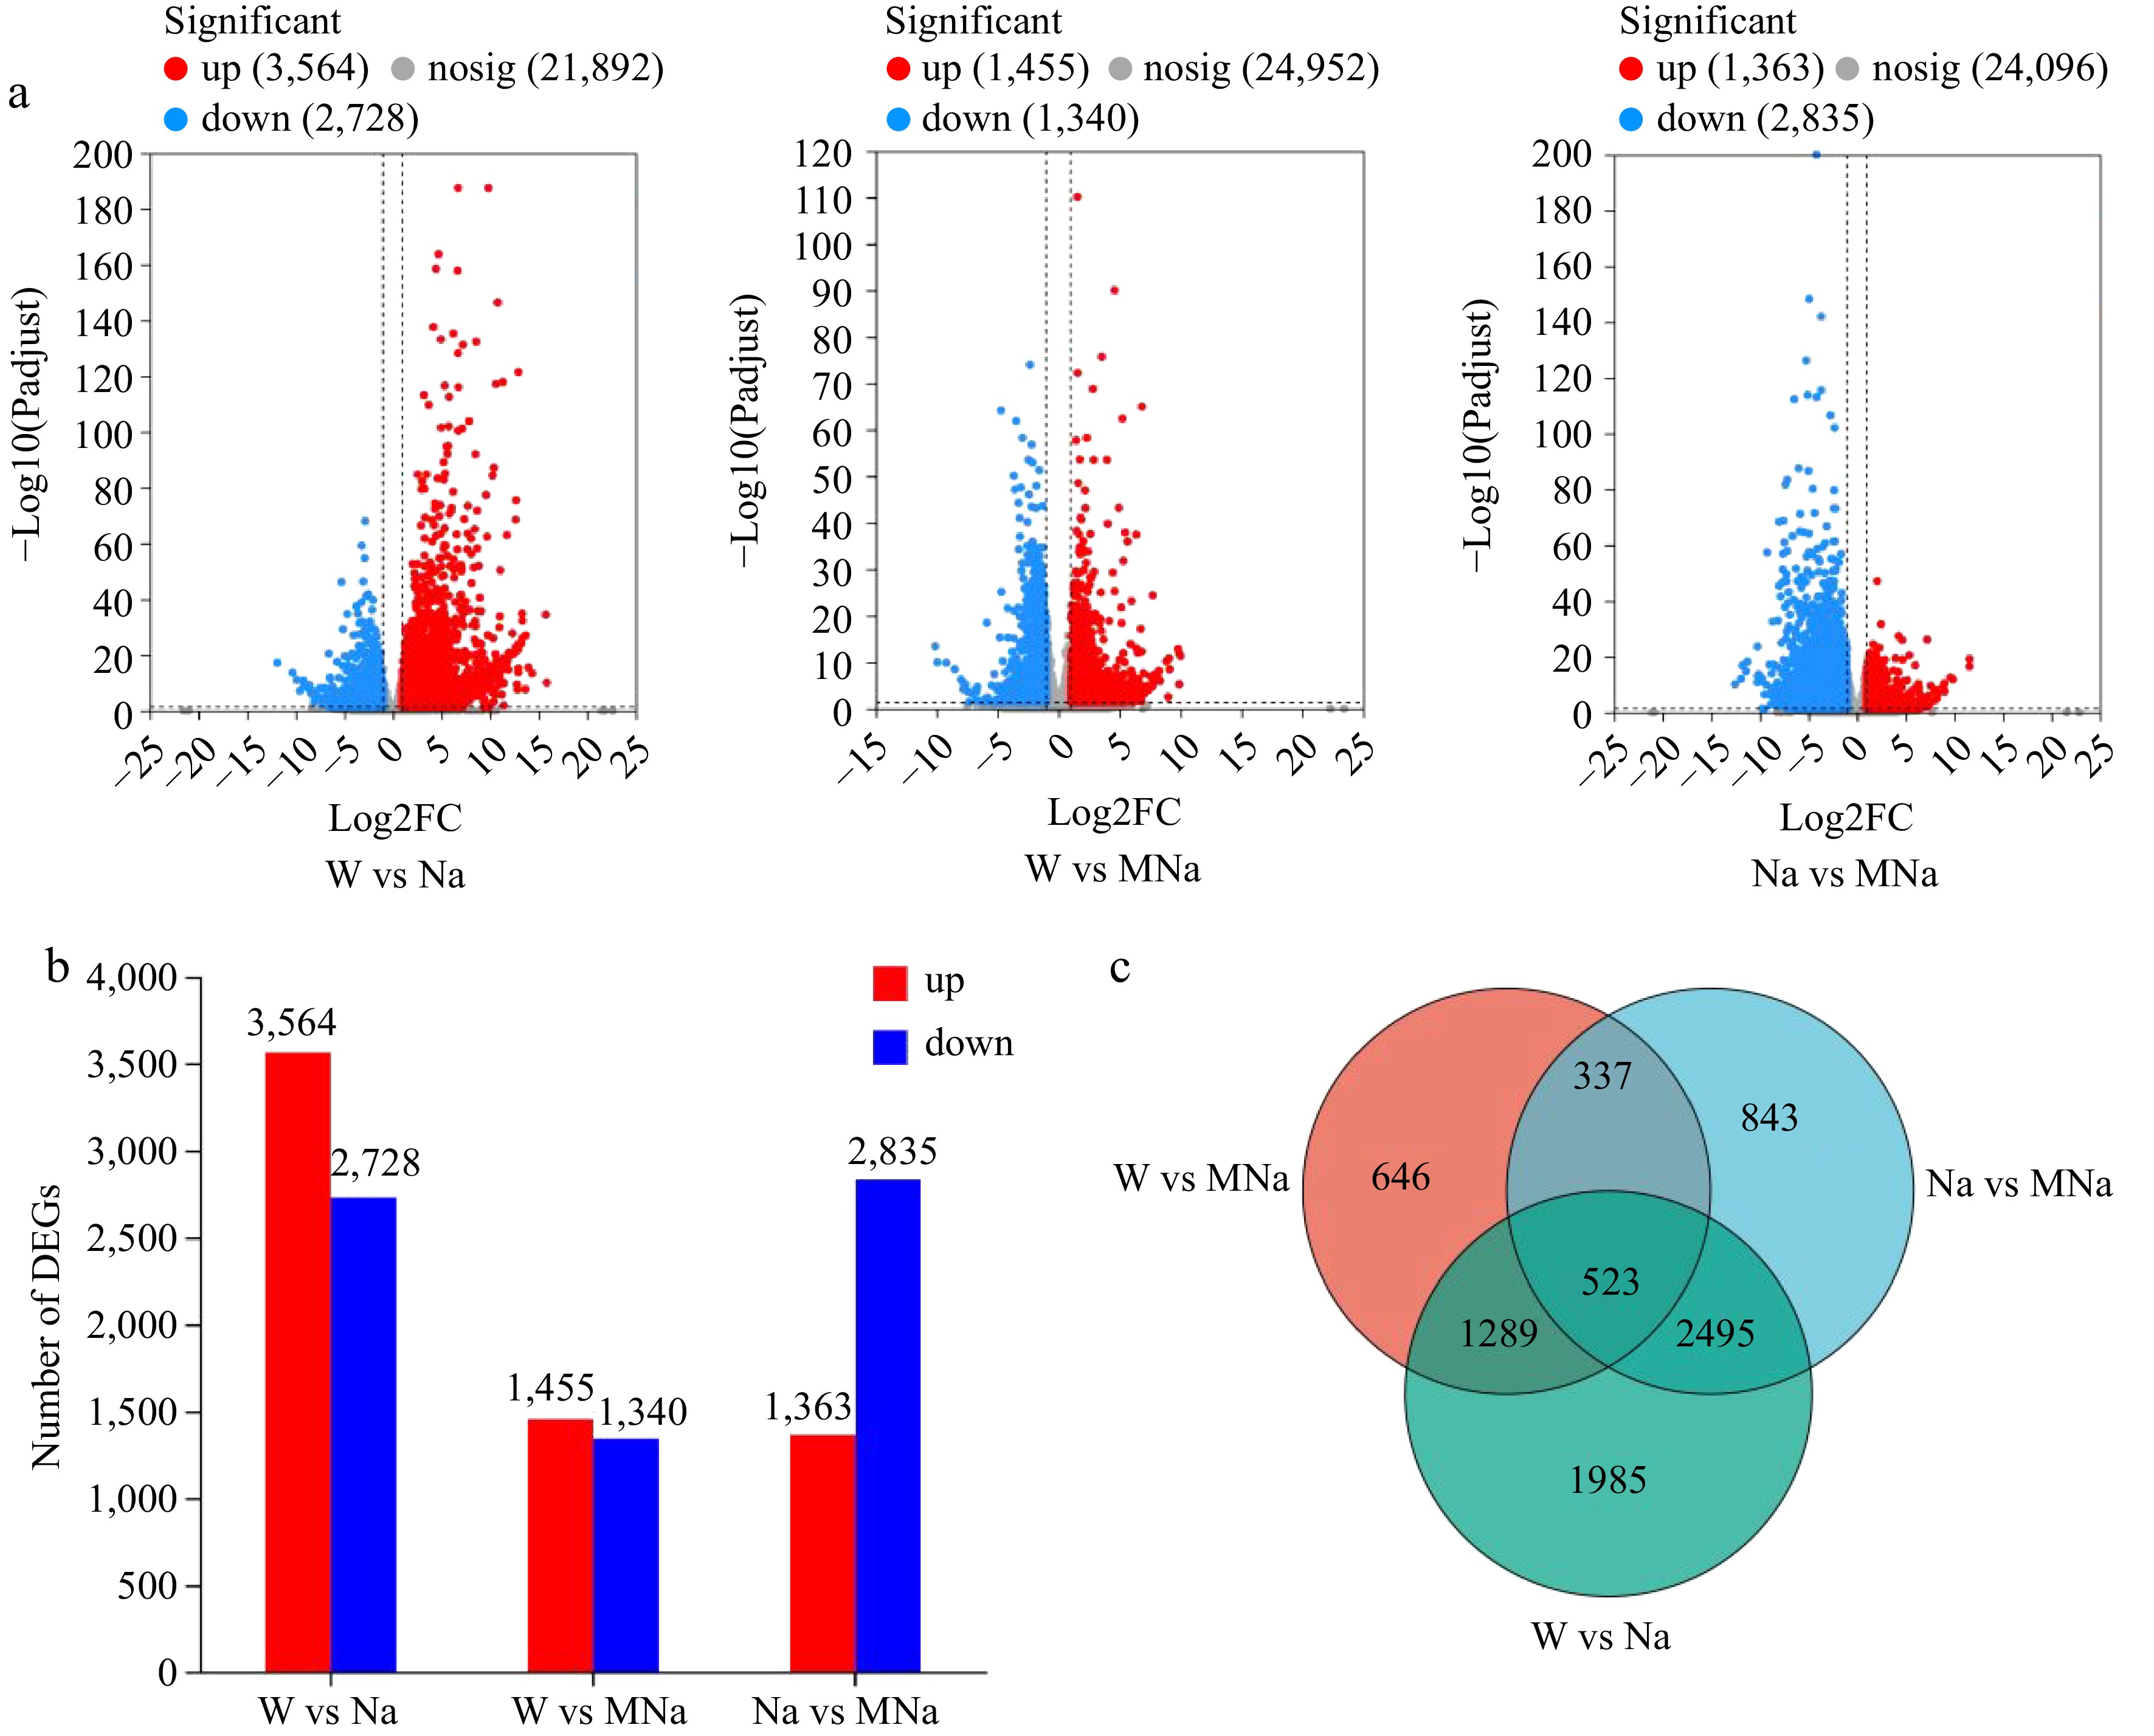
      Figure 3. 

      Identification of the number of differential expression genes (DEGs) in sour jujube seedlings under different treatments. (a) Volcano plots analysis of the number of DEGs. (b) Number of up and down regulated DEGs. (c) Venn diagrams of DEGs.

    • To gain insight into the biological functions of DEGs among the three treatment groups, GO annotation analysis was performed. As shown in Fig. 4, among the top 20 metabolic pathways mapped to DEGs, the molecular function was mainly enriched in catalytic activity (GO:0003824) and binding (GO:0005488) pathways. The biological process was mainly enriched in metabolic process (GO:0008152), cellular process (GO:0009987), biological regulation (GO:0065007), localization (GO:0051179), response to stimulus (GO:0050896), etc. While in the cellular component, the cell part (GO:0044464) accounts for the most, followed by the membrane part (GO:0044425), membrane (GO:0016020), and organelle (GO:0043226).
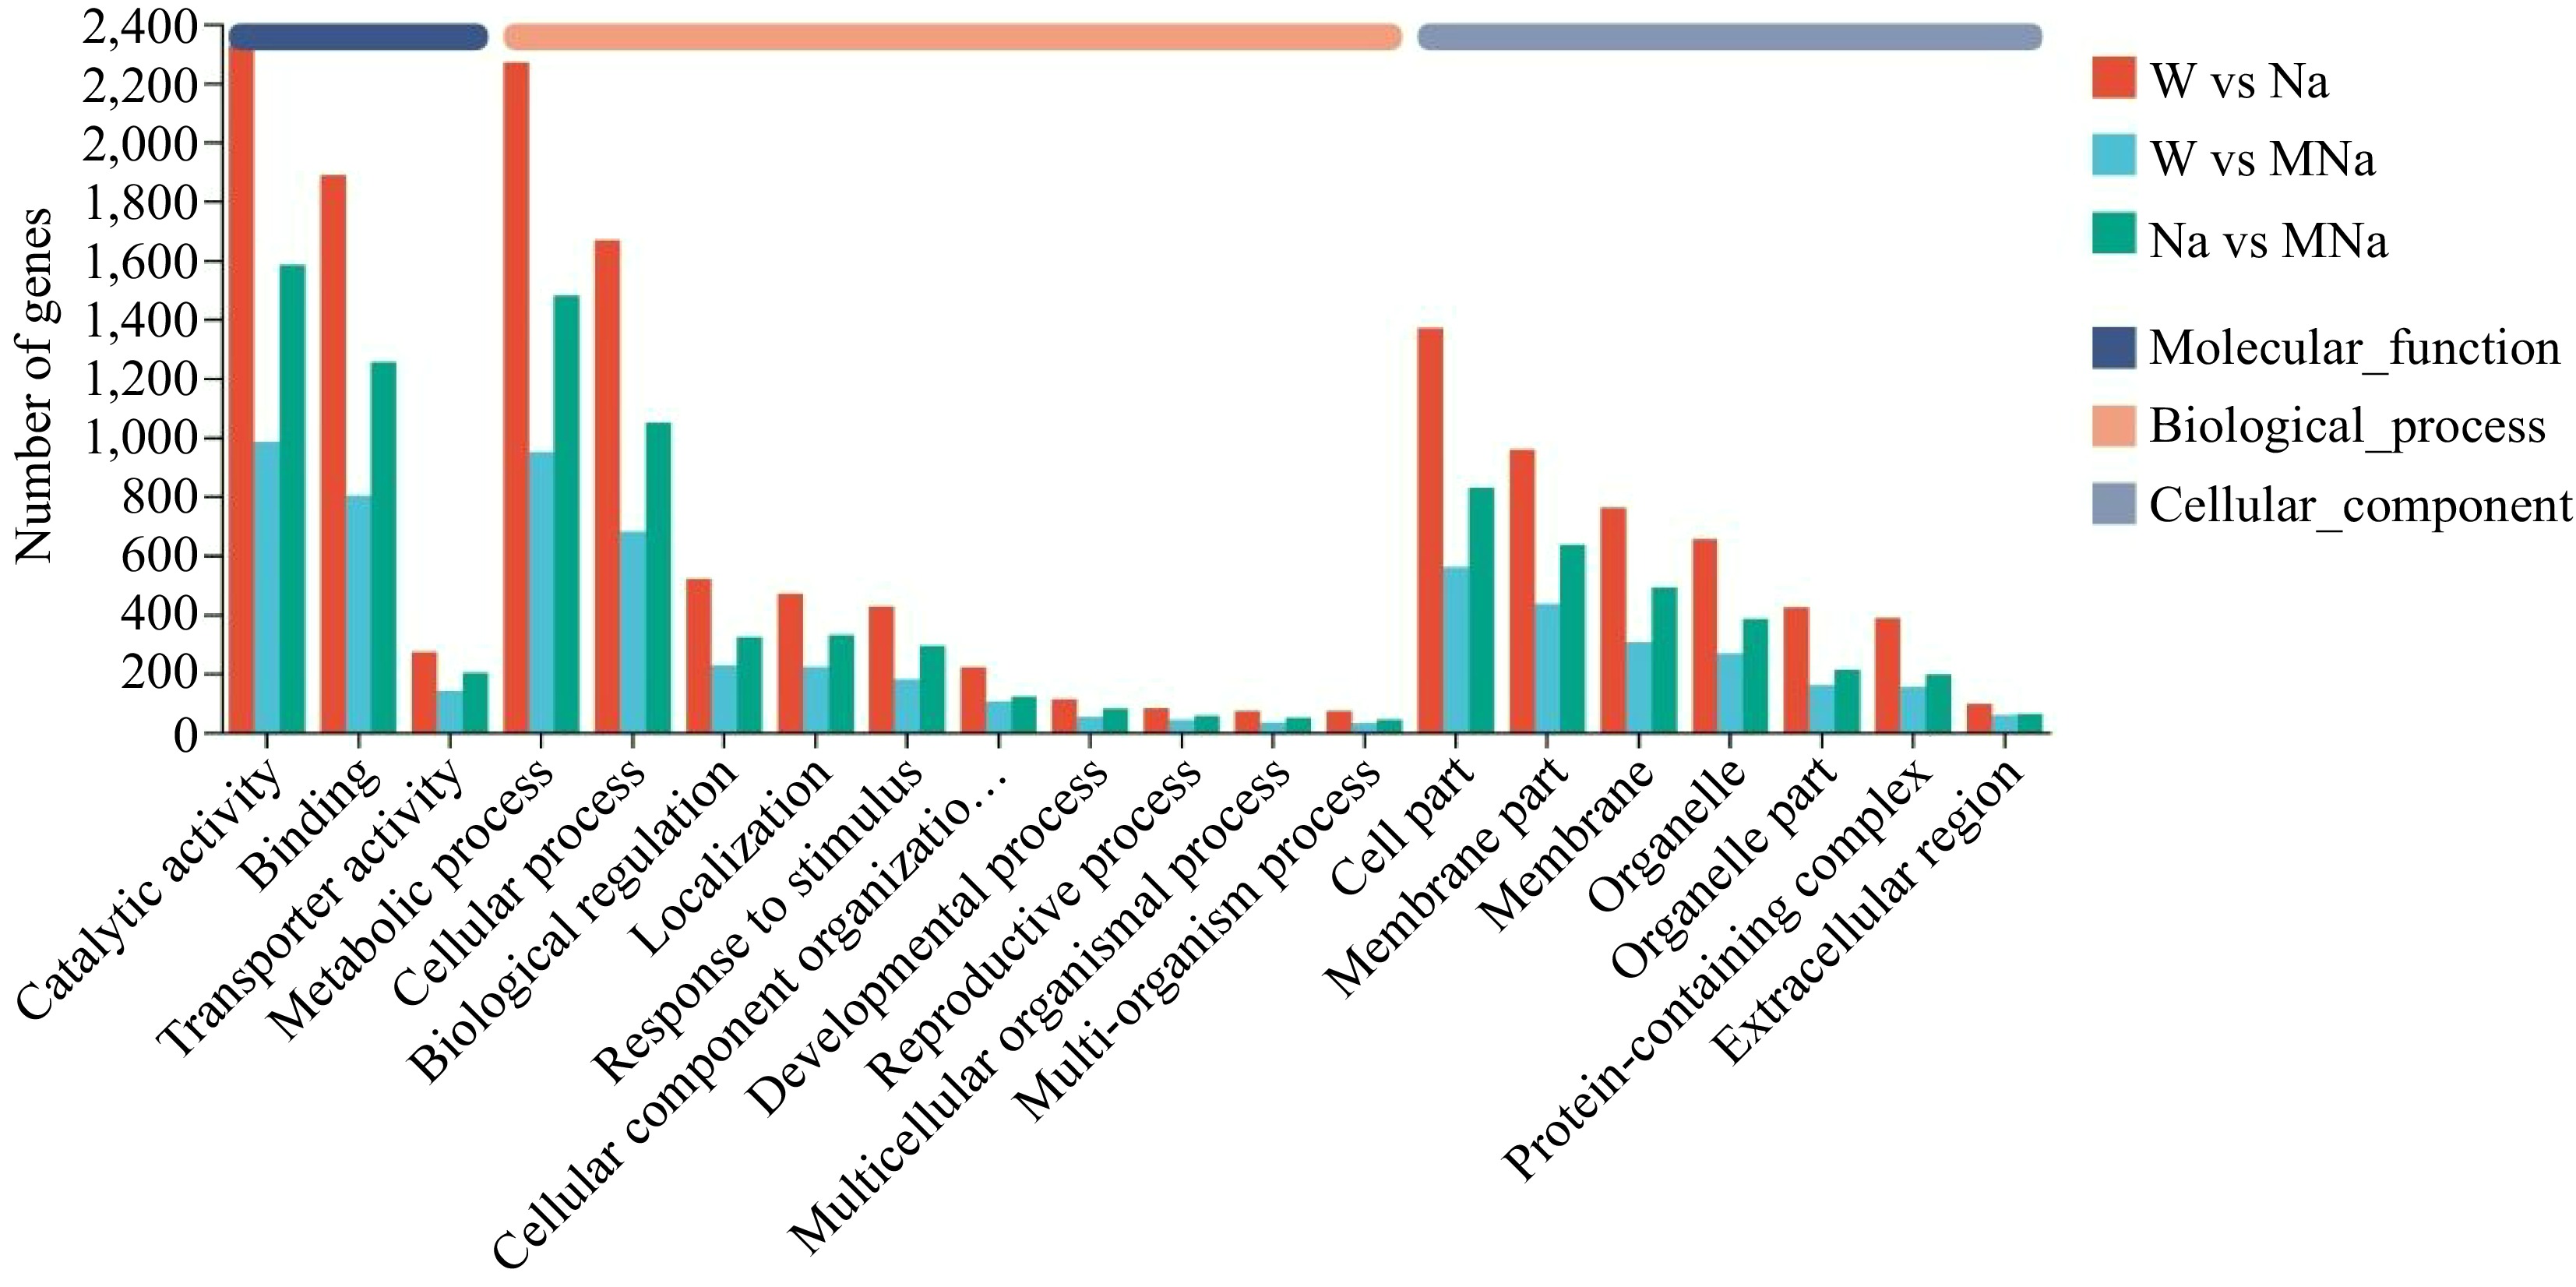
      Figure 4. 

      Histogram of annotation analysis of gene ontology among different pairwise groups.

    • To comprehensively understand the biological pathways in DEGs among different treatments and determine the main pathways of MT regulated in salt stress, KEGG pathway enrichment analysis was performed. As shown in Fig. 5, 20 top pathways were enriched in these pairwise groups. Among them, DEGs in the W vs Na group were significantly enriched in glyoxylate and dicarboxylate metabolism (map00630), photosynthesis-antenna proteins (map00196), glycolysis/gluconeogenesis (map00010), and monoterpene biology (map00902) pathways. In W vs MNa group, DEGs were significantly enriched in tryptophan metabolism (map00380), anthocyanin biosynthesis (map00942), flavonoid biosynthesis (map00941), phenylpropanoid biosynthesis (map00940), and indole alkaloid biosynthesis (map00901) pathways. In Na vs MNa group, DEGs were significantly enriched in galactose metabolism (map00052), monoterpenoid biosynthesis (map00902), phosphatidylinositol signaling system (map04070), MAPK signaling pathway-plant (map04016), and arginine and proline metabolism (map00330) pathways. These results indicated the key DEGs in these pathways might play important roles in NaCl and MT + NaCl treatments.
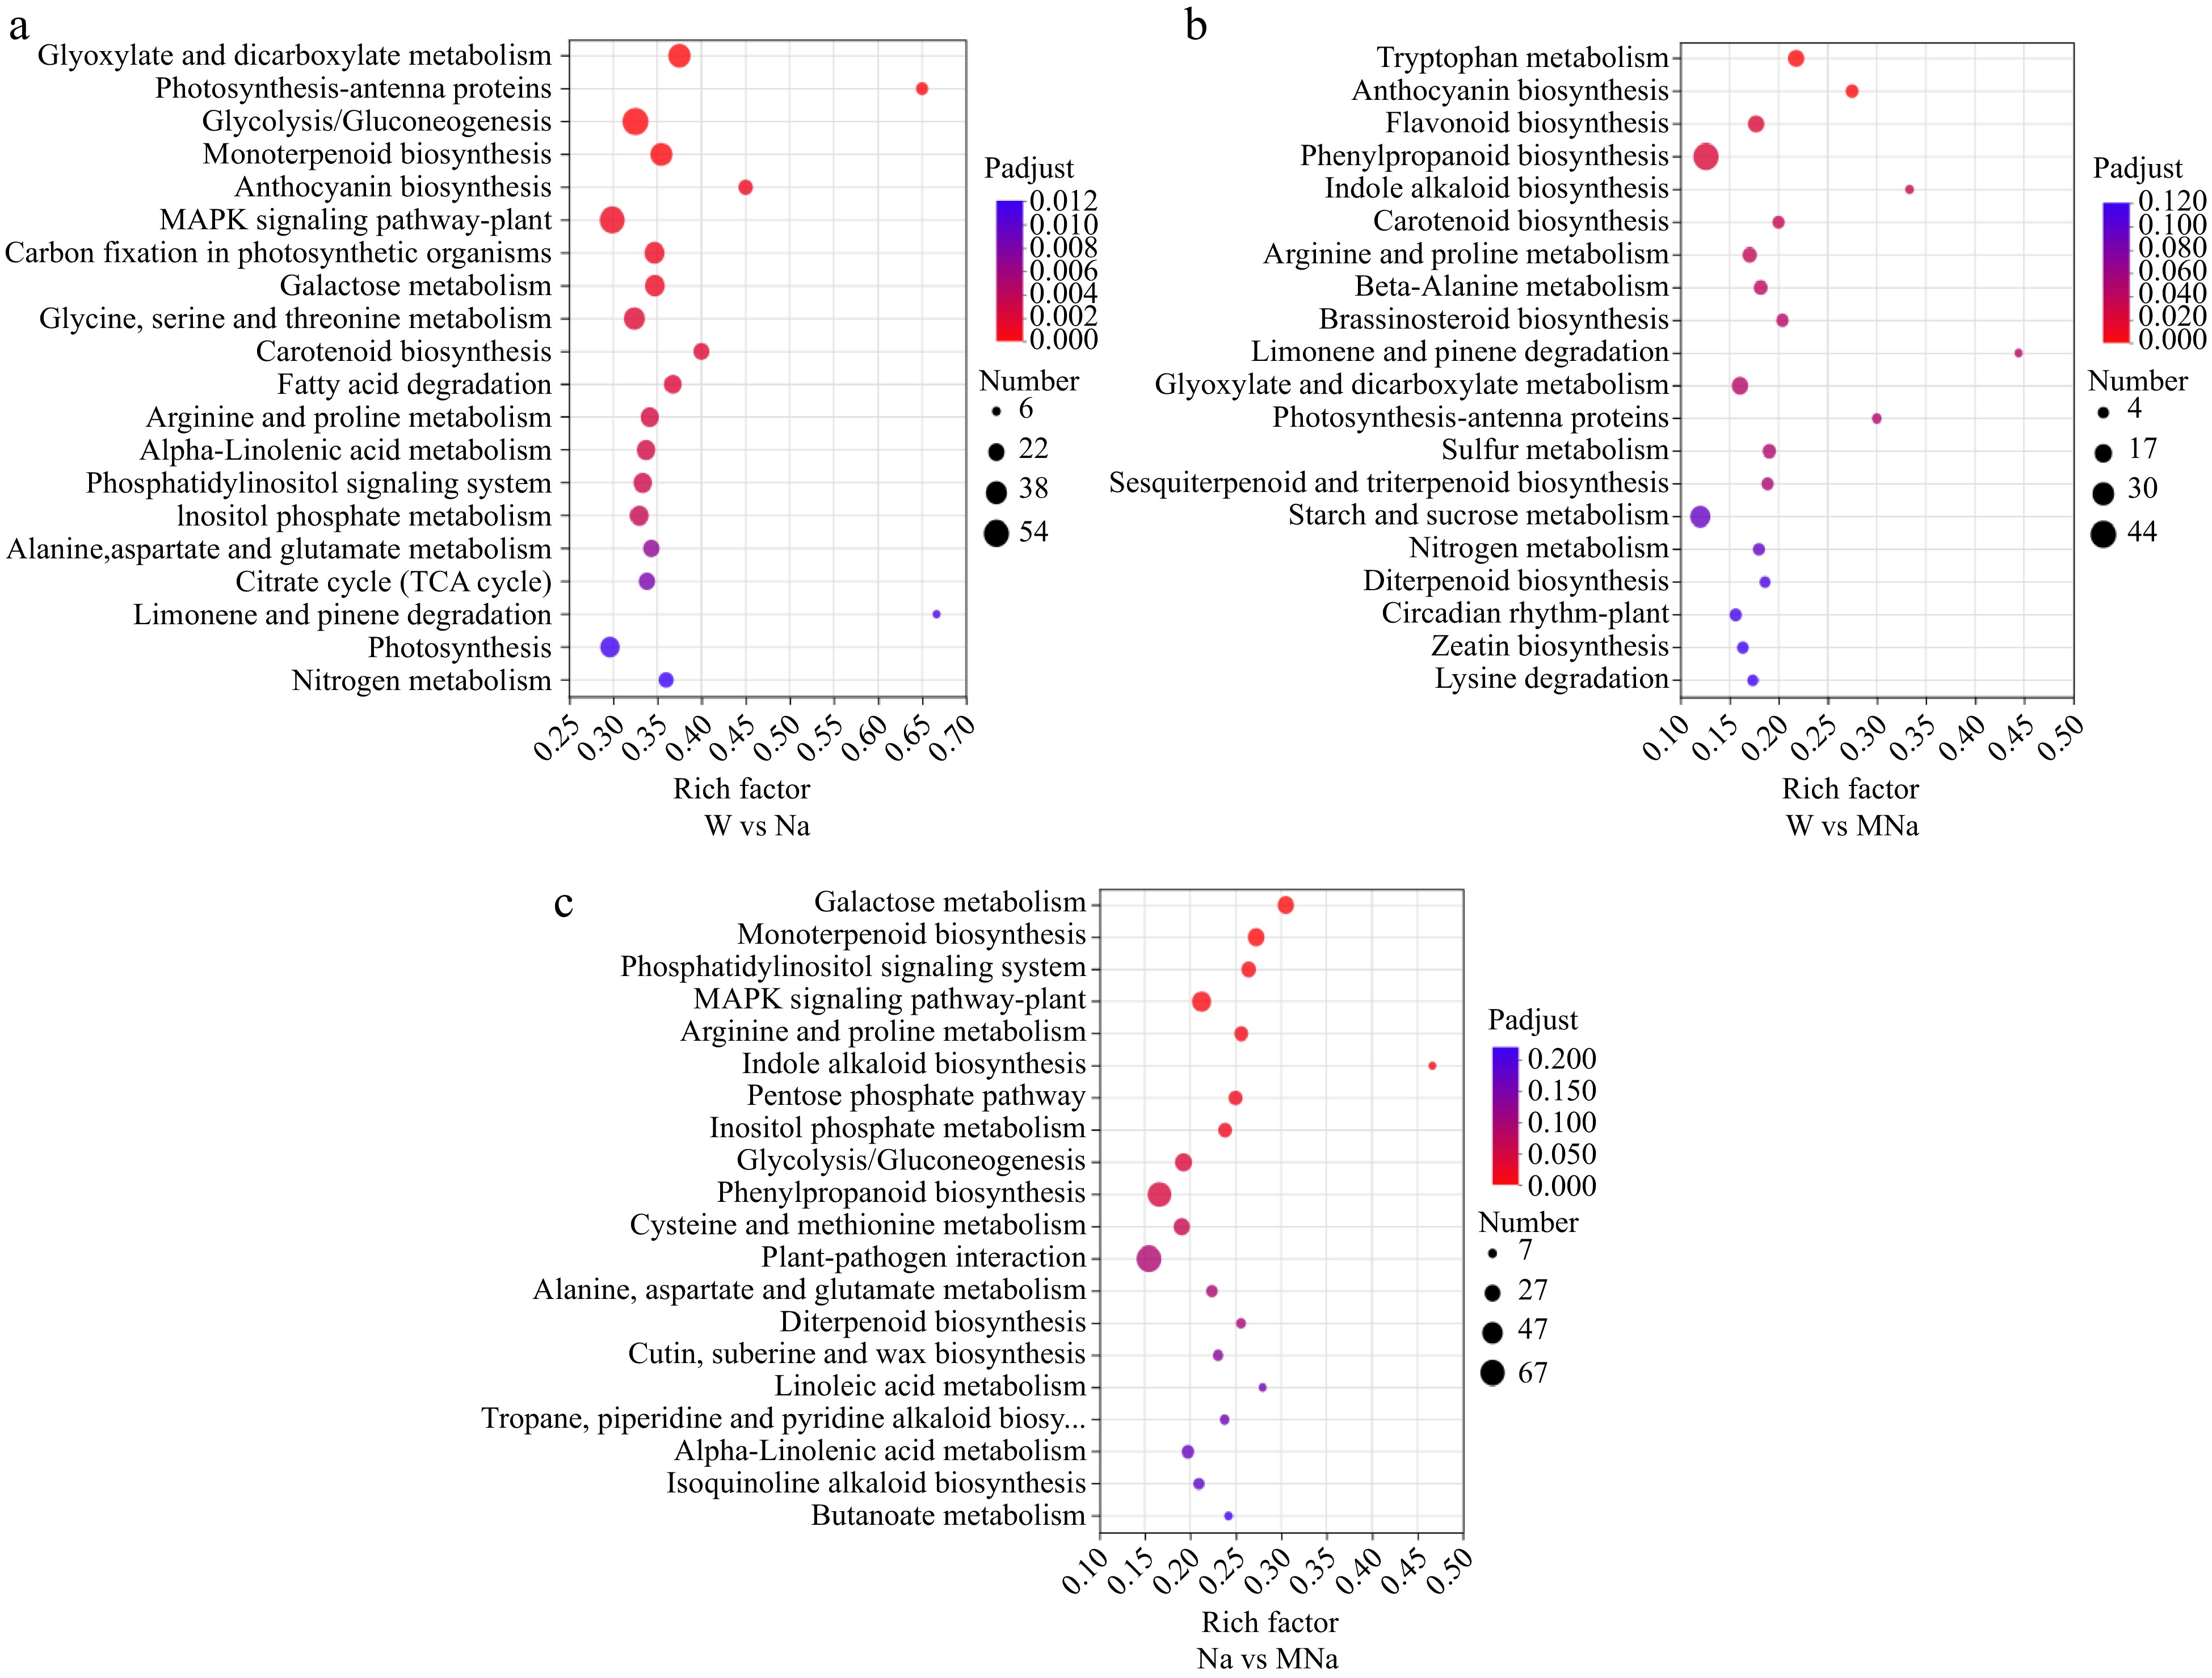
      Figure 5. 

      The top 20 KEGG pathways were analyzed in sour jujube under different pairwise groups, such as (a) W vs Na, (b) W vs MNa, and (c) Na vs MNa. The vertical axis represents the pathway name, the horizontal axis represents the rich factor, the size of dots in the pathway represents the number of DEGs, and the p-adjust value is reflected by the color of the dots.

      However, a large number of DEGs were enriched in plant hormone signal transduction (map04075) pathway as well as MAPK signaling pathway and phosphatidylinositol signaling pathway between different treatments, especially in the Na vs MNa group, which might further indicate these pathways function more importanly in MT allevated salt stress inducd damage in sour jujube and should be focused on and deeply analyzed.

    • MAPK pathway has been demonstrated to function importantly in various abiotic stresses. The above analysis indicated it might function importanly in MT allevated salt stress inducd damage in sour jujube. As shown in Fig. 6, in the Na vs MNa group, a total of 37 DEGs were enriched in eight sub-pathway of MAPK signaling pathway and we mainly focused on two of them which are related to salt stress (Fig. 6a). Among them, comparing to NaCl treatment, gene13139 encoding mitogen-activated protein kinase kinase kinase 1 (MEKK1) was downregulated in MT + NaCl treatment, while gene6673 encoding abscisic acid receptor PYR/PYL family (PYL) was upregulated. In addition, eight genes, including gene7093, gene7094, gene32214, gene3897, gene21562, gene28461, gene7270, and gene31283 encoding protein phosphatase 2C (PP2C) were downregulated and gene6889 encoding mitogen-activated protein kinase kinase kinase 17/18 (MAPKKK17_18) was downregulated, while gene8078 encoding mitogen-activated protein kinase kinase 3 (MKK3) was upregulated. These results indicated that the gene6673 encoding PYL and gene8078 encoding MKK3 might function positively in MT allevated salt stress inducd damage in sour jujube. To further discuss and excavate the interaction of these key genes, the corresponding protein interaction prediction analysis was performed. As shown in Fig. 6b, gene8078 (mitogen-activated protein kinase kinase 3-like), gene6889 (mitogen-activated protein kinase kinase kinase 2), gene7270 (probable protein phosphatase 2C 51), gene31283 (protein phosphatase 2C 37-like), gene21562 (probable protein phosphatase 2C 51), and gene6673 (abscisic acid receptor PYL4-like) in both pathways were also key nodes which could further regulate the other genes in response to salt stress within MT treatment.
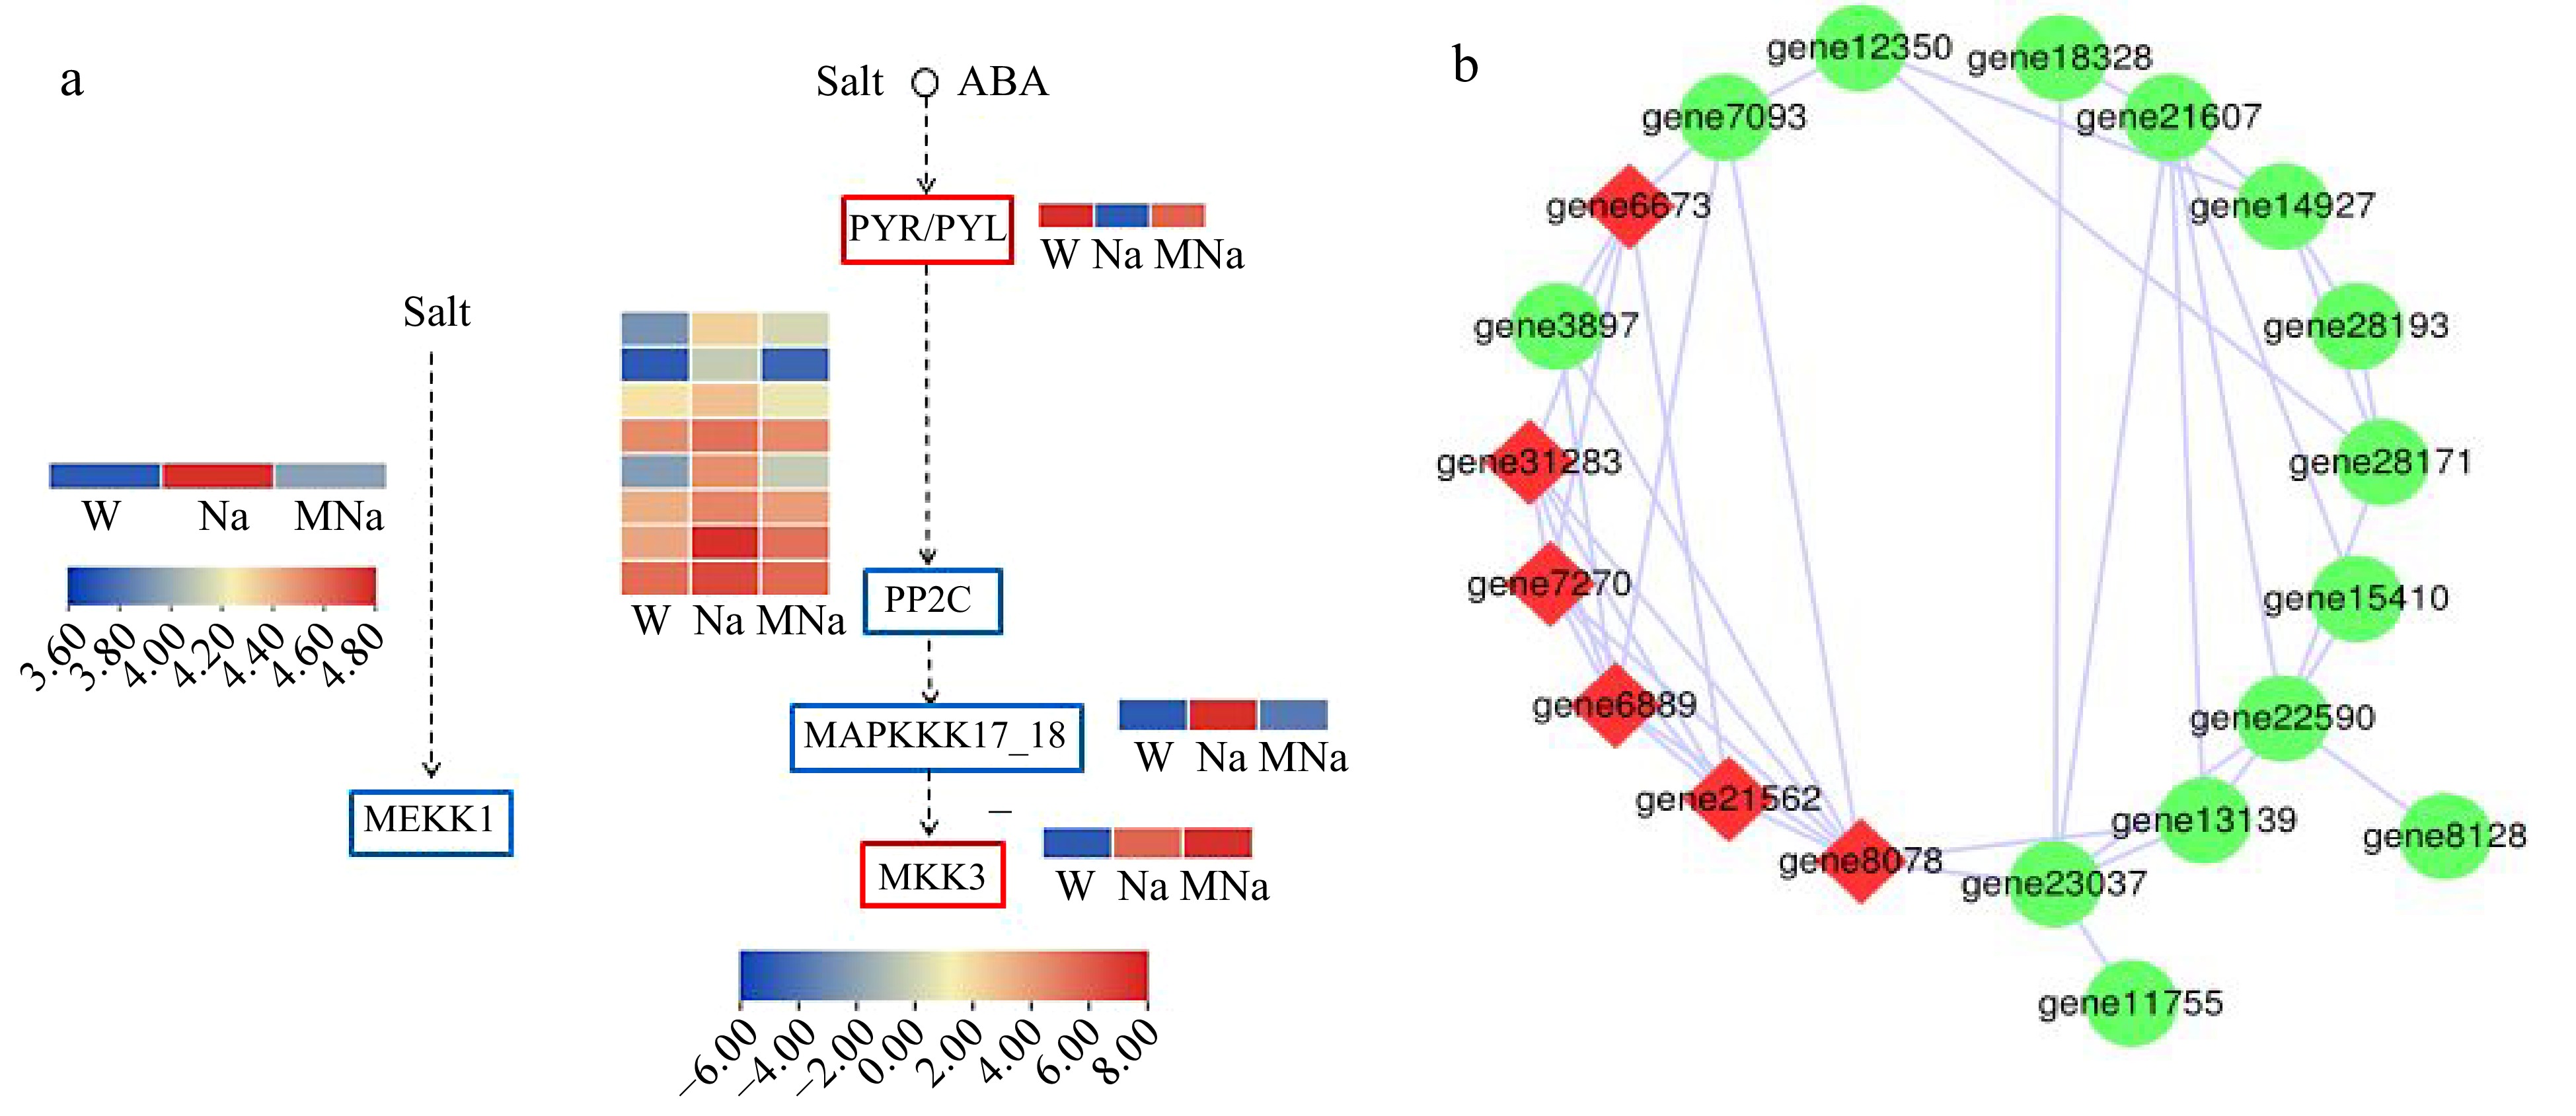
      Figure 6. 

      Key DEGs analysis on MAPK signaling pathway. (a) DEGs analysis in two key MAPK pathways in response to salt stress within MT treatment. Red border represents genes which are upregulated, blue border represents genes which are downregulated. Arrows only represent legend indications. (b) Protein interaction network analysis. Node size represents the strength of protein interactions. Red color indicates the key node proteins.

    • The calcium signaling pathway plays a crucial role in plant perception and response to stress signals[31]. In phosphatidylinositol signaling system pathway, a total of 23 DEGs were enriched under Na vs MNa group, among which genes, including gene11755, gene15410, gene11271, gene8128, were regulated under exogenous melatonin treatment. Compared to NaCl treatment, gene15410 expression was upregulated in MT + NaCl treatment, while gene11755, gene11271, and gene8128 expression was downregulated (Fig. 7a). In addition, protein interaction prediction analysis revealed that gene15254 (inositol polyphosphate multikinase beta-like, transcript variant X1) and gene15254 (probable CDP-diacylglycerol-inositol 3-phosphatidyltransferase 2) are key nodes in exogenous MT treatment under salt stress (Fig. 7b).
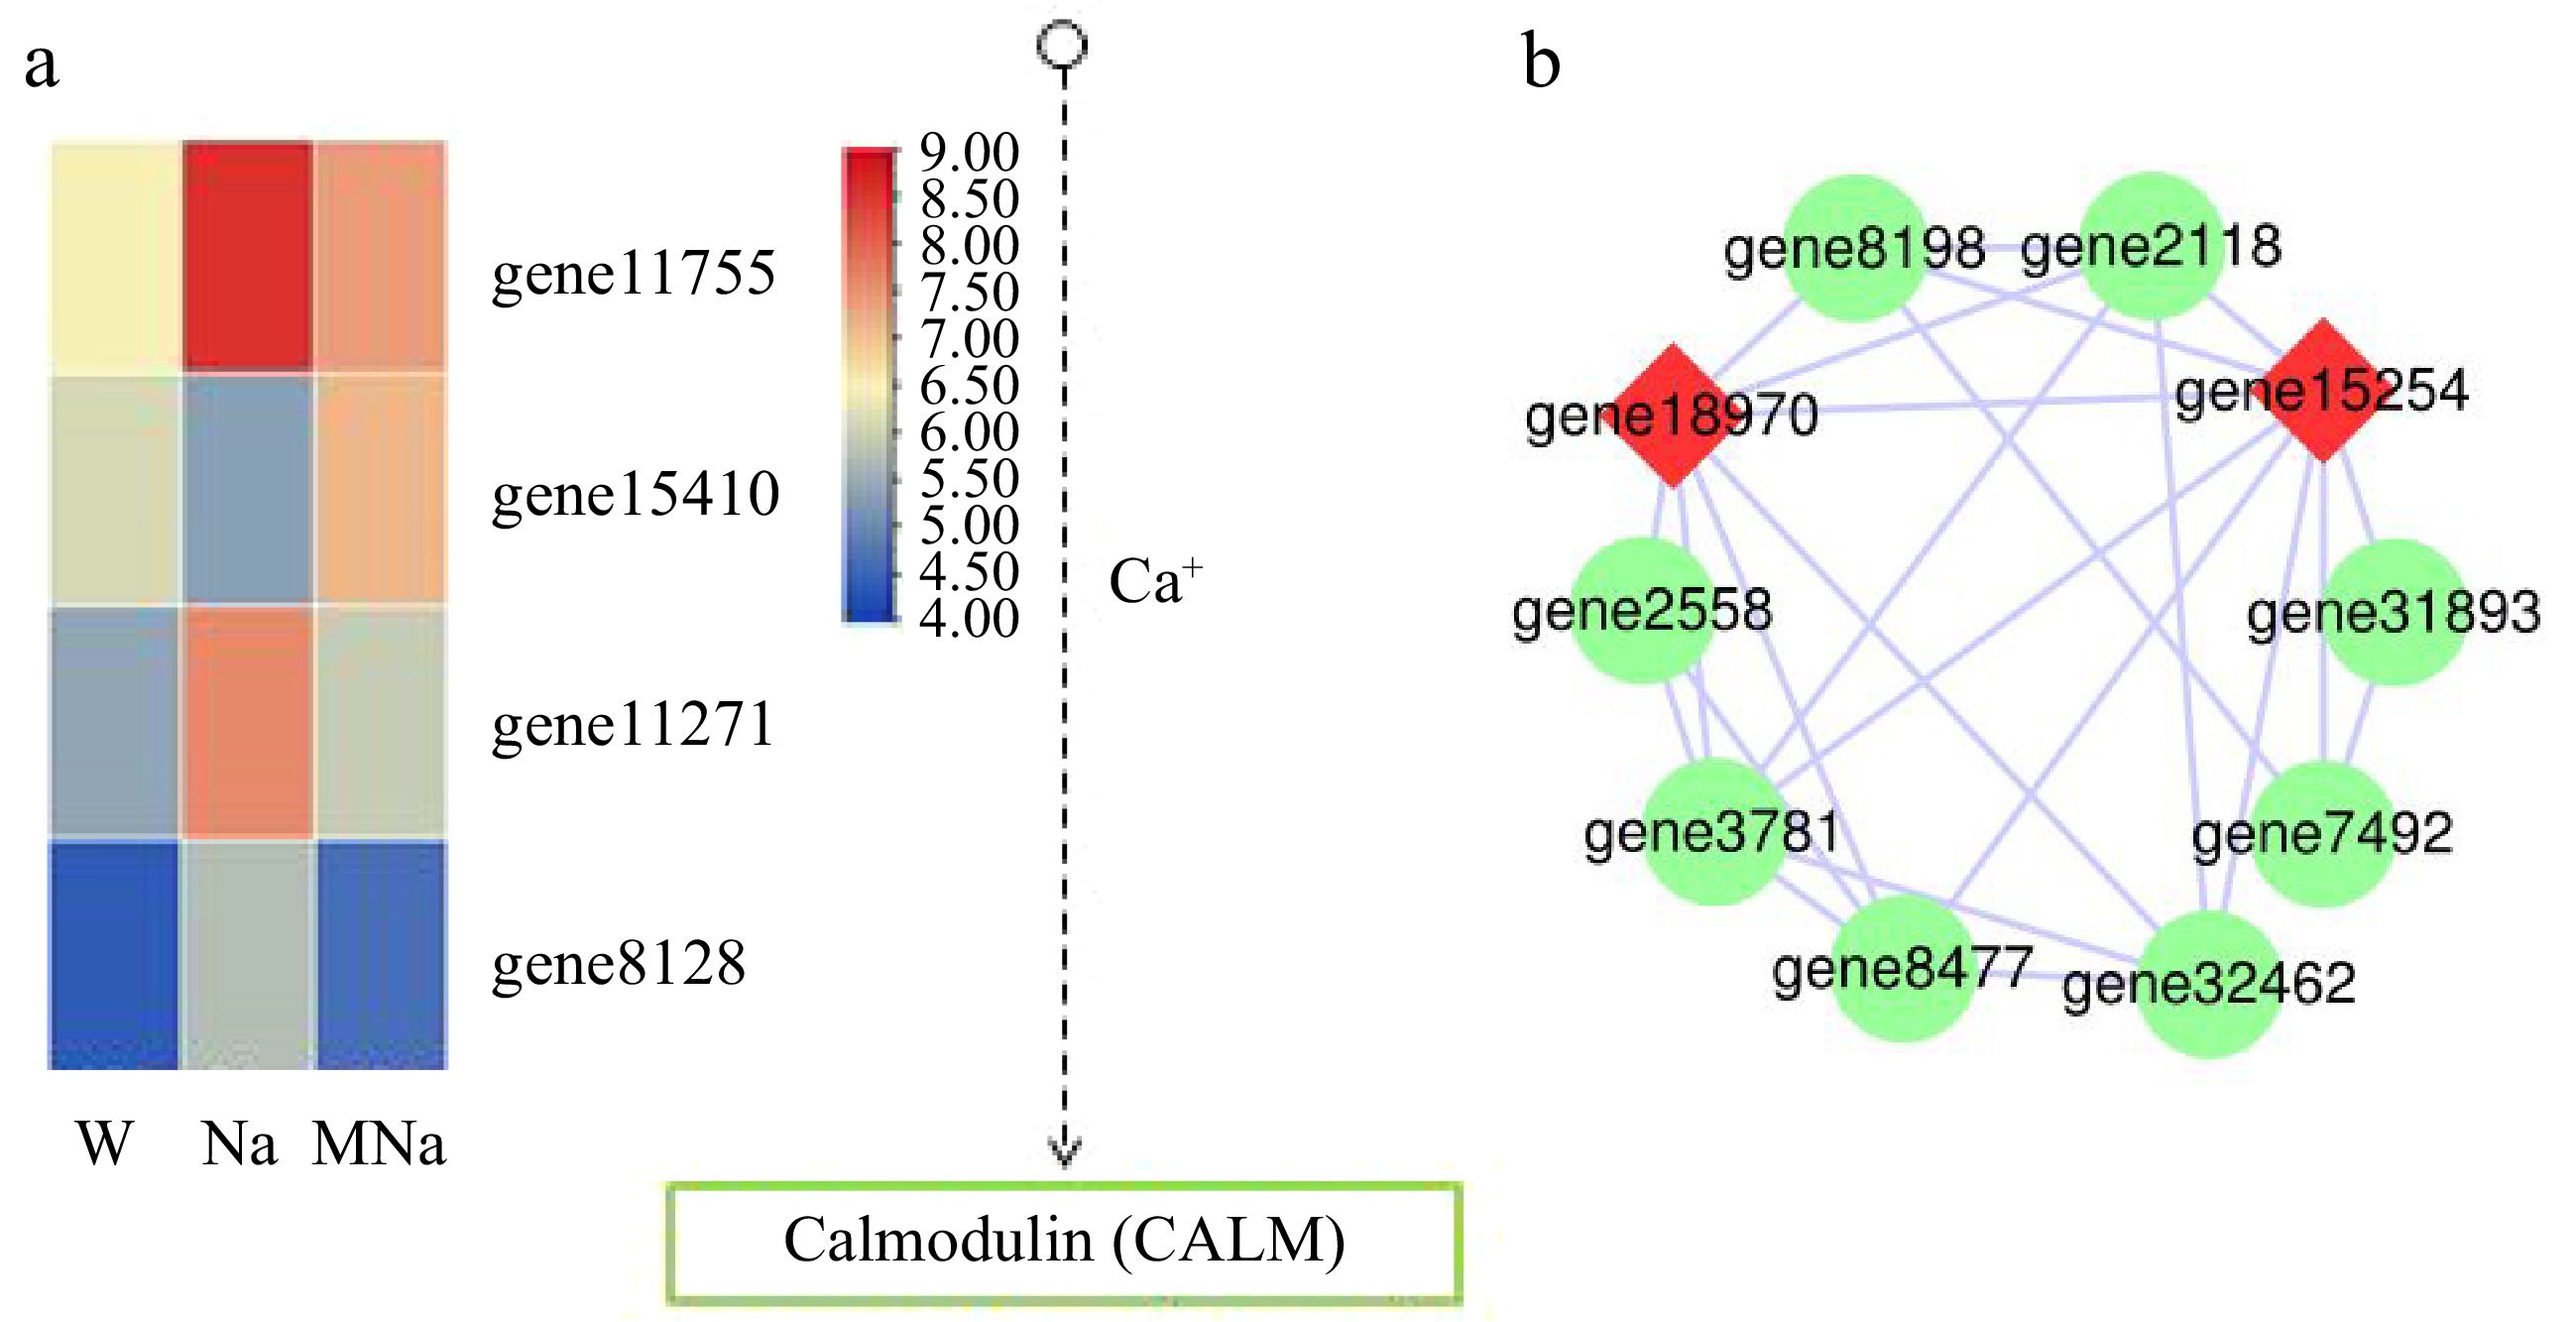
      Figure 7. 

      Key DEGs analysis on phosphatidylinositol signaling system. (a) DEGs analysis in Ca2+ signaling pathway. Arrows only represent legend indications. (b) Protein interaction network analysis. The node size represents the strength of protein interactions. Red color indicates the key node proteins.

    • It has been suggested that plant hormone signaling pathways are associated with biotic and abiotic stresses in plants[32, 33]. In the Na vs MNa group, a total of 42 DEGs were enriched in the plant hormone signal transduction pathway (Fig. 8b), participated in the regulation of eight hormone sub-pathways (Fig. 8a). In the case of auxin signaling, compared to NaCl treatment, six upregulated genes encoded auxin-responsive protein IAA (AUX/IAA), auxin response factor (ARF), and auxin responsive GH3 gene family (GH3), and eight downregulated genes encoded AUX/IAA, ARF, GH3, and SAUR family protein (SAUR) were identified in MT + NaCl treatment. In the case of cytokinin (CTK) signaling, one upregulated gene encoded histidine-containing phosphotransferase protein (AHP) and one downregulated gene encoded two-component response regulator ARR-A family (ARR-A) were identified. Then in the case of other six hormones signaling, several upregulated and downregulated genes were identified. Among them, genes which encoded DELLA protein (DELLA), abscisic acid receptor PYR/PYL family (PYR/PYL), ABA responsive element binding factor (ABF), and jasmonic acid-amino synthetase (JAR1_4_6) were upregulated, demonstrating these genes positively correlated with MT regulated salt stress tolerance in sour jujube. Further protein interaction prediction analysis of 42 DEGs revealed that gene15814 (protein TIFY 10A, transcript variant X1), gene6673 (abscisic acid receptor PYL4-like), gene12590 (auxin response factor 5), gene23244 (auxin-responsive protein IAA27), gene31283 (protein phosphatase 2C 37-like), gene27460 (two-component response regulator ORR10-like), gene14927 (ethylene receptor 2, transcript variant X1), gene28171 (EIN3-binding F-box protein 1-like), and gene20606 (jasmonic acid-amido synthetase JAR1-like) interacted more strongly with other proteins and played an important role in the process of melatonin regulated salt stress tolerance (Fig. 8c).
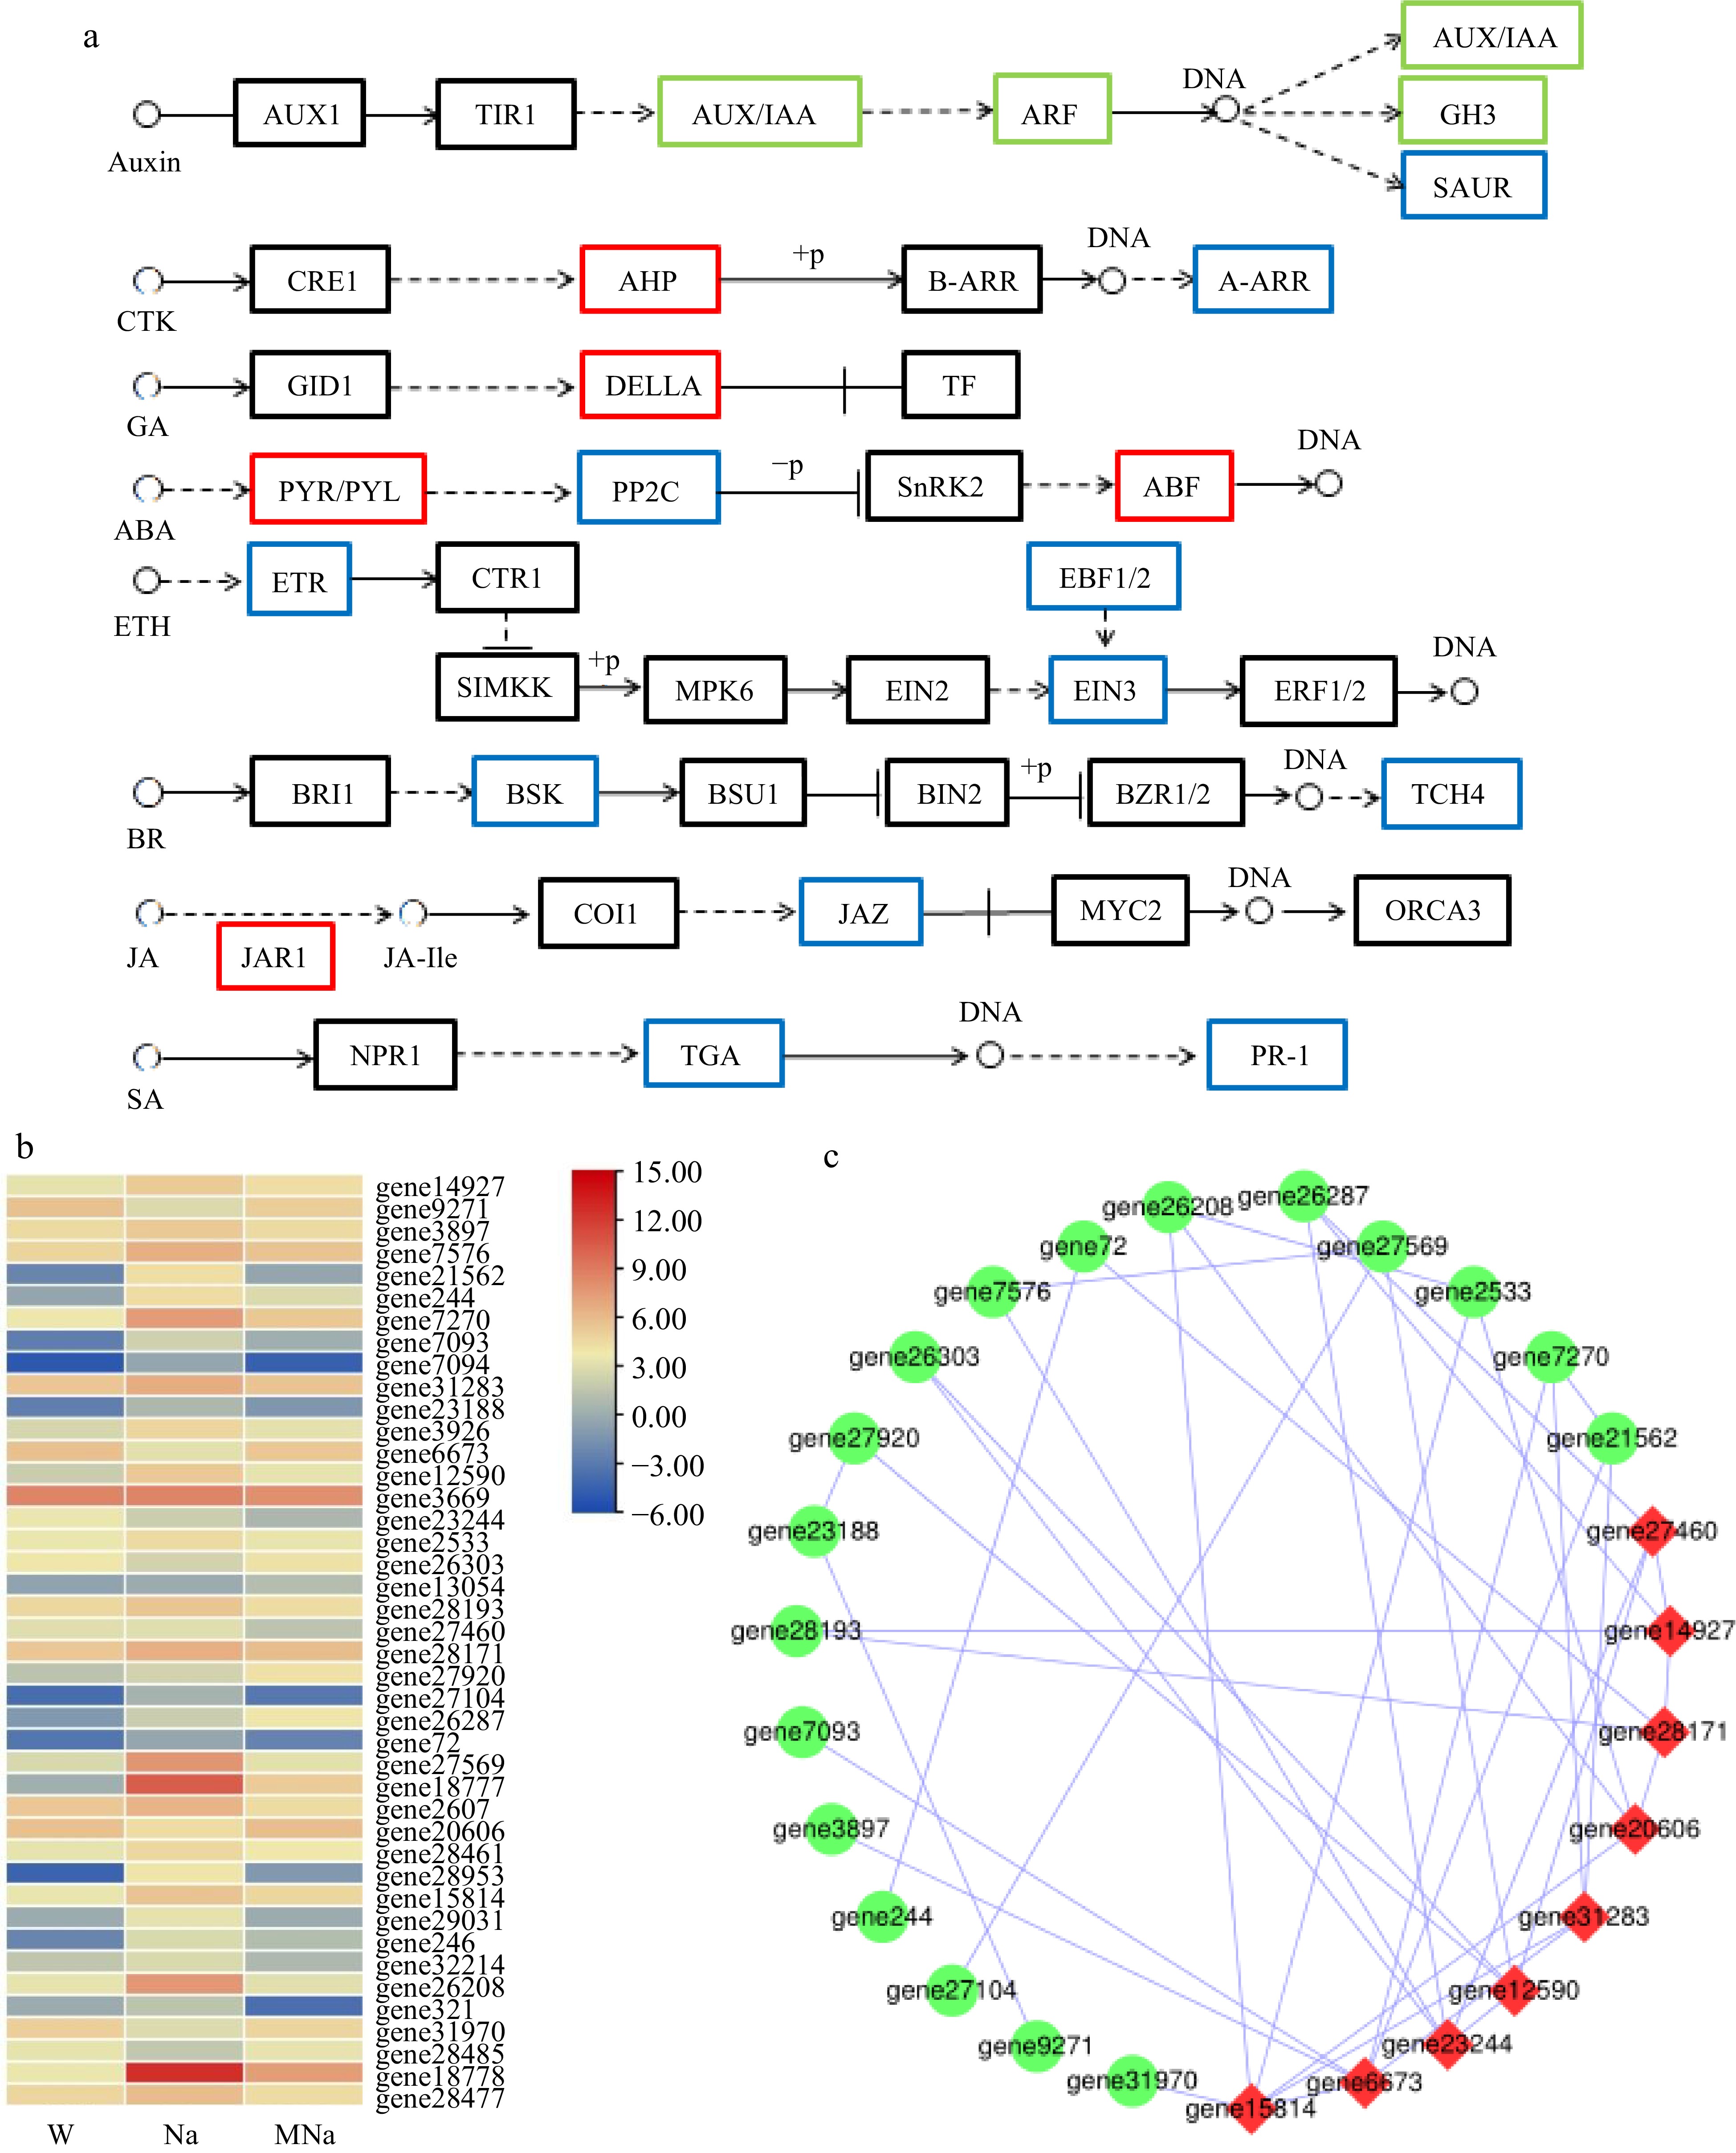
      Figure 8. 

      Key DEGs analysis on plant hormone signal transduction pathway. (a) DEGs analysis in hormone pathways in response to salt stress with MT treatment. Red border represents upregulated genes, blue border represents downregulated genes, and green border represents both up and down regulated genes. Arrows only represent legend indications. (b) Heatmap analysis of related DEGs. (c) Protein interaction network analysis. Node size represents the strength of protein interactions. Red color indicates the key node proteins.

    • Numerous transcription factors (TFs) have been shown to play an important role in the stress response of plants[34]. It is reported that the MYB transcription factor family was involved in the regulation of plant cellular processes and plays a crucial role in various biotic and abiotic stresses[35]. WRKY plays a key role in regulating the stress response of plants and can improve salt tolerance[36]. NAC is involved in the regulation of different developmental processes in plants and has a positive regulatory role in stress-induced senescence in Arabidopsis[37]. Here, these three transcription factor families were induced in the top six TFs in different comparative groups. Among them, in the W vs Na group, 31 DEGs belonging to MYB transcription factor family, 30 DEGs of WRKY transcription factor family and 26 DEGs of NAC transcription factor family were identified (Fig. 9a). While in the Na vs MNa group, 32, 25, and 16 DEGs of MYB, WRKY, and NAC family have been found, respectively (Fig. 9b). The DEGs belonging to MYB, WRKY, and NAC family between the W vs Na and Na vs MNa groups might function importantly in MT regulated salt tolerance in sour jujube.
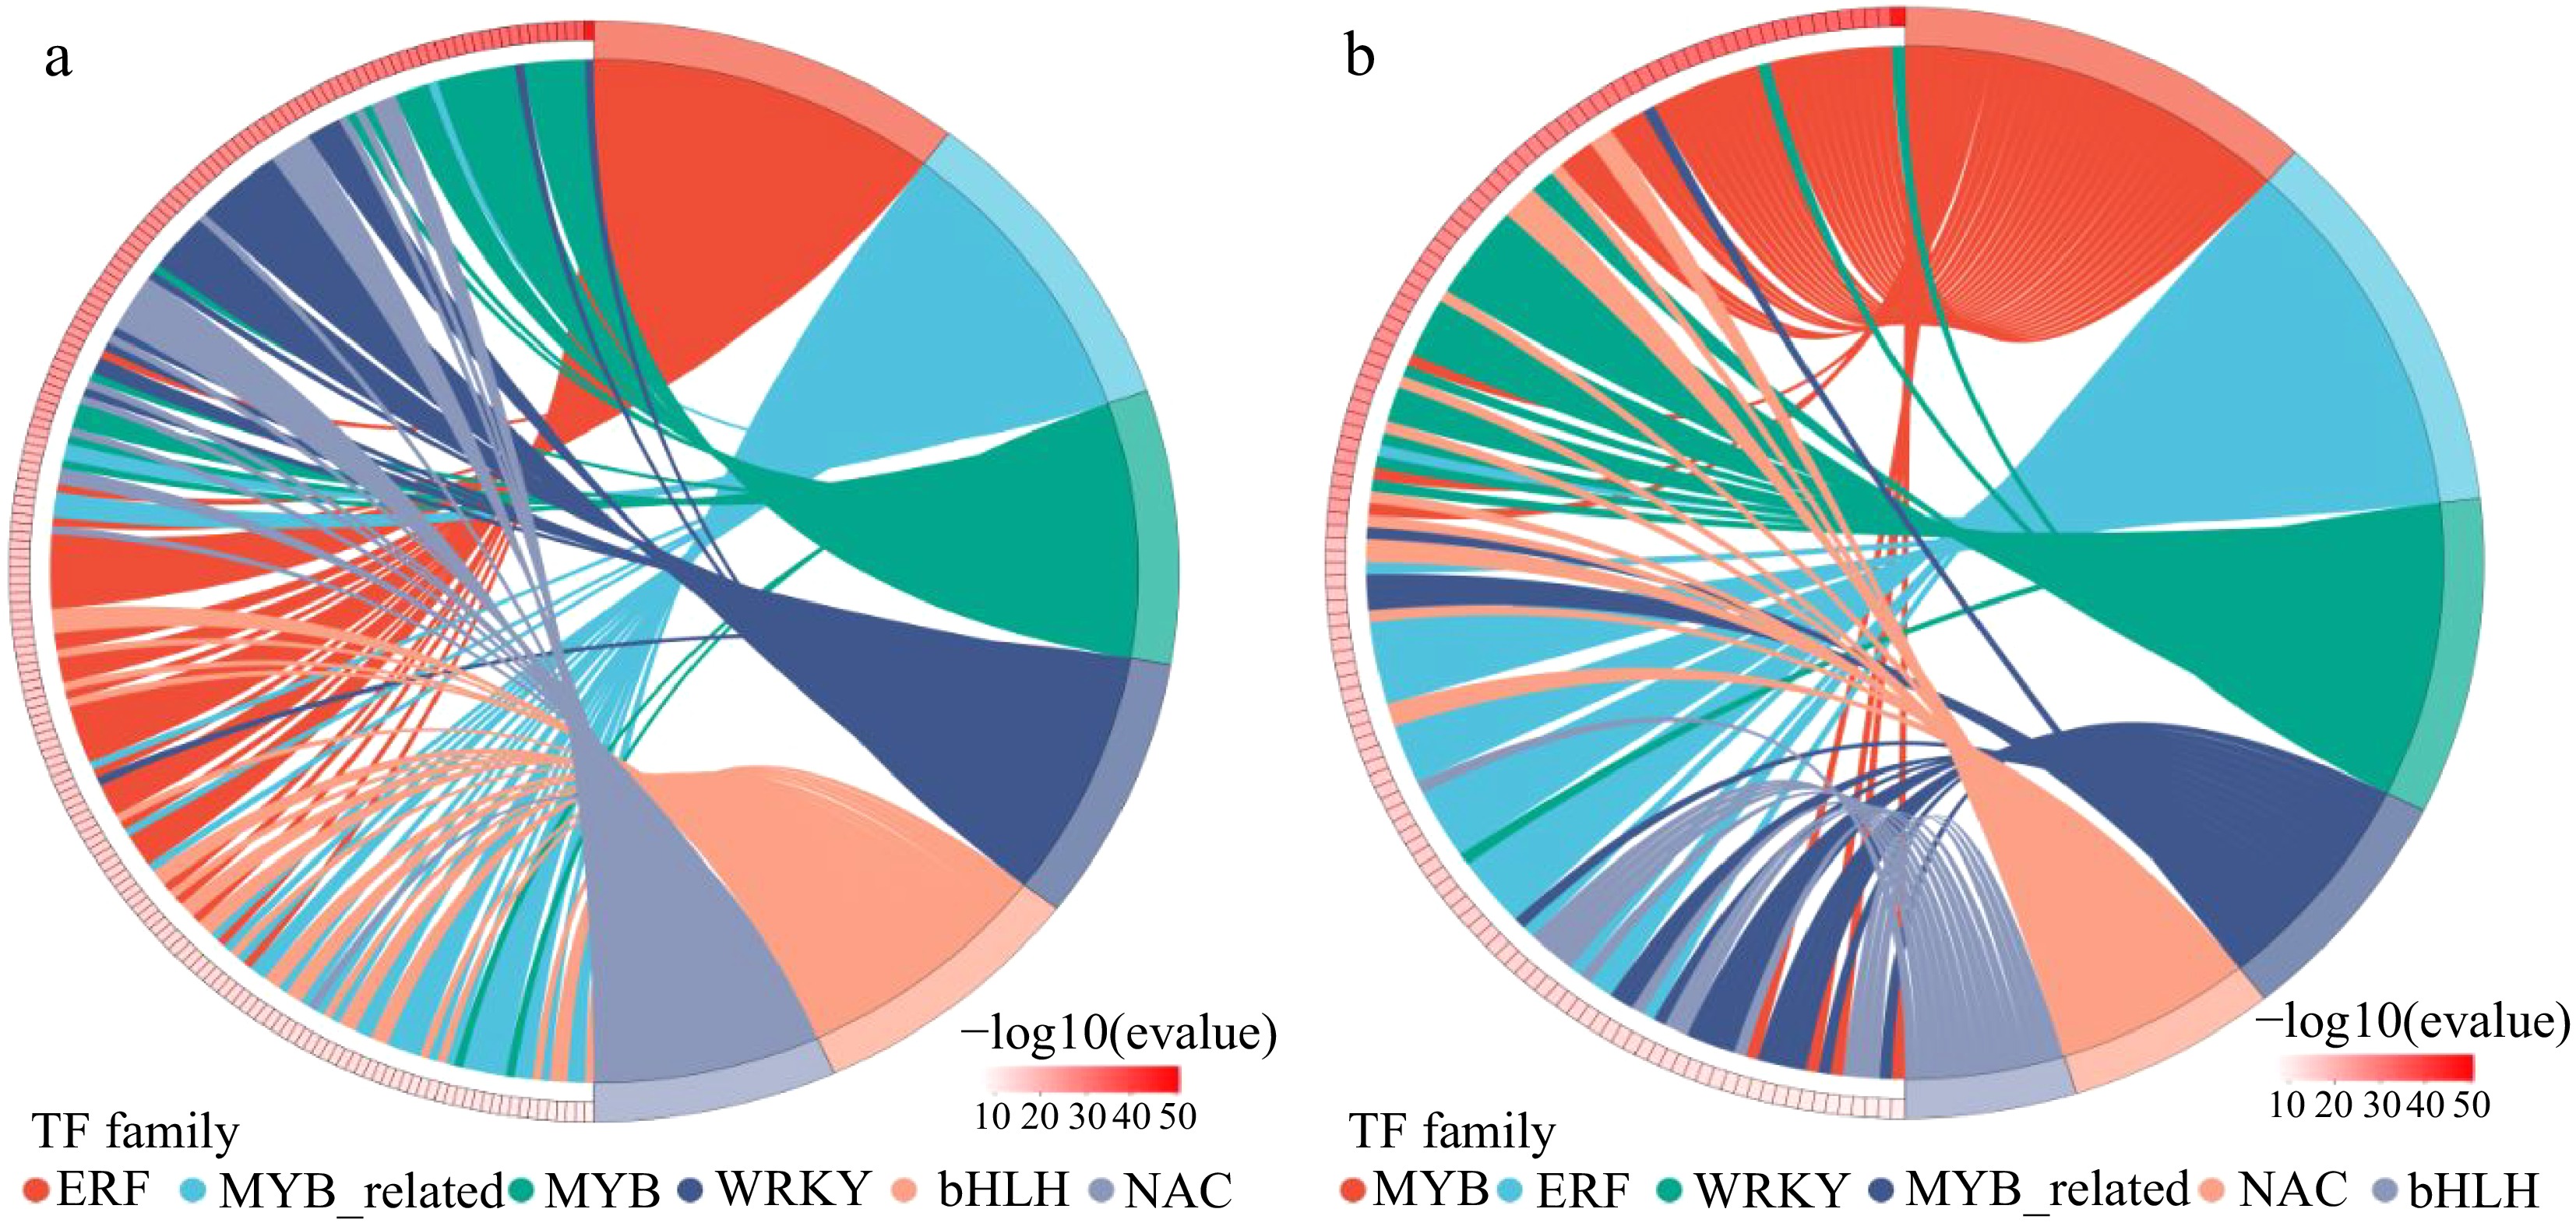
      Figure 9. 

      Distribution map of expressed transcription factor families in (a) W vs Na group and (b) Na vs MNa group. The horizontal coordinates are different transcription factor families, the vertical coordinates are number of genes falling into that transcription factor family.

    • When plants suffer salt stress, harmful cellular changes and phenotypical symptoms, including compatible osmolytes, ion homeostasis, reactive oxygen species (ROS), hormones, are always observed[38]. For example, under salt stress, cucumber seedlings have restricted chlorophyll synthesis, reduced germination rate, inhibited growth, and reduced biomass and yield[39, 40]. In citrus seedlings, salt stress significantly reduced plant height, leaf area, leaf water content, chlorophyll content, and restricted ion uptake[41, 42]. In short, the growth status of different plant species was negatively affected by salt stress to some extent. As an effective growth regulator, melatonin can alleviate the adverse effects of salt stress on fruit trees[43]. After exogenous application of melatonin, the fruit tree had increased nutrient uptake, improved leaf cuticle, reduced osmotic and water loss, and decreased leaf wilting under salt stress[44]. Moreover, MT treatment could also reduce production of stress induced substances, such as ROS, lipid peroxides, H2O2, and MDA, and limited losses of photosynthetic pigments and improved defense systems[45]. For example, in banana seedlings, the application of exogenous MT can enhance salt tolerance by increasing the content of proline content and soluble protein, slowing down the degradation of chlorophyll, reducing membrane permeability, increasing the accumulation of MDA, and enhancing antioxidant defense activity. In our current study, NaCl treatment could induce leaf curling and yellowing, while MT treatment could alleviate the salt stress induced damage in sour jujube seedlings. However, which physiological parameters involved in this process should be further elucidated.

      To initially reveal the molecular mechanism of MT treatment on sour jujube seedlings in response to salt stress, the transcriptomic analysis was performed. It was found more DEGs were identified in MNa vs Na group than that in MNa vs W group. KEGG enrichment analysis showed these DEG mainly involved in plant hormone signal transduction pathway as well as MAPK signaling pathway and phosphatidylinositol signaling pathway. In the study of salt stress on banana, cotton, and rapeseed seedlings, plant hormone synthesis and its signal transduction, lignin and fatty acid metabolism, and phenylalanine metabolism play important roles in MT regulated salt stress[38, 46]. Together with our results, these major metabolism pathways, especially the plant hormone signal transduction pathway may be involved in the potential mechanism of MT effect on salt stress.

      Plant hormones play an important role in resistance to abiotic stresses[4749]. ABA is a plant defense hormone that improves plant resistance. Under salt stress, endogenous ABA could be significantly induced which could activate the synthesis of related protein kinases to improve salt stress[50]. GA is involved in multiple processes of plant growth and can promote the growth of tree stems, which is a stimulating factor in plants[51]. In response to salt stress, GA levels could be reduced which further inhibited plant growth[52]. Other hormones could also regulate the plant growth and development and function importantly in response to stresses. For example, the increase of SA level is related to the improvement of active oxygen scavenging and antioxidant capacity, and plays an important role in improving plant abiotic stress. JA can also improve salt tolerance by enhancing its antioxidant capacity. According to reports, MusaNAC29 transcription factor is involved in regulating drought and salt tolerance in bananas by altering the content of plant hormones such as SA and JA[53]. MT is an important regulator of the expression of plant hormone-related genes and plays an important role in response to salt stress. In cotton, salt stress could decrease the endogenous contents of MT and enhance the accumulation of IAA, GA, BR, and ABA[46]. In banana, auxin, cytokinin and gibberellin signaling were identified function importantly under MT + NaCl treatment. In our study, 42 DEGs involving in different hormone signal transduction pathways were identified. Among them, genes encoded DELLA, PYR/PYL, ABF, and JAR1 were upregulated, demonstrating these genes positively correlated with MT regulated salt stress tolerance in sour jujube. However, the biological function of their involvement in MT regulated salt tolerance in sour jujube should be further demonstrated. If conditions permit, further exploration will be conducted on the changes in plant hormone content of jujube seedlings under salt stress accompanied with MT treatment to further confirm how MT regulated the changes of hormones to alleviate the damages induced by salt stress.

      As well as plant hormone signal transduction pathways, Ca2+ and MAPK signaling pathways act together within exogenous MT regulated salt stress in sour jujube seedlings. Among them, the MAPK signaling pathway has two key sub-pathways which were related to salt stress, and 12 DEGs involved in this process. Under different abiotic stress with MT treatment, the function of the MAPK pathway has also been demonstrated. For example, the number of DEGs involving in MAPK signaling pathway was significantly affected by exogenous MT treatment under stress in maize[31]. Under salt stress, the expression of MAPK genes was significantly upregulated in plum with exogenous MT treatment[54]. In oat seedlings, MAPKs involving in the ABA signaling pathway participated in drought stress[55]. Here, the gene6673 encoding PYL and gene8078 encoding MKK3 might function positively in MT allevated salt stress induced damage in sour jujube and deserve further study.

      Ca2+ plays a regulatory role in stress response during plant growth and development. When plants are subjected to various external stimuli, such as temperature, light, salt, and drought, Ca2+ will be released into the cytoplasm through Ca2+ channels to generate specific signals for signal transduction[56]. In our study, exogenous application of melatonin treatment induced the expression of gene11755, gene15410, gene11271, and gene8128 under salt stress, thereby regulating calmodulin protein (CALM), which may promote Ca2+ uptake to mediate signal transduction and mitigate the damage caused by salt stress to sour jujube seedlings. However, all the above pathways, especially the corresponding DEGs should be functionally demonstrated in future studies.

      As regulators of genes, transcription factors have been confirmed to perform vital functions in regulating abiotic stress responses in plants[57]. It is shown that different types of transcription factors, mainly including AP2/ERF, NAC, bZIP, MYB, WRKY can play a crucial role in response to various stress[58]. In the current study, the transcription factors MYB, WRKY, and NAC were identified, which are associated with adversary stresses, and possibly regulate a large number of DEGs to promote MT induced salt tolerance in sour jujube seedlings.

      To take all the data together, we come to a proposed model where MT treatment could regulate the MAPK pathway and the genes related to hormones to confirm MT induced salt tolerance in sour jujube. Meanwhile, calcium signaling was also involved (Fig. 10). The current results and proposed model could provide some theoretical basis for understanding the molecular mechanism of how applying exogenous MT alleviated the damage caused by salt stress to sour jujube seedlings, but the specific regulatory mode and pathway need to be further explored.
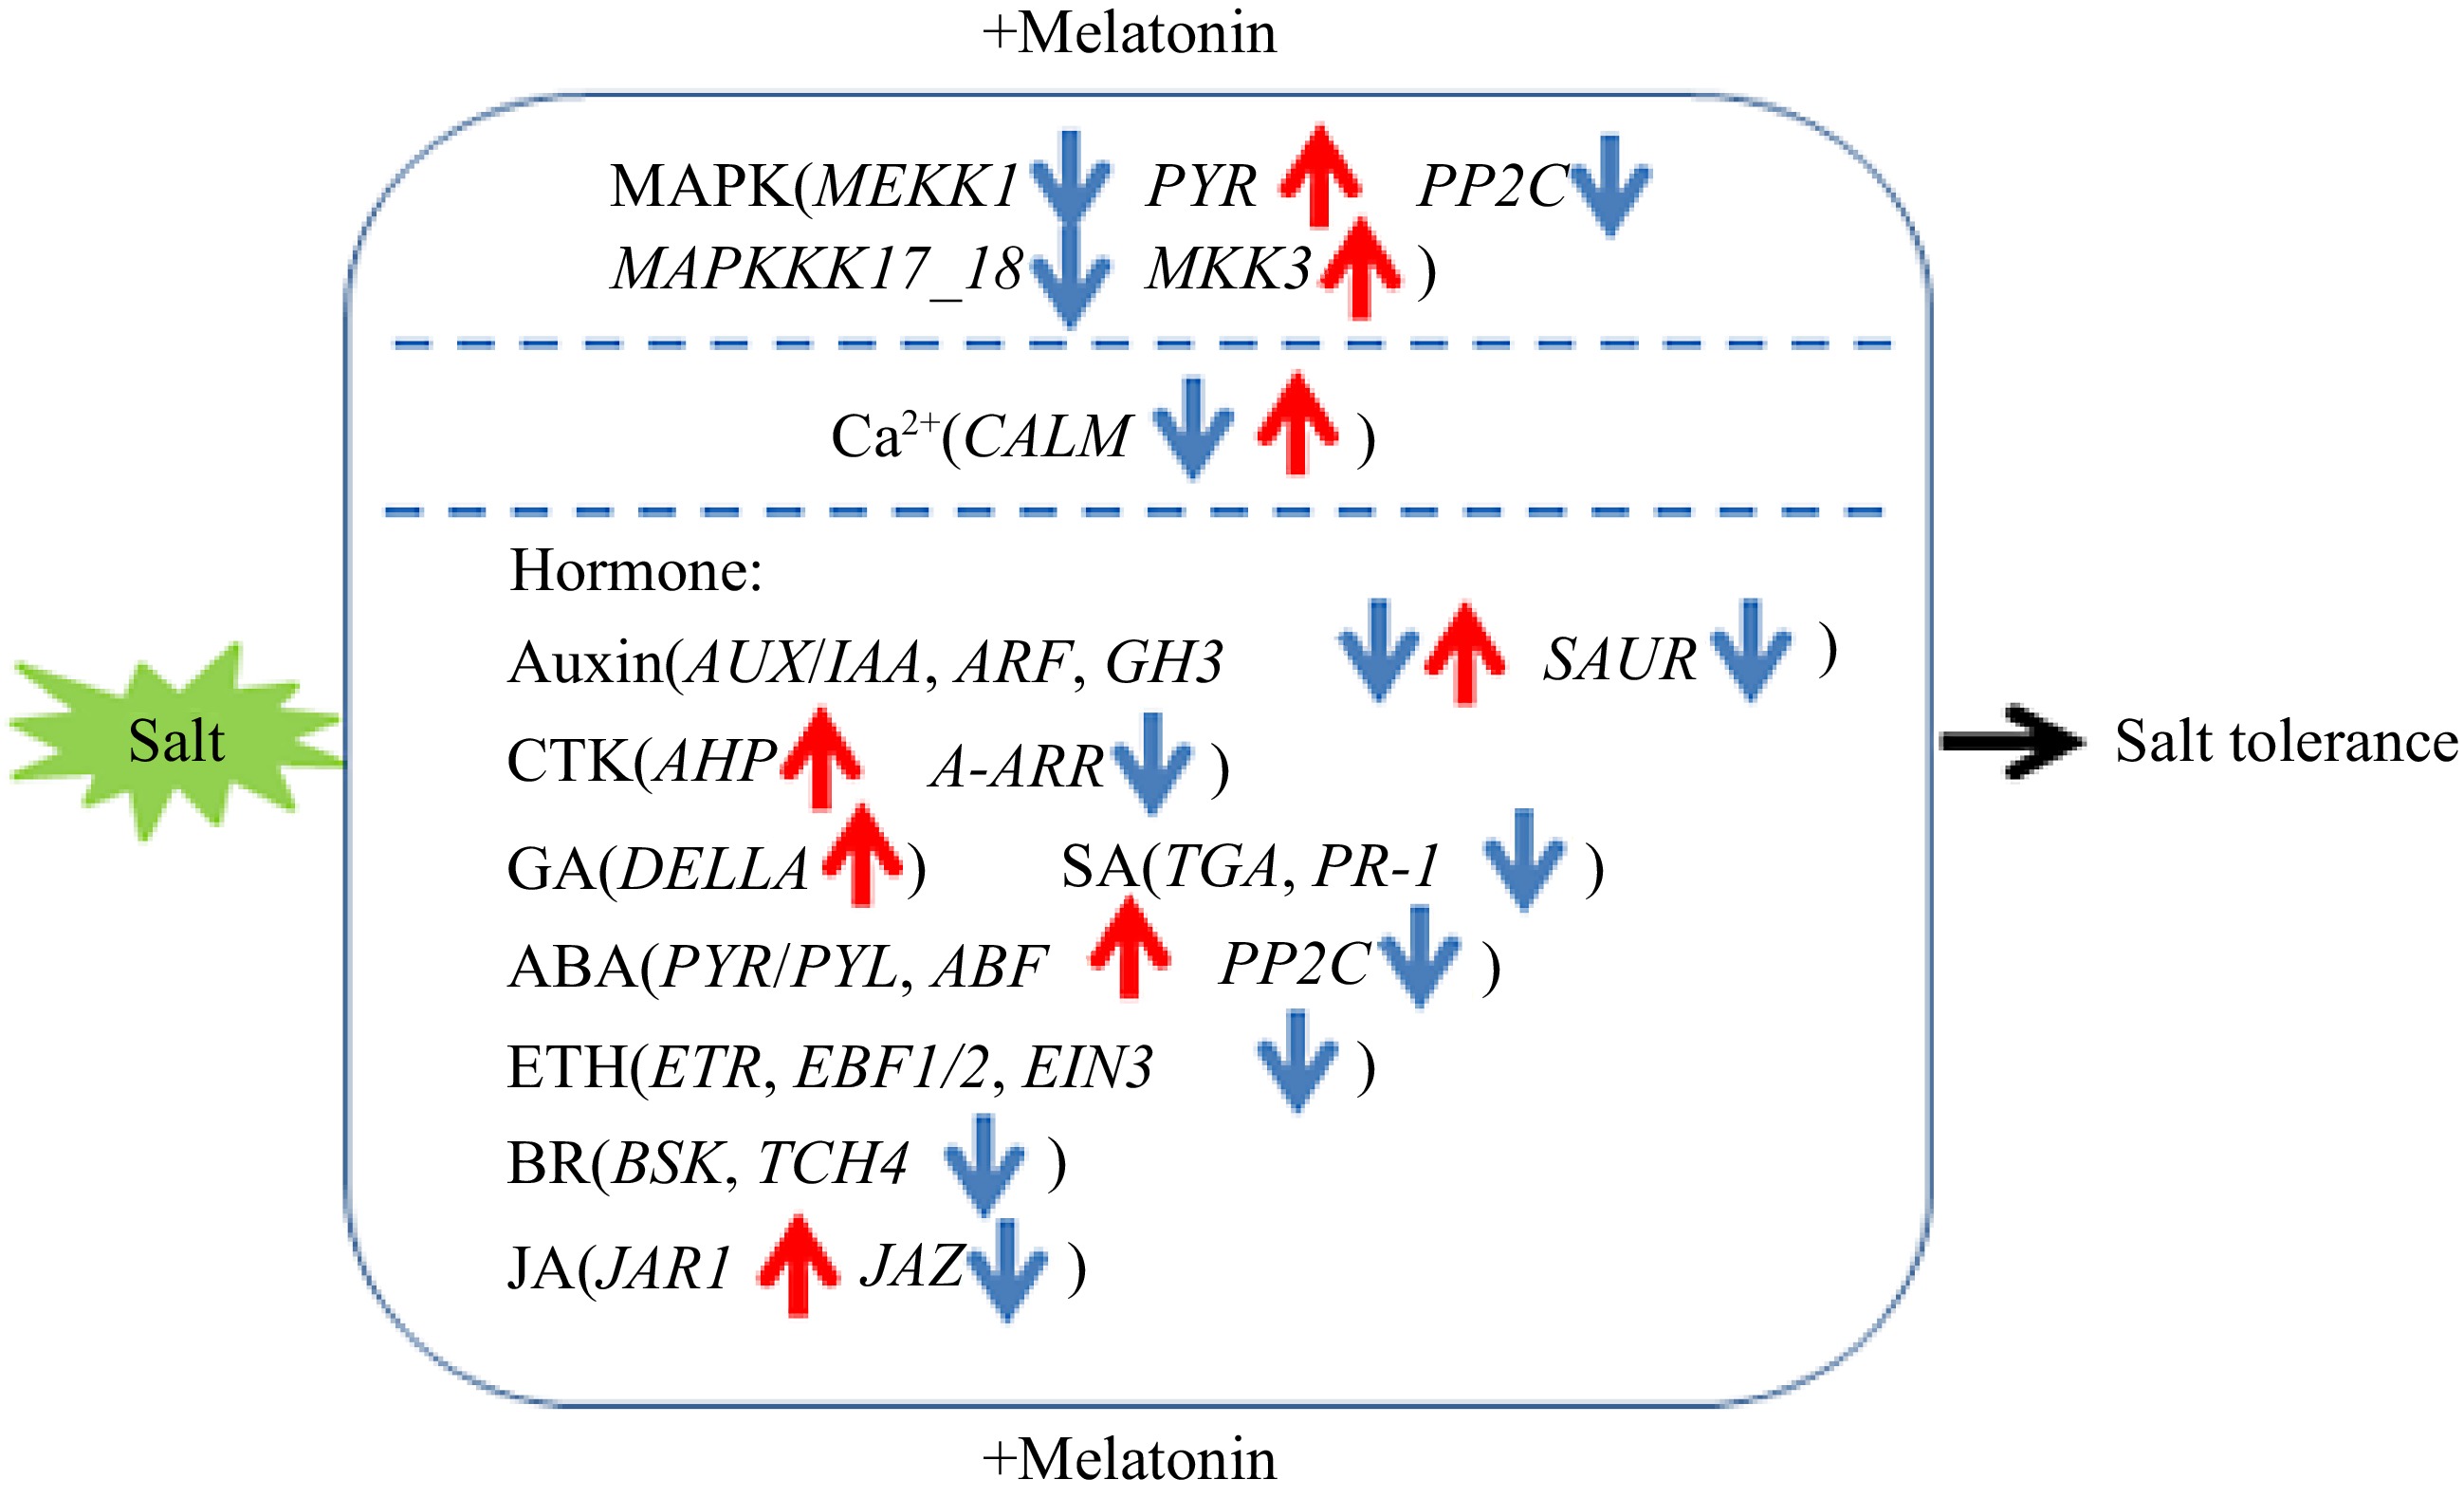
      Figure 10. 

      Proposed model of exogenous melatonin application on effects of sour jujube seedlings in response to salt stress. Blue arrows represent regulatory downregulated genes and red arrows represent regulatory upregulated genes.

      • This research was funded by Provincial Supporting Program of Hebei for the Returned Oversea Scholars (C20210114); Science and Technology Project of Hebei Education Department (QN2022017); Fundamental Scientific Research Fund of Universities in Hebei Province (KY2021059); China Agriculture Research System (CARS-30-2-07); Natural Science Foundation of Hebei province (C2020204082); Funds for Hebei Jujube Industry Technology Research Institute after Operation Performance (205676155H); Young Talent Project of Hebei Agricultural University Foundation (YJ201853).

      • The authors declare that they have no conflict of interest.

      • # These authors contributed equally: Wenhui Zhu, Haonan Cao

      • Supplemental Fig. S1 Overall observation of phonotypical changes of sour jujube seedlings after192 h NaCl (a) and MT plus NaCl (b) treatments, respectively.
      • Copyright: © 2023 by the author(s). Published by Maximum Academic Press, Fayetteville, GA. This article is an open access article distributed under Creative Commons Attribution License (CC BY 4.0), visit https://creativecommons.org/licenses/by/4.0/.
    Figure (10)  Table (1) References (58)
  • About this article
    Cite this article
    Zhu W, Cao H, Wang Q, Niu Y, Sadeghnezhad E, et al. 2023. Transcriptome analysis revealed MAPK and hormone pathway involving in exogenous melatonin-regulated salt tolerance in sour jujube. Fruit Research 3:19 doi: 10.48130/FruRes-2023-0019
    Zhu W, Cao H, Wang Q, Niu Y, Sadeghnezhad E, et al. 2023. Transcriptome analysis revealed MAPK and hormone pathway involving in exogenous melatonin-regulated salt tolerance in sour jujube. Fruit Research 3:19 doi: 10.48130/FruRes-2023-0019

Catalog

  • About this article

/

DownLoad:  Full-Size Img  PowerPoint
Return
Return