-
The tropical C4 grass, bermudagrass (Cynodon spp.), belongs to the Chloridoideae family, of which C. dactylon is the most widely distributed member of the genus. C. dactylon and C. dactylon ×
C. transvaalensis hybrids are commercially used as turf in many public parks, golf courses and sporting fields in Australia due to their recuperative potential, colour and high tolerance to drought[1]. Evidence suggests that compared with other turf species, Cynodon grasses are susceptible to shade stress as a result of decreased Photosynthetic Photon Flux (PPF) with decreases in turf quality metrics such as colour and density after prolonged shading[2,3]. As 20%−25% of turf is exposed to regular shading, there is considerable interest in developing shade-tolerant cultivars, with the role of the cell wall in responding to decreased PPF also significant[4,5]. Decreased PPF attributable to shade, leads to reduced photosynthetic rates, chlorophyll a and b content, total protein content and decreased soluble carbohydrate content, collectively hypothesized to reduce nitrogen uptake, resulting in stunted root growth and elongation of leaves[3,6]. Plants typically employ a shade avoidance or growth response to avoid low PPF and seek sunlight by increasing the length of internodes and leaves, increasing leaf area and resulting in thinning of turf leaves[7]. Shade tolerance is an alternative response observed, particularly in dwarf varieties with reduced gibberellin production, characterized by decreased overall biomass accumulation and increased chlorophyll content to maximise light capture capability[8,9].
The quality of light received by plants is also vital, particularly the ratio of Red:Far Red (R:FR) light. Shade is known to reduce the R:FR ratio, with phytochrome A detecting Far Red wavelengths (700−800 nm) associated with reduced PPF and phytochrome B responding to the photosynthetically active wavelengths of light (PAR; 400−700 nm). Phytochrome B is responsible for regulating the growth pathway, increasing auxin levels, elongating stems and plant height[10]. Light with a reduced R:FR ratio has also been shown to increase RuBisCo activity and produce greater biomass. Increasing photosynthetic capacity ensures a high supply of carbohydrates for cellulose synthesis and cell wall carbohydrates, while lignin content is reduced in tomato seedlings grown under low light conditions[11]. Turf management regimes to improve quality traits such as colour and coverage under shade stress, have been trialed with alterations to nitrogen application, growth regulator application and elevation of mowing heights. The success of these management regimes, however, is not universal and the shade tolerance of individual cultivars wields the most significant influence[12]. To date, there have been studies investigating the effects of altered PPF on different cultivars of Cynodon grasses; these studies have focused predominantly on the subjective measurements of colour, density and biomass accumulation to determine turf quality, with none of these studies having focused on the role of the cell wall in response to altered PPF[13−16].
Fourier Transform Infra-red (FTIR) spectrometry is a valuable tool when analysing cell wall composition, with many wavenumbers within the range of 450−4,000 cm−1 associated with cell wall compounds[17−19]. It also has the advantage of being non-destructive to the cell wall and the short measurement period of only minutes provides a high throughput capacity, in contrast to more conventional cell wall analysis methods that are time-consuming and expensive as they generally require multiple pieces of equipment[17,20]. Most studies have utilised a PCA approach to categorise and identify phenotypes of various plant tissues such as wood, stem, and fruits based on spectra to select varieties for more in-depth analysis[17,18,21,22]. While useful, this approach cannot quantify any single component in the analysed tissue. Partial Least Squares Regression (PLSR) models calibrated with spectral and analytically derived reference data can accurately predict and quantify cell wall components of interest, such as individual carbohydrates, lignin and pectins[23−26]. The study described herein sought to utilise PLSR models to test a hypothesis that a reduction in PPF would result in measurable changes in cell wall composition in eight different cultivars of Cynodon grasses grown over seven weeks.
-
Six cultivars of C. dactylon (Wintergreen, OZTUFF®, Grand Prix, Legend®, UQ25a1 and UQ545) and two C. dactylon × C. transvaalensis hybrid cultivars (Latitude 36® and TifSport®) selected for the experiment were established in 1.2 m × 2.4 m plots at the Redlands Research Station (27.5274° S, 153.2509° E) Cleveland, Queensland, Australia on red podzolic soil in February and March of 2017. In addition to the control (0% reduction of PPF), the cultivars were grown under woven cloth that reduced PPF by 30%, 50% and 70%, as shown in Fig. 1. Three granular fertilisers Turfstarter (45 kg/ha), Couchmaster (7 kg/ha) and Renolblen Sport (24 kg/ha) were applied monthly throughout both establishment of the grasses and the trial itself. Weeds were controlled by hand weeding and a spot spraying of 74 g/L Disodium Methylarsonate (DSMA) and 50 g/L of Chlorpyrifos was used to manage the threat of lawn army worm. The mean weekly midday PPF measured when plots were mown, is listed in Table 1 for the control and each of the three treatments, with the theoretical PPF based on the woven cloth manufacturer's rating and the ratio of R:FR received by plants under each treatment also shown.
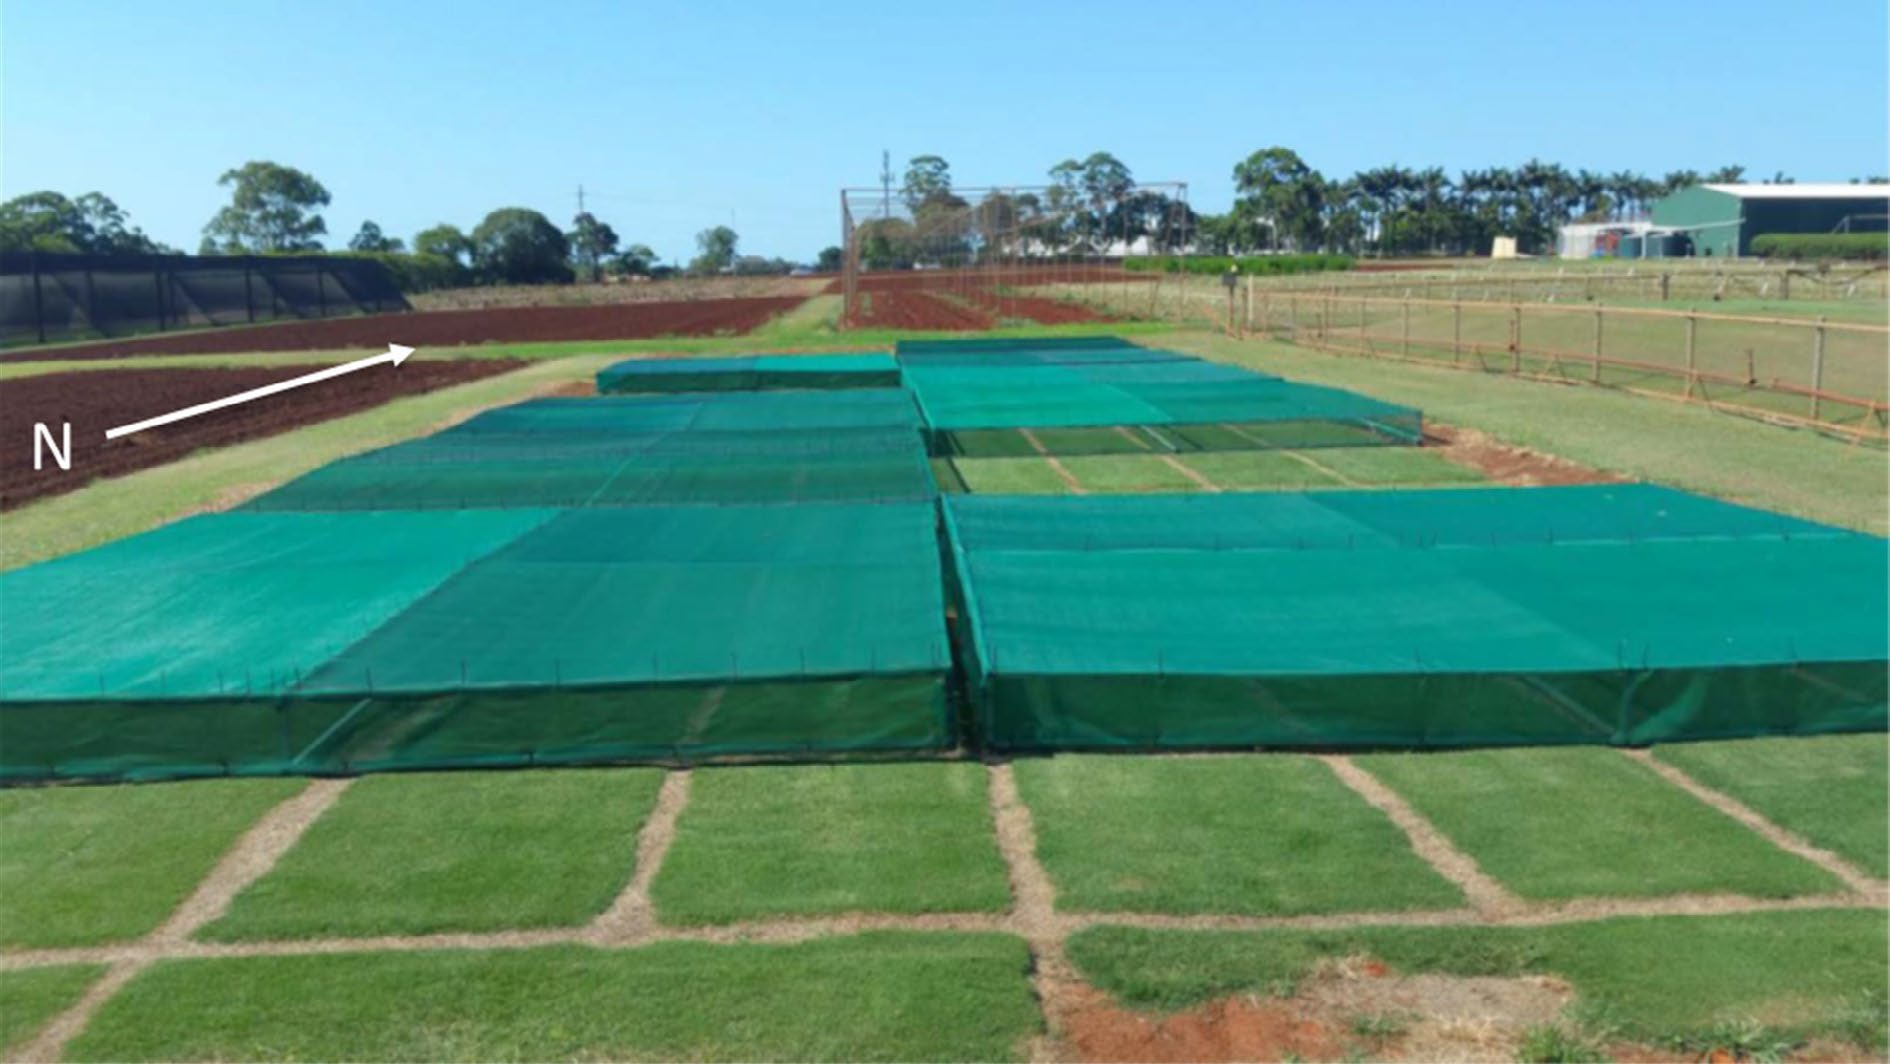
Figure 1.
Experimental plot with woven cloth providing different treatments estimated by the manufacturer to be a 30%, 50% and 70% reduction of PPF, with the uncovered quadrants serving as the controls. The eight different cultivars of Cynodon grasses were assessed for seven weeks to determine the effect of reduced PPF on the amount of biomass produced and cell wall composition. The woven cloth was removed weekly for sufficient time to allow clipping to be undertaken.
Table 1. Mean weekly PPF measurements (μmol·m−2·s−1) were recorded at midday using a LiCor LI6400XT® external light sensor for each plot established in the experimental design. The theoretical mean based on the manufacturer's ratings and the ratio of R:FR light received by the plant were also calculated.
Reduced PPF treatment Actual mean PPF
(μmol·m−2·s−1)Theoretical mean PPF
(μmol·m−2·s−1)R:FR
ratio0% Reduced PPF 1,537 1,537 1.27 30% Reduced PPF 1,022 1,075 1.23 50% Reduced PPF 679 768 1.16 70% Reduced PPF 337 461 1.02 A trial based upon a split-plot design (Supplemental Fig. S1) with two factors the main plot (reduced PPF) , and the sub-plot, (cultivar) randomly reproduced over three adjacent blocks. Weekly clippings were collected over seven weeks by mowing, commencing on the 3rd of February 2017 with a reel mower set at a height of 20 mm, dried at 60 °C for three days and weighed to determine the amount of biomass produced. The trial was assessed at three time points, a short period (weeks 1−2), medium period (weeks 1−5) and long period (weeks 1−7). At each time point, the total clipping yield was assessed to determine if a cumulative effect was attributable to the imposed treatments. Once dried and weighed, all clippings were ground to a fine powder using a customised roller mill[27]. Approximately 20−40 mg was scanned four times to obtain average spectra using a Perkin Elmer Spectrum II FTIR® instrument (Perkin Elmer, Waltham, MA, USA) fitted with a Universal Attenuated Total Reflectance (UATR) sampling accessory.
Determination of reference data
-
To generate a PLSR model, a reference set of 144 randomly selected samples underwent compositional analysis. The analysis required the removal of any non-cell wall components (extractives and water) by washing and redrying the sample to determine the cell wall content of the biomass. The isolated cell wall material underwent a two-stage acid hydrolysis[28] with the residue used to determine Acid Insoluble Lignin (AIL) and ash content. The hydrolysate was used to measure cell wall glucan, xylan, arabinan, galactan and mannan content by High-Pressure Liquid Chromatography (HPLC). The instrument used was an Agilent 1,260 series® HPLC (Agilent, Santa Clara, CA, USA) equipped with a refractive index detector and Bio-Rad® HPX-87P column (Bio-Rad, Hercules, CA, USA) with a flow rate of 1 ml/min and a mobile phase of ultra-pure water. Acid Soluble Lignin (ASL) was determined by measuring absorbance at 280 nm on a UV nanodrop spectrometer (Thermo scientific nanodrop 1,000®, Thermo Fisher Scientific, Waltham, MA, USA).
Development and application of FTIR prediction models
-
Spectral and reference cell wall composition results were entered into Unscrambler® (Camo analytics, Bedford, MA, USA) software to develop PLSR models to predict each major cell wall component. A subset of 124 of the 144 reference samples was chosen randomly to form a calibration set to generate a PLSR model, while the remaining 20 samples were used to form an independent validation set to reduce the likelihood of the model overfitting. A series of regression models were produced using combinations of the pre-treatment options available in Unscrambler®, such as area normalisation, Multiplicative Scattering Correction (MSC), Standard Normal Variate (SNV), smoothing and 1st and 2nd derivative transformations of spectra to determine the optimum pre-treatment for each variable. An ideal threshold set for models was a Pearson R2 above 0.90 based on what had been achieved in similar studies in sorghum, and other forage grasses and the lowest possible Root Mean Squared Error (RMSE) for each model[24−26]. Supplemental Table S2 provides a list of R2 and RMSE values for all spectral treatments tested for each variable, with plots of predicted versus reference values for the key components total lignin and total carbohydrates shown in Fig. 2a & b, with all other variables plotted in Supplemental Figs S2−S12. The modelled variables were predicted confidently with validation sets of R2 values ~0.9 or above, except for arabinan, galactan and mannan, which were less than 0.8.
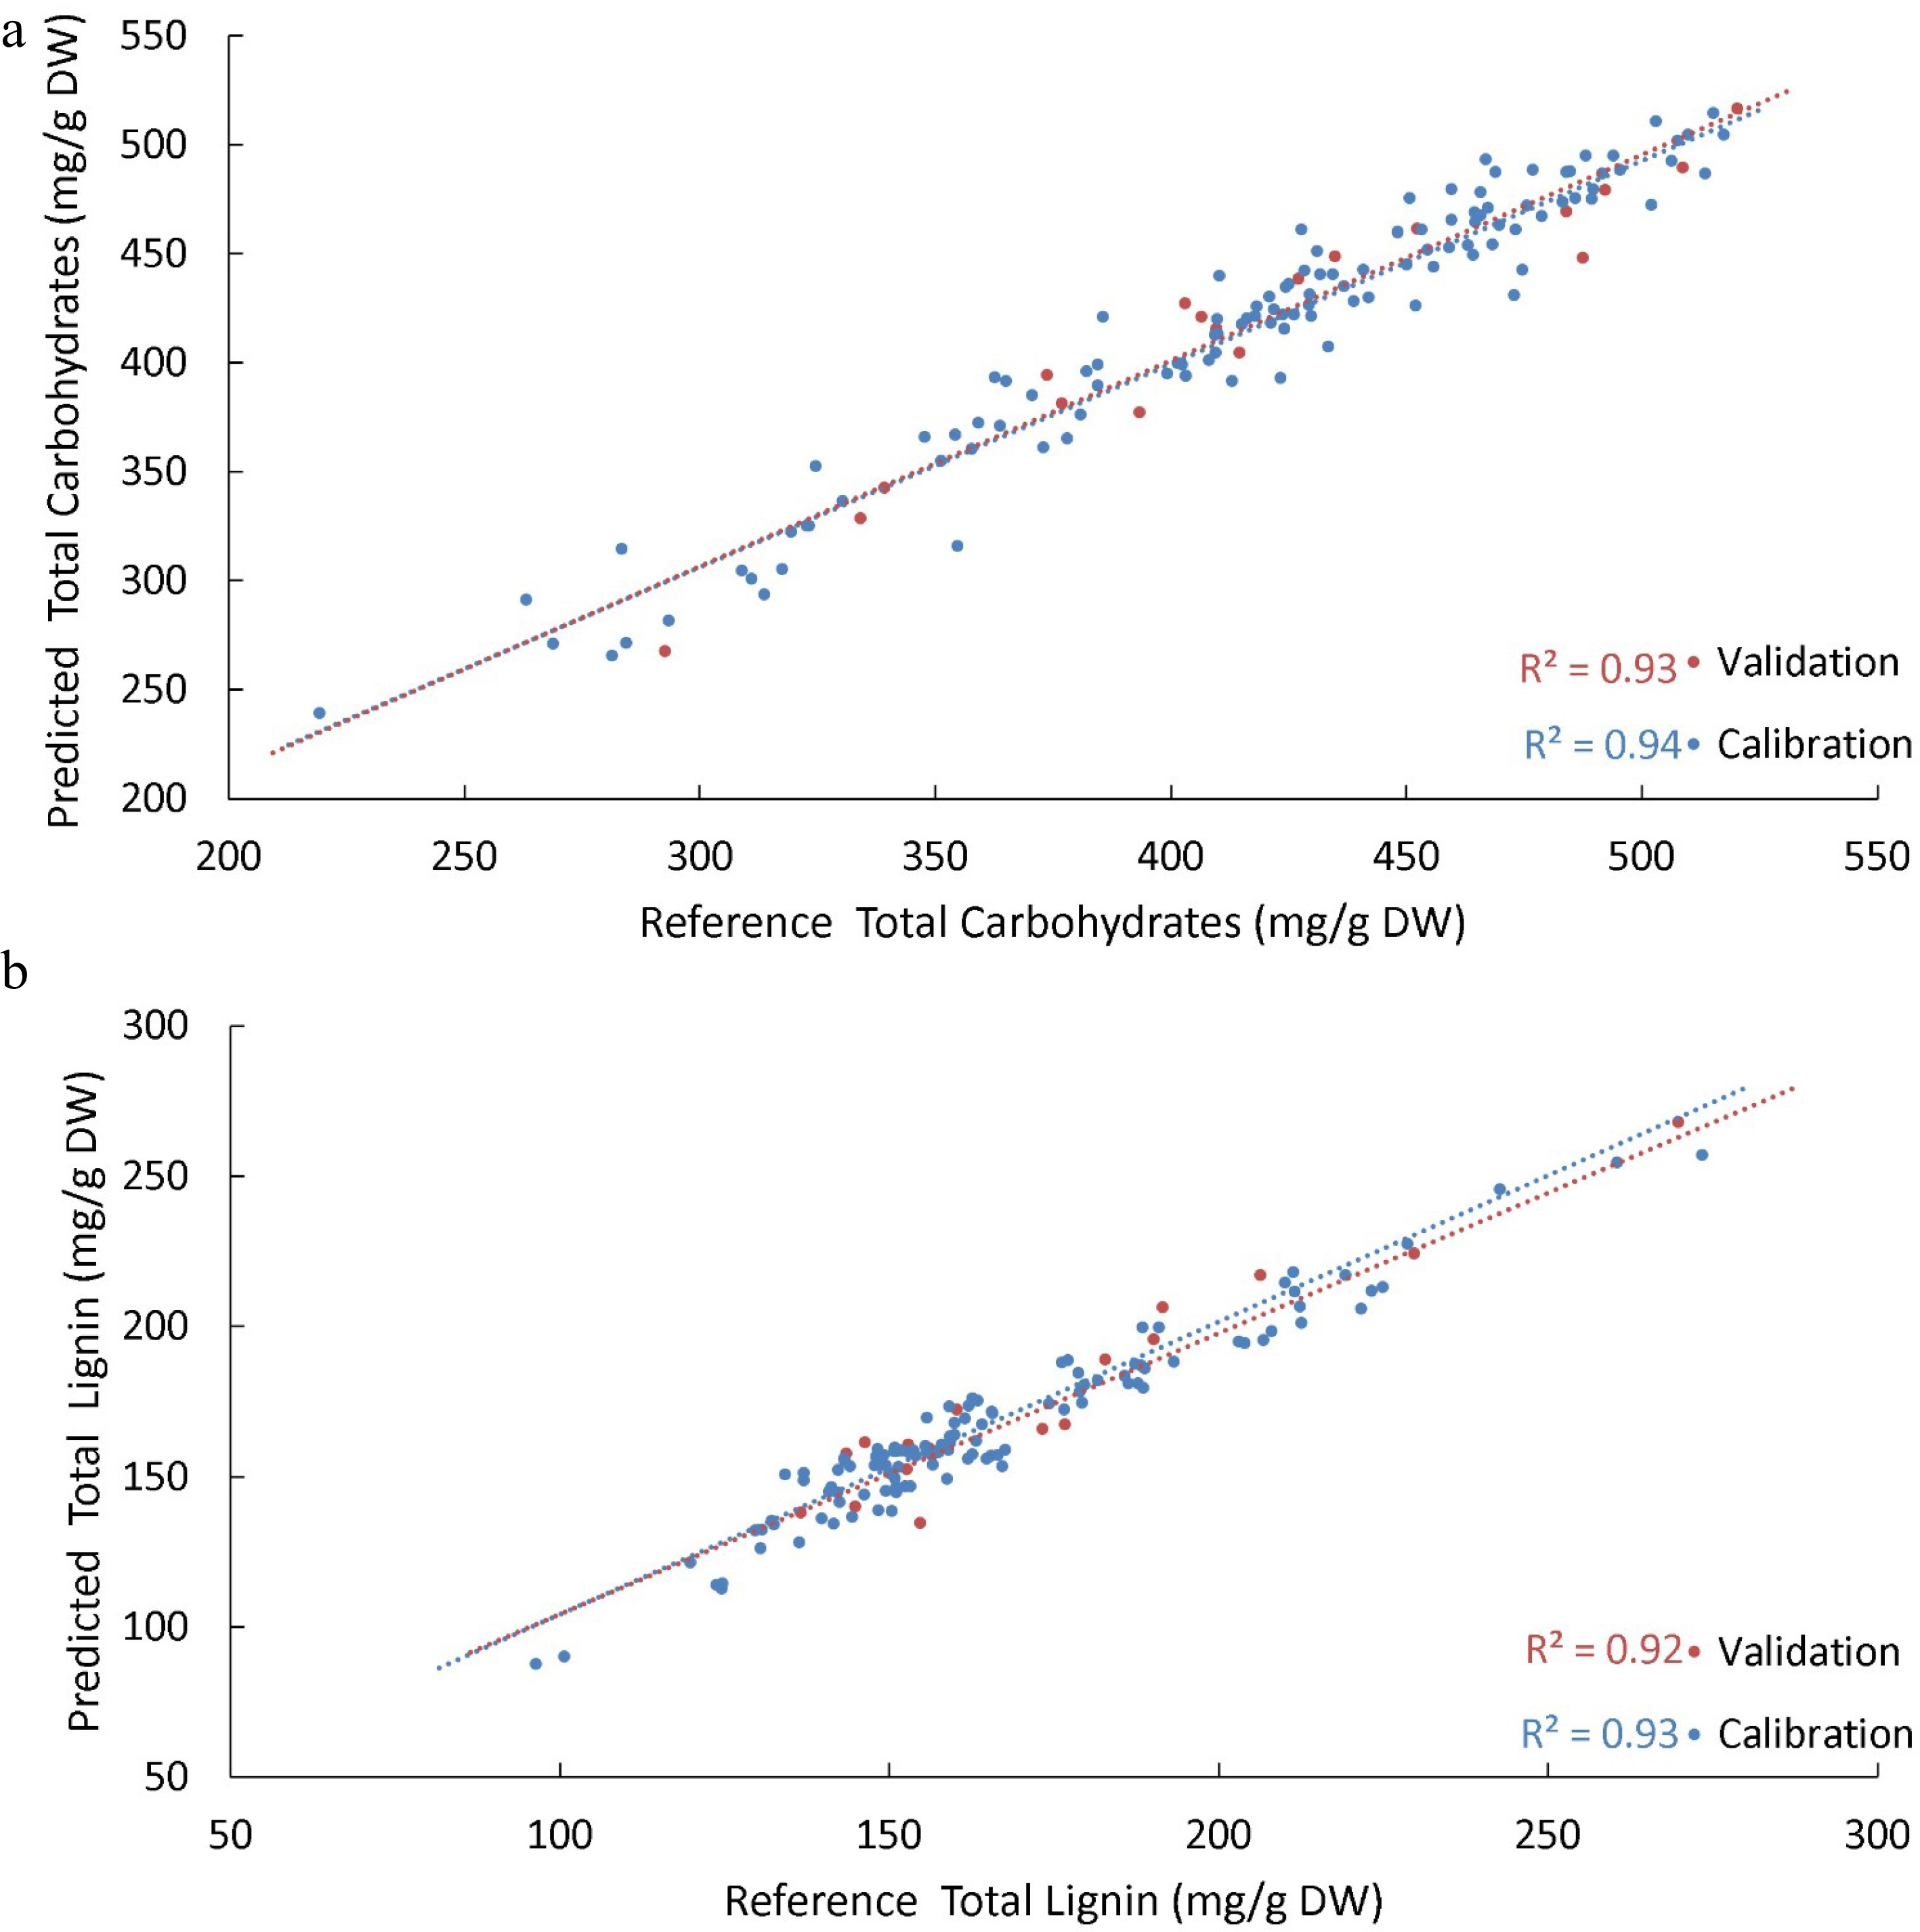
Figure 2.
PLSR models were generated to predict the various biomass components of Cynodon cultivars. (a) Shows the predicted values from the PLSR model developed for total carbohydrates present in the cell wall versus reference values for the same sample. (b) Shows the predicted versus reference values for total lignin present in the cell wall. For both models, a subset of data was withheld to be used as an independent validation set of samples (red); the R2 of the validation set was used to assess the robustness of the model in predicting unknown samples. A benchmark R2 of 0.90 for this validation set was nominally established for predictive models, which both achieved.
Statistical analysis
-
Initial analysis of all measured traits was performed using a mixed-effects model for a split-plot analysis of variance with period, cultivar and reduced PPF treatment as the main effects, and residuals for the model were calculated using a first-order autocorrelation to account for repeated (weekly) measures using the ASReml-R software package. Variance components are given in Supplemental Table S1 which showed that 'period' was the main factor accounting for observed variation in the key traits. However, this repeated measures analysis did not give the opportunity to present the data in a way that would be easily displayed, for example, we would not have been able to present histograms, with Least Significant Difference (LSD = 0.05) for key traits; treatments and cultivars for each period of this study. Consequently, for clarity of data presentation, three independent split-plot analyses one for each period, without repeated measures, were performed on all traits (clipping yield, turf quality, water quality, extractives, cell wall, total carbohydrates, glucan, xylan, arabinan, galactan, mannan, total lignin, AIL, ASL and ash) in the final week of each period using the Agricolae package in R studio to determine the effect of treatment and cultivar. Throughout the trial multivariate analyses were used to develop dendrograms and PCA plots. All values were standardized by dividing the mean for each variable by the standard deviation for that period. Dendrograms were constructed using Ward Linkage and Squared Euclidean distance options to observe interrelationships among, traits, cultivars and altered PPF levels at each time period. These multivariate analyses were also performed in R Studio using the gclus, dendextrend, dplyr, stats, and ggplot2 packages.
-
The initial mixed effects analysis of clipping yield (Supplemental Table S1) revealed that period (46.5% of variance) had the greatest influence on the variation observed in clipping yield followed by cultivar and no variation due to treatment. However, there was variation attributed to interactions between the treatments and period and cultivar, suggesting that cultivars responded to the shade treatments differently at different points throughout the trial. For this reason a comparison at the end of each period for all traits investigated was undertaken to determine which traits changed between periods.
Individual Period Clipping Yield
-
The main effects (PPF treatments, cultivar) were significant in each period (short, medium and long), however, interaction effects were only significant for the medium and long periods (Table 2). Consequently, LSD's were calculated using the appropriate error terms of the ANOVA for a split plot as calculated using the Agricolae package[29]; shown in Supplemental Tables S3−S5.
Table 2. ANOVA analysis results for clipping yields at the short, medium and long period time points for eight cultivars of Cynodon grasses grown under 0% (control), 30%, 50% and 70% reduced PPF. At all periods, there were significant differences between cultivars and reduced PPF treatments. It was also found that there were significant interactions between cultivar and treatment at the medium and long periods. Significance determined by p-value (* < 0.05, ** < 0.01, *** < 0.001).
Short period Medium period Long period Cultivar *** *** *** Treatment *** *** *** Cultivar : Treatment *** ** At the end of the short period (Fig. 3a), the 30%, 50% and 70% reduced PPF treatments exhibited a significant (p-value < 0.05) increase in weekly clipping yield compared to the control treatment, with the Legend® cultivar the least affected. There were also notable differences in clipping yield between cultivars with Latitude 36®, TifSport® and Wintergreen producing significantly higher clipping yields than Legend® and UQ 545. At the end of the medium period (Fig. 3b), total clipping yield was still higher for most cultivars grown under the 30%, 50% and 70% reduced PPF treatments, with the 30% reduced PPF treatment providing the highest clipping yield for most cultivars. When grown under the 30% reduced PPF treatment, the clipping yield for Wintergreen was the highest yielding combination of cultivar and reduced PPF treatment; it was also significantly higher than any total clipping yield collected for the Legend® cultivar and all but the 50% reduced PPF treatment clipping yield collected for OZTUFF®.
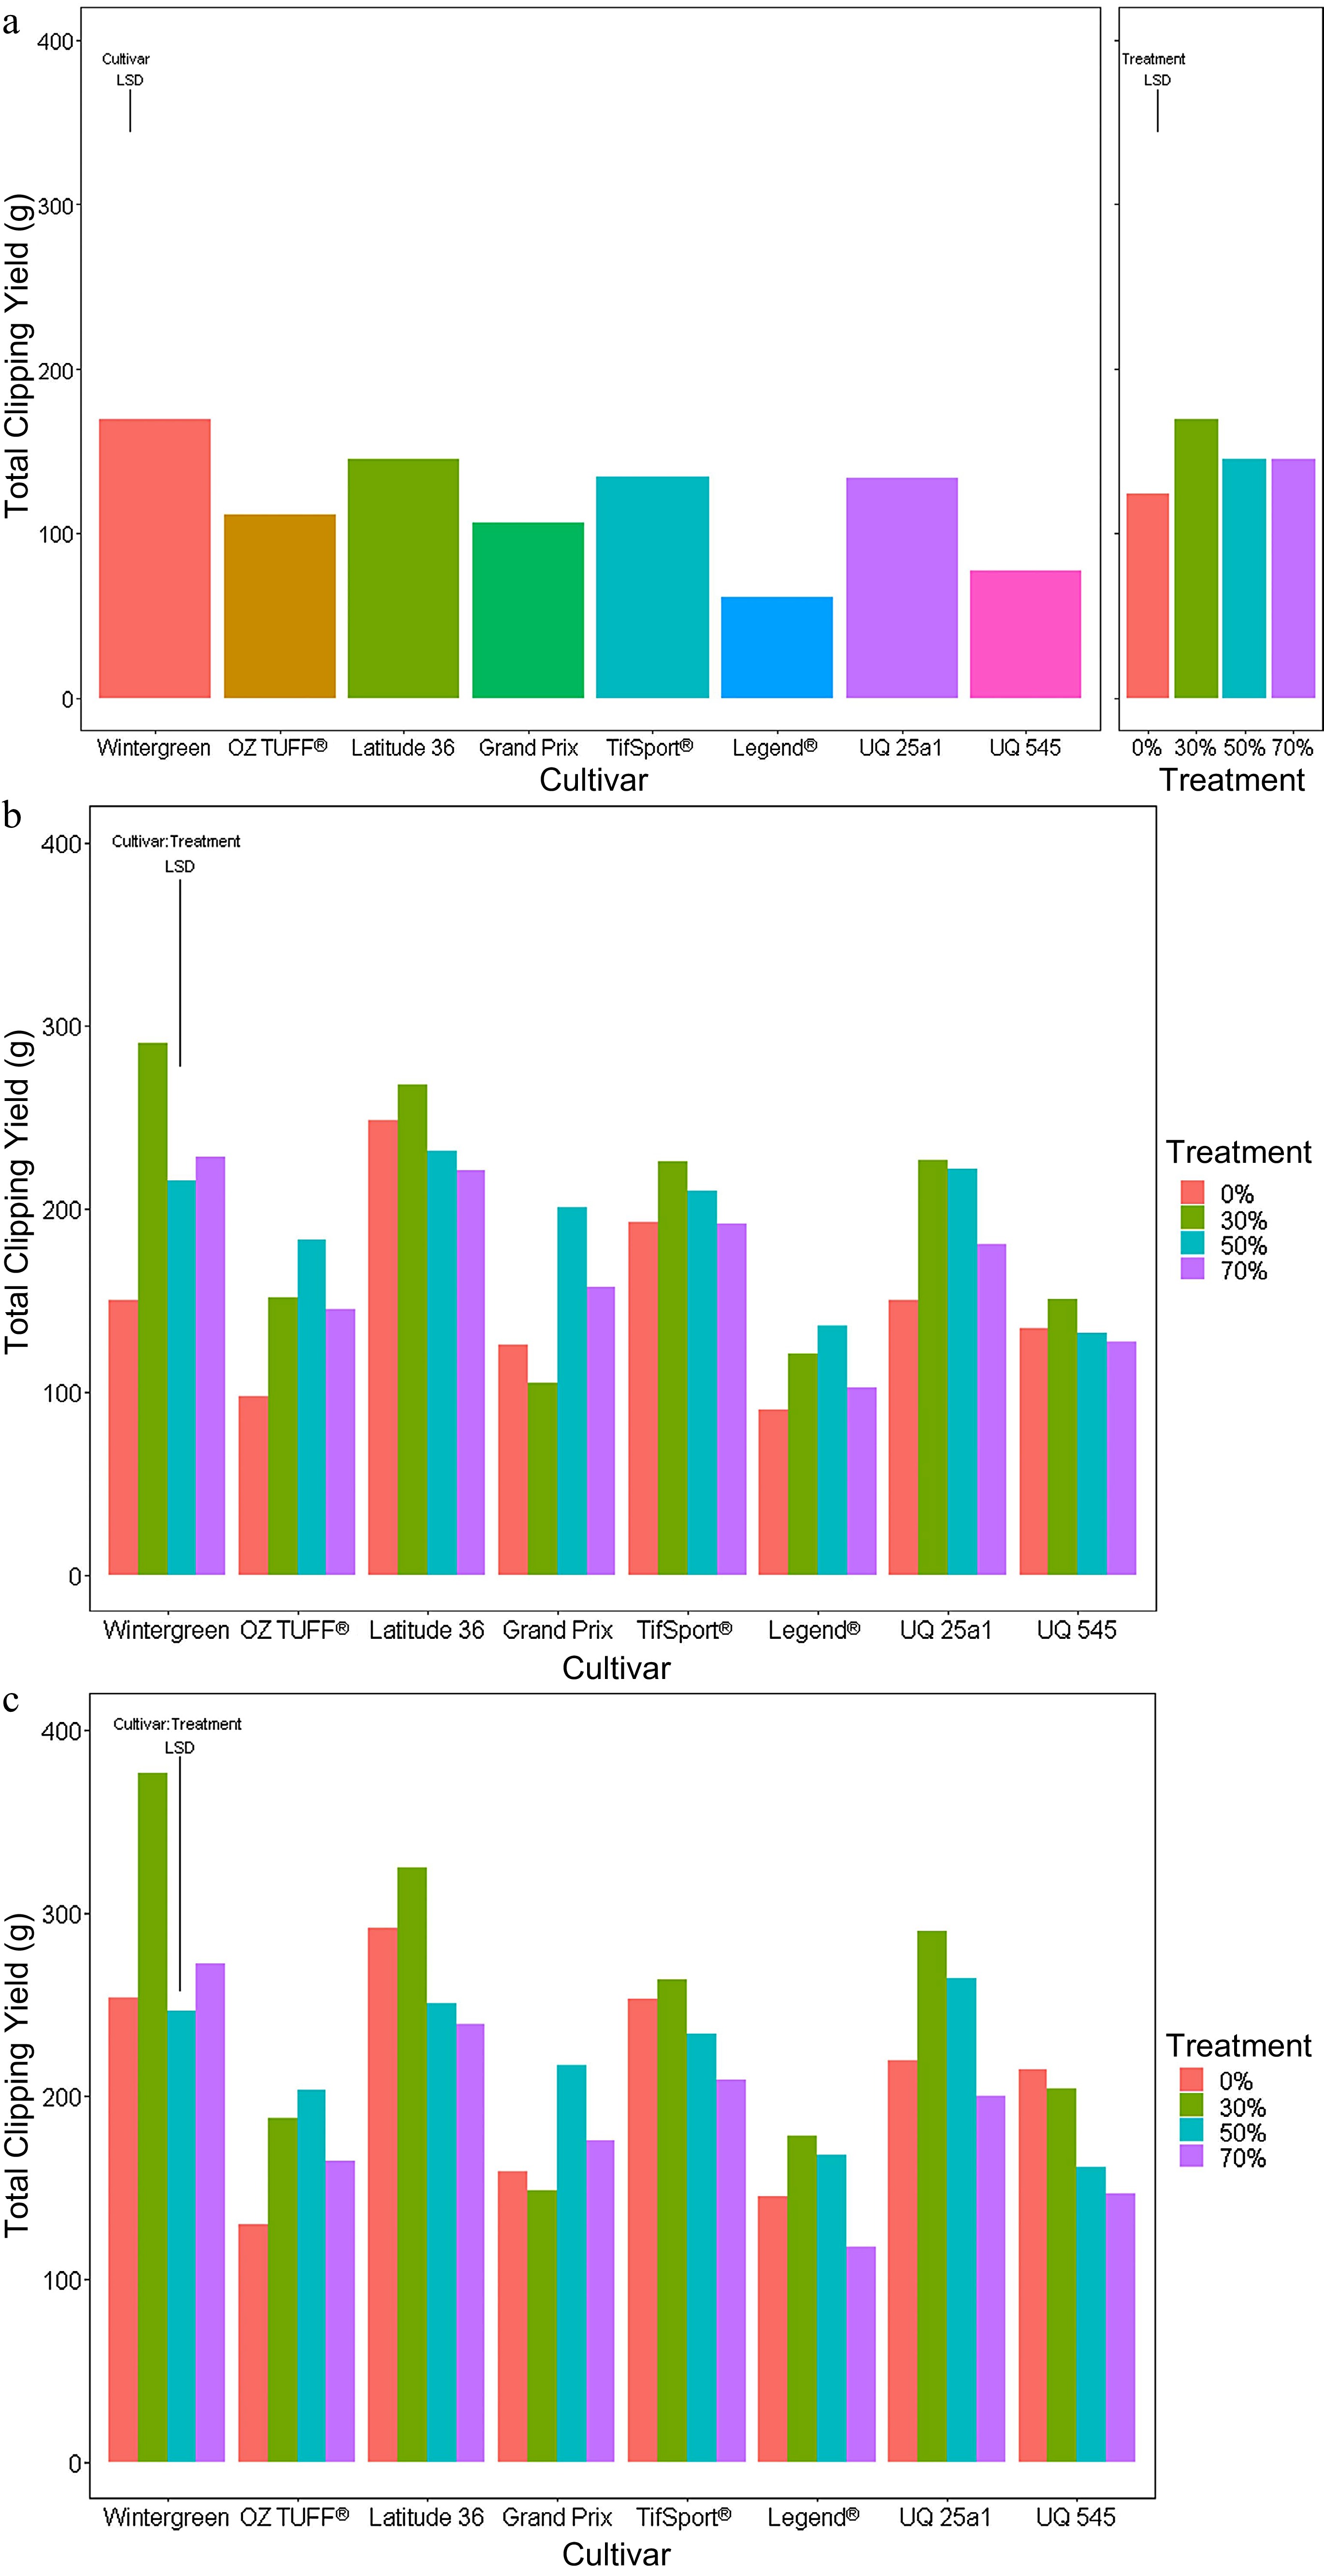
Figure 3.
Accumulated clipping yields of eight cultivars (Wintergreen, Oztuff®, Latitude 36®, Grandprix, TifSport®, Legend®, UQ 25a1 and UQ 545) of Cynodon grasses grown under different treatments; 0% control, 30%, 50% and 70% reduced PPF. The accumulated clipping yield was assessed at three time points, (a) short (weeks 1−2), (b) medium (weeks 1−5) and (c) long (weeks 1−7) periods. Significance was determined based on an LSD post hoc ANOVA analysis with an alpha value of 0.05.
At the end of the long period (Fig. 3c), the 30% reduced PPF treatments for many cultivars again produced the highest total clipping yield. Wintergreen accumulated the highest clipping yield overall and was significantly different from any total clipping yield recorded for OZTUFF®, Grand Prix Legend® and UQ 545. Summaries of the LSD post hoc analysis for all three periods are presented in Supplemental Tables S3, S4 and S5.
Turf quality
-
At the outset of the trial, all cultivars were assessed for turf quality and scored the maximum of ten. At the end of the medium period (week five; Fig. 4a), cultivar Latitude 36® showed a significant (p-value < 0.05) depletion in turf quality under both the 50 and 70% reduced PPF treatments, whereas the quality of OZTUFF® was only negatively affected by the 70% reduced PPF treatment (Fig. 4a). In the late period (Fig. 4b), all cultivars except for Grand Prix, showed significant decreases in turf quality under the 70% reduced PPF treatment compared to the control, with Latitude 36® and UQ 545 cultivars also showing significant differences under the 50% reduced PPF treatment with the LSD post hoc in Supplemental Tables S6 & S7).
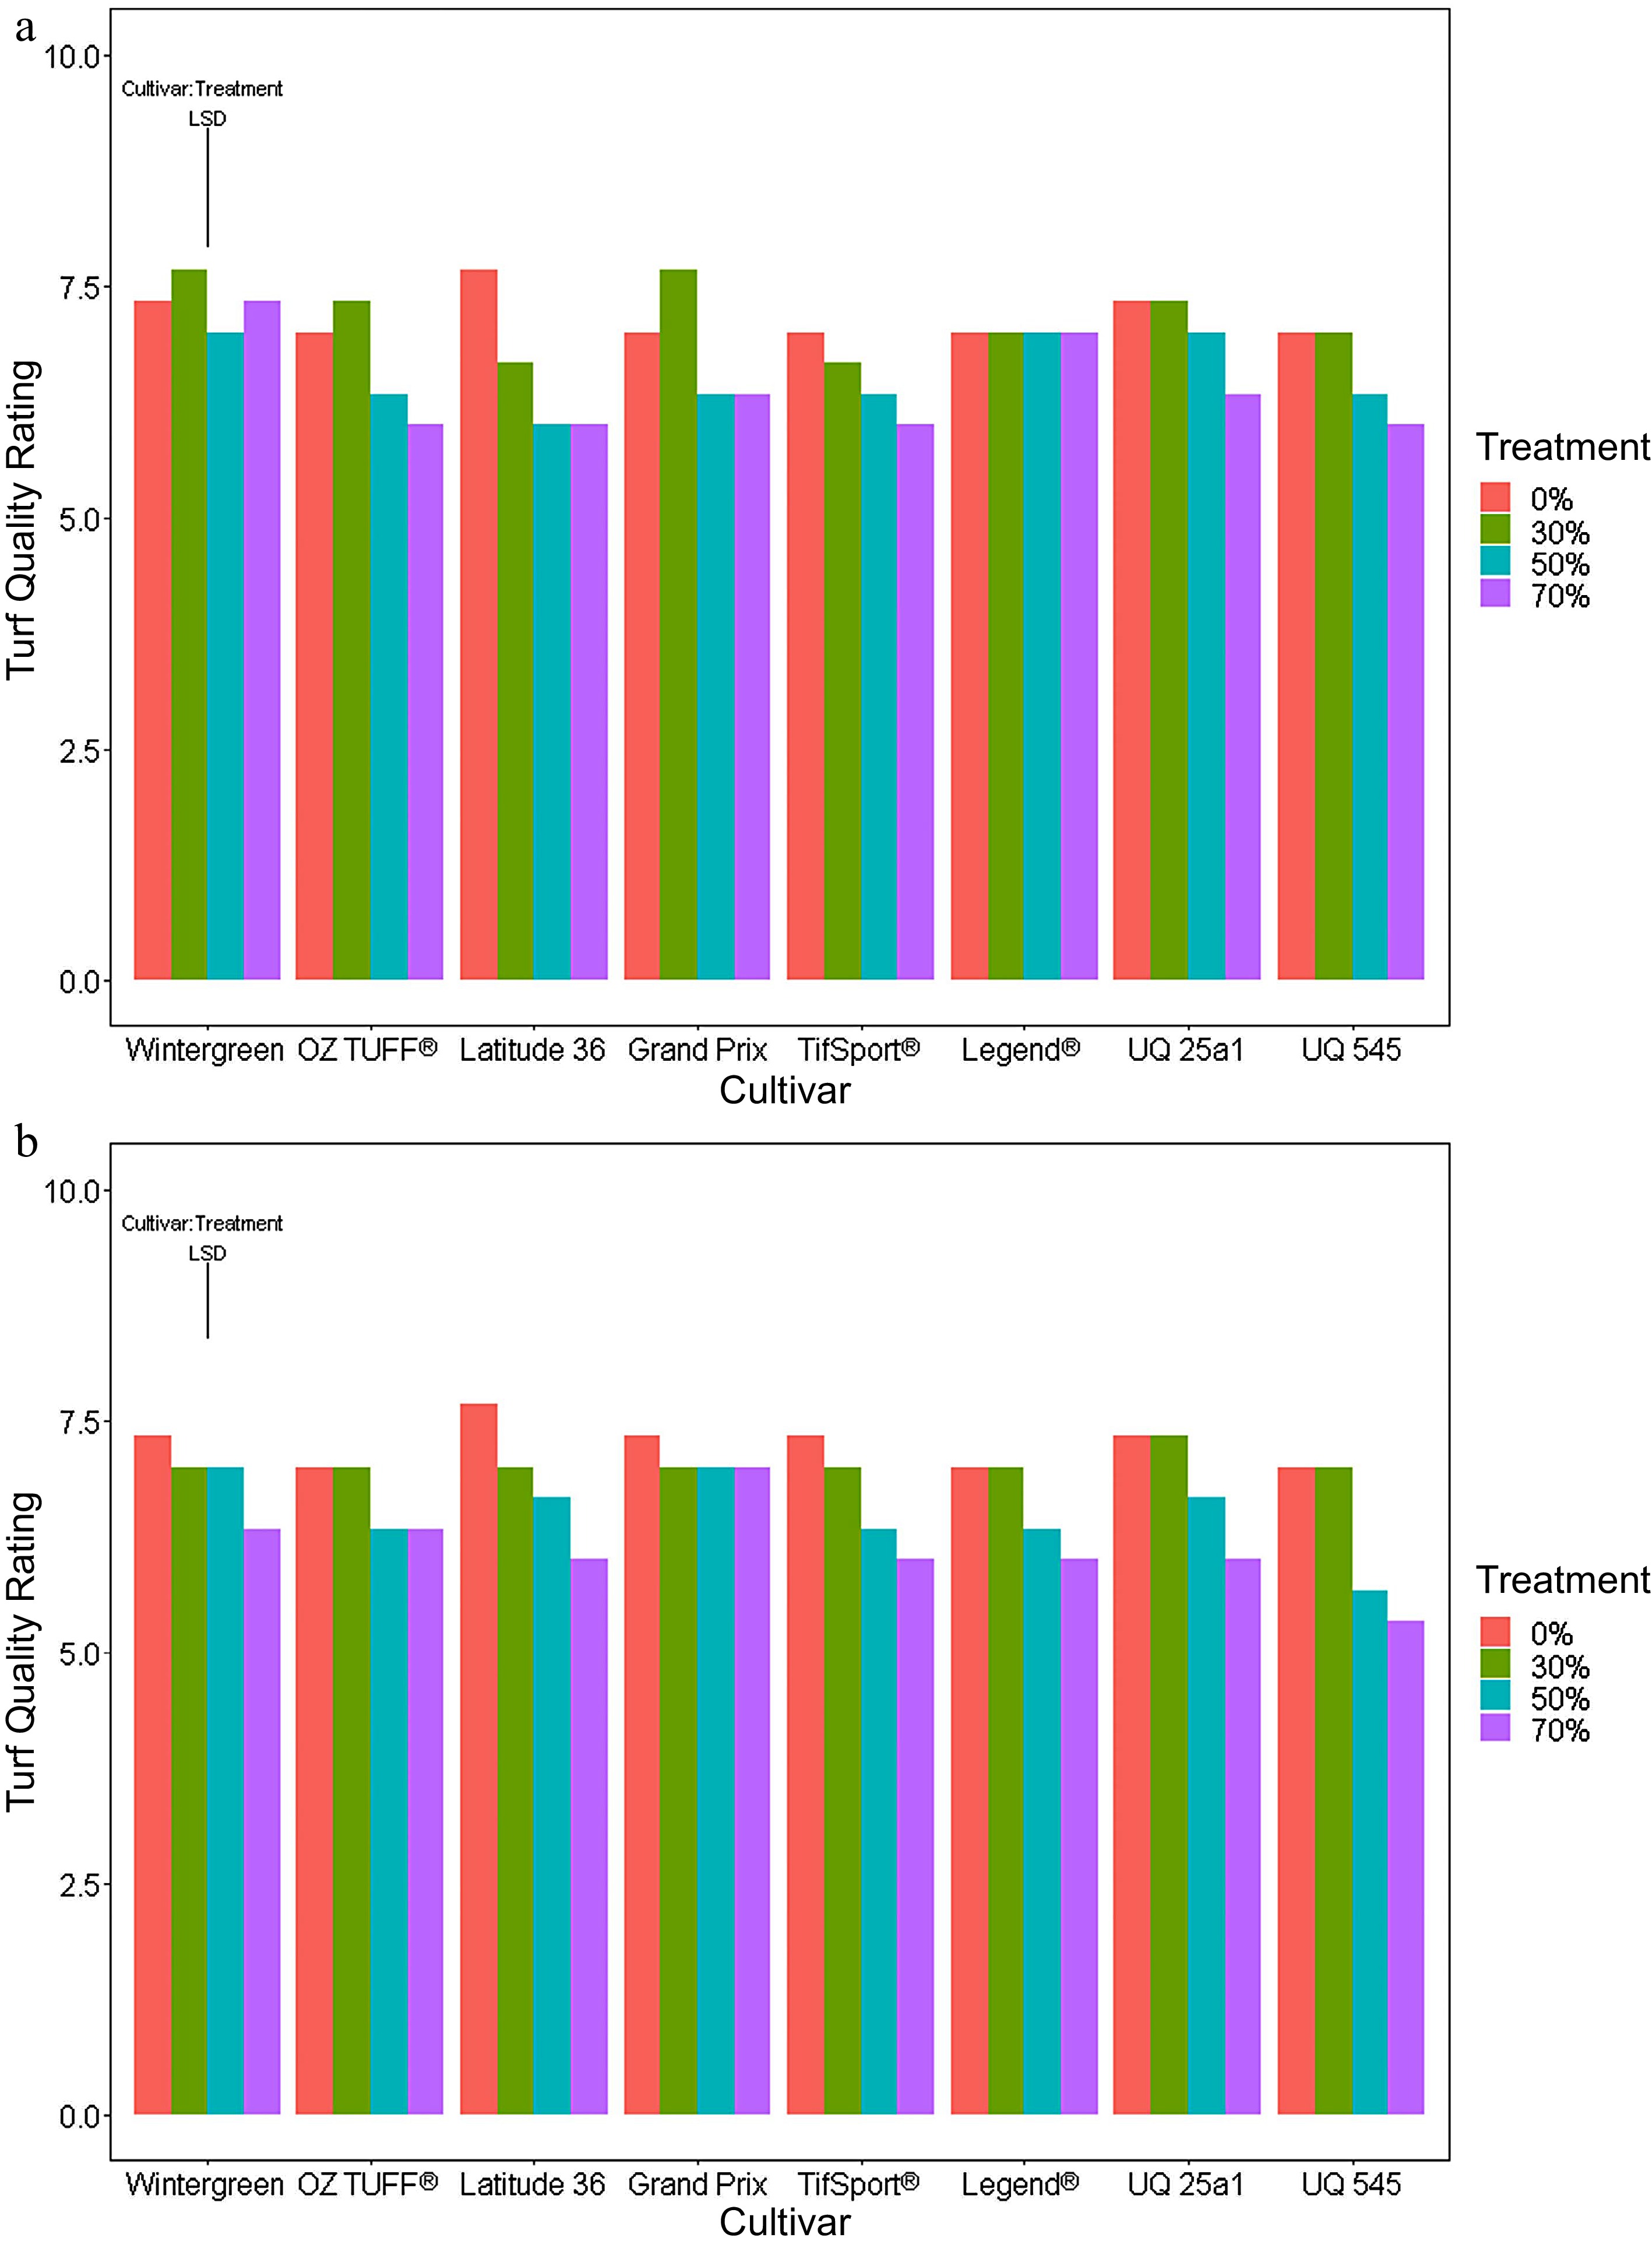
Figure 4.
Mean turf quality scores in the final week of the (a) medium (week 5) and (b) long periods (week 7) using a split plot analysis ANOVA. The ANOVA revealed there were significant interactions between the two main effects cultivar and reduced PPF treatments for both periods and so a LSD was calculated for cultivar: treatment with a significance p value set at < 0.05.
Biomass Composition throughout Trial
-
Biomass composition was assessed using dendrograms and PCA generated from standardized values collected at the end of each period. This combination of analyses allowed any associated biomass component, e.g., lignin or structural carbohydrate, associated with a cultivar or reduced PPF treatment to be identified. At the end of the short period (Fig. 5), it was clear that cultivar was the dominant factor in determining the composition of the clipping biomass collected. TifSport® and OZTUFF® (circled in orange) clustered together in the dendrogram (Fig. 5a) and were found in the PCA (Fig. 5b) to be associated with clipping yield, extractives, biomass, lignin and AIL. Other cultivars grouped in the dendrogram (Fig. 5a) and formed a cluster (circled in purple) that was associated with all structural carbohydrates investigated, the cell wall and water content. A third cluster (circled in brown) made up primarily of UQ545 and Legend® cultivars grown under 30%, 50% and 70% reduced PPF treatments, associated with higher ash and ASL content.
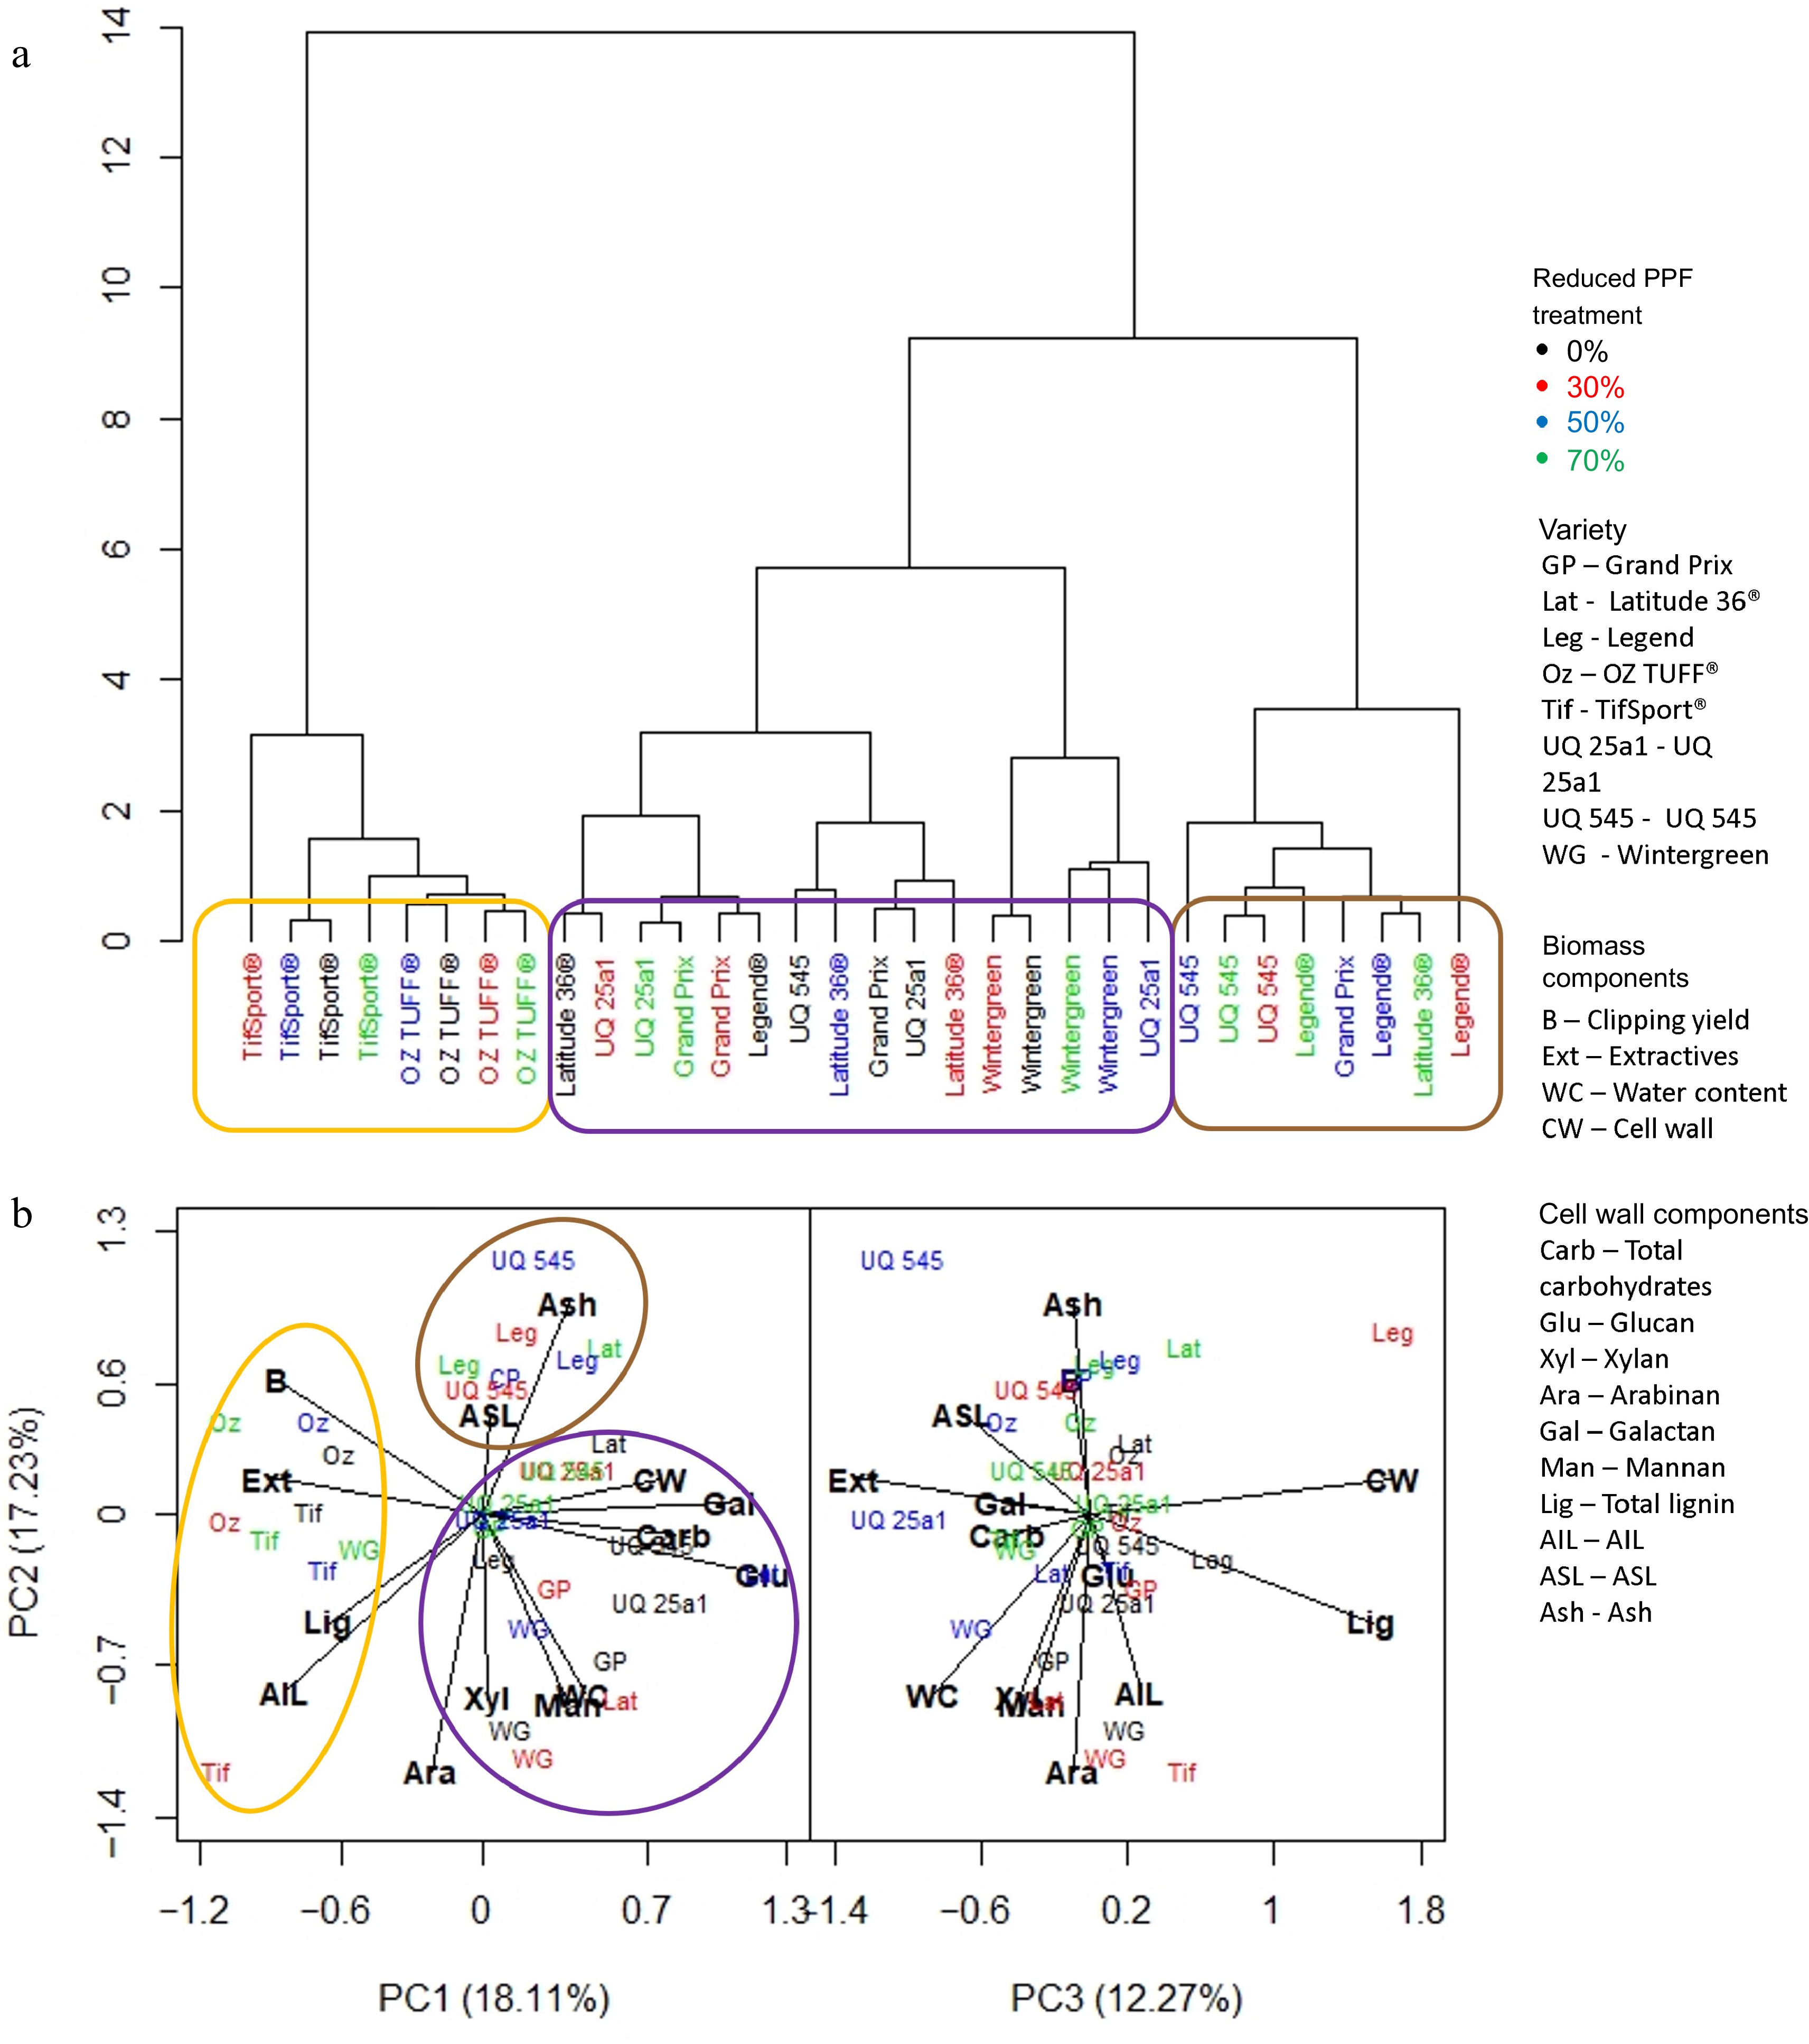
Figure 5.
(a) Dendrogram based on standardized means derived from each trait investigated and the influence of cultivar and reduced PPF treatments on that trait at the final week (week two) of the short period (weeks 1−2). (b) PCA analysis was generated from the same dataset, showing which trait was associated with cultivar or reduced PPF treatment. Clusters identified in the dendrogram are circled and highlighted in the PCA analysis.
The dendrogram at the end of the medium period (Fig. 6a) showed that the reduced PPF treatments exerted more influence on the predicted biomass components, forming two distinct clusters. The first, circled in orange, contained the control for every cultivar, the 30% reduced PPF treatment for some cultivars (Latitude 36®, UQ 25a1 and Grand Prix), and all reduced PPF treatments for cultivar UQ 545. This cluster was associated with total carbohydrates, glucan, xylan and extractives (Fig. 6b). The other cluster circled in purple was comprised of the 30% reduced PPF treatments of the remaining cultivars and all 50% and 70% reduced PPF treatments for all cultivars except UQ545; and was associated with ash, cell wall, water content AIL, ASL and lignin (Fig. 6b).
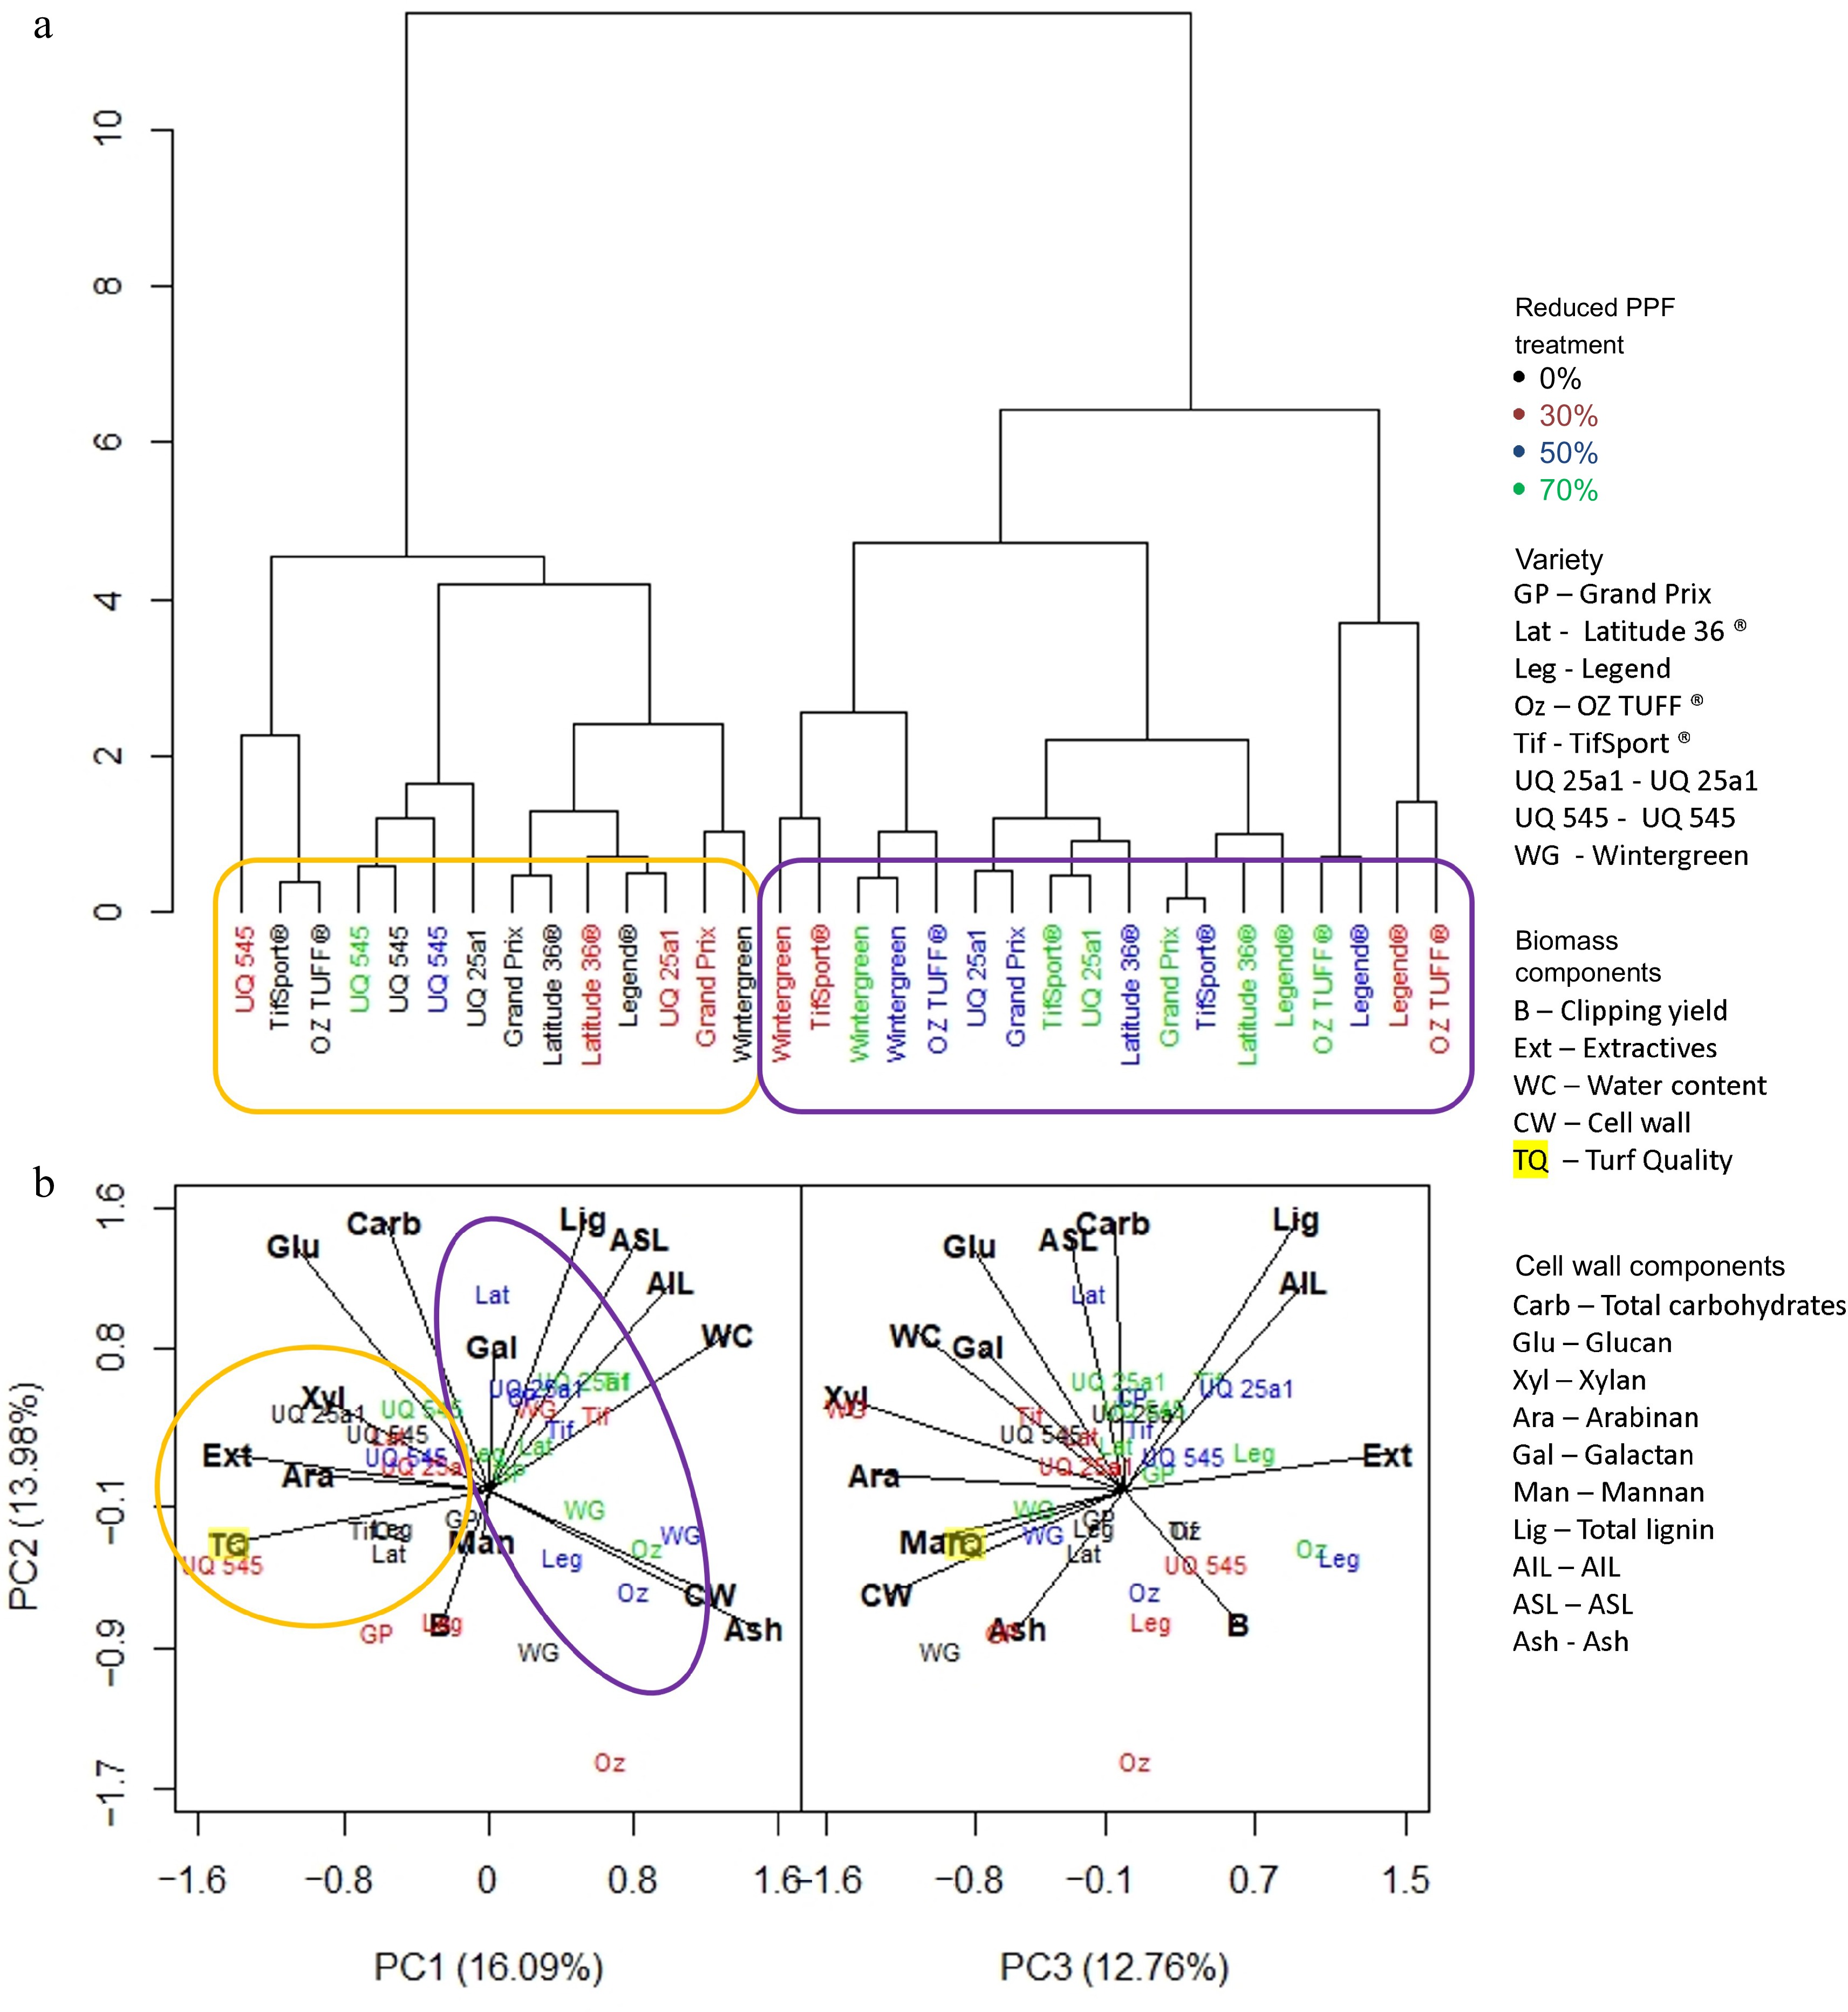
Figure 6.
(a) Dendrogram based on standardized means derived from each trait investigated and the influence of cultivar and reduced PPF treatments on that trait at the final week (week five) of the medium period (weeks 1−5). (b) PCA analysis was generated from the same dataset, showing which trait was associated with cultivar or reduced PPF treatment. Clusters identified in the dendrogram are circled and highlighted in the PCA analysis.
At the end of the long period (Fig. 7a), the dendrogram showed that the reduced PPF treatments were the more influential variable, with two main clusters forming; the first (circled in orange) was comprised only of non-control treatments and except for the 30% reduced PPF treatment of the TifSport® cultivar, of 50% and 70% reduced PPF treatments only. This group was associated with high water content, lignin, AIL, mannan, arabinan, galactan and ash. The second cluster was divided into two more groups; the first (circled in purple) was comprised entirely of control and 30% reduced PPF treatments, except for the 70% reduced PPF treatment of UQ 545; this group was associated with increased amounts of total carbohydrates, glucan, xylan, ASL and higher turf quality scores (Fig. 7b). The final group (circled in brown) was small, comprised of all non-control reduced PPF treatments for Legend®, the control and 30% reduced PPF treatments for OZTUFF®, and the 50% reduced PPF treatment for UQ 545; this group was associated with higher extractive content.
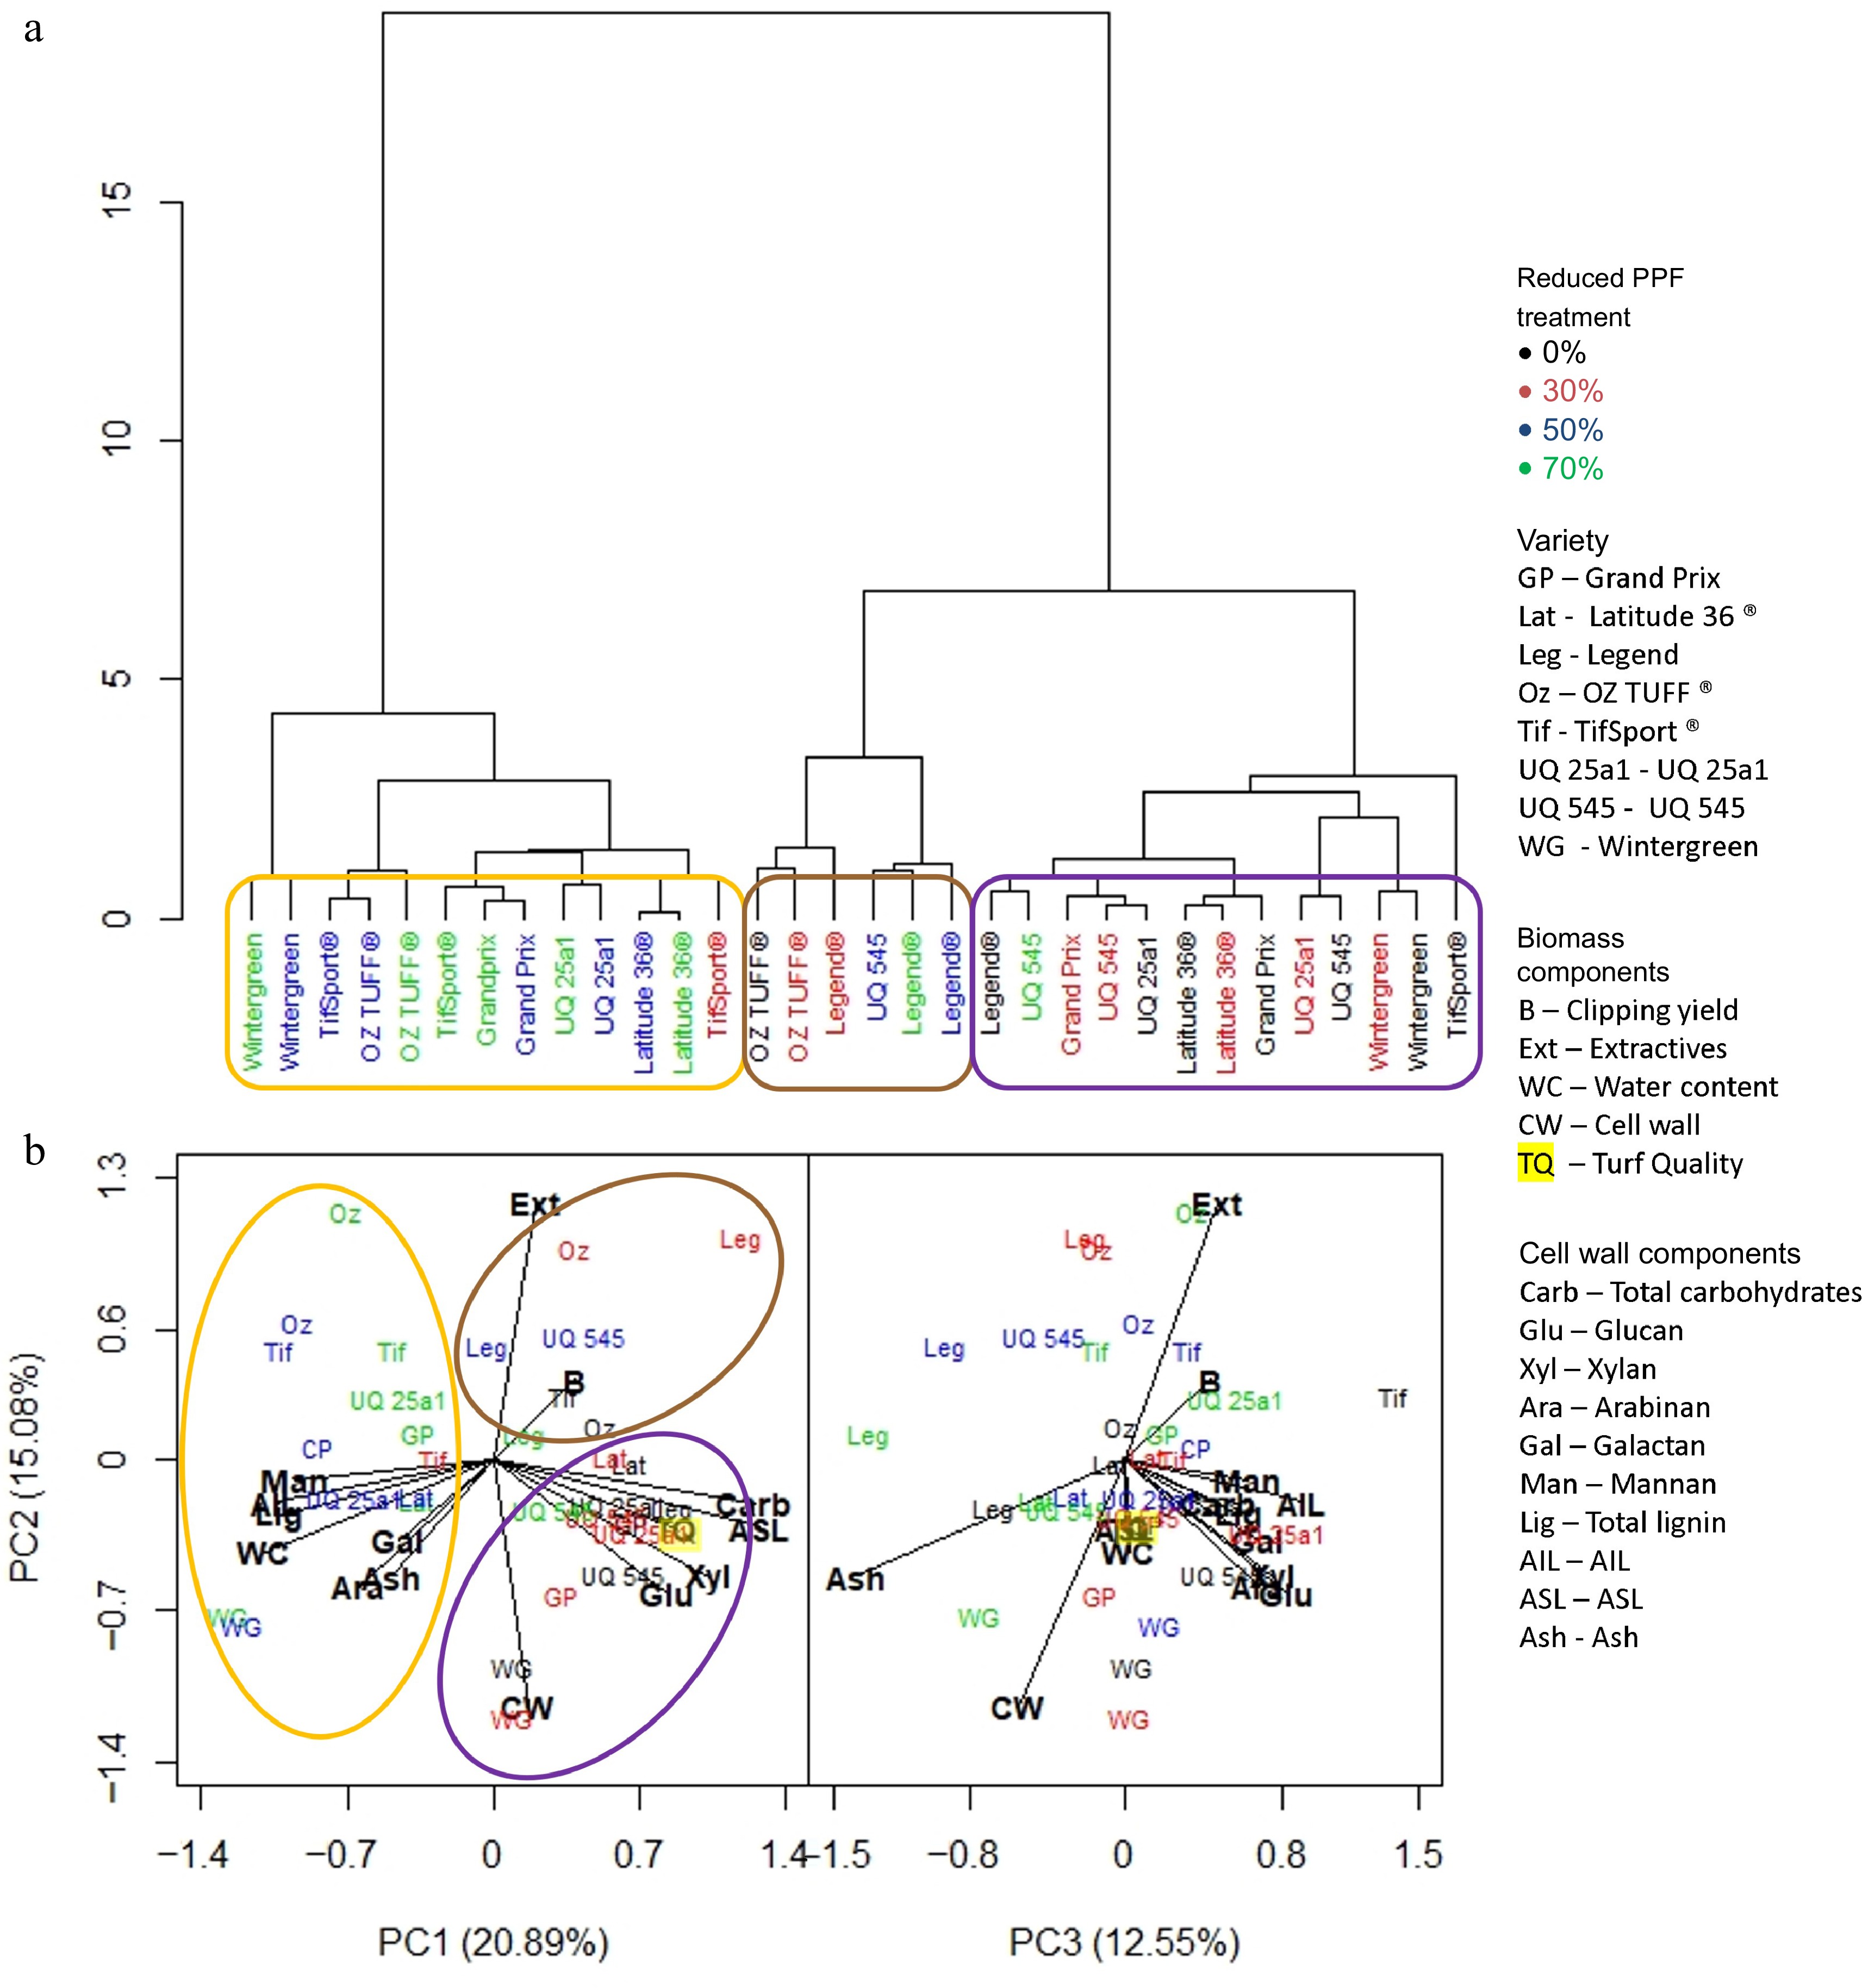
Figure 7.
(a) Dendrogram based on standardized means derived from each trait investigated and the influence of cultivar and reduced PPF treatments on that trait at the final week (week 7) of the long period (weeks 1−7). (b) PCA analysis was generated from the same dataset showing which trait was associated with cultivar or reduced PPF treatment. Clusters identified in the dendrogram are circled and highlighted in the PCA analysis.
-
The PLSR models based upon FTIR spectrometry were demonstrated to effectively assess and discriminate cell wall composition in over 1300 samples collected during this study. The high-quality models provided the platform to investigate the impact of different levels of PPF upon cell wall compositional changes in grasses at a grander scale than could have been achieved with traditional methods. Notably, we found strong correlations of cell wall components with turf quality at the end of the experimental period.
PLSR models based upon FTIR spectrometry have been utilised in previous studies investigating different cultivars of forage grasses, such as sorghum, switchgrass and panic grass[25,30]. The focus has been on the enzymatic release of sugars, primarily glucose and xylose, as well as other cell wall constituents, lignin and ash, to assess superior cultivars or mutated lines primarily within the context of assessing potential feedstocks for the biofuel industry[25,30]. The PLSR models generated for this study (glucan, R2 = 0.96, xylan, R2 = 0.87, lignin R2 = 0.92, and ash R2 = 0.97) measuring sugars released by acid hydrolysis, were equivalent or superior to other PLSR models developed for comparable components, where R2 values ranged from 0.81−0.91[23−25,31]. The models for galactan (R2 = 0.77), arabinan (R2 = 0.64) and mannan (R2 = 0.41) content which were not measured in previous enzymatic based PLSR driven studies, performed below this stringent level, as arabinan, galactan and mannan were only present in very low concentrations, which at times approached the lower limits of the HPLC equipment to measure accurately.
Throughout the trial, clipping yield varied considerably between cultivars and treatments. Increased clipping yield under reduced PPF treatments in the short period and prolonged by some cultivars into the medium and long periods, was likely due to a reduction in evapotranspiration rate, reduced thermal stress and an increase in far-red light which have previously been reported to be positive attributes of canopy shade and likely mimicked by the woven shade cloth in this experiment[32−34]. As bermudagrasses are rhizomatous, it is possible that shaded plants may have benefited from the remobilisation of stored carbohydrates from these or other organs, such as stolons[35]. The impact of reduced PPF treatments upon yield are cumulative, as reported in field sown pasture species, including grasses. However, significant reductions in yield were only evident after three months at reduced PPF levels greater than 60%[2]. Cultivars of Cynodon grasses did not exhibit a universal response to reduced PPF; for example, neither the 50% nor 70% reduced PPF treatments clipping yield for the Legend® cultivar grouped with the majority of 50% and 70% treatments at the end of the long period. Variation in response to shade stress between cultivars of the same species has been found in other shade-related studies, suggesting that multiple responses to shade stress are possible; for example, species with lower vertical growth rates are considered more shade tolerant while within species, there are still considerable differences in growth and quality that can surpass differences between species found within the same study[14,36].
The relationship between cultivar and reduced PPF treatment effects on cell wall composition supported a cumulative response to decreased PPF, with cultivar initially the more influential factor at the short period time point and reduced PPF the more influential factor at the final long period time point. The key example of this was the TifSport® and OZTUFF® cultivars that were associated with specific cell wall components at the short period time point regardless of treatment, compared to the final long period time point, where they, as with most cultivars, were separated based on the reduced PPF treatments applied.
The effect of shade avoidance on cell wall composition has been well characterized in Arabidopsis thaliana, with cell walls becoming more flexible due to increased activity of cell wall modifying enzymes and decreased lignin content[37]. Genes encoding key enzymes catalysing steps of the lignin synthesis pathway have been downregulated in soybean and rice under shade stress, resulting in increased lodging[38]. Conversely, studies of A. thaliana and Glycine max suggest that plant cultivars with greater shade tolerance have higher lignin content than those less shade tolerant[39]. Acid Digestible Fibre (ADF) is a useful forage quality measurement that has been a focus of several studies aimed at determining the effect of shade on tropical forages where ADF, which is primarily comprised of lignin and structural carbohydrates, was higher in response to shade[40−42].
At the final experimental time point, turf quality was negatively correlated with total lignin and AIL and positively correlated with carbohydrates glucan, xylan and ASL. The consequence of these relationships in terms of genetic variation in response to changes in PPF, was that under incremental reductions in PPF, grasses with the highest turf quality had lower concentrations of total lignin and AIL and a higher concentration of carbohydrates and ASL. This suggests that as Cynodon grasses were exposed to step-wise reductions in PPF, a measurable stress response was evoked.
In most angiosperms, when exposed to shade stress, the growth pathway (regulated by phytochrome B signalling, which responds to uncompromised high light intensity, i.e., higher R:FR ratios) is prioritized over the defense pathway (regulated by jasmonic acid signalling), by outcompeting and inhibiting access to transcription factors shared by both pathways[43,44]. Recent evidence in Scots pine (Pinus sylvestris) and Norfolk spruce (Picea abies), however, has shown that in higher latitudes, the defense pathway is preferred[45,46]. Trees in northern regions growing under reduced PPF showed up-regulation of key genes involved in lignin synthesis and key transcription factor suppressors such as MYB3 and MYB4 were down-regulated compared to those pines originating from southern regions where PPF is more abundant[45].
In the present study with Cynodon grasses, the observed changes associated with the elevated shade treatments indicate key elements of a defense response to the shade stressor[37]. Other stressors have reportedly interacted with the response to decreased PPF, such as salt stress inhibiting hypocotyl and petiole elongation, reducing the ability of a plant to respond to light stress[44,47]. During this experiment, the grasses were subjected to reduced PPF and clipped and the effects of these stressors could have been confounded. The clipping regime implemented during this study may have promoted the defense response pathway over the growth pathway leading to an increase in lignin and ash content, both of which are increased in response to jasmonic acid signalling produced from wounding caused by clipping[48]. However, detailed transcriptomic analysis would be required to confirm such a hypothesis whilst furthering the understanding of how cell walls of Cynodon grasses respond to shade and the interaction of the phytochrome B regulated growth and the jasmonic acid regulated stress response pathways.
-
The authors declare that they have no conflict of interest. Christopher Lambrides is the Editorial Board member of Journal Grass Research who was blinded from reviewing or making decisions on the manuscript. The article was subject to the journal's standard procedures, with peer-review handled independently of these Editorial Board members and their research groups.
- Supplemental Fig. S1 The layout of the split-plot design implemented to determine the effect of reduced PPF on i) the amount of biomass produced and ii) cell wall composition of eight different cultivars of Cynodon grasses. Each of the three blocks included the control (0% reduced PPF; white) and the reduced PPF treatments of 30% (red), 50% (blue) and 70% (green). The control and each reduced PPF treatment within each block included all eight cultivars (1) Wintergreen, (2) OZTUFF®, (3) Latitude 36®, (4) Grand Prix, (5) TifSport®, (6) Legend®, (7) UQ25a1 and (8) UQ 545.
- Supplemental Fig. S2 Predicted cell wall mg /g dried biomass (DW) determined by application of a PLSR model generated from FTIR spectra vs measured (reference) values of isolated cell walls derived from ground leaf clippings of Cynodon grasses by washing non-cell wall extractives away with ethanol and 40°C water. The calibration set of samples (blue) was used to generate the model, while another independent validation set of samples (red) was used to test the capability of the model to predict unknown datasets with the R2 and RMSE obtained for the validation set providing a measure of the model's accuracy in predicting unknown samples based on their FTIR spectra.
- Supplemental Fig. S3 Predicted water content of the cell wall value determined by PLSR model generated from FTIR Spectra vs reference values water extracted by freeze drying ground leaf clippings obtained from Cynodon grasses including the R2 and RMSE for a calibration and validation set of samples. The calibration set (blue) was used to generate the model, while another independent validation set (red) was used to test its ability to predict unknown datasets. The R2 and RMSE obtained for the validation set measured the model's effectiveness for predicting unknown samples based on their FTIR spectra.
- Supplemental Fig. S4 Predicted ‘extractive’ values of the cell wall determined by PLSR model generated from FTIR Spectra vs reference of non-cell wall extracted mass from dried ground leaf clippings obtained from Cynodon grasses including the R2 and RMSE for a calibration and validation set of samples. The calibration set (blue) was used to generate the model, while another independent validation set (red) was used to test its ability to predict unknown datasets. The R2 and RMSE obtained for the validation set measured the model's effectiveness for predicting unknown samples based on their FTIR spectra.
- Supplemental Fig. S5 Predicted Cell wall values determined by PLSR model generated from FTIR Spectra vs reference glucan values extracted from cell wall isolated from dried ground leaf clippings obtained from Cynodon grasses including the R2 and RMSE for a calibration and validation set of samples. The calibration set (blue) was used to generate the model, while another independent validation set (red) was used to test its ability to predict unknown datasets. The R2 and RMSE obtained for the validation set measured the model's effectiveness for predicting unknown samples based on their FTIR spectra.
- Supplemental Fig. S6 Predicted Cell wall values determined by PLSR model generated from FTIR Spectra vs reference xylan values extracted from cell wall isolated from dried ground leaf clippings obtained from Cynodon grasses including the R2 and RMSE for a calibration and validation set of samples. The calibration set (blue) was used to generate the model, while another independent validation set (red) was used to test its ability to predict unknown datasets. The R2 and RMSE obtained for the validation set measured the model's effectiveness for predicting unknown samples based on their FTIR spectra.
- Supplemental Fig. S7 Predicted Cell wall values determined by PLSR model generated from FTIR Spectra vs reference arabinan values extracted from cell wall isolated from dried ground leaf clippings obtained from Cynodon grasses including the R2 and RMSE for a calibration and validation set of samples. The calibration set (blue) was used to generate the model, while another independent validation set (red) was used to test its ability to predict unknown datasets. The R2 and RMSE obtained for the validation set measured the model's effectiveness for predicting unknown samples based on their FTIR spectra.
- Supplemental Fig. S8 Predicted Cell wall values determined by PLSR model generated from FTIR Spectra vs reference galactan values extracted from cell wall isolated from dried ground leaf clippings obtained from Cynodon grasses including the R2 and RMSE for a calibration and validation set of samples. The calibration set (blue) was used to generate the model, while another independent validation set (red) was used to test its ability to predict unknown datasets. The R2 and RMSE obtained for the validation set measured the model's effectiveness for predicting unknown samples based on their FTIR spectra.
- Supplemental Fig. S9 Predicted Cell wall values determined by PLSR model generated from FTIR Spectra vs reference mannan values extracted from cell wall isolated from dried ground leaf clippings obtained from Cynodon grasses including the R2 and RMSE for a calibration and validation set of samples. The calibration set (blue) was used to generate the model, while another independent validation set (red) was used to test its ability to predict unknown datasets. The R2 and RMSE obtained for the validation set measured the model's effectiveness for predicting unknown samples based on their FTIR spectra.
- Supplemental Fig. S10 Predicted Cell wall values determined by PLSR model generated from FTIR Spectra vs reference AIL values extracted from cell wall isolated from dried ground leaf clippings obtained from Cynodon grasses including the R2 and RMSE for a calibration and validation set of samples. The calibration set (blue) was used to generate the model, while another independent validation set (red) was used to test its ability to predict unknown datasets. The R2 and RMSE obtained for the validation set measured the model's effectiveness for predicting unknown samples based on their FTIR spectra.
- Supplemental Fig. S11 Predicted Cell wall values determined by PLSR model generated from FTIR Spectra vs reference ASL values extracted from cell wall isolated from dried ground leaf clippings obtained from Cynodon grasses including the R2 and RMSE for a calibration and validation set of samples. The calibration set (blue) was used to generate the model, while another independent validation set (red) was used to test its ability to predict unknown datasets. The R2 and RMSE obtained for the validation set measured the model's effectiveness for predicting unknown samples based on their FTIR spectra.
- Supplemental Fig. S12 Predicted Cell wall values determined by PLSR model generated from FTIR Spectra vs reference ash values extracted from cell wall isolated from dried ground leaf clippings obtained from Cynodon grasses including the R2 and RMSE for a calibration and validation set of samples. The calibration set (blue) was used to generate the model, while another independent validation set (red) was used to test its ability to predict unknown datasets. The R2 and RMSE obtained for the validation set measured the model's effectiveness for predicting unknown samples based on their FTIR spectra.
- Supplemental Table S1 Repeated measures mixed-effects model for a split-plot analysis of variance for all traits measured weekly with period, cultivar and reduced PPF treatment as the main effects. Residuals for the model were calculated using a first-order autocorrelation to account for the repeated weekly measures using the ASReml-R software package. Analysis revealed that period was the main influence on the variation observed for the majority of traits highlighted yellow.
- Supplemental Table S2 Different pre-treatments were applied to the raw spectra obtained from the Perkin Elmer Spectrum II FTIR® spectrometer and a PLSR model generated with the transformed spectra and reference values. A calibration set of samples was used to generate each model and was evaluated by an independent validation set of samples. Each model was evaluated based on its calibration R2 and RMSE (mg/gDW) values, with those providing the lowest RMSE (mg/gDW) values for the validation set, chosen as the pre-treatment for the final model. The pre-treatments chosen for each variable measured are listed below with the calibration and validation R2 and RMSE (mg/gDW) values from that PLSR model.
- Supplemental Table S3 (a). ANOVA table from a split plot analysis of clipping yield at the end of the short period (weeks 1-2). (b). Main effects (Reduced PPF) clipping yield means. LSD was calculated using Error a. (c). Subplot effects (Cultivar) clipping yield means. LSD was calculated using Error b. Groupings based on LSD are provided.
- Supplemental Table S4 (a). ANOVA table from a split plot analysis of clipping yield at the end of the medium period (weeks 1-5). (b). Main plot (Reduced PPF) and subplot (Cultivar) interaction clipping yield means. Interaction LSD (p<0.05) was calculated using Error b. Groupings based on LSD are provided.
- Supplemental Table S5 (a). ANOVA table from a split plot analysis of clipping yield at the end of the long period (weeks 1-7). (b). Main plot (Reduced PPF) and subplot (Cultivar) interaction clipping yield means. Interaction LSD (p<0.05) was calculated using Error b. Groupings based on LSD are provided.
- Supplemental Table S6 (a). ANOVA table from a split plot analysis of turf quality at the end of the medium period (weeks 1-5). (b). Main plot (Reduced PPF) and subplot (Cultivar) interaction turf quality means. Interaction LSD (p value <0.05) was calculated using Error b. Groupings based on LSD are provided.
- Supplemental Table S7 (a). ANOVA table from a split plot analysis of turf quality at the end of the long period (weeks 1-7). (b). Main plot (Reduced PPF) and subplot (Cultivar) interaction turf quality means. Interaction LSD (p value <0.05) was calculated using Error b. Groupings based on LSD are provided.
- Copyright: © 2023 by the author(s). Published by Maximum Academic Press, Fayetteville, GA. This article is an open access article distributed under Creative Commons Attribution License (CC BY 4.0), visit https://creativecommons.org/licenses/by/4.0/.
-
About this article
Cite this article
Brown CW, Jie MWQ, Pearce W, Arief V, Dayananda B, et al. 2023. The application of Fourier Transform Infra-Red spectrometry to assess the impact of changes in Photosynthetic Photon Flux on cell wall components and turf quality of different cultivars of Cynodon grasses. Grass Research 3:9 doi: 10.48130/GR-2023-0009
The application of Fourier Transform Infra-Red spectrometry to assess the impact of changes in Photosynthetic Photon Flux on cell wall components and turf quality of different cultivars of Cynodon grasses
- Received: 03 January 2023
- Accepted: 27 April 2023
- Published online: 09 June 2023
Abstract: The impact of decreased Photosynthetic Photon Flux (PPF) on the biomass and quality of Cynodon turf grasses are of considerable interest to the turf community, however there is little available data regarding its effect upon cell walls. Fourier Transform Infra-Red (FTIR)-based Partial Least Squares Regression (PLSR) models are useful for assessing the cell wall composition of a multitude of samples in a high-throughput manner. Such models were generated to predict cell wall components, water and extractive non-cell wall content of Cynodon grass biomass to determine if different levels of PPF imposed by woven polyester cloth influenced the cell wall composition of six cultivars of C. dactylon and two hybrid cultivars of C. dactylon × C. transvaalensis. The trial ran over seven weeks, and cell wall composition was assessed at three time points, week two (short period), week five (medium period) and week seven (long period). Cultivar had the strongest influence on cell wall composition in the short period, while at the end of the long period, reduced PPF was the more influential factor affecting the composition of the cell wall. At the final experimental time point, turf quality was negatively correlated with reduced PPF (50% and 70% reduction), total lignin and Acid Insoluble Lignin (AIL) and positively correlated with higher PPF (30% and 0% reduction) carbohydrates and Acid Soluble Lignin (ASL). It is proposed that the defense response pathway was preferred over the typical shade avoidance responses due to the weekly clipping regime confounding the response to reductions in PPF, leading to higher percentages of lignin, ash and lower carbohydrate content in the cell wall of Cynodon grasses.
-
Key words:
- Applications /
- Fourier /
- Transform /
- InfraReds /
- Spectrometry /
- Assess /
- Shade /
- Bermudagrass /
- Turfgrass


