ARTICLE   Open Access    

AGAMOUS correlates with the semi-double flower trait in carnation

  • # These authors contributed equally: Chunlian Jin, Huaiting Geng

More Information
  • Flower type is the most valuable ornamental trait in floricultural plants, for which the ABCDE model was proposed to explain the identity of each floral organ in flowering plants. The C-class gene AGAMOUS (AG) is responsible for stamen formation and plays an essential role in the double flower phenotype. A previous study in carnation revealed that the mutation in the miR172 binding site of the A-class gene APETALA2 (AP2) leads to petal accumulation. And the expression level of AG was reduced significantly in the double flowers compared with that in the single flowers. However, there was no sequence polymorphism detected between AGs isolated from the double flowers and single flowers. Here, we performed AG analysis using single and semi-double flower carnations, and detected several mutations located in the crucial position like the MADS-box domain in the AGs of semi-double flower carnations while no changes were found at the miR172 binding site of AP2. As a result, the expression levels of AGs are reduced in the semi-double flower carnation, which could be caught by the loss function of AGs. Our data proves that AGs mutations are also associated with the semi-double flower formation in carnation, complementing the lack of research about AG-mutation-associated double flower formation in carnation.
  • Surimi gel, known as 'concentrated myofibrillar protein'[1], is a kind of gel prepared by processing fish tissue according to fixed steps, such as rinsing, dehydration, and chopping, then adding a certain number of auxiliary materials for crushing, molding, heating and cooling. Salt-soluble myofibrillar protein (mainly myosin) of surimi denatures and unfolds after heating, and then re-crosslinks and polymerizes to form large protein aggregates[2], which is the internal mechanism of forming the gel structure. To enhance the texture and taste of surimi gel products, 2%−3% salt is added to promote the formation of the protein gel network structure and enhance the solubility and functional properties of the products[3,4]. Nonetheless, numerous studies have confirmed that excessive salt intake may result in risks of disease to human health, such as hypertension, and coronary heart disease[5]. Therefore, the development of low-salt surimi products will be widely focused on in future research.

    Recently, two strategies have been innovatively proposed to improve or maintain the gel properties of low-salt surimi products: one is to use exogenous additives or sodium salt substitutes[68], and the other is to exploit new processing technologies[911]. Glutamine transaminase (TGase) is the most effective surimi quality improver to enhance the functional properties of protein, which could catalyze acyl donors in proteins (γ-Hydroxylamine group) and acyl receptors (lysine residue, primary amine compound, etc.) undergo acyl transfer reaction to form cross-linked structures[1214]. Previous studies by Jiang et al.[15] revealed that the cross-linking effect of TGase catalysis depends on the content and spatial distribution of available substrates. In addition, lysine, as an ideal exogenous additive, has been widely used in different meat protein gel systems, which can effectively improve the gel properties of low-salt surimi gel[16] and emulsified chicken sausage[17]. Many researchers have spent a lot of time to obtain higher-quality surimi gel products through the combination of two or more exogenous additives. Many scientists devoted themselves to obtaining higher quality surimi gel products through the combination of two or more exogenous additives. For example, Cao et al.[18] demonstrated that lysine (Lys) could bring about the dissociation of actin under the condition of the presence of TGase, promoting the cooking yield and gel properties of oxidative damaged MP. Similar findings reported by Cando et al.[19] indicated that Lys could induce the changes in protein structure, which were favorable terms to heighten the cross-linking effect of TG and improve the strength of surimi gel.

    Recently, the term ε-Poly-lysine (ε-PL) was followed with interest since it's a natural amino acid polymer produced by microbial fermentation, and was speculated that it has a similar molecular structure and potential effect to Lys[20]. ε-PL, which is generally composed of 25−30 lysine residues connected by amide bonds (by ε-Amino and α-Carboxyl group), was often used as an antibacterial agent for the preservation of meat products and aquatic products[21]. Li et al.[21] explored the effect of preservative coating with ε-PL on the quality of sea bass fillets during storage. It turned out that, ε-PL treatment evidently reduced the thiobarbituric acid and volatile base nitrogen values of bass slices during storage, inhibited the growth of microorganisms, and improved the water retention, texture, and flavor characteristics of the fish. A previous study by Cai et al.[20] proved the bacteriostatic and fresh-keeping effect of the composite coating of protein and sodium alginate on Japanese sea bass, and found that the composite coating had an effect on inhibiting the proliferation of sea bass microorganisms (Escherichia coli, lactic acid bacteria, yeast, etc.), fat oxidation, protein degradation, and nucleotide decomposition. As a natural cationic polypeptide, ε-PL has the advantages of no biological toxicity and low viscosity of aqueous solution. It is noteworthy that it can produce strong electrostatic adsorption with negatively charged amino acids[22]. Its effective modification of protein helps it fully interact with gel component molecules and groups[23], which may play a role in enhancing the texture and water retention of protein gel.

    Nevertheless, few reports are based on the addition of ε-PL to explore the influence mechanism on TGase-catalyzed surimi gel properties. The current study sought to shed light on the effects of different additions of ε-PL on TGase-induced cross-linking effect and the performance of composite surimi gel, to provide a theoretical basis and reference for further research and development of 'low salt', efficient and healthy surimi products.

    Testing materials, including marine surimi, transglutaminase (TG, enzyme activity 100 IU/g), and ε-Polylysine (ε-PL, ≥ 99% purity) were supplied by Jiangsu Yiming Biological Technology Co., Ltd (Jiangsu, China). Egg white protein was purchased from Henan Wanbang Chemical Technology Co., Ltd (Henan, China). All other chemicals were from Shanghai Yuanye Biochemical Co., Ltd (Shanghai, China) and were at least analytical grade. The ingredients of the surimi gel are shown in Table 1.

    Table 1.  Surimi samples with different treatments.
    GroupsSurimi
    (g)
    TGase
    (w/w, %)
    Egg white
    Protein
    (w/w, %)
    ε-PL
    (w/w, %)
    NaCl
    (w/w, %)
    CK3000.5
    TE3000.47.00.5
    TE + P13000.47.00.0050.5
    TE + P23000.47.00.010.5
    TE + P33000.47.00.020.5
    TE + P43000.47.00.040.5
    TE + P53000.47.00.060.5
     | Show Table
    DownLoad: CSV

    The prepared block surimi was firstly put into the chopping machine (or tissue masher) and chopped for 2 min, then different mass fractions of ingredients were added, while the chopping time was extended to 5 min (the temperature should be controlled below 10 °C during this process). The exhausted surimi paste was poured into the special mold (50 mm × 20 mm), which was heated in two stages to form the heat-induced surimi gel (40 °C water bath for 40 min; 90 °C water bath for 20 min). Above prepared surimi gel underwent an ice water bath for 30 min and finally stored overnight at 4 °C for further use.

    Mixed surimi samples with different treatments were determined under a Haake Mars 60 Rheometer (Thermo Fisher Scientific, Germany) with 35 mm stainless steel parallel plates referring to the method described by Cao et al.[18], and each determination was repeated three times. After centrifugation (1,000× g, 3 min) and 4 °C, the degassed surimi sol (~2 g) was equilibrated at 4 °C for 3 min before measurement.

    The shear stress of the mixed surimi sol was measured at shear rates between 0−100 s−1.

    The rheological properties of the mixed surimi sols were measured in an oscillatory mode of CD-Auto Strain at 0.02% and 0.1 Hz frequency, respectively. The heating temperature range is set to 20~90 °C while the heating rate is 1 °C·min−1.

    The TA-XT Plus physical property analyzer (TA-XT Plus, Stable Micro Systems Ltd, Surrey, UK) was used to analyze the mixed surimi gel strength of each group of samples (n ≥ 3) at room temperature, and the cube-shaped surimi gel samples are measured through the P/0.5 probe. Referring to the method previously described by Fang et al.[24], the test parameters are as follows, pre-test and test rate (1 mm·s−1); rate after measurement (5 mm·s−1); depressing degree (30%); trigger force (5 g); data acquisition rate (400 p/s).

    Concerning the method of Jirawat et al.[25], texture profile analysis (TPA) was employed to record the hardness, elasticity, cohesion, chewiness, and resilience of mixed surimi gels. It is well known that TPA can explore the textural properties of food through the texture analyzer (TA-XT Plus, Stable Micro Systems Ltd, Surrey, UK) equipped with a P/75 probe to simulate human oral chewing action and obtain the texture characteristic values related to human sensory evaluation. The physical property parameter settings were as follows: downforce (5 g), compression degree (50%), pre-test speed, test speed, and post-test speed (1.0 mm·s−1).

    The cooking loss of surimi gel under different treatments was determined referring to the protocol of Dong et al.[26]. The cooked surimi gel sample was instantly absorbed dry and weighed (W5). The cooking loss (CL) is calculated as follows:

    CL(g/100g)=(M1M2)/M1×100 (1)

    Where M1, weight of the sample before cooking; M2, weight of the sample after cooking.

    The LF-NMR of the mixed surimi gel was detected by a PQ001-20-025V NMR analyzer (Niumag Analytical Instruments Co., Ltd, Suzhou, China) referring to the previous method conducted by Li et al.[27]. Relevant characteristic parameters were set as follows: sampling frequency (200 KHZ), echo time (0.3 ms), and cumulative number (8). Keeping the surimi gel sample (approximately 2 g) at room temperature for 30 min, they were carefully put into a cylindrical nuclear magnetic tube (15 mm in diameter), and finally, the relaxation time (T2) was recorded using the Carr Purcell Meiboom Gill (CPMG) pulse sequence.

    CM-5 colorimeter (Konica Minolta Sensing, Inc., Tokyo, Japan) was used for surimi gel with different treatments following to the procedure of Wang et al.[28]. Several 1 cm thick slices were cut from surimi samples (n = 3) selected from different treatment groups, and the gel whiteness was calculated according to the following formula:

    Whiteness=100(100L)2+a2+b2 (2)

    According to the previously described procedure by Gao et al.[29], the square-shaped surimi gels (4 mm × 4 mm × 4 mm) were immersed in 0.1 mol·L−1 phosphate buffer (pH 7.2) containing 2.5% (v/v) glutaraldehyde for 24 h. The above samples were washed using phosphate buffer (0.1 mol·L−1, pH 7.2) three times and then subsequently dehydrated in a series of alcohol solutions. The microstructures of the mixed surimi gels were imaged using an FEI Verios 460 SEM (FEI Inc., Hillsboro, OR, USA).

    The TBARS value was analyzed by the method described by Hu et al.[30] with slight modification. Thiobarbituric acid solution (1.5 mL) and 8.5 mL of trichloroacetic acid solution were added to the sample in turn, the mixture was bathed in water at 100 °C for 30 min. The supernatant was extracted and centrifuged twice (3,000× g, 5 min): (1) The original supernatant (5 mL) was taken and the same amount of chloroform for mixed centrifugation; (2) The second supernatant (3 mL) and petroleum ether (1.5 mL) were taken for mixed centrifugation. Finally, a small amount of lower liquid was taken to determine the absorbance (A532 nm). The final result was expressed in malondialdehyde equivalent (mg·kg−1).

    All statistical analyses of data were investigated by statistical product and service solutions IBM SPSS Statistics version 23.0 (IBM SPSS Inc., Chicago, USA). The LSD all-pairwise multiple comparison method was used for the least significance analysis, and p < 0.05 was considered to indicate significance. The experimental data are expressed as mean ± standard deviation (SD) and plotted using Origin 2019 (Origin Lab, Northampton, MA, USA) software.

    The steady-state shear flow curve can be used to characterize the interaction between proteins. The steady shear flow changes of apparent viscosity (Pa·s) of composite surimi with shear rate (s−1) under different treatments are shown in Fig. 1a. The apparent viscosity of all samples decreased significantly (p < 0.05) with increasing shear rate, exhibiting shear-thinning behavior[31]. In the range of shear rates from 0.1 to 100 s−1, the samples with TGase addition were always higher than the control, indicating that the induction of TGase enhanced the cross-linking of surimi proteins and formed a more stable structure. The surimi samples added with a lower proportion of ε-PL (0.005% and 0.01%) were regarded as lower viscosity fluid (Fig. 1a). The possible reason was that the low concentration of ε-PL provided a weak effect on the pH value of the surimi system. As a consequence, the content of the net charge provided was relatively small and the electrostatic interaction between the surimi proteins was weakened[20].

    Figure 1.  Effect of different treatments on rheological properties of surimi.

    The elastic modulus (G′) mainly depends on the interaction between protein molecules, which can reflect the change of elasticity in the heat-induced surimi gel. As shown in Fig. 1b, the gel process of surimi in the control group was a thermodynamic process consisting of two typical stages. In the first stage, the value of G' showed a gradual downward trend in the range of 20~50 °C. This is mainly because, (1) the activity of endogenous protease in surimi is increased; (2) the myosin light chain subunits of surimi are dissociated under the action of protease, forming myosin and actin[24]; (3) heat-induced hydrogen bonds break between protein molecules, thus enhancing the fluidity of the gel system[31]. The second stage: From 50 to 73 °C, the G' value increases rapidly. As the temperature continues to rise to 90 °C, the G 'value keeps rising steadily. At this time, the gel network structure gradually became stable and irreversible.

    Compared with several curves in Fig. 1b, TGase treatment could significantly increase the G' value. The change trend of G' value of the samples added with TGase and ε-PL were similar to that of the control group, but the former increased faster and the maximum value of G' was also significantly higher. The temperature corresponding to the first peak of G' gradually decreased (PL1≈PL2 < PL4≈TE < PL3≈PL5 < CK), indicating that the process of protein denaturation and aggregation was advanced. This result showed that the proper amount of ε-PL (0.04%) in combination with TGase can reduce the thermal denaturation temperature of protein-forming gel and improve the forming ability of composite gel, which was unanimous with the changes in texture and properties of surimi gel (Table 2). Furthermore, the addition of a small amount (0.005%) or an excessive amount (0.06%) of ε-PL made the mixed surimi protein system more unstable, affecting the ability of TG-induced gel formation as the last resort[32].

    Table 2.  Effect of different treatments on the textural properties of surimi gels.
    GroupsHardness (g)SpringinessCohesivenessChewiness (g)Resilience
    CK811.40 ± 45.28de0.81 ± 0.01a0.53 ± 0.02b498.36 ± 21.58c0.21 ± 0.01e
    TE1105.80 ± 61.83c0.83 ± 0.01a0.56 ± 0.01b510.40 ± 26.04c0.24 ± 0.00bcd
    TE + P1736.01 ± 18.49e0.80 ± 0.03a0.61 ± 0.00a348.78 ± 18.36d0.23 ± 0.01cde
    TE + P2777.45 ± 39.61de0.80 ± 0.01a0.60 ± 0.02a307.03 ± 12.97e0.22 ± 0.00de
    TE + P3869.66 ± 45.82d0.83 ± 0.02a0.63 ± 0.01a485.06 ± 22.73c0.28 ± 0.00a
    TE + P41492.80 ± 77.13a0.83 ± 0.01a0.60 ± 0.01a721.74 ± 31.55a0.26 ± 0.01ab
    TE + P51314.60 ± 84.10b0.81 ± 0.00a0.60 ± 0.02a652.36 ± 30.24b0.25 ± 0.01bc
    Different lowercase letters in the same column indicated significant differences (p < 0.05).
     | Show Table
    DownLoad: CSV

    Gel strength is one of the vital indicators to test the quality of surimi products, which directly affects the texture characteristics and sensory acceptance of the products. The strength of mixed surimi gel with TGase was significantly enhanced by 23.97% (p < 0.05) compared with the control group after heat-inducing. This enhancement is probably caused by the crosslinking promotion of TGase (Fig. 2a). A deeper explanation is that under the catalysis of TGase, the ε-amino group on lysine and the γ-amide group on glutamic acid residues undergo acylation reaction inside or between proteins, forming ε-(γ-Glutamyl)-lysine covalent cross-linking bond which promotes the production of the protein gel network[26].

    Figure 2.  (a) Catalytic reaction of glutamine transaminase and (b) effect of different treatments on gel strength and cooking loss of surimi gel. a−d/A−D: values with different lowercase letters indicate significant difference (p < 0.05).

    On the basis of adding TGase, the strength of the mixed gel with ε-PL concentration ranging from 0.005% to 0.03% was lower than that of TE (Fig. 2b). It was speculated that the surimi sample with low concentration ε-PL was a fluid with lower viscosity, and the interaction between protein and water is strengthened, while the electrostatic interaction between proteins is further weakened[33]. This was also consistent with the change in rheological properties in Fig. 1a. Nevertheless, with the increase of ε-PL content to 0.04%, the gel strength of surimi gel significantly increased and reached the highest value (781.63 g·cm), which was about 21.03% higher than that of the TE group (p < 0.05) (Fig. 2b). The increase of gel strength in this process was obtained due to the following three possible reasons, (1) ε-PL is a cationic amino acid with positive charge, which can improve the pH value of protein or meat product system; (2) The interaction between the ε-amino group of ε-PL and the aromatic residue of protein, namely the cation-π interaction, can change the structure of meat protein[34]; (3) Protein (mixed surimi system) with high ε-amino group content, TGase has strong gel improving ability[35].

    Such synergy (ε-PL = 0.04%), as a comprehensive result of different impactors, is that after the surimi was mixed under the optimal ratio conditions, the synthesis of TGase enzyme catalysis, pH value shift, changes in protein and amino acid composition, etc., increased the strength of various forces, thus forming a denser stereoscopic network structure. Note that when the content of ε-PL reached 0.06%, the gel strength of the corresponding surimi gel decreased by 10% compared with 0.04%. Similarly, others reported the result that alkaline amino acids led to the reduction of the strength of the myosin gel of bighead carp[36].

    TPA, also known as whole texture, is a comprehensive parameter that determines the sensory quality of surimi gel, including hardness, elasticity, cohesion, chewiness, and resilience[37]. As shown in Table 2, the addition of TGase significantly improved the texture properties of surimi gel (p < 0.05), which is related to TGase's ability to induce surimi protein to form more ε-(γ-Glu)-Lys covalent bond during heating[38] (Fig. 2a). Compared with the cross-linking induced by TGase alone, the gel hardness of the mixed surimi gel treated with ε-PL showed a similar change to the gel strength (Fig. 2b). As the concentration of ε-PL increased from 0.005% to 0.04%, the hardness of surimi gel gradually increased until it reached the maximum (1,492.80 g). At the same time, we also observed that the elasticity, cohesion, and chewiness of the composite gel reached the highest values with the 0.04% ε-PL, and these were higher than those of the TGase-only group. Similar to the findings of Ali et al.[39], the author found that the combination of ε-PL and beetroot extract can effectively replace nitrite, which produced a marked effect in maintaining the color of Frankfurt sausage and improving the texture and performance. However, the data we collated above (Table 2) also showed a clear phenomenon, that is, the addition of ε-PL with lower concentration (0.005%−0.02%) or highest concentration (0.06%) was not conducive to the combination with TGase to improve the texture characteristics of mixed surimi gel.

    Cooking loss indicates the water holding capacity of heated surimi, which usually represents the stability of the three-dimensional network structure of surimi gel[40]. The 0.4% TGase significantly reduced the cooking loss of surimi samples (p < 0.05), which was 4.91% lower than that of the control group (Fig. 2b). When the addition of PL (combined with TGase) gradually increased from 0.005% to 0.04%, the cooking loss of surimi showed a decreasing trend and reached the minimum at 0.04%. The ε-PL-added surimi gel samples had higher cooking loss compared with that of only with TGase. Most notably, this may be due to ε-PL is able to further exert the cross-linking effect of TGase. A similar finding was reported in the study by Ma et al.[22], adding ε-PL is able to improve the solubility of myofibrillar proteins. Proteins with high solubility are more easily induced by TGase during heating, which aggravates the cross-linking between ε-PL-protein or protein-protein and forms a disordered gel network structure with relatively weaker water-holding capacity.

    As shown in Table 3, the high lightness (L*), low yellowness (b*), and high whiteness of surimi in the control group were relatively low, with values of 72.49, 10.42, and 70.56 respectively. After TGase was added to induce cross-linking, these values increased significantly (p < 0.05), which may be related to the photochromic effect of water molecules released from gel matrix under TGase-induced surimi protein cross-linking reported in the previous study[41]. Furthermore, on the basis of adding TGase, it was interesting to see that the L* and whiteness values of surimi gel first increased and then gradually decreased with the increase in ε-PL concentration. The influence of ε-PL combined with TGase on the whiteness of gel can be attributed to three reasons: (1) The addition of ε-PL can effectively increase the substrate content of TGase, and promote the cross-linking between proteins, so as to obtain a much more compact surimi gel structure, which affects the refractive index of light; (2) The water retention performance of the high surimi gel was significantly improved with the addition of ε-PL[42] (Fig. 2b), at this time, the L* value (positively related to the whiteness) value showed a decreasing trend with the decrease of the surface free water content of the gel sample; (3) With the increase of ε-PL concentration, some colored substances, formed due to the accelerated Maillard reaction rate during the preparation of gel, may have an adverse effect on the improvement of gel whiteness[43]. After adding TGase to induce cross-linking, although the whiteness value of composite surimi was significantly enhanced, ε-PL was not enough to further improve the whiteness value of final mixed surimi gel, and high concentration so far as to have a negative impact on the whiteness value.

    Table 3.  Effect of different treatments on the color of surimi gels.
    GroupsL*a*b*Whiteness
    CK72.49 ± 0.82e−0.92 ± 0.01e10.42 ± 0.33d70.56 ± 0.65d
    TE77.82 ± 0.34ab−0.23 ± 0.02c12.29 ± 0.29bc74.64 ± 0.26ab
    TE + P178.39 ± 0.40a−0.14 ± 0.01a12.46 ± 0.12ab75.05 ± 0.41a
    TE + P278.42 ± 0.43a−0.17 ± 0.0b12.46 ± 0.15ab75.07 ± 0.32a
    TE + P377.48 ± 0.16b−0.18 ± 0.02b12.37 ± 0.09abc74.31 ± 0.11b
    TE + P476.34 ± 0.05c−0.22 ± 0.01c12.73 ± 0.02a73.13 ± 0.04c
    TE + P575.48 ± 0.18d−0.26 ± 0.01d12.01 ± 0.14c72.70 ± 0.19c
    Different lowercase letters in the same column indicated significant differences (p < 0.05).
     | Show Table
    DownLoad: CSV

    The water distribution in surimi gel products was measured by LF-NMR[44], and the results were inverted to obtain the transverse relaxation time (T2), which reflects the strength of water fluidity[45]. There are four fitted wave peaks which are assigned to four different water distribution states and wave peak ranges (Fig. 3, Table 4): strong bound water T21 (0.1−1 ms), weak bound water T22 (1−10 ms), non-flowing water T23 (10−100 ms) and free water T24 (100−1,000 ms)[46]. At the same time, similar characteristics (the main peak is centered on T23) are possessed by the water distribution of all surimi gel samples. The addition of TGase increased the proportion of non-flowing water, accompanying the significant decrease in the content of free water (p < 0.05), compared with the control group. It proved that the addition of TGase brought this phenomenon, namely the bound water in surimi gel was partially transferred to the non-flowing, which also indicated the reduction of cooking loss of surimi samples induced by TGase (Fig. 2). On the basis of adding TGase, the low level of ε-PL (0.005%, 0.01% and 0.02%) inhibited the transition of free water in surimi gel to non-flowing water, in which the proportion of T23 decreased by 2.05%, 2.74%, and 1.42% respectively compared with the surimi gel only with TGase, while T24 increased by 15.76%, 14.17%, and 4.43% respectively. The proportion of P23 in the surimi gel sample (ε-PL = 0.04%) was equivalent to that of the TE group, implying that the addition of appropriate ε-PL was not directly connected with the changes in water distribution in surimi after TGase-induced cross-linking, and slight addition would have a negative impact, which was unanimous with the above research results of cooking loss (Fig. 2a).

    Figure 3.  Effect of different treatments on the transverse relaxation time T2 of surimi gel.
    Table 4.  Effect of different treatments on the transverse relaxation time T2 of surimi gel.
    GroupsP21 (%)P22 (%)P23 (%)P24 (%)
    CK2.175 ± 0.186c1.198 ± 0.012e82.863 ± 0.691bc13.764 ± 0.091a
    TE1.938 ± 0.095d2.166 ± 0.043a85.144 ± 1.336a10.752 ± 0.033e
    TE + P12.705 ± 0.067b1.414 ± 0.009d83.435 ± 1.616b12.446 ± 0.105c
    TE + P23.005 ± 0.003a1.845 ± 0.056b82.874 ± 1.739bc12.276 ± 0.108c
    TE + P33.107 ± 0.063a1.715 ± 0.033c83.950 ± 1.587ab11.228 ± 0.086d
    TE + P41.770 ± 0.018d2.099 ± 0.059a85.021 ± 1.756a11.110 ± 0.144d
    TE + P53.121 ± 0.007a1.758 ± 0.107bc82.136 ± 1.091c12.985 ± 0.018b
    Different lowercase letters in the same column indicated significant differences (p < 0.05).
     | Show Table
    DownLoad: CSV

    The effect of different treatment methods on the microstructure of surimi gel was observed by SEM. As shown in Fig. 4, the microstructure of the control surimi gel (Fig. 4a) was observed to be enormously loose, uneven, and irregular, with large pores, which explained the reason why the control surimi gel had low strength and large cooking loss (Fig. 2b). In addition, the morphological properties of another group of surimi gel (TGase-induced) are appreciably different from the scanning electron micrograph mentioned above (Fig. 4b). Numerous compact and evenly distributed small pores were observed, instead of the loose structure in the control sample, which accounted for the fact that TGase could interact with proteins to form a more uniform and orderly three-dimensional network structure in the process of gel formation[47]. Moreover, similar findings were also reported in the previous studies of Dong et al.[26]. When treated with TGase and ε-PL (from 0.05% to 0.04%), the surface of the surimi gel sample gradually became flat through observation (Fig. 4f). We found that some smaller pores were formed and some larger pores were slightly supplemented visually. Remarkably, when the addition of ε-PL increased to 0.06% (Fig. 4g), the structure of surimi gel was not as uniform as before, and some large and irregular holes appeared obviously. This phenomenon might be related to moderate ε-PL, especially 0.02%, which can promote the cross-linking of TGase with protein and the aggregation/denaturation of different components, which agreed with the change of coagulation strength of surimi samples.

    Figure 4.  Effect of different treatments on the microstructure of surimi.

    TBARS value, which can reflect the degree of lipid oxidation and rancidity of surimi, is an important indicator for the occurrence of oxidation[48]. Some substances in surimi, such as unsaturated fatty acids, will inevitably undergo oxidative decomposition to produce a large amount of malondialdehyde (MDA), the latter reacts easily with thiobarbituric acid (TBA) reagent to produce red compounds with maximum absorbance at 532 nm. As illustrated in Fig. 5, when TGase and a certain amount of PL (from 0.005% to 0.06%) were added, the TBARs value of surimi gels decreased to 2.03 and 1.67 mg/kg respectively, compared with the control group (2.26 mg/kg). This shows that the addition of both can significantly reduce the TBARS value of surimi gel (p < 0.05), considered to be a cue for the fat oxidation of surimi being inhibited. In addition, we also found that the antioxidant effect of PL was dose-dependent. The ε-PL can be chelated by ferrous ions along with the ability to scavenge free radicals like hydroxyl radicals, ensuring its antioxidant properties[33]. The ε-PL was prospectively considered as an antioxidant additive to prevent surimi protein from deteriorating induced by oxidation[49]. Similarly, making use of lysine or ε-PL as antioxidants in plant protein and meat protein has been widely reported[33, 50]. Fan et al.[42] confirmed that ε-PL addition has a significant effect on maintaining a high total phenolic content and vitamin C levels in fresh lettuce, which also shows that it has certain antioxidant activity.

    Figure 5.  Effect of different treatments on TBARS values of surimi gel. a−f: values with different lowercase letters indicate significant difference (p < 0.05).

    The addition of ε-PL at different concentrations had an apparent impact on the characteristics of TGase-induced mixed surimi gel, accompanied by the following situations: The 0.04% ε-PL provided a synergistic effect to promote the aggregation and crosslinking of surimi proteins induced by TGase; The rheology, LF-NMR and SEM results showed that the appropriate concentration (0.04%) of ε-PL apparently enhanced the initial apparent viscosity and elasticity of surimi samples, which was conducive to the formation of a more dense and uniform three-dimensional network structure, further limiting the flow of water in surimi and the exudation of hydrophilic substances; Simultaneously, the network strength was strengthened along with the texture properties of the mixed surimi gel. Furthermore, ε-PL had a strong ability to inhibit lipid oxidation in mixed surimi gel, showing a concentration dependence. When the content of ε-PL ran to lowest (0.005%−0.01%) or highest (0.6%), the improvement of the quality of surimi mixed gel was opposite to the above. The results show that ε-PL can be perceived as a prospective polyfunctional food additive to improve the texture properties, nutritional advantages, and product stability of surimi products.

  • The authors confirm contribution to the paper as follows: study conception and design: Cao Y, Xiong YL, Yuan F, Liang G; data collection: Liang G, Cao Y, Li Z, Liu M; analysis and interpretation of results: Li Z, Cao Y, Liang G, Liu Z, Liu M; draft manuscript preparation: Li Z, Cao Y, Liu ZL. All authors reviewed the results and approved the final version of the manuscript.

  • The datasets generated during and/or analyzed during the current study are available from the corresponding author on reasonable request.

  • This work was financially supported by the Natural Science Basic Research Program of Shaanxi (No. 2023-JC-YB-146), the fund of Cultivation Project of Double First-Class Disciplines of Food Science and Engineering, Beijing Technology & Business University (No. BTBUKF202215), the Innovation Capability Support Plan of Shaanxi (No. 2023WGZJ-YB-27), the Agricultural Technology Research and Development Project of Xi'an Science and Technology Bureau (No. 22NYYF057), and Jiangsu Yiming Biological Technology Co., Ltd. in China.

  • The authors declare that they have no conflict of interest.

  • Supplemental Fig. S1 Multiple alignment of AGa of the four cultivars.
    Supplemental Fig. S2 Multiple alignment of AGb of the four cultivars.
  • [1]

    Li S, Cheng Y, Sun D, Ma L, Li M, et al. 2021. Identification and Expression of TOP3α in Gerbera hybrida. Horticultural Plant Journal 7:167−73

    doi: 10.1016/j.hpj.2020.05.002

    CrossRef   Google Scholar

    [2]

    Li F, Cheng Y, Ma L, Li S, Wang J. 2022. Identification of reference genes provides functional insights into meiotic recombination suppressors in Gerbera hybrida. Horticultural Plant Journal 8:123−32

    doi: 10.1016/j.hpj.2020.09.008

    CrossRef   Google Scholar

    [3]

    Krizek BA, Fletcher JC. 2005. Molecular mechanisms of flower development: an armchair guide. Nature Reviews Genetics 6:688−98

    doi: 10.1038/nrg1675

    CrossRef   Google Scholar

    [4]

    Zhang L, Chen F, Zhang X, Li Z, Zhao Y, et al. 2020. The water lily genome and the early evolution of flowering plants. Nature 577:79−84

    doi: 10.1038/s41586-019-1852-5

    CrossRef   Google Scholar

    [5]

    Meyerowitz EM. 1994. Flower development and evolution: new answers and new questions. PNAS 91:5735−37

    doi: 10.1073/pnas.91.13.5735

    CrossRef   Google Scholar

    [6]

    Yanofsky MF, Ma H, Bowman JL, Drews GN, Feldmann KA, et al. 1990. The protein encoded by the Arabidopsis homeotic gene agamous resembles transcription factors. Nature 346:35−39

    doi: 10.1038/346035a0

    CrossRef   Google Scholar

    [7]

    Mizukami Y, Ma H. 1997. Determination of Arabidopsis floral meristem identity by AGAMOUS. The Plant Cell 9:393−408

    doi: 10.1105/tpc.9.3.393

    CrossRef   Google Scholar

    [8]

    Chen X. 2004. A microRNA as a translational repressor of APETALA2 in Arabidopsis flower development. Science 303:2022−25

    doi: 10.1126/science.1088060

    CrossRef   Google Scholar

    [9]

    Dubois A, Raymond O, Maene M, Baudino S, Langlade NB, et al. 2010. Tinkering with the C-function: a molecular frame for the selection of double flowers in cultivated roses. PLoS One 5:e9288

    doi: 10.1371/journal.pone.0009288

    CrossRef   Google Scholar

    [10]

    Sun Y, Fan Z, Li X, Liu Z, Li J, et al. 2014. Distinct double flower varieties in Camellia japonica exhibit both expansion and contraction of C-class gene expression. BMC Plant Biology 14:1−11

    doi: 10.1186/s12870-014-0288-1

    CrossRef   Google Scholar

    [11]

    Sharifi A, Oizumi K, Kubota S, Bagheri A, Shafaroudi SM, et al. 2015. Double flower formation in Tricyrtis macranthopsis is related to low expression of AGAMOUS ortholog gene. Scientia Horticulturae 193:337−45

    doi: 10.1016/j.scienta.2015.06.050

    CrossRef   Google Scholar

    [12]

    Liu Z, Zhang D, Liu D, Li F, Lu H. 2013. Exon skipping of AGAMOUS homolog PrseAG in developing double flowers of Prunus lannesiana (Rosaceae). Plant Cell Reports 32:227−37

    doi: 10.1007/s00299-012-1357-2

    CrossRef   Google Scholar

    [13]

    Gattolin S, Cirilli M, Pacheco I, Ciacciulli A, Da Silva Linge C, et al. 2018. Deletion of the miR172 target site in a TOE-type gene is a strong candidate variant for dominant double-flower trait in Rosaceae. The Plant Journal 96:358−71

    doi: 10.1111/tpj.14036

    CrossRef   Google Scholar

    [14]

    François L, Verdenaud M, Fu X, Ruleman D, Dubois A, et al. 2018. A miR172 target-deficient AP2-like gene correlates with the double flower phenotype in roses. Scientific Reports 8:12912

    doi: 10.1038/s41598-018-30918-4

    CrossRef   Google Scholar

    [15]

    Wang Q, Zhang X, Lin S, Yang S, Yan X, et al. 2020. Mapping a double flower phenotype-associated gene DcAP2L in Dianthus chinensis. Journal of Experimental Botany 71:1915−27

    doi: 10.1093/jxb/erz558

    CrossRef   Google Scholar

    [16]

    Gattolin S, Cirilli M, Chessa S, Stella A, Bassi D, et al. 2020. Mutations in orthologous PETALOSA TOE-type genes cause a dominant double-flower phenotype in phylogenetically distant eudicots. Journal of Experimental Botany 71:2585−95

    doi: 10.1093/jxb/eraa032

    CrossRef   Google Scholar

    [17]

    Wollmann H, Mica E, Todesco M, Long JA, Weigel D. 2010. On reconciling the interactions between APETALA2, miR172 and AGAMOUS with the ABC model of flower development. Development 137:3633−42

    doi: 10.1242/dev.036673

    CrossRef   Google Scholar

    [18]

    Abdirashid H, Lenhard M. 2020. Say it with double flowers. Journal of Experimental Botany 71:2469−71

    doi: 10.1093/jxb/eraa109

    CrossRef   Google Scholar

    [19]

    Agrawal GK, Abe K, Yamazaki M, Miyao A, Hirochika H. 2005. Conservation of the E-function for floral organ identity in rice revealed by the analysis of tissue culture-induced loss-of-function mutants of the OsMADS1 gene. Plant Molecular Biology 59:125−35

    doi: 10.1007/s11103-005-2161-y

    CrossRef   Google Scholar

    [20]

    Glover BJ. 2013. My favourite flowering image. Journal of Experimental Botany 64:5775−77

    doi: 10.1093/jxb/erp049

    CrossRef   Google Scholar

    [21]

    El-Dairi M, House RJ. 2020. Optic nerve hypoplasia. In Handbook of Pediatric Retinal OCT and the Eye-Brain Connection, eds. Toth CA, Ong SS. London: Elsevier. pp. 285−87 https://doi.org/10.1016/B978-0-323-60984-5.00062-7

    [22]

    Zhang B, Liu Z, Ma J, Song Y, Chen F. 2015. Alternative splicing of the AGAMOUS orthologous gene in double flower of Magnolia stellata (Magnoliaceae). Plant Science 241:277−85

    doi: 10.1016/j.plantsci.2015.10.017

    CrossRef   Google Scholar

    [23]

    Wang Q, Dan N, Zhang X, Lin S, Bao M, Fu X. 2020. Identification, characterization and functional analysis of C-class genes associated with double flower trait in carnation (Dianthus caryphyllus L. ). Plants 9:87

    doi: 10.3390/plants9010087

    CrossRef   Google Scholar

    [24]

    Cartolano M, Efremova N, Kuckenberg M, Raman S, Schwarz-Sommer Z. 2009. Enhanced AGAMOUS expression in the centre of the Arabidopsis flower causes ectopic expression over its outer expression boundaries. Planta 230:857−62

    doi: 10.1007/s00425-009-0966-7

    CrossRef   Google Scholar

    [25]

    Jack T, Sieburth L, Meyerowitz E. 1997. Targeted misexpression of AGAMOUS in whorl 2 of Arabidopsis flowers. The Plant Journal 11:825−39

    doi: 10.1046/j.1365-313X.1997.11040825.x

    CrossRef   Google Scholar

    [26]

    Schmittgen TD, Livak KJ. 2008. Analyzing real-time PCR data by the comparative CT method. Nature Protocols 3:1101−8

    doi: 10.1038/nprot.2008.73

    CrossRef   Google Scholar

  • Cite this article

    Jin C, Geng H, Qu S, Zhang D, Mo X, et al. 2022. AGAMOUS correlates with the semi-double flower trait in carnation. Ornamental Plant Research 2:11 doi: 10.48130/OPR-2022-0011
    Jin C, Geng H, Qu S, Zhang D, Mo X, et al. 2022. AGAMOUS correlates with the semi-double flower trait in carnation. Ornamental Plant Research 2:11 doi: 10.48130/OPR-2022-0011

Figures(4)  /  Tables(2)

Article Metrics

Article views(5867) PDF downloads(983)

ARTICLE   Open Access    

AGAMOUS correlates with the semi-double flower trait in carnation

Ornamental Plant Research  2 Article number: 11  (2022)  |  Cite this article

Abstract: Flower type is the most valuable ornamental trait in floricultural plants, for which the ABCDE model was proposed to explain the identity of each floral organ in flowering plants. The C-class gene AGAMOUS (AG) is responsible for stamen formation and plays an essential role in the double flower phenotype. A previous study in carnation revealed that the mutation in the miR172 binding site of the A-class gene APETALA2 (AP2) leads to petal accumulation. And the expression level of AG was reduced significantly in the double flowers compared with that in the single flowers. However, there was no sequence polymorphism detected between AGs isolated from the double flowers and single flowers. Here, we performed AG analysis using single and semi-double flower carnations, and detected several mutations located in the crucial position like the MADS-box domain in the AGs of semi-double flower carnations while no changes were found at the miR172 binding site of AP2. As a result, the expression levels of AGs are reduced in the semi-double flower carnation, which could be caught by the loss function of AGs. Our data proves that AGs mutations are also associated with the semi-double flower formation in carnation, complementing the lack of research about AG-mutation-associated double flower formation in carnation.

    • Dianthus caryophyllus L. (carnation) is one of the most important floricultural crops in the world market. Double flower (DF) has been the key breeding target for carnations in the last century, resulting in the long dominant position of DF cultivars such as 'Master', 'Francesco' and 'Karen Rouge' in the carnation market. However, aesthetic habits change, especially for the younger generation. For instance recently, new cultivars with semi-double flowers (SDF) have become a new trend of carnation preference in China. Obviously, aesthetic diversity brings challenges but also provides opportunities for the commercial market.

      In the last few decades, the molecular mechanism regulating flower development has been well studied in the model plant Arabidopsis, and the knowledge has also been transferred in part to ornamental plants[1,2]. In general, the A-, B- and C-class homeotic genes regulate the floral organ formation in a dependent or cooperative way[3,4]. The A-class genes control sepal formation alone and petal formation together with B-class genes; C-class genes determine the carpel fate alone and stamen formation together with the B-class genes[4,5]. In Arabidopsis, the function loss of the C-class gene AG can promote the over-accumulation of the A-class genes (AP1 and AP2), resulting in the homeotic conversion of stamens into petals[6,7]. In turn, the over-accumulation of AP2 can reduce the expression level of AG and lead to the same homeotic conversion of stamens into petals[8]. Similarly, the AG function leads to a petal number increase in Prunus lannesiana, Camellia japonica, Tricyrtis macranthopsis and roses[912]. And the mutation in miR172 target site causes the elevation of AP2 expression, resulting in the formation of double flowers in Prunus persica, roses, carnation, peonies, and camellias[1316]. According to these studies, the DF phenotype is regulated basically by two genetic pathways, either through the loss of AG function or via miR172-mediated target-deficient of AP2[17,18].

      The molecular mechanism underlying petal accumulation was studied also in carnation and the miR172 target-deficient of AP2 was uncovered[16]. However, the regulatory pathway of AG remains unknown. In this study, we cloned the two AG orthologs (DcAGa and DcAGb) and DcAP2 from one single flower (SF) and three SDF cultivars. Sequence polymorphisms causing amino acid changes were identified in DcAGa and DcAGb between SF and SDF cultivars while no difference was detected in the binding site of DcAP2. Further expression analysis indicated that these mutations caused the down-regulation of AGa and AGb. Our results suggest that the DcAG genes are associated with the semi-double flower phenotype as reported in other ornamental plants.

    • The single flower (SF) cultivar, 'Peach Party', typically has five sepals, five petals and 10 stamens. All three semi-double flower (SDF) cultivars possess five sepals but varying numbers of petals and stamens (Fig. 1, Table 1). The petal numbers of 'Pink Star', 'Purple Star' and 'Oscar' are 29.00 ± 3.30, 29.20 ± 3.33 and 26.00 ± 2.79, respectively, four times higher than the SF carnation while the stamen numbers of them are reduced by half, which are 5.20 ± 2.30, 4.90 ± 3.14 and 4.30 ± 2.06, respectively. There are also chimeric petals and stamens observed in the semi-double flower cultivars, including sharp petals similar to stamen and stamens with abnormal anthers, implying the homeotic transition from stamen into petals of the SDF cultivars.
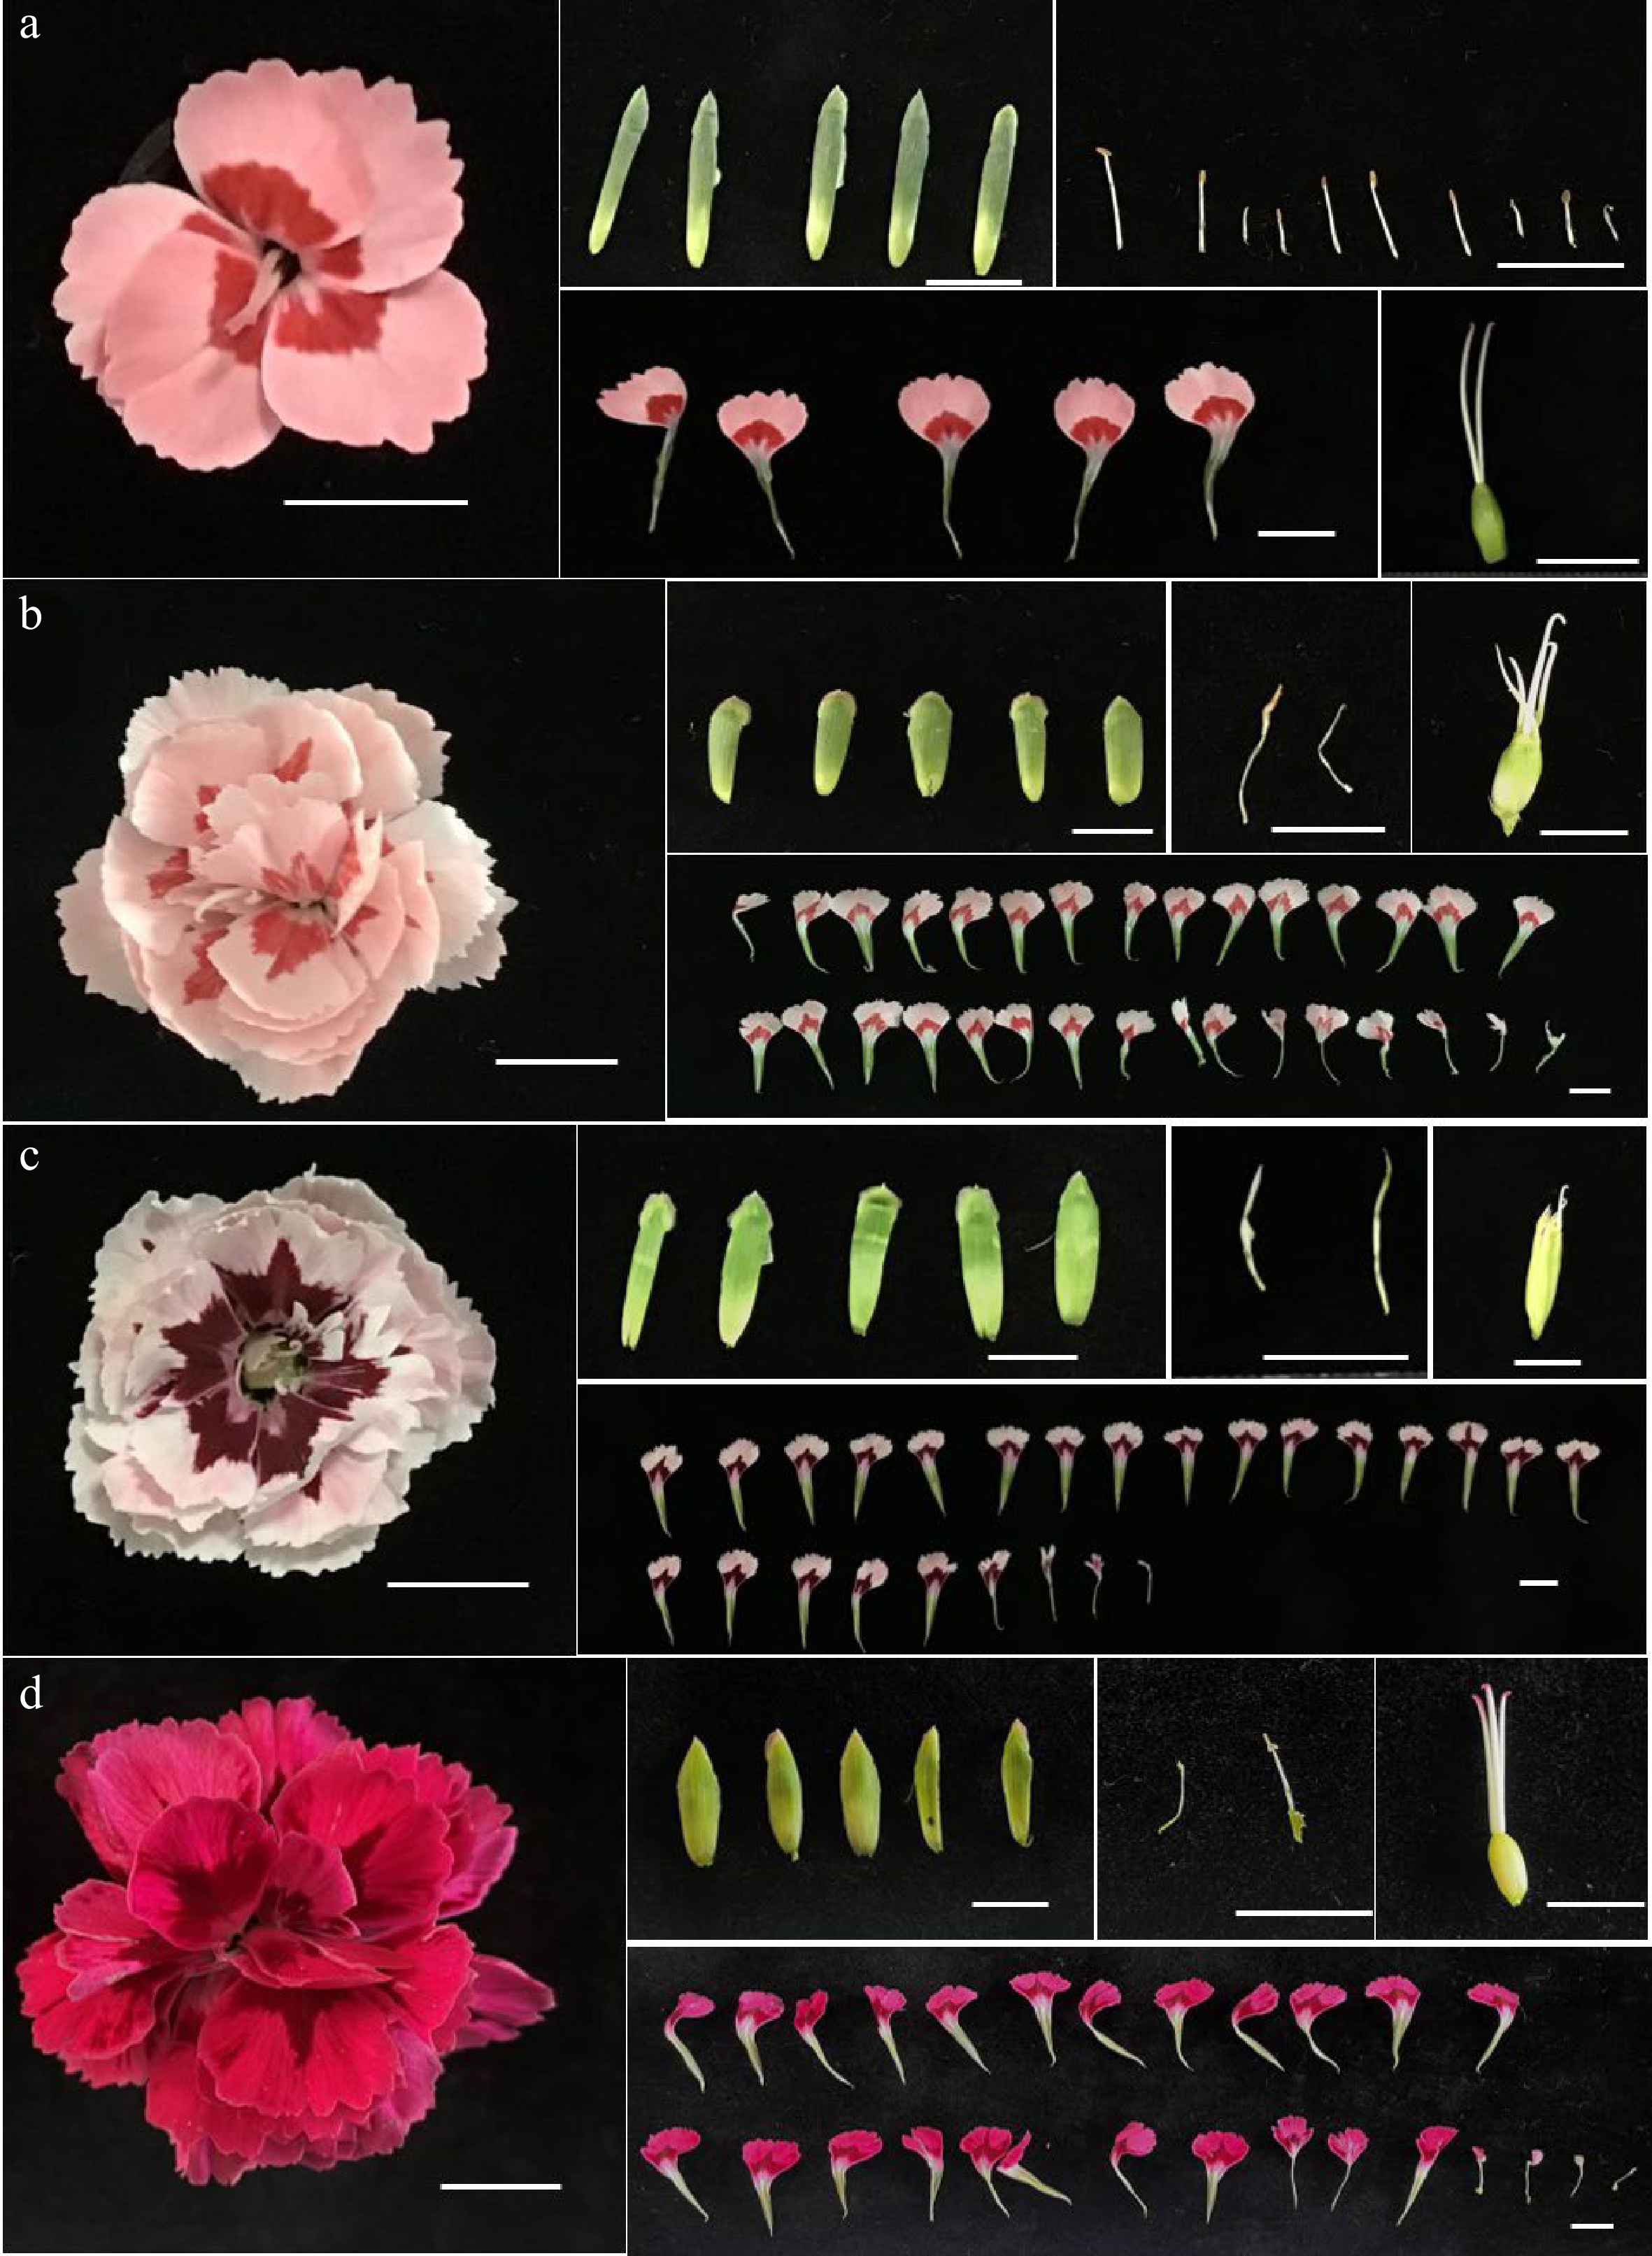
      Figure 1. 

      Characteristics of single and semi-double flower carnations. (a) 'Peach Party' (single flower, pink), (b) 'Pink Star' (semi-double flower, pink), (c) 'Purple Star' (semi-double flower, purple), (d) 'Oscar' (semi-double flower, red). Scale bars = 1 cm.

      Table 1.  Statistics of floral organs of the four cultivars.

      Flower typeAccessionsSepal
      number
      Petal
      number
      Stamen
      number
      SinglePeach Party5.00 ± 0.005.00 ± 0.0010.00 ± 0.00
      Semi-doublePink Star5.00 ± 0.0029.00 ± 3.305.20 ± 2.30
      Semi-doublePurple Star5.00 ± 0.0029.20 ± 3.334.90 ± 3.14
      Semi-DoubleOscar5.00 ± 0.0026.00 ± 2.794.30 ± 2.06
    • It has been reported that the A- and C-class genes co-control the double flower phenotype of carnations. To understand the semi-double flower phenotype formation of this ornamental plant, we first cloned C-class genes from the SF cultivar and three other SDF cultivars. Multiple sequence alignments reveal that there are amino acid substitutions among the two types of cultivars in AGa and AGb. For AGa, the three SDF cultivars share two of the same amino acid changes (A62V, P73L) in the MADS-box domain. And 'Oscar' owns three more amino acid insertions, two at the end of the MADS-box domain and one in the K-box domain. 'Pink star' has another amino acid change (K167R) and an amino acid insertion in the K-box domain (Fig. 2a, Supplemental Fig. S1). 'Oscar' displays specific amino acid changes in the MADS-box domain (T34A) and K-box domain (Q110H) of AGb and shares three of the same amino acid changes with 'Pink star' and 'Purple star' in the K-box domain (K152I, V194A) and AG motif region (E236D) (Fig. 2b, Supplemenatal Fig. S2).
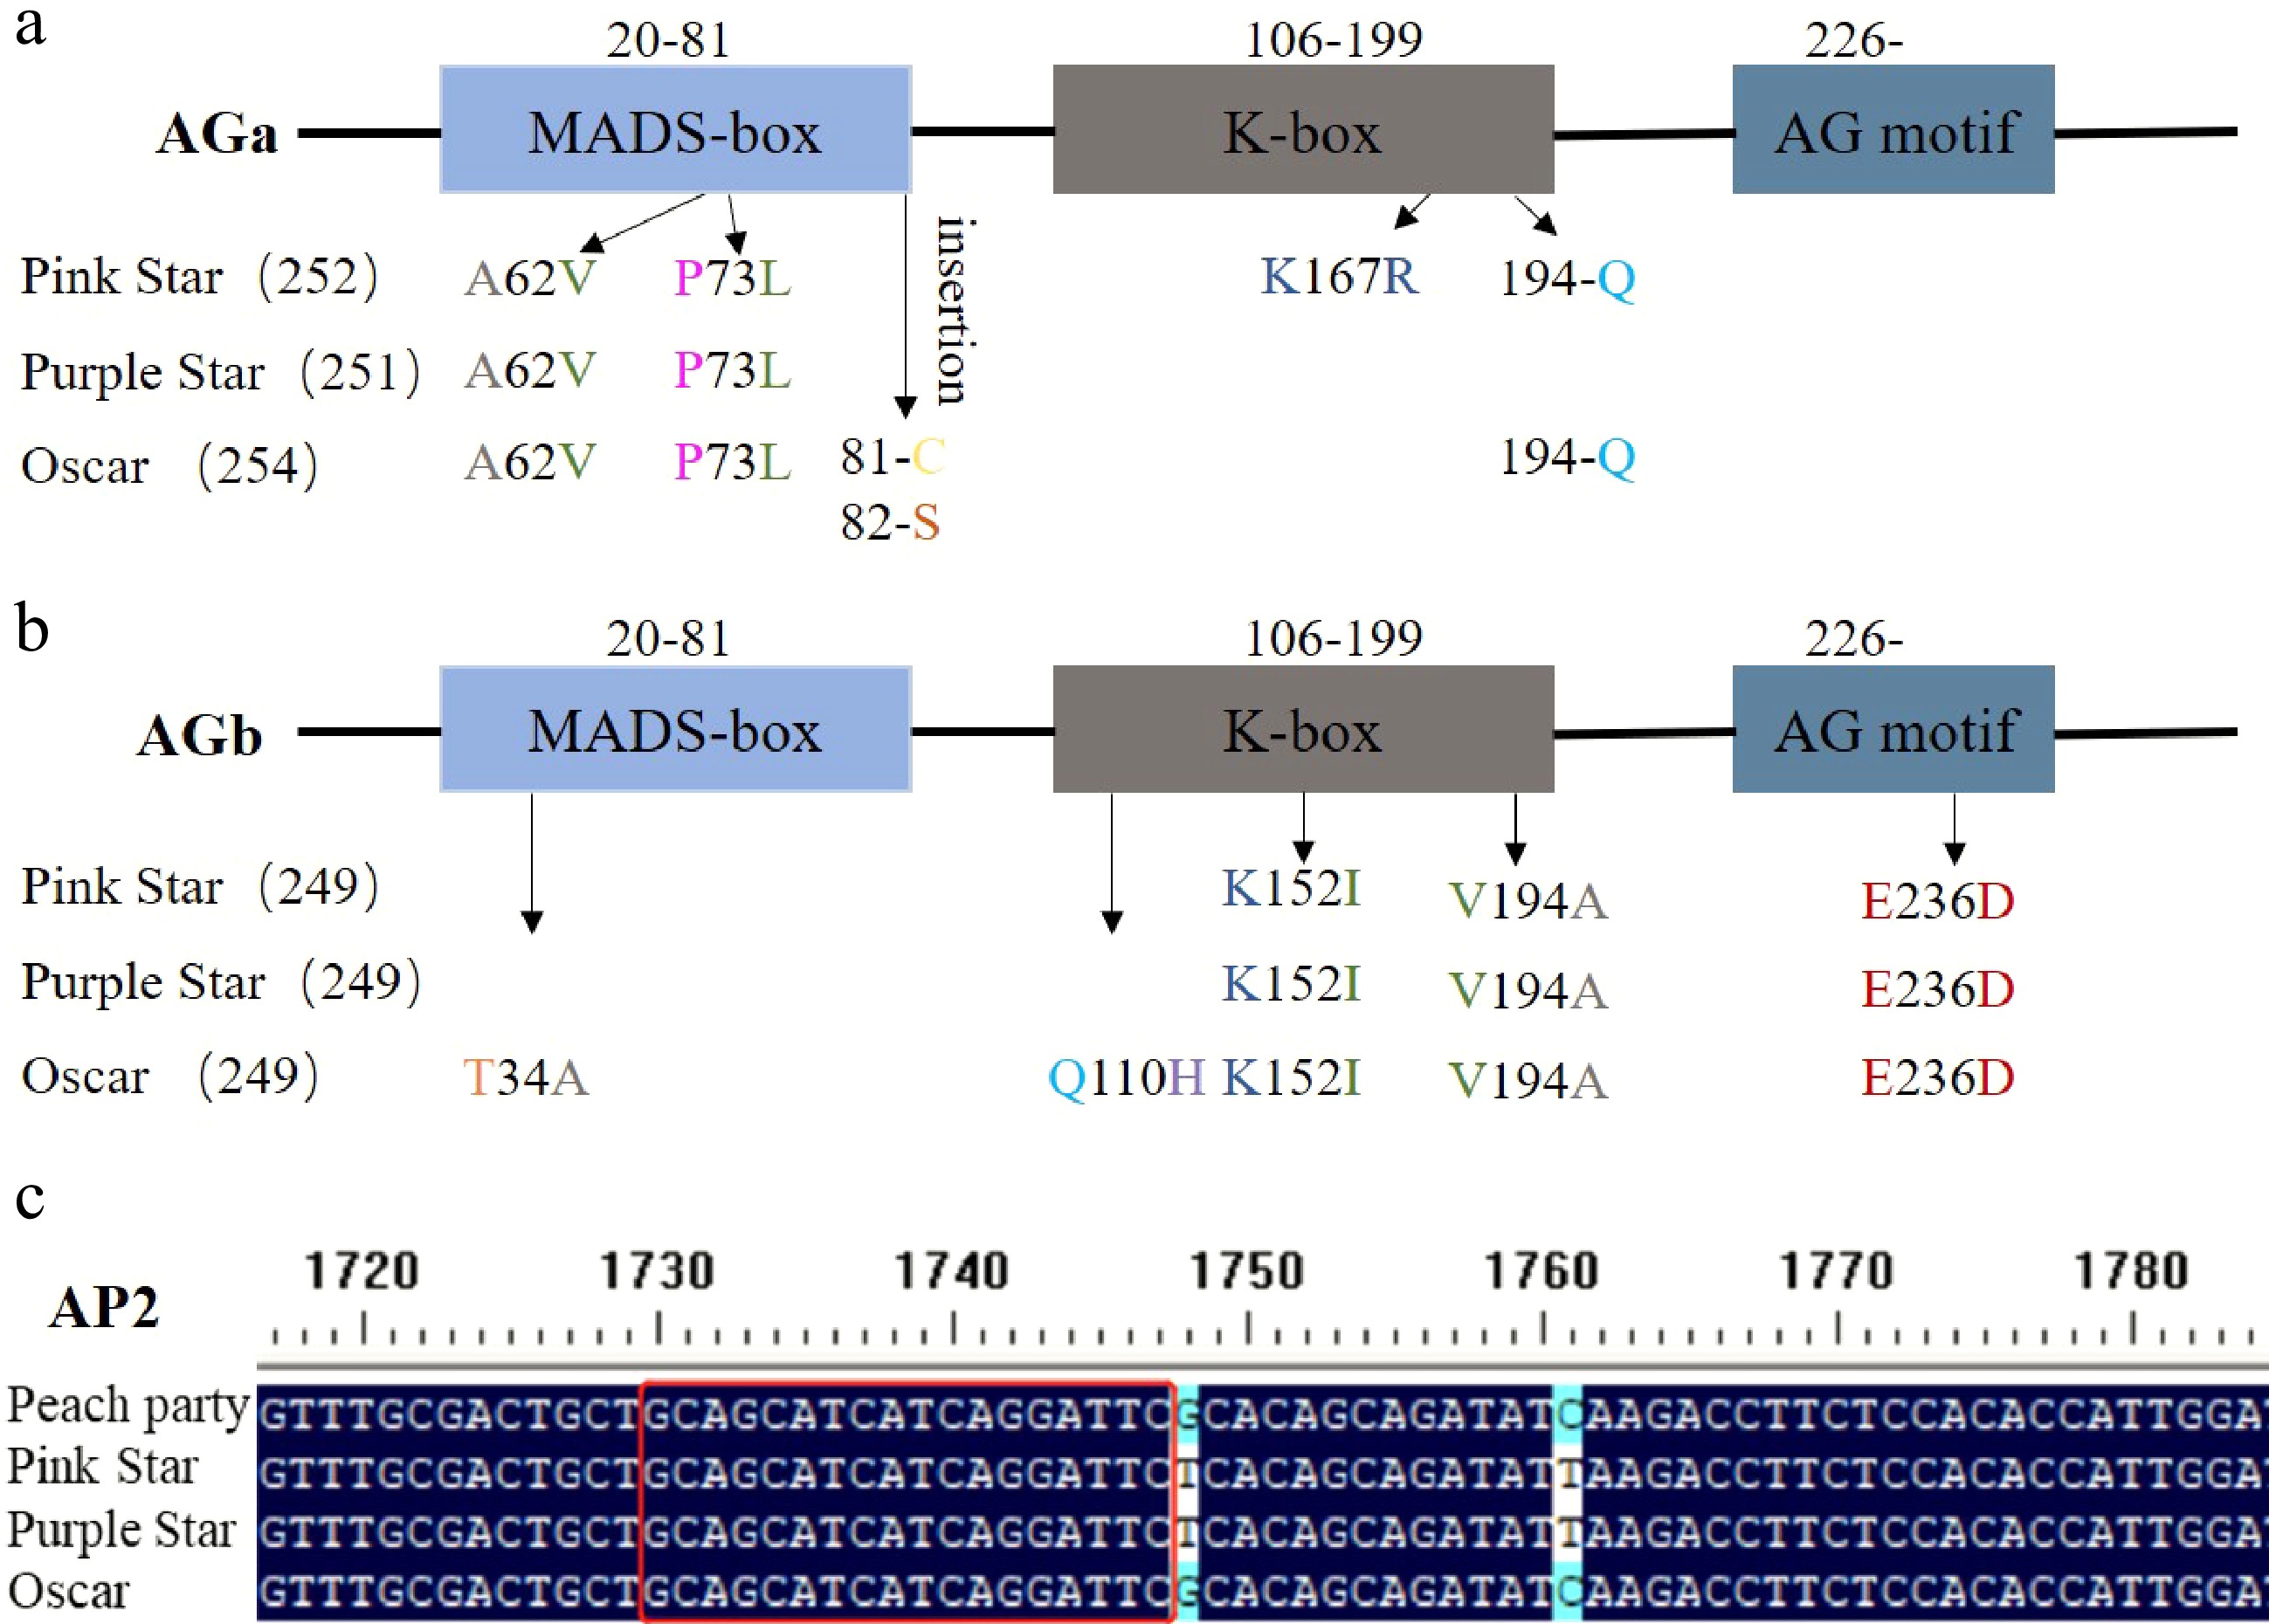
      Figure 2. 

      Sequence polymorphisms of A-class and C-class genes in SF and SDF cultivars. (a) Amino acid substitutions in AGa. (b) Amino acid substitutions in AGb. (c) Sequence covering miR172 bind site of AP2.

      We also analyzed sequences of the miR172 binding site of the A-class gene AP2. Our results show that there is no mutation in the miR172 binding site of AP2 isolated either from the SDF cultivars or the SF cultivar (Fig. 2c).

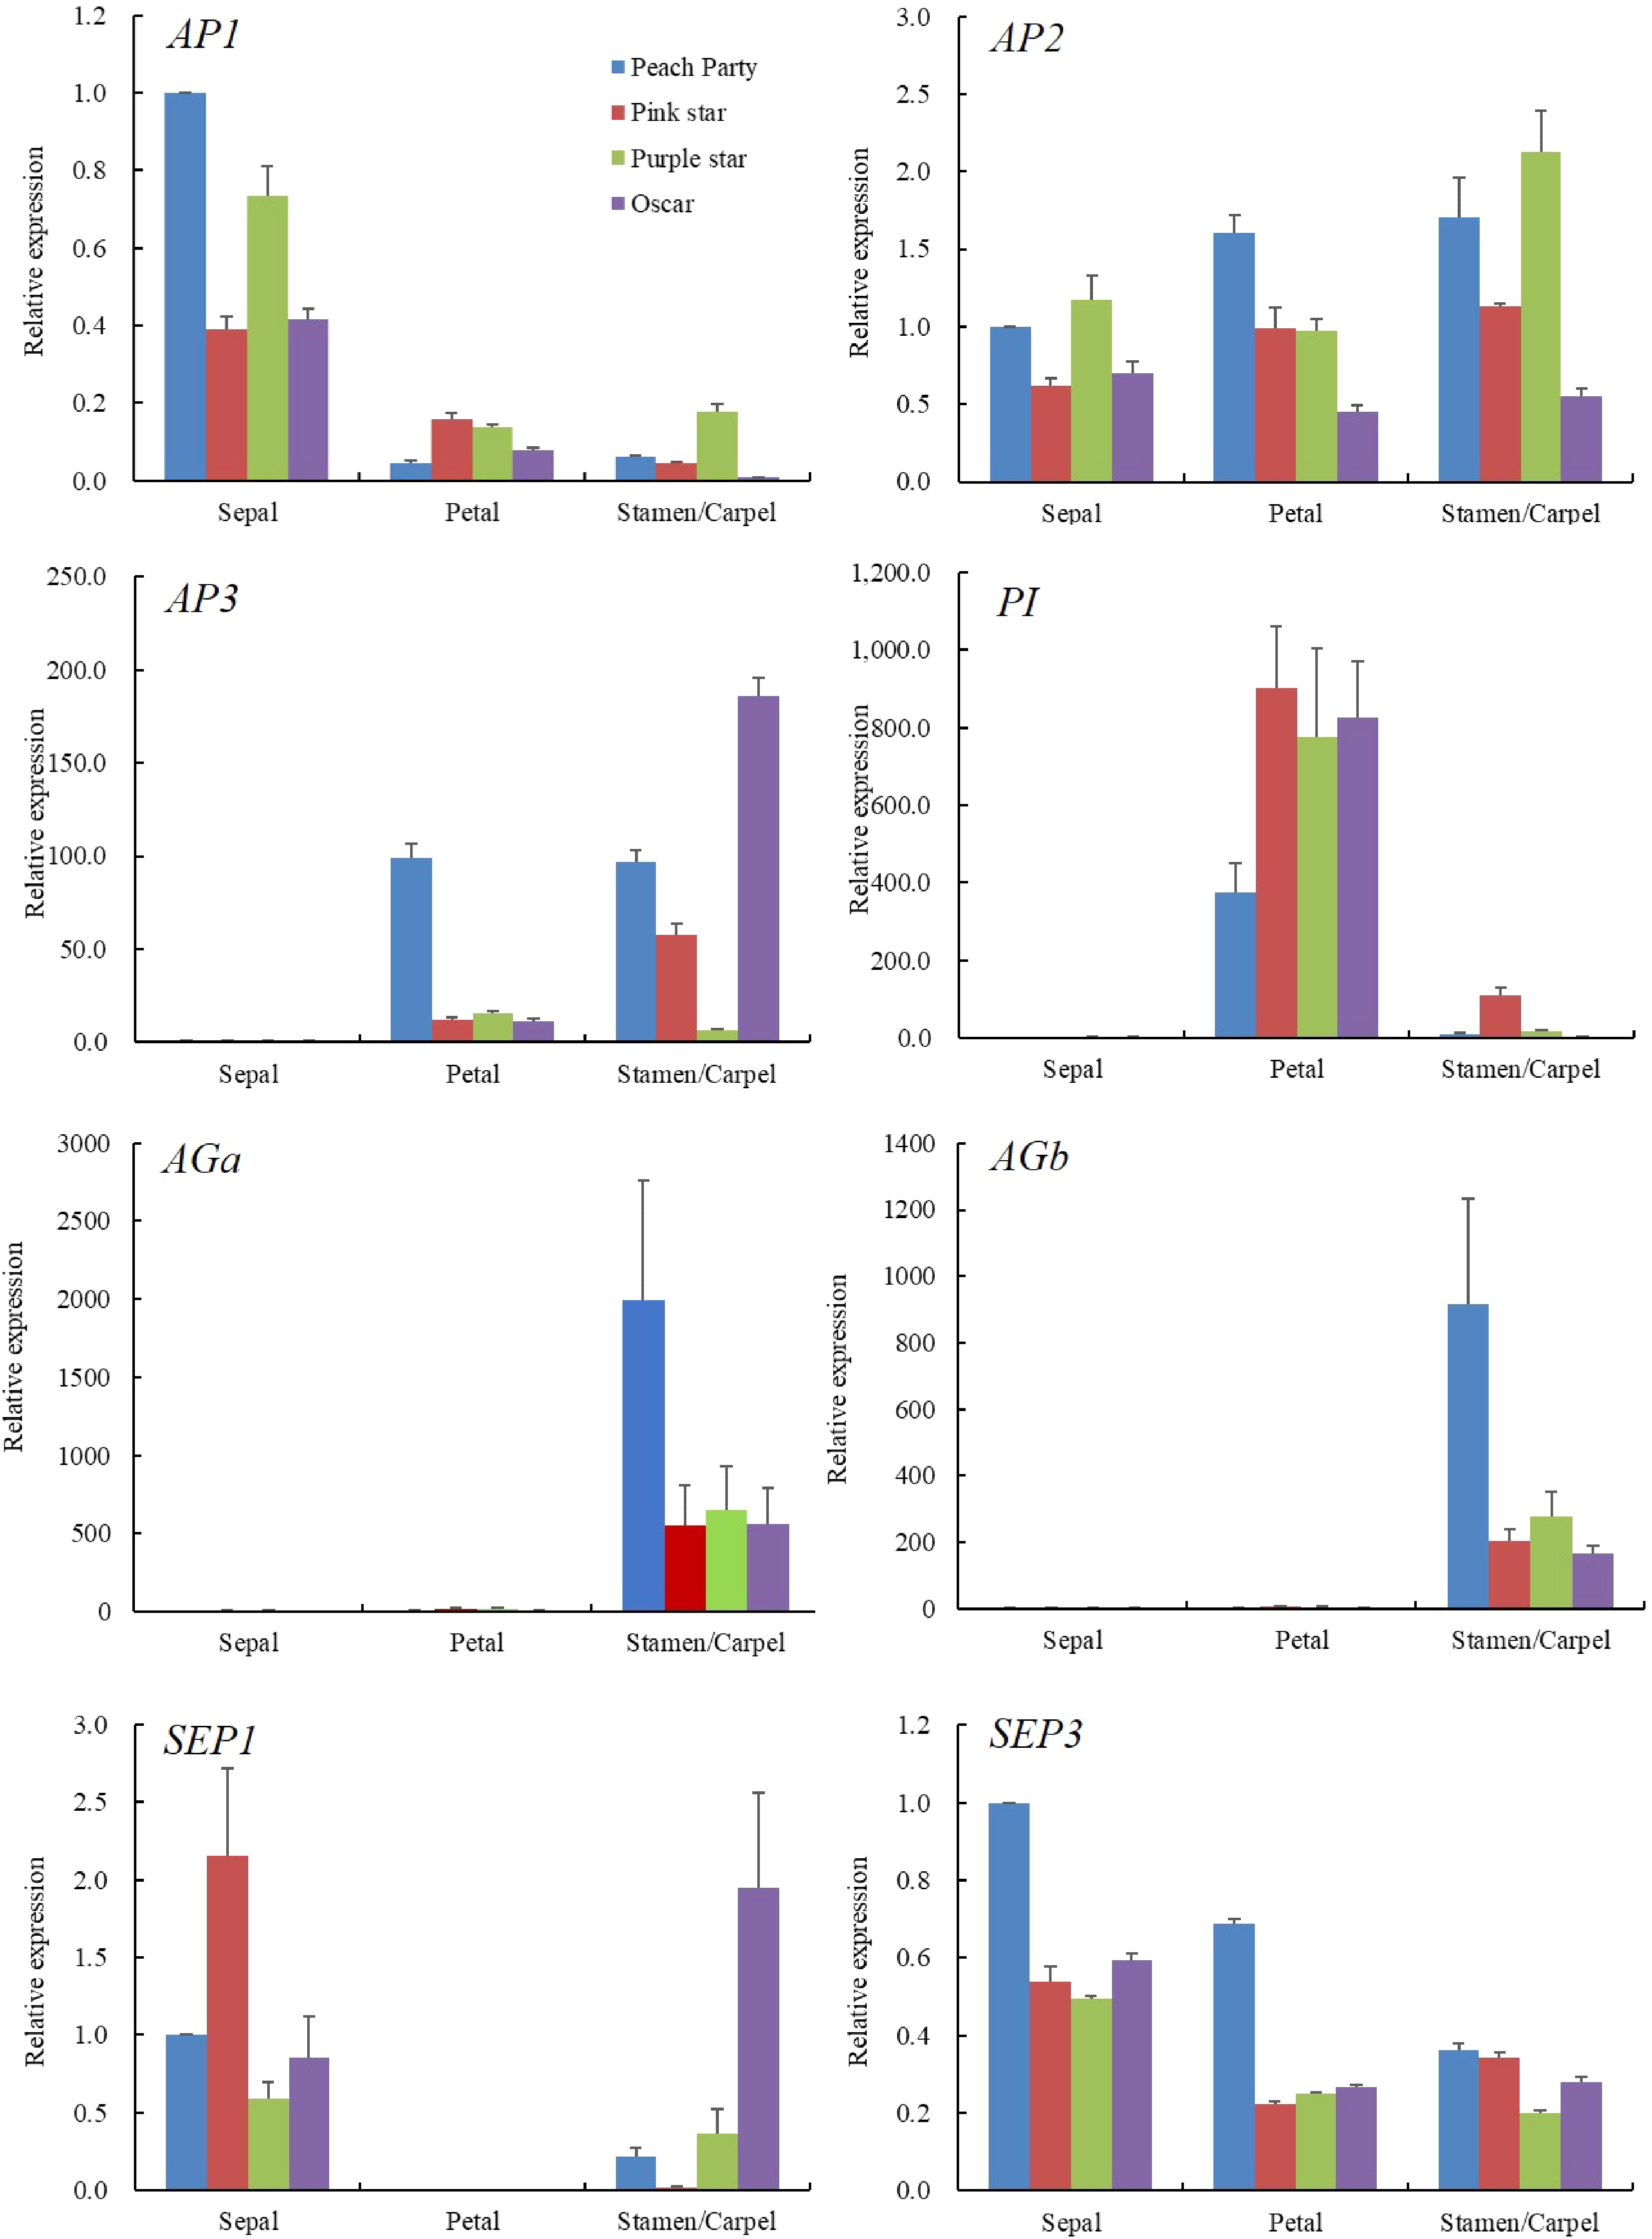
    • To investigate the relationship between the expression pattern of ABCE model genes and the SDF phenotype, we analyzed the expression levels of A-class (AP1 and AP2), B-class (AP3 and PI), C-class (AGa and AGb) and E-class (SP1 and SP3) genes in the sepal, petal and stamen/carpel of the four cultivars (Fig. 3). Firstly, we analysed the relative expression level of AGa, AGb and AP2, since the antagonistic expression between A- and C-class genes affects the homeotic conversion of petal and stamen. Our results show that AGa and AGb expressed significantly highly in the stamen/carpel and their expression levels in the stamen/carpel are reduced in the SDF cultivars compared with the SF cultivar. AP1 displayed a higher expression level in the sepal than that of other floral organs, while AP2 expressed consistently in all flower organs. Moreover, the expression level of AP1 was slightly reduced in the sepal but increased in the petal of the SDF cultivars. In contrast, AP2 expression is slightly increased in the petal of SDF cultivars. This is in line with the antagonism between class A genes and class C genes, indicating AG genes might play a major role in the formation of semi-double flower in carnations.

      Figure 3. 

      Expression analysis of ABCE model genes in different floral organs.

      B-class genes, AP3 and PI, displayed higher expression levels in the petal and stamen/carpel than that in the sepal. However, theses two genes show opposite expression patterns in the SF and SDF cultivars. The expression level of AP3 is reduced significantly in the petal of the SDF cultivars while the expression level of PI is increased in the same organs. Similarly expression patterns happen in the carpel/stamen of the different cultivars. As for the E-class gene, the expression pattern of SEP3 is relatively smooth in all floral organs between single and semi-double flower, while there was no expression of SEP1 detected in the petal. One may conclude from the expression patterns of these genes that they fit the ABCE model in the general trend, but there is specificity in the expression of certain genes in specific tissues, implying their specific functions in floral organ formation which requires further exploration.

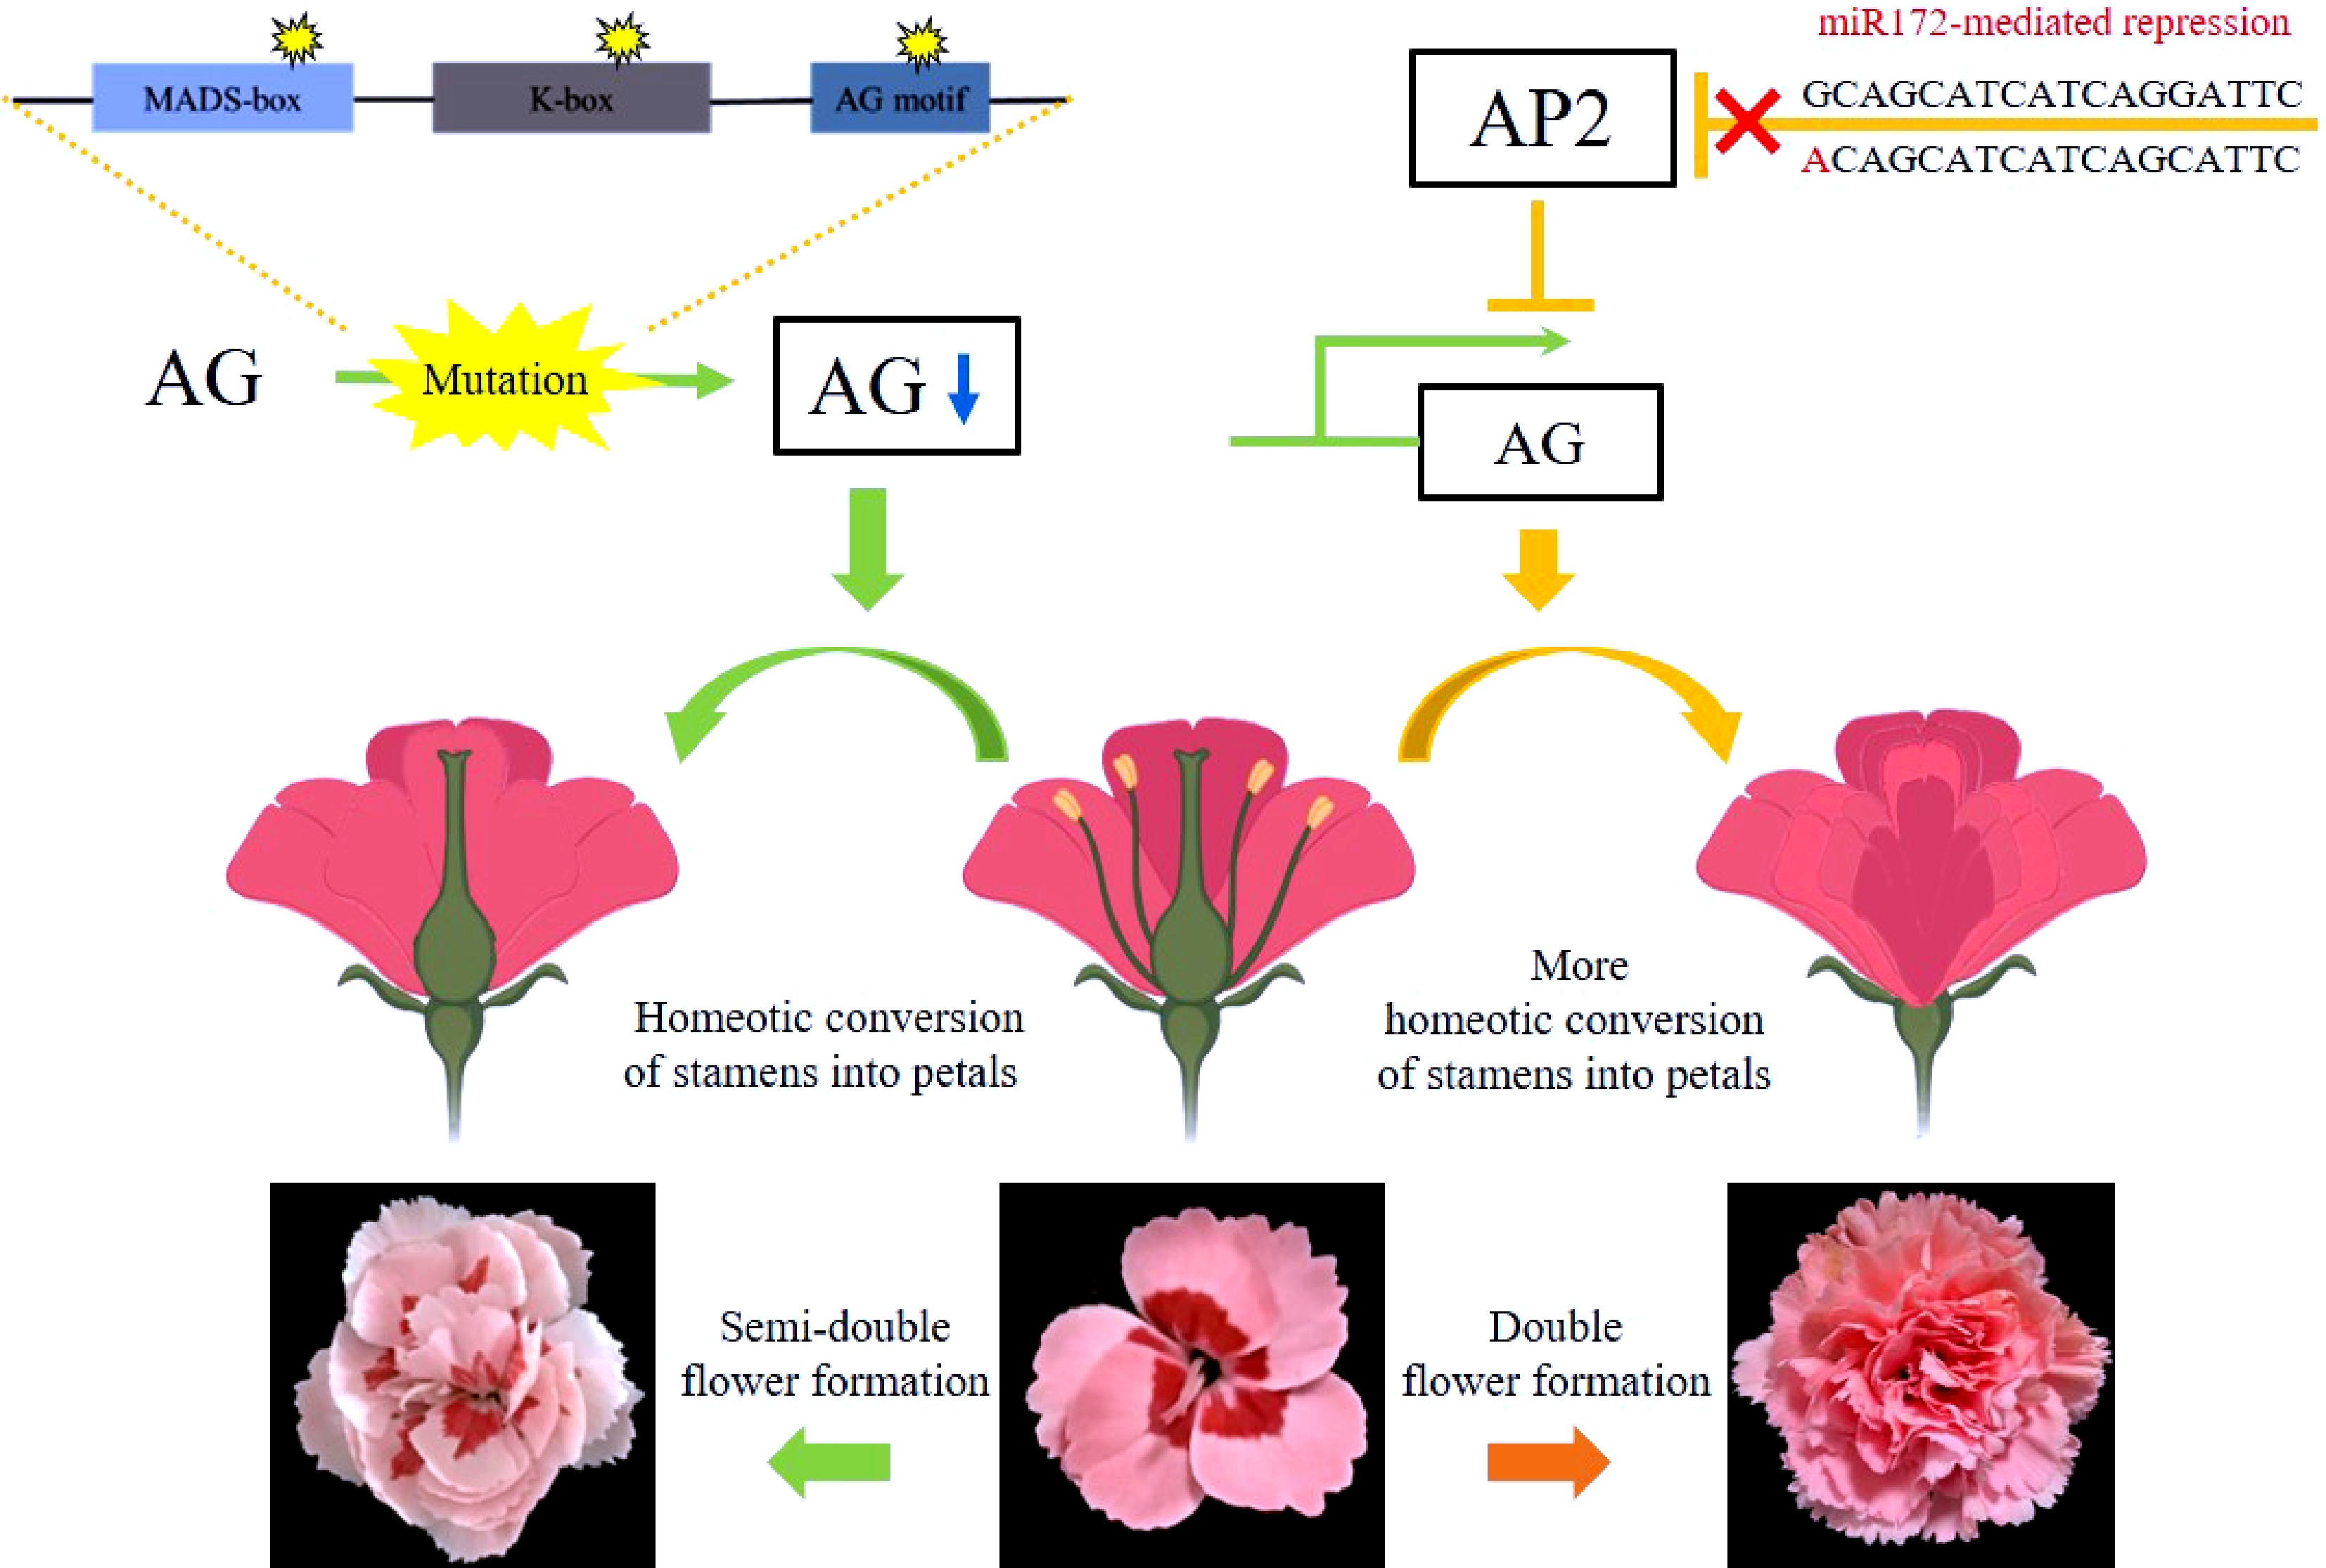
    • The genetic regulation networks governing the formation and subsequent development of each floral organ have been raised and supplemented in the past few decades, forming a well-known theory, namely the ABCDE model which suits most species[19]. AG, belonging to the C-class, is a key regulator of flower development. It specifies the fate of floral organs, whose mutation leads to the DF trait. Observation from scanning electronic microscopy shows that the Arabidopsis ag-1 mutant was defected in stamen development and displays extra petal formation[20]. Similarly, AG alleles with deletions in the exon were isolated from two Matthiola incana double flower cultivars. The deletions in the AG coding sequence also caused defects in its expression[21]. Studies in Magnolia stellate and Prunus lannesiana revealed that alternative transcriptional splicing of AG which lead to exon skipping also caused petal accumulation[12,22]. Here, we show that there are mutations in two DcAG orthologous, AGa and AGb of SDF carnation cultivars. A previous study on carnation DF trait demonstrated that there was no AG sequence polymorphism detected between SF and DF cultivars[23]. Based on our data, taken together with published data in carnations, we suggest the following model for the flower formation in carnation (Fig. 4), and predict that the DF phenotype is caused by the mutation of the micro172-binding site of AP2[15] whereas the mutation in AG is associated with the formation of the SDF trait.

      Figure 4. 

      The regulation network of flower formation in carnation.

      The expression of AG is spatially controlled and restricted in the third and fourth whorl. Ectopic expressing AG controlled with CLV3 promoters in the outer whorl lead to the formation of carpelloid sepals and reduced petal number in Arabidopsis[24]. Expressed AG in the second whorl with the promoter of AP3 resulted in stamen replacement of petals, even causing the failure of the second whorl development in Arabidopsis[25]. Our data shows that AGa and AGb express primarily in the third and fourth whorl of either SF or SDF carnation flowers but barely express in the first and second whorl. The expression levels of these two genes drop in SDF cultivars, constantly with the observation that the stamen number of them are reduced compared with SF cultivar.

      The double flower is more attractive, especially in ornamental plants. Nevertheless, with the expansion of aesthetic variance, people sometimes appreciate semi-double flowers more. Breeders never stops gaining novel double flowers while researchers continue to investigate the mechanism underlying double flower traits. Our results provide insights into the semi-double flower carnation cultivars, which would facilitate carnation breeding.

    • Four commercial carnation cultivars, 'Peach Party' (single flower, SF, pink), 'Pink Star' (semi-double flower, SDF, pink), 'Purple Star' (SDF, purple) and 'Oscar' (SDF, red), were used in this study (Fig. 1). The plants of four cultivars with different flower phenotypes were provided by JinPin Yunke (Yunnan) Seedling Co., Ltd. (Kunming, China).

    • Total RNA was extracted from 200 mg stamen/carpel mixture for each cultivar using EasyPure® Plant RNA Kit (TransGen, Beijing, China). cDNA was then synthesized using TransScript® One-Step gDNA Removal and cDNA Synthesis SuperMix (TransGen, Beijing, China). The 20 μl reaction system contained 1 μg total RNA, 1 μl Random Primer, 10 μl 2*TS Reaction Mix, 1 μl RT Enzyme Mix, 1 μl gDNA Remover, and variable RNase-free Water. At first, a sufficient volume of RNA and the Random Primer was added to RNase-free Water. The mixture was then cultured at 65 °C for 5 min with a subsequent 2-min ice-bath. Afterwards, the other components were added and mixed, and the mixture was incubated at 25 °C for 10 min, 42 °C for 30 min and 85 °C for 5 s. The final product was then stored at −20 °C for further experiments.

      Genomic DNA was prepared using the EDTA method. Leaf material (200 mg) was collected for each cultivar. After grinding, 800 μl DNA extraction buffer [per 100 ml including 35 ml ddH2O, 10 ml Tris-HCl (1 M, pH7.5), 10 ml NaCl (5 M), 10 ml EDTA (0.5 M) and 35 ml SDS (2%)] was added to the sample and the mixture was incubated at 65 °C for 30 min. It was then centrifuged at 12,000 rpm for 10 min and the supernatant was transferred to a new 1.5 ml tube and mixed with an equal volume of isopropanol. After mixing, the sample was centrifuged at 12,000 rpm for 10 min and the supernatant was then removed. The precipitate was washed with 70% ethanol twice and then dried. Finally, the DNA was dissolved in 50 μl ddH2O and stored at −20 °C.

    • The CDS or genomic DNA of the genes studied in this research was amplified by KOD one mix. The 10 μl reaction system contained 8.8 μl KOD one mix, 0.4 μl forward primer, 0.4 μl reverse primer and 0.4 μl template. Primers used in the experiments are listed in Table 2. The PCR mixture was then incubated at 98 °C for 3 min; followed by 35 cycles at 98 °C for 30 s, Tm (depending on the primers) for 30 s, 68 °C for 1 min; with an extension at 68 °C for 5 min. The PCR products were separated by 1% agarose gel and the expected bands were cut and purified by EasyPure® Quick Gel Extraction Kit. The purified PCR products were then constructed onto pEASY®-Blunt Simple Cloning Vector and transformed into Trans1-T1 competent cells. Positive clones selected by relative antibiotics were confirmed by PCR and sent for sequencing. The sequences were analyzed by CLC seqviewer and Snapgene.

      Table 2.  Primer sequence for gene cloning and expression analysis used in this study.

      GeneApplicationForward primerReverse primer
      AGacloningATGGAATTTTCAAGCCAAATAACTAGGCCAAACACCTCTTCAACTTGTTTGA
      AGbcloningATGGAGTTTTCAAGCCAAATTACAAACTCCTCTCCAACTTGTGTAA
      AP2cloningTGGTACGCCTGATGAAACGAATGCCCCCTAATGGTTTCCAC
      DcUbq3–7RT-qPCRGTTGTTGGTTTCAGGGCTGGTTTGCTACGGTAATTGAGAATTCACACCGAAATG
      AGaRT-qPCRATGCTAATCATAGCGTGAAGGGTTGGCTTCGGCAACAGA
      AGbRT-qPCRCCTCAAGCCAAAGGAAGCTAACCCATTTCTTCTCTTGCAG
      AP1RT-qPCRTAGGTCAAGATTTGGATACGCTATCTAATGTGTTTGAGGCCG
      AP2RT-qPCRCGCGTATGGGTCAATTTCTAATTAGTAACCGCATCCTTCC
      AP3RT-qPCRGTCTGCTCGCTCTCAGATTGTAAGTCGTGACACACGAT
      PIRT-qPCRCTTCGGTTGAAGAAATCCTAGAGGCTGAGATTTTCATGTTTTGC
      SEP1RT-qPCRGCAGCAAACATGGGAAGGGTCAATGGGCTGGAAAAGAG
      SEP3RT-qPCRTGATAGAAGCAAATCAAGCGACGTGAAAGAAGACATGGTCTCC
    • Total RNA was extracted from the three independent parts: sepal, petal and stamen/carpel for each cultivar using EasyPure® Plant RNA Kit (TransGen). Real-time PCR was performed using LightCycler® 480 II Real-time PCR Instrument (Roche, Swiss) with 10 μl PCR reaction mixture that included 1 μl cDNA, 5 μl 2×PerfectStartTM Green qPCR SuperMix, 0.2 μl forward primer, 0.2 μl reverse primer and 3.6 μl nuclease-free water. Reactions were incubated in a 384-well optical plate (Roche, Swiss) at 94 °C for 30 s, followed by 45 cycles at 94 °C for 5 s, 60 °C for 30 s. Each sample was run in triplicate for analysis. At the end of the PCR cycles, melting curve analysis was performed to validate the specific generation of the expected PCR product. The expression levels of mRNAs were normalized to DcUbq3–7 and were calculated using the 2−ΔΔCᴛ method[26]. The gene-specific primers for qPCR of the target genes are shown in Table 2.

      • This research was funded by the Major Science and Technology Project of Yunnan Provincial Department of Science and Technology (202102AE090052), High-level Talent Introduction Program of Yunnan Province -Industrial Talent Special Project (YNQR-CYRC-2020-004), and the Green Food Brand—Build a Special Project (Floriculture) supported by Science and Technology (530000210000000013742). The author would like to thank Hejun Li, the production manager of JinPin Yunke (Yunnan) Seedling Co., Ltd., for kindly providing the plant materials.

      • The authors declare that they have no conflict of interest.

      • # These authors contributed equally: Chunlian Jin, Huaiting Geng

      • Copyright: © 2022 by the author(s). Published by Maximum Academic Press, Fayetteville, GA. This article is an open access article distributed under Creative Commons Attribution License (CC BY 4.0), visit https://creativecommons.org/licenses/by/4.0/.
    Figure (4)  Table (2) References (26)
  • About this article
    Cite this article
    Jin C, Geng H, Qu S, Zhang D, Mo X, et al. 2022. AGAMOUS correlates with the semi-double flower trait in carnation. Ornamental Plant Research 2:11 doi: 10.48130/OPR-2022-0011
    Jin C, Geng H, Qu S, Zhang D, Mo X, et al. 2022. AGAMOUS correlates with the semi-double flower trait in carnation. Ornamental Plant Research 2:11 doi: 10.48130/OPR-2022-0011

Catalog

  • About this article

/

DownLoad:  Full-Size Img  PowerPoint
Return
Return