


-
Flowering is a critical developmental stage in higher plants, indicating the transition from the vegetative phase to the reproductive phase[1,2]. The timing of flowering significantly influences plant reproduction, crop yield, and overall plant fitness, making it essential to understand the molecular mechanisms for improving agricultural productivity[3]. Substantial progress has been made in comprehending the mechanisms governing flowering time, with six pathways, including the GA pathway, age pathway, autonomous pathway, photoperiod pathway, temperature pathway, and vernalization pathway, identified as regulators of the timing of floral transition[4]. To support systematic research on flowering-time-associated genes (FTAGs) in Arabidopsis thaliana, the Flowering Interactive Database (FLOR-ID:
www.phytosystems.ulg.ac.be/florid ) was established. Currently, the FLOR-ID database houses a comprehensive collection of 306 genes and provides links to 1646 articles, representing the collaborative work of more than 4600 scientists[5]. This freely accessible database offers valuable resources for the study of flowering timing.Presently, the identification of flowering-time genes primarily relies on wet-lab experiments, which are not only costly but also time-consuming and labor-intensive. The use of high-throughput omics technologies to detect flowering-time-associated genes demands significant human and financial resources. To address these challenges, computational and mathematical methods have emerged as promising alternatives. BLAST[6], a widely used bioinformatics tool, allows for the detection of FTAGs through sequence similarity searches. The existing homology sequence search tool BLAST+ only considers the sequence composition and order features, and does not take into account a comprehensive range of information, leading to low recognition rates. The application of artificial intelligence has made significant strides in recent times, particularly in fields like textual analysis, self-learning, and image recognition[7]. Machine learning (ML), a vital component of artificial intelligence, finds extensive use across various academic disciplines, including data analytics and gene discovery[8]. Researchers have developed multi-trait and multi-environment genome prediction methods for flowering traits[9−11]. Meher et al.[12] developed an ML model for identifying plant circadian genes, while our team recently proposed a method for recognizing leaf senescence-associated genes using ML techniques[13]. Notably, no machine learning method based on FTAGs' protein sequence data is currently available. This motivated our team to undertake the training of an ML model for the identification of proteins encoded by flowering-time-associated genes.
In this study, we have employed the support vector machine (SVM), one of the most commonly used ML methods, to discriminate between FTAGs and non-FTAGs using the protein sequence dataset. Notably, the SVM-Kmer-PC-PseAAC model demonstrated outstanding performance, boasting an F1 score of 0.934, an accuracy rate of 0.939, and a receiver operating characteristic score of 0.943. Building upon this ML model, we have developed a Python software tool named 'FTAGs_Find', which is made available to the research community. This tool allows for proteome-wide identification of flowering-time-associated genes. Furthermore, we conducted large-scale identification of FTAGs across 83 different species using the 'FTAGs_Find' software, shedding light on their evolutionary mechanisms. To facilitate access to the FTAGs dataset and the utilization of the 'FTAGs_Find' software for the scientific community, we have established the Plant Flowering-Time-Associated Genes Database (
www.sagsanno.top:8080/FTGD ). We are confident that the FTGD database will prove to be a valuable and user-friendly resource for all researchers. -
The protein sequences encoded by experimentally validated flowering-time-associated genes were downloaded from the Flowering Interactive Database (FLOR-ID:
www.phytosystems.ulg.ac.be/florid ). This meticulously curated database integrates a comprehensive collection of 306 genes and is linked to 1646 articles, representing the collaborative efforts of more than 4600 scientists[5]. The FLOR-ID database provides valuable resources for the study of flowering timing in Arabidopsis thaliana. A total of 628 protein sequences retrieved from the FLOR-ID database[5] were used to construct the positive dataset. These sequences were further compared with the Pfam database (http://pfam.xfam.org/ )[14] using HMMER software[15]. Additionally, 10,097 reviewed protein sequences of Arabidopsis thaliana, collected from the TAIR database (www.arabidopsis.org )[16], were employed in constructing the negative dataset.Data pre-processing
-
The collected protein sequences containing residues B, J, O, U, X, and Z were excluded using Python scripts to prevent ambiguity in generating numeric features. Additionally, protein sequences with fewer than 50 amino acids were excluded. The CD-HIT program, available in the CD-HIT database[17], was employed to eliminate protein sequences that exhibited more than 70% similarity to any other sequences. After the removal of such protein sequences, we retained 628 positive and 8,163 negative protein sequences for building the classification model.
Feature selection
-
In this study, for each protein sequence, we generated three types of features: auto-cross covariance (ACC), Kmer, and parallel correlation pseudo amino acid composition (PC-PseAAC). These features were extracted using the Pse-in-one 2.0 program[18]. The ACC features, a popular choice for protein sequence analysis, were generated using the acc.py script with a lag parameter set to 3. Kmer, on the other hand, is a straightforward method for representing proteins, involving the creation of a 400-dimensional numeric vector based on amino acid frequencies (k-mer = 2). Furthermore, the PC-PseAAC features consist of a 22-dimensional numeric vector and were extracted using the pse.py script with specific parameters set to w = 0.05 and lambda = 2.
Dataset and model building
-
In the available dataset, the size of the positive dataset was smaller than the negative set. To address the issue of imbalance, different weights were assigned to the positive and negative sets. The SVM classifier, a widely used machine learning algorithm, was utilized to construct the classification model. The classification model encompasses several parameters, and in this study, we tuned three hyperparameters, namely the kernel, gamma, and cost.
Cross validation approach
-
In this study, we utilized a 5-fold cross-validation approach to evaluate the performance of the SVM classification model. Specifically, the available positive and negative datasets were randomly divided into five equal-sized subsets. During each fold of the cross-validation, four of these subsets were employed for building the SVM model, while the remaining one served as the test set. This classification process was repeated five times, each time using different training and test datasets within the fold.
Performance metrics
-
In the present study, we assessed the performance of the classification model by using several different indices, namely Accuracy, F1-Score, and AUC. The definitions of accuracy and F1-Score are as follows:
$\rm Precision = \frac{{{\text{TP}}}}{{{\text{TP + FP}}}} $ $\rm Sensitivity = \frac{{{\text{TP}}}}{{{\text{TP + FN}}}} $ $\rm F1{\text -}Score = \frac{{{{Precision \times Sensitivity}}}}{{{\text{Precision }} + {\text{ Sensitivity}}}} $ $\rm Accuracy = \frac{{{\text{TP + TN}}}}{{{\text{TP + TN + FP + FN}}}} $ Here, FP, FN, TP, and TN represent false positive, false negative, true positive, and true negative, respectively. The pROC v1.16.2 package was employed to calculate AUC scores and generate the ROC curves.
Large-scale predict flowering-time-associated genes
-
We collected 83 released protein sequence datasets (Supplemental Table S1) from public databases[19−34]. To ensure data cleanliness, we used Python scripts to eliminate records containing residues B, J, O, U, X, and Z. After the removal of such sequences, we generated Kmer and PC-PseAAC features using nac.py and pse.py scripts[18]. Subsequently, we conducted large-scale predictions of plant flowering-time-associated genes using our presented SVM classification model. Gathered genes related to flowering time in Brassica rapa from the PubMed database for the past three years and used these genes to test a classification model.
Website construction
-
The Plant Flowering-Time-Associated Genes Database (
www.sagsanno.top:8080/FTGD ) has been established on the Aliyun cloud server, one of the world's most stable cloud service providers. The server operates on the Linux (CentOS 7.6) operating system and utilizes Apache Tomcat as its web server. All data is stored in the MySQL database, enabling efficient management, search, and display. The user-friendly website was developed using Java, Python, HTML5, and JavaServer Pages scripts (Fig. 1). The FTGD database can be accessed through different web browsers, including Internet Explorer, Google Chrome, Mozilla Firefox, and Safari.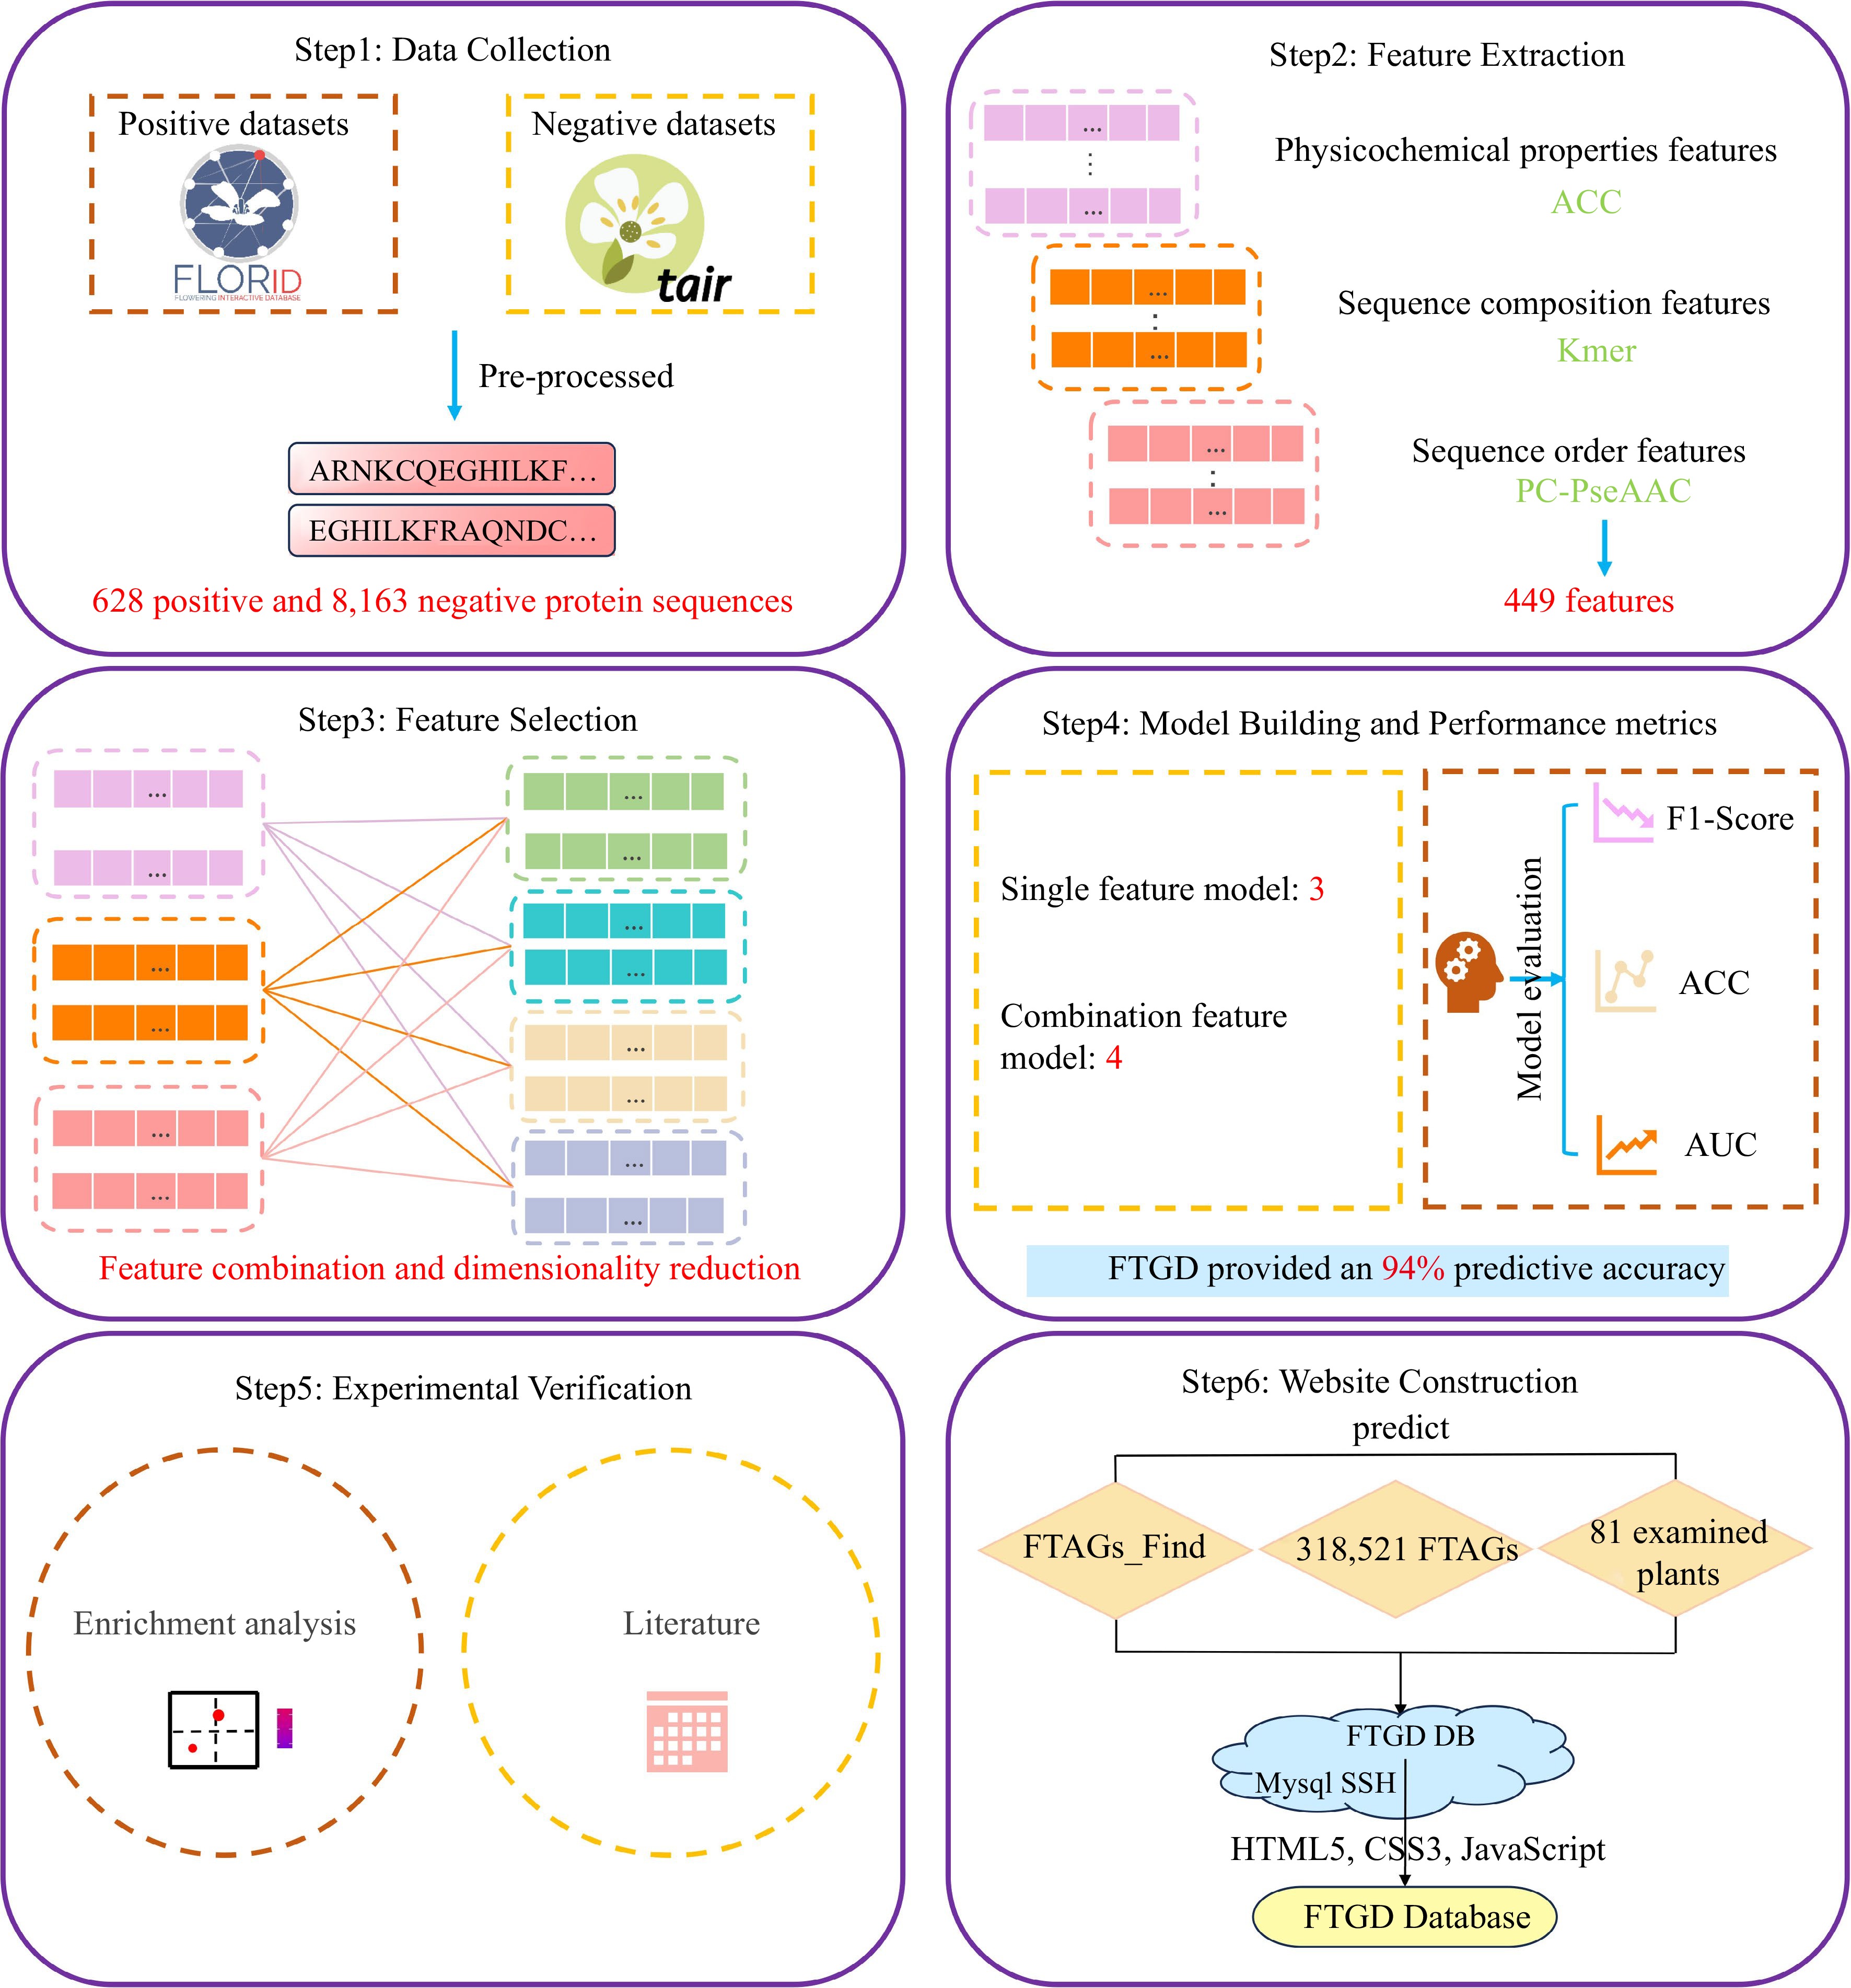
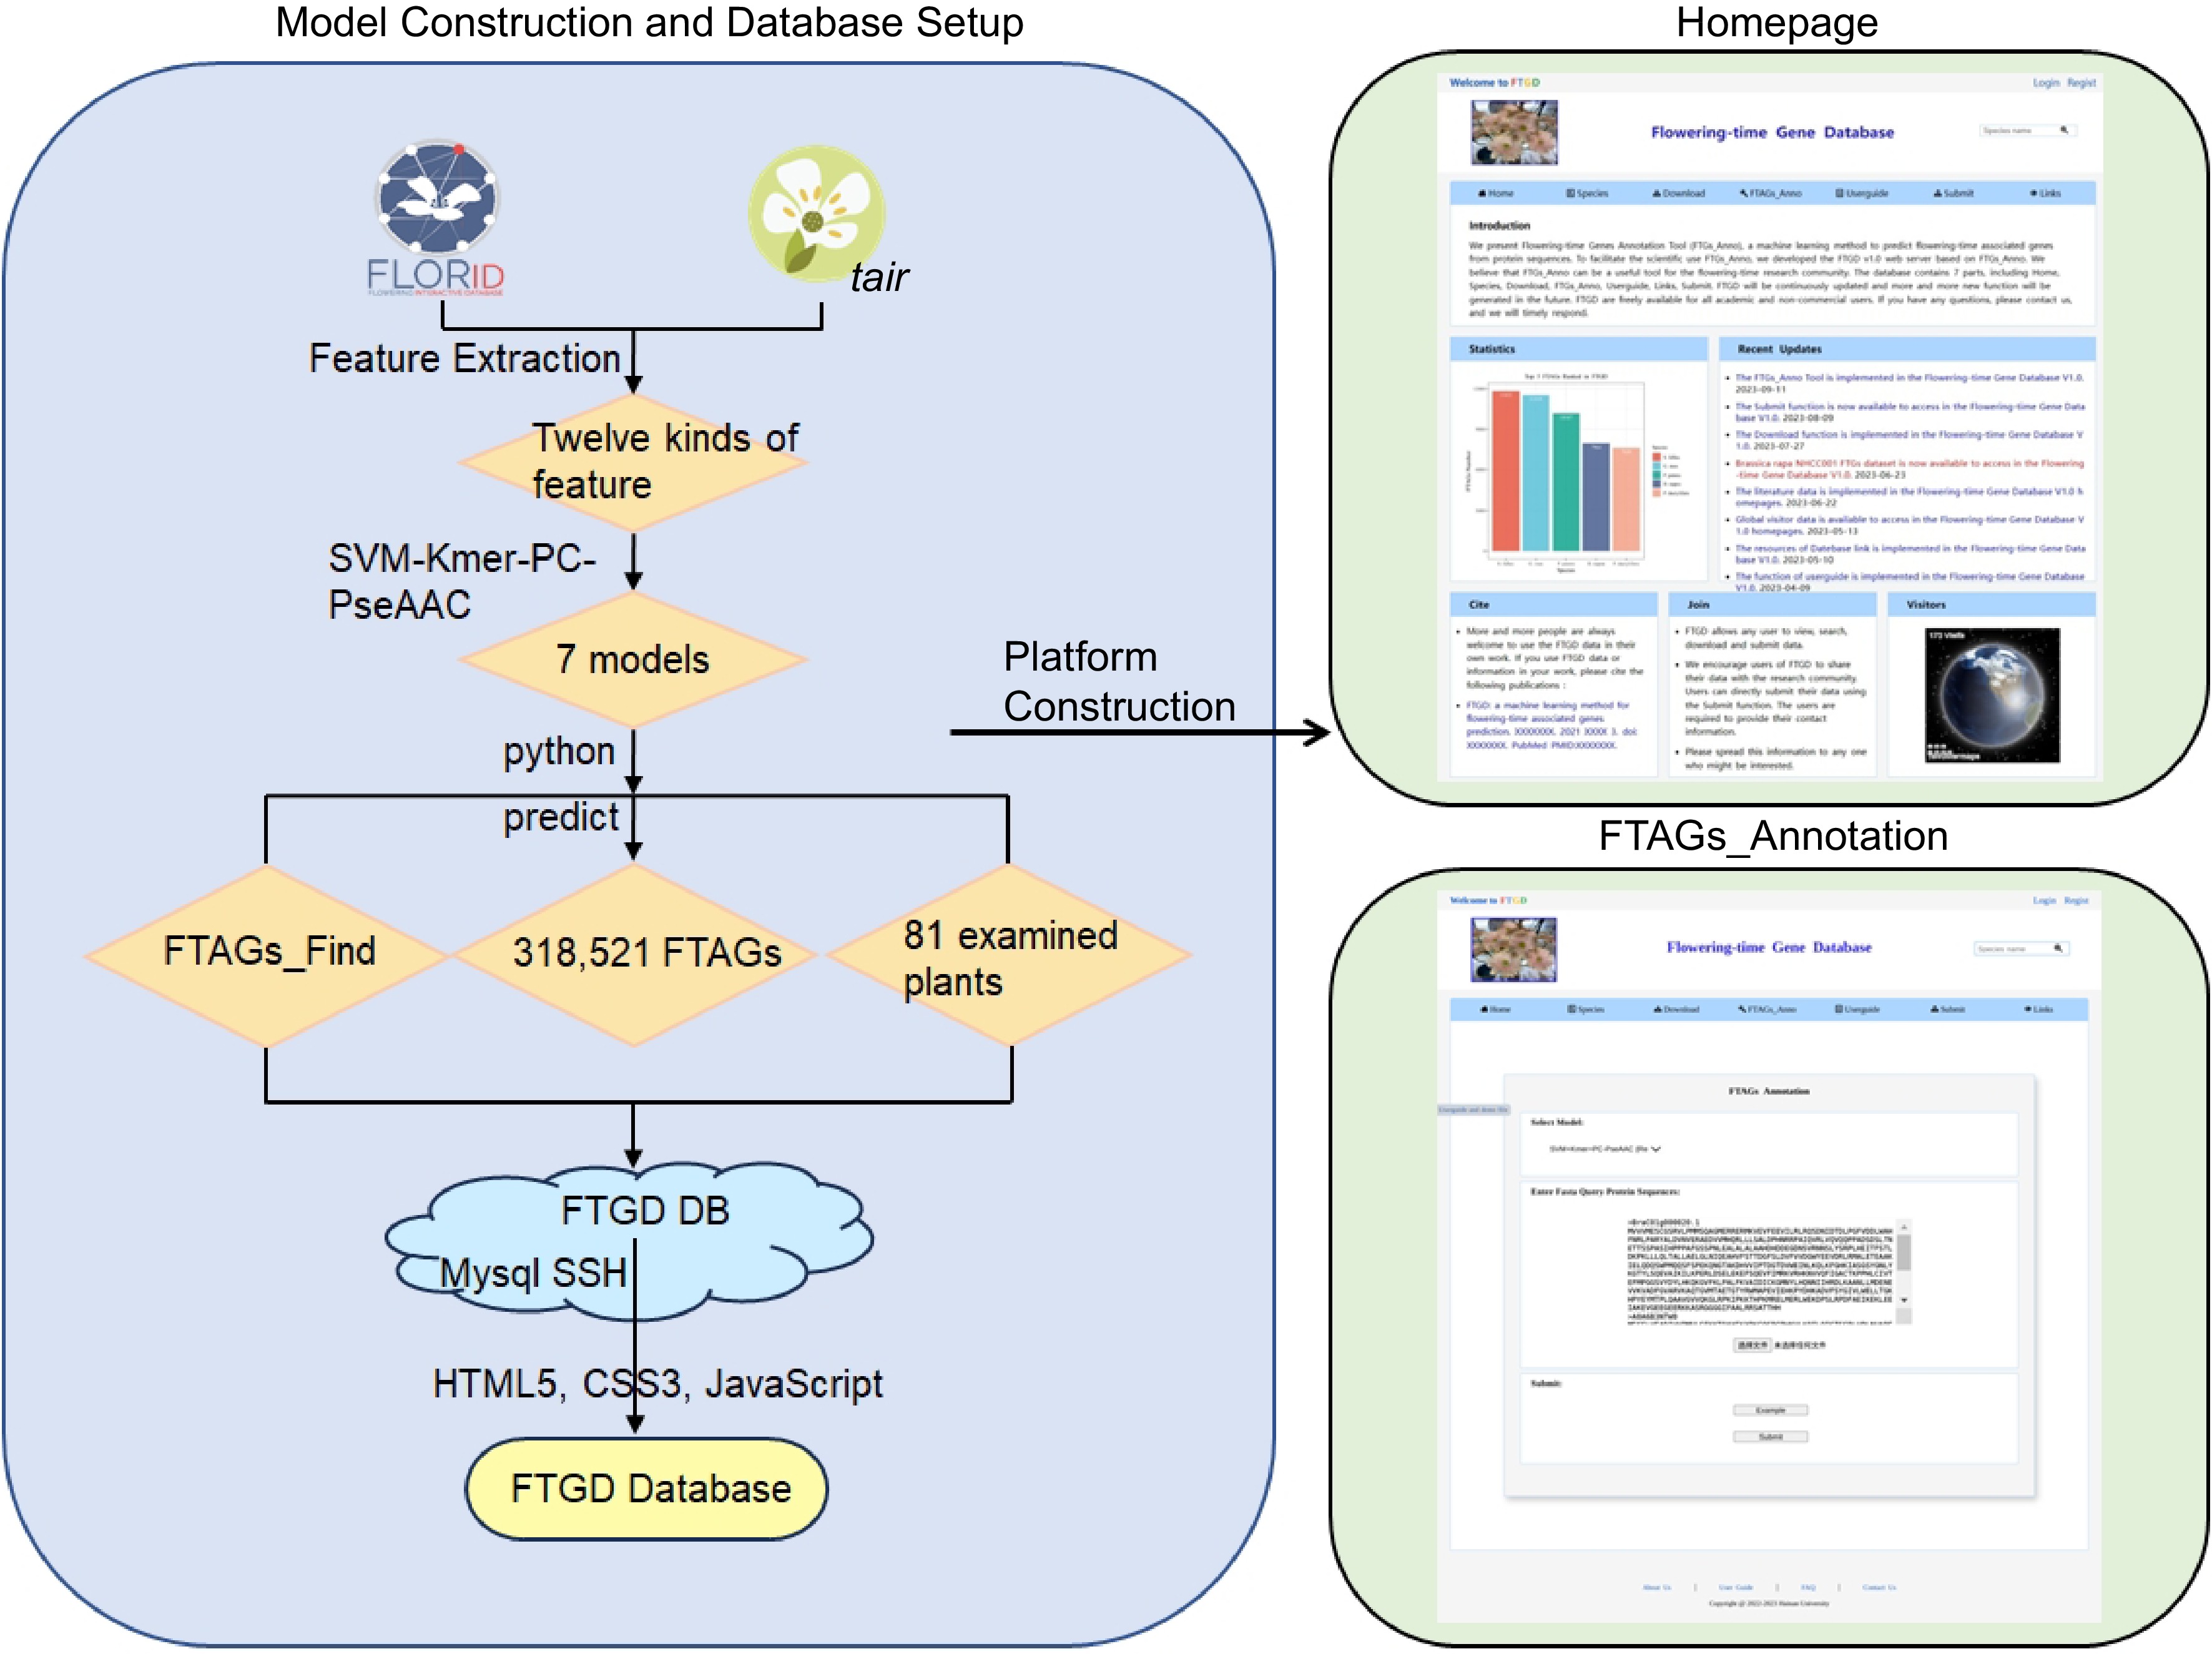
Figure 1.
FTGD platform build flowchart. To develop FTGD, we first collected plant flowering gene datasets from two databases. Second, we extracted features, including physicochemical properties, sequence composition, and sequence order features. Third, we performed feature selection through a combination of features and dimensionality reduction. Fourth, we built seven machine learning models, consisting of three single-feature models and four combination feature models. Fifth, we conducted experimental validation through enrichment analysis and literature review. Finally, we established the FTGD database and provided online prediction capabilities.
-
After data preprocessing, we retained 628 positive and 8,163 negative protein sequences for building the SVM classification model. The dataset was divided into two parts: 80% of the flowering-time dataset was used to construct the SVM prediction model, while the remaining 20% formed the test set for evaluating the prediction model. In this process, we employed seven types of features to train the SVM prediction model, which included ACC, Kmer, PC-PseAAC, Kmer-ACC, ACC-PC-PseAAC, Kmer-PC-PseAAC, and ACC-Kmer-PC-PseAAC. The ML prediction model encompasses numerous parameters, and we conducted optimization on three key hyperparameters through a grid search, including kernel, gamma, and cost. The performance of the seven SVM classification models is presented in Table 1 and Supplemental Table S2. The SVM-Kmer-PC-PseAAC model achieved the best performance (F1 score = 0.934, accuracy = 0.939, and receiver operating characteristic = 0.943), followed by the SVM-Kmer-AAC model (F1 score = 0.919, accuracy = 0.926, and AUC = 0.898).
Table 1. The prediction performance of SVM model.
Methods Number of
featureF1-score ACC AUC SVM-ACC 27 0.769 0.811 0.849 SVM-Kmer 400 0.872 0.890 0.929 SVM-PC-PseAAC 22 0.766 0.810 0.915 SVM-Kmer-ACC 427 0.919 0.926 0.898 SVM-Kmer-PC-PseAAC 422 0.934 0.939 0.943 SVM-ACC-PC-PseAAC 49 0.792 0.829 0.896 SVM-ACC-Kmer-PC-PseAAC 449 0.887 0.901 0.909 Local Python tool implementation
-
Using SVM algorithms, we built seven machine learning models to predict FTAGs (Table 1). The SVM-Kmer-PC-PseAAC model achieved the best performance (F1 score = 0.934, ACC = 0.939, and AUC = 0.943). Based on the proposed SVM-Kmer-PC-PseAAC classification model, we developed a local Python tool for proteome-wide identification of proteins encoded by flowering-time-associated genes, which is freely available at FTGD (
www.sagsanno.top:8080/FTGD ).Proteome-wide predict flowering-time-associated genes
-
In this study, a total of 318,521 FTAGs were identified from 2,873,697 protein sequences of 81 species, including 69 higher plants and 12 lower plants (Supplemental Table S1). The average FTAGs percentage was 10.98%, and only two species (2.47%) had FTAGs with a percentage less than 5%, including Micromonas pusilla CCMP1545 and Ostreococcus lucimarinus, which belong to the lower plant category. In O. lucimarinus, only 208 FTAGs were detected among the 7,769 genes in the whole genome, constituting just 2.68% of all the genes. Interestingly, O. lucimarinus belongs to non-flowering plants. For non-flowering plants, FTAGs may not be as crucial, and extensive loss appears to have occurred. The average number of FTAGs was 3,932.36, and only eight species (9.88%) had FTAGs numbering less than 1,500. Notably, all eight species with the lowest number of FTAGs were lower plants, including Coccomyxa subellipsoidea, Chlorella variabilis, Micromonas pusilla RCC299, Chondrus crispus, Cyanidioschyzon merolae, Galdieria sulphuraria, Micromonas pusilla CCMP1545, and Ostreococcus lucimarinus. Conversely, Sphagnum fallax had the most FTAGs, with a total of 11,823 FTAGs identified from the 45,611 genes in the whole genome, accounting for 25.92% of all the genes. This result suggests that FTAGs might have undergone significant expansion in Sphagnum fallax.
GO enrichment analysis of flowering-time-associated genes in Brassica rapa
-
Brassica rapa belongs to the group of flowering plants, and we detected 4,480 FTAGs from its entire genome. The GO enrichment analysis revealed that the top 15 most enriched GO terms include 'protein dimerization activity', 'chromatin binding', 'plant ovule development', 'negative regulation of flower development', 'positive regulation of flower development', 'determination of bilateral symmetry', 'Cul4-RING E3 ubiquitin ligase complex', 'DNA methylation', 'specification of floral organ identity', 'trichome morphogenesis', 'DNA methylation-dependent heterochromatin assembly', 'flower morphogenesis', 'cell adhesion', 'photoperiodism, flowering', and 'gravitropism'. (Fig. 2). In B. rapa, FTAGs play a role not only in the regulation of flowering time but also in a wide range of flower development processes. This analysis revealed that processes such as 'negative regulation of flower development', 'positive regulation of flower development', 'specification of floral organ identity', 'flower morphogenesis' and 'photoperiodism, flowering' are linked to flowering time. The enrichment analysis further underscores the reliability of our prediction tool.
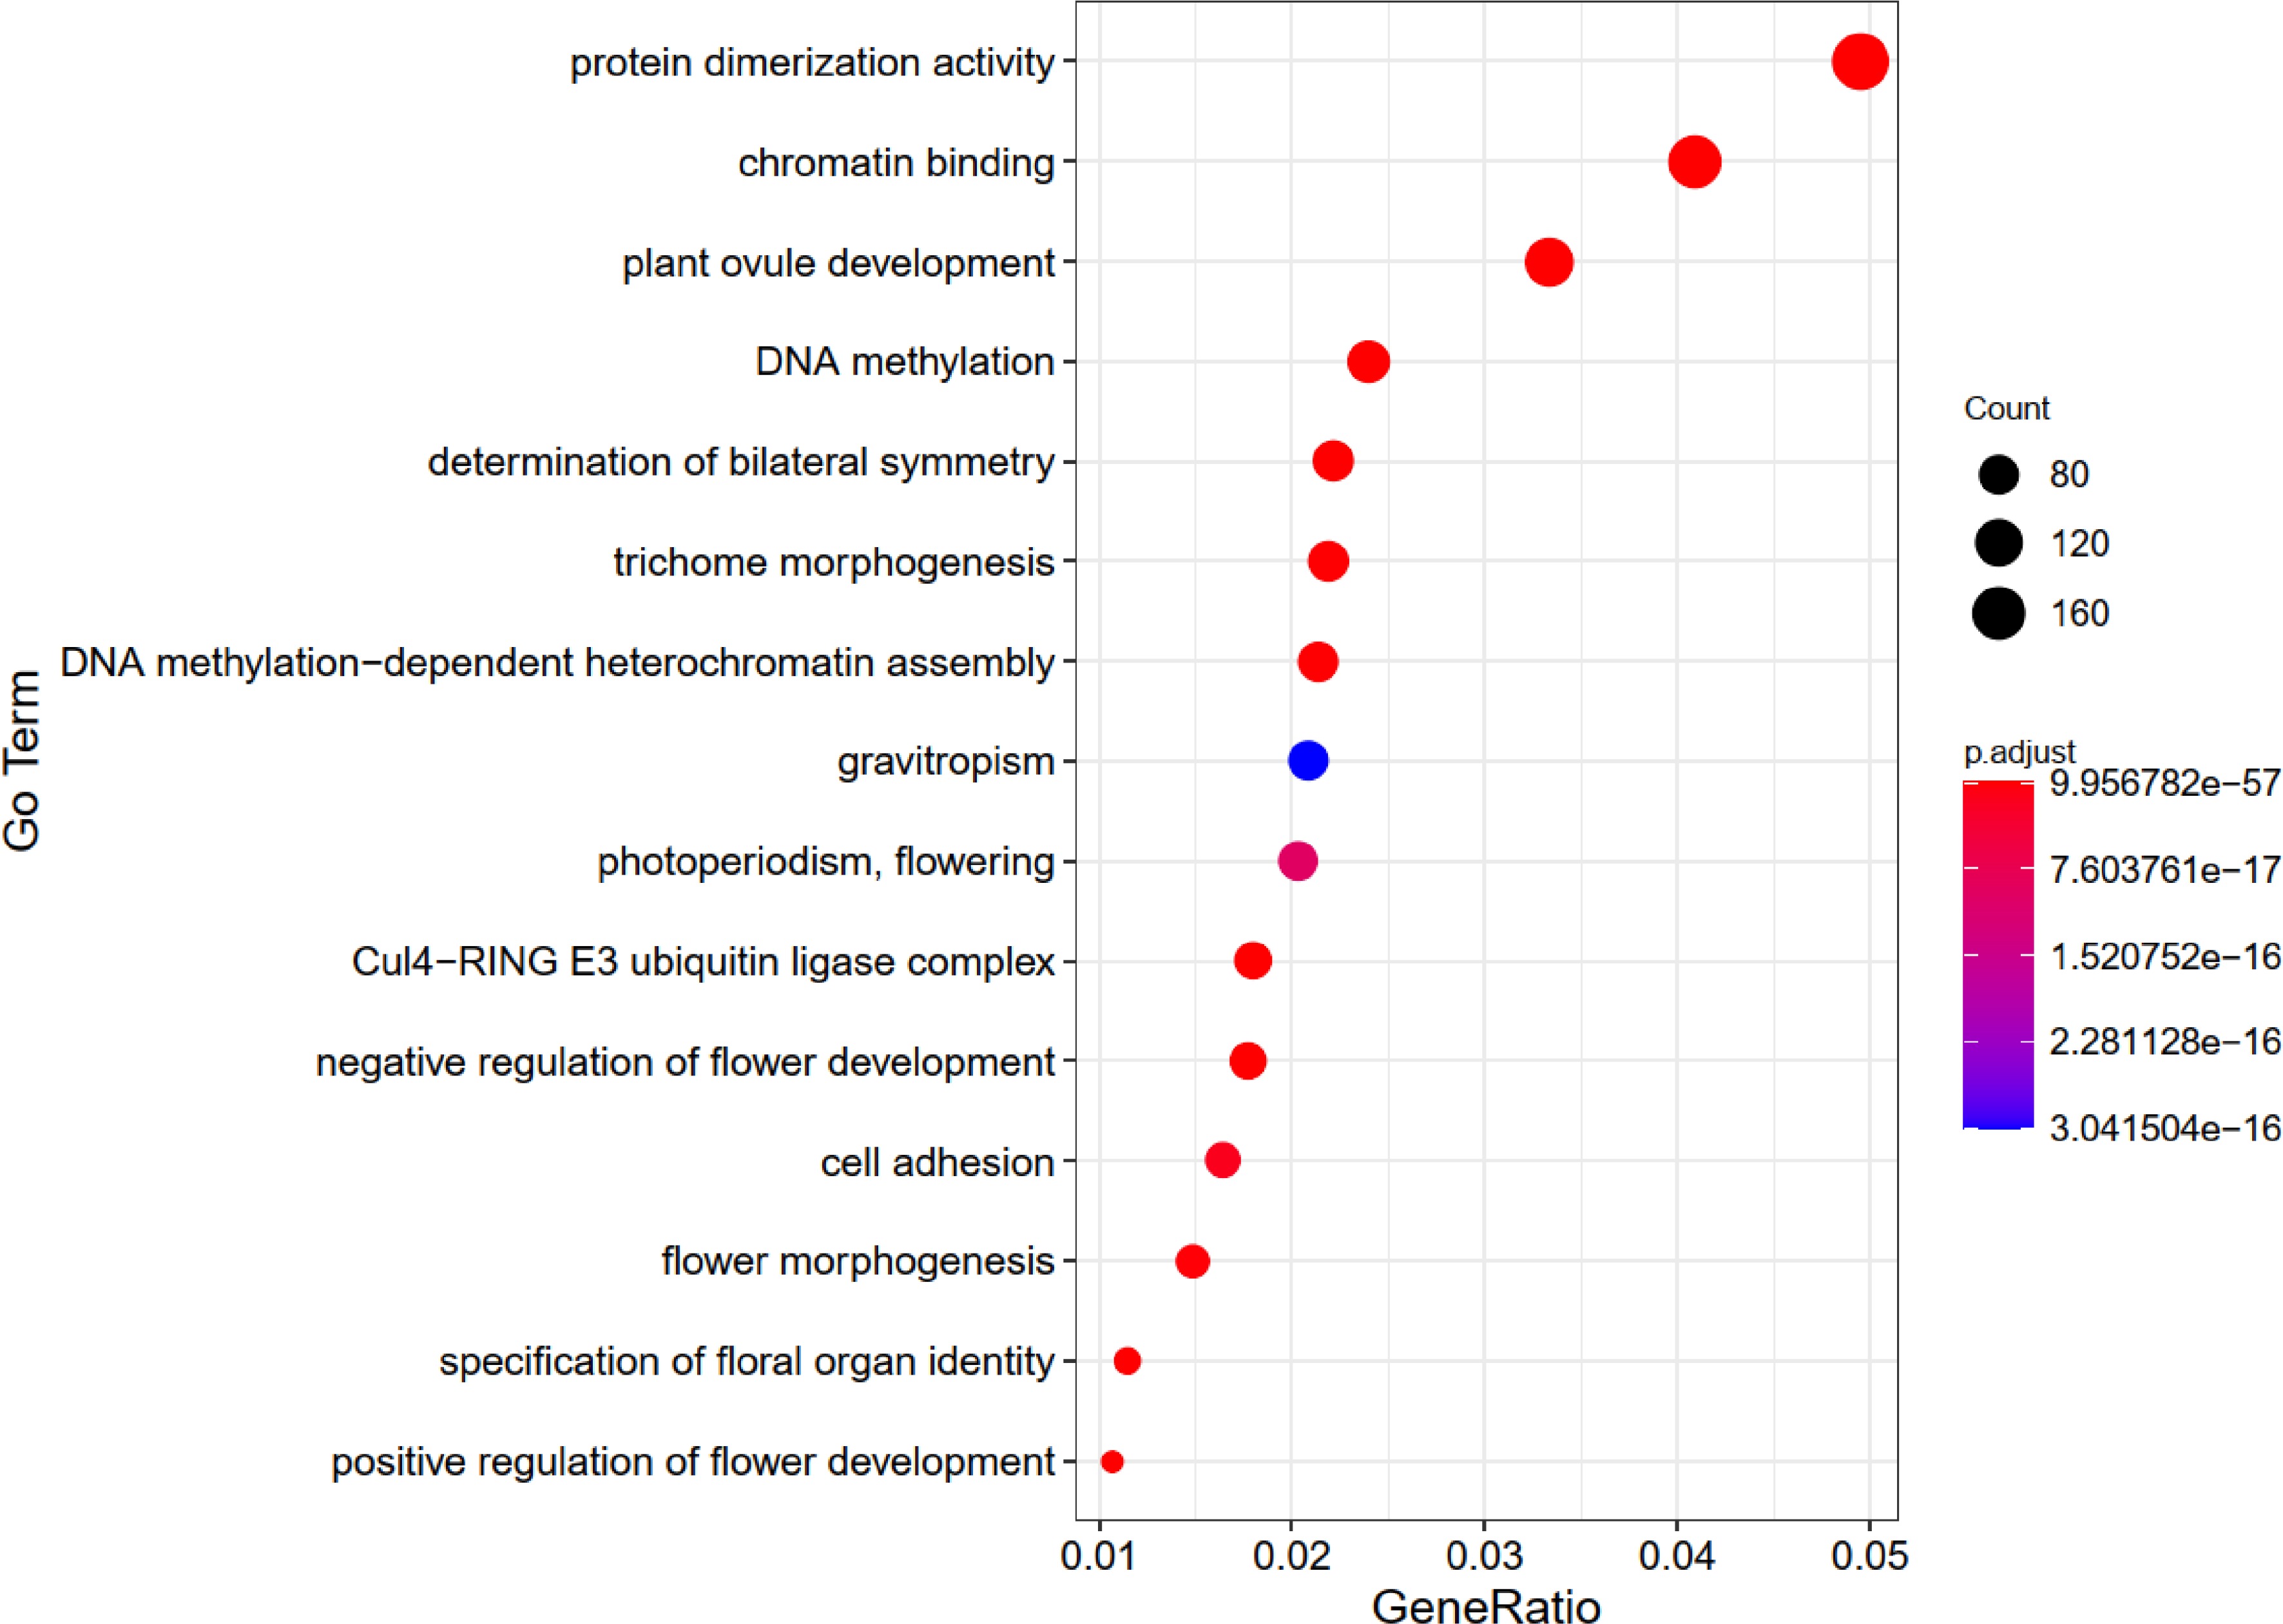
Figure 2.
The top 15 GO enrichment charts for genes related to flowering-time in Brassica rapa.
To validate the predictive capabilities of our algorithm on other species, we retrieved 18 genes related to flowering-time in B. rapa from the PubMed database. These genes include BraA.REF6 (BraA06g018530.3C)[35], BraA.ELF6 (BraA10g032100.3C)[35], qFT7.1 (BraA07g018240.3C)[36], BrSOC1-1 (Bra004928)[37], BrSOC1-2 (Bra000393)[37], BrSOC1-3 (Bra039324)[37], BrABF3 (Bra011485)[38], BrMYC2 (BraA05g023030.3C)[39], BrMYC3-1 (BraA09g022310.3C)[39], BrMYC3-2 (BraA06g041690.3C)[39], BrMYC4-2 (BraA01g009470.3C)[39], BraRGL1 (BraA02g017510.3.5C)[40], BrFT1 (Bra022475)[41], BrFT2 (Bra004117)[41], BrcuHAC1 (ANJ60744.1)[42], BrFT (BraC07g031540)[43], BrNIR1 (Bra015227)[37], BrNIA1 (Bra015656)[37]. Except for the genes BrNIR1 (Bra015227) and BrNIA1 (Bra015656), which cannot be correctly identified, our constructed prediction method accurately identifies the remaining genes with an 88% recognition rate. This outcome demonstrates that the prediction tool developed in this study can indeed accurately identify other species flowering time-related genes. This validation further strengthens the reliability and robustness of our prediction model.
Plant Flowering-time Gene Database construction
-
A clear and fully displayed homepage for the Flowering-time Gene Database (FTGD:
www.sagsanno.top:8080/FTGD ) has been created. Currently, the FTGD homepage comprises four main sections: navigation bars, statistics, recent updates, and other modules (Fig. 3). The navigation bar includes seven primary modules: Home, Species, Download, FTAGs_Find, Help, Submit, and Links. Below the navigation bar, you can find statistics related to plant FTAGs, recent updates, citations, and visitor tracking.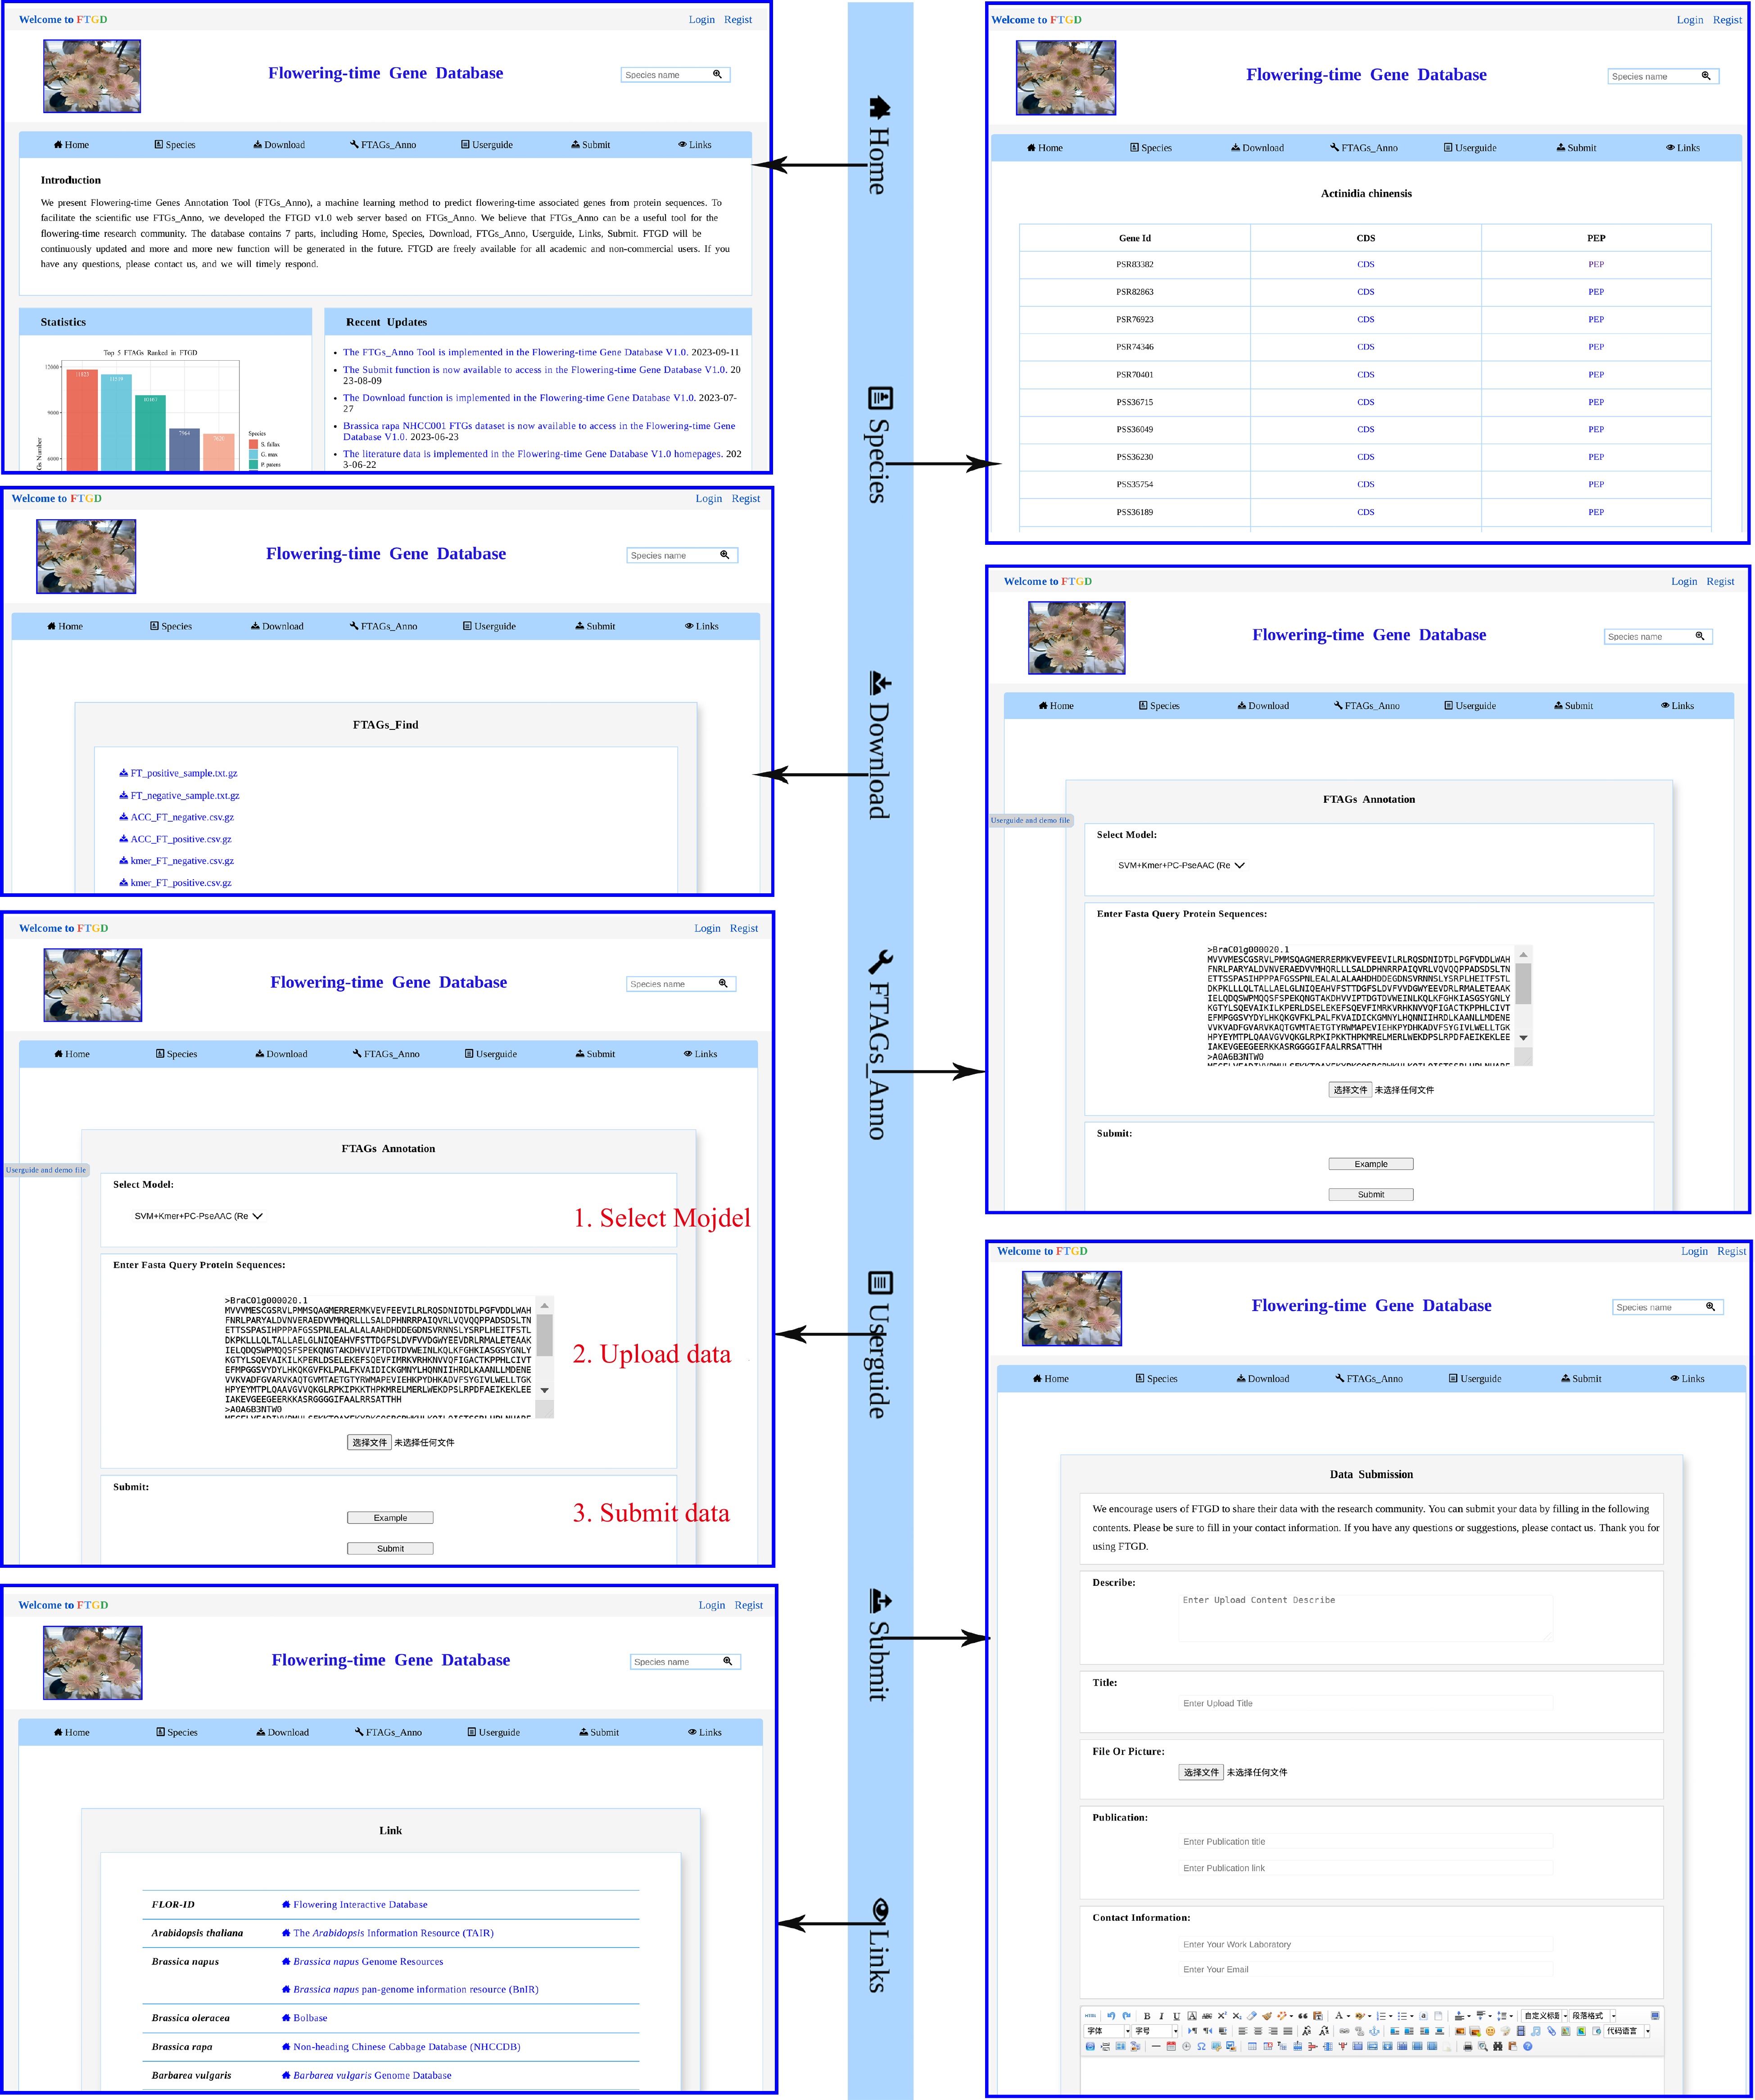
Figure 3.
FTGD website. An overview of the FTGD database, highlighting its key interfaces and internal features, which encompass Home, Species, Download, FTAGs_Anno, Userguide, Submit, and Links interfaces.
FTAGs_Find
-
Using Java, HTML5, and JavaScript, we offer an online service for predicting plant FTAGs based on our developed 'FTAGs_Find' program. We provide a user-friendly graphical interface (Fig. 3), and users simply need to upload sequences in FASTA format or copy the data into the provided frame. After submitting the task, users can browse and download the analysis results of plant FTAGs on the result page.
Browse and download the examined species FTAGs dataset
-
Currently, we have gathered 81 released plant protein datasets, resulting in the identification of a total of 318,521 FTAGs from 2,873,697 protein sequences. To facilitate the use of these datasets, we have integrated the plant FTAGs datasets into the Species module (Fig. 3). Scientists can select the species of interest by clicking on the species name to access detailed information about FTAGs, including gene identification, protein sequences, and coding sequences. Users can also download the FTAGs dataset for 81 species, including 69 higher plants and 12 lower plants, from the Download module (FTAGs part). The FTAGs_Find tool can be downloaded from the Download module (FTAGs_Find part). Additionally, we provide datasets for positive and negative protein sequences, a feature dataset for the training module, and the best-performing model (SVM-Kmer-PC-PseAAC model).
Userguide and Submit module
-
In the Userguide module (Fig. 3), we offer instructions on how to utilize the FTAGs_Find function for predicting FTAGs. In addition, a section of frequently asked questions, which includes the seven most common questions, such as how to cite FTGD and how to download it, is provided at the bottom of the page. To facilitate convenient user contact, we also provide information such as email addresses in the contact module. The Submit function has been integrated into the FTGD database to encourage users to share their FTAGs data.
-
Flowering indicates that the plant has completed the transition from the vegetative stage to the reproductive stage[1,2]. Many advances have revealed that the photoperiod pathway, vernalization pathway, autonomous pathway, GA pathway, temperature pathway, and age pathway regulate the timing of floral transition[4]. The Flowering Interactive Database integrates a comprehensive collection of 306 FTAGs, providing researchers with valuable resources for studying FTAGs.
In this study, a total of 628 protein sequences were collected from the FLOR-ID database[5] and used to construct the positive dataset. The negative dataset consisted of 8,163 protein sequences downloaded from the TAIR[16] database (
www.arabidopsis.org ). We addressed the issue of imbalance by assigning different weights to the positive and negative sets. Subsequently, we developed seven machine learning models to distinguish FTAGs from non-FTAGs using a machine learning approach. Based on the proposed SVM-Kmer-PC-PseAAC classification model (F1 score = 0.934, accuracy = 0.939, and receiver operating characteristic = 0.943), we created a local Python program for the proteome-wide identification of proteins encoded by FTAGs. Compared to biological experiments and omics high-throughput technologies, using our developed prediction tool 'FTAGs_Find' offers the advantages of resource and time savings. The existing homology sequence search tool BLAST+ only takes into account sequence composition and order features when identifying homologous genes, the predictive algorithm constructed in this study considers a broader range of information, including sequence composition, order features, and physicochemical properties.Next, a total of 318,521 FTAGs were identified from protein datasets of 81 species, encompassing 69 higher plants and 12 lower plants. Among these 81 examined species, we detected 11,823 FTAGs from the 45,611 genes in the whole genome of Sphagnum fallax. Notably, Sphagnum fallax exhibited the highest proportion of FTAGs compared to the other examined species, accounting for 25.92% of all the genes. Interestingly, Sphagnum fallax belongs to the group of flowering plants, and it suggests that FTAGs may have expanded following whole-genome duplication events in Sphagnum fallax. On the contrary, O. lucimarinus, which belongs to non-flowering plants, displayed the lowest proportion of FTAGs (2.68%). This result indicates that FTAGs may have expanded in flowering plants and contracted in non-flowering plants.
Finally, using available plant FTAGs datasets and the FTAGs_Find tool, we have constructed the Flowering-time Gene Database (FTGD:
www.sagsanno.top:8080/FTGD ), which enables users to download FTAGs datasets from 81 species and identify new FTAGs in other plants. In the future, we plan to incorporate additional plant FTAGs datasets into FTGD. We will also explore other machine learning methods, such as Random Forest algorithms, to enhance the performance of our prediction model. We believe that FTGD will prove to be a valuable resource for breeders and the flowering time research community. -
The authors confirm contribution to the paper as follows: study conception and design: Li Z; experiments performance: Zhang J, He S, Wang W, Chen F, Li Z; draft manuscript preparation & revise: Zhang J, He S, Chen F, Li Z. All authors approved the final MS. All authors reviewed the results and approved the final version of the manuscript.
-
All data generated or analyzed during this study are included in FTGD (
www.sagsanno.top:8080/FTGD orhttp://plants.hainanu.edu.cn/FTGD ) This work was supported by the National Natural Science Foundation of China (32172614), Hainan Province Science and Technology Special Fund (ZDYF2023XDNY050). Authors thank the anonymous editor and reviewers for their valuable comments and suggestions.
-
The authors declare that they have no competing interests. Wenquan Wang and Fei Chen are the Editorial Board members of Tropical Plants who were blinded from reviewing or making decisions on the manuscript. The article was subject to the journal's standard procedures, with peer-review handled independently of these Editorial Board members and the research groups.
-
accompanies this paper at (https://www.maxapress.com/article/doi/10.48130/TP-2023-0023)
-
Received 3 October 2023; Accepted 7 November 2023; Published online 22 November 2023
-
We have developed a high-accuracy machine learning model for predicting flowering-time-associated genes in plants and created a practical tool for this purpose.
We successfully predicted 318,521 flowering-time-associated genes across protein datasets from 81 plant species, providing a substantial amount of data related to plant flowering timing.
In order to facilitate user access to both the tool and the data, we have established a database of plant flowering-time-associated genes, which will serve as a valuable resource for research and breeding endeavors.
- Supplemental Table S1 The FTAGs data of 81 examined species.
- Supplemental Table S2 The hyperparameters of SVM predictive model.
- Copyright: © 2023 by the author(s). Published by Maximum Academic Press on behalf of Hainan University. This article is an open access article distributed under Creative Commons Attribution License (CC BY 4.0), visit https://creativecommons.org/licenses/by/4.0/.
-
About this article
Cite this article
Zhang J, He S, Wang W, Chen F, Li Z. 2023. FTGD: a machine learning method for flowering-time gene prediction. Tropical Plants 2:23 doi: 10.48130/TP-2023-0023 

FTGD: a machine learning method for flowering-time gene prediction
- Received: 03 October 2023
- Accepted: 07 November 2023
- Published online: 22 November 2023
Abstract: The timing of flowering significantly affects plant reproduction and crop yield, making it important to detect flowering-time associated genes. In this study, we retrieved 628 flowering-time associated protein sequences from a database of flowering-time genes in Arabidopsis thaliana (FLOR-ID) and created seven machine learning models using Support Vector Machine (SVM) algorithms to discriminate flowering-time associated genes (FTAGs) from non-FTAGs. The SVM-Kmer-PC-PseAAC model performed the best (F1 score = 0.934, accuracy = 0.939, and receiver operating characteristic = 0.943). Utilizing this model, we have developed a plant FTAGs prediction tool called 'FTAGs_Find'. We identified a total of 318,521 FTAGs from 81 species protein datasets using the FTAGs_Find. Notably, in O. lucimarinus, a non-flowering plant, only 208 FTAGs were predicted in the whole genome, accounting for just 2.68% of all genes, which is consist with the extensive FTAG loss during evolution. To facilitate user access to the FTAG prediction tool and the FTAG dataset, we constructed a plant flowering-time-associated genes database (FTAGdb), which will be a valuable resource for researchers and breeders.
-
Key words:
- Flowering-time genes /
- Support Vector Machine (SVM) /
- Classification /
- Database