METHOD   Open Access    

Determination of nuclear DNA ploidy distribution in the mesocarp of tomato red ripe fruit using a flow cytometer

More Information
  • Metabolic changes at the ripening stage are critical for the final formation of tomato fruit quality, which may have a close relationship with nuclear DNA ploidy level. The lack of efficient isolation of nuclei from tomato red ripe fruit mesocarp cells hinders the studies of relationships between nuclear DNA ploidy level and fruit quality. We established a protocol to determine the nuclear DNA ploidy level in tomato red ripe fruit mesocarps using a flow cytometer. Tomato mesocarps were chopped in nucleus isolation buffer and filtered with a 425 μm steel mesh sieve and 75 μm nylon mesh sieve sequentially, and nuclei were collected from the filtrate by centrifugation. Three nucleus isolation buffers including Aru, Galbraith and Boudon buffer could isolate nuclei from green fruit mesocarp cells but not red ripe fruit for flow cytometric analysis. We noticed that resuspending nuclei isolated from red ripe fruit mesocarp cells with buffers was a critical step for flow cytometric analysis, and phosphate buffered saline (PBS) buffer had better effects than HEPES, MOPS, Tris and phosphate buffer. PBS buffer resuspension did not change the nuclear DNA ploidy distribution in green fruit pericarps during flow cytometric analysis. Aru buffer retrieved more nuclei with PBS resuspension for flow cytometric analysis than Galbraith and Boudon buffer, and the high pH value of PBS buffer improved the detection efficiency. Our protocol could effectively isolate nuclei from tomato red ripe fruit pericarps for flow cytometric analysis, which may facilitate the nuclear sorting with different ploidy levels in the future.
  • Genetic diversity due to genetic variation is the cornerstone for ecosystem diversity and species diversity. Genetic variation is a change in the genetic material of an organism that can be passed on to future generations, including chromosomal variation, genetic recombination, genetic mutations, and the emergence of orphan genes (OGs)[1]. OGs are a group of genes in a taxonomic group for which no obvious homology can be found at the genomic level, also known as 'lineage-specific genes'[2,3]. The first report of OGs in Saccharomyces cerevisiae was released in 1996[4]. However, in the early stage, researchers knew little about OGs due to the limitation of sequencing ability to obtain the complete genome of many lineages[5]. Over recent decades, following the speedy advancement of sequencing technologies, complete genomic and transcriptomic sequences of a large number of species have been obtained quickly, accurately, and inexpensively[6]. Each freshly sequenced genome consists of a portion of OGs, and therefore, OGs in organisms such as the silkworm[7], sweet orange[8], and tea plant[9] have begun to be studied extensively. As research has continued, based on previous work on complete genomes in such species as Human, Drosophila, and Arabidopsis thaliana, researchers have proposed several mechanisms for the origin of OGs related to gene duplication and subsequent sequence divergence, transposable elements, lateral gene transfer, and de novo origination[1014].

    However, the functions of most OGs are not annotated due to the lack of homologous genes and functional domain information[15]. Although it is challenging to analyze the biological functions using comparative genomics, some preliminary explorations can be made based on their sequence structural features. OGs have a shorter generation time in comparison to non-orphan genes (NOGs), and therefore, there are some identifiable differences in gene and protein length, exon number, GC content, transcript support, and position preference on chromosomes. In sweet orange, the OGs had a lower average number of exons per gene, both shorter genes and protein length, higher GC content, as well as priority distribution on certain chromosomes, in comparison to NOGs[8]. Similar results were found in A. thaliana[15], Drosophila[16], Poaceae[17], zebrafish[18], and tea plant[9].

    A considerable amount of research has now proven that OGs have a crucial impact on growth and development[19,20]. RNA interference of 200 OGs in Drosophila melanogaster induced down-regulation of their expression and was found to result in lethality mainly concentrated in the metaphase[21]. In plants, transgenic transfer of the OG (QQS), which is responsible for influencing the process of carbon and nitrogen segregation of proteins and carbohydrates in A. thaliana, into soybean was found to affect the protein content of soybean seeds similarly[22]. It is noteworthy that tissue-specific expression of OGs exists, with a preference in animals for expression in male reproductive tissues such as the testis[13], exemplified by the species-specific chimeric gene Sdic1 encoding the sperm-specific kinesin intermediate chain in D. melanogaster[23]. A similar phenomenon is present in plants, where tissue-specific expression of OGs tends to be reflected in the male reproductive system, for instance, in pollen. By way of exemplification, the orphan protein encoded by the Ms2 gene caused male sterility in wheat, barley, and phragmites[24]. Besides, OGs have been shown to play an essential part in environmental adaptation. Drought-induced over-expression of the OG (UP12_8740) in cowpea increased its tolerance to osmotic stress and soil drought[25]. Similarly, preferential expression of OGs under abiotic stress was reported in water flea[26], A. thaliana[27] and rice[28].

    The Chinese rose (Rosa chinensis) is an important horticultural crop and one of the most commonly cultivated ornamentals in the world, with considerable economic value in potted and cut flowers. The bright colors of roses are visually attractive, and therefore, R. chinensis is often used as a suitable demonstration plant for the production of new flowering varieties[29]. R. chinensis is also the dominant species used for hybridization and was introduced to Europe in the 18th century as a parent of modern roses[30]. In the present study, the published R. chinensis genome[31]was used to identify OGs and a comprehensive analysis was performed, including sequence structural features, subcellular localization, gene duplication, and chromosome distribution. In addition, a weighted gene co-expression network analysis (WGCNA) was built to project the functions of these identified OGs. The differences in the expression of OGs at different times under salt and drought stress were also analyzed to explore the adaptation of OGs to the environment. In conclusion, the present results provide valuable clues to reveal the evolution, characterization, and environmental adaptation of OGs in R. chinensis.

    Genomes and annotation information for R. chinensis were obtained from the Rosa database (https://lipm-browsers.toulouse.inra.fr/pub/RchiOBHm-V2/). Predicted proteins of Rosa rugosa were downloaded from the eplant (http://eplant.njau.edu.cn). All other Rosaceae predicted proteins were downloaded from the NCBI Datasets (www.ncbi.nlm.nih.gov/datasets). Unique transcripts (PUT) assembled from plant mRNA sequences were downloaded from PlantGDB (https://goblinp.luddy.indiana.edu/prj/ESTCluster), and 122 plant genomes predicted proteins were extracted from Phytozome (https://phytozome-next.jgi.doe.gov), and 77 from eplant (http://eplant.njau.edu.cn) were downloaded. UniProtKB was obtained from Uniprot (www.uniprot.org/uniprotkb) and NR database were downloaded from NCBI (ftp://ftp.ncbi.nlm.nih.gov), individually.

    For the prediction of the potential function of OGs, we collected RNA-seq data from publicly available materials to acquire the gene expression levels. Such data consisted of different tissues or varying stress of R. chinensis. The transcriptome data was downloaded from the National Center for Biotechnology Information database (NCBI; www.ncbi.nlm.nih.gov) with BioProject accession number PRJNA546486 (leaf, stem, root, pistil ovary, prickle, and stamen), PRJNA722055 (leaf imposed to drought stress: 0, 30, 60, and 90 d) and PRJNA587482 (root imposed to salt stress: 0, 2, 24, and 48 h).

    The advancement of comparative genomics has led to a much more improved investigation of the origin and evolution of OGs. A homolog-based search was performed in a pipeline to identify R. chinensis within OGs (Fig. 1). Initially, R. chinensis protein sequences were scoured against the R. rugosa proteome with the BLASTP. Any R. chinensis protein sequence with BLASTP hit with an E-value cutoff of 1e-5 was discarded once available. Homology searches were then conducted with genomes of other Rosaceae plants, Phytozome, eplant, Plant-PUTs database, Uniprot-KB database, and NR database sequentially with an E-value cutoff of 1e-5. Finally, the genes without homologs in any databases were the OGs[15,32], whereas all the alternatives with homologous were non-orphan genes (NOGs).

    Figure 1.  Procedure for identifying the orphan genes in R. chinensis genome. The purple arrows represent a homolog-based search by BLASTP with an E-value cutoff of 1e-5. The blue arrow represents a homolog-based search by TBLASTN with an E-value cutoff of 1e-5. Genes without homologs in any databases were identified as OGs (2,586), while genes with homologs were classified as NOGs (33,791).

    To visualize the structural characteristics of the OGs, a genome-wide profile of R. chinensis was applied. DAMBE7 software was employed to evaluate the isoelectric points of OGs and NOGs[33]. Discrepancies among OGs and NOGs, including gene size, length of the protein, size of the exons and introns, number of the exons, and content of GC were computed with the use of in-house Python scripts. The Wilcox rank-sum test was then used to identify the significant difference across distinct groups for OGs and NOGs. Information on chromosome localization was retrieved from chromosome sequences and plotted using MapGene2Chrom (http://mg2c.iask.in/mg2c_v2.0). A final BUSCA (Bologna Unified Subcellular Component Annotator) was applied to predict the OGs subcellular localizations[34].

    Based on previous studies, there are varied models interpreting the origin of OGs[3,14], of which gene duplication has been considered the dominant mechanism underlying the emergence of OGs[35]. The present work started with a BLASTP search for homologous genes with an E-value cutoff of 1e-8, followed by the identification of different types of gene duplication using MCscanX with was capable of detecting WGD, tandem duplication, proximal duplication, transposon duplication, and dispersed duplication[36].

    To analyze tissue expression, growth and development, and ability to adapt to the environment of R. chinensis, the transcriptome data was downloaded. The raw RNA-seq data was in turn filtered using the Trimmomatic program[37]. With the aim of identifying differentially expressed genes (DEGs) between treatments, we used the default settings of the abundance_estimates_to_matrix.pl, run_DE_analysis.pl (DESeq2) and analyze_diff_expr.pl modules of the Trinity package. Significant differences in gene expression were ascertained using the |log2FC| ≥ 1 with a false discovery rate (FDR) < 0.05 as thresholds, and RSEM implemented in the Trinity package was employed to calculate FPKM (fragments per kilobase of exon per million fragments mapped)[38]. A cluster analysis was conducted using R software targeting particular expressed genes based on RNA-seq data and following functional validation was selected. It was assumed that genes with FPKM value > 0.02 were already expressed[39]. Besides, genes that were exclusively expressed in specific tissue were determined by PaGeFinder software with specificity measure (SPM)[40], and once the SPM value was ≥ 0.9, the gene in that tissue was identified specifically.

    Following the discard of genes with FPKM < 1, WGCNA was constructed and the genes were grouped into modules aided by the WGCNA package in R software[41]. The automatic network builder function block-wise Modules were utilized to construct the network with default parameters. After that, eigengene values were computed for individual modules for every tissue and the module with the highest correlation coefficient, while fulfilling a p-value < 0.05, was picked to serve as the tissue-specific module for further analysis. The candidate with the most significant representative gene in each module was assumed to be the module eigengene. Module membership[10] and gene importance[32] were calculated for every ME in each tissue-specific module, and once MM > 0.95 and GS > 0.85, the gene was deemed to be the central gene of the module. KEGG enrichment analysis was carried out on an online platform, OmicShare (www.omicshare.com).

    The OGs of R. chinensis were characterized according to the methodology employed in recent studies (Fig. 1) with the recently published database resources[15,42,43]. A total of 36,377 annotated protein-coding genes within the R. chinensis genome were used for BLASTP with all R. rugosa protein-coding genes (39,704) presented in this study. During this procedure, there were a total of 33,006 genes with significant similarity (E-value < 1e-5), and 3,371 genes (DBI) were kept for the follow-up analysis. The NOGs indicating homology were eliminated, and a further scan of the remaining genes were carried out alongside the published genomes of the Rosaceae family. Altogether 2872 genes (DBII) were kept for further analysis at this step. The NOGs displaying homology were dropped and the remaining genes were matched with 122 plant genomes in Phytozome for an additional search, yielding 2,812 genes being retained for the following step (DBIII). After comparing these 2,812 genes with the 77 plant genomes in the eplant database, 2,759 genes were not found as homologs (DBIV). Of these 2,759 genes subsequently matched against 251 PlantGDB-assembled Unique Transcripts (PUTs) sequences and no homologs were found for 2,613 genes (DBV). The last step, was to completely erase the impact of false positives from the analysis, leftover genes were examined in the context of UniProt-KB and NR databases, an action that finally left 2,586 genes. These leftover 2,586 genes were labelled as OGs in the R. chinensis genome, representing 7.11% of the entire genome of R. chinensis (Supplementary Table S1), as opposed to these remaining 33,791 genes whose similarity to the databases was defined as NOGs.

    Aiming at clarifying any significant differences between OGs and NOGs, the analysis highlighted and compared the sequence structural features between 2,586 OGs and 33,791 NOGs found in the present study. The results showed a significantly smaller gene size (Wilcox rank sum test, p < 2.2e-16) and protein size (Fig. 2a, Wilcox rank sum test, p < 2.2e-16) for OGs than for NOGs (Table 1), where 1,512.34 bp was the OGs gene size and 72.5 amino acids (aa) was the OGs protein size, 2868.43 bp for NOGs gene size and 378.4 aa for NOGs protein size, which suggested that the NOGs protein was 5.22-fold lengthening than OG protein (Table 1). An in-depth analysis on the structural components of the genes revealed that the shorter protein size was predominantly attributed to the lower number of exons (Fig. 2b, Wilcox rank sum test, p < 2.2e-16). The exon size (Fig. 2c, Wilcox rank sum test, p = 7.789e-15) and intron size (Fig. 2d, Wilcox rank sum test, p < 2.2e-16) of OGs, however, were both remarkably bigger than NOGs. The GC content and the isoelectric point of OGs were further comparatively examined with those of NOGs. It was shown that the GC contents of OGs were lower than that of NOGs (Table 1, Fig. 2e, Wilcox rank sum test, p < 2.2e-16). In contrast, the isoelectric point of OGs (8.53) was higher than that of NOGs (7.42) (Table 1, Fig. 2f, Wilcox rank sum test, p < 2.2e-16). In general, these results suggested that there existed significant differences in genetic features of OGs and NOGs.

    Figure 2.  Analysis and comparison of the structural characteristics of orphan genes (OGs) and non-orphan genes (NOGs). (a) Box-plot comparisons of protein length. (b) Exon number per gene. (c) Exon length. (d) Intron length. (e) GCs content. (f) Isoelectric point. White squares represent the mean value. **** indicate significance levels at p < 0.0001.
    Table 1.  Genic features of orphan genes (OGs) compared with non-orphan genes (NOGs).
    Items OGs NOGs Wilcox rank sum test
    probability
    Mean (SE) Median Mean (SE) Median
    Gene size (bp) 1,512.34 (1,736.26) 880 2,868.43 (2,590.26) 2,239 < 2.2e-16
    Protein size (aa) 72.5 (32.17) 63 378.4 (306.51) 306 < 2.2e-16
    Exons per gene 2.34 (1.99) 2 4.82 (4.74) 3 < 2.2e-16
    Exon size (bp) 347.84 (385.78) 225.5 322.22 (423.62) 164 7.789e-15
    Intron size (bp) 571.3 (998) 270 556.31 (731.19) 356 < 2.2e-16
    Gene GC content (%) 39 (4.85) 38.05 40.31 (4.06) 39.46 < 2.2e-16
    CDS GC content (%) 41.9 (6.47) 41.46 45.08 (4.54) 44.35 < 2.2e-16
    Isoelectric point 8.53 (2.34) 8.64 7.42 (1.94) 7.21 < 2.2e-16
     | Show Table
    DownLoad: CSV

    For the analysis of OGs' genomic distribution, the OGs were plotted over the chromosomes of R. chinensis based on the available information from genome annotation (Supplementary Table S1). A total of 2560 OGs were spread over seven chromosomes. A maximum number of OGs per chromosome was in the order of Chr2 (465), Chr5 (423) and Chr1 (395). The percentages of OGs distributed on the seven chromosomes were 7.97%, 7.01%, 6.84%, 7.37%, 6.91%, 6.41%, and 7.29%, respectively (Fig. 3b), demonstrating that there was no chromosomal preference in the distribution of the OGs in R. chinensis. Besides, the distribution density of OGs was higher near the telomeres, and the distribution was relatively balanced on the chromosomes apart from the aggregation phenomenon in some chromosomal regions (Fig. 3c). Generally, the spread of OGs on these seven chromosomes was reasonably uniform.

    Figure 3.  Orphan genes (OGs) distribution on chromosomes. (a) The numbers of OGs on each chromosome of R. chinensis. (b) Percentage of OGs on each chromosome of R. chinensis. (c) Chromosomal distribution of the identified OGs. Black horizontal lines represent OGs.

    Protein functions typically are, to a certain extent, inferred from their subcellular localization. In this study, among the 2,586 OGs that were identified, 788 were positioned in extracellular space, 652 in the chloroplast, 534 in the nucleus, 261 on the organelle membrane, 232 in the endomembrane system, 86 on the plasma membrane, 27 in the mitochondria, and all but eight in the chloroplast thylakoid lumen (Fig. 4).

    Figure 4.  Orphan gene (OGs) subcellular and gene duplication analysis. (a) OGs assigned to different subcellular locations. (b) The OGs number of different duplication types.

    The origination of OGs is essential in the evolution of the genome. OGs often arise from a combinatorial mix of diverse mechanisms of origin. While gene duplication is believed to be the predominant model for the origin of OGs, the gene duplication theory consists primarily of the generation of the new gene via differentiation following duplication. 2,586 OGs derived from the genome of R. chinensis were detected in this study, including 274 OGs derived from gene duplication, accounting for approximately 10.6% of the whole OGs ((Supplementary Table S2). There were altogether four OGs originating from whole-genome duplication (WGD). Besides, the number of OGs resulting from tandem duplication, transposed duplication, proximal duplication, and dispersed duplication were 10, 4, 12, and 244 (Supplementary Table S2), respectively.

    The gene expression pattern for one gene across different tissues must enlighten the corresponding biological function. Preceding transcriptomic data on six tissues subjected to normal growth conditions were reanalyzed. It was found that the transcriptional data contained 2,088 (80.74%) OGs and 29,572 (87.51%) NOGs with FPKM > 0.02. Typically, the expressed amount of OGs is relatively lower than that of NOGs. Of these, in pistil ovary and stamen, there were the most OGs expressed (Fig. 5a). In addition, 1,139 OGs were identified to be represented across all six tissues (FPKM > 2 in a minimum of one tissue), and 346 OGs were hyper-expressed in all six tissues (FPKM > 2 in all of them). The amount of actively expressed OGs (GeneSpring normalized expression value > 0) followed a generally parallel trend throughout the six tissues and the highest expression level in stamen (Fig. 5b). It was further observed that 214 OGs were specifically expressed in six tissues, out of which 24 were specifically expressed in root, 20 in the stem, 29 in leaf, 21 in prickle, 90 in stamen, and 30 in the pistil ovary (Fig. 5c), such genes may have specific roles within the corresponding tissues. It was obvious that OGs showed more potential expression in stamen (Fig. 5d). A tissue preference for the expression of most OGs was seen according to the expression abundance in each tissue (Fig. 6).

    Figure 5.  Gene expression patterns of R. chinensis orphan genes (OGs). (a) Fraction of OGs having expression in different tissues. (b) GeneSpring normalized expression levels of OGs in different tissues. (c) Fraction of OGs having tissue-specific expression in different tissues of adult stage. (d) Venn diagram showing the number and relationships of expressed OGs in root, stem, leaf, prickle, stamen, and pistil ovary.
    Figure 6.  Expression pattern of orphan genes in different tissues includes root, stem, leaf, prickle, stamen, and pistil ovary of R. chinensis.

    As the function of OGs cannot be inferred from homologous genes, however, OGs were exclusively expressed in diverse tissues (Fig. 5). The potential functions of OGs were further profiled employing WGCNA, a tool for determining synergistic gene modules. Fifteen modules were defined. Considering different tissues as traits, the modules associated with the optimization of characteristic vector genes and phenotypes were filtered and mapped the heat map of module-trait relationships. Five modules were eventually settled on that had an extremely strong positive correlation to the trait (Fig. 7a). Subsequently, 5,218 hub genes were screened and confirmed in five modules, consisting of 217 OGs. In MEblue (leaf), there were 1,454 hub genes, containing 31 OGs. In the MEbrown model (root), 1,436 hub genes were present, covering 49 OGs. In the MEgreen model (pistil ovary), a total of 250 hub genes existed, including 11 OGs. Among the MEred model (stem), with 159 hub genes that included one OG. In the MEturquoise model (stamen), as many as 1,919 hub genes were found, comprising 125 OGs (Supplementary Table S3). These five modules were followed up with an analysis of KEGG enrichment immediately (p-value < 0.05). In MEblue (leaf), it was predominantly enriched in photosynthesis (ko00195), porphyrin, and chlorophyll metabolism (ko00860), carbon fixation in photosynthetic organisms (ko00710), carotenoid biosynthesis (ko00906), and plant hormone signal transduction (ko04075). In the MEbrown model (root), it was primarily affluent in glutathione metabolism (ko00480), phenylpropanoid biosynthesis (ko00940), MAPK signaling pathway (ko04016), and plant hormone signal transduction (ko04075). In the MEgreen model (pistil ovary), linoleic acid metabolism (ko00591), alpha-Linolenic acid metabolism (ko00592), and plant hormone signal transduction (ko04075) were enriched. In the MEred model (stem), it was mainly enriched SNARE interactions in vesicular transport (ko04130) and isoflavonoid biosynthesis (ko00943). In the MEturquoise model (stamen), pentose and glucuronate interconversions (ko00040), phosphatidylinositol signaling system (ko04070), glycerophospholipid metabolism (ko00564), glycolysis/gluconeogenesis (ko00010), galactose metabolism (ko00052) and ether lipid metabolism (ko00565) (Fig. 7b).

    Figure 7.  Co-expression network analyses. (a) Heat map of module-tissue relationship. (b) KEGG enrichment analysis of five tissue-specific modules, include KEGG enrichment analysis result of MEblue module genes (leaf). KEGG enrichment analysis result of MEgreen module genes (pistil ovary). KEGG enrichment analysis result of MEbrown module genes (root). KEGG enrichment analysis result of MEturquoise module genes (stamen). KEGG enrichment analysis result of MEred module genes (stem).

    In addition, with the aim of probing the potential link between OGs and environmental adaptation, the expression of OGs were reanalyzed in roots under salt stress (0, 2, 24, and 48 h under salt stress) and leaves under drought stress (0, 30, 60, and 90 d under drought stress) using published RNA-seq data. At salt treatment, compared with the control group (0 h under salt stress), 21 (up-regulated: 7, down-regulated: 14), 116 (up-regulated: 56, down-regulated: 60) and 56 (up-regulated: 91, down-regulated: 39) identified OGs in 2 h vs 0 h, 24 h vs 0 h, and 48 h vs 0 h were differentially expressed, correspondingly (Supplementary Table S4). A total of 201 OGs overlapped (201/2586, 7.78%) that were salt responsive in roots, of which 112 OGs (112/201, 55.72%) were up-regulated and 89 OGs (89/201, 44.28%) were down-regulated (Fig. 8a). Fuzzy c-means clustering analysis of all salt-associated DEGs (including OGs and NOGs) was further divided into six Clusters of gene co-expression patterns (Fig. 8b). Two Clusters were focused on with increasing (Cluster 2), and decreasing trends (Cluster 4) of gene expression levels with increasing salt treatment time. Genes with Memberships > 0.7 in Cluster 2 and Cluster 4 were screened for subsequent functional enrichment analysis. There was a total of 440 DEGs in Cluster 2, including 15 OGs, and 336 DEGs in Cluster 4, including 7 OGs (Supplementary Table S5). Nineteen OGs were engaged and enriched in GO terms, consisting 'cellular hyperosmotic salinity response', 'cellular response to hydrogen peroxide', and 'response to salt stress' (p-value < 0.01) (Supplementary Table S6). KEGG enrichment results showed that ABC transporters and brassinosteroid biosynthesis pathway were remarkably enriched (p-value < 0.05) (Table 2).

    Figure 8.  Transcriptome analysis of orphan genes (OGs) under salt and drought stress. (a) Number of differentially expressed OGs under salt stress in leaves of R. chinensis. (b) Trends in the expression of differentially expressed genes at different time points under salt stress. (c) Heat map of the expression of OGs under the trend of pattern Cluster 2 and Cluster 4. (d) Number of differentially expressed OGs under drought stress in roots of R. chinensis. (e) Trends in the expression of differentially expressed genes at different time points under drought stress. (f) Heat map of the expression of OGs under the trend of pattern Cluster 1 and Cluster 3.
    Table 2.  Enriched KEGG pathway for R. chinensis orphan genes.
    Type Cluster KEGG pathway p-value
    Salt stress Cluster 2 Alanine, aspartate and glutamate metabolism 0.011861
    Base excision repair 0.013442
    Pentose and glucuronate interconversions 0.016805
    Ubiquinone and other terpenoid-quinone biosynthesis 0.032602
    Cluster 4 Glutathione metabolism 0.006557
    ABC transporters 0.007274
    Brassinosteroid biosynthesis 0.014615
    MAPK signaling pathway 0.016903
    Terpenoid backbone biosynthesis 0.023847
    Glycine, serine and threonine metabolism 0.035604
    Drought stress Cluster 1 Carbon metabolism 4.02E-06
    Ubiquinone and other terpenoid-quinone biosynthesis 5.04E-05
    Carbon fixation in photosynthetic organisms 5.22E-05
    Riboflavin metabolism 0.000115
    Pentose phosphate pathway 0.00284
    Glyoxylate and dicarboxylate metabolism 0.008393
    Steroid biosynthesis 0.03522
    DNA replication 0.036059
    Thiamine metabolism 0.043981
    Cluster 3 Pyrimidine metabolism 0.002402
    Aminoacyl-tRNA biosynthesis 0.019032
    Purine metabolism 0.037451
     | Show Table
    DownLoad: CSV

    Upon drought treatment, in contrast to the control group (0 day under drought stress), 101 (up-regulated: 46, down-regulated: 55), 204 (up-regulated: 76, down-regulated: 128) and 352 (up-regulated: 152, down-regulated: 200) OGs in 30 d vs 0 d, 60 d vs 0 d, and 90 d vs 0 d were differentially expressed, respectively (Supplementary Table S7). Altogether, 480 OGs overlapped (480/2586, 18.56%) in response to drought in roots, with 215 OGs (215/480, 44.79%) being up-regulated and 265 OGs (265/480, 55.21%) being down-regulated (Fig. 8d). An analysis of fuzzy c-means clustering centered on two Clusters (Cluster 1: increasing and Cluster 3: decreasing) of gene expression levels as the duration of drought treatment increased. Individual genes with Memberships > 0.7 in Cluster 1 and Cluster 3 were filtered out for follow-up functional enrichment analysis. 344 DEGs, including nine OGs, were enriched in Cluster 1, and 348 DEGs in Cluster 3 including 19 OGs (Supplementary Table S8). A total of 28 OGs were engaged and enriched in GO terms, namely 'photosynthesis', 'reductive pentose-phosphate cycle' and 'regulation of defense response' (p-value < 0.01) (Supplementary Table S9). The results of KEGG enrichment revealed that carbon metabolism and pentose phosphate pathway were markedly enriched (p -value < 0.05) (Table 2). Strikingly, for 107 OGs a response to both categories of stresses was also discovered (Supplementary Table S10), indicating that these genes likely function significantly in stress tolerance.

    Petal expansion is the principle procedure by which roses open. Interestingly, it was found that 158 OGs were differentially expressed during petal expansion from the results of Han et al. (Supplementary Table S11)[71]. In the results of Han's study, they used WGCNA to identify two modules MEyellow and MEgreenyellow that may be involved in adaxial–abaxial regulation in rose petals. In the MEyellow model, with 383 hub genes, comprising nine OGs. Within the MEgreenyellow model, a total of 52 hub genes were identified, covering two OGs (Supplementary Table S12). Functional analysis of the hub genes of both modules showed that they mainly include transcription factors such as MYBs and WUSCHEL. They also encode various enzymes such as laccase, cellulose synthase, and trehalose-6-phosphate synthase. All in all, 11 OGs were identified that may participate in adaxial–abaxial regulation and have a significant effect on the flowering open procedure.

    The burgeoning field of comparative genomics has accelerated the exploration of the emerging field of OGs, with OGs potentially important for the development, function, and evolution of living organisms being identified in successive species[7,4446]. The accurate identification of OGs is an important prerequisite for their functional prediction and analysis. In the present study, 2,586 OGs from the genome of the rose species R. chinensis were identified, representing approximately 7.11% of the genome, a proportion consistent with the typical percentage of OGs in organisms[47]. Similar to the present results, Lin et al.[15] identified 1,324 OGs in the A. thaliana genome covering approximately 4.9% of the entire genome, Zhao and Ma[9] characterized a total of 1,789 OGs in tea plant accounting for about 3.37% of the genome, and Guo et al.[28] identified 1,926 OGs in the rice genome representing approximately 4.9% of the whole genome. At present, the authentication of OGs relies primarily on comparing the target genome with published genomes of its homologous species. The more reference genomes are available, the richer the annotation information and the smaller the genome gaps of the target genome. Consequently, the number of reference genomes will affect the number and accuracy of OGs identified, where more reference genomes will likely result in fewer OGs and higher accuracy. However, the limitations of currently available identification tools lead to the possibility that the present study may not reflect the fully authentic OGs in the R. chinensis genome. Future improvements in the exclusion of pseudogenes from identification tools and evolutionary analysis of non-conserved genes may further improve the accuracy of identification.

    The shorter origin of OGs relative to NOGs has led to differences in sequence structural features, including gene size, protein size, number and size of exons and introns, GC content, and isoelectric point. The sequence structures between OGs and NOGs were analyzed and compared to reveal whether these general differences exist in the R. chinensis genome. Typically, NOGs have a larger gene size compared with OGs[17,18,42], and the results were consistent with this (Table 1). The short protein length and few exons of OGs (Fig. 2) were similar to the general characteristics of plant families Poaceae[17], Brassicaceae[27], Rutaceae[8], and Camellia[9]. The decrease in the number of exons in OGs may be an important factor contributing to the reduction in their average size (Fig. 2), as the average length of exons is somewhat constant[47]. Consequently, even if the length of exons and introns of OGs was significantly higher than that of NOGs, it had little effect on average size. De novo origination might be another reason accounting for this shorter gene size of OGs, due to their short evolutionary time[48]. In addition, it was speculated that another possible contributor to the difference was the higher proportion of intron-less OGs. Kaessmann suggested that recurrent line-specific expansion may lead to a dramatic enrichment of intron-less genes and the creation of new genes by retrotransposition, a phenomenon that has been demonstrated in zebrafish[13]. On the other hand, in the R. chinensis genome, the GC content of OGs was noticeably less than that of NOGs, in line with Aegiceras corniculatum[49], and the wheat genome[39]. Notably, the GC content of OGs and NOGs tended to be highly variable across species. In contrast to the present results, the GC content of OGs was markedly higher than that of NOGs in sweet orange[8], Bombyx mori[7], zebrafish[18], and tea[9]. The selection and adaptation of organisms to the external environment and genetic recombination are important drivers of changes in GC content[50,51]. The isoelectric point is intimately associated with protein function, and its alteration is thought to be a modifying effect on protein function, important for solubility, subcellular localization, and protein interactions[52]. It was revealed that the isoelectric point of OGs was distinctly above that of NOGs, which may also be driven by selection[53]. For example, in prokaryotes, adaptation to the environment has led to changes in protein isoelectric points[54].

    During evolution, new genetic elements acquired by the genome, such as OGs, are one of the important sources of functional and phenotypic diversity[55]. The expression patterns of OGs on different tissues for the prediction and understanding of their biological functions are accessible using RNA-seq[56]. OGs are inconsistently expressed on different tissues, and in general, OGs are highly expressed in the reproductive system of plants and animals[8,18,57,58]. In the present study, 214 OGs were expressed tissue-specific, of which 90 and 30 OGs were expressed only in reproductive organs, stamen, and pistil ovaries, respectively; in addition, 24, 20, 29, and 21 OGs were expressed in nutritional organs, including roots, stems, leaves, and prickle (Fig. 5). The specific expression of more than 50% of R. chinensis OGs on reproductive organs implied their important role in reproductive development, which was largely in line with the expression profile of other plants' OGs[9,28,49], and more detectable expression was found in stamen (42.06%). Many studies have shown that OGs, or young genes as some researchers call them, were more inclined to be expressed in the male organs. In 2015, Cui refined this doctrine to 'new genes out of the male' and hypothesized that new genes have an important role in reproductive isolation and species differentiation[1]. The present results also support this hypothesis. In a word, the specific expression of OGs in R. chinensis provides important data on their resistance mechanisms, which is resistant to herbivores, pathogens, or mechanical damage, and also prevents water loss, which suggests an important role in the evolution of habitat adaptation in R. chinensis.

    It is not feasible to use homology comparisons to infer the possible expression characteristics and functions of OGs, as they are unique in each species. Under this circumstance, co-expressed gene modules rich in biological information become a dependable vehicle for inferring the biological processes that maybe involved in OGs, as co-expressed genes usually exhibit significant functional similarities[59]. In the present study, WGCNA was used to identify 217 OGs distributed in five modules (Supplementary Table S3). KEGG analysis revealed that these co-expressed gene modules were engaged in a variety of biologically important processes. These mainly included linoleic acid metabolism, pentose and glucuronate interconversions, photosynthesis, and plant hormone signal transduction. In all, the involvement of OGs in important physiological processes such as growth and development, signal transduction, and metabolism in roses demonstrates that OGs can be functional and are likely to be essential.

    OGs involved in pentose and glucuronate interconversions may contribute to male sterility, given the crucial role of anthers in male gametogenesis, while male sterility mutants usually exhibit genetic disruption linked to anther and pollen development[60,61], which can result from abnormal carbohydrates metabolism[62,63]. Carbohydrates, such as pentose and glucuronate, play multiple roles in pollen development, serving as a major source of energy for plant metabolism and as important signaling molecules for regulating growth and development[64,65]. β-glucuronidase, a glycosyl hydrolase, is mainly responsible for the lysosomal degradation of mucopolysaccharides, dermatopoietin, and keratin sulfate[66]. In addition, β-glucuronidase is involved in the metabolism of various endogenous substances, including pentose, glucuronides, porphyrins, starch, and sucrose[67]. The pentose and glucuronide interconversion pathway, enriched with OGs, is highly correlated with male sterility in studies of cabbage (Brassica oleracea L. var. capitata)[68] and cotton (Gossypium hirsutum L.)[69,70] transcriptome analysis, suggesting the involvement of key genes in this pathway.

    Rose flower opening is dependent on petal expansion. The adaxial-abaxial regulation of petals led to a heterogeneous distribution of auxin, and the transport and signaling of the phytohormone auxin were involved in the entire development of flowers[71], and the OGs might be active in determining and maintaining the adaxial-abaxial polarity of petals. On the other hand, floral fragrance is an important feature of ornamental roses, providing sensory pleasure to humans, and monoterpenes are one of the main classes constituting the fragrance of roses[72]. Usually, monoterpenes are mainly produced in plastids and their substrates are derived from the methylerythritol 4-phosphate pathway[73]. However, the lack of photosynthesis in rose petals may lead to a reduced flux of substrates produced through the methylerythritol 4-phosphate pathway. Therefore, photosynthesis not only provides roses with energy for growth and development, but also plays a role in the production and dispersal of floral fragrances. Fatty acid derivatives are prominent compounds in the leaves and sepals of roses[74]. An important class of enzymes involved in the formation of fatty acid-derived volatiles is lipoxygenase (LOX), the enzymatic oxidation of linoleic acid by LOX to produce hexanal. In addition, cleavage of linoleic acid at the 12−13 double bond yields the C12 precursor of jasmonic acid[75]. It has been shown that increased levels of jasmonic acid methylation led to a delayed degradation of carotenoids and affected the carotenoid content of the yellow rose cultivar R. hybrida 'Frisca'[76].

    Rose plants usually grow in subtropical climates where environmental stresses such as drought and salinity are important factors limiting their growth and productivity. It has been shown that OGs were preferentially expressed under abiotic stress, as in yeast[77] and rice[26,28]. Using available RNA-seq data, the expression patterns of OGs were screened under salinity and drought stresses, respectively, and observed 201 and 480 OGs stimulated individually, suggesting the possible important role of these stress-responsive OGs in adaptation to extreme environmental stresses (Fig 8). The increased stimulation of OGs under drought is probable to be highly correlated with their native environment, exemplified by the Middle East Taif region, where Damask rose (Rosa damascena Mill.) originated[78]. The roots serve as the primary site of plant perception of soil water deficit, and subsequently, drought response signals from the roots are transmitted to the leaves[79]. The enrichment of OGs in phytohormone signaling pathways suggested that they may have an essential position in drought sensing and signaling. Surprisingly, a total of 107 OGs responding to both types of stress were found (Supplementary Table S10). RhEXPA4 is a rose expansion protein gene that regulates leaf growth and bestows drought and salt tolerance in Arabidopsis[80] This suggests that these 107 OGs may be critical candidates for further studies of environmental adaptations in roses.

    In conclusion, even without direct functional evidence, the analysis of co-expressed gene modules implies that OG genes maybe involved in important biological processes such as developmental regulation, signal transduction, metabolism, and stress adaptation in roses.

    The authors confirm contribution to the paper as follows: study conception and design: Mao J; data analysis, draft manuscript preparation: Ma D, Ding Q; critical manuscript revision: Mao J, Ma D, Zhao Z, Han X. All authors read and approved the final manuscript.

    The data that support the findings of this study are available in the Rosa database repository: https://lipm-browsers.toulouse.inra.fr/pub/RchiOBHm-V2/.

    We appreciate Laboratoire Reproduction et Developpement des Plantes for providing their valuable databases to the public. This work was financially supported by Fundamental Research Funds for the Central Universities (JUSRP124005).

  • The authors declare that they have no conflict of interest.

  • Supplemental Fig. S1 Effect of cellulase and pectinase on nucleus isolation. Mesocarps of 55 DPA red ripe tomato fruit were pretreated in water without (a) or with (b) cellulase and pectinase for 10 minutes. Nuclei were isolated from pretreated mesocarps using “Aru”, “Galbraith” and “Bourdon” buffer for flow cytometric analysis. Shown are histograms of flow cytometric analyses. PI-A, PI fluorescence pulse signal area.
    Supplemental Fig. S2 Effects of nucleus resuspension on flow cytometric analysis. Nuclei were isolated from mesocarps of 55 DPA red ripe tomato fruit using “Aru”, “Galbraith” and “Bourdon” buffer, harvested by centrifugation and resuspended by water (a) or original nucleus isolation buffers (b) for flow cytometric analysis. Shown are histograms of flow cytometric analyses. PI-A, PI fluorescence pulse signal area.
  • [1]

    The Tomato Genome Consortium. 2012. The tomato genome sequence provides insights into fleshy fruit evolution. Nature 485:635−41

    doi: 10.1038/nature11119

    CrossRef   Google Scholar

    [2]

    Klee HJ, Giovannoni JJ. 2011. Genetics and control of tomato fruit ripening and quality attributes. Annual review of genetics 45:41−59

    doi: 10.1146/annurev-genet-110410-132507

    CrossRef   Google Scholar

    [3]

    Karlova R, Chapman N, David K, Angenent GC, Seymour GB, et al. 2014. Transcriptional control of fleshy fruit development and ripening. Journal of Experimental Botany 65:4527−41

    doi: 10.1093/jxb/eru316

    CrossRef   Google Scholar

    [4]

    Li S, Chen K, Grierson D. 2021. Molecular and Hormonal Mechanisms Regulating Fleshy Fruit Ripening. Cells 10:1136

    doi: 10.3390/cells10051136

    CrossRef   Google Scholar

    [5]

    Cherian S, Figueroa CR, Nair H. 2014. 'Movers and shakers' in the regulation of fruit ripening: a cross-dissection of climacteric versus non-climacteric fruit. Journal of Experimental Botany 65:4705−22

    doi: 10.1093/jxb/eru280

    CrossRef   Google Scholar

    [6]

    Bertin N. 2005. Analysis of the tomato fruit growth response to temperature and plant fruit load in relation to cell division, cell expansion and DNA endoreduplication. Annals of Botany 95:439−47

    doi: /10.1093/aob/mci042

    CrossRef   Google Scholar

    [7]

    Mintz-Oron S, Mandel T, Rogachev I, Feldberg L, Lotan O, et al. 2008. Gene expression and metabolism in tomato fruit surface tissues. Plant Physiology 147:823−51

    doi: 10.1104/pp.108.116004

    CrossRef   Google Scholar

    [8]

    Shinozaki Y, Nicolas P, Fernandez-Pozo N, Ma Q, Evanich DJ, et al. 2018. High-resolution spatiotemporal transcriptome mapping of tomato fruit development and ripening. Nature Communications 9:364

    doi: 10.1038/s41467-017-02782-9

    CrossRef   Google Scholar

    [9]

    Inzé D, De Veylder L. 2006. Cell cycle regulation in plant development. Annual Review of Genetics 40:77−105

    doi: 10.1146/annurev.genet.40.110405.090431

    CrossRef   Google Scholar

    [10]

    Cheniclet C, Rong WY, Causse M, Frangne N, Bolling L, et al. 2005. Cell expansion and endoreduplication show a large genetic variability in pericarp and contribute strongly to tomato fruit growth. Plant Physiology 139:1984−94

    doi: 10.1104/pp.105.068767

    CrossRef   Google Scholar

    [11]

    Azzi L, Deluche C, Gévaudant F, Frangne N, Delmas F, et al. 2015. Fruit growth-related genes in tomato. Journal of Experimental Botany 66:1075−86

    doi: 10.1093/jxb/eru527

    CrossRef   Google Scholar

    [12]

    Bapat VA, Trivedi PK, Ghosh A, Sane VA, Ganapathi TR, et al. 2010. Ripening of fleshy fruit: molecular insight and the role of ethylene. Biotechnology Advances 28(1):94−107

    doi: 10.1016/j.biotechadv.2009.10.002

    CrossRef   Google Scholar

    [13]

    Xu F, Yuan S, Zhang D, Lv X, Lin H. 2012. The role of alternative oxidase in tomato fruit ripening and its regulatory interaction with ethylene. Journal of Experimental Botany 63:5705−16

    doi: 10.1093/jxb/ers226

    CrossRef   Google Scholar

    [14]

    Chai Y, Jia H, Li C, Dong Q, Shen Y. 2011. FaPYR1 is involved in strawberry fruit ripening. Journal of Experimental Botany 62:5079−89

    doi: 10.1093/jxb/err207

    CrossRef   Google Scholar

    [15]

    Jia H, Chai Y, Li C, Lu D, Luo J, et al. 2011. Abscisic acid plays an important role in the regulation of strawberry fruit ripening. Plant Physiology 157:188−99

    doi: 10.1104/pp.111.177311

    CrossRef   Google Scholar

    [16]

    Jia H, Lu D, Sun J, Li C, Xing Y, et al. 2013. Type 2C protein phosphatase ABI1 is a negative regulator of strawberry fruit ripening. Journal of Experimental Botany 64:1677−87

    doi: 10.1093/jxb/ert028

    CrossRef   Google Scholar

    [17]

    Bartley GE, Viitanen PV, Bacot KO, Scolnik PA. 1992. A tomato gene expressed during fruit ripening encodes an enzyme of the carotenoid biosynthesis pathway. The Journal of Biological Chemistry 267(8):5036−39

    Google Scholar

    [18]

    Fray RG, Grierson D. 1993. Identification and genetic analysis of normal and mutant phytoene synthase genes of tomato by sequencing, complementation and co-suppression. Plant Molecular Biology 22:589−602

    doi: 10.1007/BF00047400

    CrossRef   Google Scholar

    [19]

    Ballester AR, Molthoff J, de Vos R, Hekkert BTL, Orzaez D, et al. 2010. Biochemical and molecular analysis of pink tomatoes: deregulated expression of the gene encoding transcription factor SlMYB12 leads to pink tomato fruit color. Plant Physiology 152:71−84

    doi: 10.1104/pp.109.147322

    CrossRef   Google Scholar

    [20]

    Jaakola L. 2013. New insights into the regulation of anthocyanin biosynthesis in fruits. Trends in Plant Science 18:477−83

    doi: 10.1016/j.tplants.2013.06.003

    CrossRef   Google Scholar

    [21]

    Hyodo H, Terao A, Furukawa J, Sakamoto N, Yurimoto H, et al. 2013. Tissue specific localization of pectin-Ca2+ cross-linkages and pectin methyl-esterification during fruit ripening in tomato (Solanum lycopersicum). PLoS One 8:e78949

    doi: 10.1371/journal.pone.0078949

    CrossRef   Google Scholar

    [22]

    Brummell DA, Harpster MH. 2001. Cell wall metabolism in fruit softening and quality and its manipulation in transgenic plants. Plant Molecular Biology 47:311−39

    Google Scholar

    [23]

    Powell ALT, Kalamaki MS, Kurien PA, Gurrieri S, Bennett AB. 2003. Simultaneous transgenic suppression of LePG and LeExp1 influences fruit texture and juice viscosity in a fresh market tomato variety. Journal of Agricultural and Food Chemistry 51:7450−55

    doi: 10.1021/jf034165d

    CrossRef   Google Scholar

    [24]

    Uluisik S, Chapman NH, Smith R, Poole M, Adams G, et al. 2016. Genetic improvement of tomato by targeted control of fruit softening. Nature Biotechnology 34:950−52

    doi: 10.1038/nbt.3602

    CrossRef   Google Scholar

    [25]

    Willats WG, Orfila C, Limberg G, Buchholt HC, van Alebeek GJ, et al. 2001. Modulation of the degree and pattern of methyl-esterification of pectic homogalacturonan in plant cell walls. Implications for pectin methyl esterase action, matrix properties, and cell adhesion. Journal of Biological Chemistry 276:19404−13

    doi: 10.1074/jbc.M011242200

    CrossRef   Google Scholar

    [26]

    Daher FB, Braybrook SA. 2015. How to let go: pectin and plant cell adhesion. Frontiers in Plant Science 6:523

    doi: 10.3389/fpls.2015.00523

    CrossRef   Google Scholar

    [27]

    Musseau C, Jorly J, Gadin S, Sørensen I, Deborde C, et al. 2020. The tomato guanylate-binding protein SlGBP1 enables fruit tissue differentiation by maintaining endopolyploid cells in a non-proliferative state. Plant Cell 32:3188−205

    doi: 10.1105/tpc.20.00245

    CrossRef   Google Scholar

    [28]

    Koch JL, Nevins DJ. 1989. Tomato fruit cell wall: I. Use of purified tomato polygalacturonase and pectinmethylesterase to identify developmental changes in pectins. Plant physiology 91:816−22

    doi: 10.1104/pp.91.3.816

    CrossRef   Google Scholar

    [29]

    Renaudin JP, Deluche C, Cheniclet C, Chevalier C, Frangne N. 2017. Cell layer-specific patterns of cell division and cell expansion during fruit set and fruit growth in tomato pericarp. Journal of Experimental Botany 68:1613−23

    doi: 10.1093/jxb/erx058

    CrossRef   Google Scholar

    [30]

    Joubès J, Phan TH, Just D, Rothan C, Bergounioux C, et al. 1999. Molecular and biochemical characterization of the involvement of cyclin-dependent kinase A during the early development of tomato fruit. Plant Physiology 121:857−69

    doi: 10.1104/pp.121.3.857

    CrossRef   Google Scholar

    [31]

    Mathieu-Rivet E, Gévaudant F, Sicard A, Salar S, Do PT, et al. 2010. Functional analysis of the anaphase promoting complex activator CCS52A highlights the crucial role of endo-reduplication for fruit growth in tomato. The Plant Journal 62:727−41

    doi: 10.1111/j.1365-313X.2010.04198.x

    CrossRef   Google Scholar

    [32]

    Gonzalez N, Gévaudant F, Hernould M, Chevalier C, Mouras A. 2007. The cell cycle-associated protein kinase WEE1 regulates cell size in relation to endoreduplication in developing tomato fruit. The Plant Journal 51:642−55

    doi: 10.1111/j.1365-313X.2007.03167.x

    CrossRef   Google Scholar

    [33]

    Arumuganathan K, Earle ED. 1991. Estimation of nuclear DNA content of plants by flow cytometry. Plant Molecular Biology Reporter 9:229−41

    doi: 10.1007/BF02672073

    CrossRef   Google Scholar

    [34]

    Bao Z, Zhang N, Hua J. 2014. Endopolyploidization and flowering time are antagonistically regulated by checkpoint component MAD1 and immunity modulator MOS1. Nature Communications 5:5628

    doi: 10.1038/ncomms6628

    CrossRef   Google Scholar

    [35]

    Galbraith DW, Harkins KR, Maddox JM, Ayres NM, Sharma DP, et al. 1983. Rapid flow cytometric analysis of the cell cycle in intact plant tissues. Science 220:1049−51

    doi: 10.1126/science.220.4601.1049

    CrossRef   Google Scholar

    [36]

    Bourdon M, Coriton O, Pirrello J, Cheniclet C, Brown SC, et al. 2011. In planta quantification of endoreduplication using fluorescent in situ hybridization (FISH). The Plant Journal 66:1089−99

    doi: 10.1111/j.1365-313X.2011.04568.x

    CrossRef   Google Scholar

    [37]

    Bainard JD, Bainard LD, Henry TA, Fazekas AJ, Newmaster SG. 2012. A multivariate analysis of variation in genome size and endoreduplication in angiosperms reveals strong phylogenetic signal and association with phenotypic traits. New phytologist 196(4):1240−50

    doi: 10.1111/j.1469-8137.2012.04370.x

    CrossRef   Google Scholar

    [38]

    Barow M, Meister A. 2003. Endopolyploidy in seed plants is differently correlated to systematics, organ, life strategy and genome size. Plant, Cell & Environment 26:571−84

    doi: 10.1046/j.1365-3040.2003.00988.x

    CrossRef   Google Scholar

    [39]

    Laimbeer FPE, Holt SH, Makris MR, Hardigan MA, Robin Buell C, et al. 2017. Protoplast isolation prior to flow cytometry reveals clear patterns of endoreduplication in potato tubers, related species, and some starchy root crops. Plant Methods 13:27

    doi: 10.1186/s13007-017-0177-3

    CrossRef   Google Scholar

    [40]

    Pirrello J, Deluche C, Frangne N, Gévaudant F, Maza E, et al. 2018. Transcriptome profiling of sorted endoreduplicated nuclei from tomato fruits: how the global shift in expression ascribed to DNA ploidy influences RNA-Seq data normalization and interpretation. The Plant Journal 93:387−98

    doi: 10.1111/tpj.13783

    CrossRef   Google Scholar

    [41]

    Bourdon M, Pirrello J, Cheniclet C, Coriton O, Bourge M, et al. 2012. Evidence for karyoplasmic homeostasis during endoreduplication and a ploidy-dependent increase in gene transcription during tomato fruit growth. Development 139:3817−26

    doi: 10.1242/dev.084053

    CrossRef   Google Scholar

    [42]

    Fieuw S, Willenbrink J. 1991. Isolation of protoplasts from tomato fruit (Lycopersicon esculentum): first uptake studies. Plant Science 76:9−17

    doi: 10.1016/0168-9452(91)90212-Q

    CrossRef   Google Scholar

    [43]

    Feldhaus MJ, Siegel RW, Opresko LK, Coleman JR, Feldhaus JMW, et al. 2003. Flow-cytometric isolation of human antibodies from a nonimmune Saccharomyces cerevisiae surface display library. Nature Biotechnology 21:163−70

    doi: 10.1038/nbt785

    CrossRef   Google Scholar

    [44]

    Chen G, Hayhurst A, Thomas JG, Harvey BR, Iverson BL, et al. 2001. Isolation of high-affinity ligand-binding proteins by periplasmic expression with cytometric screening (PECS). Nature Biotechnology 19:537−42

    doi: 10.1038/89281

    CrossRef   Google Scholar

    [45]

    Moreno-Romero J, Santos-González J, Hennig L, Köhler C. 2017. Applying the INTACT method to purify endosperm nuclei and to generate parental-specific epigenome profiles. Nature Protocols 12:238−54

    doi: 10.1038/nprot.2016.167

    CrossRef   Google Scholar

    [46]

    Kim JY, Symeonidi E, Pang TY, Denyer T, Weidauer D, et al. 2021. Distinct identities of leaf phloem cells revealed by single cell transcriptomics. The Plant Cell 33:511−30

    doi: 10.1093/plcell/koaa060

    CrossRef   Google Scholar

    [47]

    Long Y, Liu Z, Jia J, Mo W, Fang L, et al. 2021. FlsnRNA-seq: protoplasting-free full-length single-nucleus RNA profiling in plants. Genome Biology 22:66

    doi: 10.1186/s13059-021-02288-0

    CrossRef   Google Scholar

    [48]

    Krishnaswami SR, Grindberg RV, Novotny M, Venepally P, Lacar B, et al. 2016. Using single nuclei for RNA-seq to capture the transcriptome of postmortem neurons. Nature Protocols 11:499−524

    doi: 10.1038/nprot.2016.015

    CrossRef   Google Scholar

    [49]

    Picard CL, Povilus RA, Williams BP, Gehring M. 2021. Transcriptional and imprinting complexity in Arabidopsis seeds at single-nucleus resolution. Nature Plants 7:730−38

    doi: 10.1038/s41477-021-00922-0

    CrossRef   Google Scholar

    [50]

    Fan W, Xia C, Wang S, Liu J, Deng L, et al. 2022. Rhizobial infection of 4C cells triggers their endoreduplication during symbiotic nodule development in soybean. The New Phytologist 234:1018−30

    doi: 10.1111/nph.18036

    CrossRef   Google Scholar

  • Cite this article

    Zhang J, Zhang P, Wang G, Chen C, Wang X, et al. 2023. Determination of nuclear DNA ploidy distribution in the mesocarp of tomato red ripe fruit using a flow cytometer. Vegetable Research 3:8 doi: 10.48130/VR-2023-0008
    Zhang J, Zhang P, Wang G, Chen C, Wang X, et al. 2023. Determination of nuclear DNA ploidy distribution in the mesocarp of tomato red ripe fruit using a flow cytometer. Vegetable Research 3:8 doi: 10.48130/VR-2023-0008

Figures(7)  /  Tables(3)

Article Metrics

Article views(5284) PDF downloads(719)

METHOD   Open Access    

Determination of nuclear DNA ploidy distribution in the mesocarp of tomato red ripe fruit using a flow cytometer

Vegetable Research  3 Article number: 8  (2023)  |  Cite this article

Abstract: Metabolic changes at the ripening stage are critical for the final formation of tomato fruit quality, which may have a close relationship with nuclear DNA ploidy level. The lack of efficient isolation of nuclei from tomato red ripe fruit mesocarp cells hinders the studies of relationships between nuclear DNA ploidy level and fruit quality. We established a protocol to determine the nuclear DNA ploidy level in tomato red ripe fruit mesocarps using a flow cytometer. Tomato mesocarps were chopped in nucleus isolation buffer and filtered with a 425 μm steel mesh sieve and 75 μm nylon mesh sieve sequentially, and nuclei were collected from the filtrate by centrifugation. Three nucleus isolation buffers including Aru, Galbraith and Boudon buffer could isolate nuclei from green fruit mesocarp cells but not red ripe fruit for flow cytometric analysis. We noticed that resuspending nuclei isolated from red ripe fruit mesocarp cells with buffers was a critical step for flow cytometric analysis, and phosphate buffered saline (PBS) buffer had better effects than HEPES, MOPS, Tris and phosphate buffer. PBS buffer resuspension did not change the nuclear DNA ploidy distribution in green fruit pericarps during flow cytometric analysis. Aru buffer retrieved more nuclei with PBS resuspension for flow cytometric analysis than Galbraith and Boudon buffer, and the high pH value of PBS buffer improved the detection efficiency. Our protocol could effectively isolate nuclei from tomato red ripe fruit pericarps for flow cytometric analysis, which may facilitate the nuclear sorting with different ploidy levels in the future.

    • Tomato has been used as a model species for all fleshy fruits due to its excellent biological characteristics, such as short life cycle, easy self-pollination, and high growth rate[1]. Given that whether or not a respiratory burst occurs during ripening, fleshy fruits are classified into climacteric (tomato, apple, banana etc.) and non-climacteric (grape, strawberry, citrus etc) fruits[25]. Tomato fruit is composed of several different tissues, including pericarp (containing exocarp, mesocarp and endocarp), placenta, septum, and ovary (containing seeds and pulp)[68], and the pericarp accounts for 2/3 of the total fruit weight. Physical and chemical characteristics of pericarps such as texture, sugar and acid content, and lycopene content mainly determines the tomato fruit quality. The characteristics of tomato pericarp are formed during the fruit development of the fruit, which is closely related to the changes in the cell cycle[9]. In the early fruit developmental stage, active mitosis plays a dominant role in increasing the thickness of the pericarp, and cell layers dramatically increased until 5-8 d after pollination. Tomato fruit enlargement is mainly dependent on cell expansion, and this process is strongly linked to the endocycle[10,11].

      The ripening of climacteric fruit mainly depends on the burst of ethylene biosynthesis[5,12,13], while the ripening of non-climacteric fruit depends on the signal transduction pathway of abscisic acid[1416]. Fruit ripening involves changes in color, texture, flavor and aroma, the most obvious of which are changes in color due to accumulation of pigments. Tomato accumulates carotenoids, flavonoids and lycopene during ripening[1719], while grapes accumulate anthocyanins[3,20]. Fruit softening is also one of the characteristics of fleshy fruit ripening, during which the cell wall is remodeled and the structure of all major cell wall polysaccharides changes[4,21]. The solubilization of the primary cell wall and middle lamella results in reduced intercellular adhesion, depolymerization and solubilization of hemicellulose and pectin cell wall polysaccharides, and consequently a reduction in fruit firmness[21,22]. A variety of hydrolases in the cell wall are involved in the enzymatic hydrolysis of polysaccharides, galactosidase (PG) and β-galactosidase catalyze the depolymerization of pectin in the fruit wall and middle lamella[23] Knocking out of pectin lyase (PL) makes tomato fruit firmer[24]. The pectin component homogalacturonic acid (HG) is secreted into the cell wall in a highly methyl-esterified form, followed by demethyl-esterification to balance cell wall stiffness and flexibility[2527]. During tomato fruit ripening, the degree of methyl esterification of pectin decreased by 55%[28]. At the same time, active physiological and biochemical changes occurred in many cellular compartments including nucleus, plastid and cell wall during fruit ripening[4].

      Cell size in tomato fruit pericarps does not change after the fruit development reaches the mature green stage[29]. Whether or not endocycle in tomato pericarps ceases or how it progresses after the mature green stage remains largely unknown due to the difficulties of determination of nuclear DNA ploidy distribution using a flow cytometer. Previous studies utilize unripe green fruit for the flow cytometric analysis of nuclear DNA ploidy distribution, in which nuclei with different ploidy levels could be clearly differentiated[3032] . At the red ripe stage of tomato fruit, nuclei with ploidy levels from 2C to 32C could not be clearly differentiated from each other resulting in inaccurate calculation of nuclear DNA ploidy distribution[30]. In this study, we discovered that resuspending nuclei with buffers is critical for flow cytometric analysis of nuclear DNA ploidy distribution in red ripe tomato mesocarps, and phosphate buffered saline (PBS) buffer had the best effects. We used three buffers including 'Aru' buffer[33,34], 'Galbraith' buffer[35], 'Bourdon' buffer[36] to isolate nuclei from red ripe tomato pericarps and resuspended them with PBS buffer for flow cytometric analysis. Our results reveal that 'Aru' buffer plus PBS buffer resuspension is the best combination to retrieve nuclei from red ripe tomato pericarps for flow cytometric analysis to determine the nuclear DNA ploidy distribution.

    • Tomato plants of cultivar 'Heinz 1706' were grown in the greenhouse with the condition of 16 h light at 25 °C and 8 h dark at 20 °C. The day of performing manual pollination was determined as day 0 (Anthesis, 0 DPA).

    • Pieces of fresh equatorial pericarps were fixed in FAA fixative solution containing 50% ethanol, 5% acetic acid and 5% formalin, and vacuumized for 30 minutes. Pericarp tissues were consecutively dehydrated with 50%, 70%, 85% and 95% ethanol containing 0.5% eosin, and then 100% ethanol. Tissues were cleared by 50% and 100% xylene, and embedded in wax. Embedded samples were cut into slices with 10 μm thickness using a microtome. Sections were stained with Iron vitriol-hematoxylinand observed under an optical microscope.

    • Tomato pericarp tissue was defined as reported previously[29]. Three-layer cells on the outer surface are the exocarp (Ex); the 4th to the penultimate layer of cells is the mesocarp (Me); the last layer of cells is the endocarp (En, Fig. 1b, g). About 0.5 g of fresh equatorial mesocarps were collected and chopped with a double-sided razor blade in a plastic petri dish containing 1 ml of 'Aru' buffer (10 mM MgSO4·7H2O, 50 mM KCl, 5 mM 4-Hydroxyethylpiperazineethanesulfonic acid (HEPES), 6.5 mM Dithiothreitol (DTT), 2.5% Triton X-100), or 'Galbaith' buffer (45 mM MgCl, 30 mM sodium citrate, 20 mM 4-morpho-linepropane sulfonate (MOPS), 0.1% Triton X-100), or 'Bourdon' buffer (45 mM MgCl, 30 mM sodium citrate, 20 mM MOPS, 5 mM sodium metabisulfite, 1% polyethylene glycol 10000 (PEG 10000) 0.1% Triton X-100). Chopped mesocarp samples were consecutively filtered through a 425 μm mesh sieve and a 75 μm nylon mesh sieve. The filtrate was centrifuged at 5,000 rpm for 5 min, and the pellet was resuspended with 500 μl of 1 × phosphate buffered saline (PBS, pH = 7.4) buffer. Nuclei in the resuspended solution were stained by propidium iodide (PI) at a final concentration of 50 µg/ml or 4’,6-diamidino-2-phenylindole (DAPI) at a final concentration of 1 µg/ml, which were then used for flow cytometric analysis (CytoFLEX, Backman). Endocycle index or the cycle value were calculated using the following formula[37,38]: EI = (%2C nuclei × 0) + (%4C nuclei × 1) + (%8C nuclei × 2) + (%16C nuclei × 3) + (%32C nuclei × 4) + (%64C nuclei × 5) + (%128C nuclei × 6) + (%256C nuclei × 7).
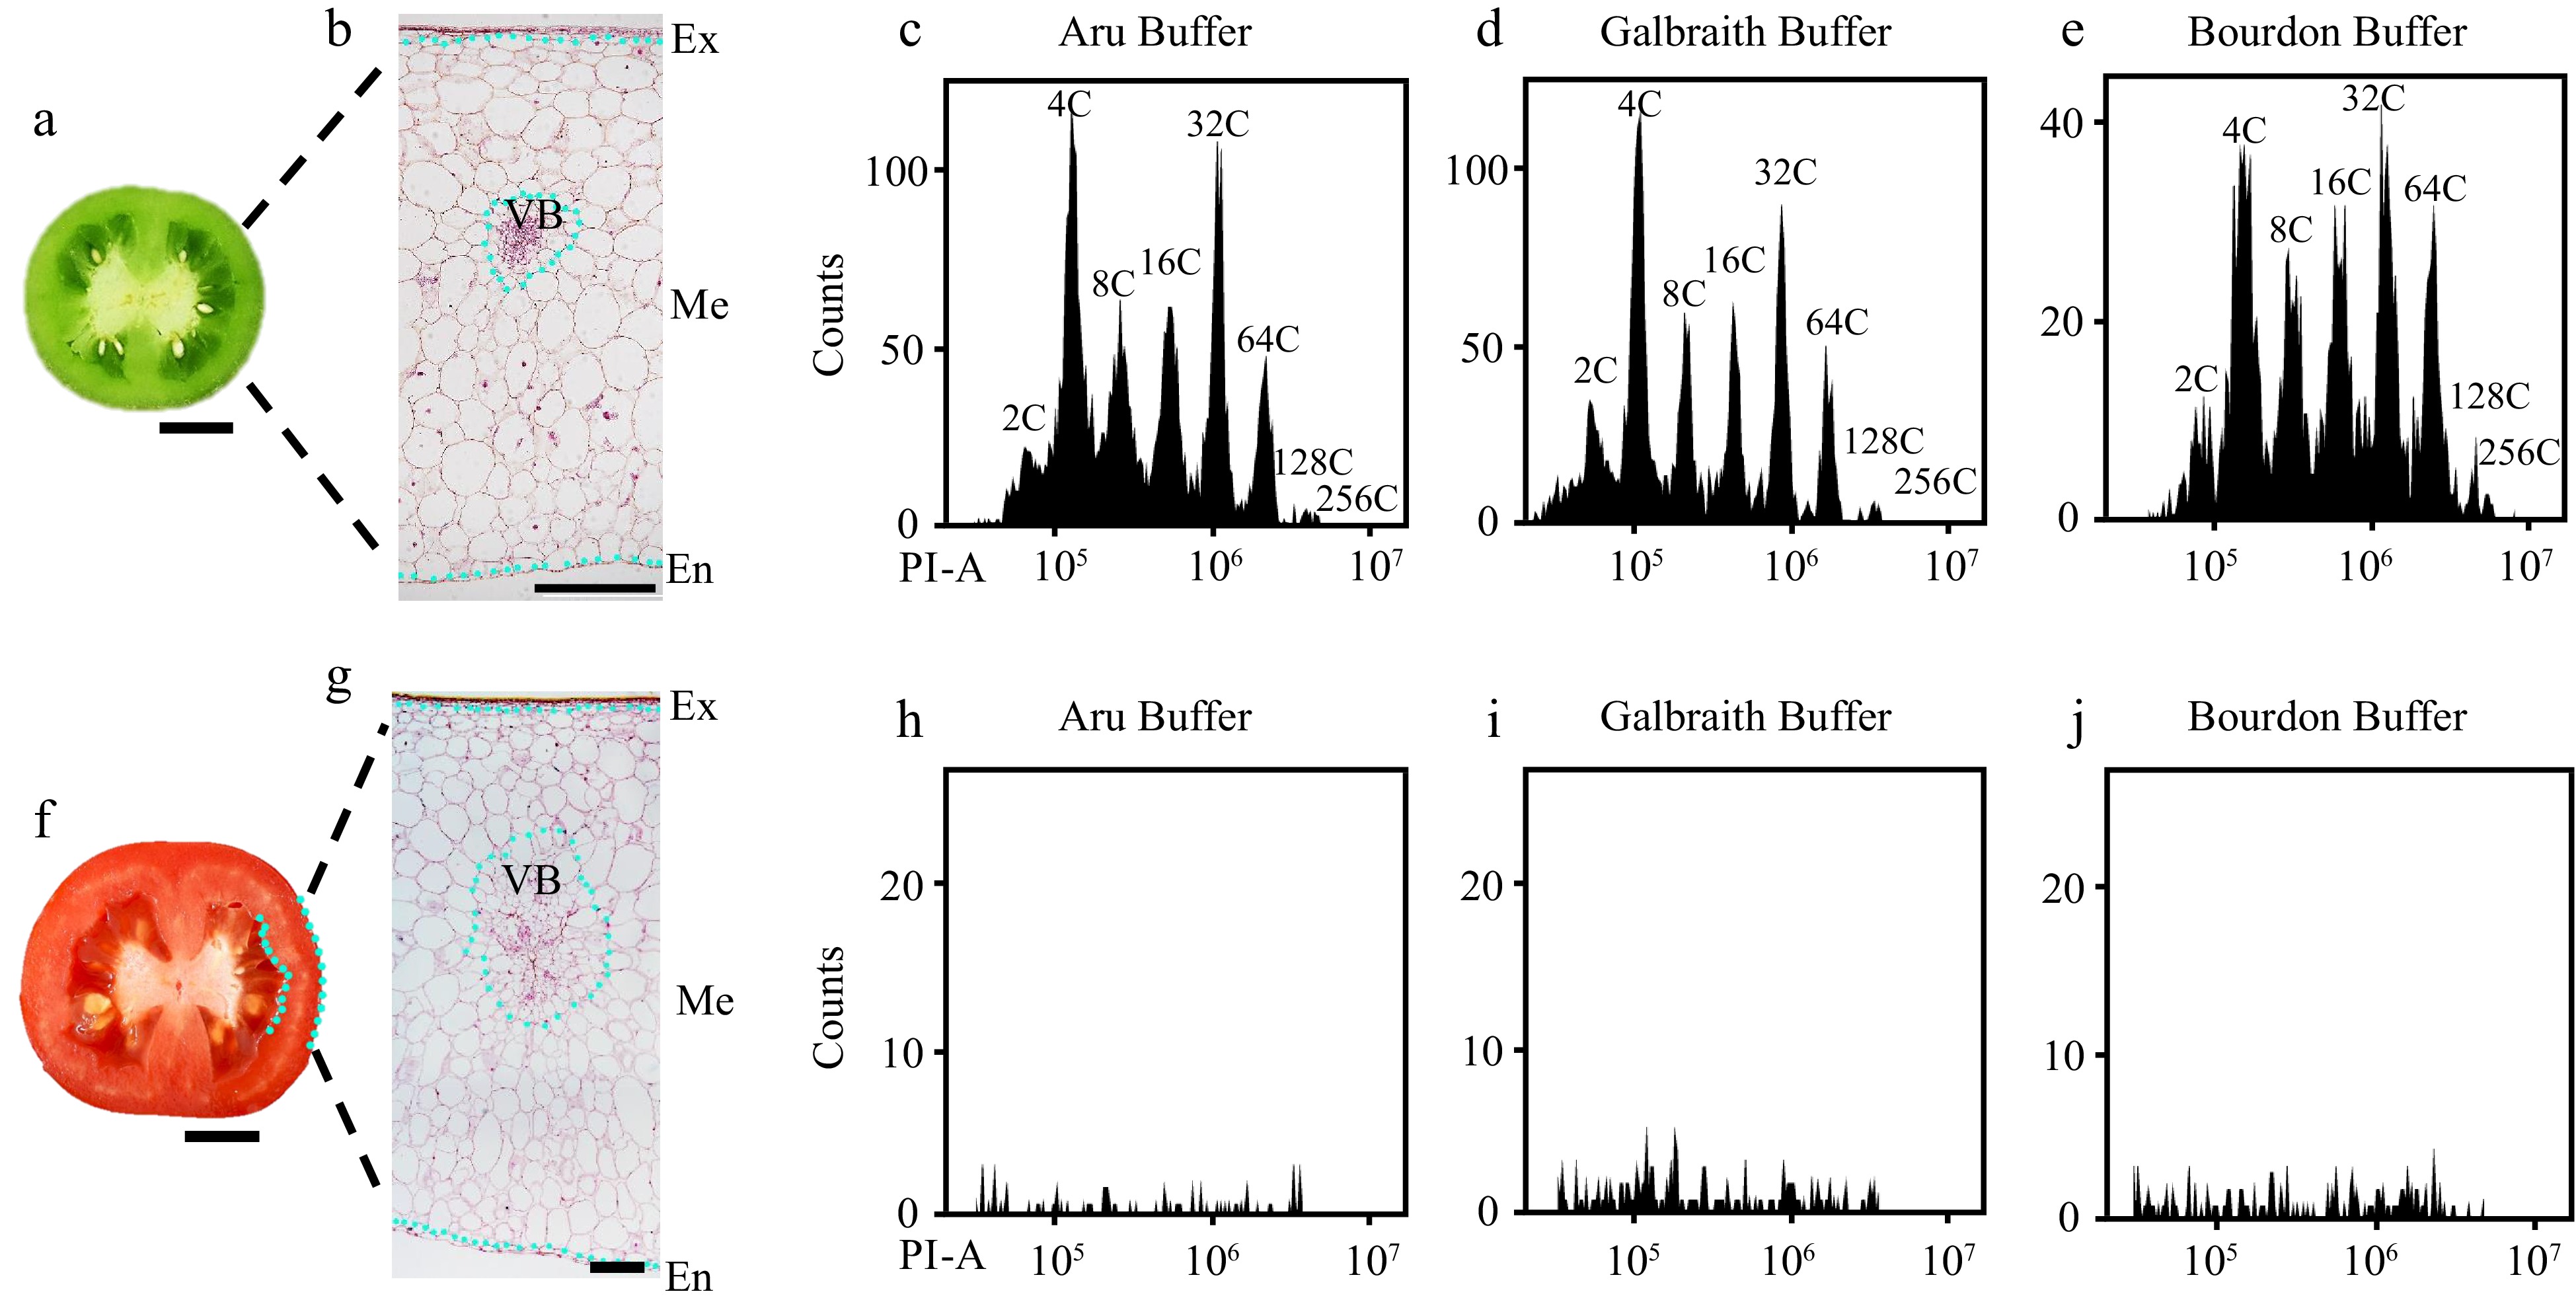
      Figure 1. 

      Flow cytometric analysis of nuclear DNA ploidy distribution in mesocarps of green and red ripe tomato fruit. Nuclei were isolated from mesocarps of 25 d after pollination (DPA) green (c)−(e) and 55 DPA red ripe tomato fruit (h)−(j) using 'Aru', 'Galbraith' and 'Bourdon' buffer. Nuclei were stained by propidium iodide (PI) at the final concentration of 50 µg/ml for flow cytometric analysis. (a), (f) Representative picture of the equatorial plane of (a) 25 DPA and (f) 55 DPA tomato fruit. Scale bar = 1 cm. (b), (g) Paraffin section of (b) 25 DPA and (g) 55 DPA tomato pericarp. Scale bar = 500 μm. (c)−(e) Histograms of nuclear DNA ploidy distribution in 25 DPA tomato mesocarps. (h)−(j) Histograms of nuclear DNA ploidy distribution in 55 DPA tomato mesocarps. Ex, exocarp; Me, mesocarp; En, endocarp; VB, vascular bundle; PI-A, PI fluorescence pulse signal area.

    • The method for extraction of protoplasts in tomato mesocarps was as performed in a previous study[39] with some modifications. Pieces of mesocarps were suspended in 20 ml of protoplast isolation solution containing 0.4 M mannitol, 20 mM KCl, 10 mM CaCl2, 20 mM 2-morpholinoethanesulfonic acid (MES), 2% sucrose, 1.5% 'Onozuka' R-10 cellulase (Yakult Pharmaceutical Co. Ltd., Tokyo, Japan), 0.4% macerozyme R-10 (Yakult Pharmaceutical Co. Ltd., Tokyo, Japan) and 0.05% pectinase (Yakult Pharmaceutical Co. Ltd., Tokyo, Japan), vacuumized for 30 min, and then kept in the dark at 25 °C for 12 h. An equal volume of W5 solution containing 0.15 M NaCl, 0.125 M CaCl2, 5 mM KCl, and 2 mM MES was added to the protoplast isolation solution, and the mixture was filtered through a 75 μm nylon mesh sieve. Protoplasts were collected from the filtrate by centrifugation at 500 rpm for 10 min, resuspended using 10 ml W5 solution and kept on ice for 30 min. Protoplast solution was further prepared by adding 2 ml MMg solution containing 0.4 M mannitol, 15 mM MgCl2 and 4 mM MES. For fluorescent microscopic analysis, DAPI was added to the protoplast solution at the final concentration of 1 µg/ml. For flow cytometric analysis, nuclei were isolated by adding equal volume of 'Aru' buffer to the protoplast solution, and stained by PI at the final concentration of 50 µg/ml.

    • Nuclei were stained by DAPI at the final concentration of 10 µg/ml and investigated by Nikon fluorescence microscope Eclipse Ni with the excitation wavelength of 328−375 nm under 4ⅹ and 10ⅹ magnification.

    • The resuspension solution of nuclei was transferred into a 10 ml round bottom centrifugation tube, and its pH value was measured using a pH meter (PHS-3C; INESA Scientific Instrument Co., Ltd).

    • All data were recorded in Excel. Statistical analysis was performed using one-way ANOVA test plus Duncan's multiple range test in the data processing system (DPS) software. Different letters indicate significant difference with p < 0.05.

    • Most studies on cell cycle in tomato fruit focus on developing stages and mature green stage, and do not extend to turning and red ripe stages[36,40,41]. In order to determine the nuclear DNA ploidy distribution in tomato red ripe fruit (55 DPA) mesocarps, we used three commonly used buffers including 'Aru' buffer, 'Galbraith' buffer and 'Bourdon' buffer to isolate nuclei for flow cytometric analysis. The sample processing follows the traditional protocol. The tomato pericarp was chopped in the lysis solution, and 50 μg/ml PI is directly added to the mixture after filtration to detection for 10 min[35,36]. Green fruits at 25 DPA had rigid pericarps with multiple layers of big cells in mesocarps, and all three buffers could successfully isolate nuclei from mesocarp cells for the determination of ploidy levels by a flow cytometer (Fig. 1ae). However, red ripe fruits at 55 DPA had soft pericarps and cells with dramatic size differences in mesocarps, and the flow cytometer failed to determine the nuclear DNA ploidy distribution in mesocarp cells (Fig. 1fj). To determine the reasons for poor nuclei isolation, we first isolated protoplasts from mesocarps of red ripe fruits as previously described[42]. Nuclei from 10 μl protoplast solution were stained by DAPI at the final concentration of 1 μg/ml and could be clearly detected under fluorescent microscope (Fig. 2a, b). Nuclei were extracted from 500 μl protoplast solution and stained by PI at a final concentration of 50 μg/ml for flow cytometric analysis. Flow cytometer detected nuclei with different ploidy levels, while a lot of debris affected the sensitivity and efficiency of detection resulting in 2C, 64C and 128C could not be clearly separated (Fig. 2c, d). Destruction of cellulose and pectin during the isolation of protoplasts prompted us to pretreat mesocarps with 1% cellulase and pectinase for 10 min. We isolated nuclei from pretreated mesocarps using Aru, Galbraith or Bourdon buffer, and no nuclei isolated from sole water pretreated mesocarp cells could be detected by the flow cytometer (Supplemental Fig. S1a). However, nuclei isolated in Bourdon buffer from cellulase and pectinase pretreated mesocarp cells could be detected by the flow cytometer with low efficiency (Supplemental Fig. S1b). These results suggested that pretreatment with cellulase and pectinase was not an effective way for nuclear DNA ploidy distribution analysis via the flow cytometer.
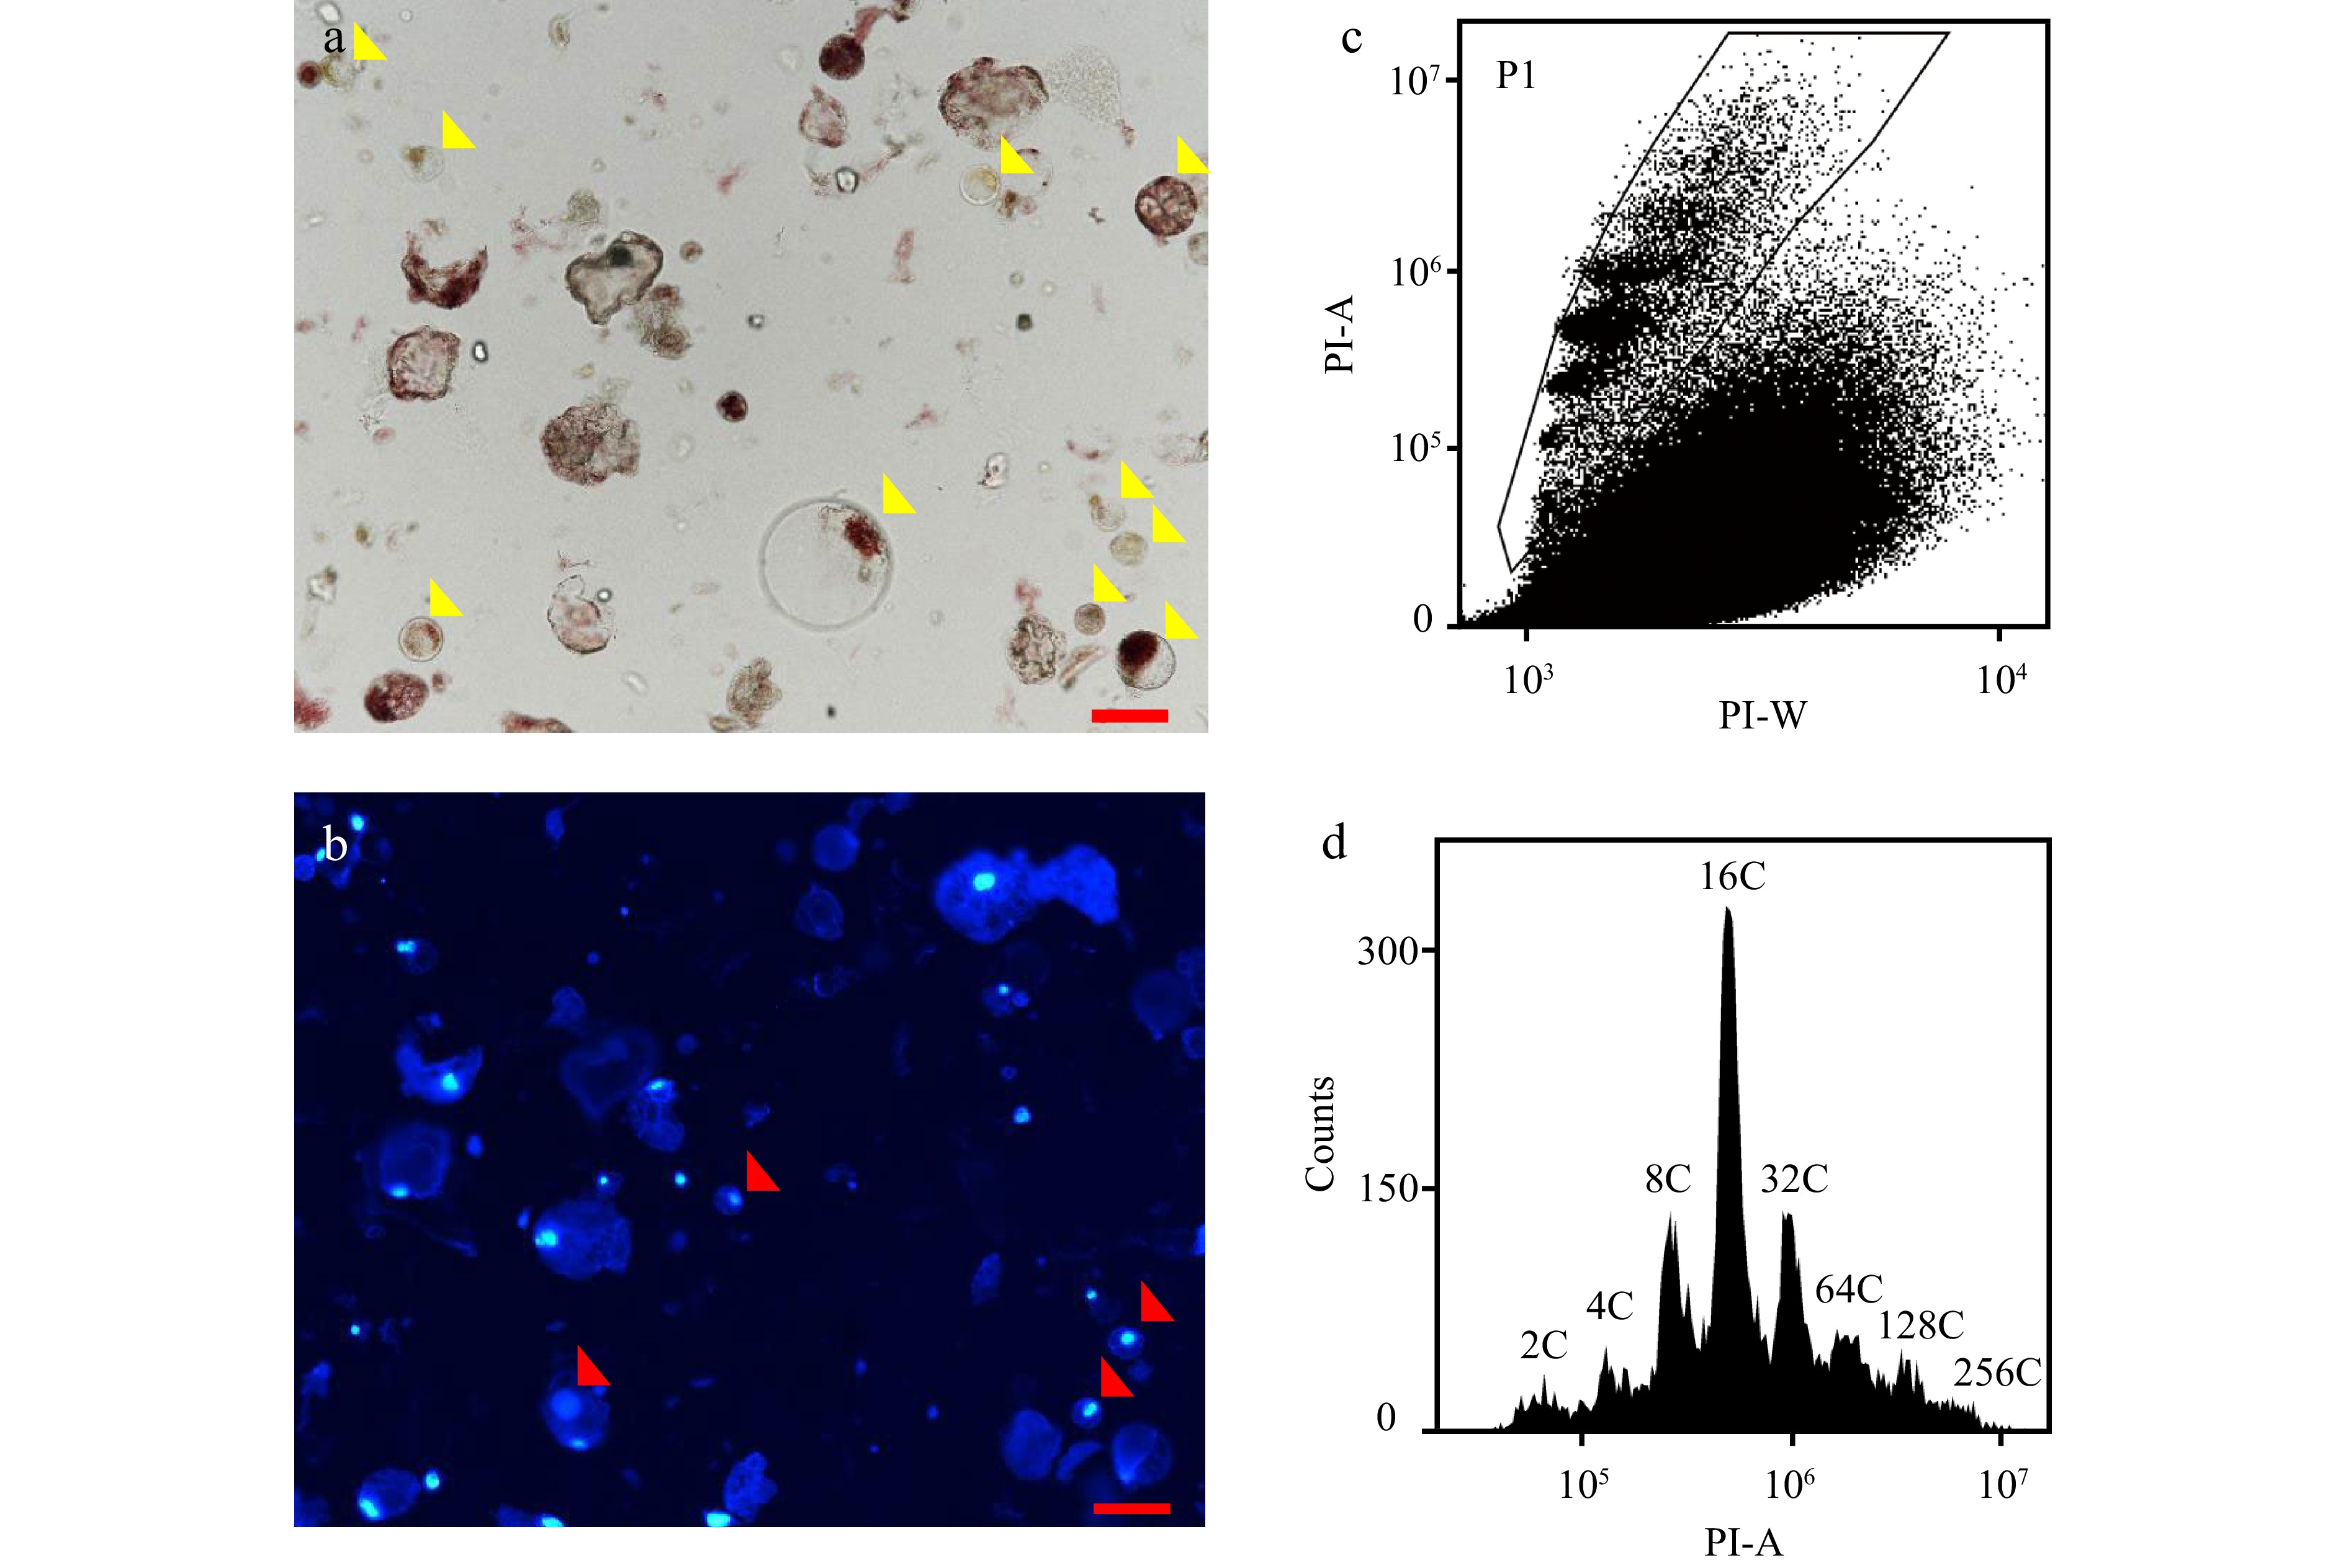
      Figure 2. 

      Flow cytometric analysis of nuclear DNA ploidy distribution in protoplasts isolated from mesocarps of red ripe tomato fruit. (a) Microscopic examination of protoplasts isolated from 55 DPA tomato mesocarps. Yellow arrows indicate intact protoplasts. Scale bar = 100 μm. (b) Examination of nuclei in protoplasts under fluorescent microscope. Red arrows indicate nuclei. Nuclei were stained by 4’,6-diamidino-2-phenylindole (DAPI) at the final concentration of 1 µg/ml. Scale bar = 100 μm. (c), (d) Scatter plot and histogram of nuclear DNA distribution in flow cytometric analysis using nuclei isolated from protoplasts by 'Aru' buffer and stained by PI at a final concentration of 50 µg/ml . PI-A and PI-W represent PI fluorescence pulse signal area and width.

    • We harvested nuclei from the filtered lysate in different nucleus isolation buffers by centrifugation (Fig. 3a). Nuclei were resuspended by water or its original nucleus isolation buffer, and water improved the detection efficiency of flow cytometer especially for nuclei isolated by 'Aru' buffer (Supplemental Fig. S2). We resuspended the pellet of nuclei with 'Aru' buffer and stained nuclei with DAPI. Fluorescence microscopic analyses revealed that many nuclei were aggregated and surrounded by debris (Fig. 3b, c). We then resuspended the pellet with five different buffers adjusted at pH 7.4 including HEPES, MOPS, Tris, phosphate (PB) and phosphate buffered saline (PBS) buffer (Fig. 4). 'Aru' buffer contains HEPES, and both 'Galbraith' and 'Bourdon' buffer contain MOPS. Interestingly, resuspended nuclei with each buffer could be effectively detected by flow cytometer. For nuclear DNA ploidy distribution analysis, HEPES buffer resuspended nuclei isolated in Aru buffer not Galbraith and Bourdon buffer, had clear separation of each peak with specific ploidy level (Fig. 4a). Either MOPS buffer or PB buffer resuspended nuclei had clear separation of peaks with high ploidy levels but not low ploidy levels such as 2C, 4C and 8C (Fig. 4b, d). Tris buffer resuspended nuclei isolated in Aru buffer or Galbraith buffer, not Bourdon buffer, had clear separation of each peak with specific ploidy level, but the proportion of low ploidy levels was less than that of high ploidy levels suggesting a nuclear aggregation (Fig. 4c). PBS buffer resuspended nuclei isolated in any of three buffers had clear separation of each peak at specific ploidy level (Fig. 4d). The proportion of nuclei at each ploidy level did not exhibit significant difference among the three buffers resulting in similar EI values (Table 1). Moreover, fluorescence microscopic analyses of nuclei resuspended by PBS buffer revealed that nuclei were separated and disassociated with debris (Fig. 3d, e) Aru buffer could retrieve 2- and 1.3-fold more nuclei than Galbraith and Bourdon buffer respectively, while the flow cytometer had the highest detection efficiency for nuclei isolated by Bourdon buffer (Table 1). Therefore, our results revealed that the utilization of PBS buffer to resuspend nuclei is effective for the flow cytometer to determine nuclear DNA ploidy distribution in mesocarp cells of red ripe tomato fruit.
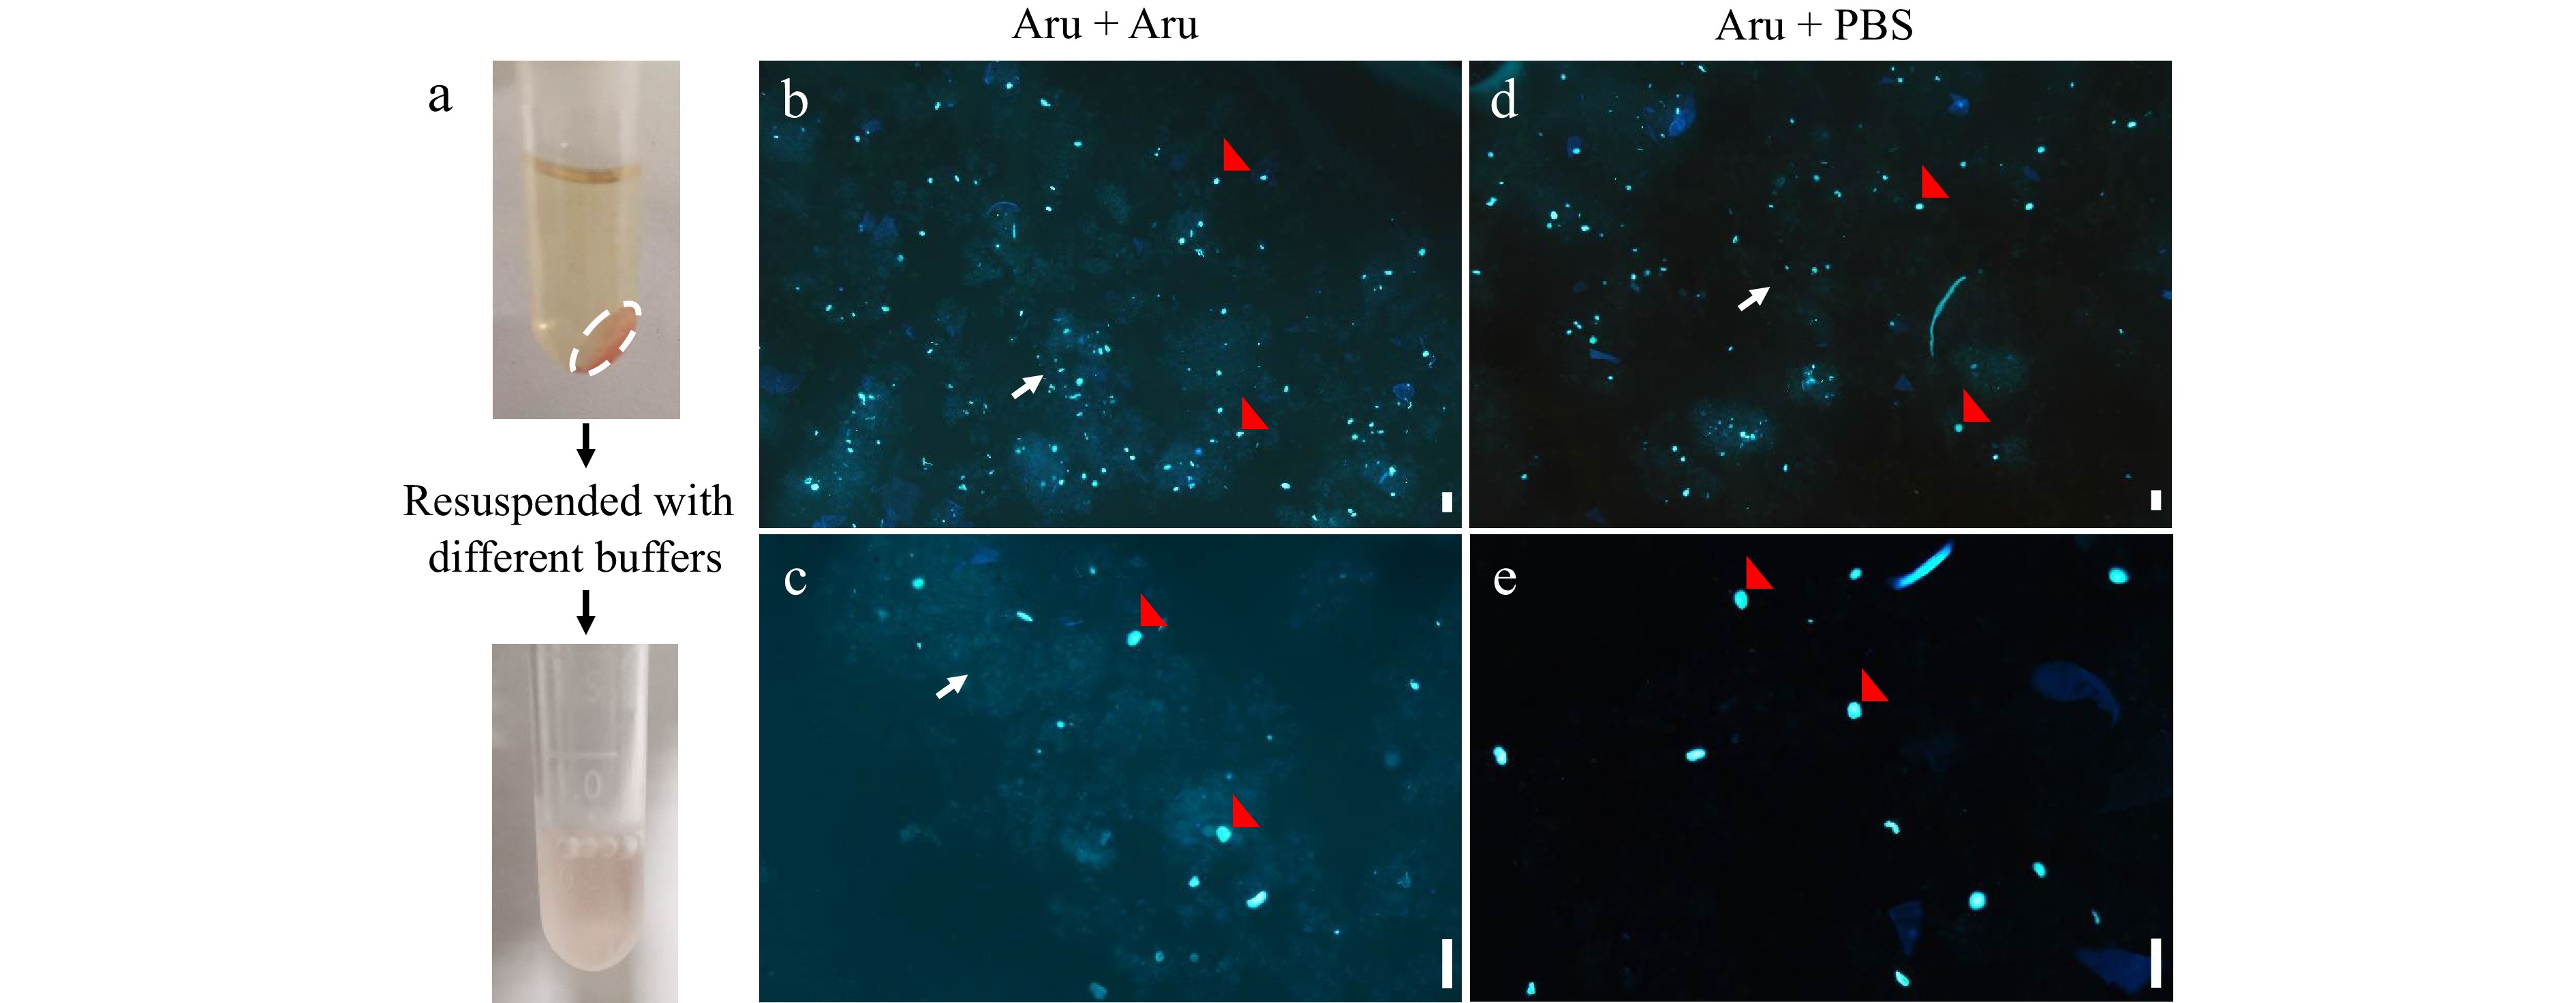
      Figure 3. 

      Fluorescence microscopic analyses of nuclei resuspended by different buffers. Nuclei were isolated from mesocarps of 55 DPA red ripe tomato fruit using 'Aru' buffer and resuspended by 'Aru' (b), (c) or Phosphate Buffered Saline (PBS) buffer (d), (e). (a) The pellet of nuclei (white dashed circle) were collected by centrifugation and resuspended. (b)−(e) Fluorescence microscopic analyses of nuclei stained by DAPI under (b), (d) 4× and (c), (e) 10× magnification. Scale bar = 100 μm. Red arrows indicate nuclei, and white arrows indicate debris.
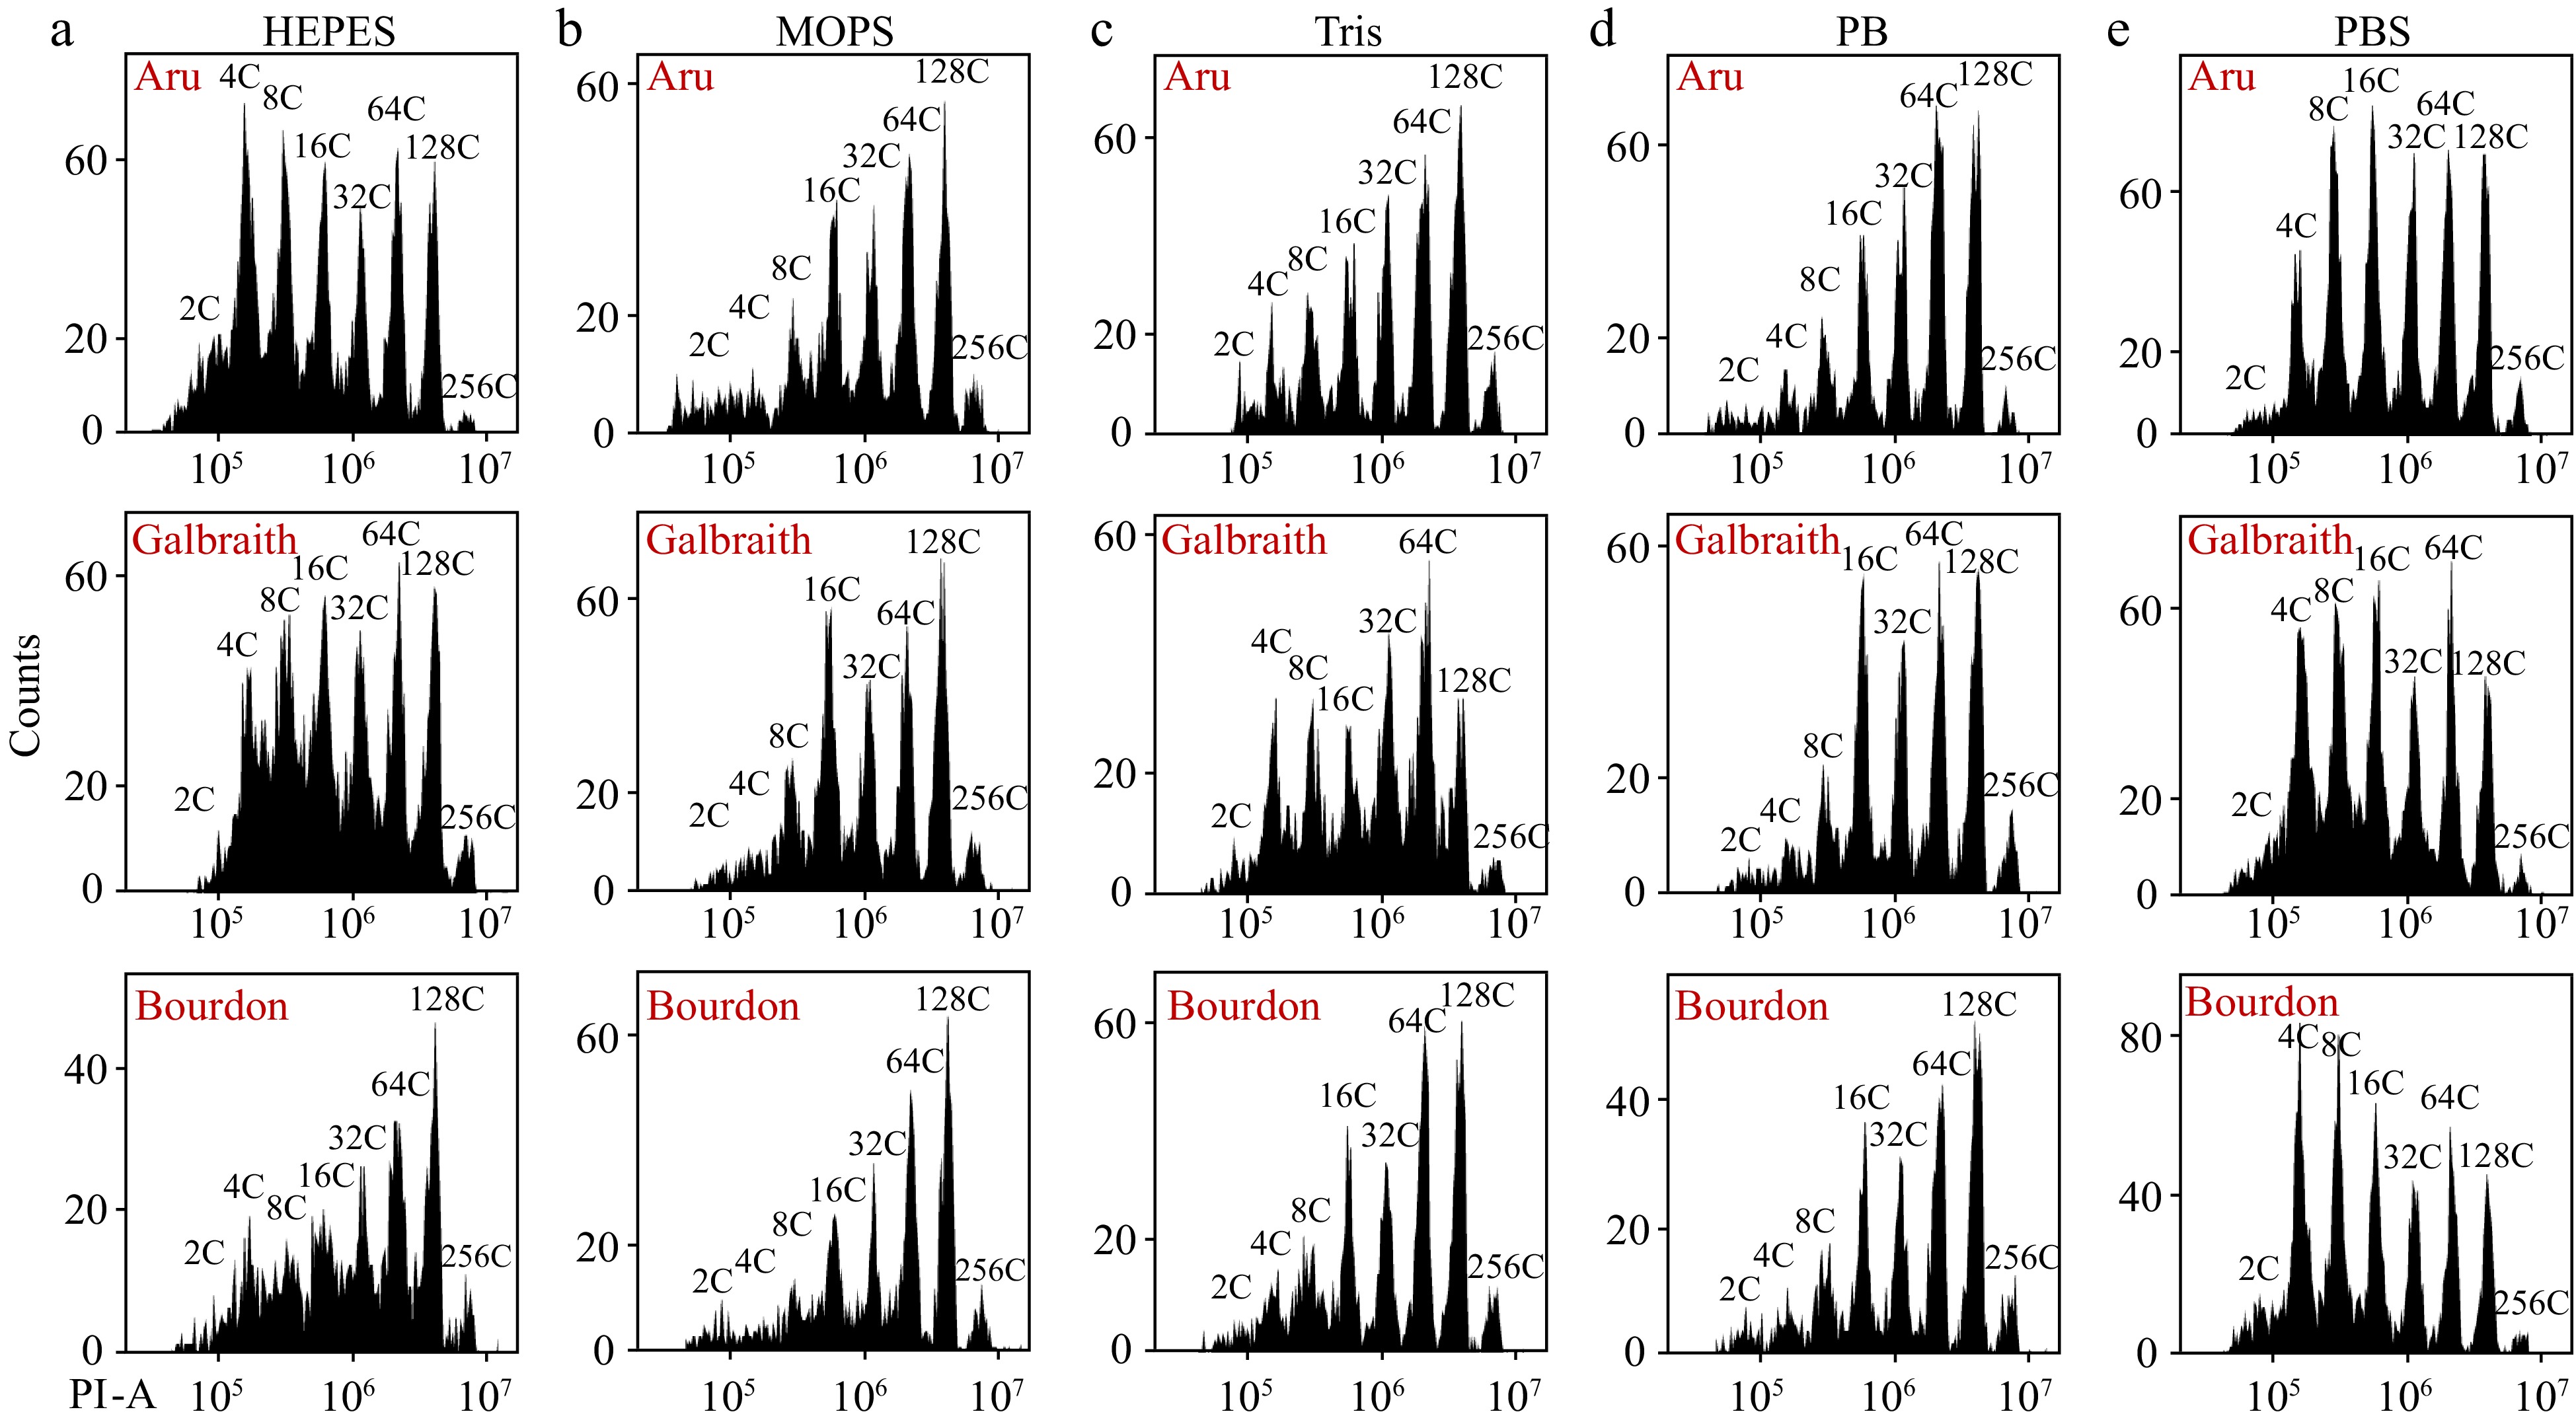
      Figure 4. 

      Different resuspension buffers of nuclei have distinct effects on flow cytometric analysis. Nuclei were isolated from mesocarps of 55 DPA red ripe tomato fruit using 'Aru', 'Galbraith' and 'Bourdon' buffer. Nuclei were harvested by centrifugation, resuspended by (a) HEPES, (b) MOPS, (c) Tris, (d) Phosphate or (e) PBS buffer, and stained by PI at a final concentration of 50 µg/ml. Shown are histograms of flow cytometric analyses. PI-A, PI fluorescence pulse signal area.

      Table 1.  Impacts of different isolation buffers with PBS buffer resuspension of nuclei on the nuclear DNA ploidy distribution in the mesocarp of red ripe tomato fruit.

      TreatmentNuclear DNA ploidy distributionEI ValueNumber
      of nuclei
      Efficiency value
      2C4C8C16C32C64C128C256C
      Aru + PBS4.25 ± 0.40%b11.05 ± 0.38%b12.57 ± 0.40%a11.63 ± 0.76%b17.86 ± 1.17%a25.48 ± 0.92%a14.93 ± 0.24%a2.22 ± 0.40%a3.75 ± 0.02a4312 ± 254a0.39 ± 0.02%b
      Gal + PBS3.68 ± 0.46%b13.39 ± 0.93%a13.81 ± 0.92%a12.76 ± 0.12%b19.38 ± 0.83%a21.72 ± 0.66%b13.01 ± 1.74%a2.24 ± 0.68%a3.59 ± 0.10a2133 ± 118c0.16 ± 0.01%c
      Bou + PBS5.35 ± 0.21%a12.14 ± 0.71%ab12.18 ± 0.57%a14.14 ± 0.61%a19.12 ± 0.21%a21.24 ± 1.23%b13.24 ± 0.24%a2.55 ± 0.23%a3.59 ± 0.05a3442 ± 130b0.58 ± 0.05%a
      Different letters indicate significant difference with p < 0.05 determined by one-way ANOVA plus Duncan's multiple range test.
    • To investigate whether PBS buffer resuspension of nuclei affects the nuclear DNA ploidy distribution, we isolated nuclei from green fruit (25 DPA) mesocarp cells using three different buffers for flow cytometric analysis with or without PBS buffer resuspension. Nuclei isolated in Aru, Galbraith and Bourdon buffer with or without PBS buffer resuspension were clearly separated at different ploidy levels in flow cytometric analysis, and Aru or Bourdon buffer isolated nuclei after PBS resuspension were much cleaner and less affected by debris (Fig. 5). The flow cytometer had enhanced detection of nuclei with high ploidy levels especially 128C and 256C after PBS resuspension, and had better detection efficiency for nuclei isolated in either Aru or Bourdon buffer (Table 2). The nuclear DNA ploidy distribution in nuclei isolated by either Aru or Bourdon buffer was not altered after PBS buffer resuspension resulting in similar EI values, while PBS resuspension increased the proportion of 128C and 256C in nuclei isolated by Galbraith buffer resulting in a slight increase of EI value. Again, Aru buffer retrieved significantly more nuclei than Galbraith and Bourdon buffer. Taken together, our results suggest that the nuclear DNA ploidy distribution in mesocarp cells of tomato fruit at all developmental stages can be accurately determined by a flow cytometer using nuclei isolated by Aru buffer and resuspended by PBS buffer.
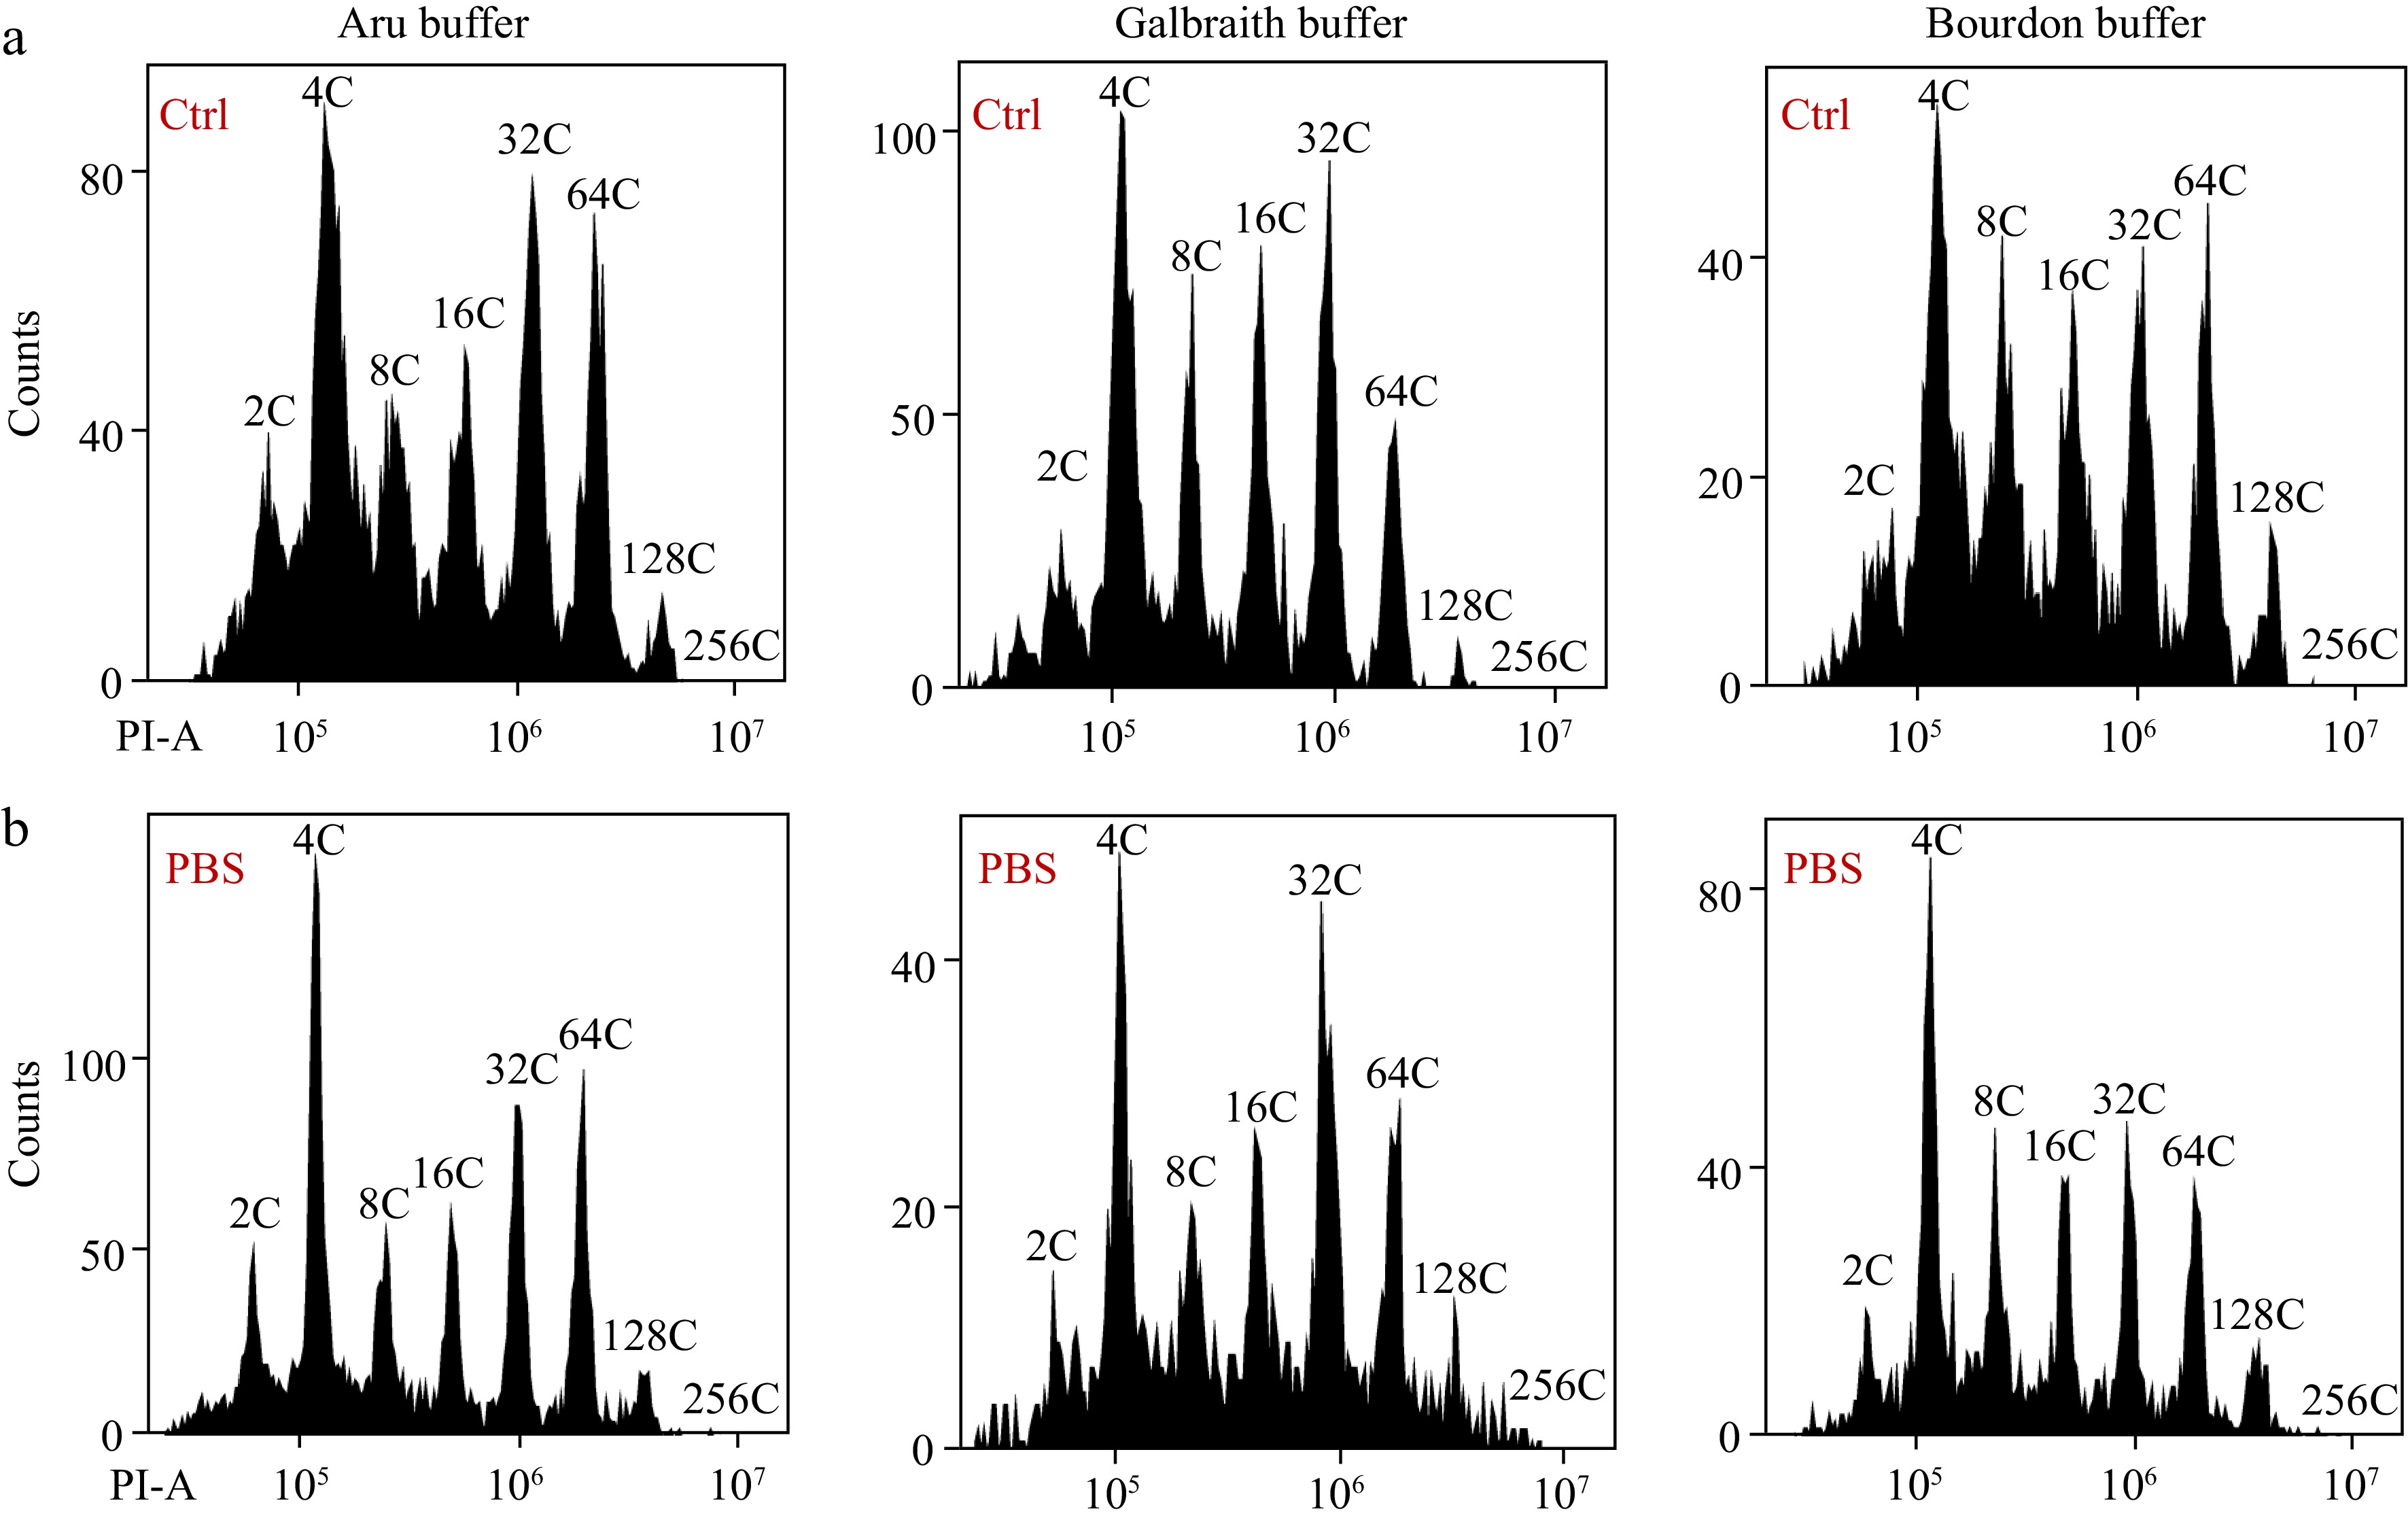
      Figure 5. 

      Effects of PBS buffer resuspension on the nuclear DNA ploidy distribution in mesocarps of green tomato fruits. (a) Nuclei were isolated from mesocarps of 25 DPA green tomato fruit using 'Aru', 'Galbraith' and 'Bourdon' buffer and directly used for flow cytometric analysis. (b) Isolated nuclei in (a) were harvested by centrifugation and resuspended in PBS buffer. All nuclei were stained by PI at a final concentration of 50 µg/ml. Shown are histograms of flow cytometric analyses. PI-A, PI fluorescence pulse signal area.

      Table 2.  Impacts of different isolation buffers with or without PBS buffer resuspension of nuclei on the nuclear DNA ploidy distribution in the mesocarp of green tomato fruit.

      TreatmentNuclear DNA ploidy distributionEI ValueNumber
      of nuclei
      Efficiency value
      2C4C8C16C32C64C128C256C
      Aru7.88 ± 0.58%bc27.11 ± 0.30%a13.70 ± 1.57%bc14.76 ± 1.86%ab20.98 ± 1.28%a13.56 ± 2.71%a2.02 ± 0.26%bc0c2.63 ± 0.06bc3450 ± 102a0.81 ± 0.05%b
      Aru + PBS10.37 ± 0.23%a27.35 ± 0.57%a12.47 ± 1.26%c13.45 ± 1.28%b19.01 ± 0.98%ab14.07 ± 2.01%a3.11 ± 1.03%abc0.17 ± 0.14%bc2.59 ± 0.07bc2968 ± 449a1.01 ± 0.15%b
      Gal9.39 ± 1.48%ab27.57 ± 1.47%a13.82 ± 0.48%bc16.40 ± 1.48%a20.48 ± 0.97%a10.78 ± 0.59%a1.56 ± 0.12%c0c2.50 ± 0.09c2979 ± 125a1.38 ± 0.11%a
      Gal + PBS7.56 ± 0.53%c23.23 ± 1.60%b13.03 ± 0.81%c15.19 ± 0.83ab21.14 ± 1.14%a13.82 ± 1.07%a5.19 ± 0.49%a0.84 ± 0.32%a2.86 ± 0.05a1676 ± 225b0.94 ± 0.06%b
      Bou7.82 ± 1.00%bc24.65 ± 0.66%b16.57 ± 1.23%a16.27 ± 0.33%a16.17 ± 1.91%bc14.00 ± 0.67%a4.42 ± 1.70%ab0.10 ± 0.11%c2.69 ± 0.08b1922 ± 37b0.81 ± 0.09%b
      Bou + PBS7.45 ± 0.57%c27.87 ± 0.56%a15.70 ± 0.96%ab14.71 ± 0.26%ab15.62 ± 2.35%c13.05 ± 1.09%a4.97 ± 1.99%a0.64 ± 0.46%ab2.65 ± 0.07b2064 ± 214b1.56 ± 0.20%a
      Different letters indicate significant difference with p < 0.05 determined by one-way ANOVA plus Duncan's multiple range test.
    • To determine whether pH value in nuclei resuspension buffer is important for flow cytometric analysis, we adjusted the pH value of PBS buffer to 5.4, 7.4 and 9.0 to resuspend nucleus solutions for flow cytometric analysis. We first chopped the mesocarp of red ripe tomato fruit in 'Aru' buffer with a pH value of 6.0 and filtrated lysates with sieves. We measured the pH value of the filtrate which was about 4.0. We collected nuclei from the filtrate by centrifugation and then resuspended them with PBS buffers at different pH values, and observed that nuclei in PBS buffer at either pH value could be clearly separated and detected at each ploidy level by a flow cytometer. However, PBS buffer of pH 5.4 retrieved slightly less nuclei with higher ploidy levels than that of pH 7.4 and 9.0 resulting in significant reduction of EI values (Fig. 6ac, Table 3). Overall, PBS buffer with high pH value retrieved more nuclei than low pH value (Table 3). A pH value of 7.4 and 9.0 did not affect the detection efficiency of flow cytometry and nuclear ploidy distribution (Table 3). The combined results suggest that PBS buffer with a high pH value may facilitate the separation of nuclei from debris for accurate flow cytometric analysis.
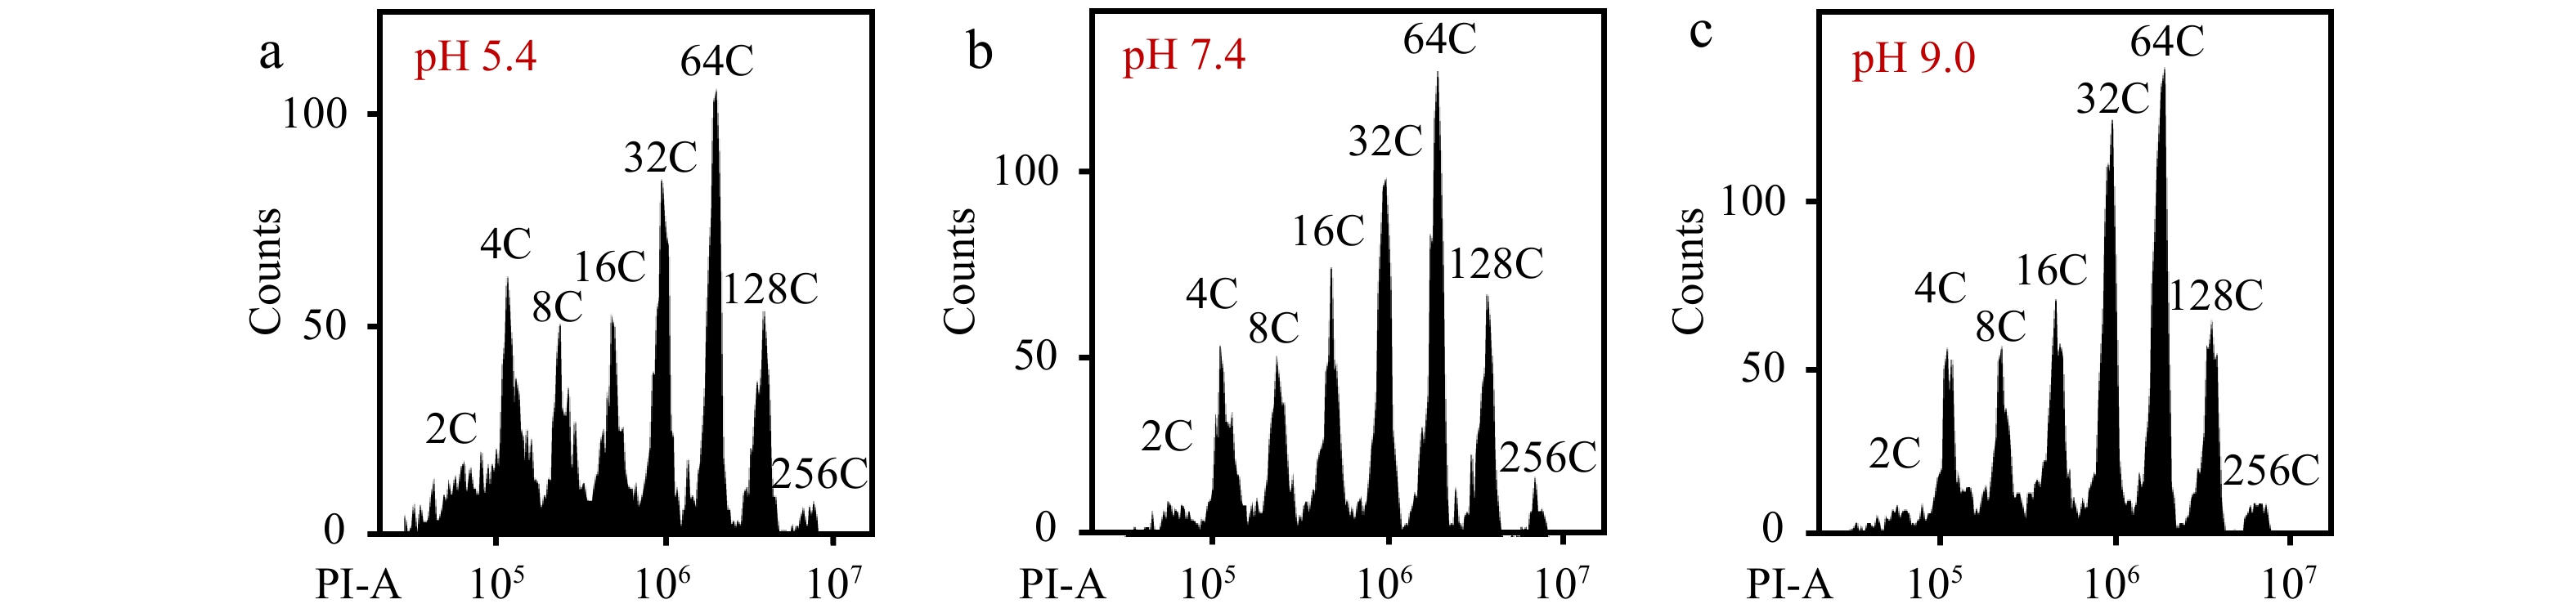
      Figure 6. 

      The pH value of PBS buffer affects the detection of flow cytometer. Nuclei from mesocarp cells of red ripe tomato fruits were isolated in 'Aru' buffer, harvested by centrifugation and resuspended by PBS buffer with a pH value of (a) 5.4, (b) 7.4 and (c) 9.0. All nuclei were stained by PI at a final concentration of 50 µg/ml. Shown are histograms of flow cytometric analyses. PI-A, PI fluorescence pulse signal area.

      Table 3.  Impacts of different pH values of PBS buffer on the nuclear DNA ploidy distribution in the mesocarp of red ripe tomato fruit.

      TreatmentNuclear DNA ploidy distributionEI ValueNumber
      of nuclei
      Efficiency value
      2C4C8C16C32C64C128C256C
      PBS (pH 5.4)5.22 ± 0.79a14.72 ± 0.24a11.93 ± 0.36a12.75 ± 0.77b19.95 ± 0.42b22.56 ± 0.78b11.63 ± 1.18a1.22 ± 0.27b3.48 ± 0.01b3058 ± 104c0.43 ± 0.01a
      PBS (pH 7.4)3.11 ± 0.14b11.10 ± 0.45b11.27 ± 0.25ab13.65 ± 1.11a21.69 ± 1.05a24.75 ± 1.03a12.40 ± 0.56a2.02 ± 0.19a3.74 ± 0.03a3339 ± 14b0.37 ± 0.01b
      PBS (pH 9.0)2.60 ± 0.14b10.44 ± 0.22b10.76 ± 0.32b14.25 ± 0.12a22.57 ± 0.48a25.63 ± 0.27a11.77 ± 0.16a1.96 ± 0.05a3.78 ± 0.02a3598 ± 36a0.38 ± 0.01b
      Different letters indicate significant difference with p < 0.05 determined by one-way ANOVA plus Duncan's multiple range test.
    • Tomato fruit development is a consequence of active cell cycle progression including mitotic cell cycle and endocycle, which controls cell division and cell expansion, respectively. Previous studies on the connection between cell cycle regulation and tomato fruit growth and development mainly focus on stages before or at the mature green. The endocycle plays a dominant role in tomato fruit expansion, while its progression and roles in tomato fruit after the mature green stage remains largely unknown. The traditional method to analyze the nuclear DNA ploidy distribution in vegetative tissues or green tomato fruit using a flow cytometer is less effective and unstable for fruits after mature green stages. Here we establish a protocol to effectively and accurately analyze the nuclear DNA ploidy distribution in red ripe fruit mesocarp cells using a flow cytometer. Resuspending nuclei with PBS buffer is critical for the separation between nuclei and debris, resulting in an effective detection of the flow cytometer. Our results can also facilitate cell cycle related studies or ploidy determination in organs of other crops with difficulties via flow cytometric analysis.

      At the end of the cell expansion phase, the single cell volume of the mesocarp increased 30,000 times compared to the initial cell volume[10], which is closely related to the endocycle. However, there is no evidence linking the endocycle to fruit ripening possibly due to the technical limitation of endocycle analysis using a flow cytometer. Fruit ripening is associated with the changes of cell wall structure and accumulation of secondary metabolites such as cellulose, saccharide and pectin, which may hinder the isolation of nuclei for flow cytometric analysis[22,26,28]. In order to solve this problem, we first adopted the method of extracting protoplasts, in which cell walls and pectin are destroyed and cells are released. As expected, the flow cytometer detects nuclei at different ploidy levels especially 8C, 16C, 32C with substantial enrichment suggesting that cellulose, pectin and other substances are barriers for the separation of nuclei. However, protoplast isolation causes loss of cells and nuclei from broken cells, which results in the alteration of nuclear DNA ploidy distribution. The preparation of protoplast is also time- and labor-consuming, and therefore more costly. To remove barriers influencing nucleus isolation, we filter mesocarp lysates twice through a 425 μm steel mesh sieve and a 75 μm nylon mesh sieve, and harvest nuclei by centrifugation. We observed a large number of nuclei surrounded by debris after DAPI staining under fluorescent microscope, which prompts us to use different buffers to resuspend the nucleus pellet and release nuclei. This strategy drastically improves the detection of the flow cytometer, and resuspension of nucleus pellet with PBS buffer has better effects than other buffers on flow cytometric analysis of nuclear DNA ploidy distribution. PBS buffer is usually used to resuspend animal cells prior to flow cytometric analysis[43,44]. In our study, we confirm that PBS buffer resuspension of nuclei does not alter the nuclear DNA ploidy distribution in green fruit mesocarp cells during flow cytometric analysis, suggesting that this method is accurate and suitable for all developmental stages of tomato fruit cells. PBS disperses the nuclei encased in debris, and the detection efficiency of the flow cytometer increases with the rising pH value. Considering that high pH value may cause damage to the tube line of the flow cytometer, we recommend the neutral buffer of PBS (pH 7.4) for long-term analysis.

      To summarize our method, we produced a workflow for the detection of nuclear DNA ploidy distribution in mesocarp cells of red ripe tomato fruits using a flow cytometer (Fig. 7). Firstly, 0.5 g or so equatorial mesocarp tissues are placed in a plastic petri dish containing 1 ml of 'Aru' buffer, and then chopped into fine pieces with a razor blade. Secondly, the lysate of mesocarps is initially filtered through a 425 μm steel mesh sieve, and then filtered through a 75 μm nylon mesh sieve. The filtrate is centrifuged at 5000 rpm for 5 min to collect pellets and discard the supernatant. The pellet containing nuclei is resuspended with 500 μl of PBS buffer (pH 7.4). Finally, the resuspension solution is stained with PI at the final concentration of 50 μg/ml and analyzed by a flow cytometer.
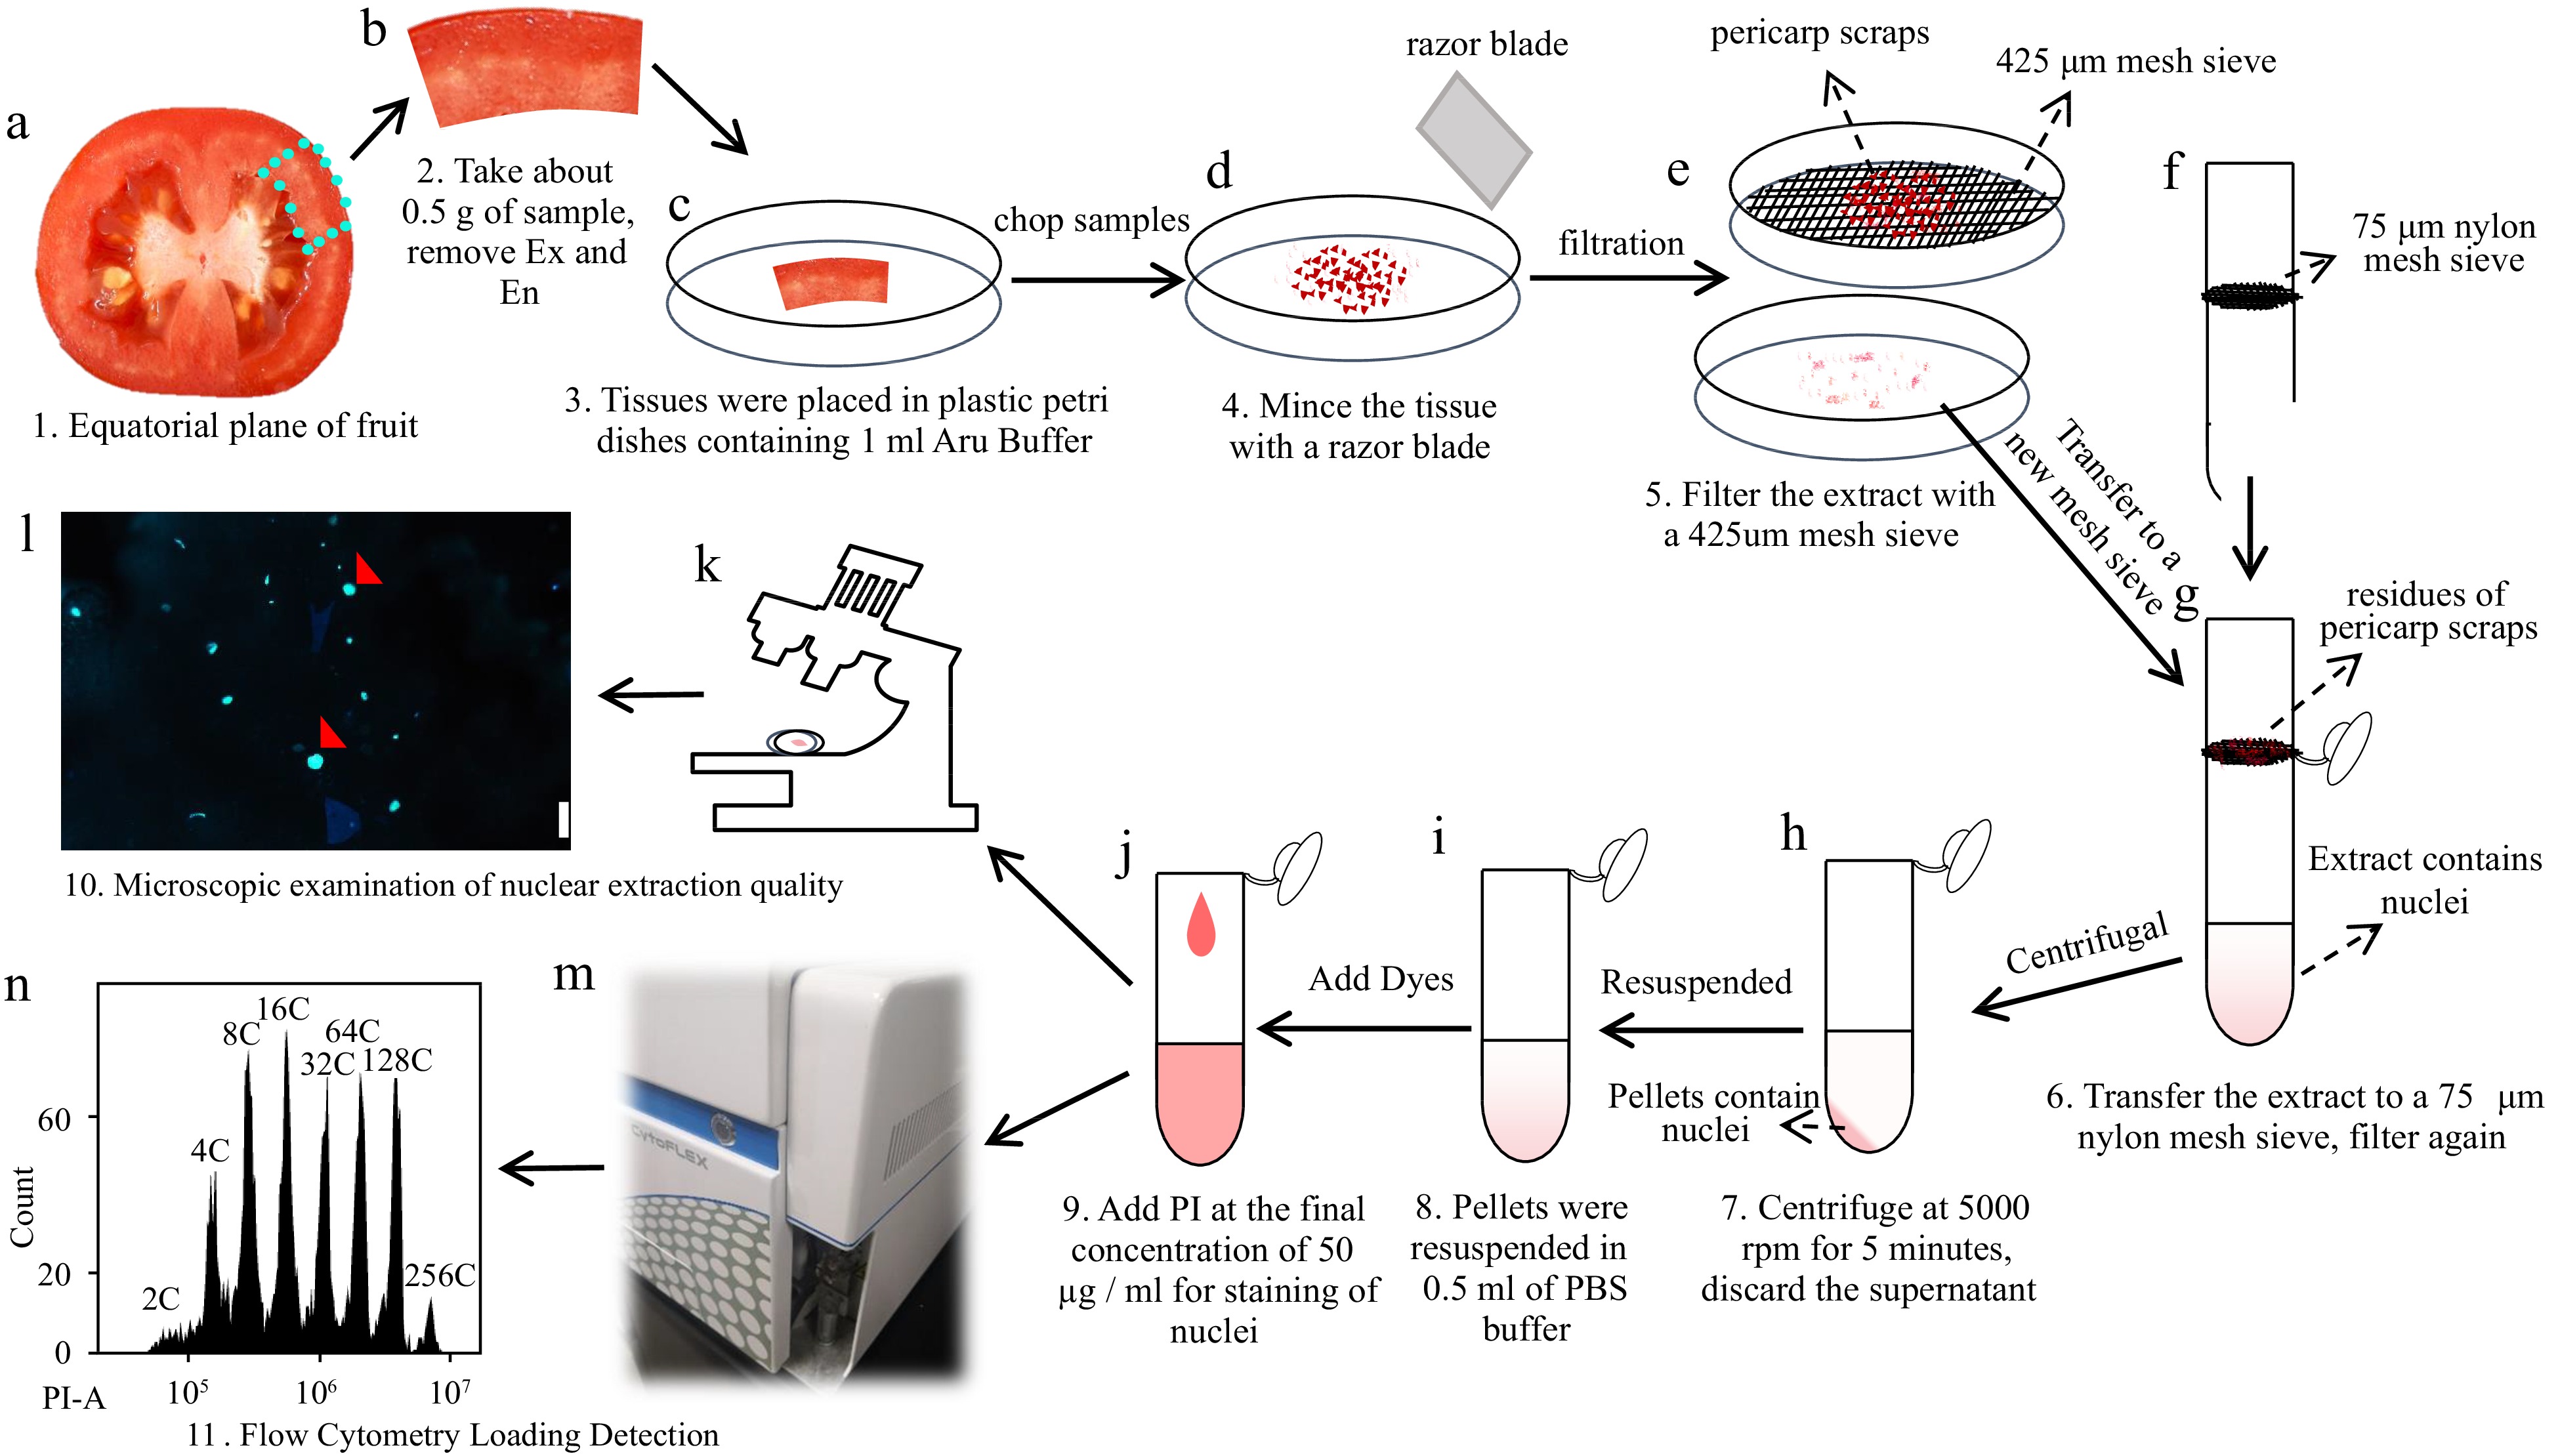
      Figure 7. 

      Workflow diagram illustrating the detection of nuclear DNA ploidy distribution in tomato mesocarp using a flow cytometer. (a)-(d) About 0.5 g of the equatorial mesocarp is taken and chopped into pieces with a razor blade in a plastic petri dish containing 1 ml of 'Aru' buffer. (e)-(g) Lysates were filtered through a 425 μm steel mesh sieve and a 75 μm nylon mesh sieve sequentially. (h), (i) The filtrate is centrifuged at 5000 rpm for 5 min and the supernatant is discarded. The pellet of the nuclei is resuspended using 500 μl PBS buffer (pH 7.4). (j)-(n) PI is added to the resuspended solution at a final concentration of 50 µg/ml for flow cytometric analysis.

      Recently single-cell or single-nucleus sorting techniques are increasingly used to decipher functions of cells with different ploidy levels or in different tissues of various plant species[4550]. In tomato, single-nuclear sorting technology and in situ hybridization are applied to illustrate the developmental regulation and metabolite accumulation in cells with different ploidy levels at the mature green stage[36,40,41]. The technical breakthrough in our method not only facilitates the detection of nuclear DNA ploidy distribution in cells of other fleshy fruits (eg, grapes, strawberries, etc), but also the sorting of nuclei with different ploidy levels in ripe fruits to study the relationship between endocycle and intracellular events.

      • This research was supported by National Natural Science Foundation of China (31872951 to Zhilong Bao, 31872952 to Fangfang Ma), and Taishan Scholar Foundation of Shandong Province (tsqn201812034) for Zhilong Bao. We thank Tomato Genetics Resource Center (TGRC) for providing tomato seeds. We thank plant growth facility members in the State Key Laboratory of Crop Biology at Shandong Agricultural University (China).

      • The authors declare that they have no conflict of interest.

      • Supplemental Fig. S1 Effect of cellulase and pectinase on nucleus isolation. Mesocarps of 55 DPA red ripe tomato fruit were pretreated in water without (a) or with (b) cellulase and pectinase for 10 minutes. Nuclei were isolated from pretreated mesocarps using “Aru”, “Galbraith” and “Bourdon” buffer for flow cytometric analysis. Shown are histograms of flow cytometric analyses. PI-A, PI fluorescence pulse signal area.
      • Supplemental Fig. S2 Effects of nucleus resuspension on flow cytometric analysis. Nuclei were isolated from mesocarps of 55 DPA red ripe tomato fruit using “Aru”, “Galbraith” and “Bourdon” buffer, harvested by centrifugation and resuspended by water (a) or original nucleus isolation buffers (b) for flow cytometric analysis. Shown are histograms of flow cytometric analyses. PI-A, PI fluorescence pulse signal area.
      • Copyright: © 2023 by the author(s). Published by Maximum Academic Press, Fayetteville, GA. This article is an open access article distributed under Creative Commons Attribution License (CC BY 4.0), visit https://creativecommons.org/licenses/by/4.0/.
    Figure (7)  Table (3) References (50)
  • About this article
    Cite this article
    Zhang J, Zhang P, Wang G, Chen C, Wang X, et al. 2023. Determination of nuclear DNA ploidy distribution in the mesocarp of tomato red ripe fruit using a flow cytometer. Vegetable Research 3:8 doi: 10.48130/VR-2023-0008
    Zhang J, Zhang P, Wang G, Chen C, Wang X, et al. 2023. Determination of nuclear DNA ploidy distribution in the mesocarp of tomato red ripe fruit using a flow cytometer. Vegetable Research 3:8 doi: 10.48130/VR-2023-0008

Catalog

  • About this article

/

DownLoad:  Full-Size Img  PowerPoint
Return
Return