


-
Green tea is an un-aerated product made from the tender shoots of the tea plant (Camellia sinensis L.). Unlike black tea, the processing technique employed for green tea production omits the oxidation stage by fixing enzymes, allowing the tea to remain green in color which leads to an assortment of external and inner qualities[1]. Green tea production employs both Chinese and Japanese-style processing methods. Steaming is preferred in Japan and India, whereas the pan-firing method is popular in China and Korea. It has been previously reported that differences in processing methods impart distinguishable changes in the biochemical profile and taste quality of green teas[2]. Green tea processed in orthodox forms requires hand or machine-assisted rolling of deactivated tea leaves to obtain relatively bigger-sized tea particles, but in the CTC method, the fixing step is followed by complete maceration of the tea leaves to produce smaller-sized granular particles. Green tea fixing methods like steaming, pan-firing, and blanching have developed over the years depending on cultural variability, market acceptability, and end-user preference[3]. The fixing stage of enzyme deactivation along with the rolling step, in which leaves are curled and twisted, are considered important technical parameters to attain desirable quality in green tea. Monitoring the initial fixing step at elevated temperatures during green tea production, is crucial to avoid catechin oxidation that is responsible for the astringency and bitterness of green teas, during storage[4]. It has been reported that over-fixing increases the amino acid content due to rapid protein hydrolysis, scorches the leaf and results in a smoky taste and a higher ratio of broken leaf whereas under-fixing results in the browning of green teas upon storage due to residual enzyme activities[2]. Research studies suggest that bigger-sized orthodox green teas retain more moisture and are more likely to be oxidized, reducing their storage life and extraction efficiency, whereas, in contrast, the CTC teas' increased surface area causes smaller particles to interact with water more during brewing, which increases the extraction efficiency of the final brew and therefore has been found to be suitable for ready-to-drink dip tea sachets[5]. Production of green CTC tea has been shown to be a simple, better recovery and less time-consuming method[6], wherein, the teas exhibited bright green colour and more cuppage. The blending and mixing of herbs for desirable flavors become easier with the smaller-sized CTC tea granules. Ready-to-drink flavoured CTC green tea variants are becoming popular nowadays and present competitive and customer-appealing products in the market. Few researchers have reported that the type and quality of the green tea reflected by its chemical composition and the soluble solids extracted during infusion not only depend upon genetic character and temperature of infusion but are also affected by multifarious biochemical changes within the tea leaves during fixing as well as harvesting and subsequent processing conditions[3,7]. Primary leaf biochemicals imparting the taste characteristics and health-attributes of green tea include catechin polyphenols, caffeine, free amino acids, chlorophyll and other compounds jointly or separately[8]. The water-soluble extracts of green tea are the main compounds responsible for bioactivity and the associated medicinal benefits[9].
Scientific investigations on tea biochemicals in recent years have justified the ancient belief of health promoting benefits of green tea consumption[10], which is gaining popularity among the wider community. Increased mass media propaganda on the medicinal health-promoting effects linked with green tea consumption has created a lucrative market potential. As a popular non-alcoholic beverage, green tea products with diverse physical and chemical quality parameters would be equally beneficial to tea manufacturers and consumers.
Ensuing the futuristic trend of the Indian tea industry, there is a scope for Dooars tea estates to divert attention to these alternative ways of green tea processing as well as its promotion to capture the domestic market domain. Recent findings have generated information on region-specific green tea suitable cultivars[11], however, a detailed scientific study in terms of biochemical constituents and organoleptic taste profiles of differentially fixed and processed orthodox and CTC green teas has not been addressed under Dooars agroclimatic conditions. Therefore, the present study was conducted to investigate the impact of various fixing methods viz. steaming, pan-firing, and blanching for orthodox and CTC green teas, in determining the anti-oxidative and health-promoting biochemical profiles, by keeping minimal variations in cultivars, plucking, and other technical aspects of process-parameters.
-
All the chemicals used for this study were of analytical grade. Miniature manufacturing was carried out using a mini-CTC machine (Mesco Equipment) with a 10 tpi (tooth-per-inch) roller. UV-VIS spectrophotometer (Cary Bio 50) was used for biochemical analysis. HPLC analyses (Agilent 1260 infinity UPLC) for the estimation of catechin fractions and caffeine were carried out.
Study site and agro-climatic conditions
-
The Dooars region is situated in the Himalayan foothills and has loamy to sandy loam type and silt clay type of soil. Tea cultivars used in the study were grown in the trial plot of our center, situated at 26°54' North Latitude and 88°54′ East Longitude with an elevation of 226.60 m. Long-term weather data showed a daily temperature range of 18.7 to 28.8 °C, humidity levels of 91.5% (morning) and 64.2% (evening), 5.72 h average sunshine, and approximately 3,800 mm of annual rainfall. Monsoon commences from May-June and lasts until September, followed by cold winters. During the period of our study from July to September, the maximum and minimum temperatures were 31.3 to 32.3 °C and 20.5 to 21.8 °C respectively with corresponding precipitation recorded between 867.7 to 1,058.2 mm. The experimental plot received the balanced fertilizers of nitrogen, phosphorus, and potassium in two splits at a ratio of 110:25:110, as recommended for tea cultivation in this region[12].
Selection of tea cultivars
-
Locally grown tea cultivars viz. Tocklai Vegetative (TV)-9, TV-20, Teenali (TA)-17/1/54, and Tocklai Stock (TS)-462 of similar age from our experimental plots were used for green tea processing. These cultivars were selected based on previous studies on the suitability of these cultivars for green tea production[11,13]. Leaf quality of 50%−60% fineness, was maintained. Three sets of green tea samples were processed by different methods, on three separate occasions, during July, August, and September respectively, coinciding with monsoon flush, and subsequently analyzed for chemical and sensory parameters.
Green tea processing methods
-
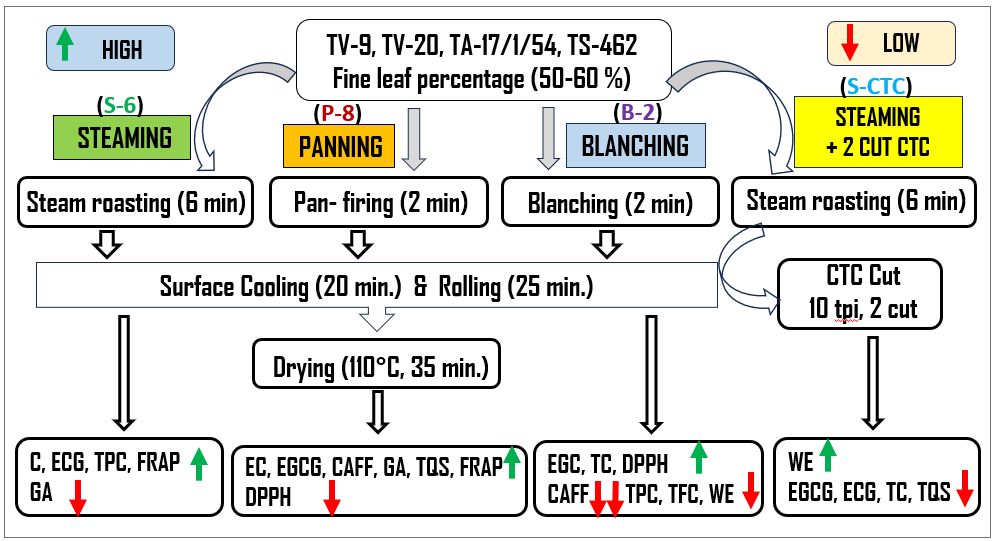
The leaf samples in equal proportions from each cultivar were mixed and then divided into four parts of 0.5 kg each. Green tea processing of the orthodox and CTC-type was done in a miniature factory set-up by various methods, which included conventional steam-roasting, pan-firing, blanching, and steam-roasting followed by 2 cut CTC, with minor simplified modifications as follows.
Steam-roasting (S-6)
-
Green tea was processed by steaming in a perforated chamber at 105 ± 5 °C for 6−8 min, depending on leaf standard. The steamed leaves were surface dried and cooled by blowing air for 15 min, rolled in a peizzy roller for 30 min and finally dried in a cabinet drier at 110 °C for 40 min[13].
Pan-firing (P-8)
-
Fresh leaves were deactivated by pan-firing in an electric panner at 250 ± 10 °C for 8−10 min, depending on leaf standard, cooled by blowing air for 15 min, rolled in a peizzy roller for 30 min and finally dried in a cabinet drier at 110 °C for 40 min[11].
Blanching (B-2)
-
Fresh leaves were fixed by dipping in boiling distilled water for 1−2 min depending on leaf standard. The subsequent procedure was similar to the conventional steam-roasting method.
CTC type (S-CTC)
-
Fresh leaves were deactivated by steaming in a perforated chamber at 105 ± 5 °C for 6−8 min, depending on leaf standard. The steamed leaves were surface dried and cooled by blowing air for 15 min, rolled in a peizzy roller for 30 min prior to cutting in a mini-CTC machine for twice (2-cut). Final drying was carried out in a cabinet drier at 110 °C for 40 min.
Individual catechins, gallic acid and caffeine
-
Extraction of green tea catechins was carried out following the ISO method[14]. Samples were finely grounded in a mortar-pestle, and 0.2 g samples were taken in graded tubes. To the sample, 5 mL of 70% (v/v) pre-heated (70 °C) methanol/water extraction mixture was added and mixed thoroughly on a vortex mixer (Remi). The tubes were put in a water bath at 70 °C (10 min), followed by mixing in a vortex mixer after 5 and 10 min, respectively, and then cooled to room temperature, before centrifugation (3,500 rpm, 10 min) (Remi). After decanting the supernatant in a graduated tube, the residue was extracted a second time with 5 mL of extraction mixture. The extracts were then mixed and concentrated to a volume of 10 mL using the methanol/water extraction mixture. For catechin analysis by HPLC, 1 mL of sample extract was mixed with 4 mL of stabilizing solution (10% v/v acetonitrile with 500 μg/mL EDTA and ascorbic acid), and filtered through a 0.45 μm filter and injected.
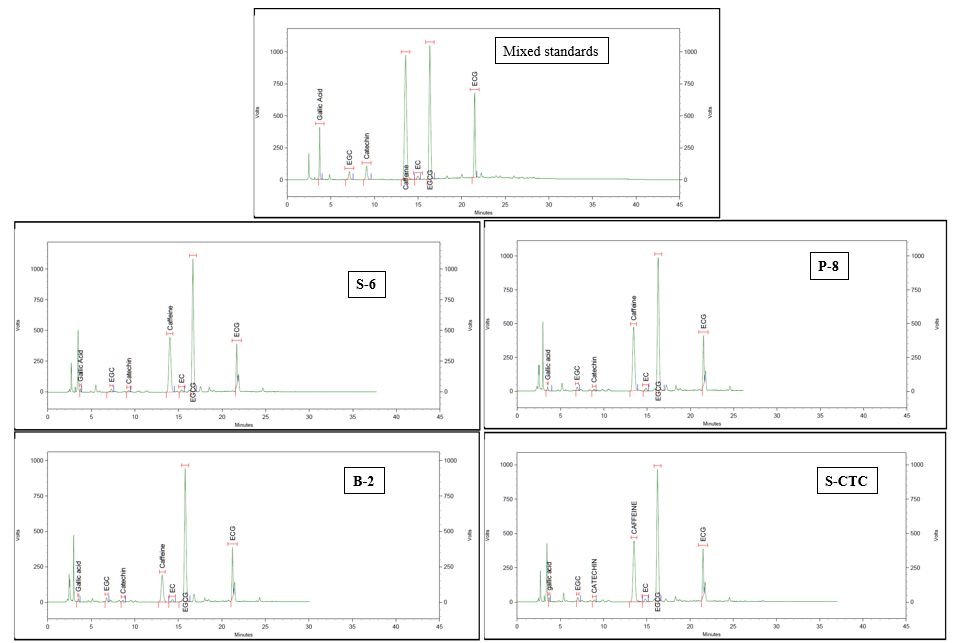
Individual catechins, gallic acid and caffeine was analyzed using Agilent 1260 infinity series HPLC equipped with Zorbax Eclipsed plus Phenyl-Hexyl column (4.6 mm × 250 mm, 5 μm) and Agilent Zorbax Eclipsed Plus Phenyl-Hexyl guard column (4.6 × 12.5 mm, 5 μm), in accordance with the ISO method[14]. Different ratios of water, acetonitrile, and acetic acid solvents were employed for mobile phase A (89:9:2) and mobile phase B (18:2:80). Both the mobile phases received an addition of EDTA (20 μg/mL). The injection volume was 20 μl. Flow rate, column temperature and detection wavelength were set to 1 mL/min, 35 ± 0.5 °C, and 278 nm respectively. A binary gradient condition was initiated with 100% mobile phase A for 10 min, followed by a linear gradient over a period of 15 min to 68% mobile phase A and 32% mobile phase B, which was run and maintained for 10 min. The system was then reset to 100% mobile phase A and given 10 min to equilibrate before the next injection. Catechin and caffeine peaks were identified by comparing retention times from sample chromatograms with those obtained from the mixed standard solutions under the same chromatographic conditions.
Quantification of individual catechins, gallic acid and caffeine was done by using the Relative Response Factors (RRFs) values for catechins and gallic acid with respect to caffeine and comparing the peak area of individual components to the caffeine calibration graph (Supplemental Table S1) as described[14].
Total polyphenol content (TPC)
-
Folin-Ciocalteau reagent was used to estimate the total polyphenol content by the ISO method[15]. Approximately, 0.2 g of well-ground green tea powder was extracted using a methanol-water (70−30) mixture, and the extract was then diluted to 100 times with water. To 1 mL of the diluted extract, 5 mL (10 % v/v) Folin-Ciocalteau reagent was added, followed by 4 mL of Sodium Carbonate solution (7.5% w/v), which was thoroughly mixed. The mixture was left to stand at room temperature for 1 h. The result of the absorbance measurement at 760 nm was reported as a weight percentage by the gallic acid standard calibration curve values (Supplemental Table S1).
Total flavonoid content (TFC)
-
TFC was estimated following the method described by Akbay et al.[16]. Powdered green tea sample (0.2 g) was extracted with methanol-water (70−30) mixture. One mL of this extract was diluted with 3 mL of methanol. To this diluted solution 0.2 ml of Aluminium Chloride (AlCl3, 1 M), 0.2 mL potassium acetate solution (10% w/v) and 5.6 mL distilled water were added and mixed well. Similarly, a sample blank was prepared by replacing AlCl3 with water. The absorbance reading was taken at 415 nm and the result was obtained by quercetin standard calibration curve values (Supplemental Table S1).
Water extract (WE) content
-
The water extract content in green tea samples was determined using the ISO method[17], with minor modifications, to evaluate the effect of process type in determining the water-soluble extract content. Briefly, the non-grounded orthodox and CTC green tea samples (2.0 g) were put in a 250 mL flask, and 200 mL hot distilled water was added and refluxed over low heat for 1 h, rotating the flask occasionally. The flask was repeatedly washed out with hot distilled water transferring all the insoluble residue into a pre-weighed crucible. Finally, the residue was washed with 200 mL of hot water. The residue was dried by suction. The crucible and its contents were heated in an oven at 103 ± 2 °C, for 16 h. The dessicator-cooled crucible with its content was weighed. The result was expressed as a weight% on a dry mass basis, as mentioned in ISO 9768:1994[17].
Organoleptic evaluation and Tasters Quality Score (TQS)
-
ISO 3103:2109[18] was followed in the preparation process of tea infusion and liquor. This method entails extracting soluble substances from 2.8 ± 0.2 g of dried tea leaves contained in a porcelain cup using 150 ml of freshly heated water, that is covered with a lid for 4−5 min for brewing. The liquor is then poured into the bowl through the serration in the lid cover to keep the infused leaf in the pot. The lid was removed and then inverted and the infused leaf was placed on it. The tea taster used a randomized method for the tasting, concealing the sample details in accordance with ISO 3163[19] and examined the infused leaf and liquor organoleptic qualities. Once the tea is cool enough, a tea taster uses a large spoon to noisily slurp the liquor into the lips, which guarantees a consistent taste profile by allowing adequate oxygen and tea to travel through the tongue's taste receptors[20]. The liquid was spit subsequently in a spittoon, before the next sample. The parameters of tea quality (color, strength, briskness, and brightness), manufacturing defect parameters, and field-related agro-practices have been described by FAO[21]. After taking these findings into account, the taster evaluated the tea's organoleptic quality in Hedonic scale ratings ranging from 0 to 10[11,22].
Antioxidant assays
2,2-diphenyl-1-picrylhydrazy (DPPH) assay
-
The DPPH antioxidant activity assay was carried out following a previously reported method[23], with slight modifications. Briefly, the powdered tea sample (0.2 g) was extracted with methanol-water (70−30) mixture. DPPH solution (0.1 mM in methanol, 4 mL) was added to 2 mL each of the different concentration of the extract (2.5, 5, 7.5, 10, 12.5, 15, and 20 μg/mL). The reaction mixture was incubated at room temperature for 30 min and absorbance readings were taken at 517 nm, with ascorbic acid (100 μg/mL) as positive control and methanol as blank. The inhibition ratio (i.e., the concentration of the tea extract required to reduce the absorbance of DPPH by 50%) of the sample was obtained using the following equation:
Inhibition ratio (%) = {(Ac – As)/Ac} × 100; where, Ac = Absorbance of the control and As = Absorbance of the sample
A plot of inhibition ratio against concentration gives a straight line from which IC50 was calculated.
Ferric reducing antioxidant potential (FRAP) assay
-
The FRAP assay was performed following a previously reported method[24], with some modifications. Preparation of FRAP reagent was carried out by mixing 10 mM 2,4,6-Tripyridyl-S-triazine (TPTZ) in 40 mM HCl with 20 mM Ferric Chloride (FeCl3) in 300 mM acetate buffer. For the assay, 200 μL of tea extract, 1.8 mL of water and 4 mL FRAP reagent was mixed and the solution was incubated in the dark for 30 min. Then, the absorbance was taken at 593 nm using water as blank. The result was obtained by comparison with the Ferrous Sulphate (FeSO4) standard graph.
Statistical analysis
-
The data of each experimental analysis that was performed in triplicate was analyzed by one-way analysis of Variance (ANOVA). Mean values of the biochemical parameters were separated using Duncan's multiple test range (p ≤ 0.05). All values are represented as mean ± standard error (SE). Statistical analysis and correlations among the biochemical quality parameters were calculated by Pearson's correlation coefficient test using SPSS software (version 16.0., SPSS < Chicago, IL, USA).
-
The content of individual catechin fractions and total catechins, caffeine, gallic acid in green tea samples processed differently are presented in Table 1 and Fig. 1 respectively.
Table 1. Content (% dry weight) of non-gallated catechins viz. catechin +(C), epicatechin (EC) and epigallocatechin (EGC), gallated catechins viz. epicatechin gallate (ECG) and epigallocatechin gallate (EGCG), in green tea samples processed by different methods.
Process type Catechin fractions Total catechins (TC) C EC EGC EGCG ECG S-6 0.99 ± 0.07 1.30 ± 0.06 3.87 ± 0.33 10.49 ± 0.57 2.84 ± 0.25 19.48 ± 0.44ab P-8 0.93 ± 0.03 1.46 ± 0.08 4.35 ± 0.31 10.84 ± 0.50 2.70 ± 0.14 20.26 ± 0.47b B-2 0.95 ± 0.05 1.39 ± 0.07 4.47 ± 0.40 10.79 ± 0.34 2.74 ± 0.25 20.33 ± 0.27b S-CTC 0.94 ± 0.05 1.43 ± 0.07 3.91 ± 0.21 9.84 ± 0.53 2.58 ± 0.21 18.69 ± 0.42a All values are represented as mean ± SE. Values within a column with different letters are significantly different by ANOVA with Duncan multiple test range at p < 0.05. C, (+)-catechin; EC, (−)-epicatechin; EGC, (−)-epigallocatechin; EGCG, (−)-epigallocatechin gallate; ECG, (−)-epicatechin gallate; TC, total catechins. S-6, steam-roasting for 6 min; P-8, panning for 8 min; B-2, blanching for 2 min; S-CTC, steam-roasting for 2 min followed by two CTC cuts. 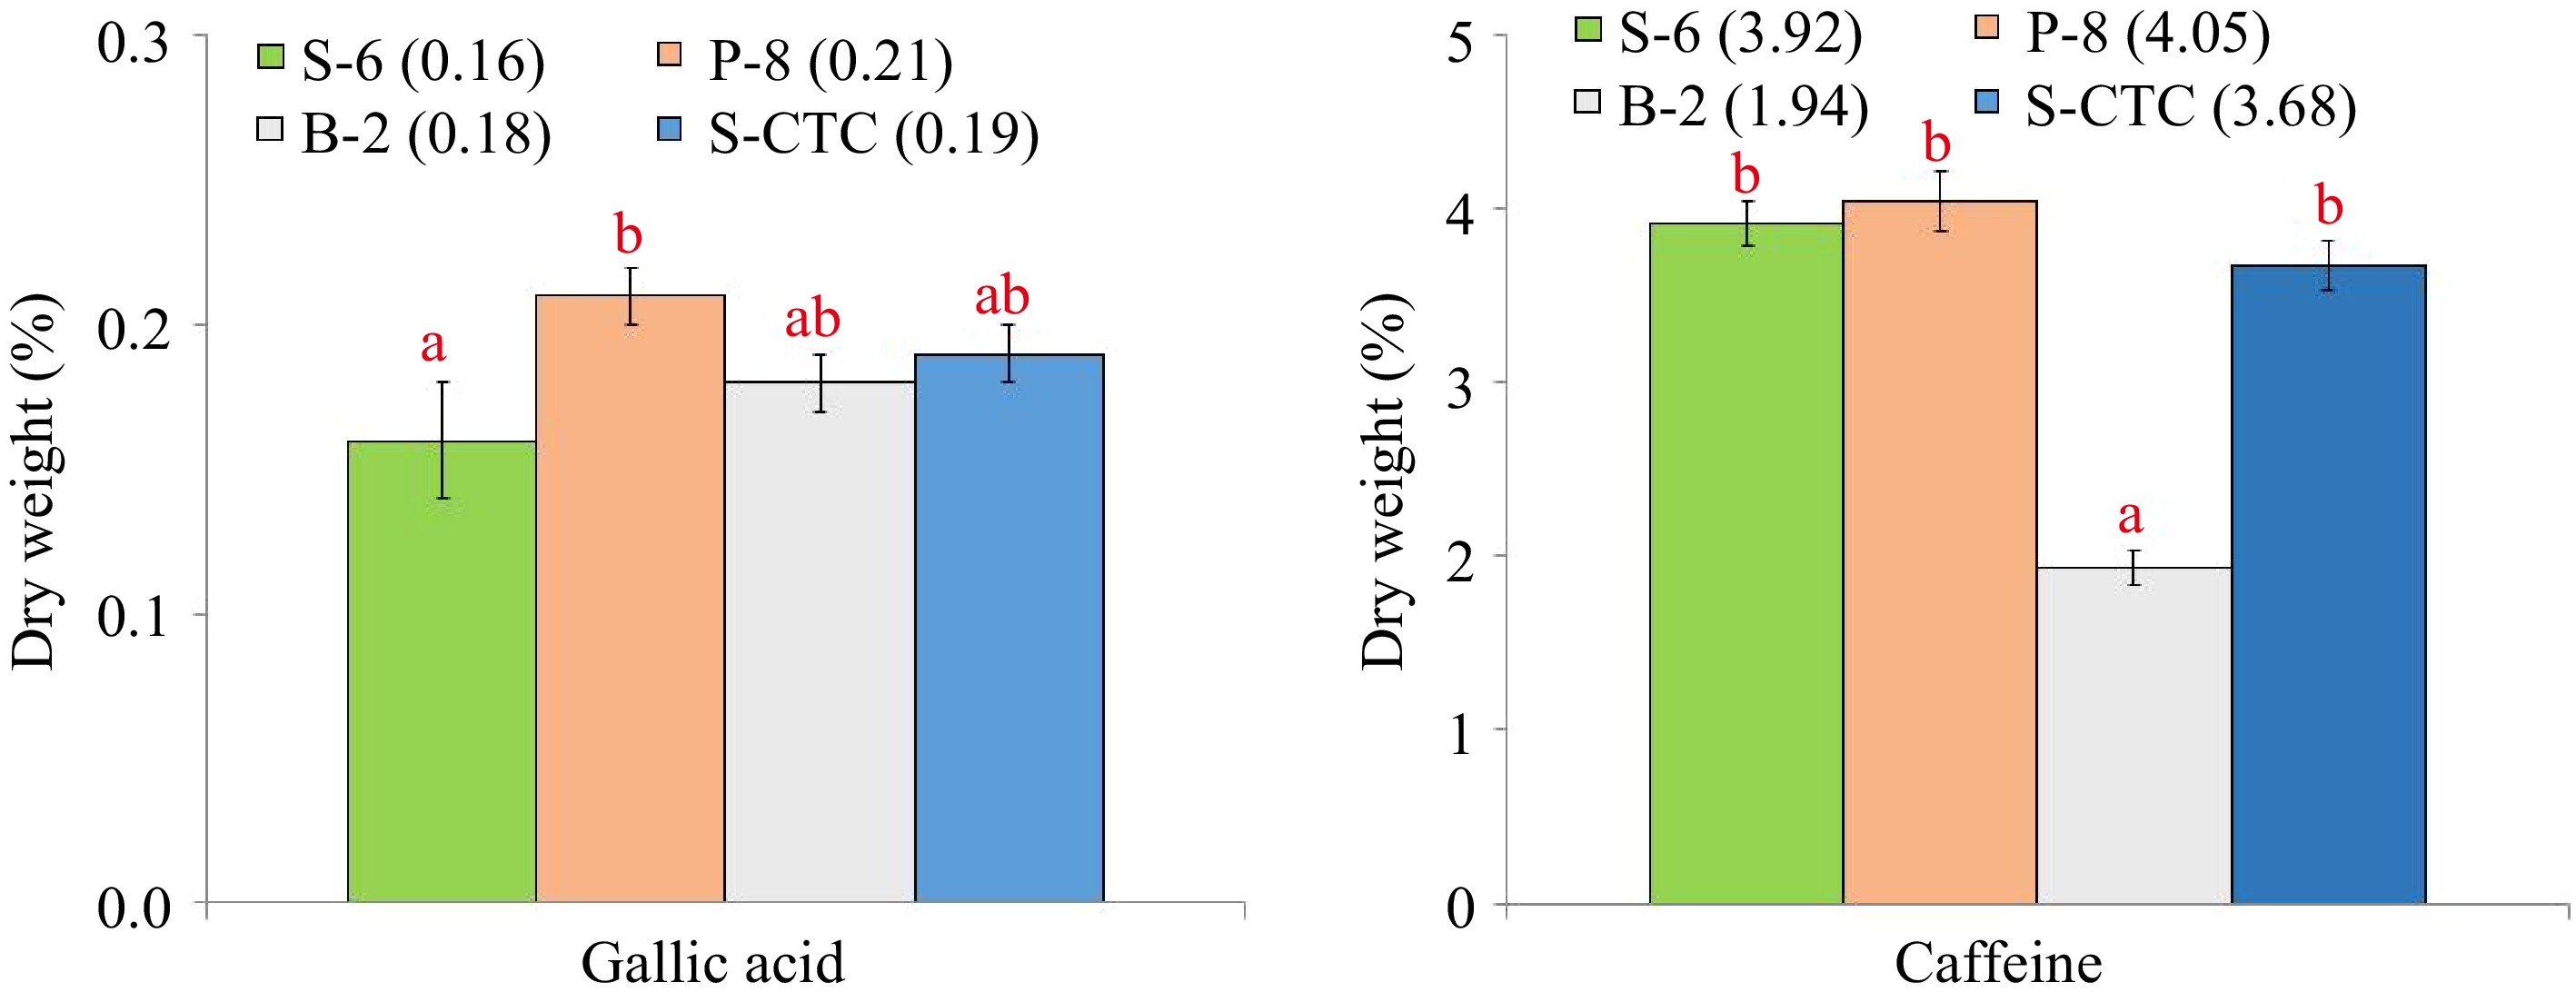
Figure 1.
Content (% dry weight) of gallic acid and caffeine of green tea samples processed by different methods. Values are represented as mean ± SE. Different lowercase letters on top of the bars indicate significant difference by ANOVA with Duncan multiple test range at p < 0.05; S-6, steam-roasting for 6 min; P-8, pan-firing for 8 min; B-2, blanching for 2 min; S-CTC, steam-roasting for 2 min followed by two CTC cuts.
The data indicates that the processing method exhibits a significant impact on the chemical composition of green tea samples, especially caffeine. The content of epigallocatechin was found to be marginally higher in pan-fired and blanched-green teas than in steamed orthodox and CTC-mode processing. Although insignificant, the amounts of epigallocatechin gallate and epicatechin gallate were found to be notably higher in S-6, P-8, and B-2 as compared to S-CTC samples. However, significant differences were observed between the total catechin contents of S-CTC type green tea as compared to other process-type green teas, which may be attributed to the loss of gallated catechin fractions viz. epigallocatechin gallate and epicatechin gallate due to frictional heat generation at the crushing-tearing and curling step, that is congruent with a previous report that the level of green tea catechins is reduced due to epimerization and degradation during processing[25], and storage conditions such as temperature and relative humidity[2]. Contrary to our findings, higher total catechin content for CTC green tea than orthodox type has been detailed[26,27], the difference can be attributed to the diversity in tea cultivars, agroclimatic variation in the study and smaller size of CTC granules enhancing the extraction efficiency. It was noted that deactivation by blanching (B-2) reduced the caffeine content by 40%−50% as compared to other green tea processing types viz. S-6, P-8 and S-CTC respectively (Supplemental Fig. S2). Representative HPLC chromatographs of the mixed standards and green tea samples processed by different methods is mentioned in Supplemental Fig. S2.
Our finding of significantly lower caffeine content of B-2 orthodox green tea (1.94%) as compared to other green tea types, is consistent with a previous report[27], where it was conferred that blanching tea leaves for 3 min eliminated 83% of the caffeine while retaining 95% of the catechins. It has been reported that the solubility of caffeine is very low in water at room temperature (2.2% w/w), however, in boiling water, the solubility of caffeine increases greatly (66.7% w/w). Specific removal of a significant amount of caffeine as compared to catechins, from fresh tea leaves during blanching, may be attributed to the higher solubility of caffeine in hot water and its lower molecular weight (21.7 g·L−1, 194.2 kDa) than the catechins (~ 5 g·L−1, 290−458 kDa), that allows caffeine molecules to diffuse through the cell membrane and hence, during the blanching step, a large amount of caffeine goes out of the leaf resulting in lower caffeine content in the green tea[28]. The results also indicated significant variation (p ≤ 0.05) in the gallic acid content of S-6 and P-8 orthodox green teas that could have occurred due to wet and dry mode of heat application and resulted in greater loss of gallic acid in steaming by wet-heat as compared to pan-firing.
The combination of catechins with caffeine and gallic acid is often associated with green tea taste. Although caffeine intake has some proven health benefits, higher intake of caffeine can have a negative impact on the human central nervous system and is therefore contraindicated for children and pregnant women[29,30]. Moreover, studies have linked consumption of caffeine containing beverages with irritation of the gastrointestinal tract and sleeplessness[31]. There is persistent market demand for decaffeinated versions of tea and coffee beverages, therefore, caffeine reduction in the green tea manufacturing process is often desirable. Based on these findings, it can be suggested that fixation by blanching is one of the simple, non-toxic, and low-cost processes of decaffeinating green tea without removal of the catechin antioxidants.
Total polyphenol and flavonoid content
-
The TPC and TFC in green teas processed by different methods is presented in Fig. 2. Significant variation in polyphenol content was observed for green tea samples processed by different fixing-methods and types.
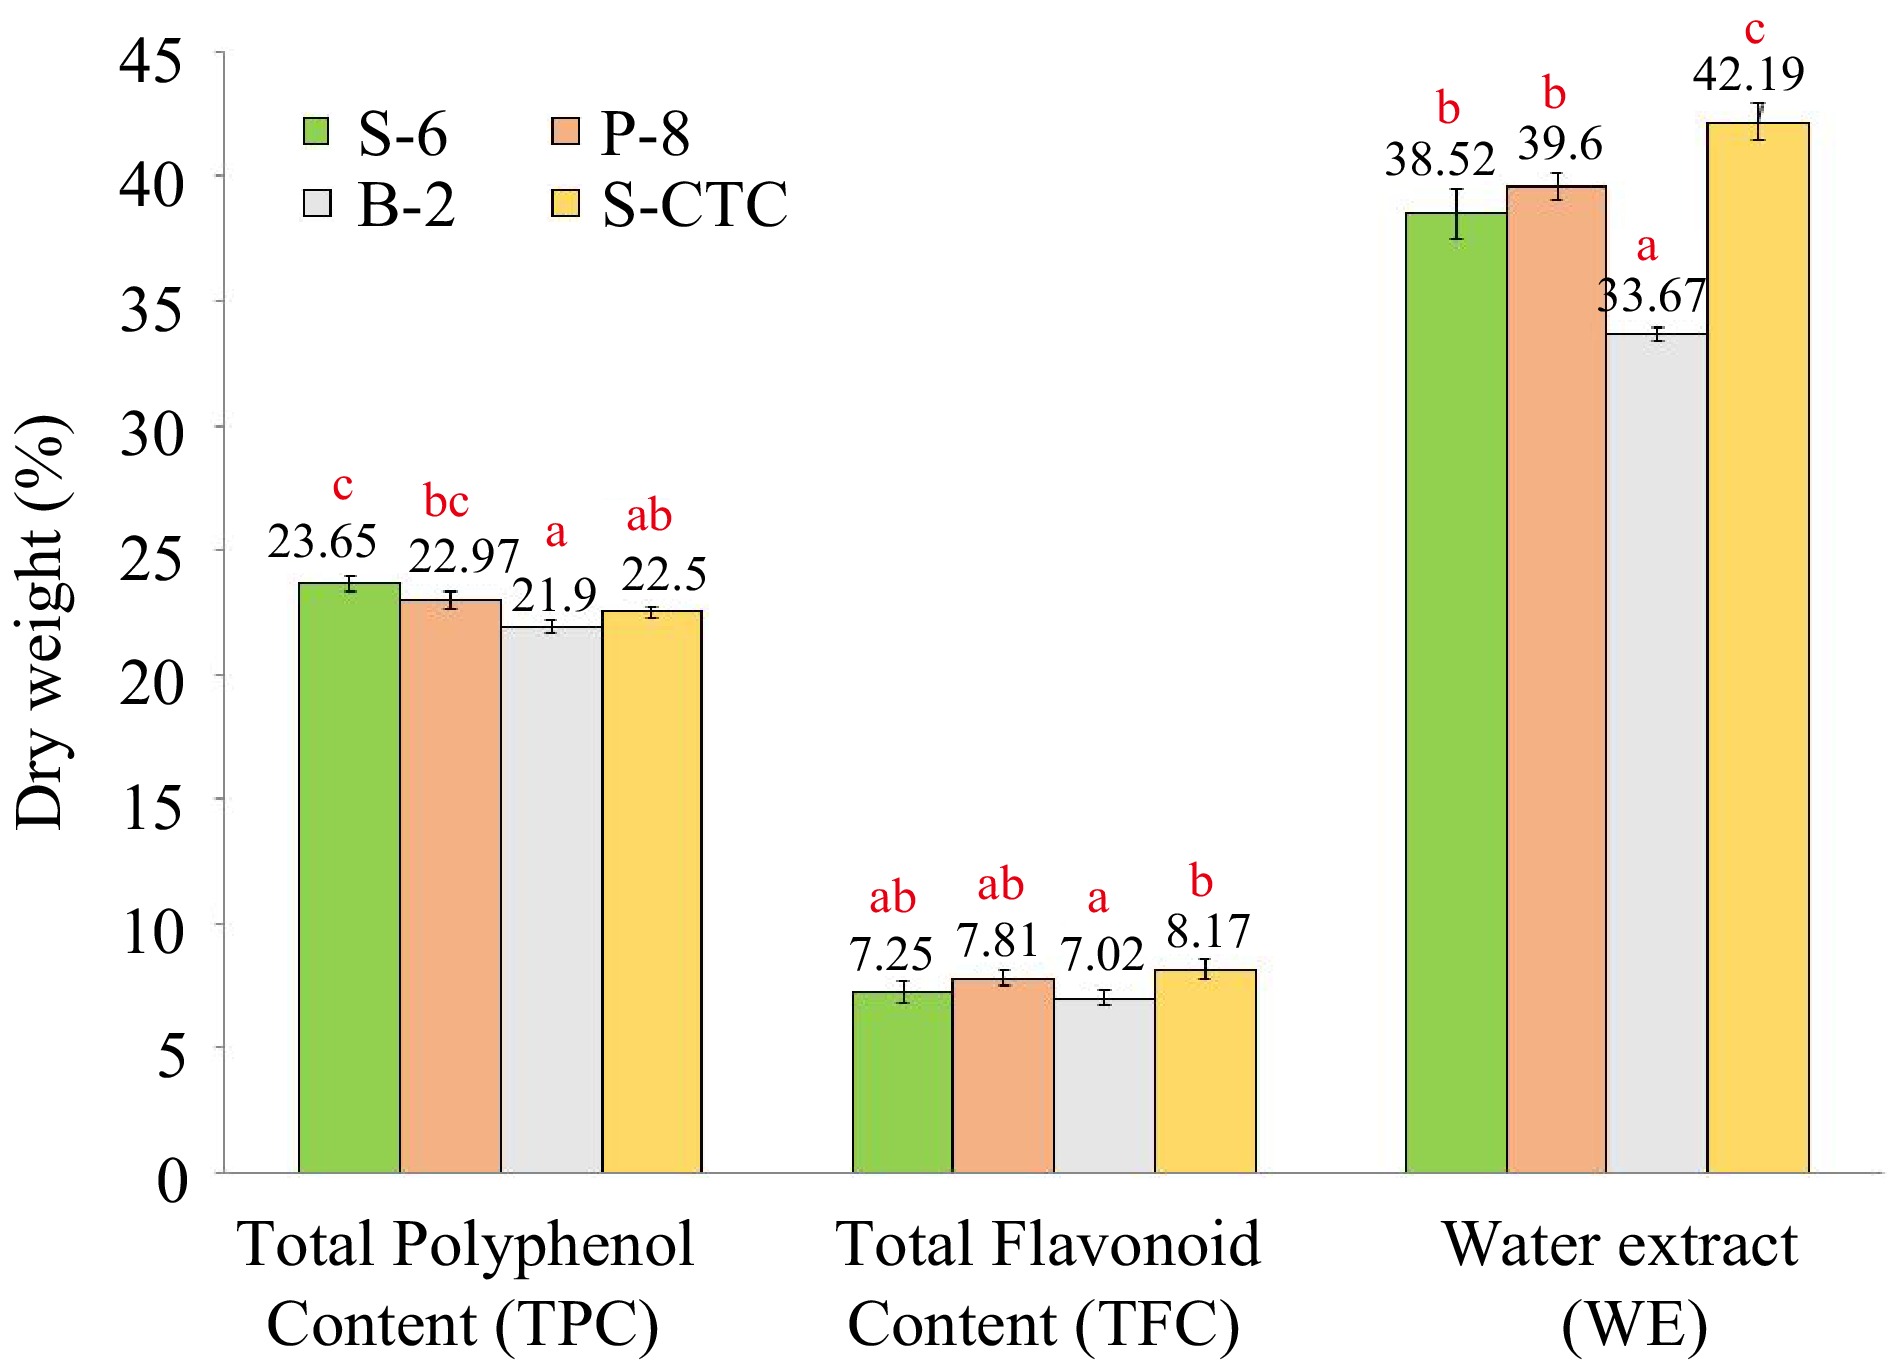
Figure 2.
Content (% dry weight) of total polyphenol, total flavonoid and water extract of green tea samples processed by different methods. Values are represented as mean ± SE. Different lowercase letters on top of the bars indicate significant difference by ANOVA with Duncan multiple test range at p < 0.05; TPC, Total Polyphenol Content; TFC, Total Flavonoid Content; WE, Water Extract; S-6, steam-roasting for 6 min; P-8, pan-firing for 8 min; B-2, blanching for 2 min; S-CTC, steam-roasting for 2 min followed by two CTC cuts.
The conventional steam-roasting process (S-6) of orthodox green tea production retained the maximum polyphenols. Green teas (S-6, P-8, and S-CTC) exhibited higher polyphenol content (23.65%, 22.97%, and 22.50%) as compared to B-2 (21.90%). Similar data was obtained for TFC, wherein significant differences (p ≤ 0.05) were obtained for S-CTC and B-2 type green tea. The extraction rate of green tea polyphenols is influenced by the shape, size of tea leaves, and degree of destruction during the fixing of leaves and, usually the longer time of fixation during the steaming and panning method causes more destruction of leaves yielding more small particles compared to the shorter duration blanching process. The bi-directional rolling after fixation step aids the juices to spread out in steam-roasted green teas as compared to other methods. The CTC step after steaming leads to the loss of polyphenolic compounds because of prolonged processing[1]. Our results on differences of TPC and TFC content due to process-variation are in congruence with a previous finding[32], where the researchers inferred that thermal treatment by blanching resulted in transformation, as well as, loss of phenolic and flavonoid compounds due to leaching in water and therefore reduction in the phenolic and flavonoid content. Likewise, variation in polyphenol levels in the water infused extracts of green tea due to processing has also been described[33].
Green tea polyphenols and flavonoids are key compounds conferring the antioxidative and therapeutic properties of tea consumption and also impart astringency and bitter taste to green tea infusion. The water-soluble polyphenols and flavonoids have the potential used singly or in combination with other active principles in the food, pharmaceutical, and cosmetic industries[10]. The health value of green tea beverages is determined, among others, by the content of polyphenolic substances, therefore, in summary, the conventional methods of steam-roasting and pan-firing are best suited to conserve polyphenols and flavonoids in green tea products.
Water extract content and Tasters Quality Score
-
Water extract content is a quality indicator that constitutes the phenolics, alkaloids, amino acids, and many minor water-soluble substances extracted from the tea samples which determines the quality and cuppage of the tea, and is employed in the tea industry[17]. Data presented in Fig. 2, show the average water extract contents to be 38.52%, 39.60%, 33.67%, and 42.19% for S-6, P-8, B-2, and S-CTC type- green teas respectively.
Based on the current findings, all the analyzed green tea samples complied with the ISO requirement with regard to WE content, implying the presence of adequate extractable substances. However, significant variation was observed between orthodox and CTC type green tea samples. The WE content was higher in case of S-6, 2-CTC (42.19%) and lower in B-2 type processed orthodox green teas (33.67%). It has been reported that the water extract of tea depends on tea and water ratio, temperature of the tea brew, type, and size of made tea particles[34]. Our findings emphasized that the CTC cut facilitated smaller particle size thereby presenting a larger surface area of tea granules exposed to water and enabling effective extraction of soluble constituents in water during brewing as compared to the orthodox tea type, whereas, the soluble solid content of B-2 process was lower compared to other fixing methods which can be attributed to the draining-out of water-soluble components during the blanching process[35].
The benefit of CTC-type green teas consisting of fannings and dust grades is that these are readily packaged in tea bags for easy marketability and a lesser time is required for brewing out the extractable bioactive compounds, than the leafy orthodox green teas, however, the smaller-sized particles of CTC green teas are more influenced by oxidative processes during storage than whole tea leaves, because a larger surface area is exposed to oxygen and light[7].
The TQS of steamed (S-6) and pan-fired green teas (P-8) showed significant differences with blanched (B-2) and steamed-CTC (S-CTC) type with lesser bitterness components in orthodox green tea liquor than CTC type (Fig. 3), that indicates the preference of tea tasters towards conventionally processed orthodox type green teas[11,13]. Representative pictures of dry leaf, infused leaf and liquor appearance of green teas processed differently are shown in Fig. 4.
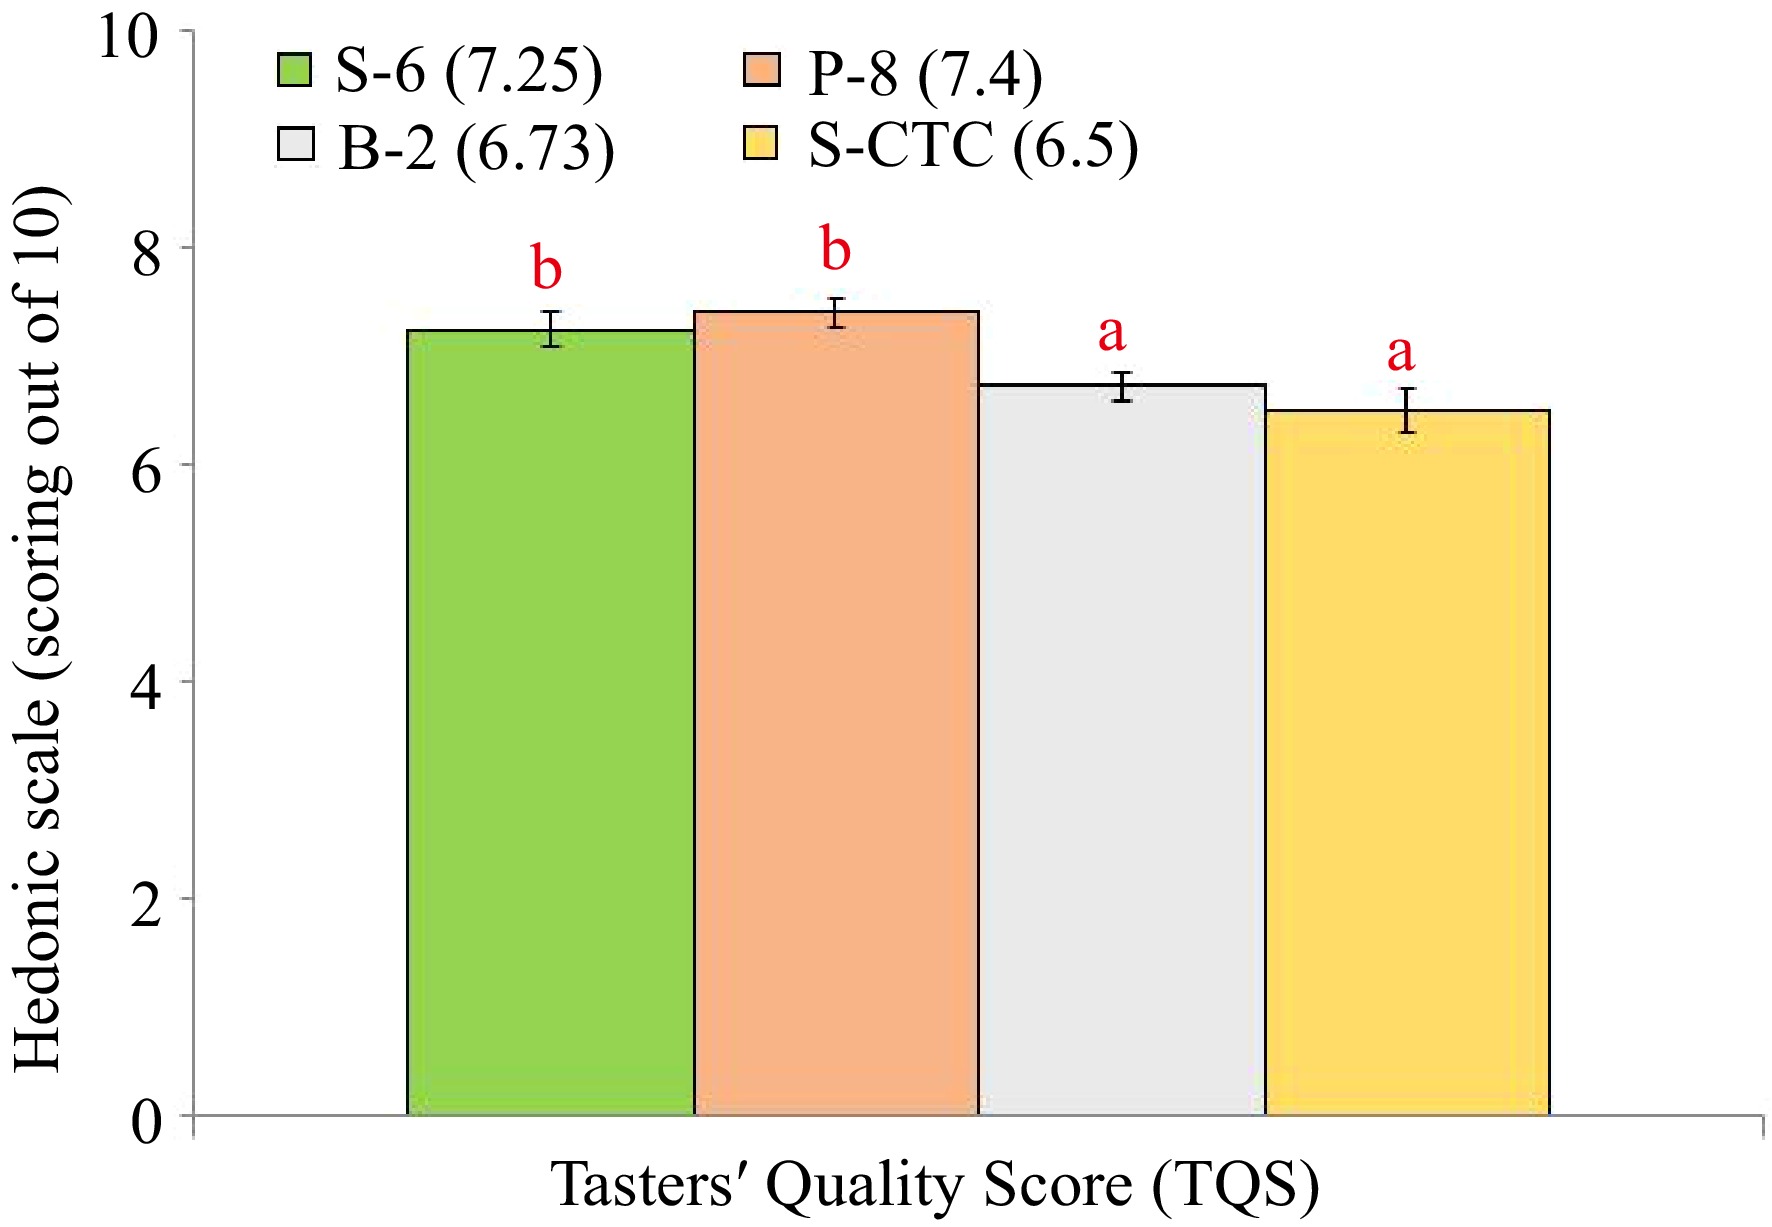
Figure 3.
Taster Quality Score (TQS) of green tea samples processed by different methods. Values are represented as mean ± SE. Different lowercase letters on top of the bars indicate significant difference by ANOVA with Duncan multiple test range at p < 0.05; TQS, Tasters' Quality Scores. S-6, steam-roasting for 6 min; P-8, pan-firing for 8 min; B-2, blanching for 2 min; S-CTC, steam-roasting for 2 min followed by two CTC cuts.
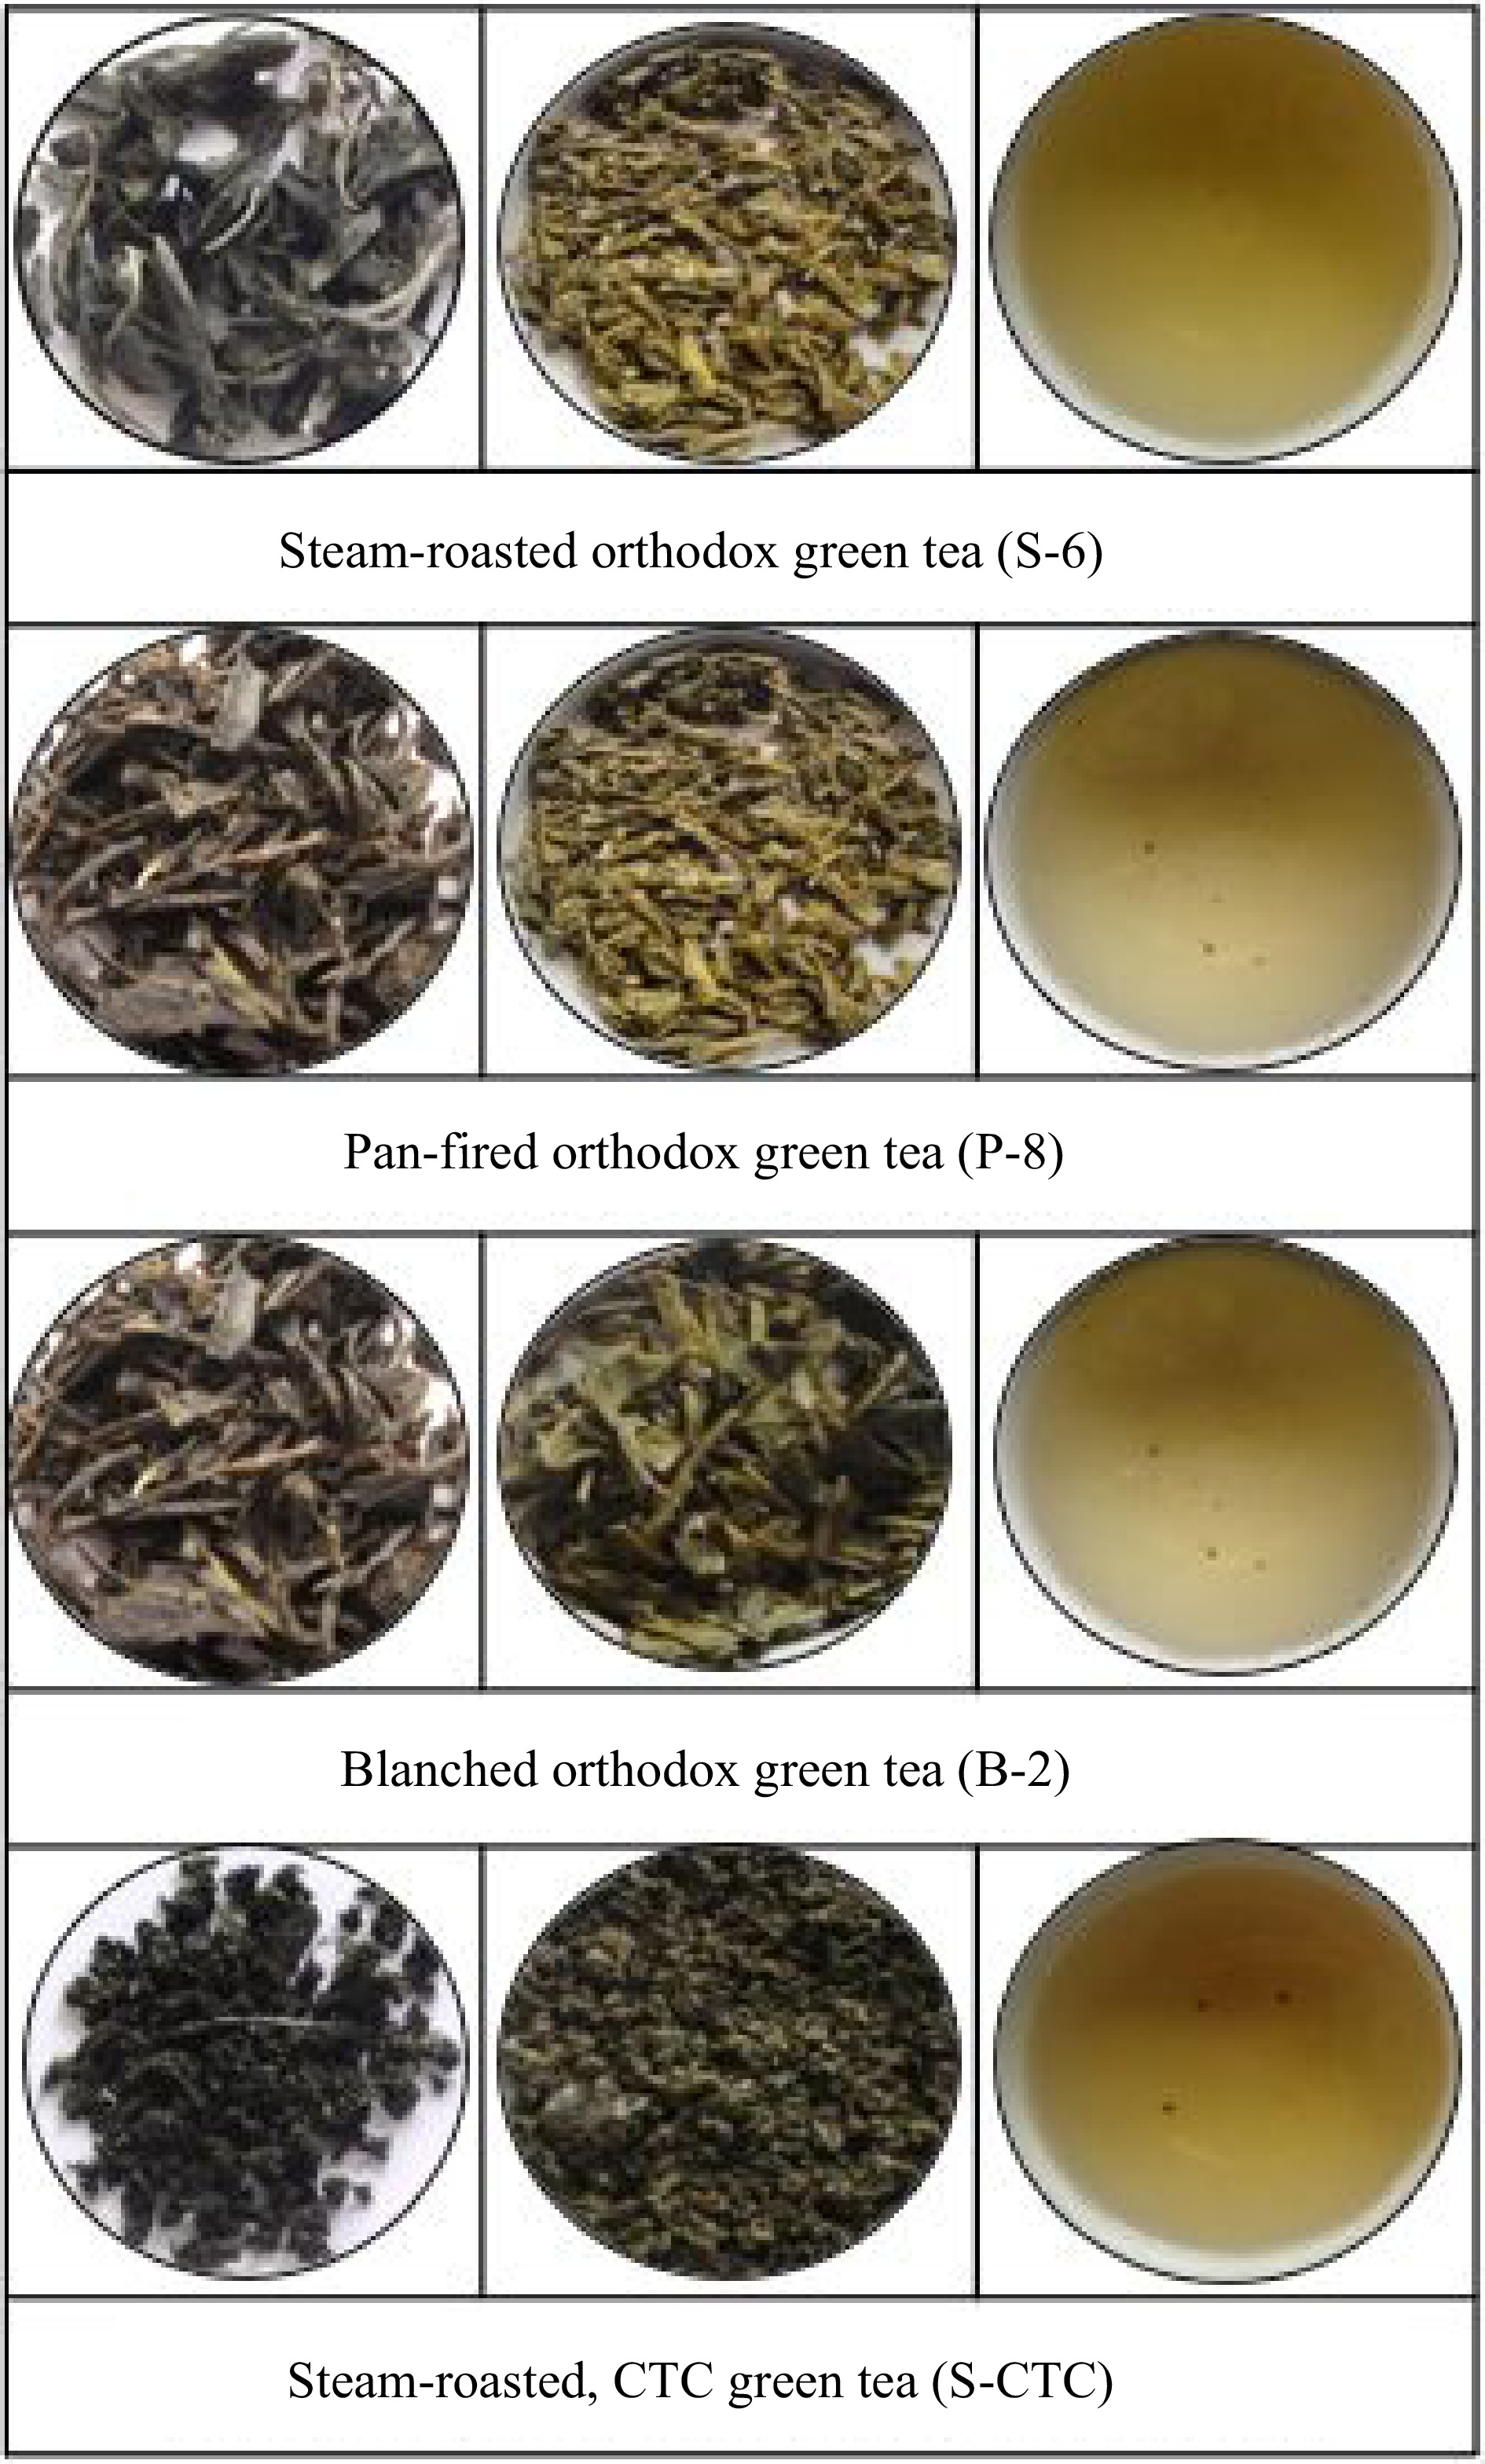
Figure 4.
Representative pictures of dry leaf appearance, infused leaf and liquor colour of green tea processed by different processing methods, used for organoleptic evaluation.
Anti-oxidant activity
-
The antioxidant activity serves as an indicator of the proportion of antioxidant substances in green tea. Since it is not always possible to characterize the antioxidant potential of tea by a single assay because the majority of naturally occurring antioxidants found in tea have multiple functions, hence, we used the DPPH and FRAP assays in the current study to describe the antioxidant activity of green tea samples processed in different ways. Under the conditions described in this manuscript, no significant differences were observed in the IC50 values of green tea samples processed by different methods (Fig. 5).
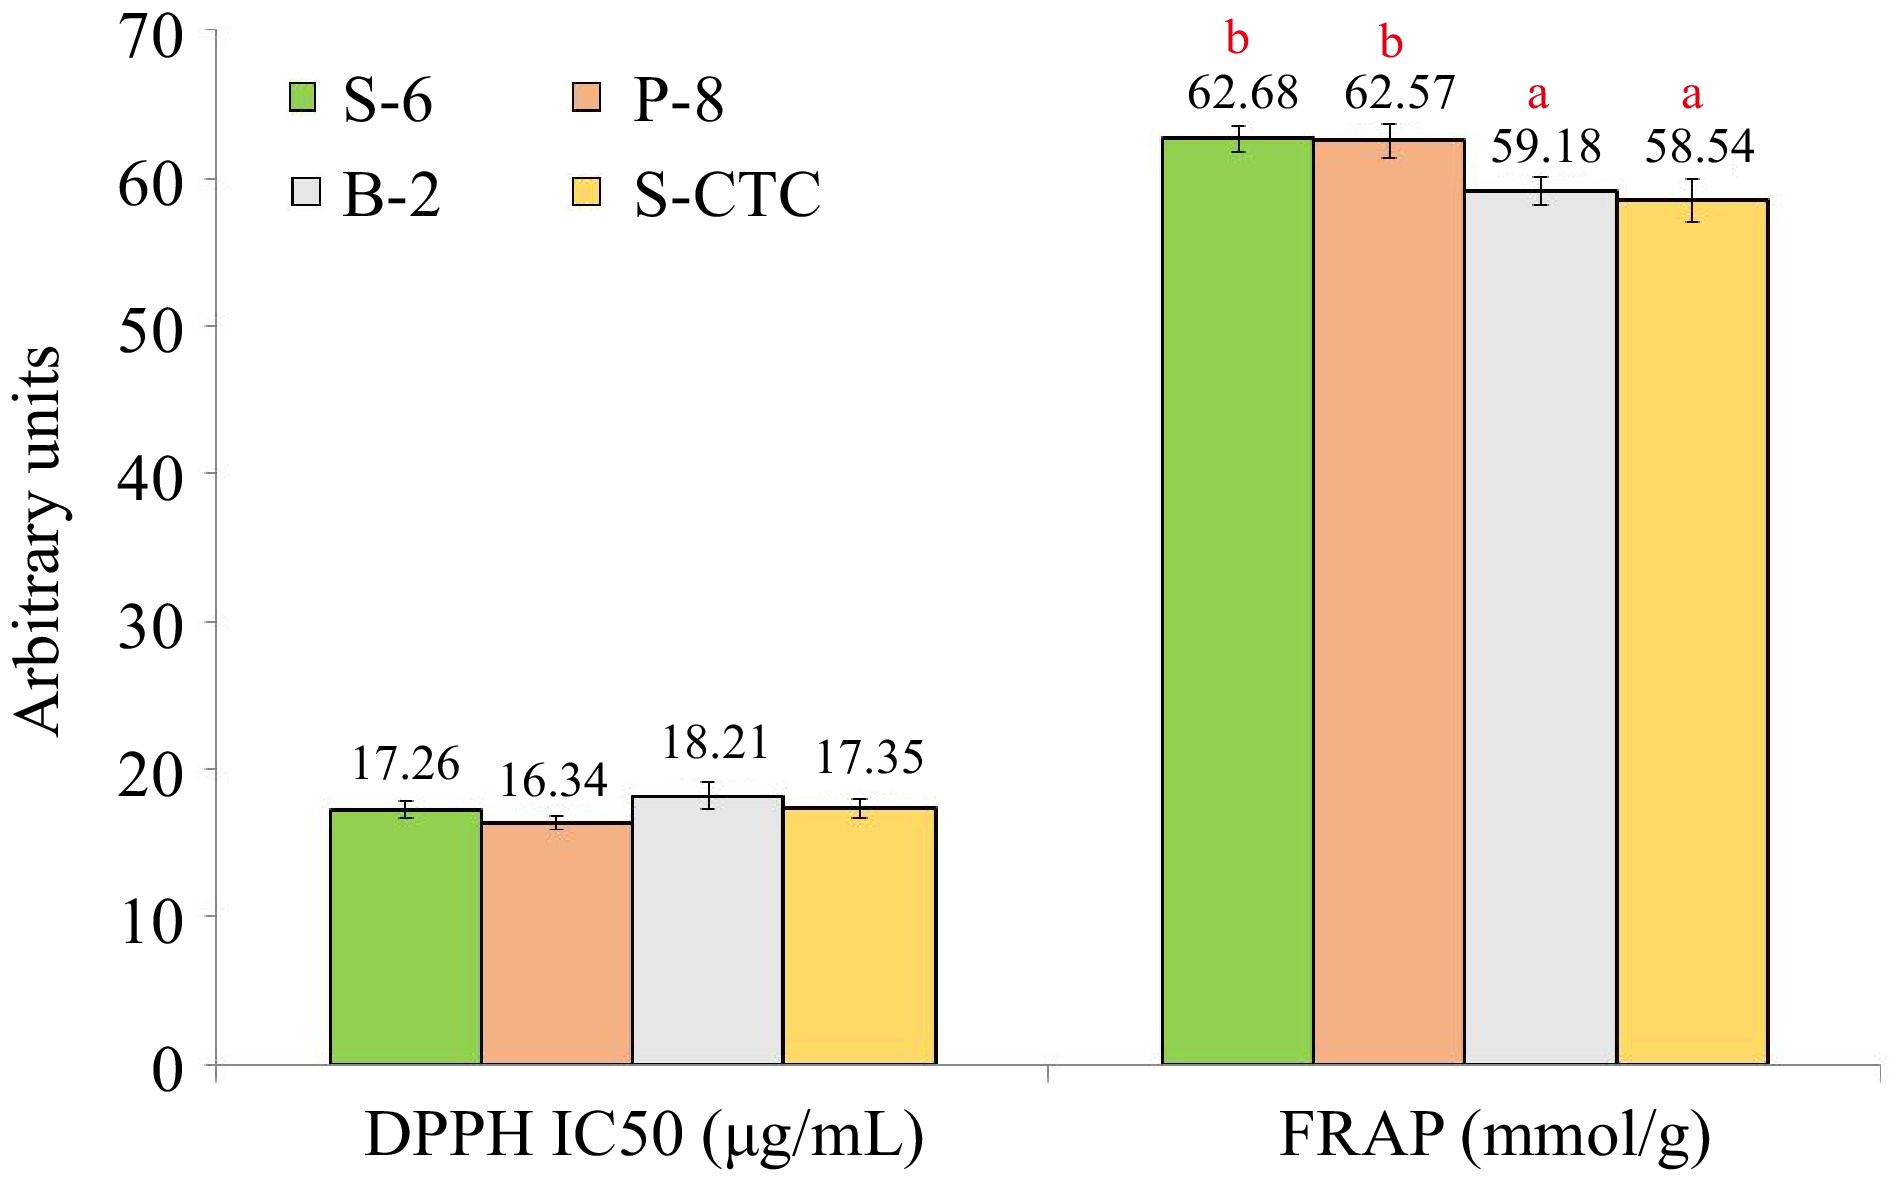
Figure 5.
Anti-oxidant activity in terms of DPPH and FRAP assay values of green tea samples processed by different methods. Values are represented as mean ± SE. Different lowercase letters on top of the bars indicate significant difference by ANOVA with Duncan multiple test range at p < 0.05; DPPH, 1,1-diphenyl-2-picrylhydrazyl (DPPH) free radical-scavenging ability; FRAP, Ferric reducing antioxidant power; S-6, steam-roasting for 6 min; P-8, pan-firing for 8 min; B-2, blanching for 2 min; S-CTC, steam-roasting for 2 min followed by two CTC cuts.
The B-2 and P-8 type processed green teas exhibited the maximum and minimum IC50 value of 18.21 and 16.34 μg/ml respectively in the DPPH assay, which may be attributed to the loss of water-soluble antioxidants during blanching and negligible loss during deactivation by dry heat application or pan-firing. Likewise, in the FRAP assay, the values of S-6 and P-8 green teas were significantly higher than in B-2 and S-CTC methods, wherein, the variance noted in the FRAP values can primarily be attributed to the loss of anti-oxidative polyphenols during the blanching and CTC steps of green tea processing[23].
Correlation coefficient matrix analysis
-
Pearson correlation was used to evaluate the relationship among the various chemical quality parameters and tasting scores for the green teas processed by four different methods (Table 2), wherein, a strong positively significant correlation was obtained between EGC and EC, TC and also between C and ECG, TFC. Additionally, caffeine content was positively and significantly correlated with TPC, WE, TQS and likewise, TFC with EC; TC with EGCG; TQS with ECG, WE also displayed significant positive correlation. However, a negative correlation was observed between EGC and C, ECG, WE, TQS; C and EGCG, TC; EC, ECG with EGCG; TC with ECC, TFC, WE, TQS as reported earlier[36]. These results confirm the above discussed results that some of the green tea chemical constituents are correlated to the different methods of green tea processing.
Table 2. Correlations between gallic acid (GA), epigallocatechin (EGC), catechin (C), caffeine (CFF), epicatechin (EC), epigallocatechin gallate (EGCG), epicatechin gallate (ECG), total catechin (TC), total polyphenol content (TPC), total flavonoid content (TFC), water extract (WE) and tasters' quality score (TQS) in green tea samples processed by different methods.
GA EGC C CAFF EC EGCG ECG TC TPC TFC WE TQS GA 1 EGC 0.018 1 C 0.099 −0.529** 1 CAFF 0.090 −0.170 −0.118 1 EC 0.035 0.510** 0.073 −0.186 1 EGCG −0.021 0.093 −0.669** 0.269* −0.514** 1 ECG 0.030 −0.679** 0.767** −0.100 −0.044 −0.430** 1 TC 0.021 0.523** −0.630** 0.084 −0.051 0.809** −0.409** 1 TPC −0.167 −0.073 −0.067 0.514** −0.088 0.175 0.035 0.137 1 TFC 0.158 0.241* 0.437** −0.034 0.612** −0.755** 0.147 −0.443** −0.097 1 WE 0.141 −0.495** 0.273* 0.514** −0.072 −0.326* 0.302* −0.556** 0.149 0.272* 1 TQS 0.126 −0.483** 0.243* 0.399** −0.079 −0.216 0.364** −0.400** 0.173 0.137 0.856** 1 **, Correlation is significant at the 0.01 level (1-tailed). *, Correlation is significant at the 0.05 level (1-tailed). GA, gallic acid; EGC, (−)-epigallocatechin; C, (+)-catechin; CAFF, caffeine; EC, (−)-epicatechin; EGCG, (−)-epigallocatechin gallate; ECG, (−)-epicatechin gallate; TC, total catechins; TPC, total polyphenol content; FC, flavonoid content; WE, eater extract; TQS, Tasters' Quality Score. The direction and magnitude of correlation between variables was quantified by the correlation coefficient r. One-tailed p value: *, p < 0.05; **, p < 0.01. -
The findings of the current study provide practical information about the role of different processing methodologies on green tea quality, and the composition of health-promoting constituents in green tea extract and also establish a trend in which the level of these green tea biochemicals is governed. The phytochemicals and antioxidative properties of orthodox green teas were significantly higher than the CTC type. It is reported that the blanching method of deactivation results in the production of green tea with a significantly lesser amount of caffeine compared to steaming and pan-firing methods. Moreover, a significant increase in the content of water extract was observed in CTC-green tea compared to the orthodox type. However, the organoleptic evaluation by tasters preferred the orthodox green teas processed by steam and pan-firing to blanched and CTC-green teas. The detailed scientific and comparative study on the variation of chemical constituents due to processing differences of green tea provides relevant information for consumers and professionals from the tea and pharmaceutical industry. Further work on calibration of the green tea process parameters to obtain desirable biochemicals of therapeutic value, under large-scale settings, can be attempted.
-
The authors confirm contribution to the paper as follows: Adhikary B and Kashyap B contributed equally to this work. Conceptualization, data curation, writing - original draft: Adhikary B, Kashyap B; funding acquisition: Adhikary B, Kashyap B, Babu A; project administration, Supervision: Adhikary B, Varghese S, Babu A; investigation, validation: Kashyap B, Gogoi RC; resources: Adhikary B, Kanrar B, Babu A; methodology: Kashyap B, Kanrar B; formal analysis: Kashyap B; writing - review & editing: Adhikary B, Kashyap B, Kanrar B, Gogoi RC, Varghese S, Babu A. All authors reviewed and approved the final manuscript.
-
All data analyzed during this study are included in the published article and its electronic supplementary information files.
This work was supported by a research grant from the Department of Science and Technology and Biotechnology- Government of West Bengal vide Research Grant, Ref: 936 (Sanc.) ST/P/S&T/1G-18/2016 dated 10/01/2017.
-
The authors declare that they have no conflict of interest.
-
# Authors contributed equally: Biplab Adhikary, Bishwapran Kashyap
- Supplemental Table S1 Standard calibration curve equation and R2 (coefficient of determination) values used for analysis of biochemical parameters.
- Supplemental Fig. S1 Graphical abstract.
- Supplemental Fig. S2 HPLC chromatograms of mixed standard solution and green tea extracts processed by different methods.
- Copyright: © 2024 by the author(s). Published by Maximum Academic Press, Fayetteville, GA. This article is an open access article distributed under Creative Commons Attribution License (CC BY 4.0), visit https://creativecommons.org/licenses/by/4.0/.
-
About this article
Cite this article
Adhikary B, Kashyap B, Kanrar B, Gogoi RC, Varghese S, et al. 2024. Comparative evaluation of the impact of processing methods in determining the levels of health promoting chemical constituents and quality of green tea. Beverage Plant Research 4: e027 doi: 10.48130/bpr-0024-0016 

Comparative evaluation of the impact of processing methods in determining the levels of health promoting chemical constituents and quality of green tea
- Received: 19 January 2024
- Revised: 20 March 2024
- Accepted: 01 April 2024
- Published online: 02 August 2024
Abstract: The first step of green tea manufacture involves enzyme deactivation by heat application. The present study investigated the effects of various fixing and processing methods viz. steam-roasting (S-6), pan-firing (P-8), blanching (B-2), and CTC cuts after steam-roasting (S-CTC), on the bio-chemical profiles and organoleptic quality of green teas processed differently into orthodox and CTC types, from region-specific tea cultivars, suitable for green tea production under agroclimatic condition of Dooars, West Bengal, India. Differences in fixing method and processing style showed notable variation (p ≤ 0.05) in the chemical quality indicators of green tea viz. Total catechin, polyphenol, flavonoid, and water extract content among the differently processed green teas. The most significant finding of the study revealed that when B-2 is employed for deactivation, it resulted in a substantial reduction (47%−52%) of caffeine levels without affecting the catechins content and antioxidant potential of green tea samples when compared to S-6 and P-8 methods. Interestingly, our results demonstrated significantly higher water extract values (42.19% dry weight) in green CTC teas and lower values in B-2 green tea samples (33.67%), as compared to S-8 and P-8 green teas, which received better taster ratings (≥ 7). These findings have highlighted the role of processing method and the impact of fixing technique in determining the contents of health-promoting attributes and taste quality of green teas, thus providing diverse choices to tea producers and consumers to opt for specific green tea products and expediting the need to further explore its commercial application in the nutraceutical and pharmaceutical industry (Supplemental Fig. S1).
-
Key words:
- Processing /
- Constituents /
- Quality /
- Green-tea /
- Biochemicals /
- CTC /
- Orthodox