


-
The quality of coffee encompasses various aspects, including aroma, flavor, fragrance, acidity, sweetness, and physical attributes of the coffee bean such as length, width, thickness, weight, shape, and color[1]. Paramount among these qualities are taste and aroma, serving as the primary sensory characteristics that dictate both the acceptability and market value of coffee. These essential attributes are intricately woven from a complex interplay of volatile and non-volatile chemical compounds, referred to as precursors, residing within the coffee bean[2]. The intricate symphony of coffee flavor is orchestrated by major chemical compounds, including caffeine, chlorogenic acids, sucrose, lipids, their derivatives, minerals, and various volatile components[3]. The overall quality of coffee beans is intricately shaped by a multitude of factors[4]. The interplay between genotype and environmental elements, including soil composition, altitude, climatic conditions in the coffee-growing region, harvest timing, and postharvest processing methods significantly influence the biochemical composition of coffee[1,5,6]. Consequently, key biochemical attributes like caffeine, chlorogenic acid, and sucrose content play pivotal roles in the organoleptic and sensory acceptability of coffee, undergoing alterations due to these environmental dynamics[7,8].
Ethiopian coffee exhibits a diverse range of flavors attributed to its geographical location, harvesting, and processing methods[9,10]. As the birthplace of highland Arabica coffee and a reservoir of genetic diversity for Arabica coffee[10,11]. Ethiopia boasts distinct flavor profiles across its various coffee types. Harar coffee boasts a mocha flavor, Sidamo coffee features a spicy profile, Jimma/Limu coffee offers a winy taste, and Lekempti/Gimbhi coffee presents a fruity flavor, among others[9,10,12]. The country's optimal environmental conditions, including altitude, fertile soil, and varied coffee production systems, enable the cultivation of specialty coffees[10,11]. Notably, the altitude at which coffee arabica grows in Ethiopia, ranging from 550 to 2,750 meters above sea level (m.a.s.l), with the highest altitudes associated with superior quality[10,11,13,14], makes it a key environmental factor influencing coffee quality.
A study conducted by Benti et al.[15] revealed the presence of genetic diversity among Ethiopian Arabica coffees. Additionally, coffee cultivation occurs in distinct agro-ecological zones across various geographical and political boundaries within the country, each characterized by unique production systems and processing methods[16−18]. These diverse production systems significantly influence the characteristics of coffee beans, thereby shaping the overall quality of the beans[18]. A study by Mintesnot & Dechassa[19] highlighted the impact of the coffee growing location on the biochemical composition, showcasing variability in the biochemical makeup of Arabica coffee across different regions of the country. Furthermore, a study by Fisk et al.[20] emphasized that the concentration of chemical precursors in coffee varies depending on their geographical origin. In the evaluation of coffee quality, both physicochemical and biochemical characteristics play integral roles[21], necessitating an exploration of the specific effects of growing environmental variables on overall quality.
Various scientific studies have explored the correlation between coffee quality, particularly its biochemical composition, and growing conditions as well as postharvest processing methods[1,5,6,10,14,22]. However, there is a limited number of comprehensive reports that establish a link between the physicochemical characteristics and biochemical composition of economically significant Ethiopian Arabica coffees and their growing environmental conditions across diverse agro-ecologies, production systems, and coffee-growing regions. Hence, this study aims to elucidate the association between the physicochemical characteristics and biochemical composition of coffees originating from various agro-ecologies and production systems through the application of principal component analysis.
-
Twenty premium Arabica coffee samples were sourced from different regions in Ethiopia, selected based on export potential data. Producers collected red coffee cherries, allowing natural drying (Fig. 1). A kilogram of green dried coffee per sample, along with geographical origin details, was collected from September to December 2022 with the aid of agriculture extension workers. Information included growing altitude, annual rainfall, latitude, longitude, maximum and minimum temperature (Table 1). Subsequently, the manually dehulled coffee samples were packed in an airtight jar until the laboratory analysis.
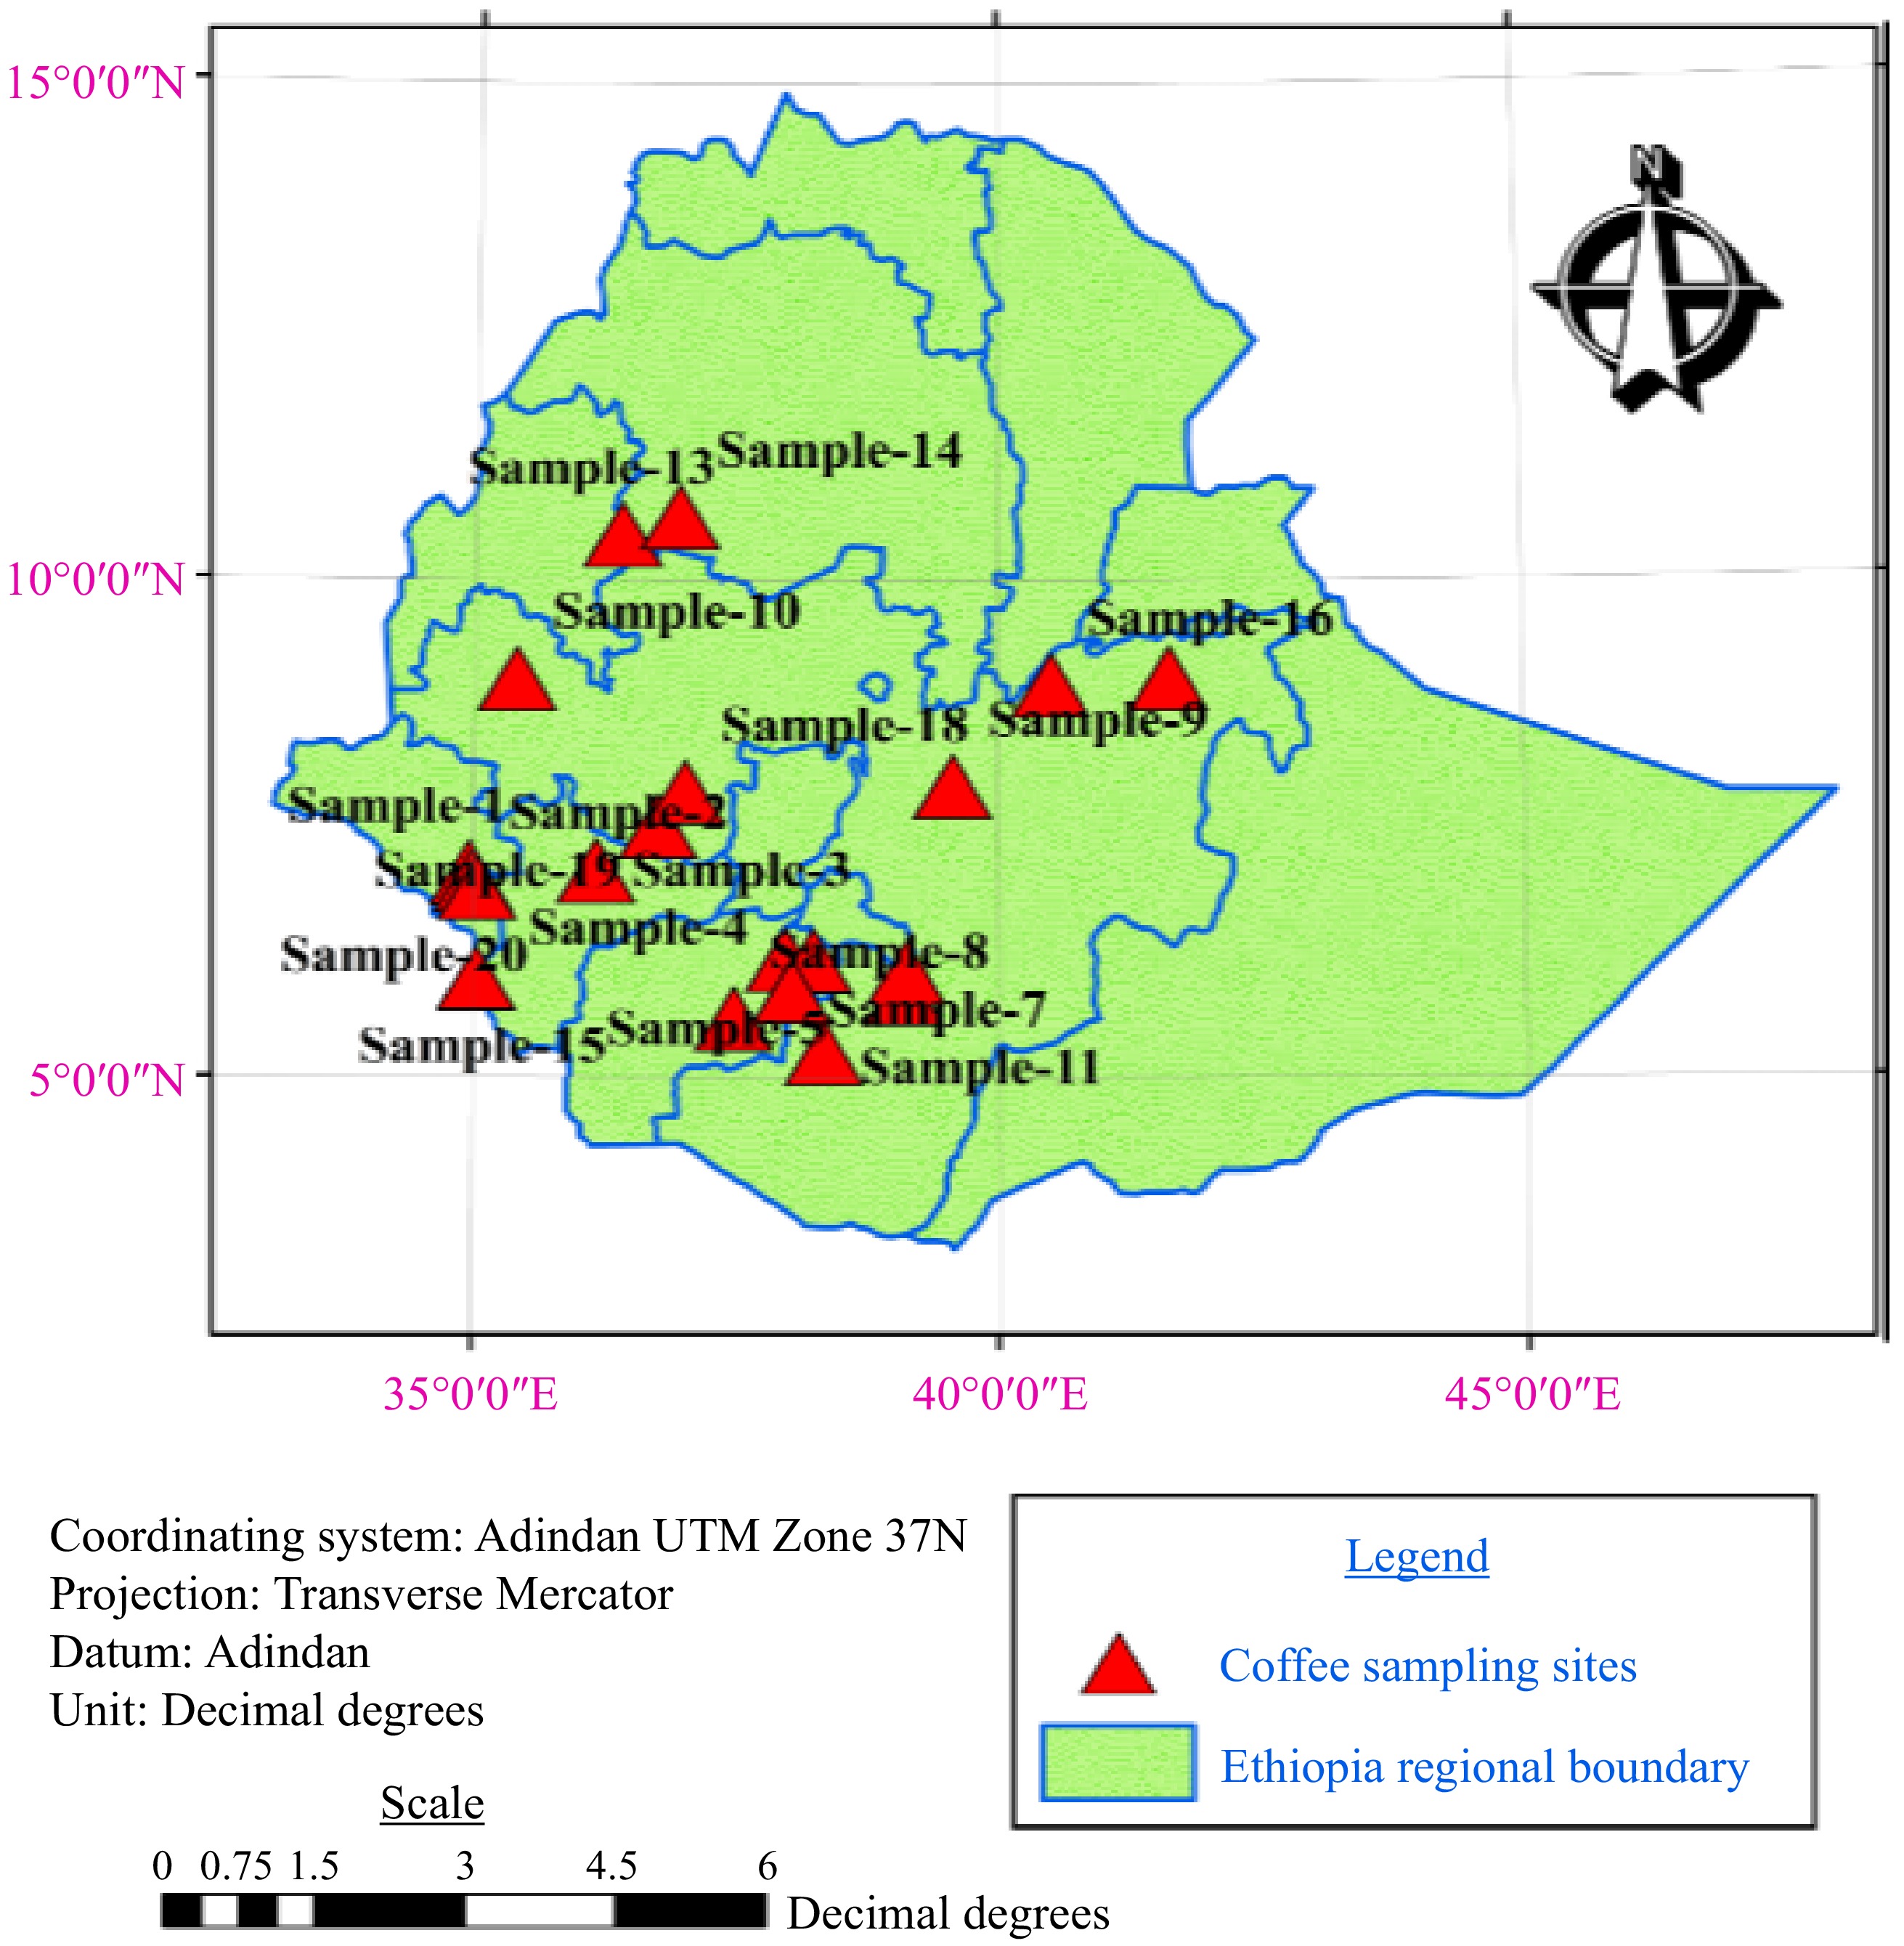
Figure 1.
Map of green Arabica coffee sampling sites.
Table 1. Coffee sample collected areas and their agro-ecologies (n = 20).
Sample Altitude (m.a.s.l.) Latitude (° N) Longitude (° E) Annual rainfall (mm) Tmax (°C) Tmin (°C) Region Sample-1 1,100−1,300 7.1215 35.2711 1,300−1,700 29.8 18 Southwest Ethiopia Sample-2 850−1,200 7.0142 35.3512 1,542−1,760 28 15 Southwest Ethiopia Sample-3 800−3,300 7.2727 36.2427 1,475−1,525 26.8 12.4 Southwest Ethiopia Sample-4 1,800−1,900 6.3045 38.0124 1,100−1,580 29.2 9.6 Southern Ethiopia Sample-5 1,900−2,000 6.3611 38.2514 1,200−1,400 23 10 Southern Ethiopia Sample-6 1,450−4,100 6.2431 39.1500 822−1,447 12 6 Southeast Ethiopia Sample-7 1,800−1,950 6.1003 38.1201 1,200−1,800 20 15 Southern Ethiopia Sample-8 1,080−3,600 5.7747 37.5564 735−1,400 20 12 Southeast Ethiopia Sample-9 1,537−2,075 8.0433 39.5915 800−1,200 25 15 Southeast Ethiopia Sample-10 1,845−1,930 9.1015 35.5012 1,400−1,800 30 10 Western Ethiopia Sample-11 1,350−2,340 5.4010 38.4011 500−1,800 25 15 Southeast Ethiopia Sample-12 1,450−3,200 6.0145 39.1515 822−1,447 34.4 10.4 Southeast Ethiopia Sample-13 1,650−2,560 10.580 36.5250 1,800−2,800 22 8 Northwest Ethiopia Sample-14 2,050−2,091 10.700 37.0668 1,386−1,757 24 14 Northwest Ethiopia Sample-15 1,500−2,100 6.1460 35. 0960 780−2,110 34 16 Southwest Ethiopia Sample-16 1,826−2,100 9.0501 40.5221 780−1,074 27.8 12.5 Eastern Ethiopia Sample-17 1,540−2,000 9.1144 41.6335 650−1,250 28 13 Eastern Ethiopia Sample-18 1,200−3,020 8.0960 37.0960 1,300−2,300 23 18 Southwest Ethiopia Sample-19 1,770−2,085 7.6788 36.8385 1,138−1690 30 14 Southwest Ethiopia Sample-20 900−2,700 7.2415 35.1317 400−2,000 27 15 Southwest Ethiopia Physicochemical characteristics analysis
Bean weight analysis
-
Bean weight (W100) was measured using a digital 2 kg, 0.01 g laboratory electronic balance according to a previous method[23], with slight modification. A known number (100 beans) of coffee beans from each sample was weighed and measured in triplicate.
Coffee bean moisture content analysis
-
The moisture content of the coffee samples was determined following the official AOAC (2000) method[24]. Initially, two grams of the test sample were precisely weighed, and this initial weight was recorded as W1. Subsequently, the sample underwent a drying process in an oven (Model: DGT-G25) at 136 °C for 1 h, followed by cooling and re-weighing, recorded as W2. The loss in weight during this process was calculated as the moisture loss of the sample, and the result was expressed as a percentage. The moisture content level played a crucial role in determining the dry matter content of both the green and roasted coffee samples. The percentage of moisture was calculated using the equation provided below (Eqn 1).
${\rm{Moisture}}\;{\text{%}}=\dfrac{{W_{t.}}\; of\; original\;sample -W_{t.}\;of\;dried\;sample }{W_{t.}\;of\;original\;sample}\times 100$ (1) Bean crude fat analysis
-
The determination of crude fat content in the samples followed the AOAC official methods[24,25]. The analysis involved the extraction of crude fat from the coffee sample utilizing the Soxhlet method, with hexane serving as the extraction solvent. Initially, the extraction cylinder was weighed, and its weight was recorded as W1. Following this, the bottom part of the extraction thimble was covered with clean cotton, and precisely 2 g of the coffee sample were measured and recorded as W2. The weighed coffee sample was then placed into the extraction thimble with cotton. Subsequently, 50 mL of hexane was introduced into the extraction cylinder and the thimble containing the sample, along with the cylinder with hexane were assembled in the Soxhlet extraction unit (Model: DW-SXT-06). Following a 4-h extraction period, the extraction cylinder was disconnected from the extraction chamber, and the sample was dried for 30 min in a drying oven. Finally, the cylinder was placed in a desiccator, allowed to cool, and the mass was measured and recorded as W3. The percentage of crude fat content in the coffee samples was then estimated using the equation provided as Eqn (2).
${\text{%}}\;{\rm{ Crude\; fat}}=\dfrac{{\mathit{W}}_{3}-{\mathit{W}}_{1}}{{\mathit{W}}_{2}}\times 100 $ (2) pH and titratable acidity analysis
-
Green coffee samples (10 g each) underwent grinding using a laboratory miller for subsequent pH and titratable acidity analysis, following the AOAC method[25]. The powdered samples were dissolved and homogenized in distilled water at a 1:5 ratio. For pH determination, the dissolved coffee samples were assessed using a digital pH meter (Model: PH-3CU) at room temperature (25 °C). To measure the total acidity of the samples, a 50 ml aliquot of the previously prepared extract was transferred into a conical flask, followed by the addition of two drops of phenolphthalein indicator. The conical flask content was then vigorously shaken, and titration ensued with 0.1 N NaOH solutions from a burette until a permanent pink color appeared. The volume of NaOH solution required for the color change was recorded, and the percentage of titratable acidity was calculated using Eqn (3).
$ {\rm{Titratable\;acidity\;(g/100\;ml)}}=\dfrac{(V\;in\;L)(N)(meq.wt.)}{wt.sample}\times 100 $ (3) Where, V is volume (ml) of NaOH in solution used for titration; N is the normality of NaOH; meq.wt. is the milliequivalent weight of NaOH = molecular mass of NaOH divided by number of equivalent moles = 40 g·mol−1/1 = 40 g·mol−1.
Biochemical characteristics analysis
Extraction of caffeine, chlorogenic acids, and trigonelline
-
Caffeine, chlorogenic acid, and trigonelline analysis of coffee samples were conducted by employing the method used by Sualeh et al.[5]. A precisely weighed 0.5 g of finely ground coffee sample was placed into a 50 mL Erlenmeyer flask. Subsequently, 50 mL of distilled water heated to 95 °C was added, and the mixture was stirred for 20 min on a hot plate. Following this, the extract underwent filtration using Whatman filter paper (No. 4), followed by an additional filtration step using a 0.22 μm pore size micro filter. Finally, 10 μL of the resultant extract was injected into the HPLC system for analysis.
Determination of caffeine, chlorogenic acids and trigonelline
-
The simultaneous determination of caffeine, chlorogenic acid and trigonelline followed the method outlined by Sualeh et al.[5], employing an HPLC device equipped with a C18 column (4.6 mm × 250 mm, 5 μm particle size). The mobile phases utilized were 5% acetic acid (A) and acetonitrile (B), with a gradient elution scheme as follows: 0–4 min: 4% B; 4–8 min: 10% B; 8–12 min: 90% B; 12–15 min: 0% B; and 15–17 min: 4% B. The flow rate was set at 0.7 mL/min, and a diode-array detector was employed. Detection wavelengths were 272 nm for caffeine and trigonelline, and 320 nm for chlorogenic acid.
Identification of caffeine, chlorogenic acid, and trigonelline in the test samples was achieved by determining the retention time of these analytes using pure standards of caffeine, chlorogenic acid, and trigonelline. For quantification, calibration curves were established using standards of caffeine, chlorogenic acid, and trigonelline, along with the peak areas of the samples. Standard solutions were prepared at concentrations of 5, 10, 20, 40, 50, 100, and 200 μg·mL−1 for caffeine and trigonelline, and 5, 10, 20, 40, 50, 100, and 200 μg·mL−1 for chlorogenic acid. Concentrations were calculated from peak areas utilizing the calibration equations.
Sucrose analysis
-
The determination of sucrose content in the coffee samples followed the method outlined by Worku et al.[6]. Accurately weighed grounded coffee (0.5 g) was extracted with 25 ml of distilled water containing 30 mg of Phenyl-Beta-D-glucopyranoside, serving as an internal standard solution. This solution was prepared using 600 mg of Phenyl-Beta-D-glucopyranoside with 100 ml of distilled water. The extraction process occurred in a hot water bath at 60 °C for 30 min. Following extraction, carrez I and carrez II reagents (5 mL each), along with distilled water, were added up to 50 ml. The resulting extract underwent filtration using a 0.45 μm PTFE filter, and 0.5 ml of the filtrate was transferred into an HPLC vial and dried using nitrogen gas.
Subsequently, 0.5 ml of 'STOX' reagent (hydroxylamine hydrochloride 25 g·L−1 in dry pyridine) was added to the dried extract, and the vials were oven-dried at 60 °C for 30 min. The extracts were allowed to cool at room temperature, and 0.5 mL of hexamethyldisilazane (HMDS) and 0.05 ml of trifluoroacetic acid (TFA) were added, followed by a 60-min incubation period to allow phase separation. Finally, 1 μL of the upper layer was extracted and injected into the gas chromatographic system.
The chromatographic parameters employed included a stationary phase of (5%-phenyl)-methylpolysiloxane, with a film thickness of 0.25 μm, a column measuring 30 m × 0.32 mm inside diameter, and a mobile phase flow rate set at 1 mL·min−1, with a split ratio of 1/40. The injector temperature was maintained at 250 °C, the detector temperature at 340 °C, and the temperature program involved an initial stage at 180 °C for 1 minute, followed by a ramp at 15 °C min−1 to 290 °C. The flame ionization detector operated with hydrogen and air at 30 and 300 mL min−1, respectively, while helium served as the makeup gas at a flow rate of 20 mL·min−1. Identification of compounds was accomplished based on the retention time of standards (Supplemental Fig. S1).
Principal component analysis
-
Geographical information (altitude, annual rainfall, and average temperature) of each coffee sample was collected with the samples. All the geographical information, physicochemical analysis data (bean density, moisture content, bean crude fat, pH, titratable acidity), and biochemical analysis data (caffeine content, chlorogenic acid, trigonelline, and sucrose content) were grouped in a spreadsheet according to their origin, where they were collected. Multivariate analysis of principal components was conducted and the result was generated in the form of Biplot graphics.
Statistical analysis
-
Statistical analyses were conducted using the R Studio version 4.3.1 software. Data from physicochemical analysis, HPLC analysis were input into SPSS software and then exported to R software for the requisite statistical analysis. The correlation analysis between environmental variables and the physicochemical and biochemical characteristics of green coffee beans utilized the Pearson correlation coefficient. Principal component analysis (PCA) was performed in R Studio, and a biplot was generated to visually illustrate the associations between environmental variables and the physicochemical and biochemical characteristics of green Arabica coffee beans.
-
The measurement of Hundred Bean Weight (W100) holds significant importance in assessing the physical characteristics of green coffee beans, contributing to overall coffee quality[26]. It serves as a key determinant of bean size, with a higher weight indicating larger bean size, as evidenced by previous studies[27]. The data presented in Table 2 reveals that green coffee beans' Hundred Bean Weights range from 13.22 to 17.28 g, with an average weight of 15.49 ± 0.98 g. This finding aligns with previous research[14,23,28]. The coefficient of variation (CV), calculated among samples collected from diverse agroecologies, stands at 6.34%. Notably, Bekele[26] suggests that coffee beans of similar genotypes may display significant variations in green bean weights. This diversity in bean size is attributed not only to genetic factors but also to environmental conditions and the incorporation of organic materials in cultural practices, as highlighted by Nugroho et al.[27]. Moreover, Mintesnot et al.[22] elucidate that discrepancies in bean weight across locations may stem from variations in coffee fruit development metabolism influenced by moisture and temperature, factors modifiable through effective management practices, altitude adjustments, and soil moisture regulation.
Table 2. Green coffee samples physicochemical characteristics (n= 20).
Samples Hundred bean weight (g) Bean moisture content (%) Bean crude
fat content
(%)pH Titratable acidity mL of NaOH g−1 Sample-1 14.59 8.55 10.39 5.38 3.05 Sample-2 13.2 8.4 10.35 5.48 1.8 Sample-3 16.2 10.45 15.4 4.85 2.33 Sample-4 15.71 9.45 11.87 5.11 2.26 Sample-5 15.38 9.25 13.27 5.18 3.02 Sample-6 17.28 11.87 16.19 4.3 1.97 Sample-7 14.53 8.5 12.5 5.41 1.93 Sample-8 17.14 10.72 16.83 4.54 2.02 Sample-9 15.86 9.55 13.81 5.05 2.61 Sample-10 14.95 9 12.78 5.2 2.25 Sample-11 15.77 9.5 14.32 5.01 2.48 Sample-12 16.67 10.6 14.97 4.8 2.88 Sample-13 16 9.95 14.42 5.01 2.32 Sample-14 15.21 9.2 13.99 5.19 2.57 Sample-15 15.51 9.45 14.12 5.11 3.19 Sample-16 15.46 9.3 14.1 5.15 2.26 Sample-17 14.97 9 13.19 5.2 2.49 Sample-18 16.19 10 14.93 4.91 3.45 Sample-19 15.21 9.2 14.03 5.21 2.4 Sample-20 14.14 9.95 14.51 5.04 2.86 Mean 15.4985 9.5945 13.7985 5.0565 2.507 SD 0.983 0.845 1.657 0.2804 0.448 CV % 6.343 8.816 12 5.54 17.87 Sample-6 of coffee, cultivated at an elevation of 2,775 m.a.s.l., exhibits the highest recorded bean weight, while conversely, coffee beans from the lowest altitude (1,025 m.a.s.l.) demonstrate the lowest hundred bean weight. This altitude-dependent pattern is visually elucidated in Fig. 2a, underscoring a substantial association between coffee bean weights and the respective growing altitudes. This observation aligns with the findings of Tolessa et al.[14], who reported a positive correlation between hundred bean weight and growing altitude. Importantly, an elevation increase corresponds to a concurrent rise in the weight of the hundred beans, a phenomenon ascribed to the elevated altitude inducing a decrease in ambient temperature and an extension of the berry maturation process. This extended maturation period allows for an increased duration for bean filling, thereby contributing to amplified cherry weight at higher altitudes[14,28,29]. The correlation is further underscored by the scatter plot in Fig. 2b, wherein the average temperature of the growing region exhibits a negative correlation with the hundred-bean weight of the green coffee beans.
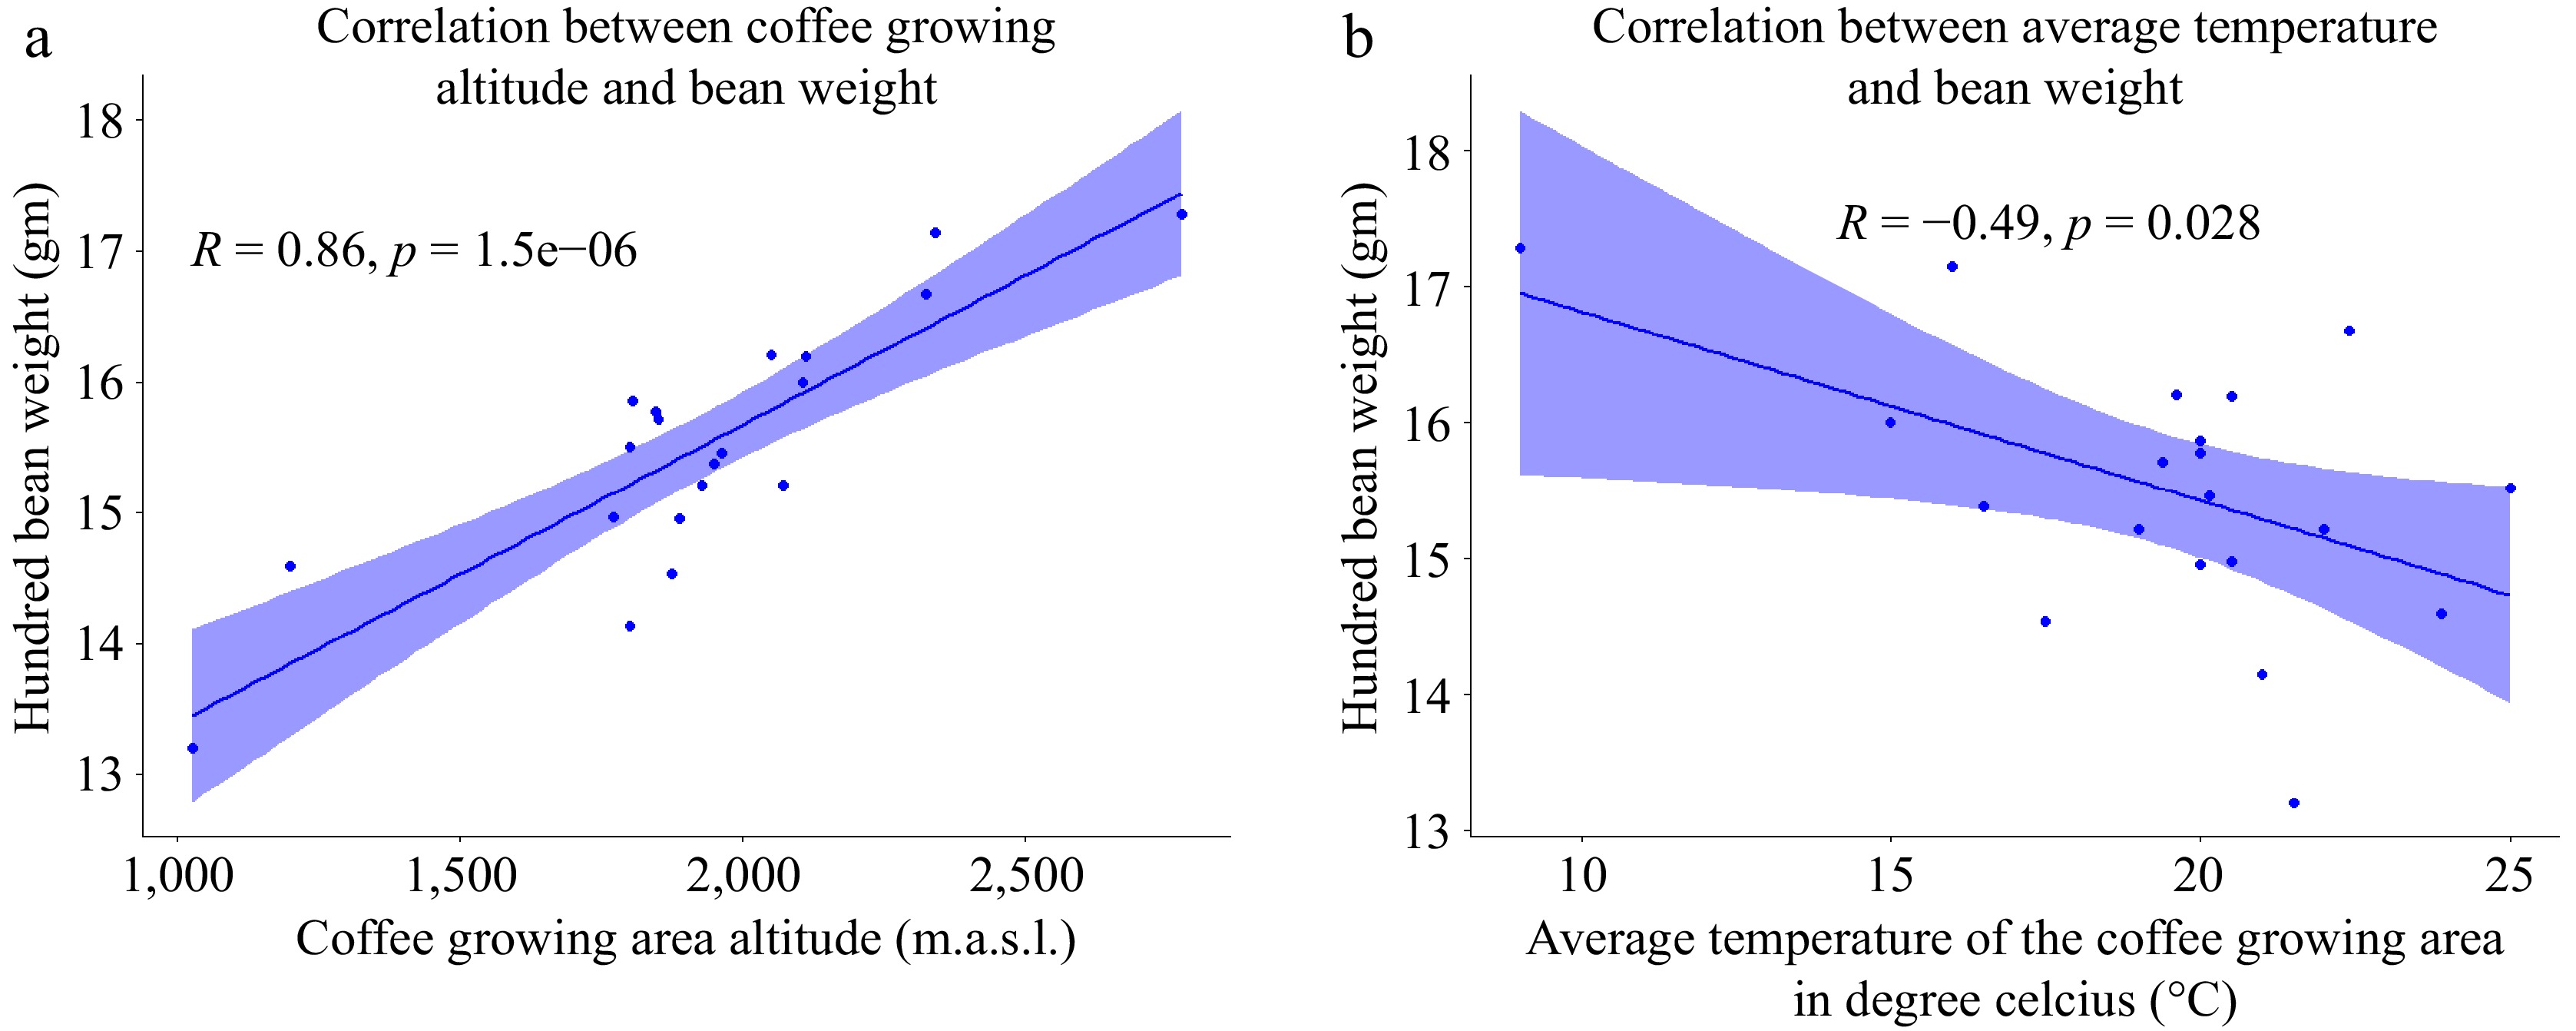
Figure 2.
(a) Scatter plot of coffee growing altitude correlation with hundred bean weight. (b) Scatter plot of the correlation average temperature with hundred-bean weight (n = 20).
The negative correlation emphasizes that a decrease in average temperature is associated with an increase in the hundred-bean weight. However, it is noteworthy that despite our extensive analysis, no apparent correlation was detected between the annual rainfall in the coffee-growing environment and the hundred-bean weight. This observation suggests that, unlike altitude and temperature, annual rainfall may not be a significant factor influencing the weight of the hundred beans. The complex interplay of various environmental elements highlights the complexity of factors shaping the physical characteristics of coffee beans in a given agro-ecological setting.
Coffee bean moisture content
-
The moisture content of green coffee beans is one of the most important quality parameters[30]. The green bean moisture content, ranging from 8.4% to 11.87% (as detailed in Table 2), exhibited variability across different altitudes. Particularly, sample 2, collected at the lowest altitude, recorded the lowest bean moisture content, while sample 6, gathered from the highest altitude, displayed the highest moisture content. This altitude-dependent trend is visually represented in Fig. 3a, highlighting a significant positive correlation between the moisture content of green coffee beans and the altitude of their cultivation. Specifically, as the coffee growing altitude increases, there is a corresponding increase in the moisture content of the beans. This positive correlation is further elucidated by considering the environmental conditions at lower elevations, where coffee beans tend to grow. In these warmer climates, the humidity levels during the drying period are lower, potentially contributing to the observed lower moisture content in beans grown at lower altitudes[31]. These findings underscore the complex relationship between altitude and moisture content, shedding light on the environmental factors influencing the quality of green coffee beans
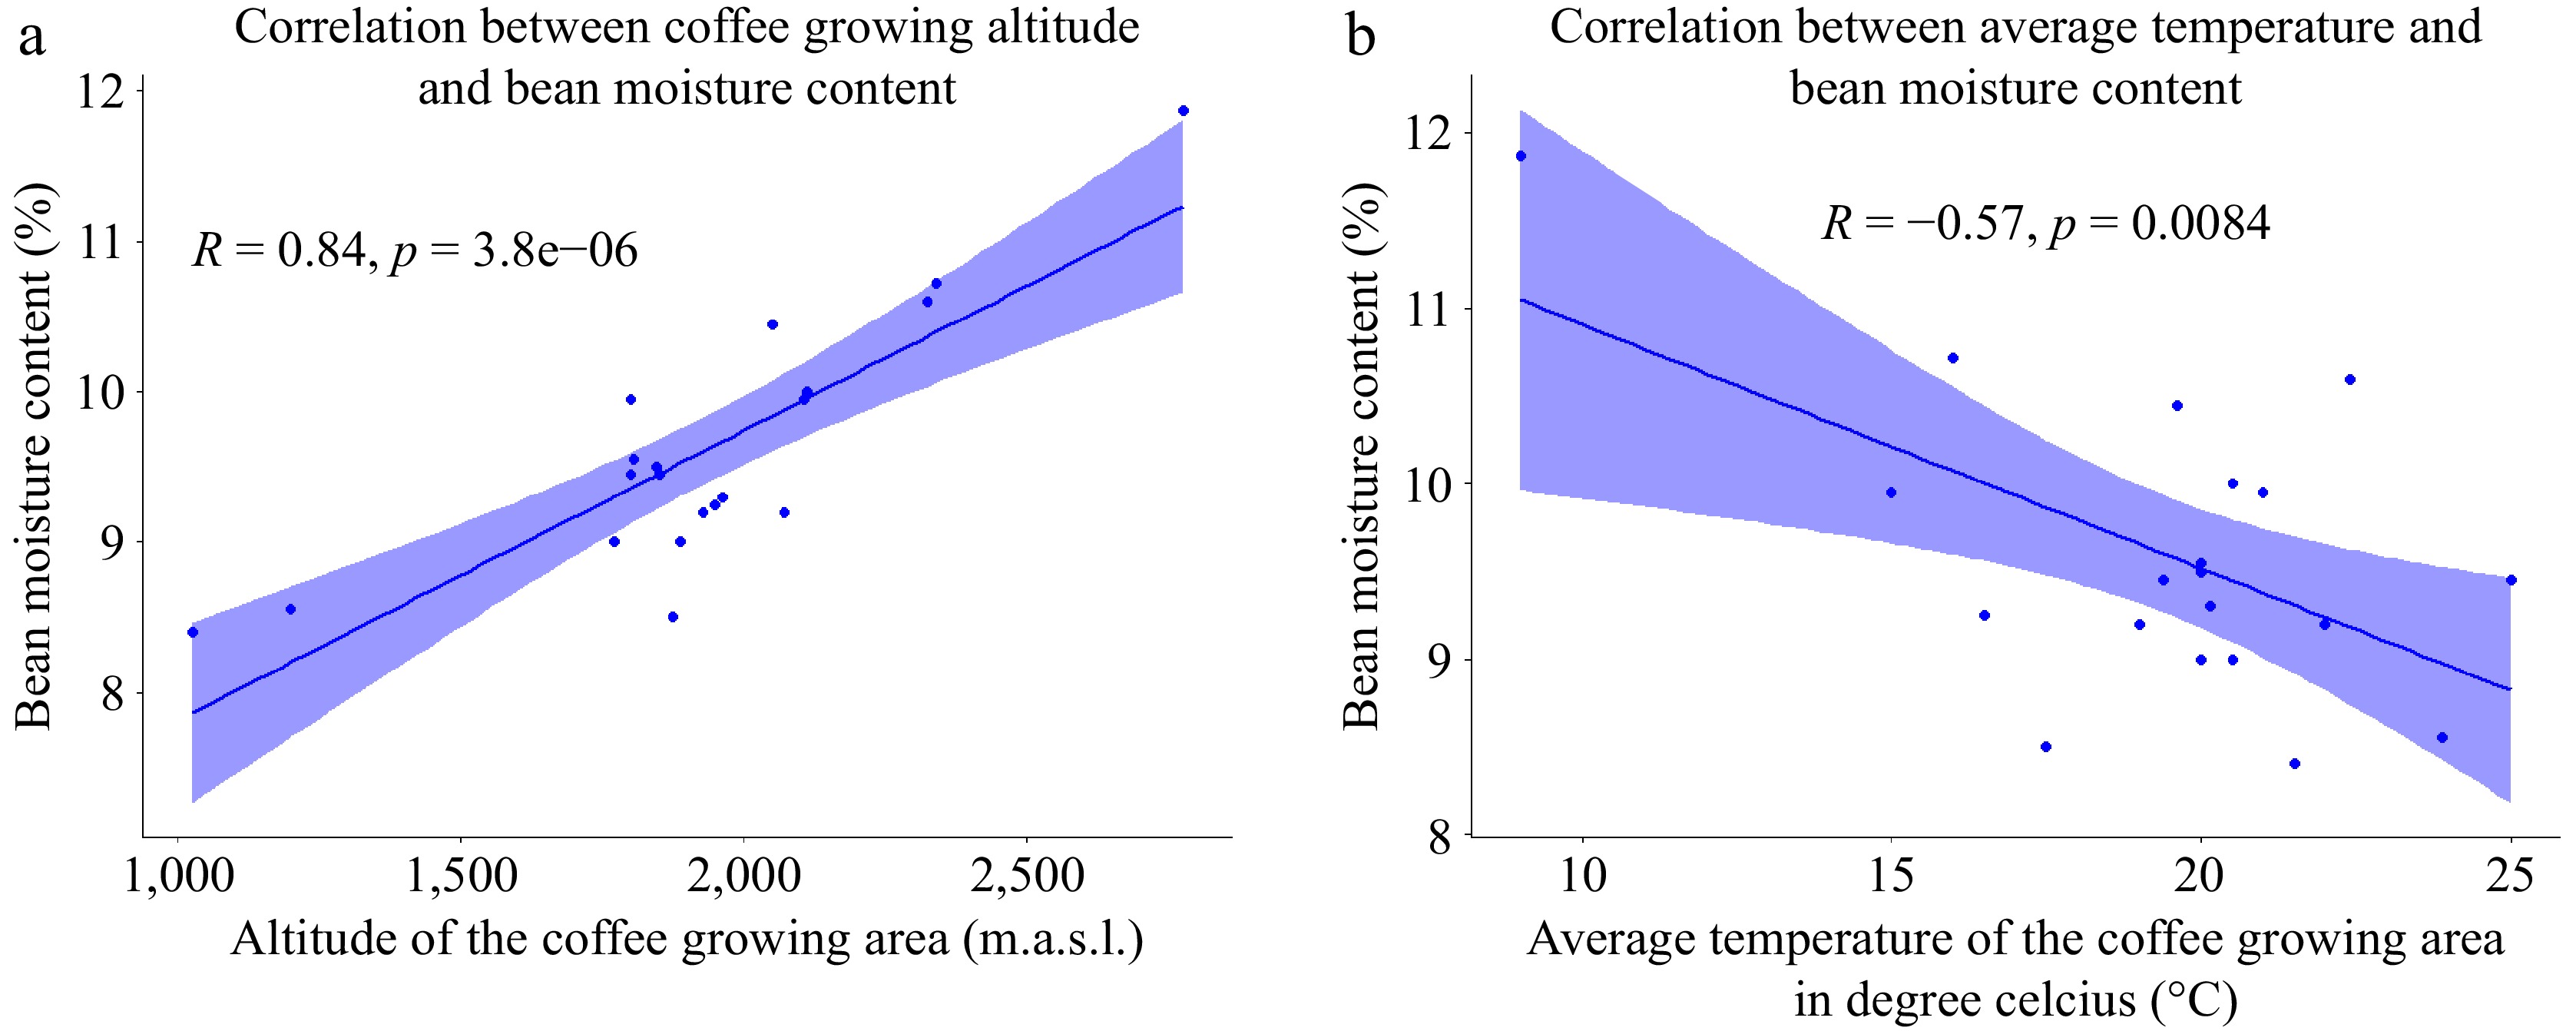
Figure 3.
(a) Scatter plot of the correlation between altitude and bean moisture content. (b) Scatter plot of the correlation between temperature and bean moisture content (n = 20)
Coffee beans exhibit a higher moisture loss during the drying process at elevated altitudes, where both relative humidity and temperatures are increased. These conditions collectively contribute to a positive association between bean moisture content and growing altitudes. The calculated average moisture content for 20 green Arabica coffee bean samples, originating from various altitudes is determined to be 9.59 ± 0.84, showcasing a notable coefficient of variation (CV) of 8.81%. This high variation among the samples emphasizes the considerable diversity in moisture content, further underscoring the influence of growing altitudes on the moisture dynamics of coffee beans. As elucidated by Mintesnot et al.[22], fluctuations in the moisture content of green coffee beans can be linked to the intricacies of the drying process and the relative humidity prevailing at the drying site. This notion gains further support from the findings of Cassamo et al.[28], who reported that with an elevation increase, there is a concurrent decrease in temperature and an augmentation in water availability due to factors such as persistent fog.
Moreover, our present study identified a notable observation: a negative association between the average temperature of the coffee growing environment and the moisture content of the beans. This finding suggests that as the average temperature increases, there is a corresponding decrease in bean moisture content (Fig. 3b). However, our study did not detect any significant association between the moisture content of coffee beans and the annual rainfall in the coffee-growing environment. Despite thorough analysis, the observed moisture content variation in coffee beans does not exhibit an apparent correlation with the annual rainfall, suggesting that the coffee growing altitude, average temperature, and other factors may play a predominant role in influencing the moisture dynamics of the beans.
Green coffee bean crude fat
-
Coffee lipids are primarily composed of triglycerides, sterols, and tocopherols, as well as the distinctive diterpenes and their esters with fatty acids. The oil extracted from Arabica green coffee beans contain a high concentration of fatty acids. Linoleic and palmitic acids are the most abundant fatty acids in green coffee beans[32,33]. The crude fat content of green coffee beans, as outlined in Table 2, exhibits variability across samples, with the highest recorded content of 16.83% in sample 8 and the lowest at 10.35% in sample 2. These values align with the research findings of Degefa et al.[34], who reported a range of 8.89% to 16.08% for the crude fat content of green Arabica beans. Figure 4a illustrates a positive correlation between crude fat content of coffee beans and the altitude of cultivation. Specifically, as the growing altitude increases, there is a corresponding rise in the crude fat content of the beans, corroborating the results previously reported[35,36]. The increased crude fat content in green Arabica coffee beans at higher altitudes are attributed to the slower maturation of beans often harvested one to two months later than those at lower elevations. This extended maturation period allows for enhanced bean filling, including increased lipid accumulation, as supported by previous studies[14,37].
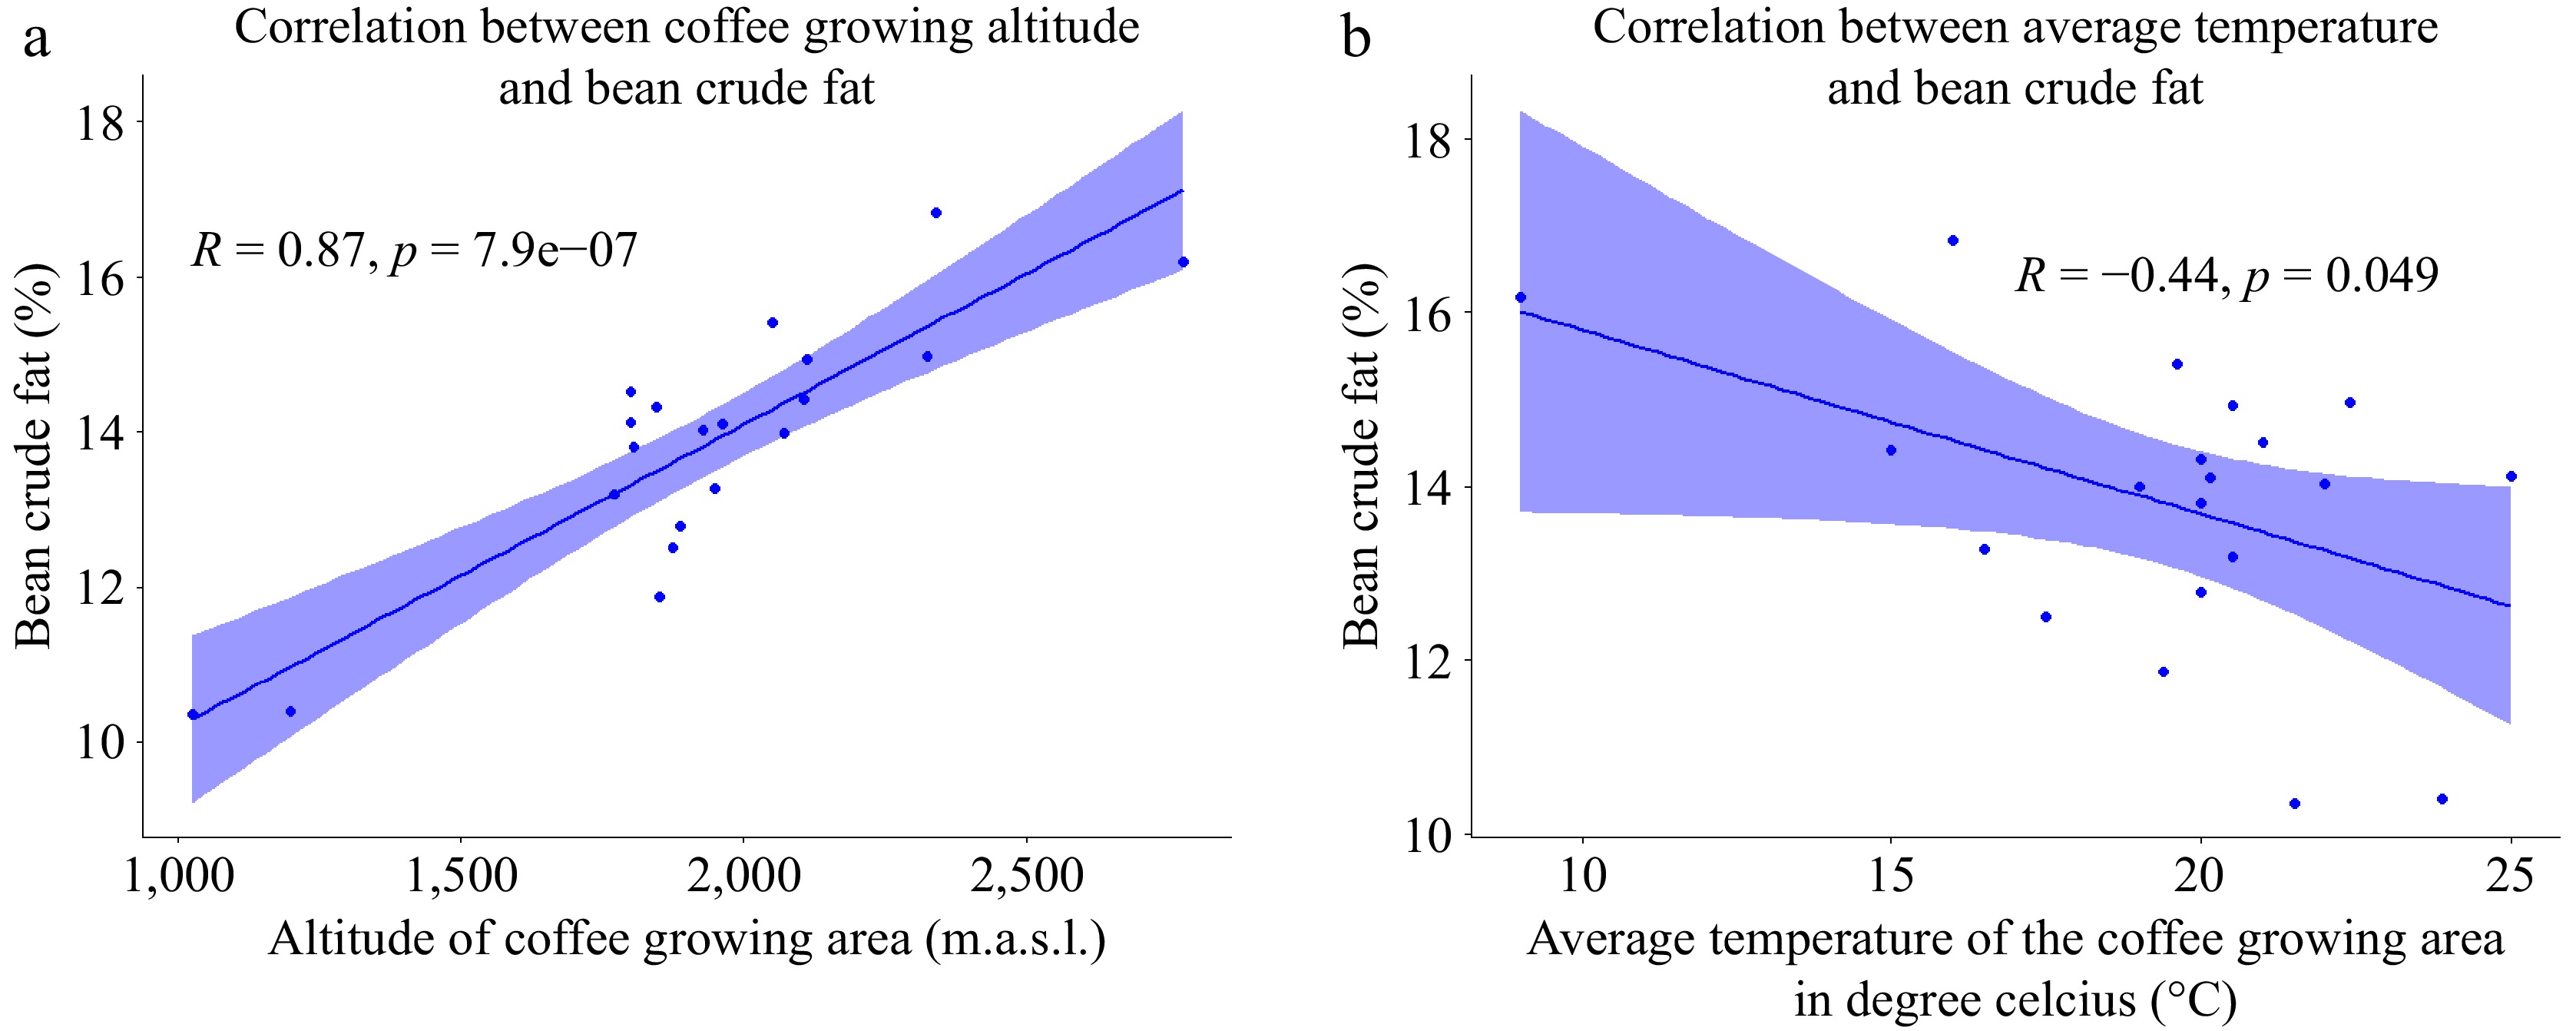
Figure 4.
(a) Scatter plot of the correlation between altitude and coffee bean crude fat content; (b) Scatter plot of the correlation between environmental temperature and green Arabica bean crude fat content (n=20).
Contrarily, our study reveals a negative correlation between the crude fat content of coffee beans and the average temperature of the coffee growing area (Fig. 4b). This contradicts the findings of Villareal et al.[38], who reported a positive correlation between environmental temperature and bean crude fat content. The intricate nature of these relationships is highlighted by Joët et al.[39], emphasizing that the associations between altitude/temperature and the final total lipid content appear to be highly dependent on the coffee variety. Despite the observed associations between altitude and environmental temperature with the crude fat content of coffee beans, our study did not reveal any significant correlation between the annual rainfall in the coffee growing environment and the crude fat content of coffee beans. This finding underlines the multifaceted nature of factors influencing the composition of coffee beans' crude fat content.
Green bean pH and titratable acidity (TA)
-
The sourness of coffee, in addition to bitterness, savory taste, and sweetness is an important factor in determining the taste of coffee and is related to pH and TA[40,41]. The pH indicates acidity by measuring the concentration of H3O+[40,41]. The pH values of green coffee beans sourced from diverse regions of Ethiopia are presented in Table 2, ranging from 4.54 to 5.48. Notably, the present findings indicate lower pH values compared to those reported previously[42] for green Arabica coffee samples from the Hararge area, where the pH ranged from 5.26 to 5.66. The observed variation can be attributed to the diverse agroecologies from which our samples were collected. It is well-established that coffee's sensory characteristics exhibit variability depending on its geographic origin[43−45].
Despite the findings of Worku et al.[6], who reported no significant difference in acidity with increasing altitude for coffee grown without shade, the present study reveals a negative association between coffee growing altitude and coffee bean pH. As depicted in the scatter plot in Fig. 5a, there is an observable trend wherein an increase in altitude corresponds to an increase in acidity and a decrease in pH values. This observation is consistent with previous research findings[43,45,46]. Furthermore, Bertrand et al.[47] emphasized that coffees grown in cooler climates at higher elevations tend to exhibit higher acidity, superior aroma quality, and fewer flavor defects compared to those cultivated in warmer climates at lower elevations.
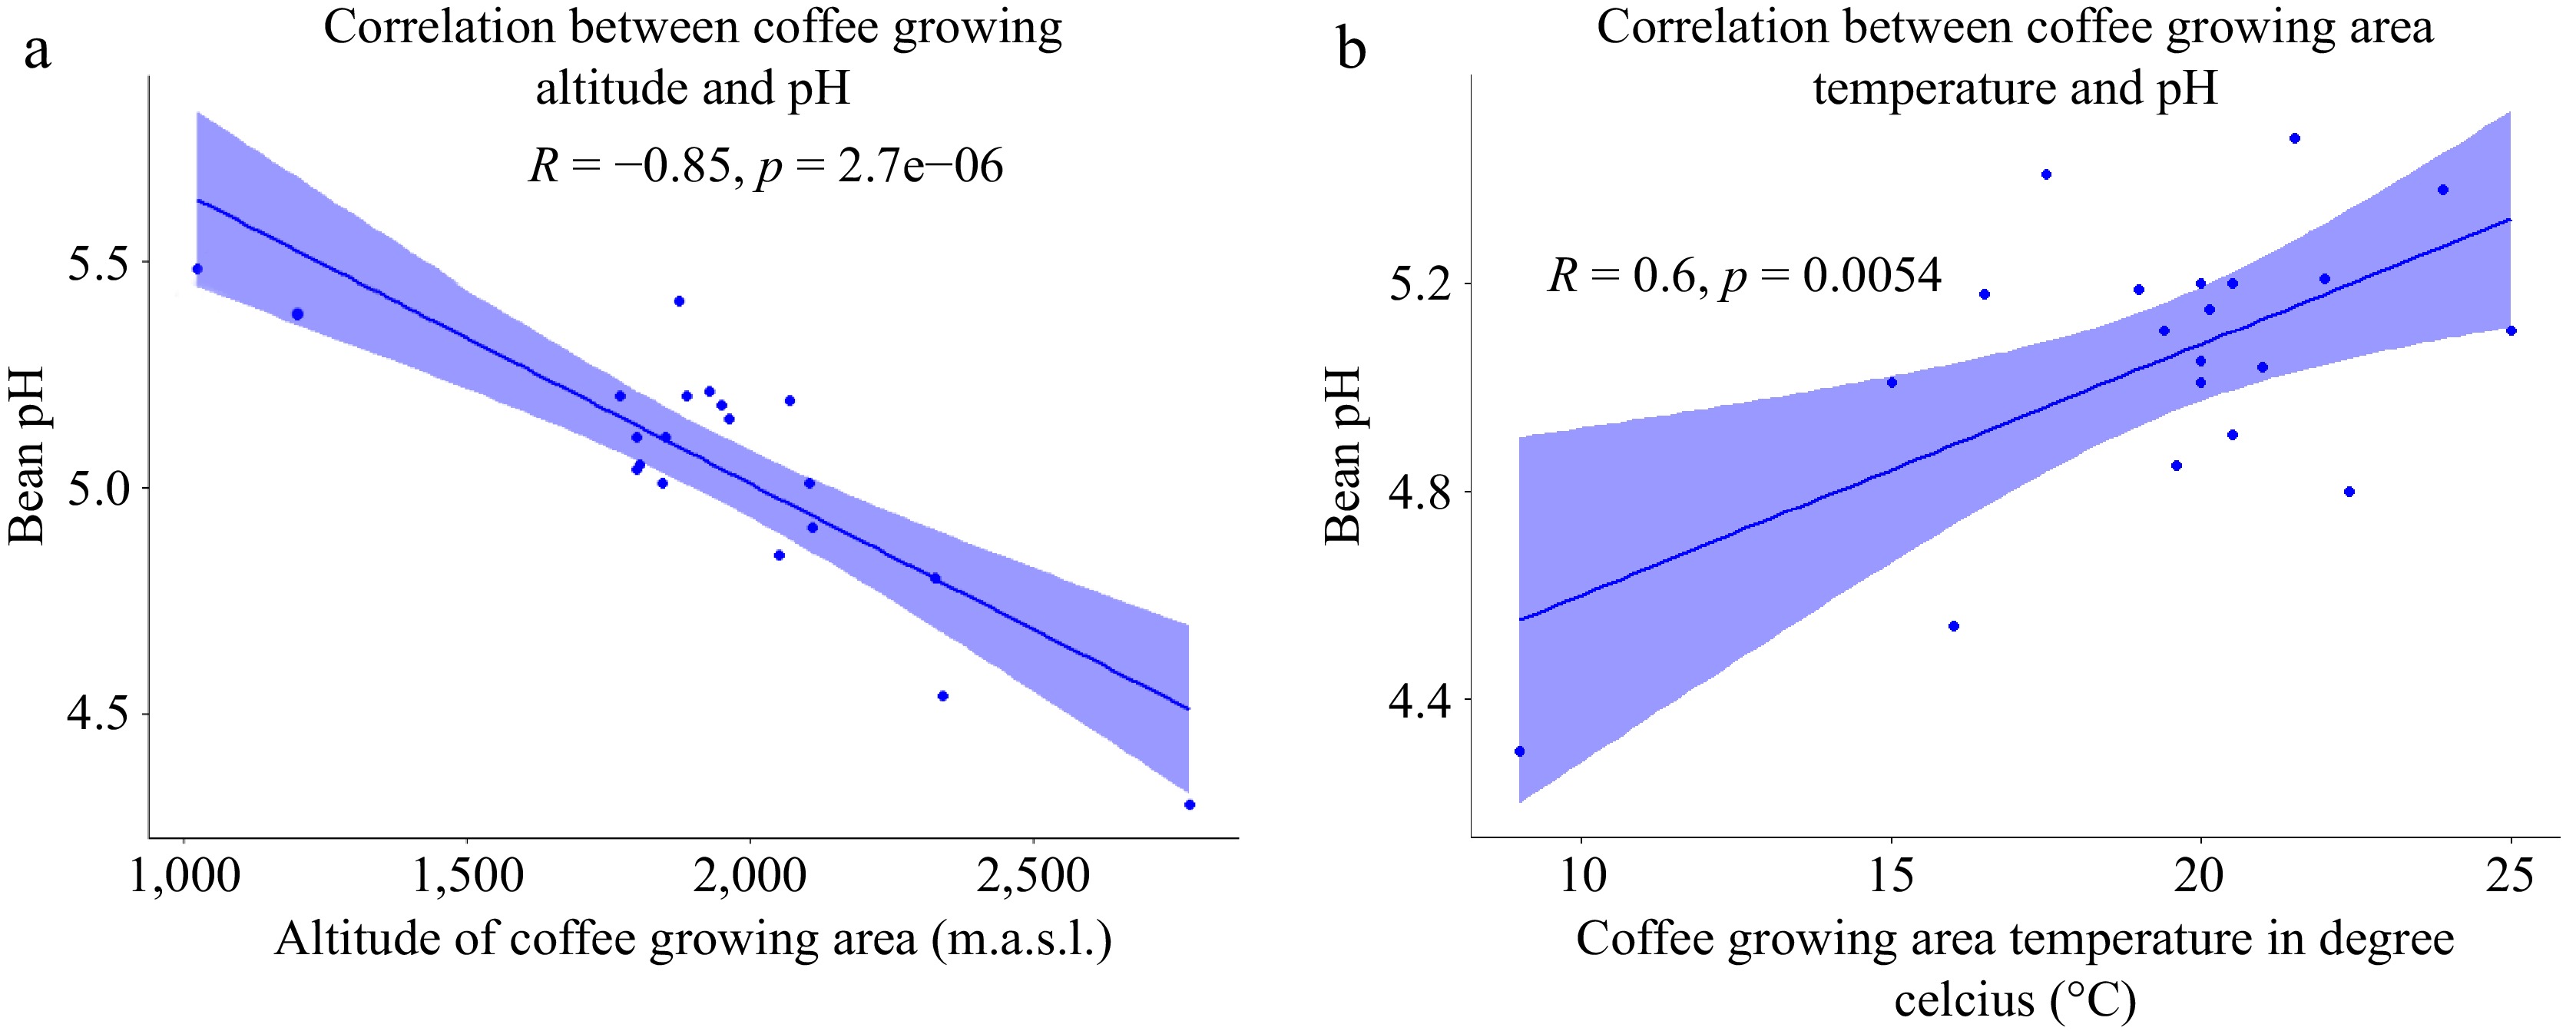
Figure 5.
(a) Scatter plot of the correlation between altitude and coffee bean pH. (b) Scatter plot of the correlation between average temperature and coffee bean pH (n = 20).
Additionally, Tolessa et al.[14] reported a lack of noticeable differences in coffee bean quality at higher altitudes with open or medium shade levels. This phenomenon could be attributed to the direct impact of altitude on various environmental factors such as average temperatures, humidity, and radiation, influencing both tree characteristics and fruit composition[48]. Altitude, affecting the daily temperature demonstrates that a mere increase in height of 100 m can result in a reduction of the average daily temperature by 0.6 °C[49]. Such temperature variations play a crucial role in the phenology cycle of coffee plants, especially during the development and processing phases of coffee beans. Lower temperatures slow down fruit ripening, leading to a more extended and precise fruit-filling process, as explained by Nugroho et al.[50]. In accordance, as visually represented in Fig. 5b, the present study elucidates a discernible negative correlation between the environmental temperature and the pH value of the coffee beans. However, the present investigation found that the annual rainfall in the coffee-growing environment did not exhibit any significant association with the pH value of coffee beans.
Titratable acidity (TTA) serves as an indicator of the concentration of total acids in foods, providing a measure that better reflects the impact of acids on flavor by considering the effects of non-degraded acids[40,41]. A higher TTA value signifies greater acidity in coffee, with higher acidity often associated with lower coffee quality in terms of flavor[51]. In the present study, the TTA of green coffee samples ranged from 1.80 to 3.19 ml of NaOH g−1, with an average TTA of 2.50 g/100 mL of NaOH g−1 and a coefficient of variation of 18% (Table 2). It is noteworthy that our TTA values differ slightly from those previously reported by Bayle & Adamu[42], who documented TTA values for green coffee samples from Hararge in the range of 1.44–2.3 mL of NaOH g−1. This discrepancy may arise due to variations in coffee acidity influenced by factors such as origin, crop climatic conditions, fruit maturation stage, harvest timing, and processing methods[51].
Interestingly, the present study did not reveal any significant association between coffee-growing altitudes and the TTA of coffee beans. However, we observed a notable correlation between the average temperature of the coffee growing environment and the TTA of green beans across different agro-ecologies in Ethiopia (Fig. 6).
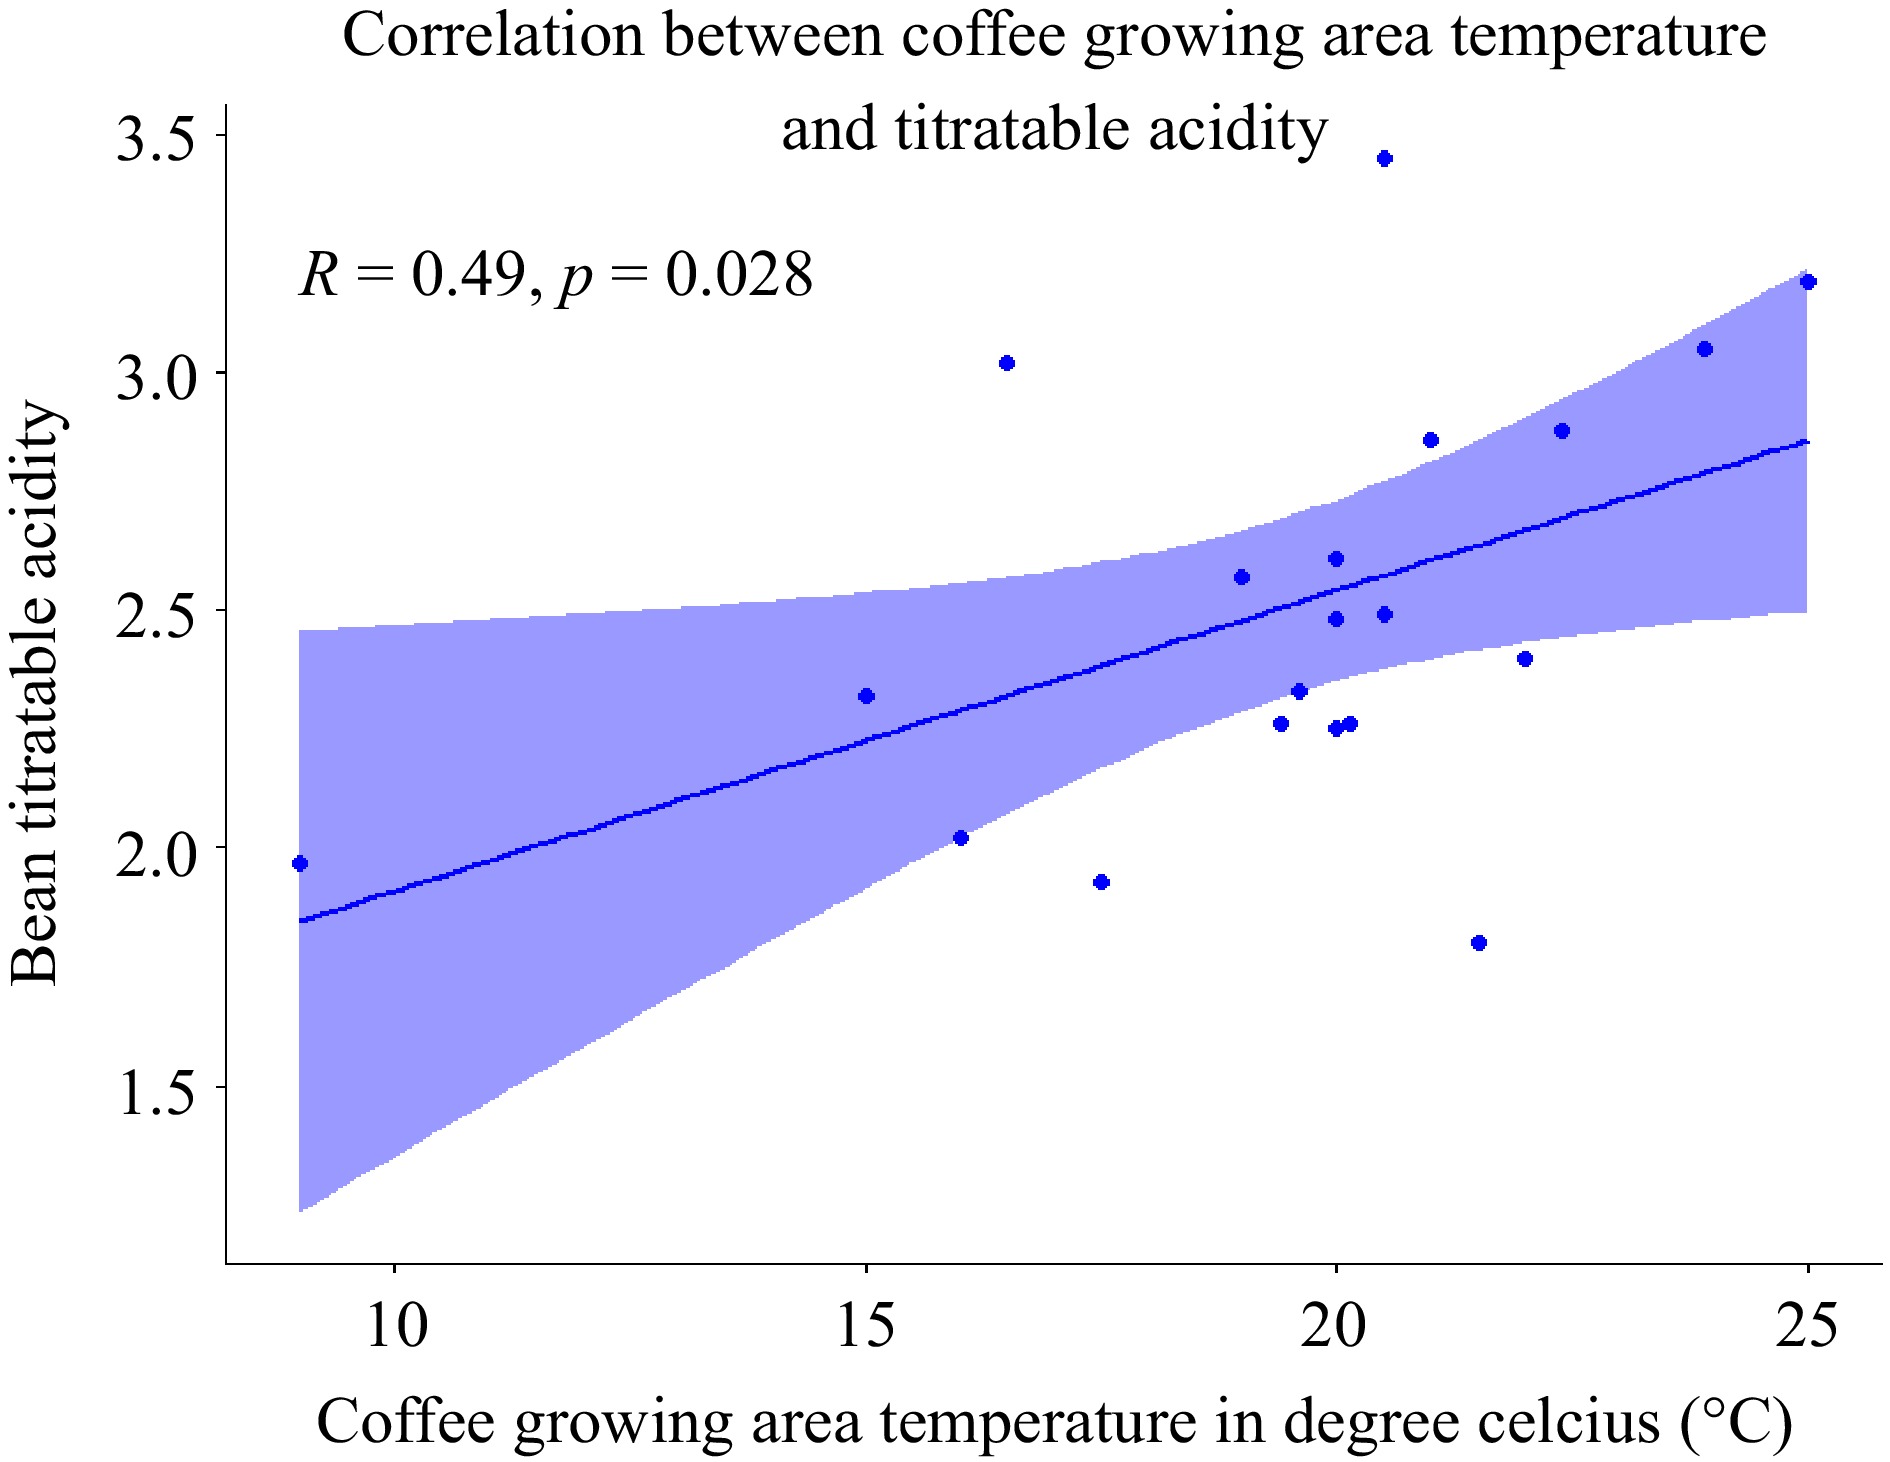
Figure 6.
Scatter plot of the correlation between coffee growing area temperature and titratable acidity of the bean (n = 20).
Biochemical composition of green Arabica beans and their association with environmental variables
Method validation
Identification
-
The identification of peaks at 4.46, 13.58, and 18.38 min was accomplished for trigonelline, caffeine, and chlorogenic acid, respectively (Fig. 7). This determination was facilitated by considering the results outlined above and comparing the retention times of the peaks with the reference standards for trigonelline, caffeine, and chlorogenic acid. Whereas, the identification of sucrose attained at 8.86 min (Fig. 8).
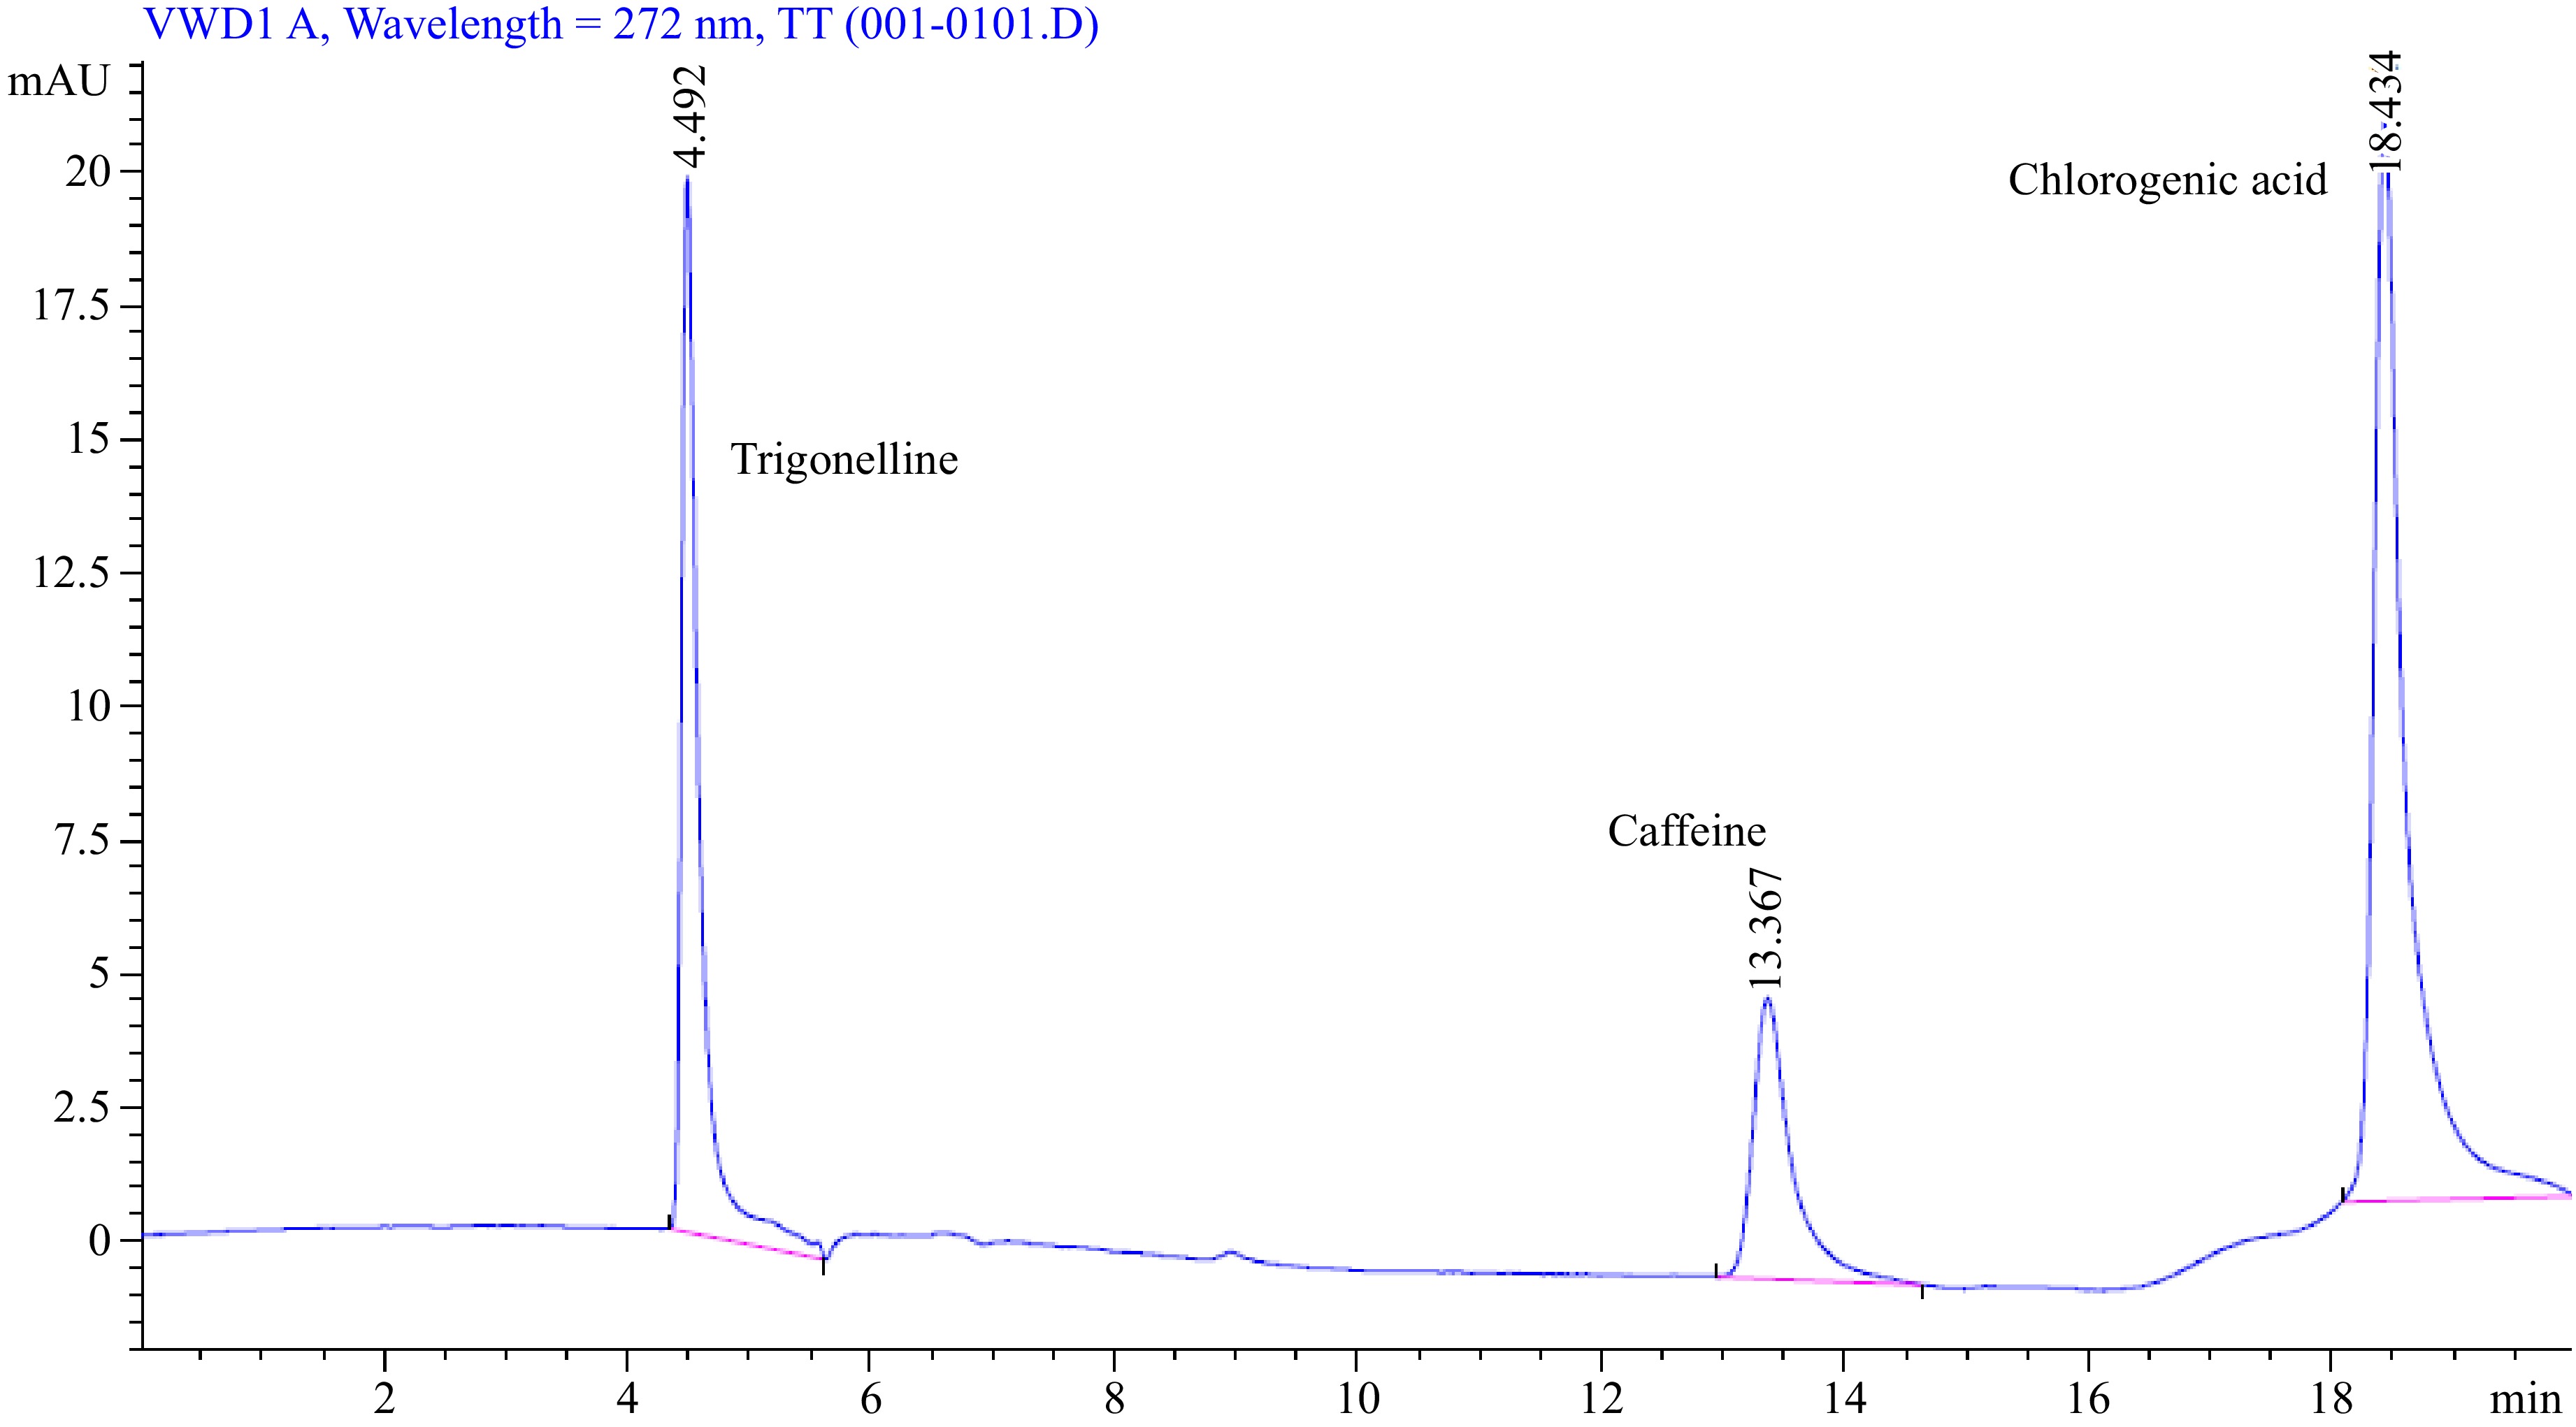
Figure 7.
Trigonelline, caffeine, and chlorogenic acid standard chromatogram.
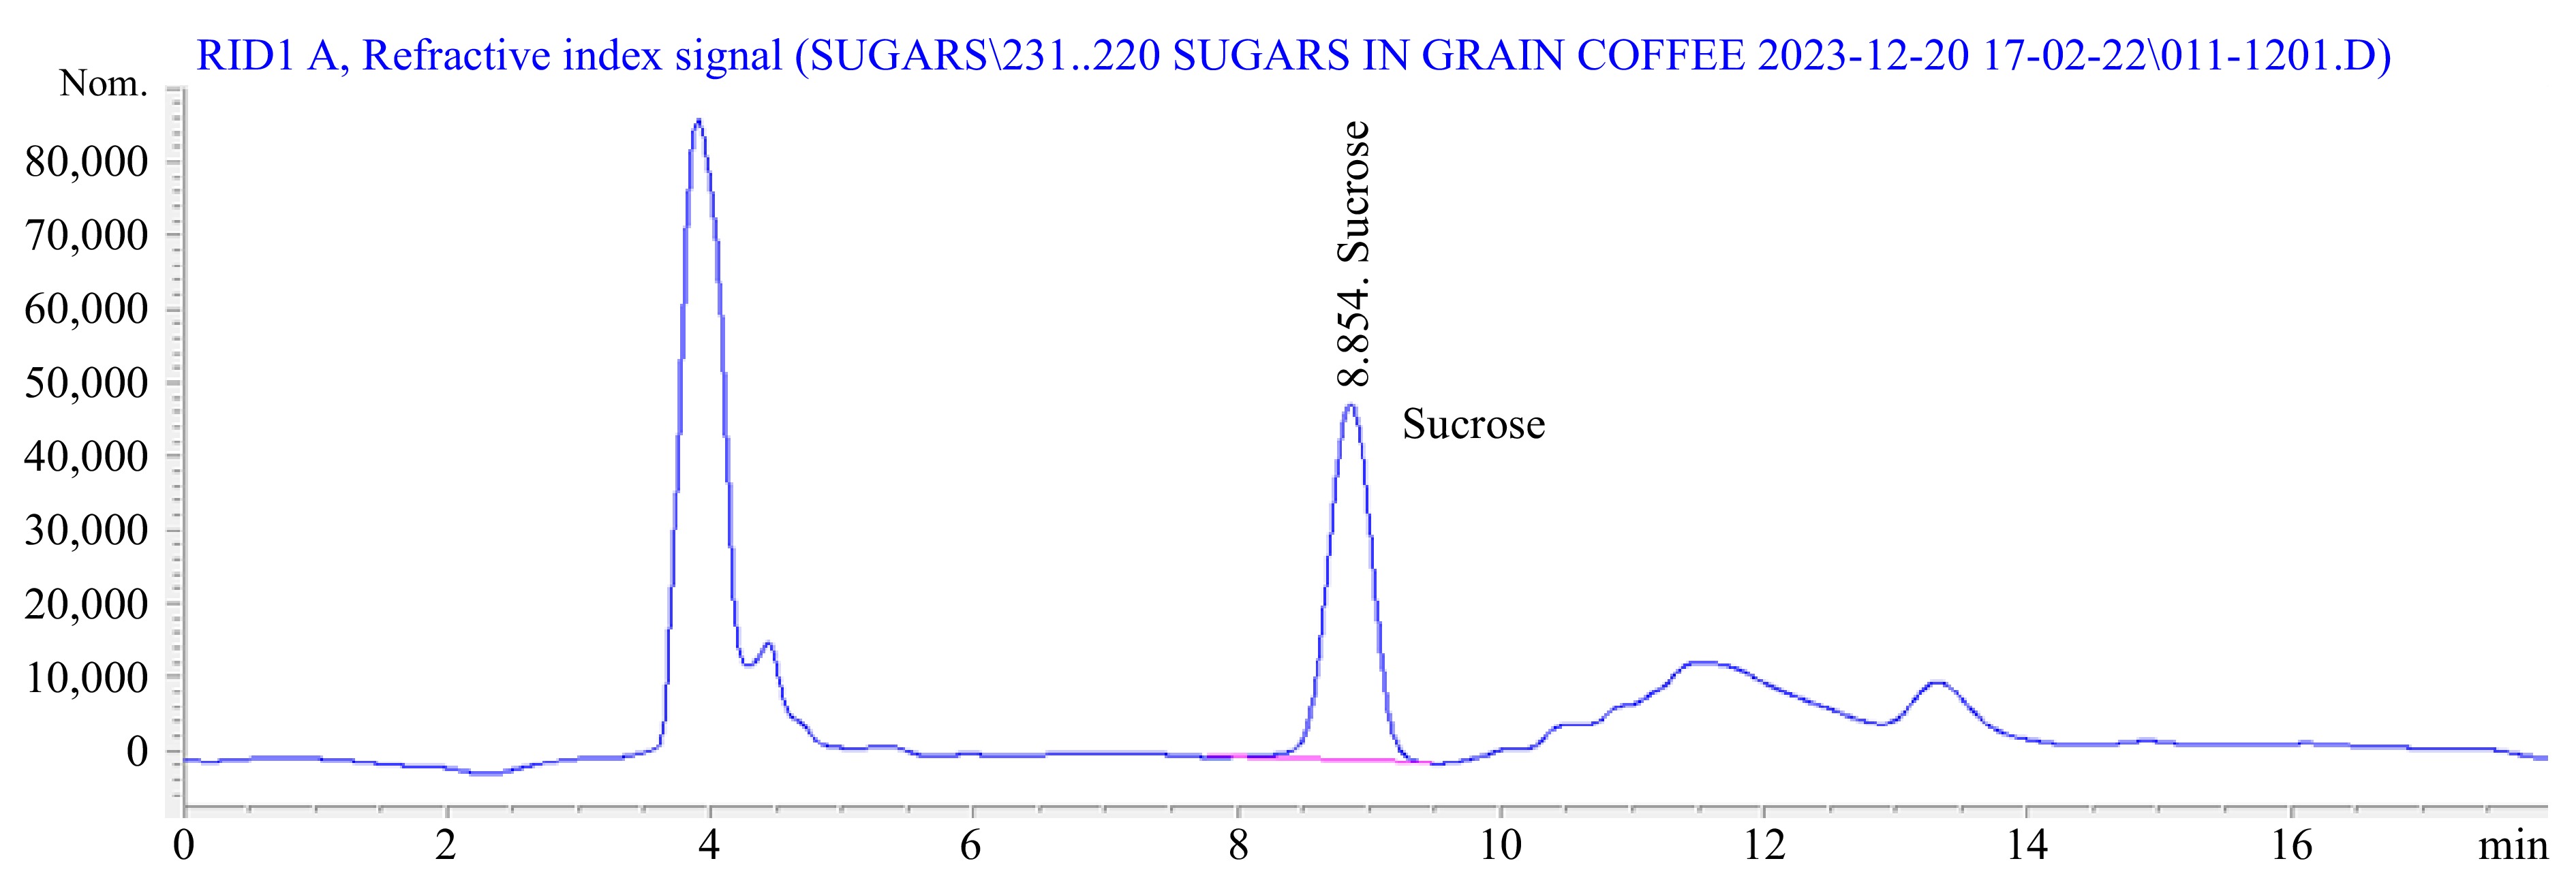
Figure 8.
Sucrose standard chromatogram.
Linearity and calibration curve
-
Linearity was established by examining the coefficient of determination of the analytical curve (Fig. 9). The high coefficients of determination confirmed the suitability of the analytical curve for accurately measuring the concentrations of trigonelline, caffeine, chlorogenic acid, and sucrose. Specifically, for trigonelline, caffeine, and chlorogenic acids, the method exhibited linearity within the concentration range of 5, 10, 20, 40, 50, 100, and 200 μg·mL−1, demonstrating excellent regression coefficients (r²) of 0.999, 0.998, and 0.999, respectively. In addition, a sucrose analysis linearity check has been conducted by running six series of standards and has exhibited an excellent regression coefficient (r2 = 0.999).
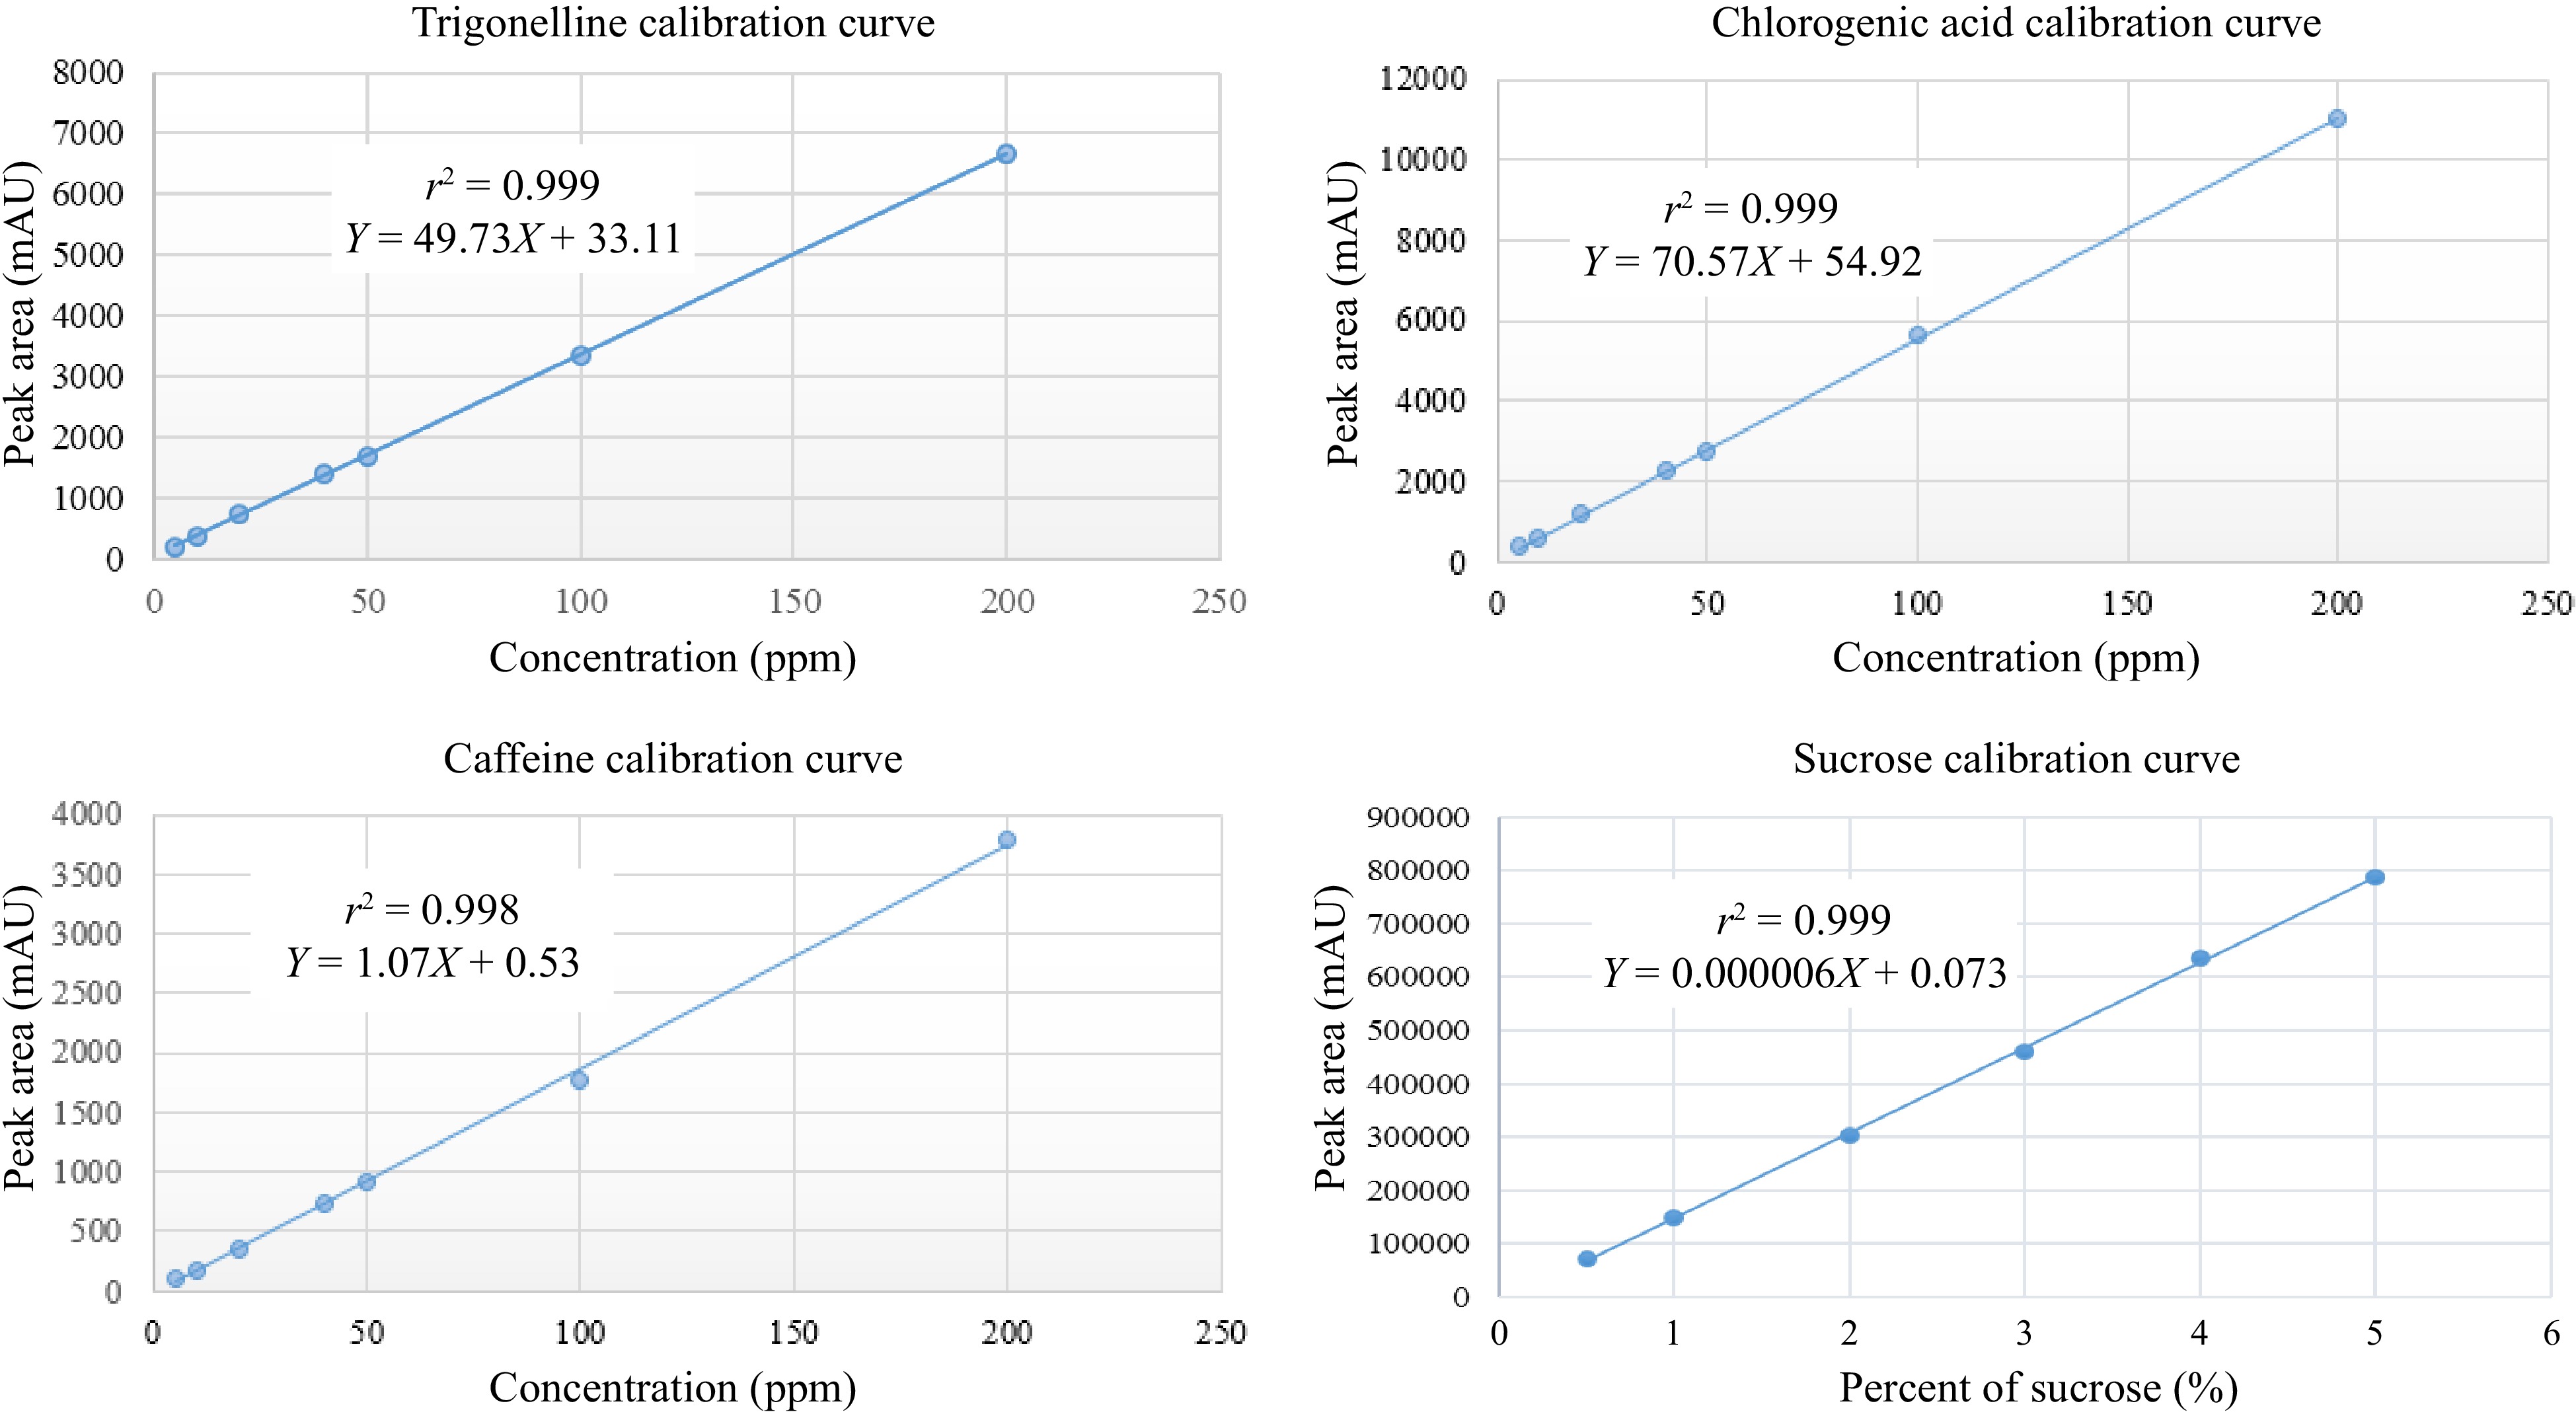
Figure 9.
The calibration curve of trigonelline, caffeine, chlorogenic acid, and sucrose.
LOD and LOQ
-
The limits of detection (LOD) for the three analytes were determined to be 1.32, 0.09, 0.77 mg·L−1, and 0.05% for sucrose, while the limits of quantitation (LOQ) were 4, 2.7, and 2.33 mg·L−1, respectively, for trigonelline, caffeine, and chlorogenic acid and for sucrose it is 0.15 % (Table 3).
Table 3. Linearity, accuracy, LOD, and LOQ parameters of the chromatographic system.
Analyte Retention
timeS/N
ratioLOD
(mg·L−1)LOQ
(mg·L−1)R2 Trigonelline 4.58 0.43 1.30 4.3 0.999 Caffeine 13.46 0.29 0.89 2.9 0.999 Chlorogenic acid 18.38 0.25 0.77 2.5 0.998 Sucrose 8.86 0.016 0.05 0.16 0.999 Caffeine content of green bean with environmental variables
-
The caffeine, chlorogenic acid, trigonelline, and sucrose content of green coffee Arabica samples from different agroecologies of Ethiopia were analyzed using High-Performance Liquid Chromatography (HPLC), and the results are presented in Table 4. The caffeine content of green coffee samples was found to range from 0.74 to 1.07 g/100 g. Coffee sample 5 had the highest caffeine content (1.07%), while the lowest was recorded for sample 12. This finding aligns with a previous study by Sualeh et al.[5], which reported similar caffeine content in green Arabica coffee beans. The analysis also revealed a significant coefficient of variation (10.69%) among the coffee samples, indicating considerable variability among the coffee samples. This variability in caffeine content could potentially be attributed to genetic differences among the coffee samples and various environmental factors that influence their growth.
Table 4. Green coffee Arabica biochemical composition (n = 20).
Samples Altitude
(m.a.s.l.)Annual rainfall
(mm)Average
temperature (°C)Caffeine
(g/100g)Chlorogenic acid
(g/100g)Trigonelline
(g/100g)Sucrose
(g/100g)Sample-1 1,200 1,500 23.9 0.92 7.7 0.52 8.1 Sample-2 1,025 1,651 21.5 0.89 8.2 0.48 5.8 Sample-3 2,050 1,500 19.6 0.78 4.5 1.41 13.7 Sample-4 1,850 1,340 19.4 0.86 5.2 0.98 10.5 Sample-5 1,950 1,300 16.5 1.07 5 1.52 13.8 Sample-6 2,775 1,134 9 1.01 3.7 2.31 25.7 Sample-7 1,875 1,500 17.5 0.86 5 1.22 10.6 Sample-8 2,340 1,067 16 0.94 4.1 1.97 15.5 Sample-9 1,806 1,000 20 1.03 5.6 1.32 10.5 Sample-10 1,887 1,600 20 0.95 5.8 1.37 11.2 Sample-11 1,845 1,150 20 0.88 5.6 1.18 10.12 Sample-12 2,325 1,134 22.4 0.74 4.4 2.02 15.2 Sample-13 2,105 2,300 15 0.81 4.2 1.57 14.1 Sample-14 2,070 1,571 19 0.77 4.6 1.48 13.9 Sample-15 1,800 1,445 25 0.84 5.4 0.89 10.7 Sample-16 1,963 927 20.15 1.04 5.1 1.60 12.1 Sample-17 1,770 950 20.5 0.91 6.2 0.74 9.5 Sample-18 2,110 1,800 20.5 0.84 4.4 1.64 13.9 Sample-19 1,927 1,414 22 1.03 4.9 1.58 12.1 Sample-20 1,800 1,200 21 0.97 5.8 0.92 10.4 Mean 0.907 5.27 1.336 12.371 SD 0.097 1.123 0.483 3.973 CV % 10.69 21.32 36.21 32.11 In the present study, we investigated the relationship between the altitude at which coffee is grown and the caffeine content of the green beans. Surprisingly, our findings revealed no correlation between the two variables. This result is consistent with previous studies[19,31,35,39,52], which also reported a lack of correlation between coffee bean caffeine content and growing altitude. However, it is important to note that our findings are inconsistent with previous research conducted by Hagos et al.[53]. Their study reported significant variation in caffeine content among green coffee bean samples from different altitudes, and they identified a moderate negative correlation between the caffeine content and the altitudes at which the coffee plants were cultivated. Similarly, previous studies[6,14] also reported a negative correlation between coffee growing altitude and the caffeine content of the green beans.
In another way, it was observed that the annual rainfall in the coffee growing environment showed a weak negative correlation with the caffeine content of the beans. This suggests that higher levels of rainfall may potentially lead to slightly lower caffeine content in green coffee beans. The connection between climate and caffeine is intricate and not easily explained. Although one might anticipate that environmental factors would influence the caffeine content in coffee beans, research suggests that there is limited evidence supporting such straightforward associations. In the present study, it was found no significant correlation between the average temperature and rainfall in coffee-growing regions and the levels of caffeine in green beans. This finding is consistent with the findings of Awaliyah et al.[54] in their study on Robusta coffee. Additionally, Joët et al.[39] reported that average temperature, altitude, rainfall, irradiation, and evapotranspiration did not directly impact the caffeine content. The complex biochemistry of the coffee plant likely plays a role in mediating any influence of climate on caffeine biosynthesis. These findings suggest that factors other than temperature, altitude, and rainfall may play a more prominent role in determining the caffeine content of coffee beans.
Chlorogenic acid content of green coffee beans and environmental variables
-
In our study, the total chlorogenic acid (sum of four subclasses) content of the coffee beans was analyzed and found to range from 3.7 to 8.2 g/100 g (Table 4). Interestingly, the coffee samples from the lowest growing altitude exhibited the highest chlorogenic acid content (8.2 g/100 g), while the samples from the highest growing altitude had the lowest chlorogenic acid content (3.7 g/100 g). Furthermore, a significant negative correlation was observed between the chlorogenic acid content and the coffee growing altitude (Fig. 10a). This indicates that as the elevation of the coffee growing area increases, the chlorogenic acid content of the samples tends to decrease, and vice versa. The result aligns with previous findings[6], suggesting that the detrimental impact of altitude on chlorogenic acid (CGA) levels in coffee beans may be attributed to alterations in the ratio of biosynthesis to biodegradation during bean maturation. The metabolic rate and biosynthesis-biodegradation ratio of coffee beans are regulated by the average air temperature experienced during seed development[13,39]. Similarly, Tolessa et al.[14] observed a negative association between altitude and shade with regard to the chlorogenic acid content in coffee beans.
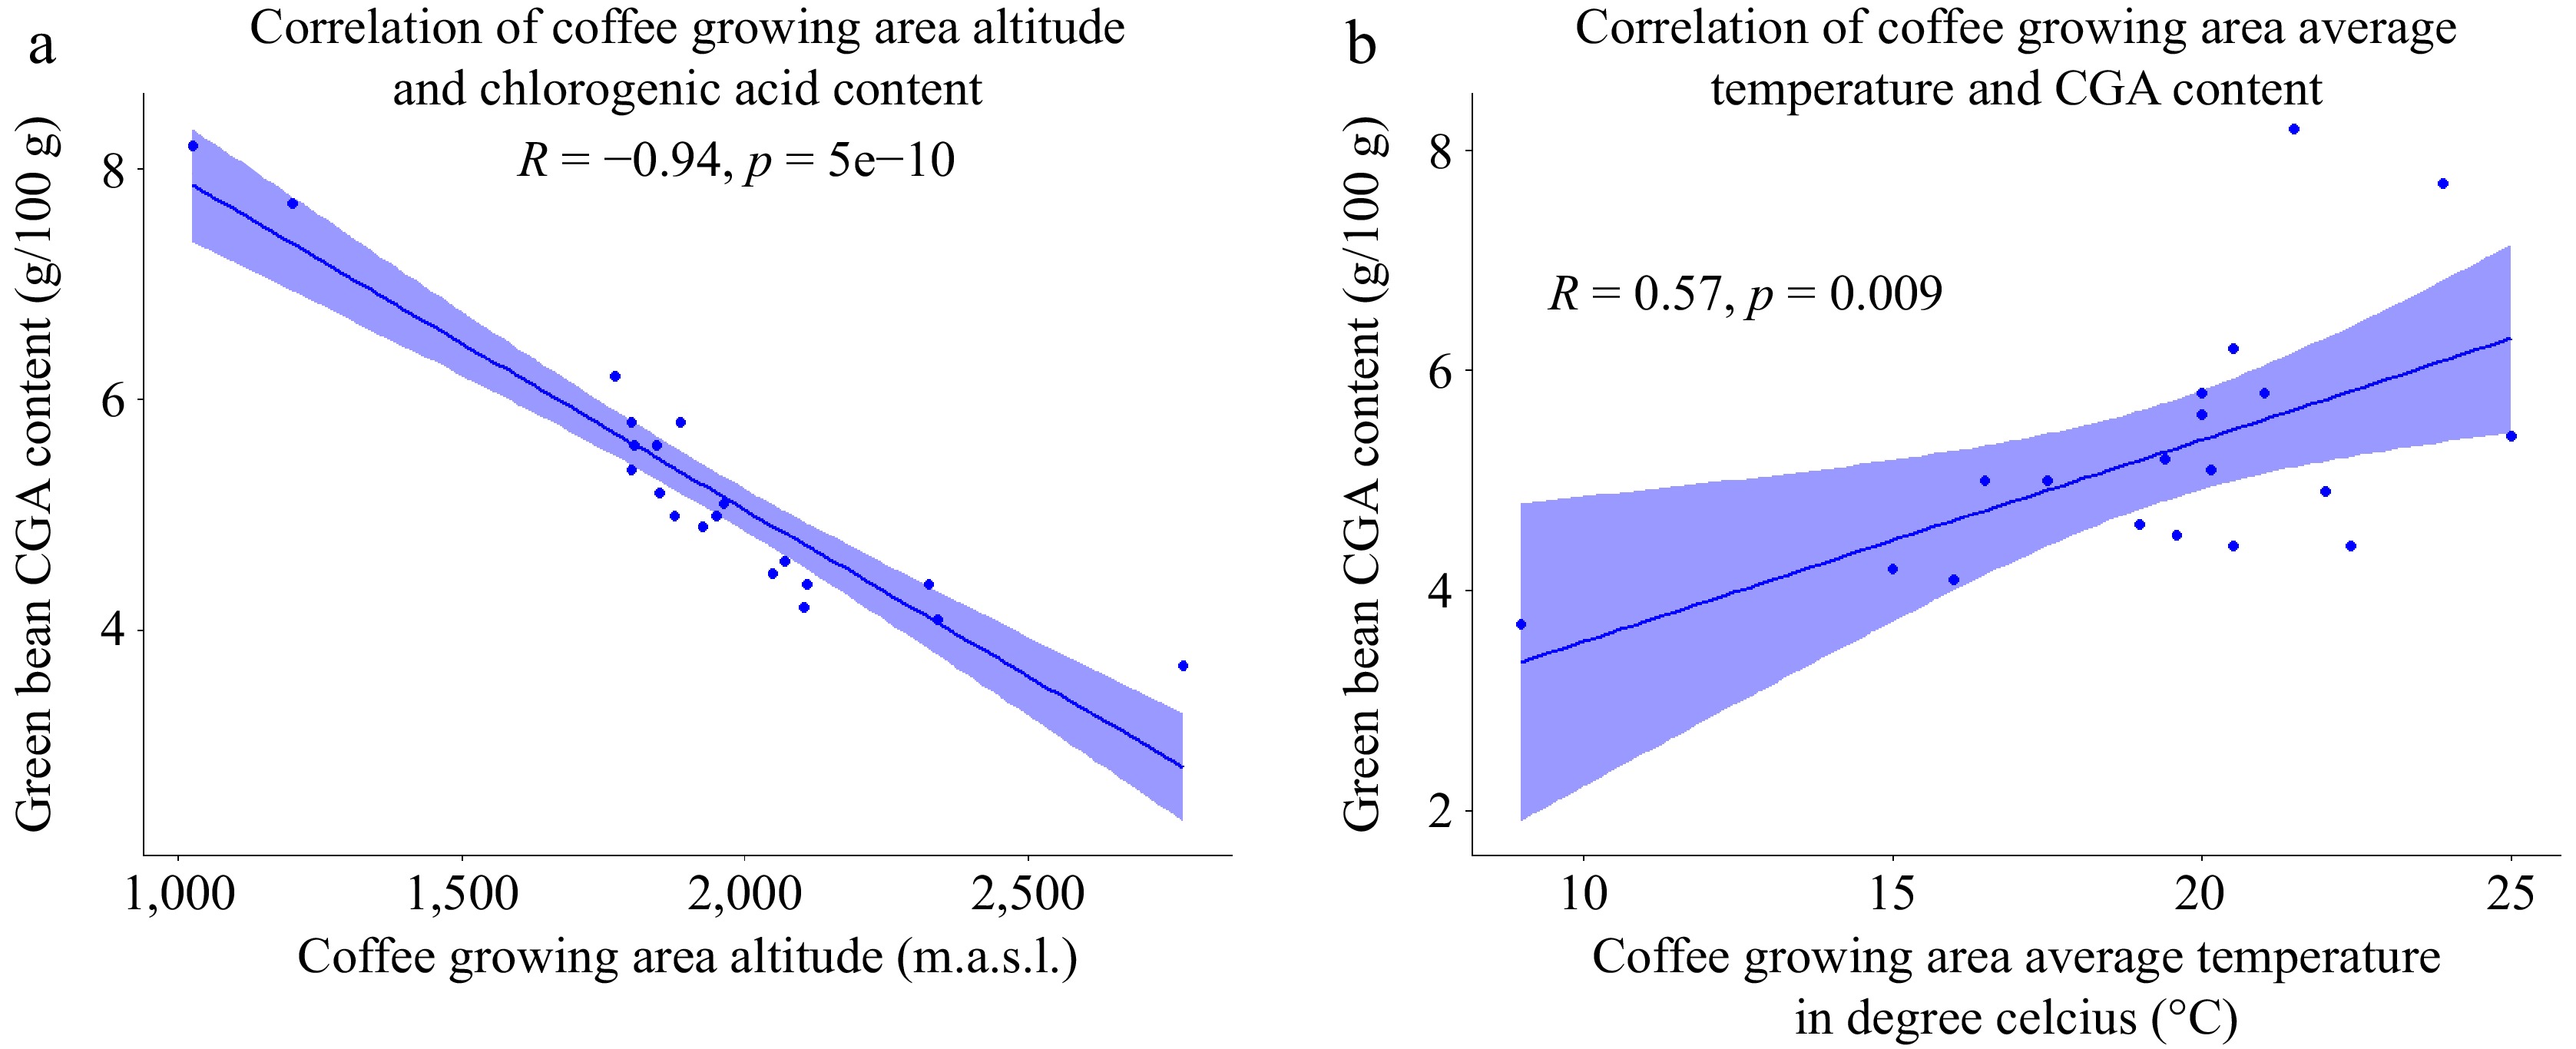
Figure 10.
(a) Scatter plot of correlation between altitude and CGA of coffee bean. (b) Scatter plot of the correlation between average temperature and green bean CGA content (n = 20).
Additionally, the present investigation also revealed a positive correlation between the average temperature of the coffee growing environment and the chlorogenic acid content (Fig. 10b). This implies that as the average temperature in the growing area rises, there is a tendency for the chlorogenic acid content in the samples to increase as well. This finding aligns with the research conducted by Tolessa et al.[14], which reported a correlation between growing area temperature and chlorogenic acid levels in coffee beans. The temperature of the growing environment directly influences the production and accumulation of chlorogenic acids[55]. Higher temperatures likely lead to greater production and accumulation of chlorogenic acids in coffee beans grown at mid-altitude compared to those grown at high altitude[14]. During the fruit ripening stage, the balance between biosynthesis and biodegradation plays a crucial role in determining the variation in CGA levels[39]. Warmer climatic conditions at lower altitudes result in faster maturation of coffee beans, leading to a higher proportion of immature beans[6,56]. A higher chlorogenic acid content indicates a relatively immature state of the coffee beans[57].
Furthermore, our findings indicate that there is no significant correlation between the annual rainfall and the overall chlorogenic acid content in green beans sourced from various regions of Ethiopia. This result aligns with the study conducted by Joët et al.[39], which also reported a lack of association between annual rainfall and the chlorogenic acid content of the beans. These findings suggest that coffee growing elevation, environmental temperature and other factors other than rainfall may play a more prominent role in influencing the chlorogenic acid content of coffee beans.
Trigonelline content of green beans and environmental variables
-
In the study, the trigonelline content of the green coffee beans was analyzed and found to range from 0.48 to 2.31 g/100g (Table 4). The coffee samples collected from higher altitudes exhibited the highest trigonelline content, while the samples from lower altitudes had the lowest trigonelline content. This observation suggests that there is a relationship between the trigonelline content and the altitude at which the coffee is grown. The scatter plot in Fig. 11a further supports this finding, showing a positive correlation between the trigonelline content and the elevation of the growing area. This indicates that as the elevation increases, there is an increase in the trigonelline content of the green coffee beans. Moreover, a negative correlation was observed between the trigonelline content and the average temperature of the growing area. This means that as the temperature increases, the trigonelline levels in the beans tend to decrease, and as the temperature decreases, the trigonelline content tends to increase.
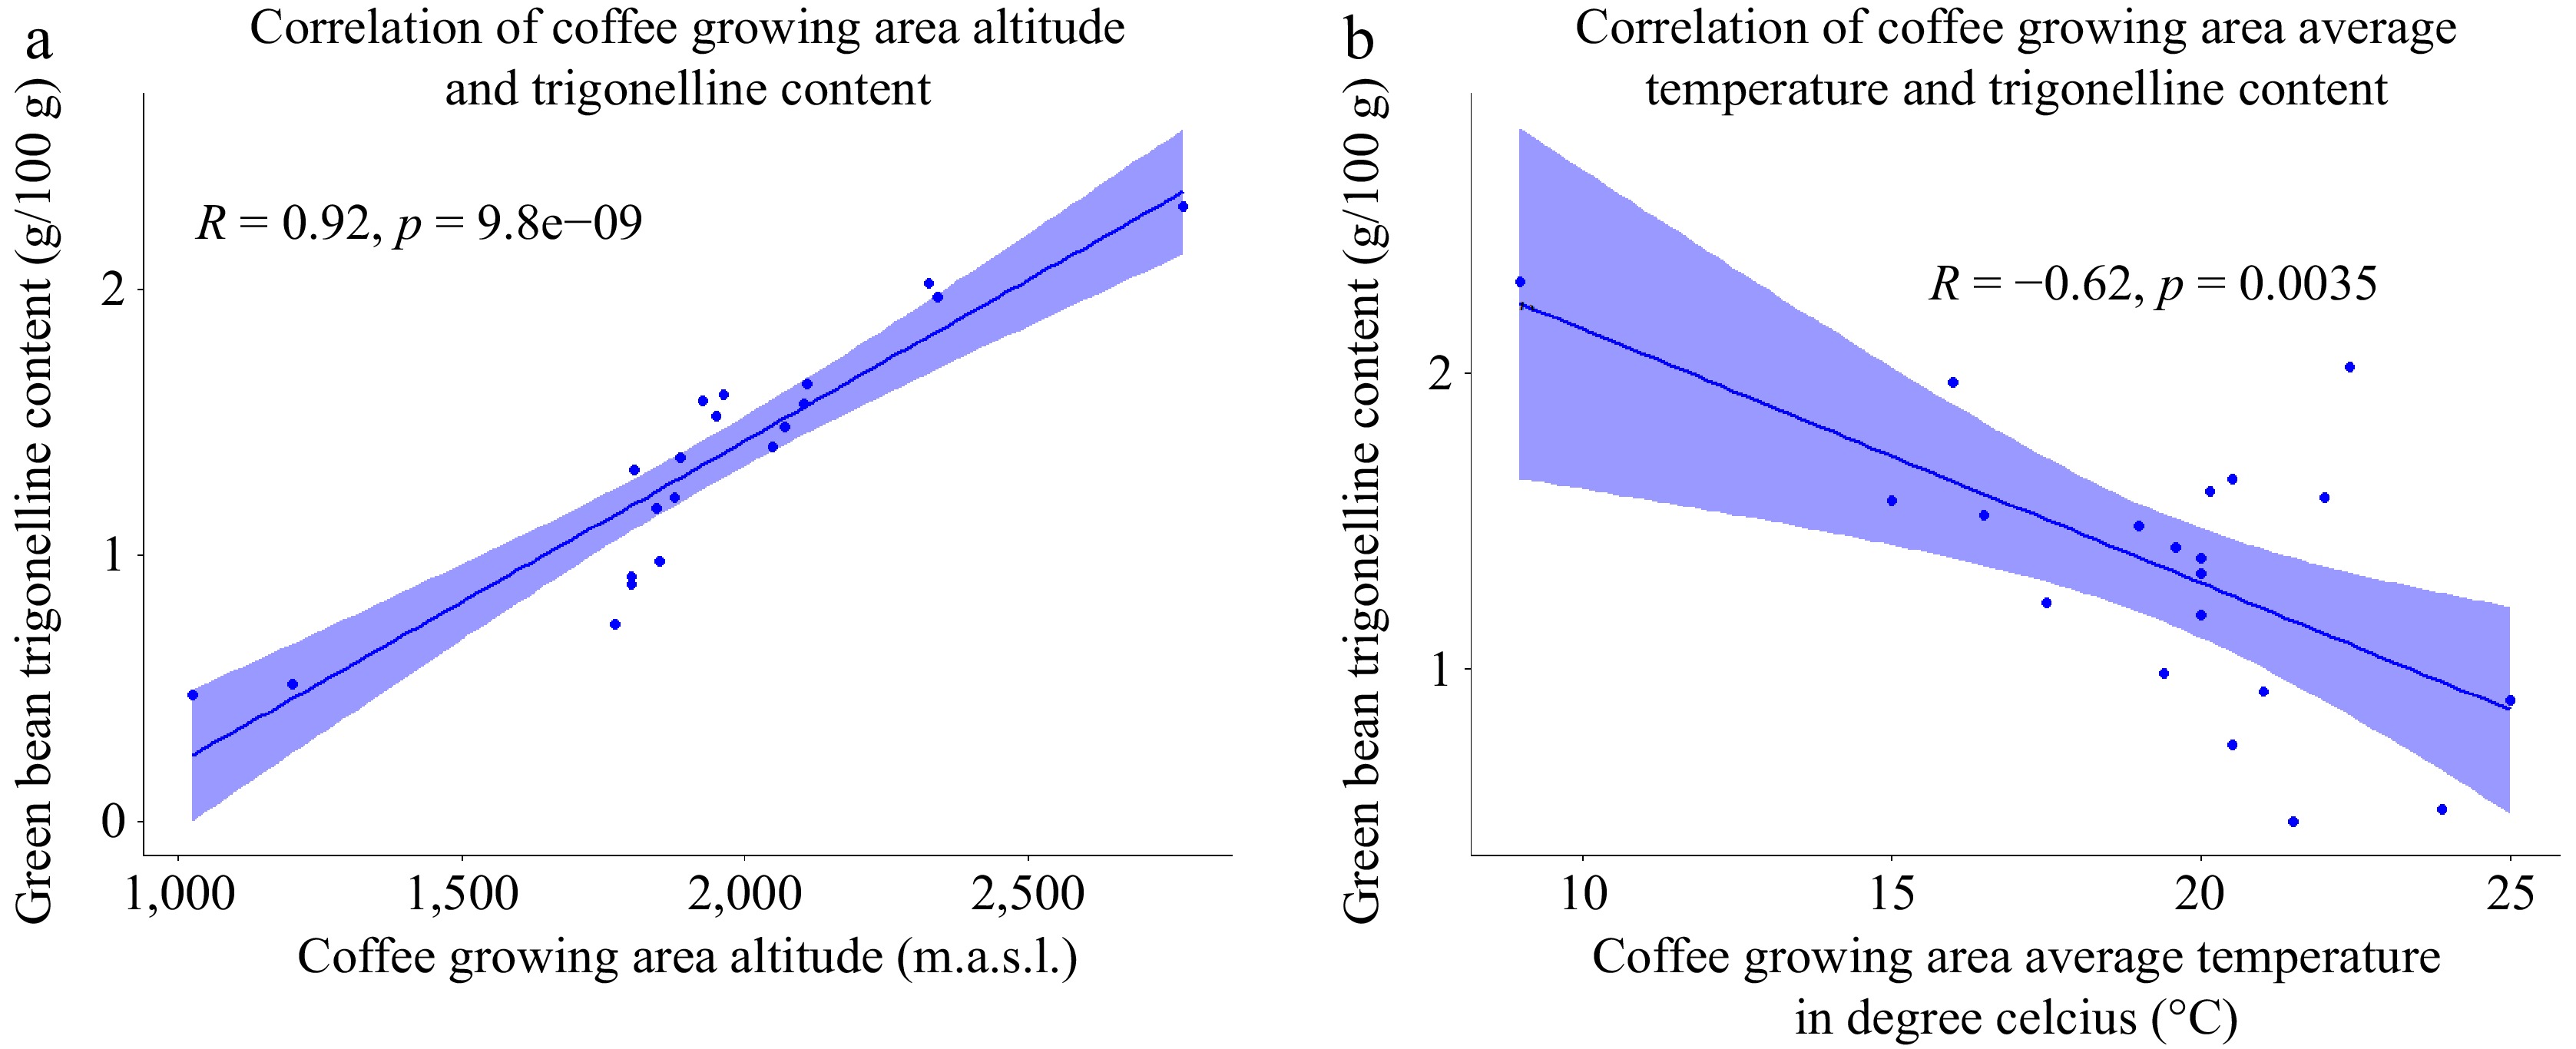
Figure 11.
(a) Scatter plot of the correlation between coffee growing altitude and green bean trigonelline content. (b) Scatter plot of the correlation between coffee growing temperature and green bean trigonelline content (n = 20).
In line with the present study's findings, prior studies[52,58] have documented a positive correlation between coffee bean trigonelline content and the altitude at which the coffee beans are grown. This association is likely influenced by the climatic factors associated with varying elevations. Additionally, these studies have reported a negative relationship between the environmental temperature of the coffee-growing environment and the trigonelline content of the beans, which aligns with the results presented in Fig. 11b of the current study. Moreover, our research revealed no significant correlation between the trigonelline content in coffee beans and the annual rainfall of the coffee growing environment. This finding suggests that the trigonelline content is not influenced by the amount of rainfall experienced in the coffee cultivation area.
Sucrose content of green bean and environmental variables
-
The sucrose content analysis of green Arabica beans from different agroecologies is presented in Table 4. The results indicate that the sucrose content ranged from 5.8 to 25.7 g/100 g. Notably, the coffee sample collected from the highest altitude exhibited the highest sucrose content, while the samples collected from the lowest altitude displayed the lowest sucrose content. This observation is further supported by the plot in Fig. 12a, which demonstrates an increase in sucrose content with increasing altitude of the growing area, and a decrease in sucrose content with decreasing altitude. Contrary to the findings reported by Mintesnot & Dechassa[31], who observed significantly higher sucrose content in coffee beans from low-altitude areas compared to those from middle and high altitudes, our results reveal a positive correlation between coffee bean sucrose content and growing altitude. The present study provides a contrasting perspective, indicating that as the altitude of coffee cultivation increases, there is a corresponding increase in sucrose content. Moreover, Fig. 12b illustrates an inverse correlation between the average temperature of the coffee growing environment and the sucrose content of the coffee beans. Specifically, as the daily average temperature increases, there is an observed increase in the sucrose content of the beans. Conversely, an increase in the temperature of the growing area is associated with a decrease in the sucrose content of the beans.
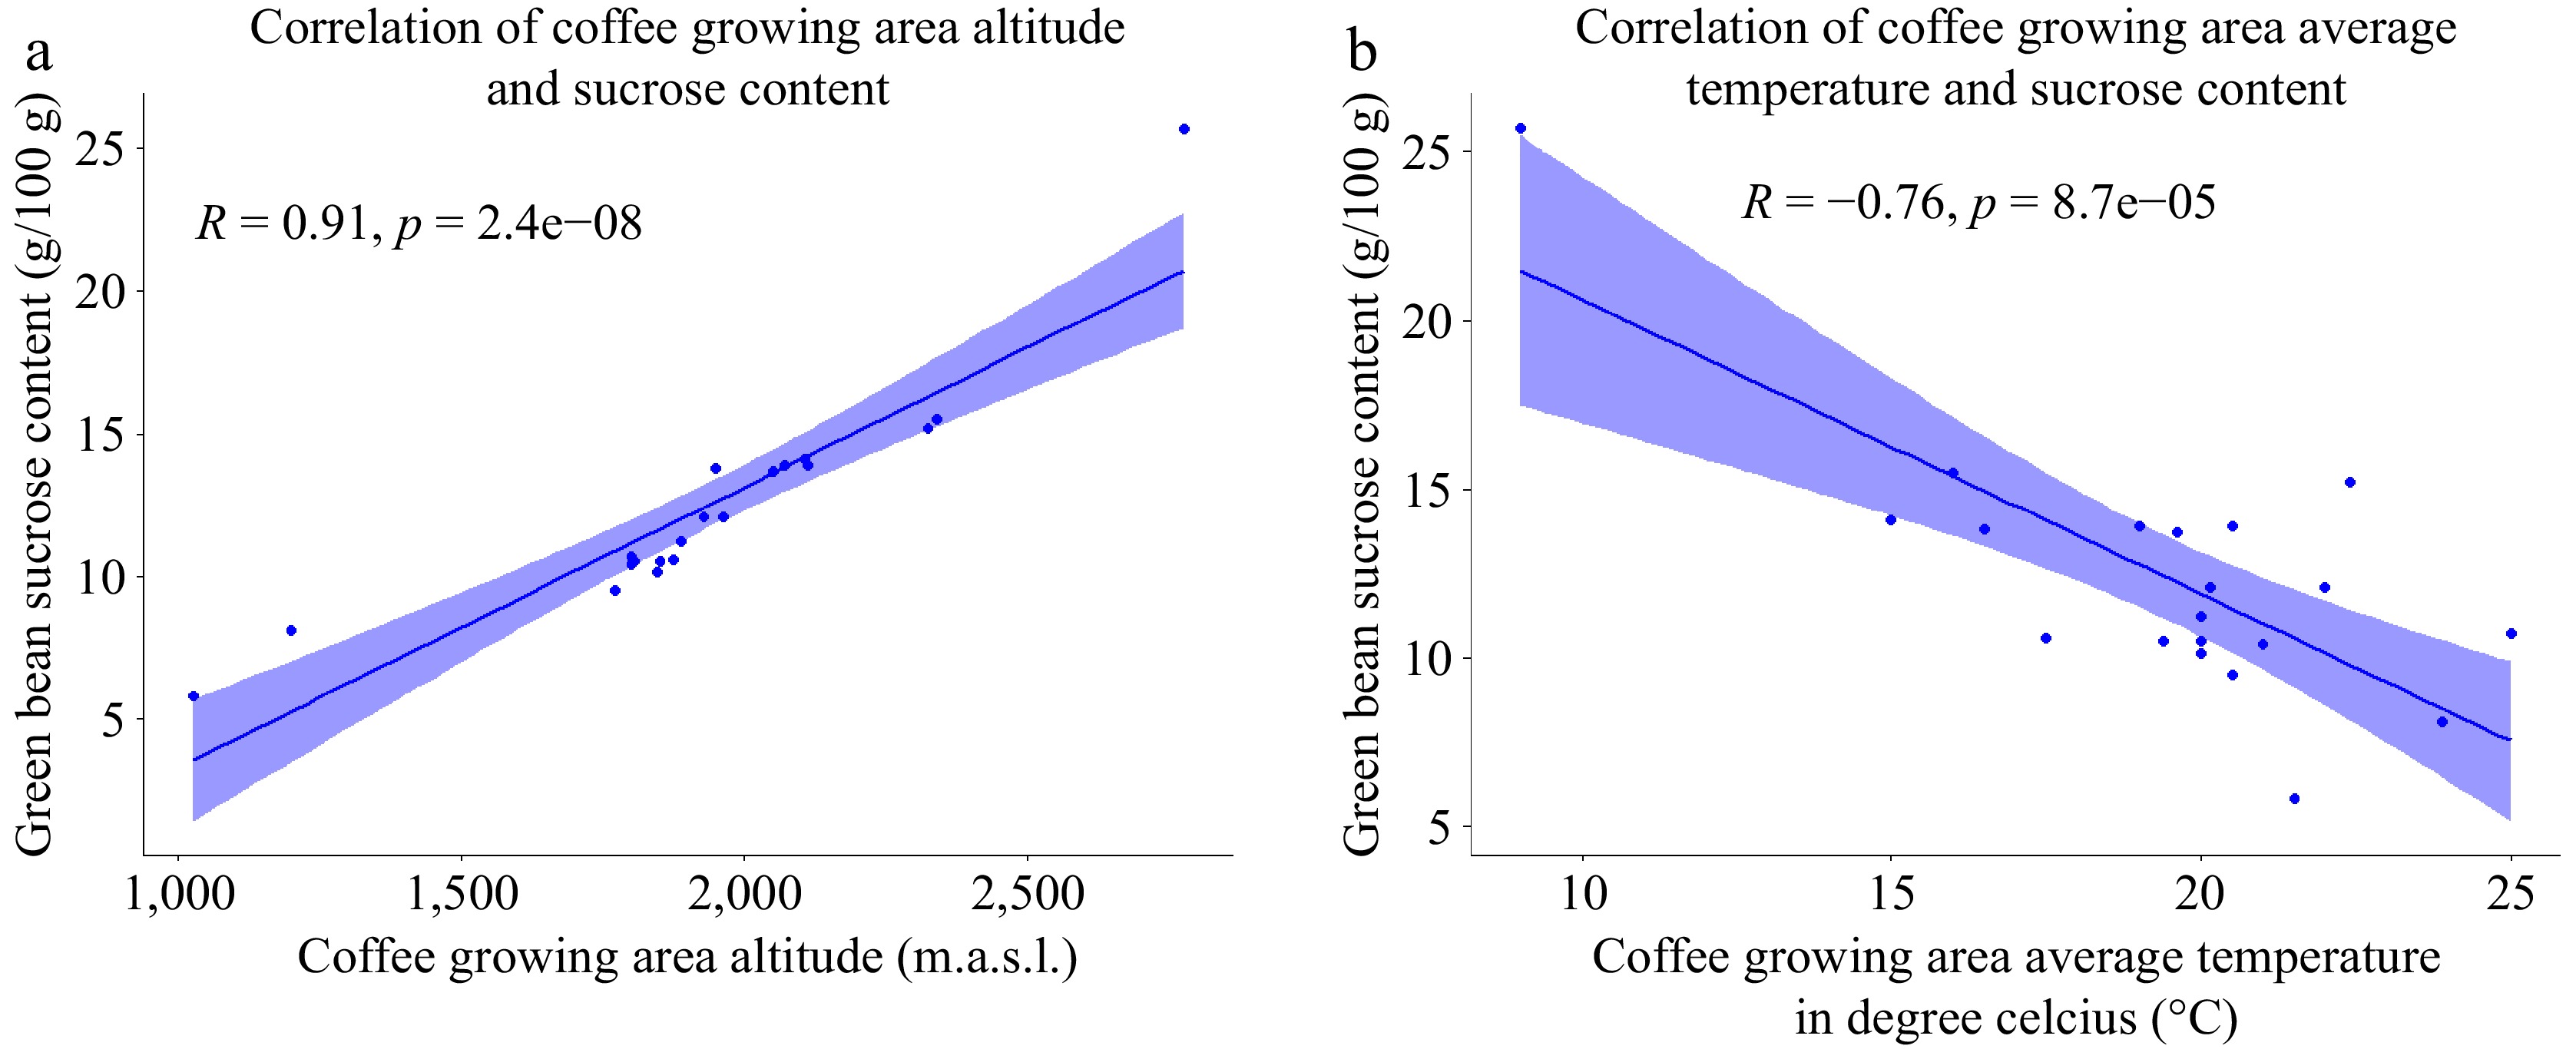
Figure 12.
(a) Scatter plot of the correlation between coffee growing altitude and green bean sucrose content. (b) Scatter plot of the correlation between coffee growing temperature and green bean sucrose content (n = 20).
In agreement with the findings of the present study, a previous study[6] found that higher altitudes led to an increase in sucrose content, particularly in wet-processed beans and coffee cultivated without shade. This observation suggests that elevated altitudes contribute to a decrease in ambient temperature, which in turn reduces heat-induced stress in plants. Consequently, the leaf-to-fruit ratio and net photosynthetic rate increase, and the maturation period of the coffee berries is prolonged. These conditions provide more carbohydrates for the developing beans and allow for a longer duration for bean filling[6,59]. As the sucrose accumulation in the endosperm initiates during the green stage of the fruit, the highest rate of sugar deposition is observed during the maturation period, as reported previously[60]. This positive correlation in the bean sucrose content and growing altitude was observed due to decreased ambient temperature which prolonged the maturation period of coffee and aided in increased sucrose as well as fat accumulation inside beans making it heavier and denser[29]. In agreement with this finding, this study also detected negative correlation between the sucrose content of green coffee bean and the average temperature of the coffee bean growing environment.
PCA of coffee bean growing environmental variables, bean physicochemical, and biochemical composition
-
To comprehensively analyze the dataset, Principal Component Analysis (PCA) was employed on 12 variables, including coffee growing altitude, annual rainfall, average temperature, hundred bean weight, moisture content, crude fat, pH, titratable acidity, green bean caffeine, chlorogenic acid, trigonelline, and sucrose content on 20 samples. PCA provides insights into the structural relationships among the samples concerning their growing environmental characteristics, as well as their physicochemical and biochemical compositions. The first two principal components, as illustrated in Fig. 13, collectively explains 64% of the variability. All the samples showed separation and examining the variable plot reveals that the first principal component exhibits significant positive associations with hundred bean weight, crude fat, altitude, trigonelline, and sucrose. On the other hand, the variables contributing to the second principal component (PC2) include annual rainfall, titratable acidity, and average temperature, all displaying strong positive associations with PC2. Upon projecting the samples onto the plane formed by these two components, it becomes evident that samples 3, 6, 8, 12, 13, and 18 are primarily positively associated with PC1 (Fig. 14). These samples exhibit a combination of high values for altitude, hundred bean weight, crude fat content, trigonelline, and sucrose, along with low values of chlorogenic acid.
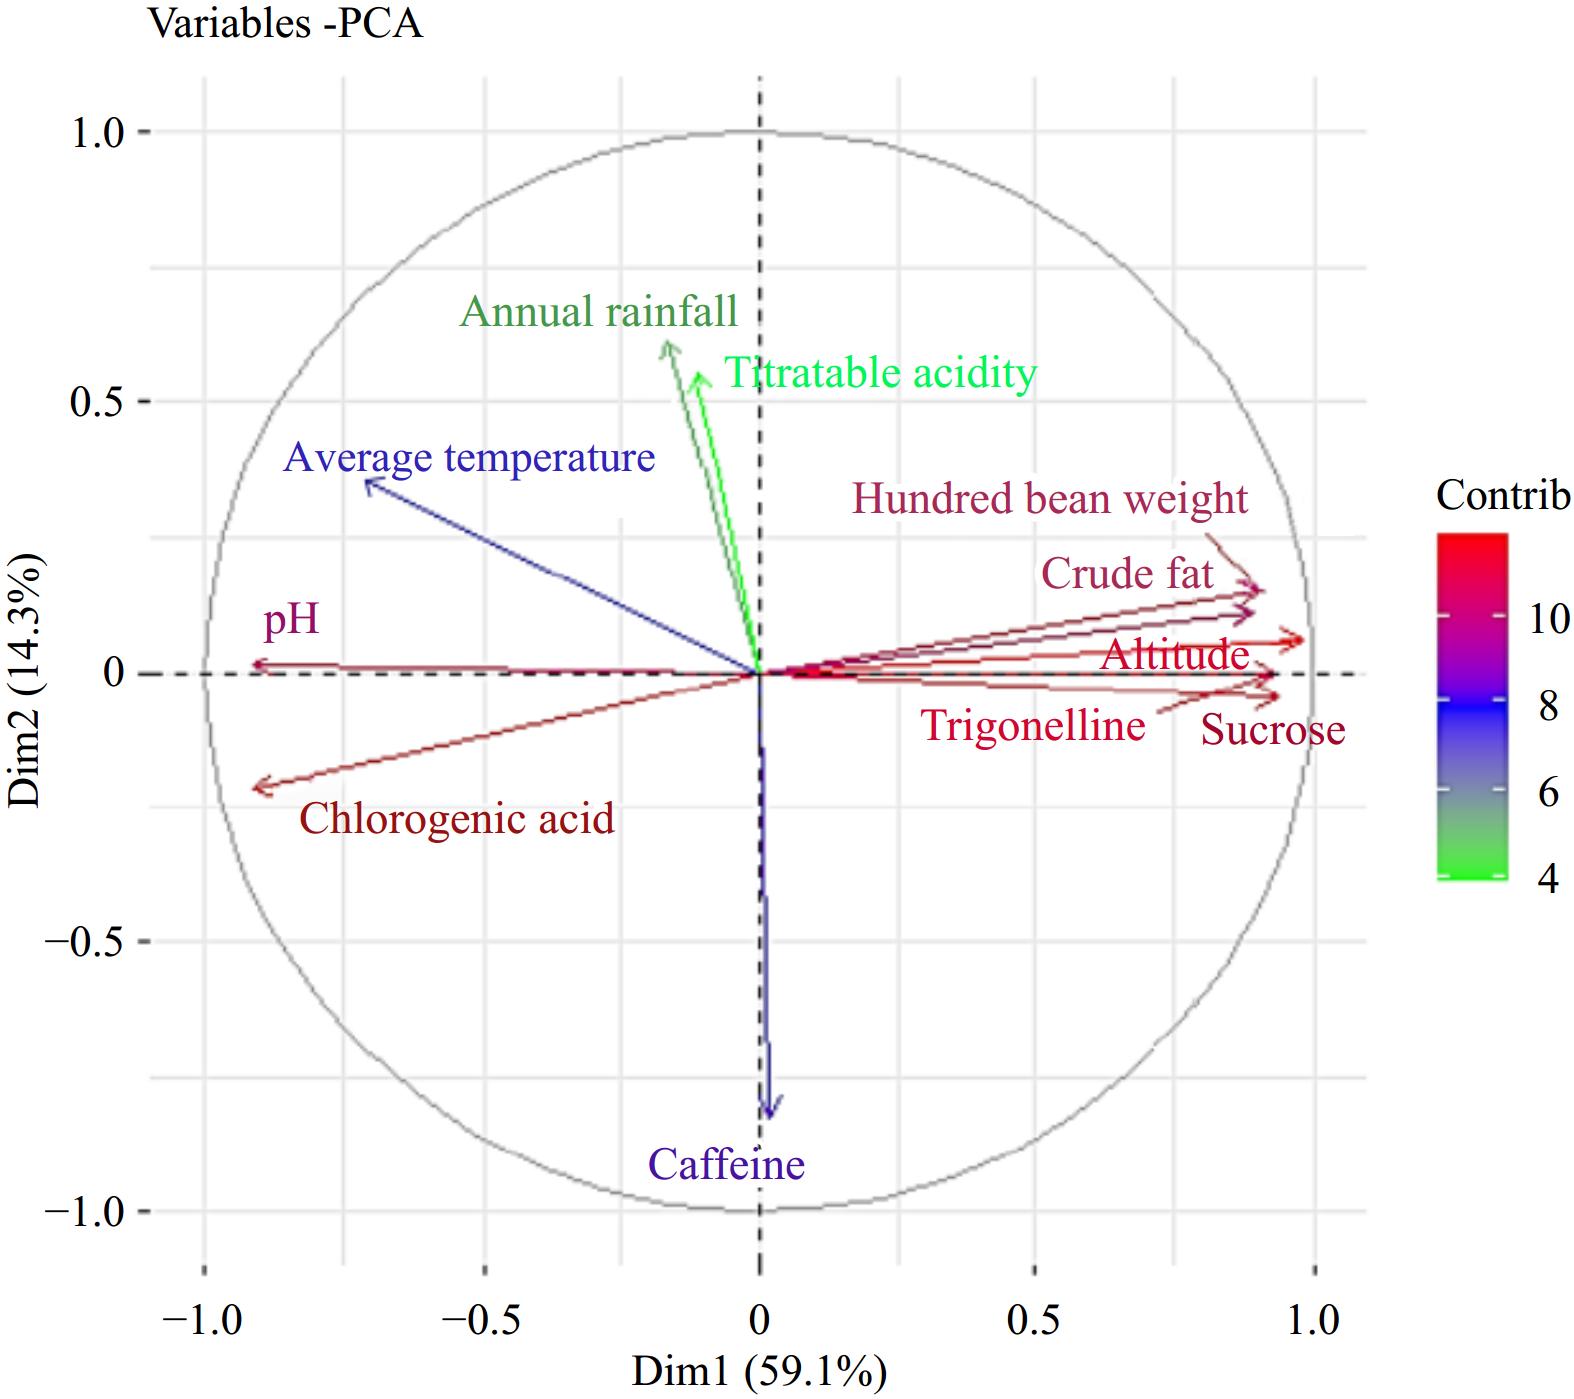
Figure 13.
PCA of variables (coffee growing environmental variables, physicochemical and biochemical compositions).
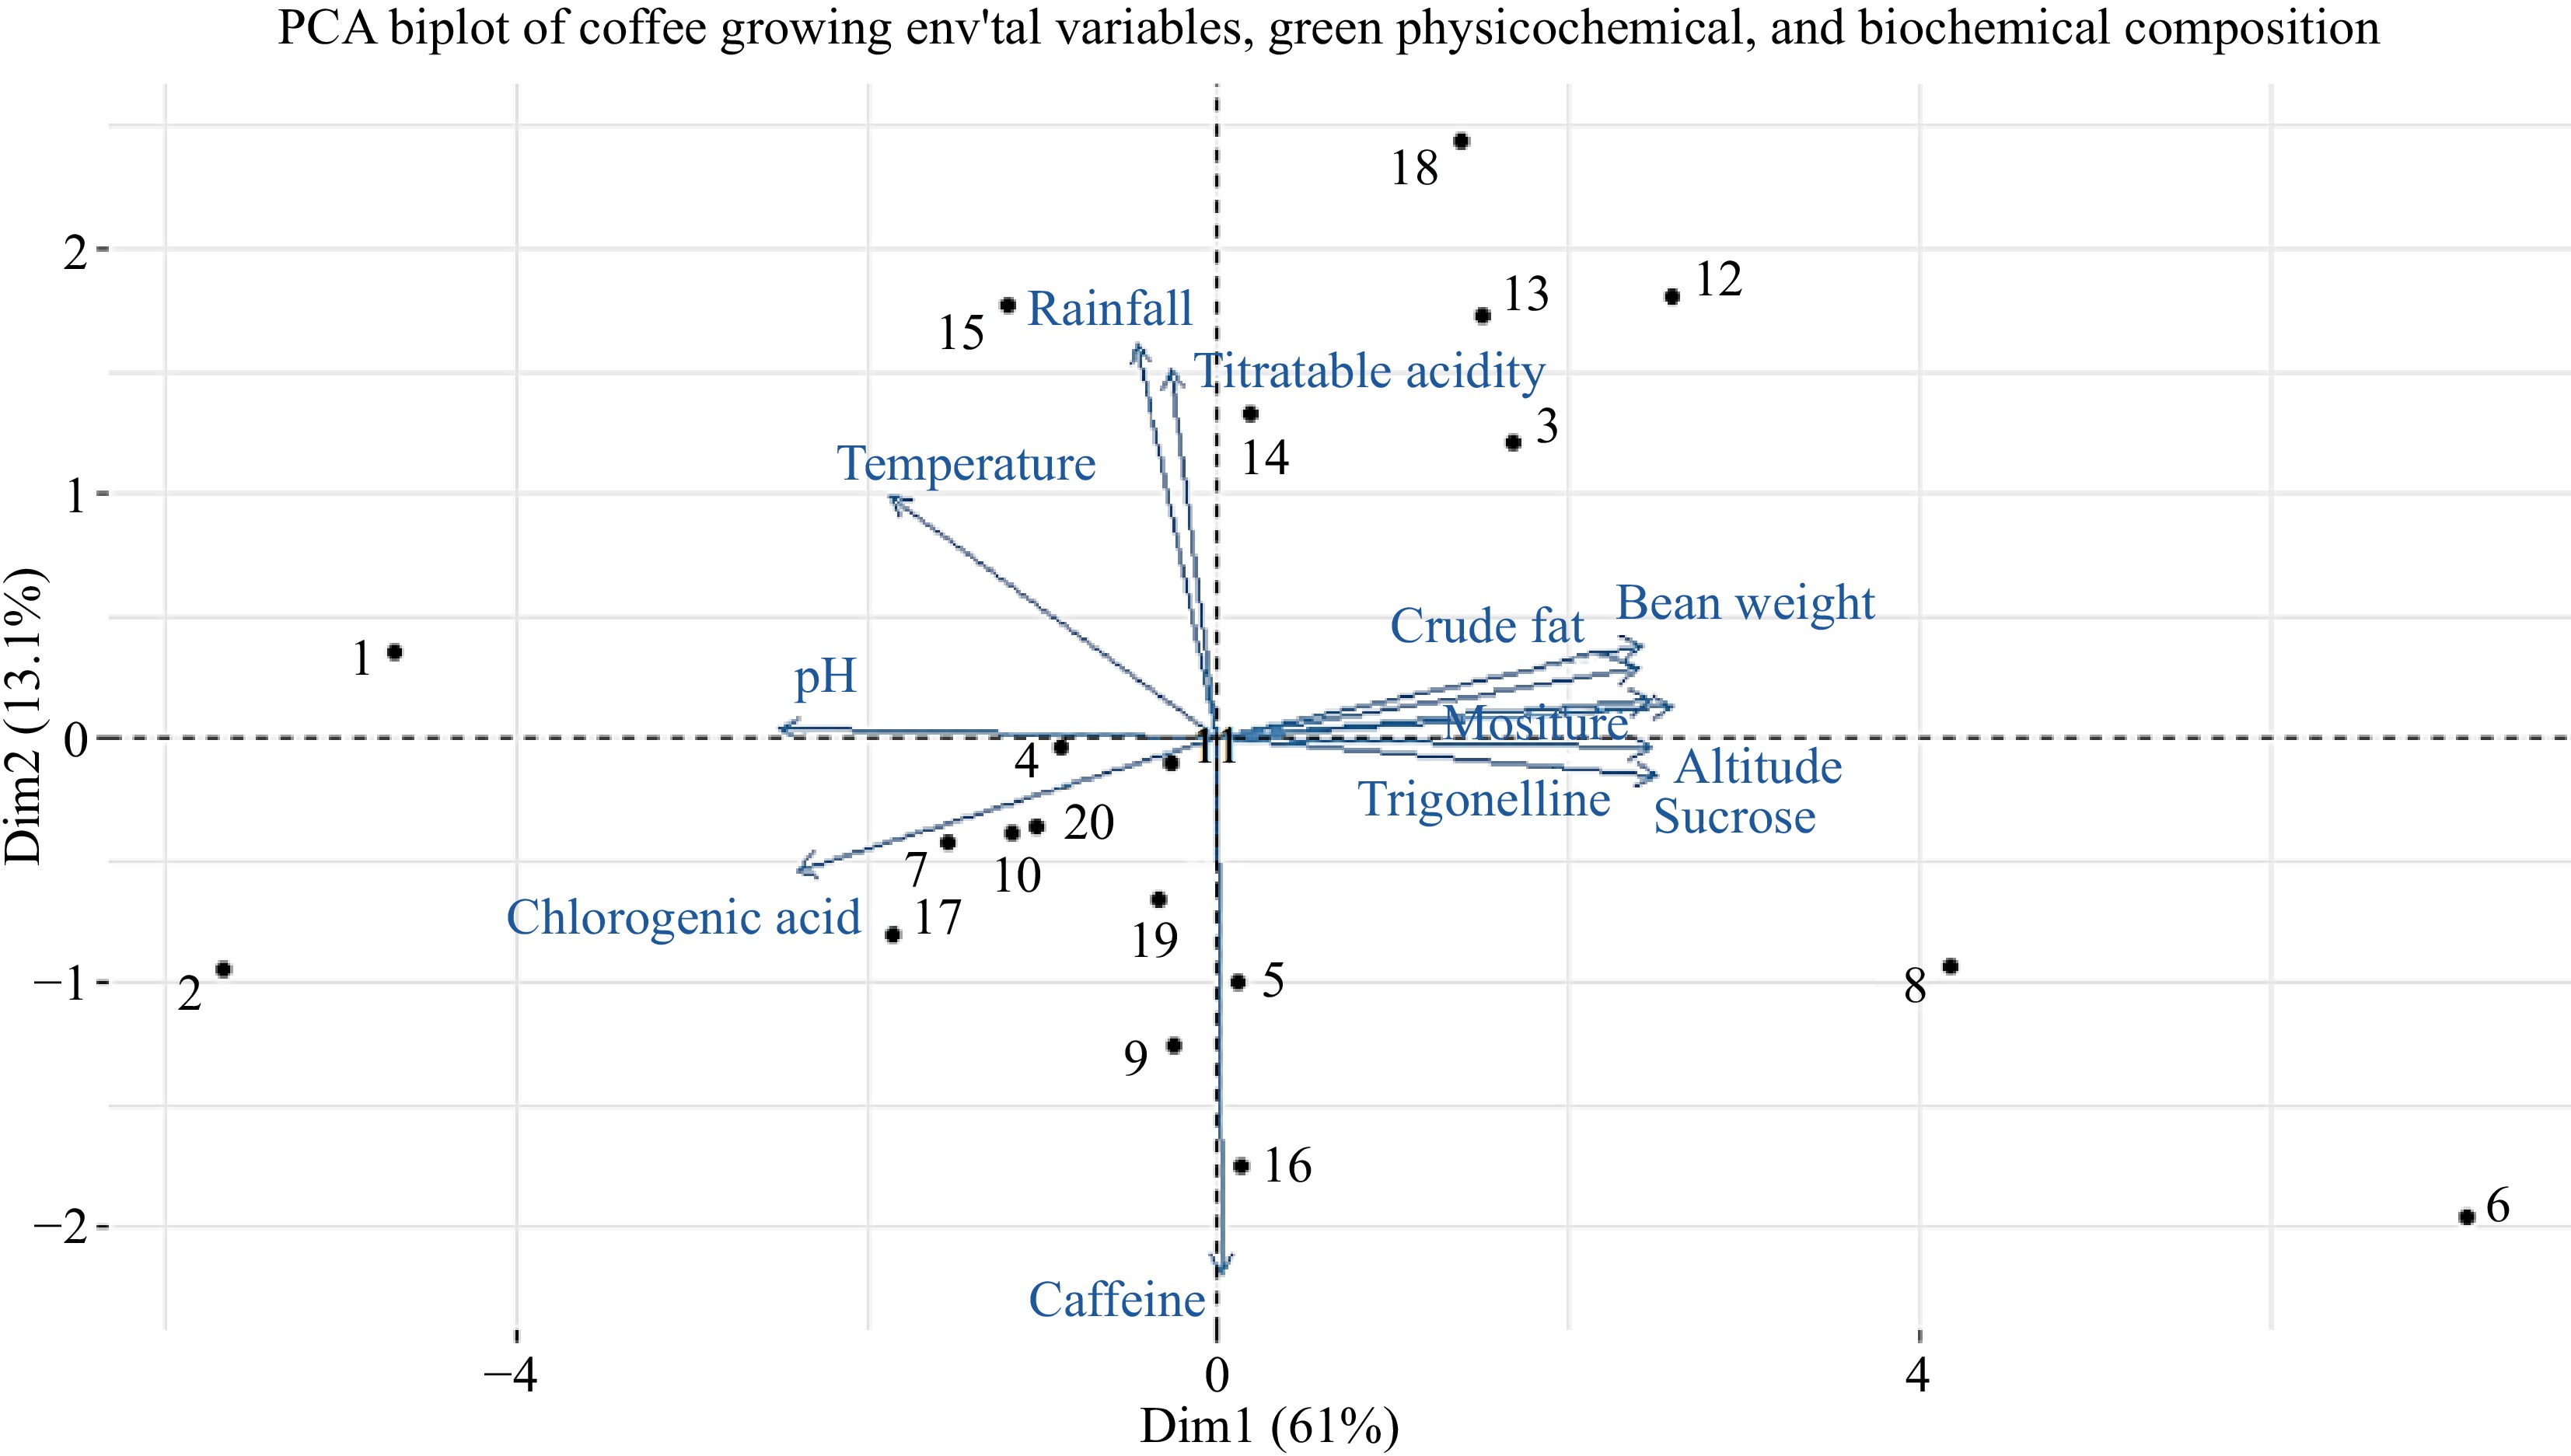
Figure 14.
Projection of variables and samples in the plane formed by first two principal components.
Furthermore, the utilization of a combined approach involving PC1 and PC2 facilitated a distinct separation among the majority of samples. This phenomenon can be attributed to the variations observed across all components considered in this study. Notably, sample number 4 floated around a value close to zero, while samples 2, 7, 9, 17, 10, and 20, as well as samples 8 and 6, displayed negative scores on PC2. Specifically, samples 3, 12, 13, and 18 exhibited the highest positive scores, distinguishing them from other samples that generally displayed intermediate scores along the PC2 direction. Conversely, samples 6 and 8 showcased the highest negative scores on PC2, further contributing to their discrimination from the rest of the samples. The comprehensive Principal Component Analysis (PCA) reveals a discernible relationship among the environmental conditions of coffee cultivation, physicochemical characteristics, and biochemical compositions. Consequently, distinct variations among the coffee samples are evident.
-
In this comprehensive study, an in-depth assessment of green Arabica coffee bean samples sourced from diverse agro-ecologies in Ethiopia was conducted, focusing on the correlation between the physicochemical characteristics and biochemical composition of the beans. The findings revealed significant associations between the elevation of coffee growing areas and the daily average temperature of the environment with key attributes such as hundred-bean weight, moisture content, crude fat content, and pH of the beans. Furthermore, the investigation examined the intricate relationship between the biochemical composition of the beans and various growing environmental variables; except caffeine content, all other biochemical compositions of the beans showed a significant association with the growing environmental conditions. The discerning application of principal component analysis underscored clear variations among the samples based on their growing environmental variables, physicochemical, and biochemical composition.
These findings reveal that the distinct quality of Arabica coffee beans across different regions in the country can be attributed to the variations in their growing environmental conditions. However, it is essential to acknowledge the limitations of our study, as we did not consider factors such as genetic variation in coffee beans, soil characteristics, and other variables that have the potential to influence the physicochemical characteristics and biochemical composition of coffee beans, ultimately impacting overall quality. Since Ethiopia is the center of origin for various agricultural products, including coffee, future research activities are recommended to consider genetic diversity. To achieve a more comprehensive understanding and differentiation of green Arabica bean samples from various coffee-growing agro-ecologies in Ethiopia, future research endeavors should investigate the exploration of metabolites that distinctly characterize these beans based on their profiles.
-
The authors confirm contribution to the paper as follows: investigation: Urugo MM; analysis: Urugo MM; writing - original draft: Tola YB, Kebede BT, Ogah O; writing - review & editing: Urugo MM, Tola YB, Kebede BT, Ogah O; validation: Tola YB, Kebede BT, Ogah O; supervision: Tola YB, Kebede BT, Ogah O; visualization: Urugo MM, Kebede BT. All authors reviewed the results and approved the final version of the manuscript.
-
The datasets generated during and/or analyzed during the current study are available from the corresponding author on reasonable request.
-
The authors would like to thank the Federal Ministry of Education of Ethiopia, Jimma University, and Wachemo University.
-
The authors declare that they have no conflict of interest.
- Supplemental Fig. S1 Standard and sample chromatogram.
- Copyright: © 2024 by the author(s). Published by Maximum Academic Press, Fayetteville, GA. This article is an open access article distributed under Creative Commons Attribution License (CC BY 4.0), visit https://creativecommons.org/licenses/by/4.0/.
-
About this article
Cite this article
Urugo MM, Tola YB, Kebede BT, Ogah O. 2024. Insight into the effects of environmental variables on the physicochemical characteristics and biochemical composition of green Arabica coffee. Beverage Plant Research 4: e021 doi: 10.48130/bpr-0024-0021 

Insight into the effects of environmental variables on the physicochemical characteristics and biochemical composition of green Arabica coffee
- Received: 29 March 2024
- Revised: 25 April 2024
- Accepted: 17 May 2024
- Published online: 17 June 2024
Abstract: This study conducted an in-depth assessment of green Arabica coffee bean samples sourced from diverse agro-ecologies in Ethiopia, focusing on the relationship between the beans' physicochemical characteristics and biochemical composition and their agro-ecological conditions. The study employs principal component analysis to elucidate the relationship between Arabica bean growing environmental conditions, physicochemical characteristics, and the biochemical composition of coffee beans from diverse Ethiopian agro-ecologies. The present findings reveal remarkable associations, particularly highlighting the impact of elevation in coffee-growing areas and the daily average temperature on key attributes such as hundred-bean weight, moisture content, crude fat content, and pH of the beans. Furthermore, the present study observed the intricate interplay between the beans' biochemical composition and diverse growing environmental variables. Except caffeine content, all other biochemical compositions of the beans exhibited significant associations with the prevailing environmental conditions during growth. Principal component analysis identifies variations in samples based on environmental variables, physicochemical, and biochemical composition. These findings highlight the complex impact of growing environmental conditions on the distinct quality of Arabica coffee beans across Ethiopian regions. For a comprehensive understanding of green Arabica beans from diverse agro-ecologies, future research should explore metabolites characterizing these beans based on their profiles.