


-
Coffee is primarily grown in tropical and subtropical regions but the influence of biophysical, edaphic, topographic, and management variables plays a pivotal role in a coffee bean's fruit yield and flavor. In the hilly areas of the coffee belt, a tropical band that stretches about 30 degrees north and south of the equator, are the world's truly great Arabica coffees[1,2]. Although all coffee is grown in tropical regions, a coffee's flavor profile is significantly influenced by the altitude at which it is grown. Southern Asia, many Pacific islands, eastern to southern Africa, and Central and South America are among the best locations on earth to grow coffee[3]. Coffee trees grow more slowly in a colder alpine climate, which delays the formation of beans. Moreover, coffee beans develop more complex sugars as a result of this extended maturation period, producing flavors that are richer and more captivating[4]. Higher altitudes with improved drainage also result in less water in the fruit, which concentrates the flavors even more in the land where the finest Arabica coffees were cultivated in highly rich and frequently volcanic soils. These rich soils give firm, thick coffee beans widely sought for their ability to offer great taste[4].
Before the 1970s, local farmers used their coffee seeds to duplicate their coffee crops[5]. However, the outbreak of coffee berry disease occurred in the 1960s which encouraged scientists to launch the national crop improvement program headed by the Jimma Agricultural Research Center (JARC), which started classifying coffee trees that exhibit high yields, resistance to drought, and coffee berry disease. However, the climates of Jimma, the plant breeding location, were not ideal for the newly chosen and resilient types of coffee plants. Thus, led by JARC, research works were being done in many coffee-growing regions of Ethiopia to record and select native landrace types that were both typical of Ethiopia's cup taste profiles and organically adapted to the locations in which they already flourished[5].
Ethiopia is the first in Africa (39%) and the fifth in the world (5%) in coffee production[6]. Coffee contributes about 24% of the country's foreign currency earnings[7]. Ethiopian coffee cultivation plays a vital role in the nation's cultural and socio-economic life. For this reason, the coffee value chain provides jobs and income for about 15 million people[8]. Due to the Arabica species' sensitivity to high temperatures and variations in the seasonal rainfall pattern, its production is seriously challenged by a changing climate[9−11]. Due to these factors, coffee loses appropriate areas, quality, and yield[9,11−14], which has an unintended effect on food security and farmer vulnerability[15].
While varietal features play a major role in determining coffee's taste and flavor, other factors affecting coffee beans' production and flavor include microclimate factors such as soils, altitude, humidity, temperature, and rainfall away from the field, the degree of roasting also affects the flavor of coffee[11,16]. The World Bank reported that neither quality nor market demand was a problem for coffee in Ethiopia[16] because 95% of production from the country's diverse coffee varieties were organic, traditionally cultivated without the use of pesticides and fertilizers but one million hectares of coffee trees were underproductive because the trees were not trimmed often. Grading and quality control of coffee was a prevalent procedure in Ethiopia at the producer, regional, and national levels[4]. For the benefit of everyone engaged in the production, collection, export, and consumption of coffee, this integrated control system aids in grading the beans before auction and export[3]. Coffee grading and quality control not only encouraged good-quality coffee production but also created lasting business relationships with overseas buyers[4]. Coffee was taken to the quality control center before exporting to ensure the reputation of the nation as well as to confirm the coffee's original character and determine if the green and cup qualities satisfied the export standard. At present, ECX provides coffee grade for cooperatives' collected coffee. The grades given throughout the last couple of years were found from 1−3 for Konga, Hafursa, Koke, and Dumerso. It was also 1−2 grades for the Haru Cooperative Society only. ECX also provides a coffee quality inspection test result certificate[3].
Clustering helps to identify homogeneous management units with relatively similar physiography, weather patterns, and production scheduling in the southern central Rift Valley of Ethiopia[17] and designed a separate production calendar for each of them[18]. Because coffee technologies are location-specific; clustering coffee fields helps to design economic, social, and management strategies required to enhance coffee quality and productivity in specific homogenous areas. According to Bhattarai et al., the heterogeneity of farm orientation, management practices, geographical context, and soil properties must be given proper attention and integrated into crop, shade tree, and soil management practices that were vital in improving and stabilizing yields in the future[19]. However, grouping coffee fields into smallholders and commercial farms oversimplifies the heterogeneity and doesn't help much to intensify management systems[20]. Anhar et al. classified global coffee growing areas broadly based on altitude into five clusters: very low (< 600 m above sea level (m a.s.l.)), low (601–760 m a.s.l.), medium (761–900 m a.s.l.), high (901−1,200 m a.s.l.) and very high (> 1,201 m a.s.l.)[21]. Based on their clustering Ethiopian coffee falls in the very high-altitude cluster (> 1,500 m a.s.l.) with fruity, spicy, floral, cherry wine quality[21]. Although Anhar's classification sheds some light on quality and productivity, it remains too broad to generate location-specific interventions within the country. Sarmiento-Soler et al.[22] showed that altitudinal gradient affected coffee yield components such as fruit load per branch, productive nodes per branch, and fruitful branches per stem at Mt. Elgon, Uganda, as well as on biochemical composition and quality of green Arabica coffee[4,23]. Bhattarai et al.[19] unraveled variations and gaps in coffee yields in Costa Rica by categorizing farm diversity through a resource endowment typology built by combining direct observation with the use of multivariate analysis and clustering techniques. Rasool & Abler[24] used agglomerative hierarchical cluster analysis to group 2,778 farming-defined counties and constructed or characterized six policy-relevant agriculturally homogeneous farming clusters with defined production potential across the US. In Gedeo, coffee output was influenced by several variables, including government regulations, agricultural system types, farm features, and the farmer's socioeconomic status. Hence, it's crucial to comprehend the scope of identical farm types and the variables that govern clustering to design productivity-boosting strategies[25,26]. Wolde et al.[26] reported that most coffee growers lack proper coffee extension training on production practices, management of coffee diseases and insect pests, fall short of inputs for enhancing productivity, and frequently remain victims of undermined coffee prices. The validity of each of these practices wouldn't be equally significant all over the study areas. The competitive advantage of one cluster over the other primarily arises from the production potential, the utilization of natural resources like land, weather and soil qualities, labor, technological advances, and capital potential[27]. To improve the current coffee production systems, it was crucial to consider how coffee farms with varying resources were managed in biophysical backgrounds that affected growth and output differences. Hence, many writers have advised a multivariate analysis of quality attributes and environmental factors of the region's diverse coffee-producing systems[4,17]. We hypothesize that: coffee production conditions associate well with growing conditions at the farm level, farmers' coffee management practices, fertility and moisture conditions in the growing season, and shade management practices across the clusters. This has been studied with the objectives of grouping coffee production areas within the Gedeo Zone into relatively homogenous clusters and identifying cluster-specific production strategies and alternative risk management responses that enhance coffee production and quality across the study area.
-
The study was conducted at all woredas of the Gedeo Zone. The zone is located geographically 38°0'0'' E to 38°50'0'' E and 5°50'0'' N to 6°20'0'' N. Gedeo Zone is 385 km and 149 km away from Addis Ababa and Wolayta Sodo cities, respectively. Representative kebeles were selected from highland, midland, and lowland areas available in each district of the Gedeo Zone. The study was conducted on 18 kebeles. The area's altitude ranges from 1,477 to 3,071 m a.s.l. (Fig. 1). The total population of the area is 1,296,557 comprising 650,816 men and 645,739 women. Eighty percent of the total population lives in rural areas and depends on agricultural activity. The major crops of the area were coffee (Coffea arabica) and enset (Ensete ventricosum). Fruit and cereals production takes the 3rd and 4th level, respectively in the study area.
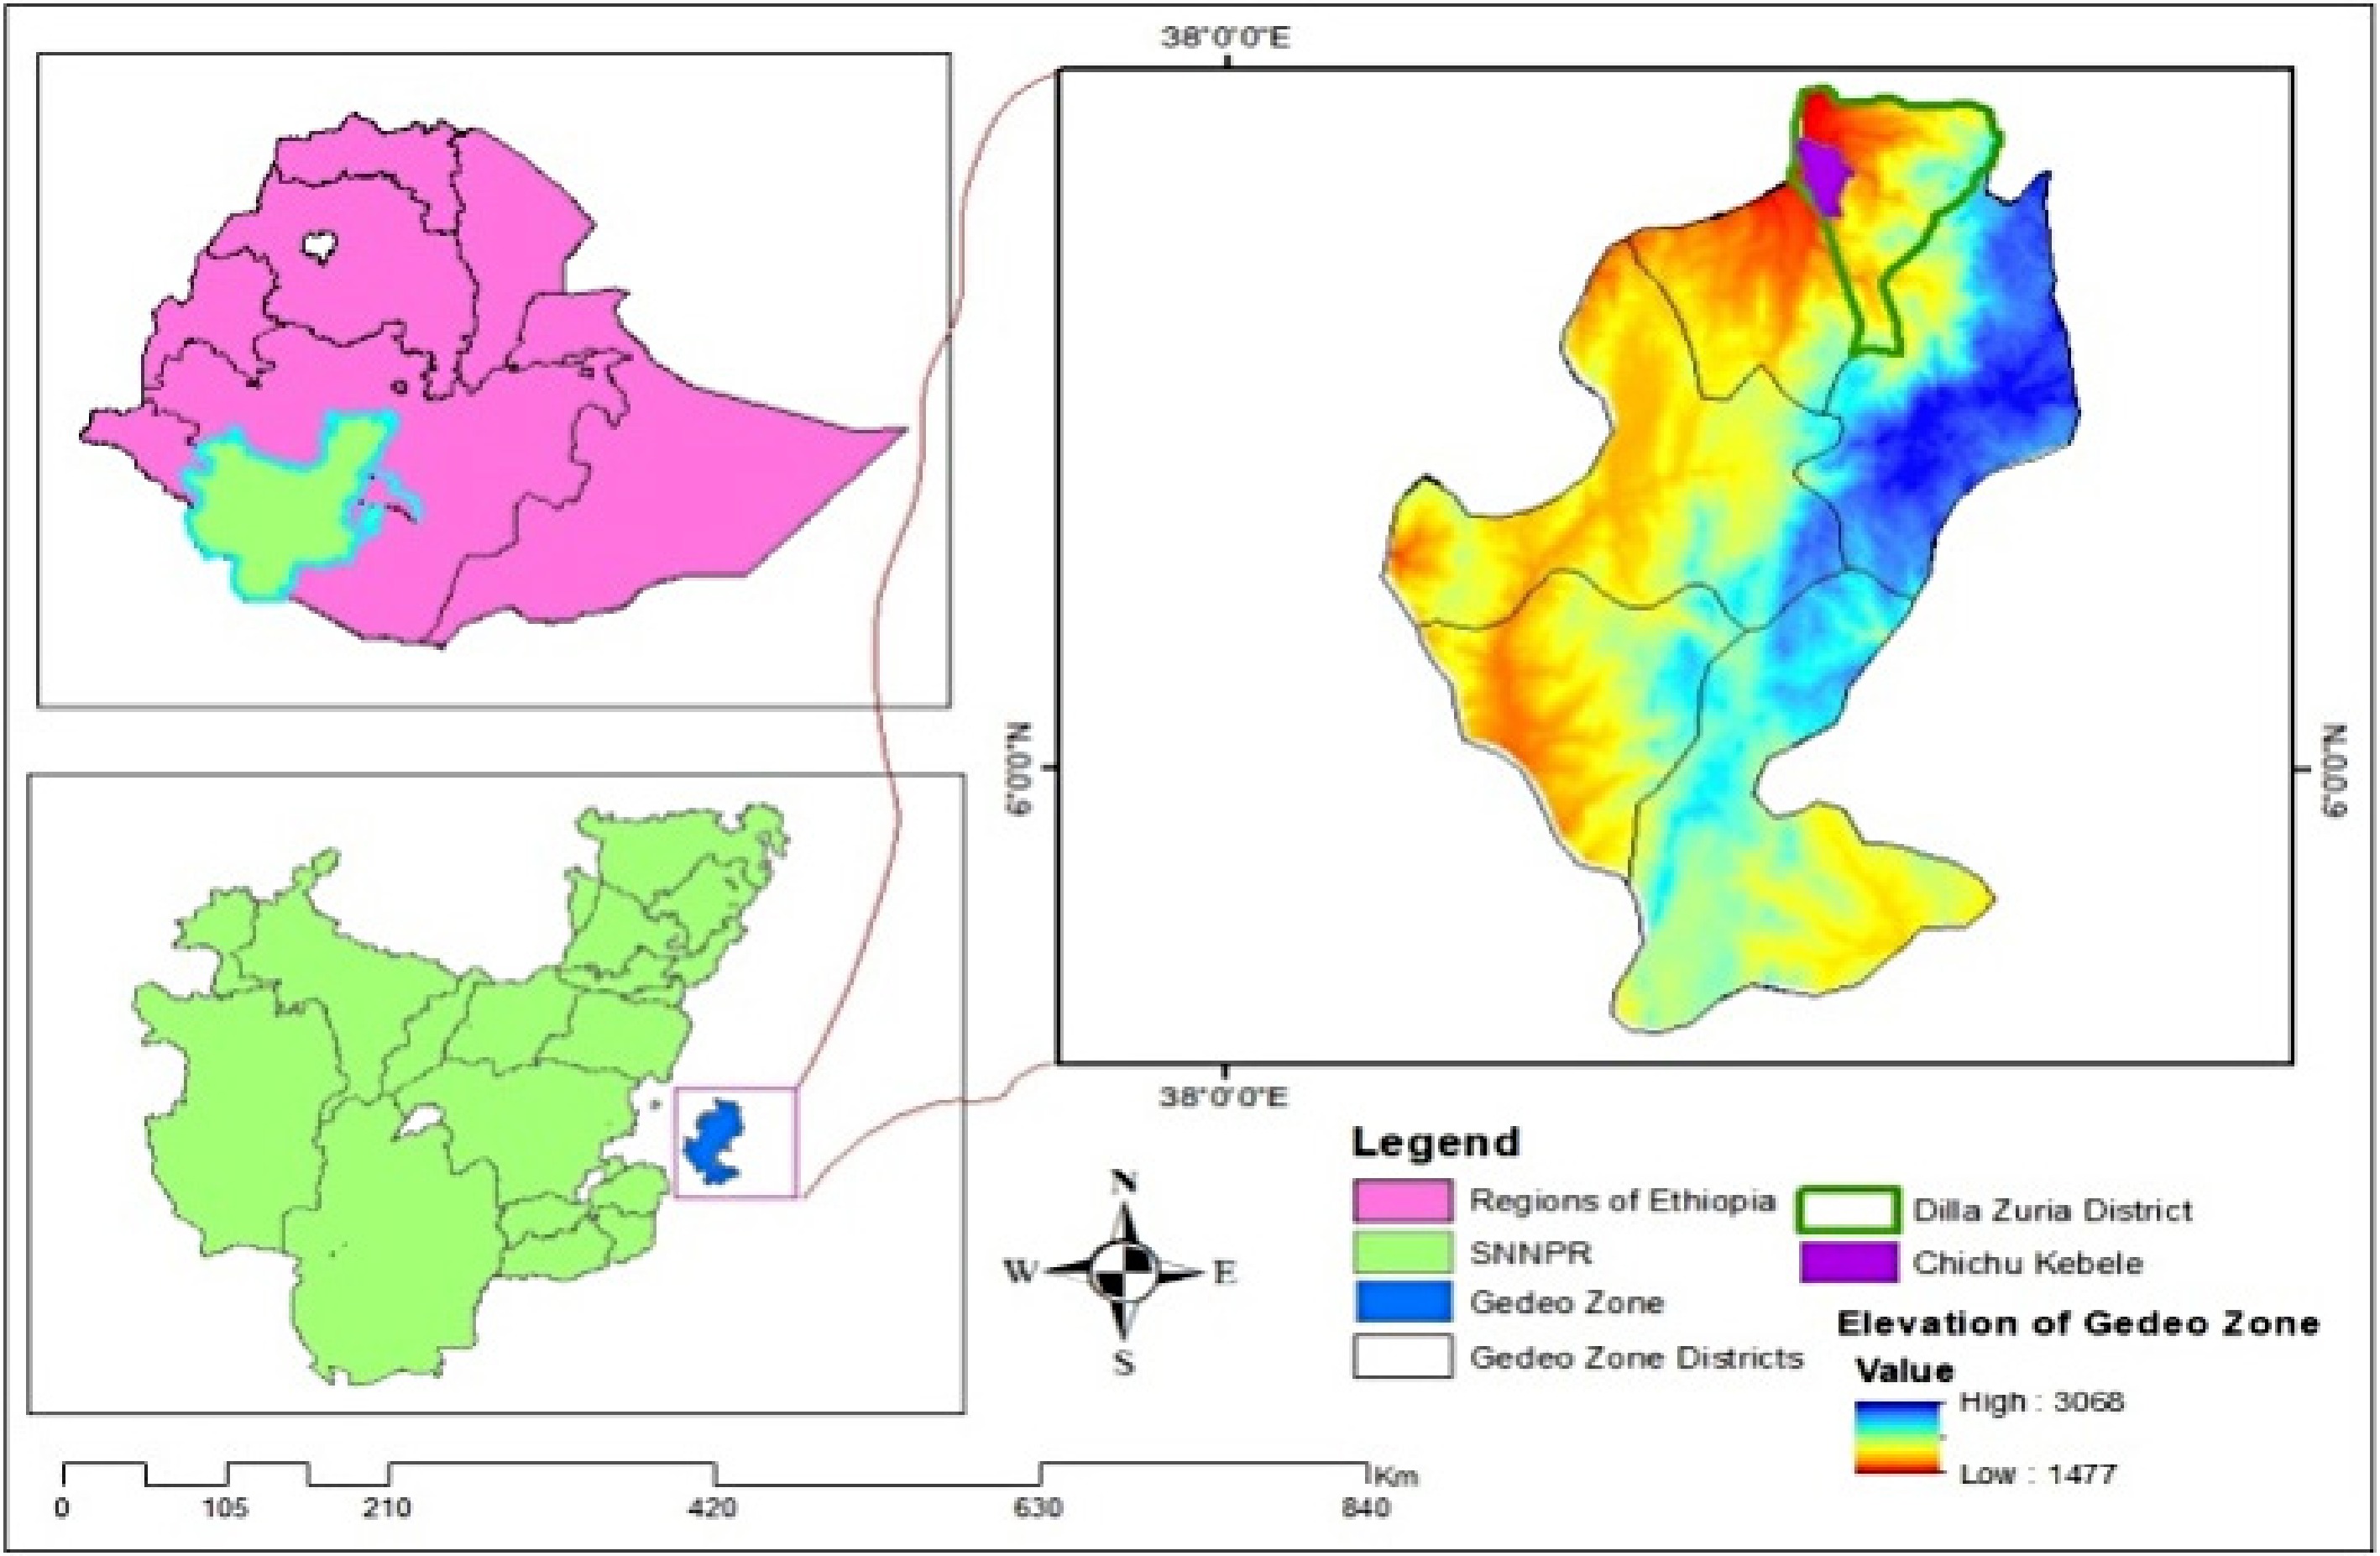
Figure 1.
Map and altitudinal variations of the study area.
Data collection and dataset standardization
-
Satellite-based daily minimum and maximum temperature, sunshine hours, relative humidity, and wind speed were computed using standard procedures following the study by Marlowe & Nunley[28]. Remote sensing data on Normalized Difference Vegetation Index (NDVI), soil moisture, and actual evapotranspiration has been retrieved from the United States Geological Surveys (USGS) suitable for the study area (
https://earthexplorer.usgs.gov following previously established procedures[29−30] with a spatial resolution of 250 m2. NDVI has been used to understand the vegetative density and health of coffee, soil moisture helped to understand moisture availability for the growing coffee plant and evapotranspiration was used to realize water loss from soils and plants grown in coffee-based agro-forestry systems.To assess management data (seedling selection, types, and rates of organic fertilizer, lime applied, shade trees, and coffee performance), all agro-ecologies per district were represented by randomly choosing representative kebeles within the district so long as the kebeles represent dominant coffee-producing areas and capture variability in the coffee production systems. Within each kebele, three adjacent coffee producer farmers were selected (Table 1) to respond to a checklist prepared. All of these farmers were considered a main soil sampling point, about 1 kg of representative composite soil sample was collected in a zigzag method from 0–30 cm depth by using an auger after removing unnecessary material such as roots, clods, and stones and thoroughly mixing together in the clean bucket and logged into properly labeled sample bags[31]. Soil samples were taken from representative coffee fields but were not taken from areas like animal dung accumulation places, poorly drained and any other places that would not give a representative image of the area. All of these farmers were interviewed on the checklist consisting of the management and production of coffee. During soil sampling, the geographic variables including latitude, longitude, and altitude were measured using GPS as shown in Table 1. Finally, the soil samples were brought to the soil laboratory of Hawassa Agricultural Research Center (Ethiopia). Datasets were standardized using z- score using the formula in Eq. (1).
$ Z=\frac{(\mathrm{X}-\mathrm{\mu }\_\mathrm{r}\mathrm{e}\mathrm{f}\mathrm{f}\mathrm{ })}{\mathrm{\sigma }\_\mathrm{r}\mathrm{e}\mathrm{f}\mathrm{f}} $ (1) where, X is value, μ_reff is mean, and σ_reff is standard deviation.
Table 1. Sampling villages representing different agro-ecologies of coffee producing areas within districts of the Gedeo Zone, southern Ethiopia.
Number District Village Altitude
(m a.s.l.)Latitude
(degrees)Longitude
(degrees)1 Yirgachefe Konga 1,902 6.12 38.21 2 Haru 1,946 6.13 38.19 3 Wonago Tumatachiracha 1,660 6.33 38.27 4 Karasodti 1,942 6.27 38.23 5 Wotiko 2,123 6.28 38.31 6 Dillazuria Odaya'a 1,586 6.35 38.32 7 Chichu 1740 6.36 38.32 8 Andida 2,345 6.28 38.3 9 Gedeb Workasakaro 2,100 5.94 38.31 10 Harmufo 2,192 6.21 38.21 11 Kochore Buno 1,760 6.02 38.14 12 Hama 1,880 6.04 38.17 13 Chorso Moralayu 2,553 6.09 38.31 14 Kisha 2,328 6.08 38.21 15 Raphe Chiribanita 2,322 6.19 38.29 16 Layurasa 2,464 6.21 38.36 17 Bule Adado 2,483 6.34 38.36 18 Basura 2,290 6.33 38.37 Soil sample preparation and soil laboratory analysis
-
The soil samples were collected from the study area air dried, crushed, and passed through a 2 mm diameter sieve for all parameters except total N and organic carbon (OC) that passed through a 0.5 mm diameter, selected soil physical and chemical properties were analyzed at soil laboratory of Hawassa Agricultural Research Center (Ethiopia) using the Walkley black method. Soil pH was determined in a 1:2.5 soil-to-water ratio using a digital pH meter[31,32]. Organic carbon was determined following the wet digestion method as described by Walkley & Black[33] while the percentage of organic matter in the soils was determined by multiplying the percent organic carbon value by 1.724. The total N of the soil was determined by the Micro-Kjeldahl digestion, distillation, and titration method[34]. Available P was determined using the Bray II method by shaking the soil samples with an extracting solution of 0.03 M ammonium fluoride in 0.01 M hydrochloric acid as described by Bray & Kurtz[35]. Exchangeable bases were extracted with 1N ammonium acetate at pH 7. Exchangeable Ca and Mg were measured by atomic absorption spectrophotometer (AAS), while exchangeable Na and K were measured using a flame photometer[36]. To determine CEC, the soil samples were leached with 1N ammonium acetate solution and washed with ethanol (97%) to remove excess salt followed by leaching with sodium chloride to displace the adsorbed (NH4+). The quantity of ammonia then was measured by distillation and taken as CEC of the soil[37]. The soil's percent base saturation was calculated as the sum of the basic exchangeable cations (Ca, Mg, K, and Na) to the CEC[38]. The textural class was determined using the Bouyoucos hydrometric method while Fe (iron) was determined using the UV-VIS method (1.10 phenanthroline - complex). Finally, the rating of soil nutrients was carried out following the method of Markos & Gurmu[39].
Multivariate statistical analysis
-
The numbers of variables were reduced into smaller numbers of groups through multivariate statistical techniques such as factor analysis (FA), principal component analysis (PCA), and hierarchical cluster analyses (HCA), which were applied to the data for drawing meaningful information. Through cluster analysis, a graphical display (dendrogram) was created to classify or group data sets as homogeneous groups using procedures by Davies & Gamm[40]. All mathematical and statistical computations were made using XLSTAT software (version 2010). The statistical approaches (PCA and HCA) were based on a correlation matrix (10 years × 18 kebeles × 58 variables) with SPSS and Minitab software; whose rows were the different samples analyzed and whose columns correspond to the different parameters. PCA was applied to examine the relationships among the variables. Normality, multicollinearity, KMO test, and Bartlett tests were carried out using SPSS[41−45]. Whereas, HCA was applied to the dataset to group similar sampling sites (spatial variability) by using Ward's algorithm method and Euclidean distances. These techniques were applied to field data, which were standardized to avoid misclassification arising from the different orders and units of variables.
Mapping the geospatial data
-
In this study, the spatial distribution maps of rainfall patterns and cluster areas were obtained using the Kriging method[46] that allowed taking into consideration the spatial continuity of the vector points. The mapping procedure started by using the geographic locations of each kebele, woreda, their area, and other data representing that geo-referenced point[30]. The results of these samples were converted to raster through interpolation using ordinary Kriging[46] in Arc-GIS software.
Euclidean distance
-
The Euclidean distance formula given in Eq. (2) measures the distance of a line segment for two points, point A (x1, y1) and point B (x2, y2) in the two-dimensional coordinate plane for the Euclidean distance (d) as shown in the study by MacQueen[47].
$ \mathrm{d}=\sqrt{\left(\mathrm{x}2-\mathrm{x}1\right)^2+(\mathrm{y}2-\mathrm{y}1)^2} $ (2) where, 'd' is the Euclidean distance; (x1, y1) is the coordinate of the first point; (x2, y2) is the coordinate of the second point.
-
The dominant factors that affect coffee production are climatic, edaphic, biotic, physiographic, and those factors related to farmers' management experience. From 18 kebeles representing the whole agroecologies of each woreda (district) (highland, midland, and lowland), we accessed 57 variables for 18 kebeles. This procedure was carried out to determine how many factors were required to explain datasets and has been carried out step by step from Kaiser-Meyer-Olkin (KMO) test, Bartlett test, correlation matrix, and VARMAX rotation. With a KMO of 0.583, the model was appropriate for factor analysis; Since the Bartlett test of Spheriocity was significant (p < 0.05), the samples were assumed adequate for data analysis (Table 2).
Table 2. KMO and Bartlett's test.
Measure Statistics Value Kaiser-Meyer-Olkin (KMO) 0.583 Bartlett's Test of Sphericity Approx. chi-square 1,690.1 df 1,596 Sig. 0.05 As a result, only variables having a correlation coefficient greater than 0.3 were considered for further analysis of PCA to avoid autocorrelations. In doing this we avoided violations to correlation matrix, which was confirmed with a Durbin-Watson test of nearly equal to 2. Subsequently, we identified 12 principal components with varying degrees of influence on the dataset as shown in Table 3.
Table 3. Correlation component matrix of coffee fields in the Gedeo Zone of southern Ethiopia.
Variables PC1 PC2 PC3 PC4 PC5 PC6 PC7 PC8 PC9 PC10 PC11 PC12 Soil water conservation 0.11 0.01 −0.37 −0.16 0.31 −0.25 0.38 0.16 0.47 0.30 −0.35 −0.06 NDVI −0.48 −0.17 −0.37 0.52 0.02 −0.06 −0.38 −0.10 0.27 0.29 −0.07 −0.11 Shade trees 0.22 −0.12 0.78 −0.37 −0.12 0.21 −0.17 −0.10 0.09 0.25 −0.12 0.05 Ash −0.31 0.11 0.04 −0.06 −0.47 0.56 0.10 0.55 0.00 0.10 0.08 −0.03 Evapotranspiration −0.09 −0.62 0.11 0.44 0.37 0.35 −0.24 −0.12 0.12 0.07 0.15 −0.11 Organic carbon −0.06 0.11 −0.20 −0.41 −0.10 0.44 −0.36 −0.39 −0.10 0.06 −0.11 0.38 Nitrogen −0.28 0.54 0.20 −0.59 0.35 −0.06 0.06 −0.16 0.08 0.04 0.12 −0.06 Iron −0.05 0.46 0.12 0.58 0.34 −0.16 −0.20 −0.40 0.18 0.02 −0.16 0.03 Altitude 0.16 0.02 −0.45 0.14 0.57 −0.19 −0.30 −0.07 −0.39 −0.06 −0.18 0.18 Variety −0.38 0.10 −0.19 −0.53 0.37 0.16 −0.04 −0.28 0.12 −0.21 −0.33 −0.18 Clay 0.14 0.28 −0.33 −0.18 −0.39 0.20 −0.46 −0.25 0.17 −0.25 0.14 −0.39 Cation exchange capacity −0.52 0.42 0.05 −0.54 0.20 −0.07 0.21 −0.15 0.00 0.18 0.17 0.08 * Values in bold were different from 0 with a significance level alpha = 0.05. Considering the values in Table 3, variables like cation exchange capacity (CEC), total nitrogen, organic matter, ash, Fe, and clay content of soils are often associated with soil fertility and nutrient availability. Higher levels of these variables could indicate more favorable soil conditions for coffee growth, potentially leading to increased yield or improved quality. Evapotranspiration, shade trees, altitude, and soil water conservation are related to climatic and environmental factors. These variables could influence water availability, temperature, and microclimate conditions, which can impact coffee plant growth, flowering, and fruit development. Optimal levels of these factors might contribute to enhanced coffee productivity and quality. Variables such as NDVI (Normalized Difference Vegetation Index) and variety were likely related to the specific coffee cultivars or plant types grown in the region. Different varieties can have varying yield potentials and flavor profiles, which could affect both quantity and quality aspects of coffee production. Thus, only 12 variables explained a correlation coefficient greater than 0.3 in the dataset of 58 variables considered across the 18 kebeles.
Variability among the dataset
-
Following the rule of eigenvalue greater than 1, 12 principal components (PC) explained over 95% of the variability in coffee production in Gedeo (Table 4). According to Tables 3 and 4, PC1, PC2, and PC3 corresponded to the cation exchange capacity (CEC) of soils, evapotranspiration, and shade trees, which were dominant in characterizing the coffee production scenarios. Next, PC4, PC5, and PC6 represented total nitrogen, altitude, and ash, respectively. Similarly, PC7, PC8, and PC9 represented organic matter, iron, and soil water conservation, respectively. Also, PC10, PC11, and PC12 corresponded to NDVI, variety, and clay content of soils. CEC, evapotranspiration, and shade trees explained 22.5%, 16.1%, and 11.9%, respectively of variability in coffee production. Total nitrogen, altitude, and ash explained 10.5%, 8.1%, and 5.8% of variability, respectively. The variables organic carbon, iron, soil water conservation, NDVI, variety, and clay explained 5.0%, 4.0%, 3.3%, 3.2%, 2.9%, and 2.1%, respectively. These variables explained 95.4% of the variability in coffee production environments in Gedeo.
Table 4. Total variance explained in the dataset after principal component analysis.
Principal component Initial eigenvalues Extraction sums of
squared loadingsTotal % of Variance Cumulative % Total % of Variance Cumulative % 1 12.58 22.46 22.46 12.58 22.46 22.46 2 9.02 16.11 38.56 9.02 16.11 38.56 3 6.65 11.88 50.44 6.65 11.88 50.44 4 5.89 10.51 60.95 5.89 10.51 60.95 5 4.53 8.09 69.04 4.53 8.09 69.04 6 3.25 5.81 74.85 3.25 5.81 74.85 7 2.82 5.04 79.89 2.82 5.04 79.89 8 2.25 4.02 83.91 2.25 4.02 83.91 9 1.86 3.32 87.23 1.86 3.32 87.23 10 1.79 3.19 90.42 1.79 3.19 90.42 11 1.65 2.94 93.36 1.65 2.94 93.36 12 1.17 2.09 95.44 1.17 2.09 95.44 Clustering the coffee fields
-
Following the hierarchical clustering technique, a scree plot (Fig. 2a) was generated for all 58 variables. Those variables with an eigenvalue greater than 1 were used to explain factors affecting the variability of coffee production in Gedeo. The distribution of variables after VARMAX rotation was also observed to explain those variables with significant influence on the variability. Variables with negative influence in the dataset were clay content, type of variety, latitude, and number of plants under coffee shade (DUCF) (Fig. 2b). The variables with positive influence were agroecologies, farm yard manure, coffee husk, coffee plant density, sand content, and soil and water conservation practices. The influence of surface and profile soil moisture, rainfall, NDVI, relative humidity, and temperature has been either positive or negative depending on the management the farmers follow (Fig. 2b). The dendrogram in Fig. 2c clearly shows five clusters following a cut point of 5 units of cluster distance. The dendrogram also elaborated five distinct clusters namely Charbanta and Harmifo in one cluster (hereafter Dumerso), Tumata chiracha, Chichu and Odaya'a (hereafter chiracha cluster), Andida, Moralayo, and Layo rasa (hereafter Wotiko), Hama, Kisha, Adado, Basura, Gelelichi, and Kara sodite (hereafter Hama cluster), and finally Konga, Haru, Worka Sakaro, and Buno (hereafter Konga cluster) (Fig. 2c). Figure 2d elaborated how each locality has been grouped with the right top cluster being known for superior coffee qualities across years throughout the Konga cluster, which was dominantly due to frequent use of compost and farm yard manure, lower evapotranspiration of coffee plants and more appropriate type and many shade trees. The top left cluster, Tumata Chiracha, was in direct contrast to that of the top right cluster due to a lower, relative humidity of the air, lower water content, and total nitrogen of soils despite higher evapotranspiration of coffee plants. Moreover, agro-ecologies, farm yard manure, coffee husk, plant density, pruning practices, sand content, soil and water conservation practices, and phosphorus content of soil were very important in determining the production of coffee (Fig. 2b & d).
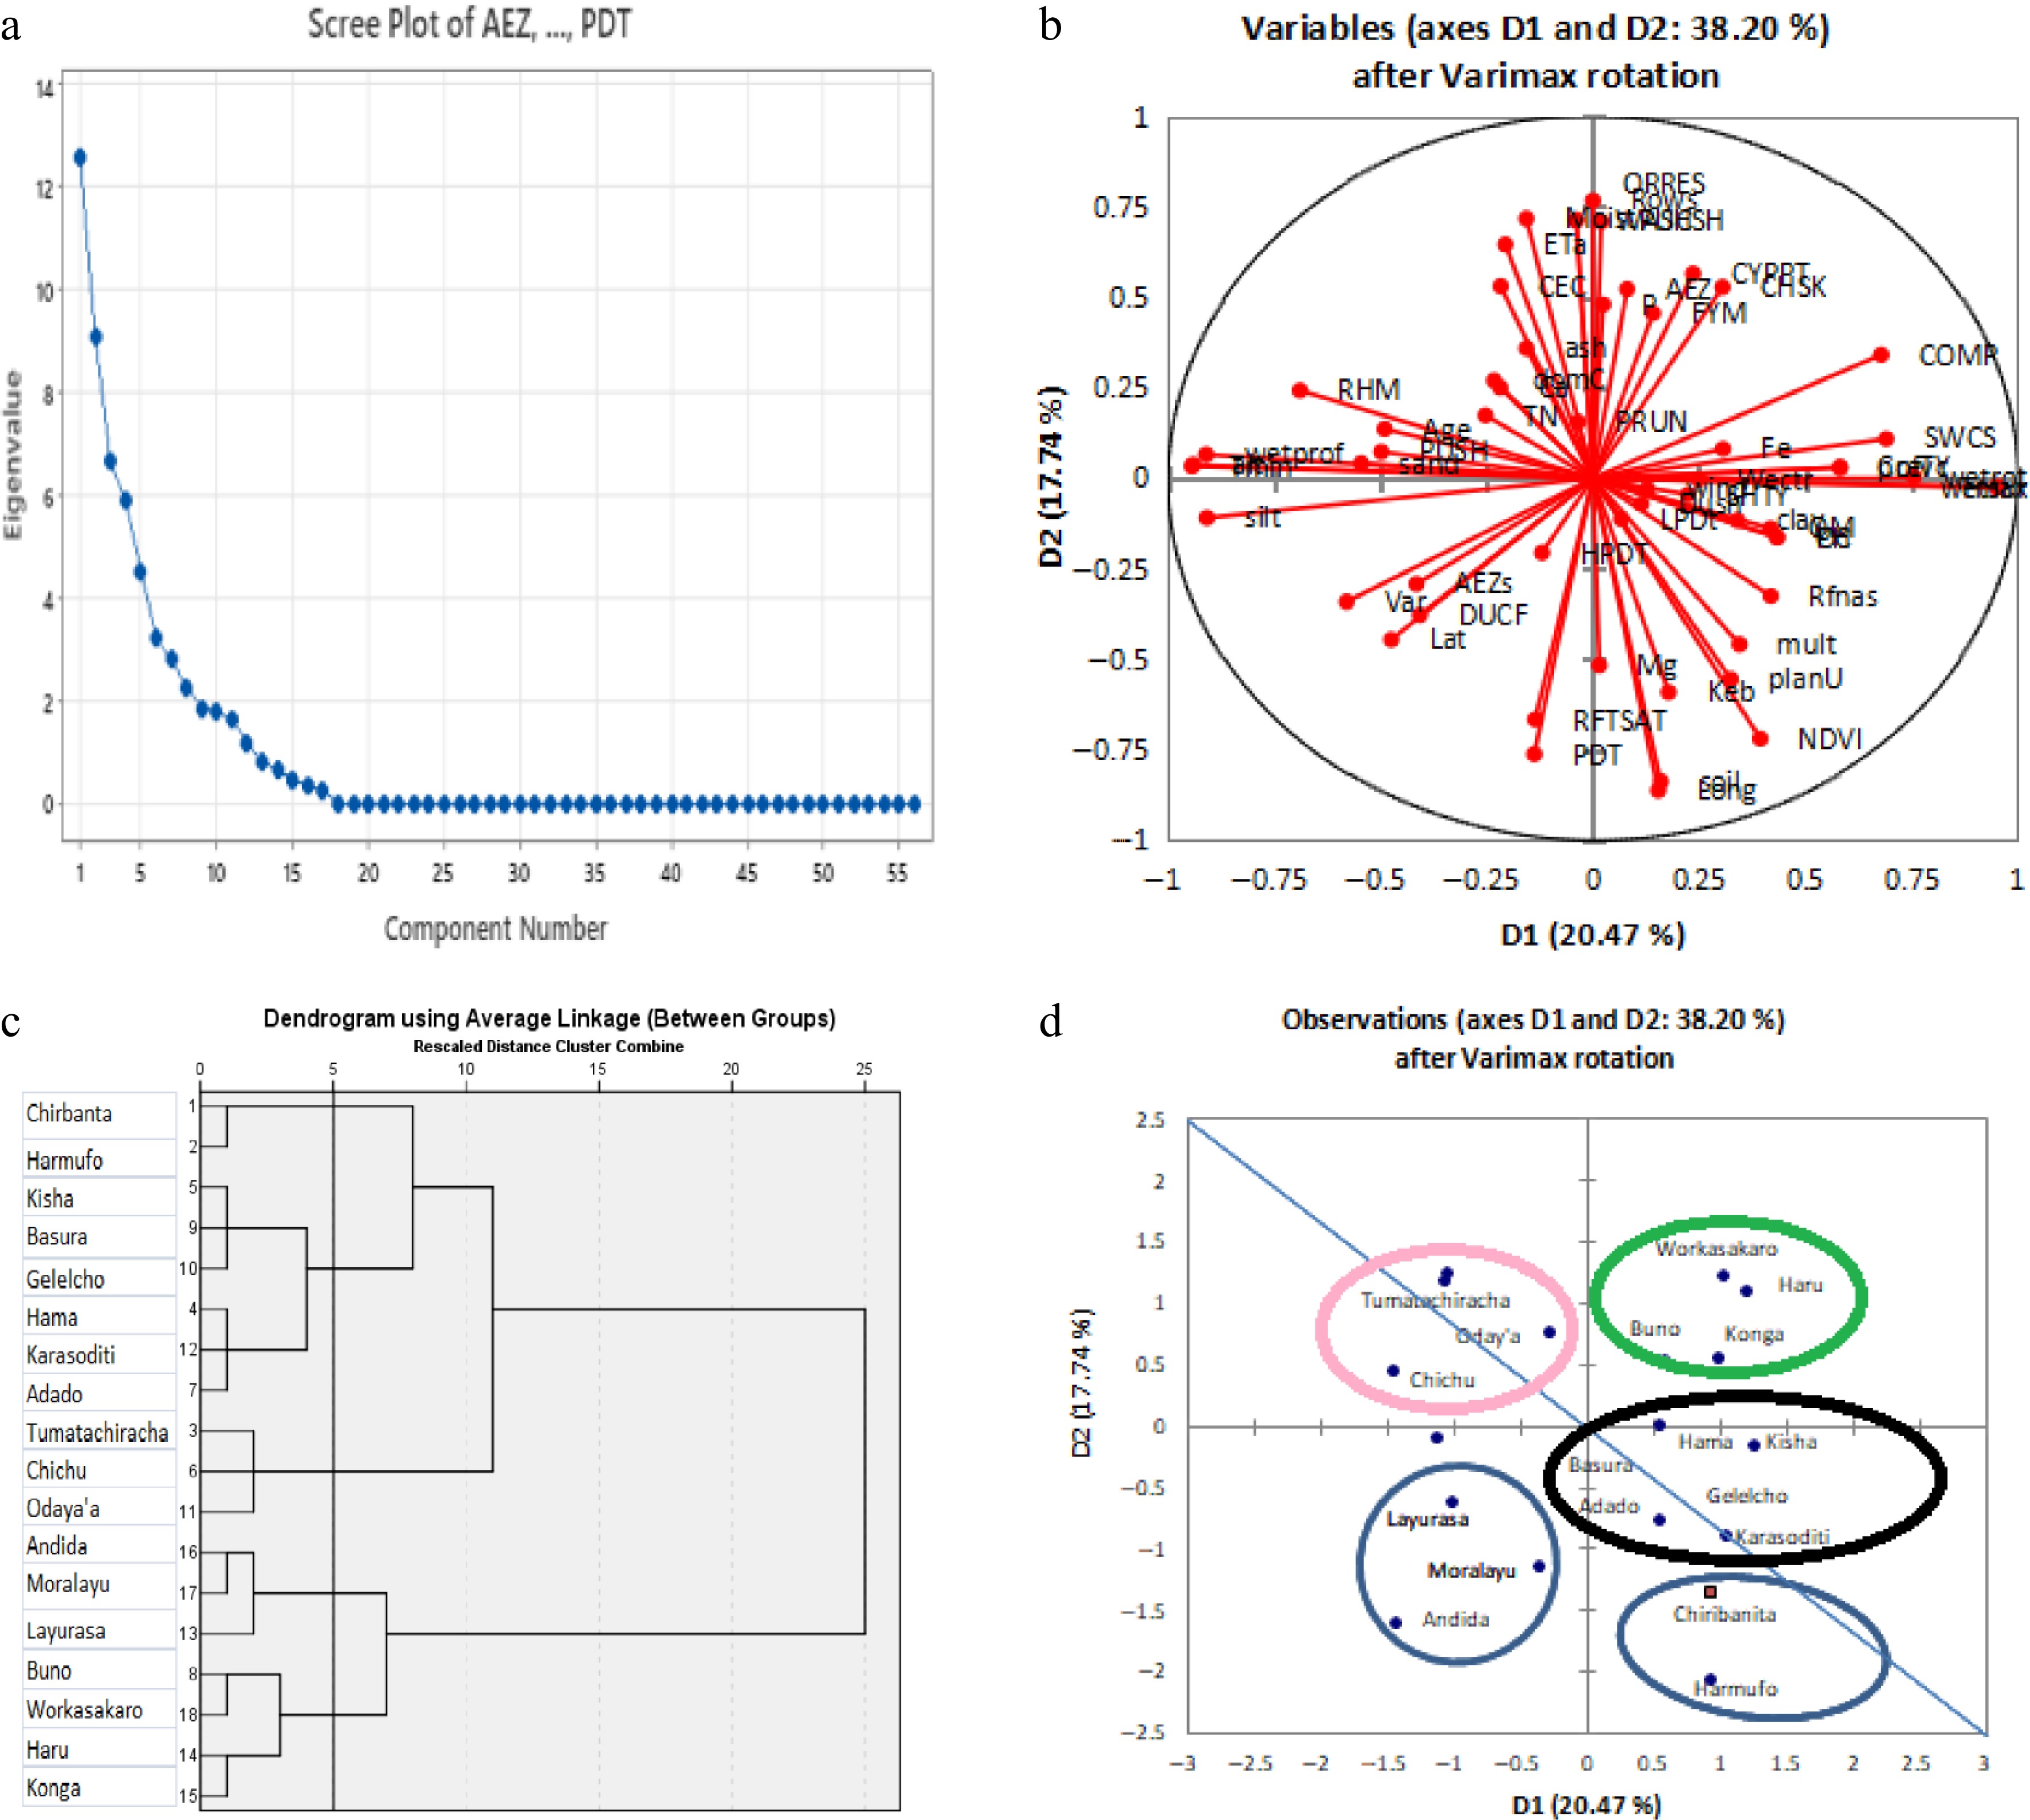
Figure 2.
(a) Scree plot. (b) Loading plot. (c) Dendrogram. (d) Score plot of observations across study areas.
Cluster analysis
-
The distance between the cluster's centroid indicating proximity matrix among clusters was found highest (894,814.6) between Tumata chiracha and Wotiko, and lowest (29,212.5) between Hama and Tumata Chiracha as presented in Table 5. The clusters were divided into two groups: Group I and Group II. Group I consisted of two clusters named Konga and Wotiko whereas Group II consisted of three clusters: Hama, Dumerso, and Tumata chiracha. The Tumata Chiracha cluster consisted of three kebeles named Tumata Chiracha, Chichu, and Oday'a (Table 5). The Wotiko cluster consisted of kebeles like Andida, Moralayou, and Layourasa. The largest cluster was known as Hama, which consisted of Hama, Kisha, Adado, Basura, Gelelichi, and Kara Soditi kebeles. The remaining cluster was named Konga, which included Konga, Worka sakaro, and Haru. The biggest centroid distance between Tumata Chiracha and Wotiko was indicative of the largest differences in the dataset explaining the coffee production and management conditions in both clusters.
Table 5. Euclidean distance showing proximity matrix among clusters.
Clusters Konga Tumatachiracha Dumerso Hama Wotiko Konga 0 206,177.10 181,089.00 80,932.50 429,054.70 Tumatachiracha 0 0 288,700.40 29,212.50 894,814.60 Dumerso 0 0 0 191,136.90 187,526.10 Hama 0 0 0 0 659,241.40 Wotiko 0 0 0 0 0 Mapping and characterizing the identified clusters
-
Each of these clusters showed distinct attributes as shown below and mapped in Fig. 3.
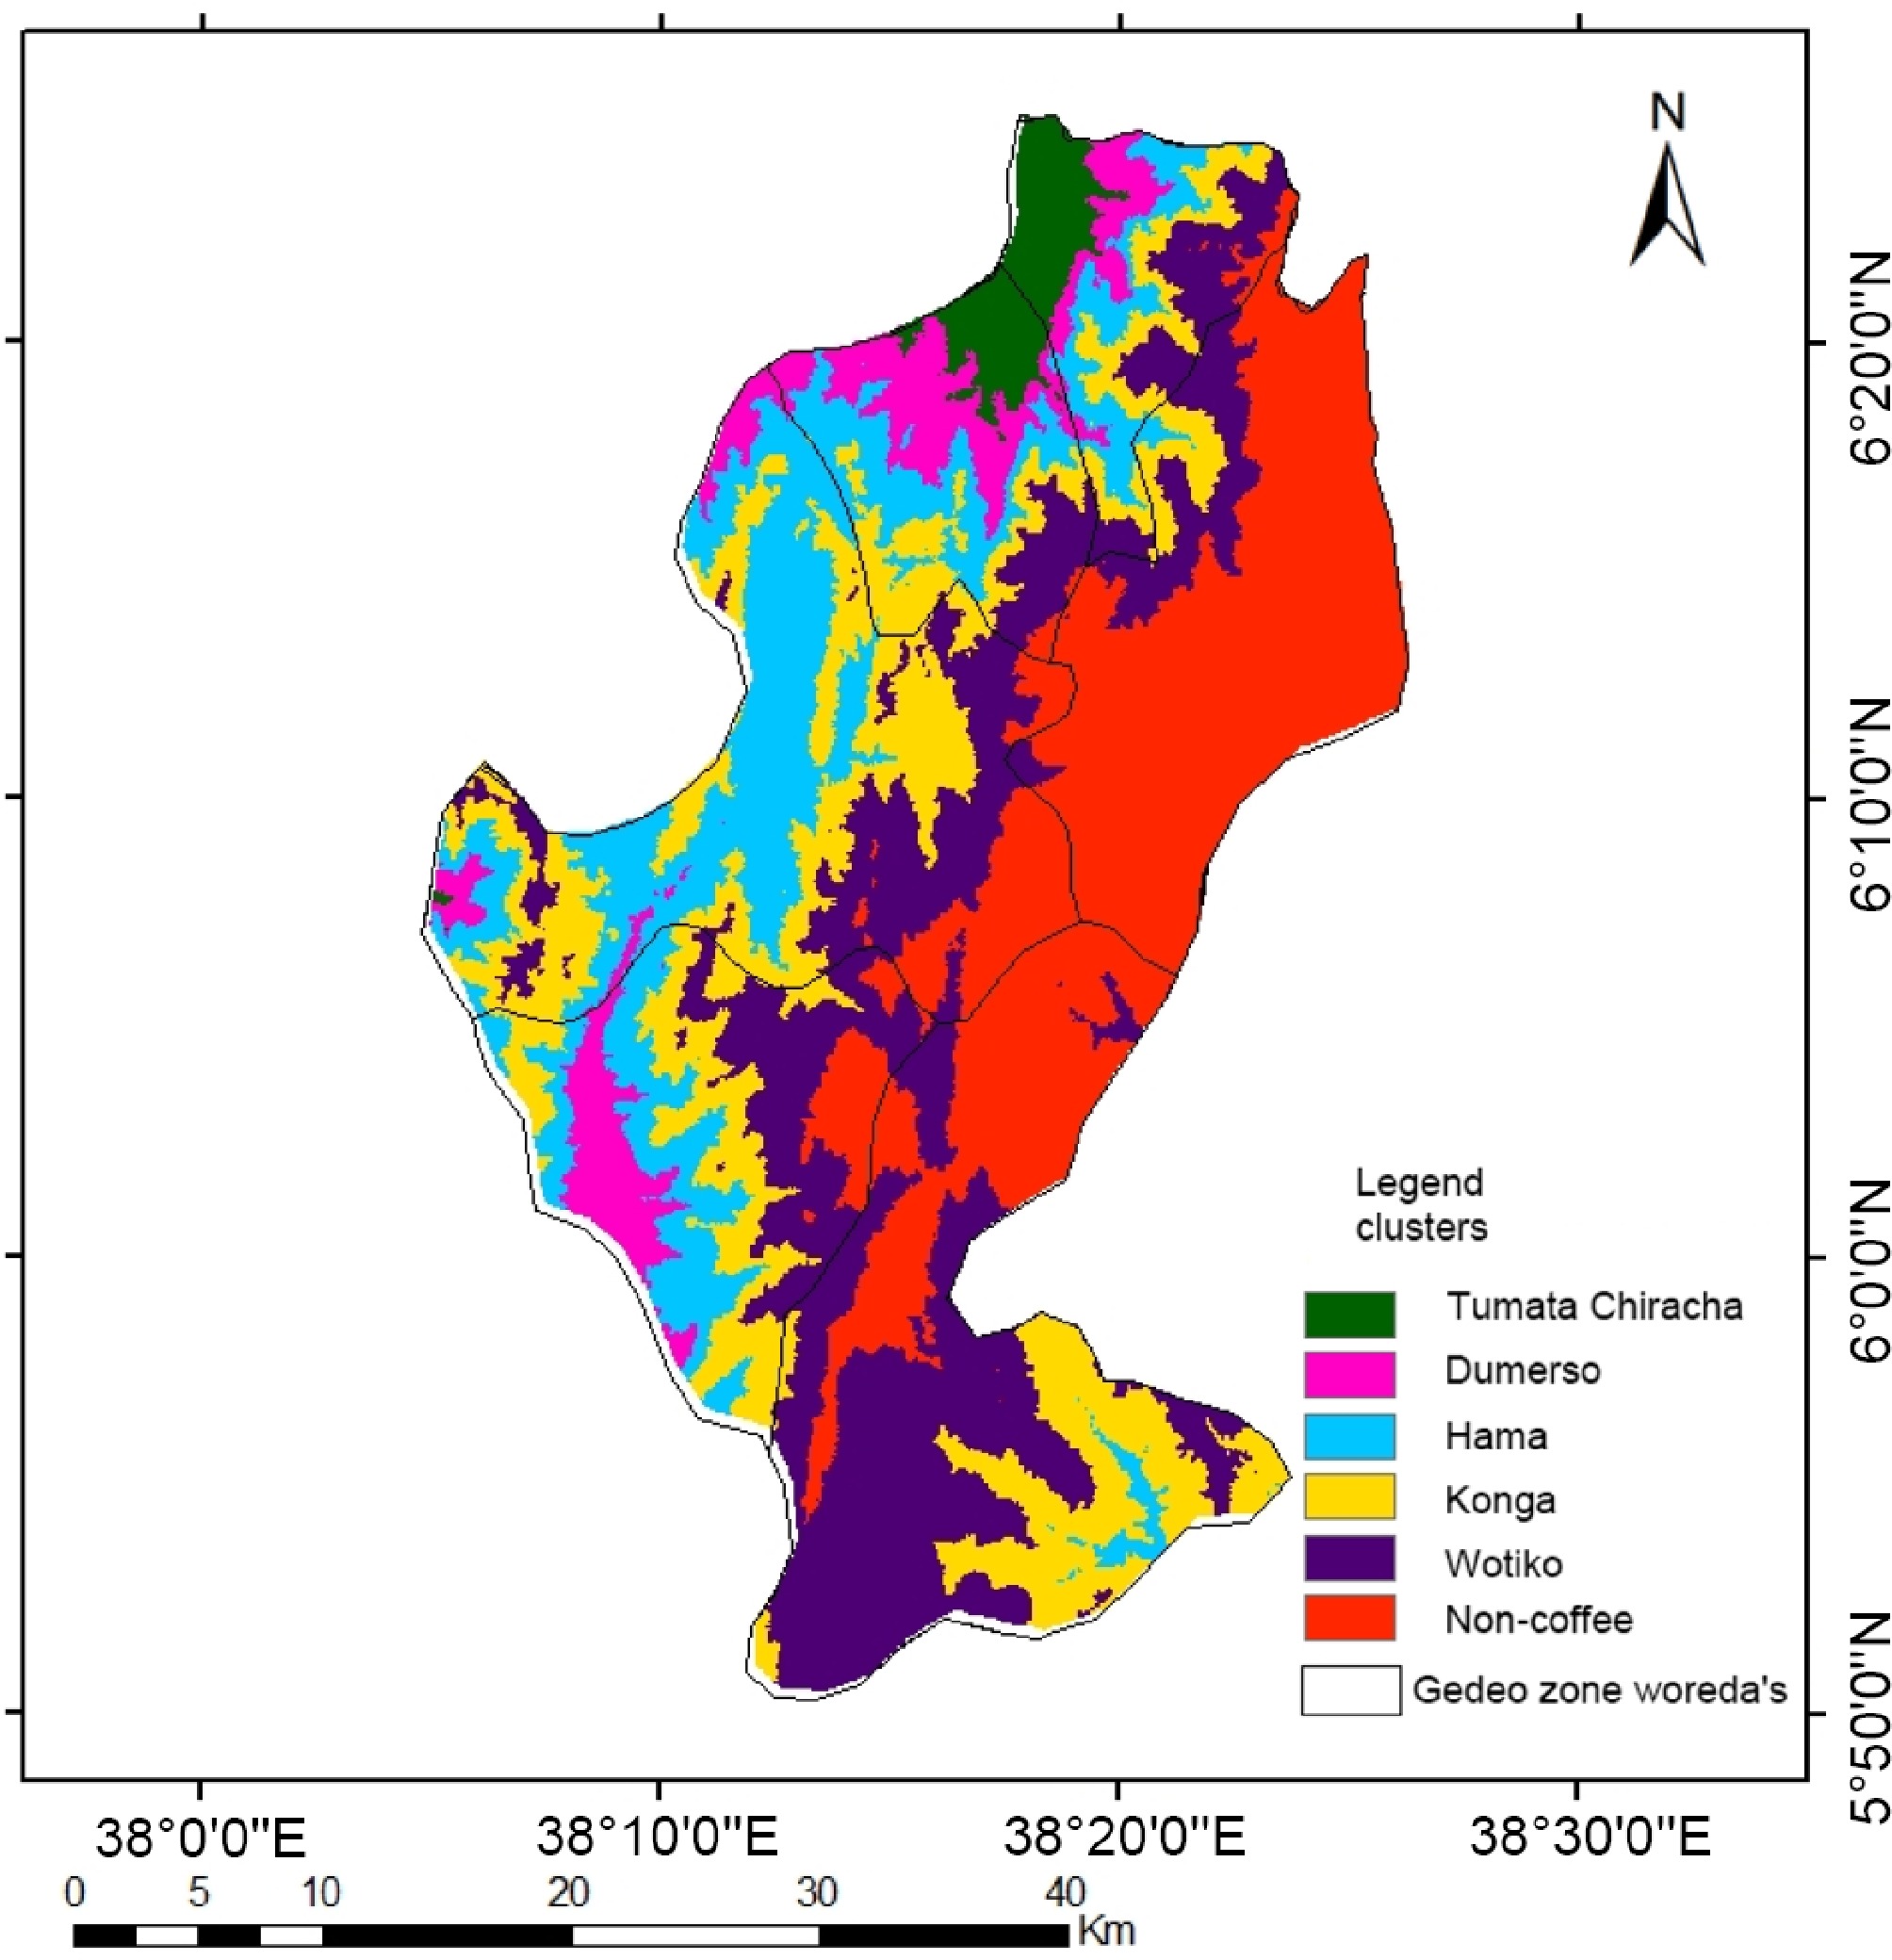
Figure 3.
Maps showing the clusters and those areas outside the coffee production areas.
Tumtatachiracha cluster
-
The area provided a frost-free climate averaging 15.8–27.1 °C year-round, with moderate rainfall of roughly 1,340.7 mm, and abundant sunshine. In this cluster, the NDVI and actual monthly evapotranspiration estimates were 0.77 and 30.6 mm, respectively marking the highest values among the study clusters (Table 6). 0.952 (17%) of the dataset explained the information gathered regarding Tumatatachiracha cluster (Table 6). It was a mid to lowland area of coffee production that required suitable mid-lowland coffee varieties and in situ soil and water conservation structures together with a reduction of sweet potato and taro intercrops from coffee fields (Figs 1 & 2). Some areas of Dilla (Odaya'a and Chichu), and Wonago (Tumata Chiracha and Hasse Haro) were a few examples in this cluster. Relative higher temperatures recorded throughout the year and rainfall coming only in a few months of the year frequently caused coffee fruits to ripen more quickly resulting in lowly filled beans with taste qualities that range from simple and bland to earthy or murky flavor. Moisture stress particularly during bean filling was the biggest challenge for coffee production in the area. This necessitates an urgent need for climate change adaptation strategies including the introduction of lowland varieties of coffee, conservation tillage, mulching, construction of soil and water conservation structures, cover cropping, and shade trees.
Table 6. Mean of NDVI, ETa, and climatic variables across clusters.
Konga Information (proportion %) Tmin (°C) Tmax (°C) RHM (%) Wind (m/s) ETa (mm/month) Rainfall (mm) NDVI (%) Konga 1.23 (22%) 13.70 25.30 68.80 1.40 29.40 1,407.10 0.71 Tumatachiracha 0.95 (17%) 15.80 27.10 66.20 1.60 30.60 1,340.70 0.77 Wotiko 0.95 (17%) 15.10 26.50 67.20 1.50 26.30 1,307.20 0.67 Hama 1.48 (33%) 14.80 26.20 67.50 1.60 28.00 1,302.30 0.69 Dumerso 0.62 (11%) 14.30 25.30 69.00 1.40 26.30 1,468.90 0.69 Mean 5.60(100%) 14.70 26.10 67.70 1.50 28.10 1,365.20 0.71 Hama cluster
-
The area provided a frost-free climate averaging 13.3–25.3 °C year-round, moderate rainfall of roughly 1,302.3 mm, and abundant sunshine (Table 6). This is the largest cluster where 1.848 (33%) of the dataset explained the information gathered. Dry mills were the most common but wet-processing plants were deficient in this cluster. It included some areas of Dilla (Amba and Shigado), Wonago (Kara soditi and Gelelicho), Yirgachefe (Koke), Basura, and Adado (Bule), Gedeb (Gedeb gubeta) and Kochore (Hama). Among the local coffee cultivars of the study area are Wolisho, Kurime, and Diga. The Kurime coffee cultivar was a land race that bears small fruit cherries. The Wolisho is a cultivar with large cherries and long leaves. This cluster represented a mid-altitude coffee area that required more suitable shade trees of coffee and organic fertilizers like compost (Figs 1 & 2).
Konga cluster
-
This area provided a frost-free climate averaging 13.7–25.3 °C year-round, moderate rainfall of roughly 1,500 mm, and abundant sunshine with 1.232 (22%) of the gathered dataset explaining the information regarding the Konga cluster. It was an upper mid-altitude coffee cluster with superior coffee quality. The soils in the Konga cluster were iron-rich and acidic. It included areas of Konga, Haru, Buno, Hafursa (Yirgachfe), and Worka Sakaro (Gedeb). The Kurume coffee cultivar was a landrace that bears small fruit cherries in this cluster.
Wotiko cluster
-
A predominantly non-coffee area with enset and cereal land mass. The NDVI and actual monthly evapotranspiration estimates were 0.67 and 26.3 mm, respectively marking the highest values among the study clusters (Table 6). About 0.952 (17%) of the data explained the information regarding the Wotiko cluster. It included some areas of Wotiko (Wonago), Halo hartume, and Gedeb Galicha (Gedeb), Layurasa (Raphe), and Moralayu (Chorso). Frost was prevalent in this cluster due to low temperatures (15.1–26.5 °C) year-round, and the area received moderate rainfall of roughly 1,302.3 mm. The microclimate has been simply too cold to sustain a coffee tree due to the usual cold weather and frost in the near past. However, due to ongoing climate change and increases in air temperature, coffee has already started climbing the high-altitude areas. Coffee landrace called Diga (locally cool highland area), which usually exhibits a vibrant smell during roasting was observed in this cluster. Improved coffee was recently introduced to this highland coffee cluster. However, coffee plants required suitable highland coffee varieties, pruning of old trees, and shade management.
Dumerso cluster
-
The area provided a frost-free climate averaging 14.3–25.3 °C year-round, moderate rainfall of roughly 1,468.9 mm, and abundant sunshine (Table 6). It encompasses mid to highland coffee clusters with formerly waterlogged or wetland areas that required drainage from farmlands and, reduction of Eucalyptus and sugarcane from coffee fields. It included some areas of Chalba and Dumerso (Yirgachefe), Chirbanta (Raphe), Harmufo (Gedeb), and Sokicha (Wonago). The remaining places (marked with red color in Fig. 3) were dominantly non-coffee production areas. The area represented a highland location dominated by enset, barley, wheat, fava beans, and field peas of Bule, Raphe, and Chorso (Figs 1 & 2). At the moment, the red-marked area was characterized by relatively high humidity and lower sunshine periods compared to other areas. These areas are too cold to handle coffee production at present.
Rainfall patterns across the study area
-
In this study, the rainfall of the Gedeo Zone was classified into seven classes (Fig. 4). The highest average rainfall value was 1,697.74 mm. However, the lowest average rainfall value was 1,313.9 mm. Major parts of the Tumata Chiracha cluster and, and Hama cluster have received relatively lower amounts of annual rainfall. However, the Konga cluster was known for receiving higher amounts of rainfall (Fig. 4). Thus, coffee production clusters at the northern and southern front of Gedeo received lower rainfall compared to those clusters located in the middle of the Gedeo Zone. The high rainfall was the reason for the highly acidic soil reaction observed in the Konga cluster.
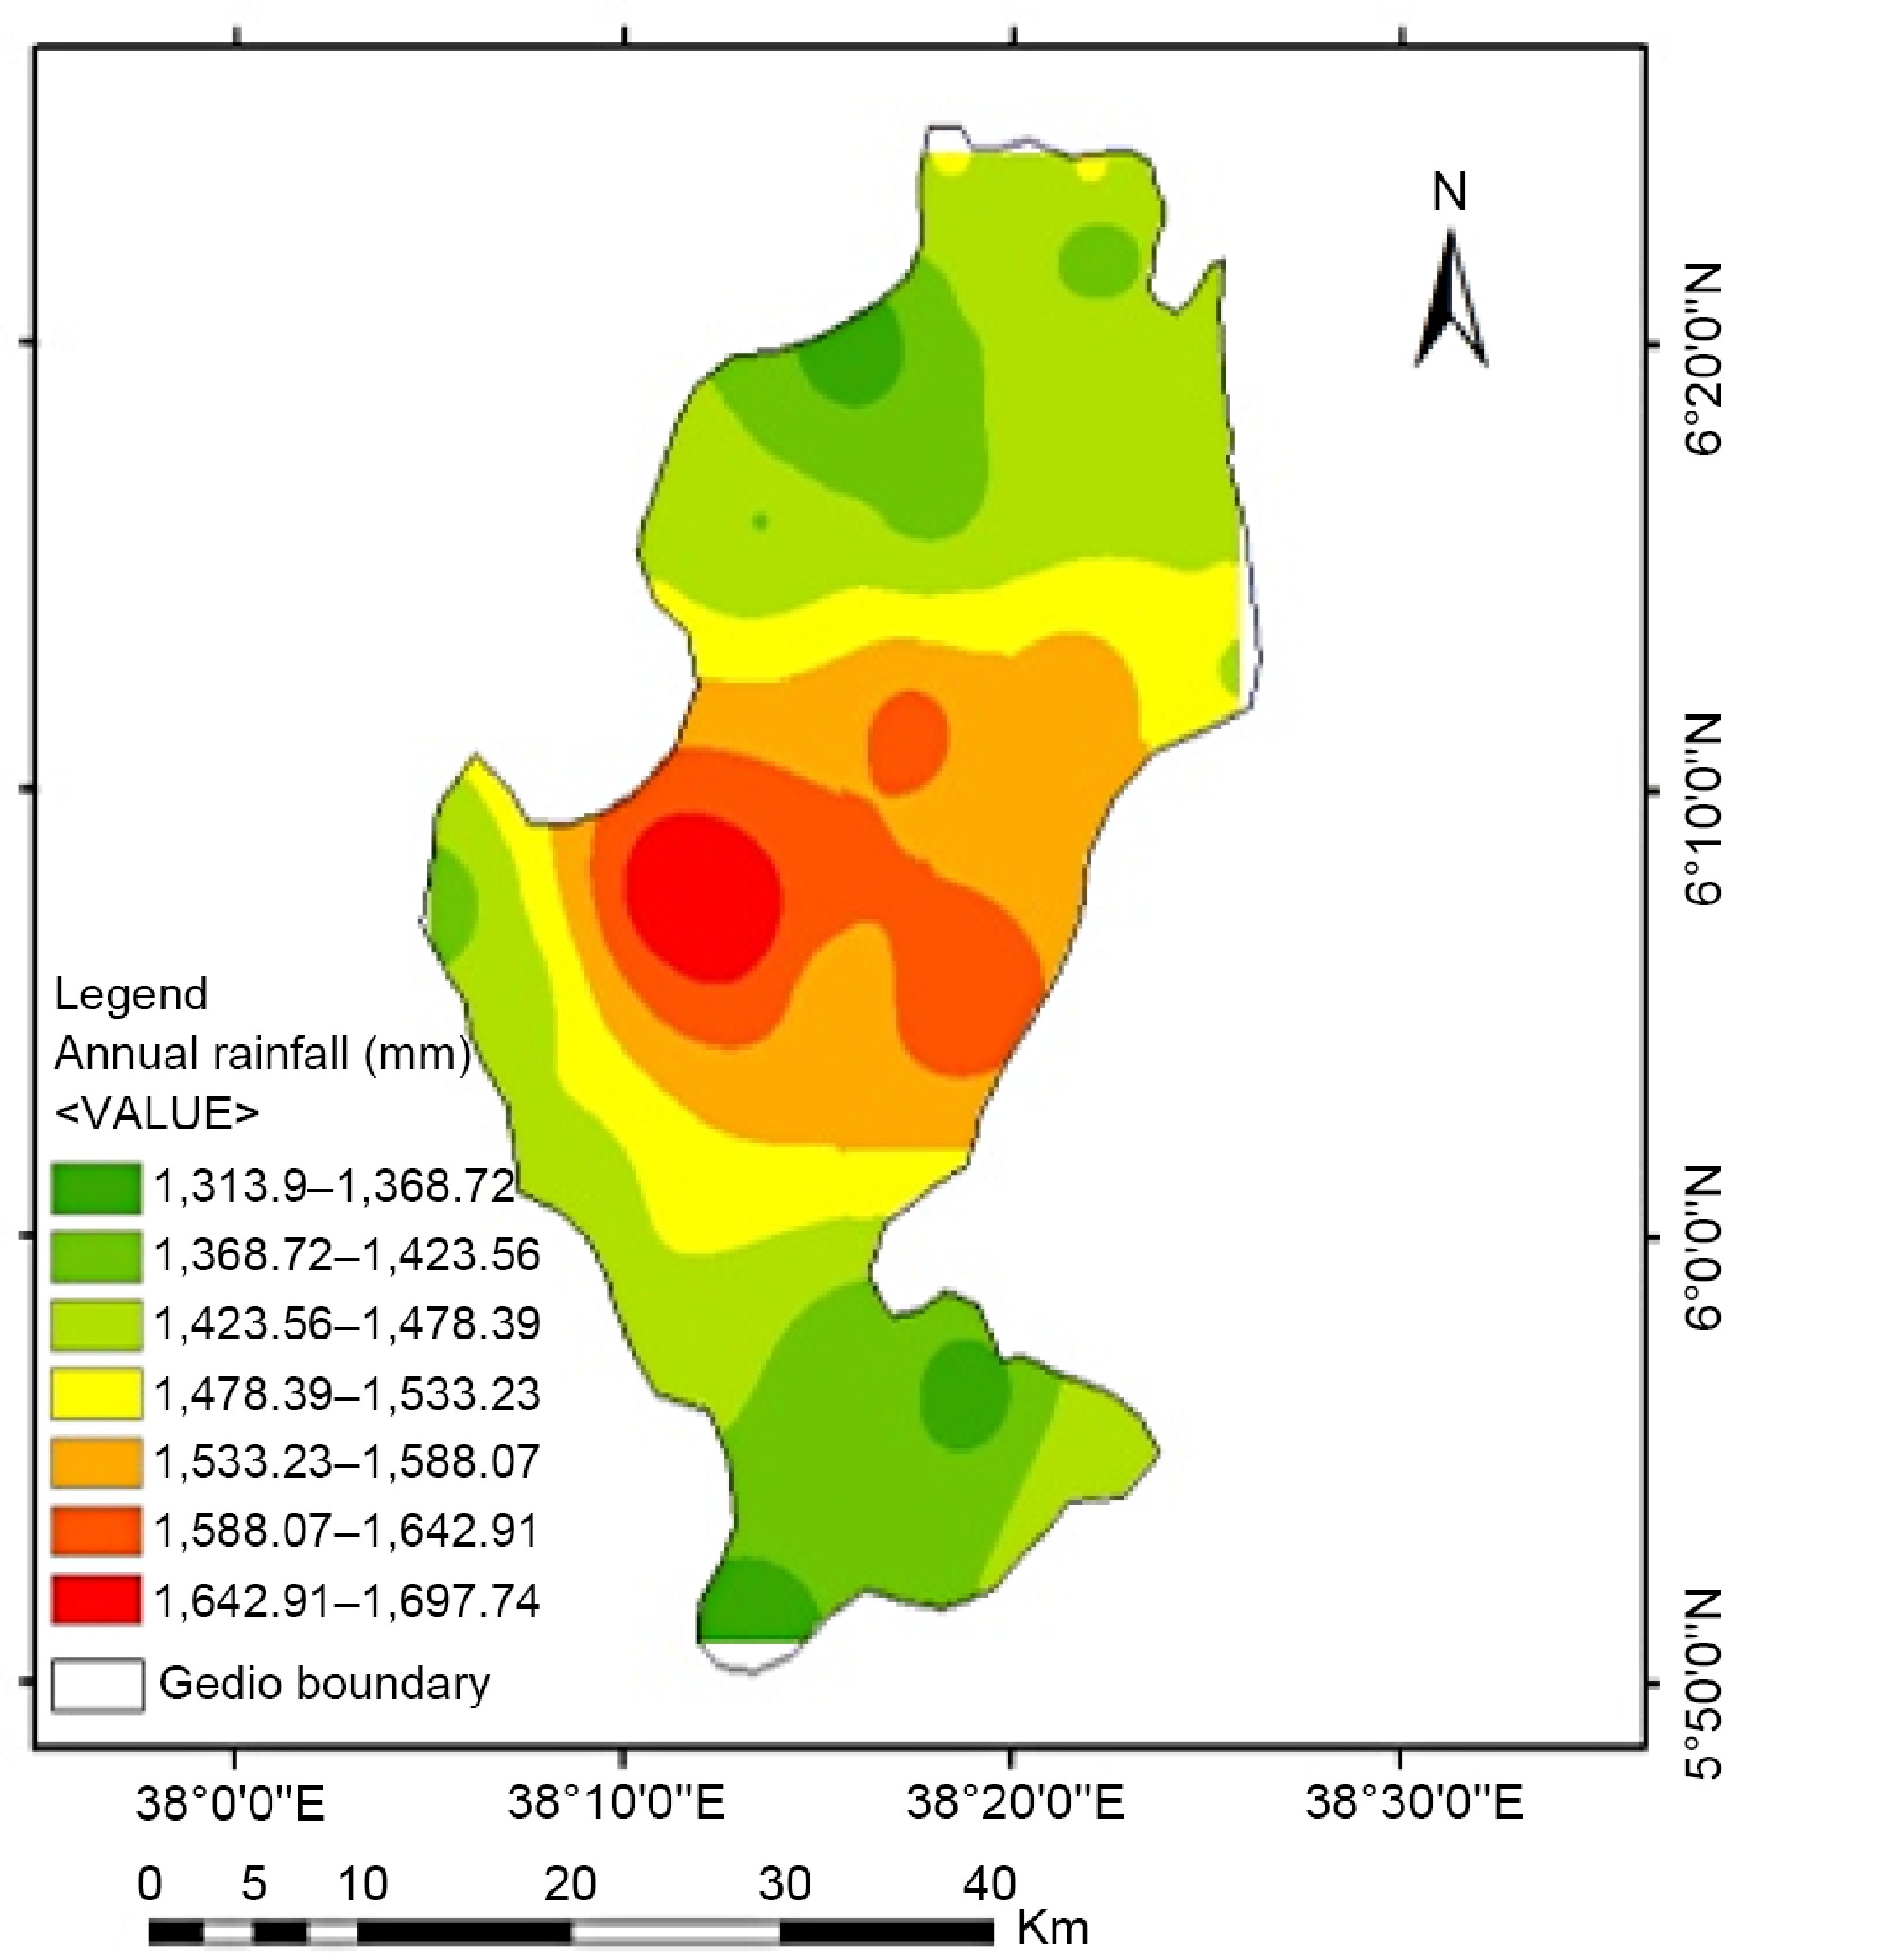
Figure 4.
Spatial distribution of total annual rainfall in the Gedeo Zone of southern Ethiopia.
Soil fertility evaluation
Soil acidity and Cation Exchange Capacity (CEC)
-
The pH was strongly and moderately acidic in the Wotiko (< 5.4) and Konga (5.4–6.4) clusters, respectively whereas the pH was neutral to alkaline (6–8) in Tumatachiracha, Hama, or Dumerso clusters (Table 7). Thus, the level of acidity in the Wotiko cluster requires necessary intervention while the Konga cluster also deserves due attention to manage at optimum levels. Hence, nutrient availability may be hindered in the Wotiko (< 20.0 mg/kg soil) and Konga (20.1–25.0 mg/kg soil) clusters because soil pH was not within the optimum range thereby necessitating liming together with other organic amendments that buffer soils. CEC was below minimum at Konga and Wotiko whereas optimum for high in other clusters. A low CEC shows a low capacity for the soils to hold cations (positively charged particles) was thus evident at the Konga and Wotiko clusters (Table 7). The observed low CEC in these clusters should be improved through the application of OM, which enhances CEC that would serve in retaining and increasing the reserve of soil cations, and improves soil structure physics and soil water relations.
Table 7. Means for the soil parameters from the five coffee clusters of Gedeo, southern Ethiopia.
Coffee clusters Total N (%) Rating Total C (%) Rating pH Rating Fe (mg/kg) Rating Tumata Chiracha 0.18−0.29 Low 1.77−3.91 Medium 6.00−7.00 Neutral 3.5−4.50 Deficient Hama > 0.40 High 3.93−5.7 Medium 7.10−7.70 Neutral < 3.50 Deficient Dumerso 0 < 0.18 Very low < 1.77 Low > 8.00 Strongly alkaline 4.6−7.40 Marginal Konga 0.30−0.35 Optimum 1.77−4.52 Medium 5.40−6.40 Moderate acidic 7.5−9.90 Marginal Wotiko 0.30−0.40 Optimum 5.17−5.26 Medium < 5.40 Strongly acidic > 10.0 Sufficient I Clusters P (mg/kg soil) Rating CEC (mg/kg soil) Rating Ca (mg/kg soil) Rating Mg (meq/100 g) Rating Tumata Chiracha 14.0−16.0 Low 25.10−30.0 Optimum 15.0−17.0 High 4.6−7.30 High Hama 12.0−14.0 Very low 30.10−35.0 Optimum 17.0−19.0 High > 7.40 Very high Dumerso 10.1−12.0 Very low > 35.0 High > 19.10 Very high 4.6−7.3 High Konga 8.0−10.0 Very low 20.10−25.0 Minimum 11.0−15.0 High 4.6−7.3 High Wotiko < 8.00 Very low < 20.00 Minimum < 11.0 Moderate < 4.50 Moderate Total nitrogen and carbon
-
Total nitrogen was related to plant nutrition in any cropping system. In Konga (1.77%–4.52%), Wotiko (5.17%–5.26%), and Hama (3.93%–5.7%) clusters, the total nitrogen ranged from optimal to high. This could be due to high total nitrogen fixation from the leguminous shade trees, weed residues, and litters of coffee leaves which could be decomposed and transformed into soils. Conversely, the total nitrogen content of soils in Dumerso (< 1.77%) and Tumata chiracha (1.77%–3.91%) was very low and low, respectively. Thus, it was necessary to increase the nitrogen content of the Tumata chircha and Dumerso clusters by adding various organic nitrogenous soil amendments and legumes (such as cow pea, labalab, Suspania spp., Lucenia spp., and others). While the soil carbon was low in the Dumerso cluster, it was rated medium in other clusters. The low level of organic carbon in the Dumerso cluster could be due to low applications of organic residues to the field. Such low levels indicated the reduced production capacity and response of the ecosystem to the environmental shocks[48], necessitating the introduction of carbon rich shade trees and soil management practices for its sustainability. The medium level of soil organic carbon observe in other clusters was lower than those reported by Kedir et al.[49] in coffee growing areas of the Goma district of Ethiopia, and could be attributed to the addition of coffee leaves, shade tree leaves, weed residues root growth and decay, and abundant burrowing fauna into the soils. Because total nitrogen stock and soil organic carbon were important markers of soil quality in tropical settings[50], which in turn affects the quality of coffee, the use the prescribed amount of organic fertilizer was mandatory if the soil's nutritional status was low to medium; if it was high, use of half the recommended amount has been recommended elsewhere.
One crucial measure of the health of the coffee ecosystem and soil productivity was the ratio of carbon to nitrogen which shows the balance between carbon and nitrogen in the soil, both of which were essential for crop growth and microbial health. To put it simply, the mass ratio of carbon to nitrogen in soil is known as the carbon-to-nitrogen ratio (C/N ratio or C:N ratio). At the Wotiko cluster, the C:N > 15 (Table 8), indicating the slow mineralization and release of N which could be due to a colder climate, clayish soils, and land management conditions. However, in other clusters, C:N ratio was < 15, showing rapid mineralization and release of N across all clusters. Because, the soil C/N ratio was below critical (< 10, which means 10 parts carbon for microbes to produce one part nitrogen) in the Hama and Dumerso clusters (Table 7), there was a need to choose shade trees, cover crops, and soil amendments that have high carbon and nitrogenous outputs to enhance the quality and productivity of coffee. The P:N ratio was as low as 22.9 (Wotiko), 27.6 (Konga), and Hama (32.3) but as high as 60.9 (Dumerso) and 64.6 (Tumatachiracha). Increases in the concentration of P relative to N led to a decrease in bean weight, bean length, bean length-to-width ratio, and bean length-to-thickness ratio. This meant increase in N relative to P enhanced the development of elongated coffee beans (beans with a higher shape index), whereas an increase in P relative to N favored the development of more rounded beans (beans had lower shape index). The current result agrees with the findings of Abebe et al.[51] who associated better bean size and quality with increases N:P ratio, Mg:Ca ratio, and N:C ratios.
Table 8. Nutrient ratios of P:N, C:N, and Mg:Ca in the coffee fields.
Clusters P:N C:N Rating Mg:Ca Range Mean Range Mean Range Mean Tumata Chiracha 55.20−77.80 64.60 9.8 0−13.80 11.80 Above critical 0.31−0.43 0.37 Hama 30.0−35.0 32.30 9.80−14.30 12.0 Above critical 0.39−0.44 0.41 Dumerso 56.10−66.70 60.90 9.80 9.80 Below critical 0.24−0.38 0.31 Konga 26.7−28.60 27.60 5.90−12.9 9.40 Below critical 0.42−0.49 0.45 Wotiko 20.0−26.70 22.90 13.20−17.20 15.20 Above critical 0.42 0.41 Phosphorus (P), calcium (Ca), and magnesium (Mg)
-
Crop productivity is directly related to P availability in farmlands. However, the phosphorus nutrition was alarming as it showed low or very low ratings (< 16 mg/kg soil) across the study clusters (Table 7). As soil test P usually estimates how much P was available in the soil for plant use, the current result confirmed deficiency of the nutrient for coffee production. Applying compost or manure could enhance soil fertility and productivity by adding nutrients including phosphorus and organic matter, which would also increase ground cover and reduce surface runoff. Calcium and magnesium content was rated moderate in Wotiko; however, high or very high in other clusters. This could be the greater the soil clay content that associates well with the higher calcium levels. The ratio of Mg:Ca at the Konga cluster was over 45 indicating why the bean size and quality of coffee was higher compared to other clusters. Thus, increasing the concentration of soil Ca relative to Ma, increases bean size, and vice versa, indicating the importance of interaction between Ca and Mg for bean size and quality (Table 8). The Mg:Ca ratio was about 41 at the Hama and Wotiko clusters but as low as 37 and 31 in the Tumata chiracha and Dumerso clusters, respectively (Table 8). This means an increase in Mg relative to Ca enhanced the development of elongated coffee beans (beans with a higher shape index). The bean size and quality arising from improved soil physico-chemical properties were in conformity with the quality of coffee reported by Mengistu[52] across the Konga cluster of Gedeo.
Micronutrients (Fe)
-
In the Dumerso and Konga clusters, iron was evaluated as marginal, but deficient or inadequate in the Tumata chiracha, and Hama clusters. Iron, however, was rated sufficient I value in the Wotiko cluster (Table 7). Based on this soil fertility assessment, it was necessary to ensure that coffee plants receive iron in the Dumerso, Konga, Tumata chiracha, and Hama clusters for coffee plants to obtain the right rate of plant nutrition. This was the reason why coffee growth and yield were significantly reduced and foliar deficiencies symptoms appear frequently. In the Tumata chiracha and Hama clusters, the application of nutrients would result in a sharp increase in growth. In Dumerso and Konga, where iron deficiency was in the marginal range, growth or yield was reduced, but the plants do not show deficiency symptoms, due to which plants frequently suffer hidden hunger. Farmyard manure, composts, and coffee husks could all enhance the physical and chemical characteristics of soil by raising its carbon content, supplying macro- and micro-nutrients, and boosting its P mobility or recovery rate through the reduction of irreversible adsorption complex formation required across the whole coffee growing environments.
Area of clusters
-
About 98,730.3 ha of land, which accounts for 73% of the area in Gedeo, has been used for coffee-based indigenous agroforestry production whereas only 27% (36,516.7 ha) of the area has been allocated for highland cereals and enset-based agroforestry. Such expansion could be elaborated due to long lasted tradition of indigenous coffee and the enset production culture of the dwellers. Among the coffee clusters, 22.7%, 20.3%, 16.0%, 9.0%, and 5.0% area have been observed across the Hama, Wotiko, Konga, Dumerso, and Tumata chiracha clusters, respectively (Table 9). The size of clusters could vary from year to year based on changes in land use, climate, and management scenarios across the coffee growing belt of the zone.
Table 9. The areal proportion of coffee and non-coffee clusters in the Gedeo Zone of southern Ethiopia.
Clusters Area (ha) Area (%) Tumata Chiracha 4,057.41 3.00 Dumerso 9,467.29 7.00 Konga 22,992.0 17.00 Wotiko 30,106.80 22.26 Hama 32,106.80 23.74 Non-coffee cluster 36,516.70 27.00 Total cover 135,247 100.00 Variability of principal components across clusters
-
The monthly actual evapotranspiration, NDVI and clay content were as high as 31.4 mm, 0.82 and 60%; respectively in the Tumata chiracha cluster (Table 10) whereas these variables were as low as 23.6 mm, 0.61, and 18% in the Wotiko and Dumerso clusters, respectively (Table 10). Thus, the superior greenness of the vegetation at Tumata chiracha had occurred due to silty clay textural class that had higher water holding capacity compared to the silty clay loam textural class of other clusters, resulting in the highest evapotranpirational water loss. This cluster should target soil moisture conservation strategies to sustainably supply moisture to transpiring plants. Conversely, the greenness of vegetation and evapotranspiration was the lowest in the Wotiko cluster, due to higher humidity and Dumerso due to water logging affecting coffee and associated plants. Thus, the reduction of plant density per unit area in Wotiko and drainage practices in clusters like Dumerso were crucial to enhancing coffee productivity.
Table 10. Cluster mean of coffee management practices recorded after farmers' interview (n = 54).
Variables Konga Tumata chiracha Dumerso Hama Wotiko Clay (%) 24.70−42.60 42.0−60.0 18.00−43.0 24.00−42.00 26.00−44.0 ETa (mm/month) 27.30−31.40 28.60−32.70 24.30−28.40 25.90−30.10 23.60−27.70 NDVI 0.66−0.75 0.73−0.82 0.65−0.73 0.65−0.73 0.61−0.70 Dominant crop Coffee Enset Enset Coffee Enset Previous land use Coffee Grassland Grassland Enset Enset Shade trees Cordia spp., Ficus spp., Milletia spp. Avocado,
Milletia spp.Cordia spp. Ficus spp. Avocado, Eucalyptus Erythrina spp. Croton spp. Cordia spp. Milltia spp. Milltia spp. Croton sp., Erythrina spp. Avocado Variety Improved, local Improved Improved Improved, local Improved, local Number of coffee plants under shade tree 3.90−6.20 2.90–5.20 2.40–4.70 1.90–4.20 1.00–3.20 Number of plants under coffee shade 10.90–15.60 8.90−13.60 2.90–7.60 6.90–10.60 2.80–7.60 Intercrops Enset, taro Enset, potato, Sweet potato, common bean, cassava Taro, enset, spices, sugarcane Enset, sugarcane Enset, cabbage, taro Wood ash (kg/plant) 2.90–5.40 3.90–6.40 1.10−3.40 1.00−3.30 1.20−3.50 Number of multistory 2.90−4.80 2.90–4.80 1.90–3.80 3.90–5.80 1.90–3.80 SWC (%) 58.9–67.10 38.90–47.10 48.90–57.10 48.90–57.20 48.90–57.10 Coffee yield (kg/plant) 0.81−1.23 0.43−0.73 0.71−1.11 0.56−0.84 0.64−0.92 Overall quality ratings* 5 3 4 4 4 * 5 = best, 4 = very good, 3 = good, 2 = poor, 1 = very poor. The numbers of coffee plants under a single shade tree were as high as 6.2 in some fields of the Konga cluster, but as low as unity in some fields of the Wotiko cluster. Planting shade trees (Albizia gummifera, Milletia ferruginea, and Erythrina abyssinica), and opening up the canopy was vital to increase coffee yield to economically feasible levels because of a number of ecological advantages related to soil maintenance and restoration[26]. However, the number of plants under coffee shade where as high as 15.6 in Konga, but as low as 2.9 and 2.8 in the Dumerso and Wotiko clusters, respectively. In total, the number of multistory was as high as 5.8 in the Hama cluster but multistory was as low as 1.9 in the Dumerso and Wotiko clusters. Although intercropping coffee with other tree crops was a means of intensification of the production system, diversifying farmers' sources of income and food security, the increased number of plants within coffee shade (eg. Enset (Ensete ventricosum), sweetpoato (Ipomia batatas), yam (Discoria spp.), taro (Colcusia spp.), common bean, maize, cabbage, ginger, turmeric, etc) were detrimental for coffee yield[26].
In the Hama, Wotiko, and Konga clusters, local coffee varieties like Wolisho, Kurume, and Diga were grown using shade from Milletia spp., Cordia africana, Ficus spp., Erythrina, spp., and Croton spp. in most occasions. Farmers responded that the productivity of improved coffee varieties was high but improved varieties were susceptible to diseases. However, some of the local coffee cultivars had medicinal uses and were resistant to disease but were low-yielders in these areas. Wolde et al.[26] also reported the adoption of improved varieties of Fiyate, Qoti, 744, 7,487, 74,112, 74,110, 74,140, and 74,165 that provided yields of about 2 t/ha. He also noted that farmers choose the coffee types of their preferences and often mix more than one landrace within one field for merits like yield, aroma, flavor, and resistance to diseases[26]. More research and technology transfer work was required to adopt existing lowland, midland, and highland coffee varieties, and generate new ones. According to our report, the coffee varieties were dominantly improved to date in Tumata chiracha and Dumerso. Because the Tumata chiracha cluster received the lowest amount of rainfall, it generally resulted in light-weight coffee beans, which calls for dwarf varieties that had a short growth periods and management options that maximize coffee yields. Conversely, the Konga cluster received the highest amount of rain resulting in well filled quality beans, which calls for hybrids of high-yielding potential for this cluster. The highland cluster of Wotiko would be optimized with highland coffee varieties tolerant to low temperatures, occasional frost, frequent cold, and fog. Thus, each cluster should have its own peculiar coffee varieties with specific characteristics and associated agronomic management in order to improve coffee production in the area.
Farmers of high-altitude clusters like Wotiko should reduce shade trees to minimize competition with coffee plants in obtaining nutrients, space, and to increase the intensity of light received by coffee plants, to increase coffee production, maintain the coffee plant density as well as shade density at an optimum level, followed by increasing management practices such as pruning, weeding, application of fertilizer, and pest and disease control. In the lower altitude clusters, like Tumata chiracha, farmers should increase shade density both with Leucaena and multipurpose plants such as mango, as well as increase management practices such as land conservation, pruning, weeding, application of organic fertilizer, and pest and disease control. In middle altitude clusters of Hama, farmers were required to reduce shade to reduce competition with coffee plants in obtaining nutrients, and space, and to increase the intensity of light received by coffee plants, to increase coffee production, maintain and improve management practices applied. Farmers were growing other multipurpose plants such as avocado (Persia americana), enset (Ensete ventricosum), taro (Colocosia esculenta), yam (Discoria alata), and banana (Musa spp.) between their coffee plant in midland clusters. The introduction of avocado, taro, sugar cane, and Eucalyptus spp. to farmlands should be reduced particularly from the Dumerso cluster. The reduction of sweet potato, cabbage, and avocado from the Hama and Tumata chiracha cluster was also important in enhancing coffee production.
-
Climatic, edaphic, biotic, and physiographic factors together with farmers' management decisions consistently affect coffee production scenarios and environments. To understand the Gedeo coffee production environments and design corrective measures, we carried out principal component and cluster analysis of the aforementioned variables. Results of multivariate analysis reduced 58 variables × 18 villages × 10 years to five clusters (Hama, Konga, Dumerso, Wotiko, and Tumata chiracha) explained by only 12 variables (cation exchange capacity, evapotranspiration, number of shade trees, total nitrogen, altitude, ash, organic matter, iron, soil water conservation practices, NDVI, coffee variety, and clay content of soils) with significant reduction in the dimensionality of dataset. The distance between the cluster of centroids was highest (894,814.6) between Tumata chiracha and Wotiko, and lowest (29,212.5) between Hama and Tumata chiracha. The two largest coffee clusters were Hama and Wotiko covering 22.7% and 20.3% of the study area, respectively.
The Konga, upper mid-altitude cluster manifested the highest magnitude for recorded rainfall, P:N ratio (27.6), Ca:Mg ratio (45) with optimum C:N ratio (10–15), but soils were iron-rich and had acidic pH. The cluster was associated with better bean size, quality, and productivity of coffee. The furthest enhancement of coffee production and quality in the Konga cluster would be realized through liming with Mg-bound materials, application of composts, and introduction of suitable varieties and leguminous shade trees to increase nitrogen availability. In the Hama cluster, the soil C:N ratio was below critical (< 10), and the phosphorus and iron content of soils in were deficient manifesting coffee plants suffering foliar deficiency symptoms or, at times, suffer hidden hunger. Corrective measures of coffee production in the Hama cluster might include proper use of shade trees, cover crops, and soil amendments (farmyard manure, composts, and coffee husks) that have a high carbon and nitrogenous outputs, could all enhance the physical and chemical characteristics of soil by raising its carbon content, supplying macro- and micro-nutrients. At Wotiko, a highland coffee cluster, the C:N > 15 due to slow mineralization and release of N arising from colder climate, P:N ratio was 22.9, and iron was rated sufficient I but the monthly actual evapotranspiration, NDVI, and clay content was 23.6 mm (lowest), 0.61, and 18%, respectively. Coffee production and quality at Wotiko might be improved through the introduction of cold and frost tolerant high land coffee varieties, management that allows maximum light capture along the multistory, liming with calcium-bound materials, and vermin-composting options that would enhance the carbon assimilation. At Dumerso, mid to highland coffee cluster with occasionally waterlogged fields, total nitrogen content was very low, C:N ratio was < 10 (below critical), P:N ratio was 60.9, Ca:Mg ratio was below 31, iron was marginal but the monthly actual evapotranspiration, NDVI, and clay content were 23.6 mm, 0.61, and 18%, respectively. The productivity and quality of coffee could be enhanced through the use of raised beds, the opening of drainage structures, the introduction of compatible shade trees and composting schemes, the reduction of Eucalyptus and sugarcane from coffee fields in the Dumerso cluster. At Tumata chiracha, the evapotranspiration was high while iron, total nitrogen, phosphorus and Mg:Ca ratios were low or deficient. Such constraints associated with soil and environmental traits have been hindering the elongation of coffee beans, which could be due to higher temperatures, greater soil erosion and rapid mineralization or release of N calling for introduction of lowland coffee varieties, compatible shade trees and soil moisture conservation strategies, and reduction of heavy feeder intercrops (avocado, sweet potato, and taro intercrops) between the coffee lines as adaptation strategies for climate change and ways of enhancing the quality and productivity of coffee.
The low phosphorus measured across all clusters depicts worrying signs of coffee nutrition but calls for campaigns of composting or manureing across the clusters. The acidic soils of Konga and Wotiko have rendered soils to low cation exchange capacity, which required composting, vermicomposting, and liming to enhance the adaptation of coffee plants to changing climate. Climate change adaptation in Dumerso and Tumata chiracha could be enhanced by improving the low total nitrogen content of these soils, which might be through cover cropping and reforestation with leguminous forage and trees, respectively. Thus, the study asserted that climate change adaptation would be possible if a different set of multistory management, intercrop selection, soil amendment optimization, and coffee variety selection strategies were adopted for each of the Gedeo coffee production clusters of southern Ethiopia.
The authors thank Dilla University for funding the study.
-
The authors confirm contributions to the paper as follows: conceptualization: Getahun T; reserach design: Mamo G, Markos D, Haile G; data collection: Getahun T, Markos D; draft writing: Getahun T; data analysis and review: Mamo G, Markos D, Haile G, Tesfaye G. All authors reviewed the results and approved the final version of the manuscript.
-
The datasets generated during and/or analyzed during the current study are available from the corresponding author on reasonable request.
-
The authors declare that they have no conflict of interest.
- Copyright: © 2025 by the author(s). Published by Maximum Academic Press, Fayetteville, GA. This article is an open access article distributed under Creative Commons Attribution License (CC BY 4.0), visit https://creativecommons.org/licenses/by/4.0/.
-
About this article
Cite this article
Getahun T, Mamo G, Markos D, Haile G, Tesfaye G. 2025. Principal component and cluster analysis of coffee production environments in the Gedeo Zone of southern Ethiopia. Beverage Plant Research 5: e028 doi: 10.48130/bpr-0025-0015 

Principal component and cluster analysis of coffee production environments in the Gedeo Zone of southern Ethiopia
- Received: 25 December 2024
- Revised: 02 March 2025
- Accepted: 01 April 2025
- Published online: 23 September 2025
Abstract: Despite the importance of coffee, there is a lack of comprehensive analysis to understand the key factors influencing coffee production across the Gedeo Zone of southern Ethiopia. We used principal component and cluster analysis approaches to minimize the dimensionality of the data gathered from the study area's topography, climate, soil analysis, farmers' interviews, and geographic information systems. Data from coffee farm records spanning ten years (2013−2022) were collected from 18 rural kebeles in the area. The first 12 principal components explained 95.4% of the total variation. The cation exchange capacity of soils contributed 22.5% of the variation in the first principal component, while evapotranspiration and shade trees explained 16.1% and 11.9%, respectively of variability in coffee productivity. Total nitrogen, altitude, and ash explained 10.5%, 8.1%, and 5.8% of variability whereas organic carbon, iron, soil water conservation, Normalized Difference Vegetation Index, variety, and clay explained 5.0%, 4.0%, 3.3%, 3.2%, 2.9%, and 2.1%, respectively. The 18 kebeles were reduced to five clusters (Tumata chiracha, Hama, Dumerso, Konga, and Wotiko), which differed for all characteristics (p < 0.001), and Konga and Wotiko clusters concentrated 39.0% (2.184) of the information with higher productivity of coffee. Similarly, the 58 variables were reduced to cation exchange capacity, clay content of soils, total nitrogen, evapotranspiration, shade trees, altitude, ash, organic carbon, iron, soil water conservation, NDVI, and variety, which were considered the most representative traits explaining the variability of the data set. Thus, farmers, agricultural planners, and policymakers shall embark on a different set of planning schemes, varietal choices, and management practices that maximize the quality and yield of coffee for each cluster.
-
Key words:
- Cation exchange capacity /
- Cluster /
- Coffee /
- Evapotranspiration /
- Total nitrogen