


-
Exploring the link between farm size and agricultural productivity has long been pivotal in agricultural economics, fostering rich discussions and diverse empirical studies. Understanding this relationship is crucial for formulating policies aimed at enhancing agricultural efficiency, reducing rural poverty, and ensuring food security. A key hypothesis in this discourse is the inverse relationship between farm size and productivity, known as the IR hypothesis, which posits that smaller farms achieve higher productivity per unit of area compared with larger holdings. This hypothesis was first observed in Russian agriculture by Chayanov[1] and gained prominence with Amartya Sen's seminal work, "An Aspect of Indian Agriculture"[2], which provided empirical evidence supporting the IR hypothesis in the Indian context. Sen's analysis demonstrated that productivity per acre decreases as farm size increases, primarily due to the intensive use of family labor on smaller farms. This observation reinforced the argument for land reforms aimed at redistributing land to smallholders to enhance agricultural productivity. Following Sen's work, numerous studies in developing countries, including India, confirmed the inverse relationship, attributing it to factors such as land quality differences, market imperfections in labor and capital, and the management efficiency of smallholders[3−6]. However, the generality of the IR hypothesis has been questioned due to contradictory findings in different agro-economic contexts.
Recent research has further examined the farm size-productivity (IR) hypothesis using advanced econometric tools and techniques and more comprehensive datasets. In a cross-country study, Savastano & Scandizzo[7] analyzed farm-level data from Sub-Saharan Africa and found a nonlinear, U-shaped relationship, indicating that productivity initially decreases with farm size but increases beyond a certain threshold. Similarly, Muyanga & Jayne[8] revisited the IR hypothesis in Kenya and discovered that the relationship holds only for farms smaller than three hectares, becoming positive for larger farms up to 70 hectares. This nuanced finding underscores the importance of considering farms' heterogeneity and contextual factors. In Asia, Sheng et al.[9] studied maize production in China and reported that the inverse relationship persists only among smallholders, whereas larger farms continuously benefited through economies of scale. Similarly, Gautam & Ahmed[10] found that the IR effect in Bangladesh has weakened over longer period due to technological advancements and improved market access. Studies have suggested that while the IR hypothesis remains relevant in specific contexts, technological progress, market integration, and institutional reforms can alter the farm size-productivity dynamics. Research in India has also revealed contrasting findings. Chattopadhyay & Sengupta[11] highlighted persistent productivity advantages for smallholders despite technological diffusion. However, recent works by Chand et al.[12], and Bhalla & Alagh[13] found that large farms in some regions now exhibit higher productivity due to mechanization, irrigation facilities, and better market linkages. Measurement precision plays a pivotal role. When yields are estimated using objective crop-cut methods instead of self-reports, the inverse relationship weakens or disappears as a result of reporting biases on small and large plots[14]. Labor valuation is equally critical, as small farms often undervalue family labor. When this is corrected using market wage rates, total factor productivity (TFP) rises with farm size, reversing the earlier conclusions of smallholders' efficiency[15]. Education also conditions productivity outcomes. In Odisha, India, educated farmers adopting modern paddy varieties achieved significantly higher yields, validating Schultz's hypothesis on human capital and innovation[16]. Furthermore, evidence from Brazil shows that with technological modernization, the relationship between farm size and TFP has become U-shaped or even positive, indicating a shift in productivity dynamics[17]. Rising labor costs in Asia are diminishing the efficiency of small farms, suggesting that without land consolidation, future competitiveness may decline[18]. Larger farms in Ethiopia show superior productivity in nutrient-rich crops like vegetables and dairy as a result of higher input intensity[19]. Land degradation has both direct and indirect effects on agricultural productivity[20]. Technological integration also matters: Internet use enhances land productivity by expanding mechanization and improving decision-making[21]. In South Asia, demographic pressures and land fragmentation are linked to declining productivity, necessitating innovation-led sustainable farming policies[22]. These insights, along with emerging evidence from India, suggest that the farm size-productivity relationship is not uniform and is heavily influenced by context-specific factors such as the adoption of technology, education, labor dynamics, and data quality. This evidence challenges the traditional view and calls for a more context-specific analysis.
The changing dynamics of agricultural production have prompted further investigations. Gollin & Rogerson[23] explored how farm consolidation and structural changes in agriculture influence productivity, suggesting that economies of scale may offset the traditional advantages of smallholder farming. Jayne et al.[24] emphasized that policy-driven investments in rural infrastructure, credit access, and land reforms can reshape the farm size-productivity relationship, making it more favorable for larger farms in specific settings. Despite extensive literature on the farm size-productivity debate, significant gaps remain. First, most studies focus on aggregate-level analyses, overlooking intra-regional and zone-specific dynamics. Second, limited research exists on farm size-productivity relationships in states with contrasting agricultural structures, such as West Bengal and Punjab. West Bengal has a high concentration of marginal farmers, wherea Punjab is dominated by large-scale commercial farming. Examining these contrasting contexts can lead to a deeper understanding ofhow farm size and productivity interact under different socioeconomic and agro-climatic conditions. Additionally, methodological challenges persist in accurately capturing farm productivity because of data limitations and model specification issues. The use of linear and log-linear models has been common, but newer econometric approaches such as stochastic frontier analysis, quantile regressions, and spatial econometrics could yield more robust estimates. Moreover, few studies have examined how evolving agricultural technologies, land tenure systems, and policy reforms affect the IR hypothesis.
The average size of operational holdings in India has declined from 2.28 ha in 1970−1971 to 1.84 ha in 1980−1981, to 1.41 ha in 1995−1996, and to 1.08 ha in 2015−2016 (Agricultural Census, 2016)[25] has intensified longstanding challenges related to scale inefficiencies, limited mechanization potential, and unequal access to institutional support[26−28]. These problems are particularly acute for marginal and smallholders, who face high input costs, poor market connectivity, and credit constraints[29,30]. At the same time, large-scale farming systems, such as those in Punjab, are increasingly characterized by input saturation, declining marginal returns, and resource degradation[27,28,31]. These structural tensions underscore the policy imperative to understand how farm size influences productivity under different agro-economic conditions. Despite extensive research on this topic, there remains a critical gap in zone-level empirical analysis that captures intra-state variability in productivity outcomes across farm sizes. This paper aims to revisit the farm size-productivity relationship in two distinct agricultural states of India, namely West Bengal and Punjab. Using plot-level summary data from the Cost of Cultivation (CoC) Scheme (2016−2017)[32], supplied by the Directorate of Economics and Statistics, Ministry of Agriculture, we investigate whether the inverse relationship holds across different agro-climatic zones. Specifically, we examine paddy cultivation in West Bengal, where smallholder dominance is evident, and wheat cultivation in Punjab, characterized by large-scale commercial farming. Both linear and log-linear models are employed to estimate the farm size-productivity relationship. This proposed study will add and significantly contribute to the literature through providing a zone-wise comparison and exploring how farm size influences productivity in contrasting agricultural economies, shedding light on the evolving dynamics of Indian agriculture.
-
The selection of West Bengal and Punjab of India was based on their distinctly different agrarian structures, offering a robust analytical framework to examine the farm size-productivity relationship. West Bengal is dominated by marginal and smallholder farms, with 83% of farmers operating holdings smaller than one hectare, as reported by the Agricultural Census (2015−2016)[25]. In contrast, Punjab has only 14% marginal farmers, with a significant proportion of operational holdings exceeding 10 ha, reflecting a large-scale commercial farming system. These contrasting characteristics provide the scientific basis for estimating whether the inverse farm size-productivity relationship holds uniformly or is context-specific. West Bengal's agricultural system is characterized by fragmented landholdings, labor-intensive practices, and traditional cropping systems, particularly paddy cultivation. The state's agro-climatic zones, such as the Terai, New Alluvial, and Coastal Saline regions, differ considerably in terms of soil fertility, water availability, and cropping intensity, creating a natural experiment for examining the persistence of the inverse relationship[3,5]. The reliance on family labor and limited mechanization have historically supported the inverse relationship due to the intensive use of inputs on smaller plots. Conversely, Punjab represents a highly mechanized, market-driven agricultural economy, specializing in wheat production supported by an extensive irrigation infrastructure and the adoption of advanced technology. Large farm sizes in Punjab capture advantages from economies of scale, better access to credit, and superior market linkages, which are factors frequently associated with highly positive productivity outcomes[6,12]. These structural advantages challenge the traditional assumptions of the inverse relationship, making Punjab an ideal comparative case. This state-wise comparative approach addresses existing research gaps through looking at more than the average national level, which often masks significant intra-state heterogeneities. By employing a zone-specific analysis backed by empirical evidence and data, this study aims to provide a nuanced understanding regarding farm size-productivity dynamics in two contrasting agricultural economies[7,8].
Data source
-
The study is based on data sourced from the Cost of Cultivation Scheme for the year 2016−2017, as reported by the Directorate of Economics and Statistics, Department of Agriculture, Cooperation and Farmers Welfare, Ministry of Agriculture and Farmers' Welfare, Government of India. The Directorate of Economics and Statistics is responsible for conducting farm-level surveys, which are integral to understanding agricultural economics. The survey design employed a three-stage stratified random sampling methodology, where the unit of the primary stage was the tehsil or taluka, followed by clusters of villages in the second stage, and operational landholdings in the third stage. The dataset provides zone-wise classifications of agricultural regions for both West Bengal and Punjab, as summarized in Tables 1 and 2.
Table 1. Agro-climatic zone descriptions for west Bengal.
Zone Description Zone II (Terai Zone) Jalpaiguri, Coochbehar, Uttar–Dinajpur Zone III (New Alluvial Zone) Malda, Murshidabad, Nadia, North 24 Parganas, Howrah Zone IV (Old Alluvial Zone) Murshidabad, Burdwan, Hoogly, West Midnapore, East Midnapore Zone V
(Red and Laterite Zone)Birbhum, Burdwan, Bankura, Purulia, West Midnapore Zone VI
(Coastal Saline Zone)North 24 Parganas, South 24 Parganas, East Midnapore Source: Directorate of Economics and Statistics, Department of Agriculture, Cooperation and Farmers Welfare, Ministry of Agriculture and Farmers' Welfare, Government of India[32]. Table 2. Zone-wise description of Punjab, West Bengal.
Zone Description Zone I Gurdaspur, SBS Nagar, Rupnagar, Patiala, Fatehgarh Sahib, Amritsar, Tarn Taran, Hoshiarpur, and Ferozepur Zone II Moga, Ludhiana, Sangrur, Jalandhar, and Kapurthala Zone III Sangrur, Mansa, Bhatinda, Sri Muktsar Sahib, and Fazika Source: Directorate of Economics and Statistics, Department of Agriculture, Cooperation and Farmers Welfare, Ministry of Agriculture and Farmers' Welfare, Government of India[32]. The objective of this study was to examine the farm size-productivity relationship, focusing on paddy cultivation in West Bengal and wheat cultivation in Punjab.
Analytical tools
-
The study concentrated on econometric techniques, specifically linear and log-linear models, to investigate the farm size-productivity relationship in West Bengal and Punjab. These models were chosen to capture both absolute and relative variations in productivity based on critical explanatory variables, providing a thorough and reliable analytical framework.
Linear model
-
The linear model evaluates the direct relationship between farm productivity, measured in quintals per hectare, and multiple explanatory variables. The model is formally specified as:
$ {Y}_{i}={\beta }_{0}+{\beta }_{1}{X}_{1i}+{\beta }_{2}{X}_{2i}+\dots +{\beta }_{k}{X}_{ki}+{\varepsilon}_{i} $ (1) where, Yi is productivity (quintals per hectare) for the i-th observation; X1i, X2i, …, Xki are the explanatory variables, including farm size (ha), family labor (h), casual labor (h), seed input (kg), fertilizer input (kg), bullock and machinery usage (h), imputed rent of land (rupees), etc.; β0 is the intercept term; and β1, β2, …, βk are the coefficients representing the marginal effects of explanatory variables. The error term (
$\varepsilon $ Log-linear model
-
The log-linear model assesses elasticity by relating the natural logarithm of productivity to the natural logarithms of the explanatory variables. This specification is particularly effective in capturing proportional changes and is expressed as:
$ ln{Y}_{i}={\alpha }_{0}+{\alpha }_{1}{\mathrm{l}\mathrm{n}(X}_{1i})+{\alpha }_{2}{\mathrm{l}\mathrm{n}(X}_{2i})+\dots +{\alpha }_{k}\mathrm{l}\mathrm{n}\left({X}_{ki}\right)+{v}_{i} … $ (2) where, ln(Yi) is the natural logarithm of productivity for the i-th observation; ln(X1i), ln(X2i),… ln(Xki) are the natural logarithms of explanatory variables; α0 is the intercept term; α1, α2,… αk are the elasticities of productivity with respect to the explanatory variables; and νi is the error term, assumed to follow a normal distribution.
Residual diagnostics
-
Residual diagnostics were conducted using kernel density estimation (Fig. 1) to ensure the robustness and reliability of the econometric models. This nonparametric technique evaluates the probability density function of the residuals, enabling the assessment of normality assumptions. The kernel density plots demonstrated that the residuals for both the paddy and wheat datasets were roughly normally distributed, confirming the primary assumptions required for the models.
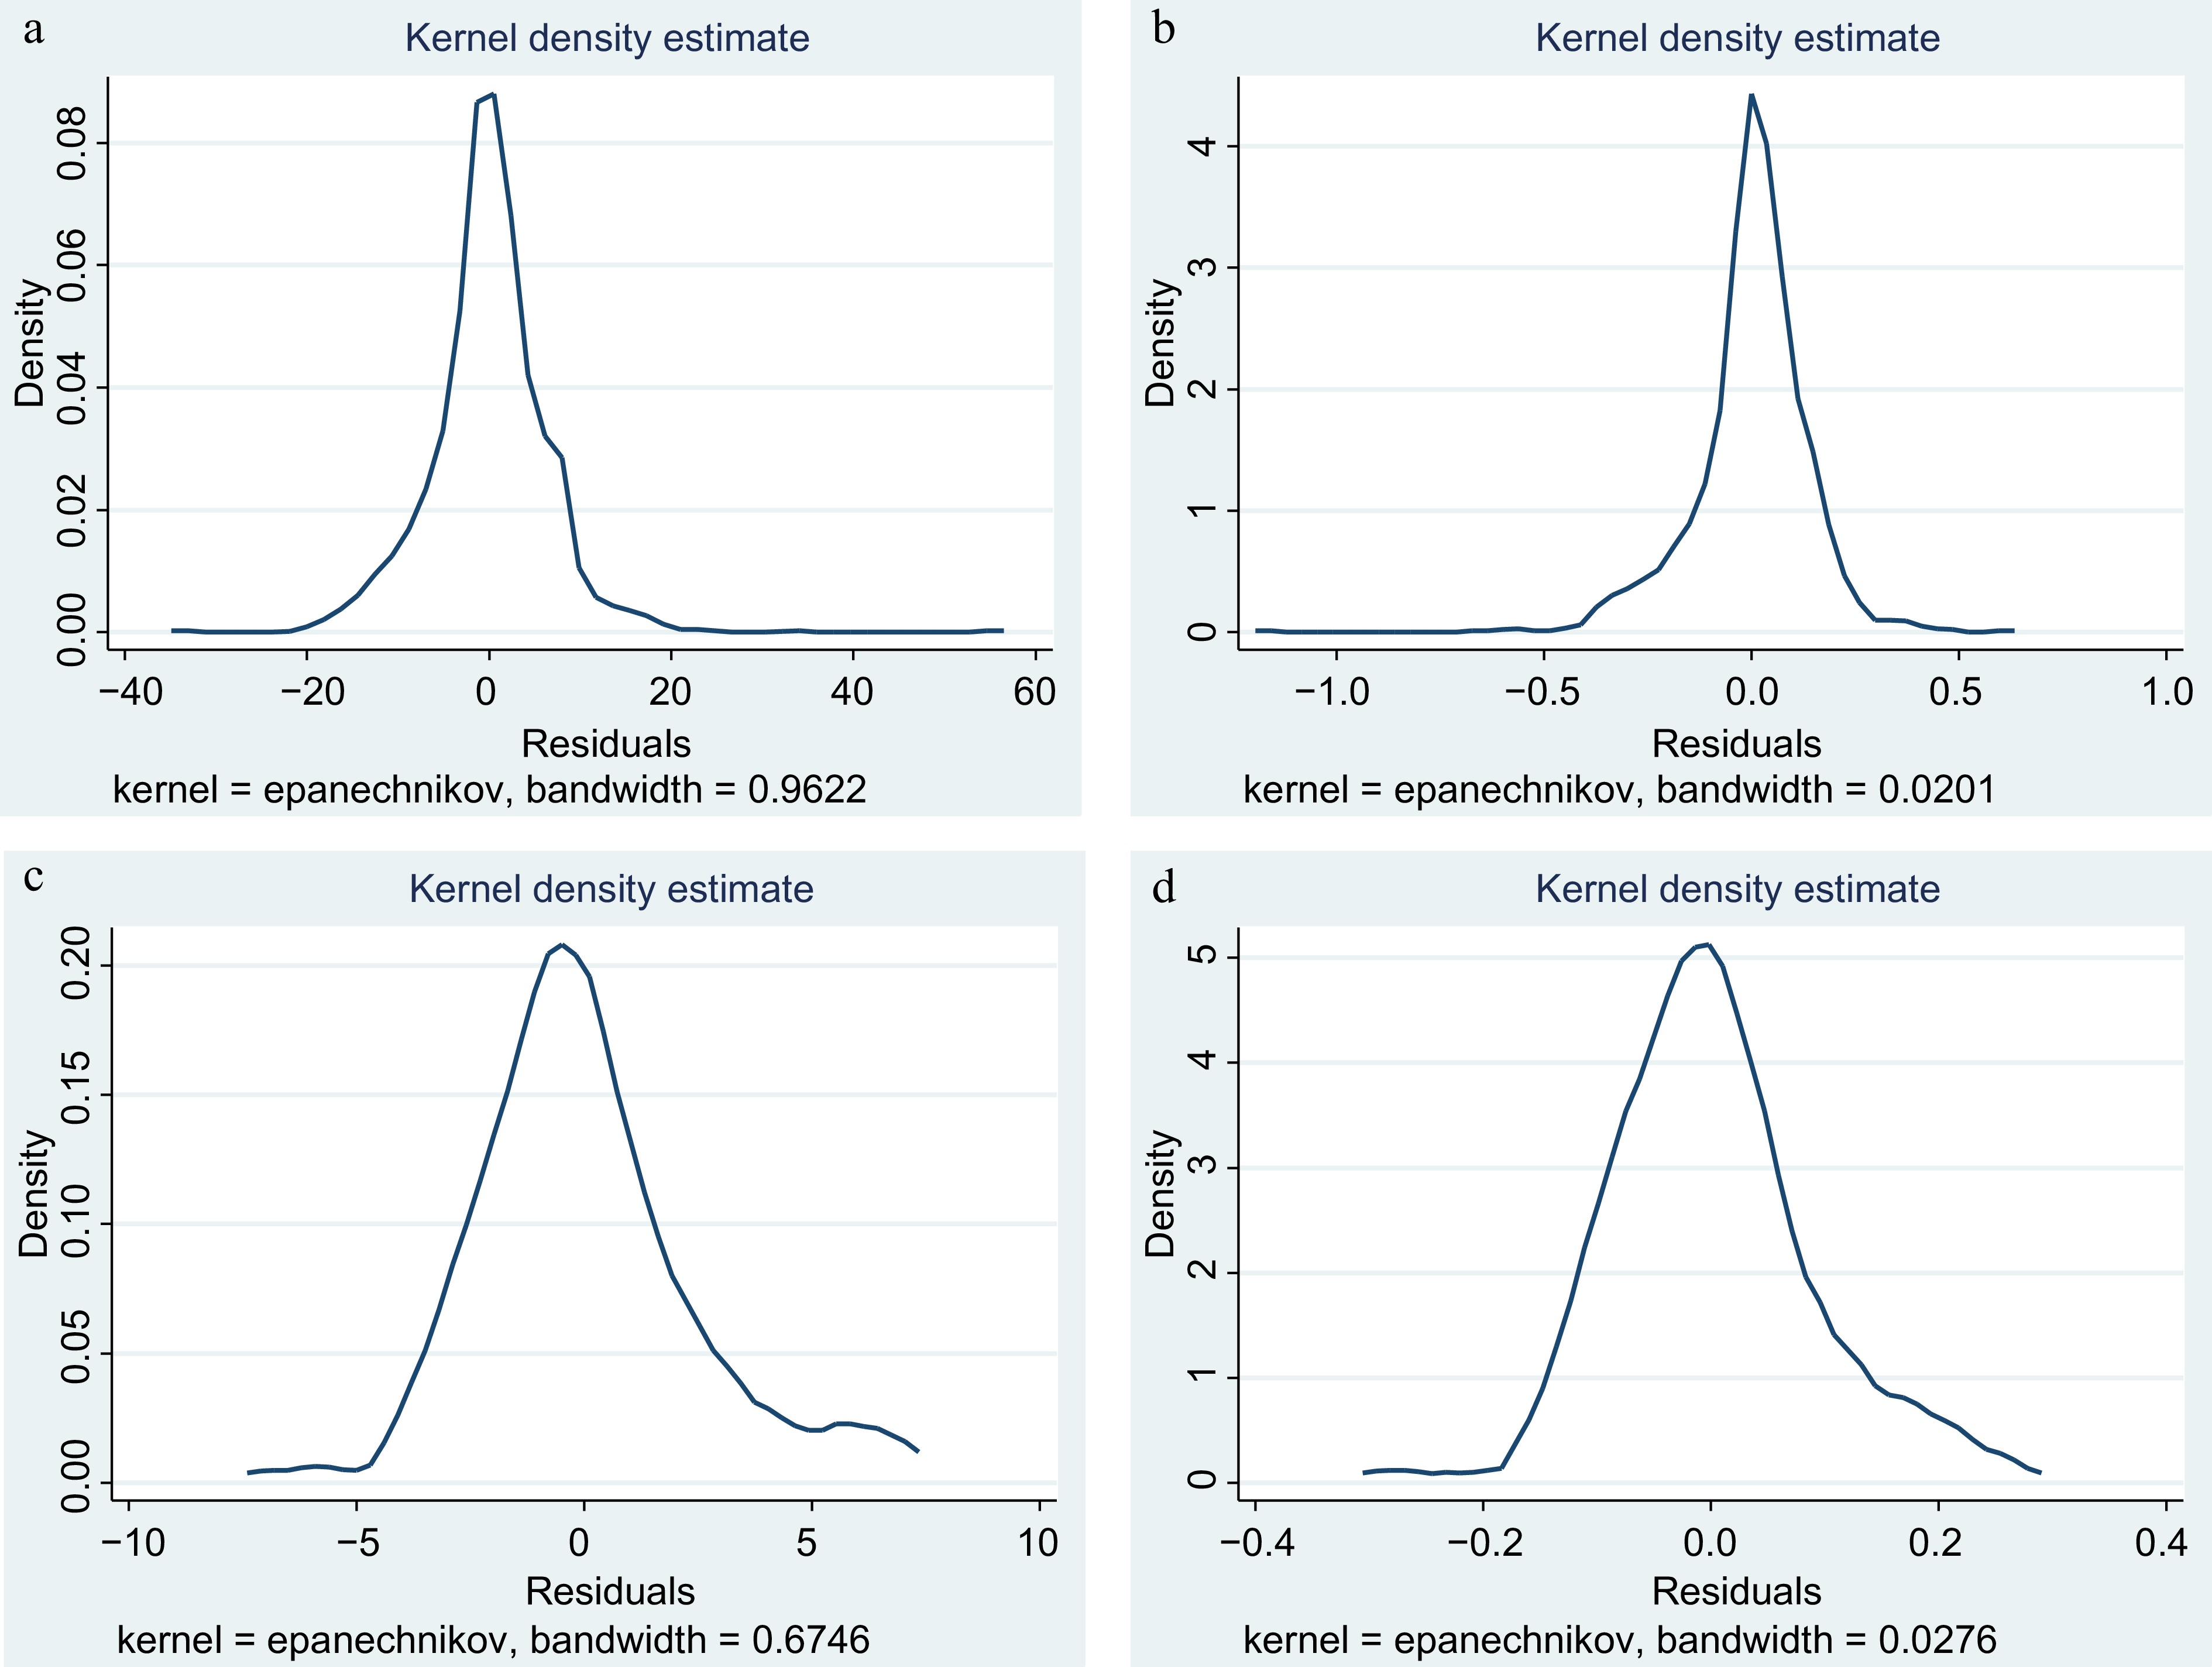
Figure 1.
Residual diagnostic using kernel density estimation.
Model selection and validation
-
The choice of linear and log-linear models was guided by their methodological compatibility with the structure of cross-sectional agricultural data and their established use in productivity studies. The linear model facilitates the interpretation of the absolute relationships between inputs and productivity, whereas the log-linear model captures relative variation across heterogeneous farm sizes using log-transformed variables[33,34]. These models are widely accepted for their analytical clarity, computational efficiency, and alignment with production theory[35]. The residual diagnostics confirmed that residuals were normally distributed, validating the models' assumptions. While these models may not capture complex nonlinear interactions, zone-wise estimations were applied to address spatial and structural heterogeneity. The coefficient of determination (R2) was used to evaluate the explanatory power of the models, indicating the proportion of variance in productivity accounted for by the independent variables. Comparative analysis of the R2 values across models determined the optimal specification for each agro-climatic zone. To account for potential heteroscedasticity and ensure reliable parameter estimates, robust standard errors were utilized in the analysis. By integrating these advanced econometric methodologies, the study delivers a granular and rigorous understanding of the size-productivity nexus, providing insights into zone-specific dynamics and its implications for agricultural policy and practices.
-
The analysis of the farm size-productivity relationship across West Bengal and Punjab highlights the complexities of agricultural systems in these states. The results, based on linear and log-linear models, provide robust insights into the role of farm size in shaping productivity outcomes across different agro-climatic zones. This section provides a comprehensive interpretation of the results, aligning them with empirical data and the existing literature.
Results for West Bengal: Paddy cultivation
-
West Bengal, with its dominance of small and marginal farmers, serves as a critical context for examining the inverse farm size-productivity relationship. Across all agro-climatic zones, a significant negative relationship is evident, which underscores the structural and operational characteristics of paddy cultivation in the region.
Zone II (Terai Zone)
-
The findings from the Terai Zone (Table 3) provide strong empirical confirmation of the inverse productivity relationship (IPR) that has been widely theorized since Sen[2] and extensively documented in South Asian agriculture[36]. Smaller farms exhibit higher productivity, as reflected by the significant negative coefficients in both the linear (β = −0.35, p < 0.05) and log-linear models (β = −0.02, p < 0.01), aligning closely with recent studies in similar intensive rice-based systems. For instance, a meta-analysis by Sahoo & Mishra[37] across Eastern India concluded that the IPR is most pronounced in high-potential regions like the Terai Zone, where superior infrastructure and market access allow smallholders to intensify their production more effectively than larger, often more fragmented, operations. This can be attributed to the intensive use of family labor and greater efficiency in resource allocation by smallholders. The high R2 values (0.90 for the linear model and 0.86 for the log-linear model) indicate that the models explain a significant proportion of the variability in productivity. This highlights the robustness of the findings and indicates that smaller farms are more efficient in optimizing output per unit of land.
Table 3. Farm size-productivity relationship in the Terai Zone (II) of West Bengal (paddy).
Particulars Linear model Log-linear model Coefficient Standard error p-value Coefficient Standard error p-value Constant 3.31 0.4 0.00 0.82 0.02 0.00 Farm size −0.35 0.14 0.02 −0.02 0.01 0.00 Family labor 2.00E-03 2.00E-03 0.34 −1.30E-04 0.00 0.15 Casual labor 9.00E-04 1.00E-03 0.54 −0.00 0.00 0.36 Seed 0.03 0.02 0.28 −1.50E-04 9.60E-04 0.87 Fertilizer 4.00E-03 0.01 0.59 7.00E-04 3.00E-04 0.01 Bullock and machinery 1.50E-03 0.01 0.84 −2.00E-04 3.00E-04 0.35 Imputed rent of land 1.80E-03 0.00 0.00 5.00E-05 3.50E-06 0.00 R2 0.9 0.86 Zone III (New Alluvial Zone)
-
In Zone III, smaller farms maintain higher productivity levels due to their efficient management of resources (Table 4). The coefficients for farm size (β = −0.12 in the linear model and β = −0.005 in the log-linear model) are both negative and significant, emphasizing the inverse relationship. The R2 values of 0.80 and 0.81 for the linear and log-linear models, respectively, indicate that the models are robust in explaining the variation in productivity. The inverse relationship may be driven by factors such as high cropping intensity, effective utilization of inputs, and reliance on family labor. The persistence of the inverse relationship in the fertile New Alluvial Zone underscores that superior soil quality does not diminish the efficiency advantages of smallholder production. These finding challenges notions that the IPR is solely a feature of marginal environments. Our results corroborate the work of Kumar et al.[38], who found that in the Indo-Gangetic Plains, smaller farms achieved significantly higher technical efficiency in rice cultivation through more meticulous management and lower labor supervision costs.
Table 4. Farm size-productivity relationship in the New Alluvial Zone (III) of West Bengal (paddy).
Particulars Linear model Log-linear model Coefficient Standard error p-value Coefficient Standard error p-value Constant 4.64 0.33 0.00 0.81 0.01 2.00E-04 Farm size −0.12 0.05 0.01 −4.93E-03 1.65E-03 5.00E-04 Family labor 3.00E-03 1.02E-03 8.25E-04 0.01 3.00E-04 0.02 Casual labor 1.00E-03 1.11E-03 0.37 4.00E-04 3.00E-03 0.27 Seed 0.05 0.02 1.95E-03 2.45E-03 6.21E-04 0.00 Fertilizer 0.03 4.15E-03 4.00E-04 1.08E-03 1.41E-04 0.00 Bullock and machinery −0.01 0.01 0.40 −2.20E-04 3.16E-04 0.49 Imputed rent of land 1.00E-03 2.00E-04 0.00 3.00E-04 2.00E-04 1.00E-04 R2 0.8 0.81 Zone IV (Old Alluvial Zone)
-
Zone IV exhibits a pronounced inverse relationship, with higher productivity observed in smaller farms. The farm size coefficient (β = −0.70 for the linear model) indicates a negative relationship, highlighting that larger farms tend to exhibit lower productivity (Table 5). These findings are consistent with the observed patterns in West Bengal, underscoring the critical role of smallholder efficiency in agricultural productivity. The pronounced inverse relationship in Zone IV includes highly productive districts like Burdwan and Hooghly, which is particularly significant. This zone is the heart of West Bengal's rice bowl, and the results indicate that the IPR is not a peripheral phenomenon but is central to the state's agricultural economy. This intense negative relationship suggests that larger farms in this region may be suffering from significant diseconomies of scale, potentially related to management constraints and tenancy issues. Our findings are consistent with a recent study by Mishra et al.[39] in Odisha, which also found the steepest IPR in regions with the highest agricultural potential. They argue that in such areas, smallholders maximize returns from poor land through optimal application of inputs, whereas larger farms face operational inefficiencies.
Table 5. Farm size-productivity relationship in Zone IV of West Bengal for paddy cultivation.
Particulars Linear model Log-linear model Coefficient Standard error p-value Coefficient Standard error p-value Constant 6.77 0.34 6.80E-04 0.92 0.01 0.00 Farm size −0.70 0.09 1.90E-03 −0.03 3.13E-03 4.40E-04 Family labor −3.35E-03 1.33E-03 0.01 −1.60E-04 4.40E-04 4.64E-04 Casual labor −4.15E-03 1.15E-03 3.43E-04 −1.50E-04 3.83E-04 6.20E-03 Seed 0.19 0.01 0.02 6.59E-03 4.95E-04 0.00 Fertilizer 0.02 3.27E-03 2.40E-03 7.60E-04 1.09E-04 0.06 Bullock and machinery 5.79E-03 0.01 0.60 4.97E-04 3.63E-04 0.17 Imputed rent of land 9.28E-04 0.44 1.55 2.64 5.00E-03 2.71E-03 R2 0.87 0.86 The districts in Zone IV are Murshidabad, Burdwan, Hoogly, West Midnapore, and East Midnapore. Both the linear and log-linear models show an inverse and significant relationship between farm size and productivity.
Zone V (Red and Laterite Zone)
-
Zone V, encompassing regions such as Birbhum, Burdwan, Bankura, and Purulia, presents unique challenges for paddy cultivation because of poor soil fertility and erratic rainfall patterns. In this zone, the farm size-productivity relationship mirrors the inverse pattern observed across other zones. Detailed results are provided in Table 6.
Table 6. Farm size-productivity dynamics in Zone V of West Bengal for paddy cultivation.
Particulars Linear model Log-linear model Coefficient Standard error p-value Coefficient Standard error p-value Constant 0.57 0.32 0.01 0.63 0.01 0.01 Farm size −0.23 0.063 2.62E-04 −0.01 2.72E-03 1.20E-04 Family labor −5.90E-04 1.72E-03 0.73 −7.00E-04 0.07 0.99 Casual labor 4.18E-03 1.51E-03 5.86E-03 3.40E-03 0.07 0.02 Seed 0.22 0.02 0.04 7.23E-03 7.77E-04 0.02 Fertilizer 3.00E-03 5.93E-03 0.61 −2.60E-04 2.56E-04 0.30 Bullock and machinery 3.04E-03 7.58E-03 0.69 3.88E-04 3.28E-04 0.24 Imputed rent of land 1.85E-03 0.06 9.60E-03 0.07 0.24 0.01 R2 0.9 0.88 In Zone V, the coefficients for farm size (β = −0.23 in the linear model and β = −0.013 in the log-linear model) reveal a statistically significant inverse association between farm size and productivity. Smaller farms continue to outperform larger farms in terms of productivity, a trend attributed to greater labor intensity and precise resource management by smallholders. The p-values (< 0.01) for both models confirm the statistical significance of the results. The higher R2 values (0.90 for the linear model and 0.88 for the log-linear model) underscore the robustness of the models in explaining the variations in productivity. Additional variables, such as seed and casual labor, show positive and significant coefficients, indicating their crucial role in enhancing productivity in this zone. Casual labor contributes positively (β = 0.004, p < 0.01), suggesting that external labor inputs are effectively utilized during critical stages of crop growth. It indicates that successful smallholders in this zone are not relying solely on family labor but are also strategically employing hired labor for critical, time-sensitive operations. This nuanced finding adds a layer of complexity to the standard narrative and echoes the work of Rahman[40] in Bangladesh, which found that the most productive small farms efficiently combine family and hired labor to overcome production bottlenecks. The resilience of the inverse relationship in the challenging agro-climatic conditions of Zone V is a critical finding. It demonstrates that the smallholder advantage extends beyond favorable environments to more stressful contexts characterized by poor soil and erratic rainfall. This aligns with the 'inverse relationship resilience' hypothesis discussed by Carletto et al.[41], who argue that small farms are often more adaptable to environmental stress.
Zone VI (Coastal Saline Zone)
-
Zone VI, which includes districts such as North 24 Parganas, South 24 Parganas, and East Midnapore, faces challenges such as saline soils and frequent flooding. Despite these adversities, smaller farms consistently demonstrate higher productivity due to their adaptability and efficient resource utilization. The findings for Zone VI are detailed in Table 7.
Table 7. Farm size-productivity relationship in Coastal Saline Zone (VI) of West Bengal for paddy cultivation.
Particulars Linear model Log-linear model Coefficient Standard error p-value Coefficient Standard error p-value Constant 0.47 0.56 4.04E-01 0.52 0.03 1.80E-04 Farm size −0.57 0.19 2.64E-03 −0.03 0.01 0.04 Family labor 0.01 2.28E-03 0.02 2.20E-04 1.30E-04 0.09 Casual labor −2.87E-03 2.80E-03 0.31 −1.00E-04 1.60E-04 0.42 Seed 0.06 0.03 0.03 4.77E-03 1.70E-03 0.01 Fertilizer 0.02 6.48E-03 5.17E-04 4.04E-04 3.77E-04 0.29 Bullock and machinery 0.02 0.03 0.43 1.10E-03 1.62E-03 0.49 Imputed rent of land 1.91E-03 1.01 2.40 8.50E-04 5.00E-04 0.03 R2 0.94 0.9 The farm size coefficients (β = −0.57 in the linear model and β = −0.03 in the log-linear model) reinforce the consistent inverse relationship between farm size and productivity. The p-values for both models indicate the statistical significance of this relationship. With R2 values of 0.94 for the linear model and 0.90 for the log-linear model, the models demonstrate their efficacy in explaining variations in productivity across different farm sizes. The significant positive coefficient for seed (β = 0.06, p < 0.05) highlights the critical role of high-quality seeds in boosting productivity in this saline-stress prone zone. The consistent inverse relationship in the Coastal Saline Zone, despite significant environmental constraints, highlights the remarkable adaptability of smallholder systems. The strong negative coefficient for farm size (β = −0.57) suggests that the ability to closely monitor and manage crops against saline intrusion and flooding is a key factor that diminishes with increasing scale. This finding is supported by the work of DasGupta et al.[42], who specifically studied adaptation strategies in the Sundarbans region and found that small farmers were quicker to adopt salt-tolerant rice varieties and implement precise water management techniques.
The results across all six agro-climatic zones in West Bengal consistently demonstrate an inverse relationship between farm size and productivity in paddy cultivation, highlighting the dominance of smallholder agriculture. Marginal and small farmers consistently outperform larger farms as a result of intensive labor use, efficient resource management, and closer supervision of farm activities. This pan-zonal consistency firmly places our study within a large body of empirical evidence from across the Global South that confirms the IPR[43]. However, our zonal analysis moves beyond merely confirming the phenomenon to elucidating its contextual drivers. In fertile zones (II, III, IV), the IPR appears to be driven by intensive input use and superior labor management, aligning with classical theories. In more challenging zones (V, VI), it is underpinned by strategic input use (e.g., quality seeds) and adaptive resilience, a nuance highlighted in more recent literature[44]. Fertile zones like the Terai Zone (Zone II) and New Alluvial Zone (Zone III) demonstrate high productivity levels among smallholders, driven by optimal input utilization and favourable agro-climatic conditions. Conversely, challenging zones like the Red and Laterite Zone (Zone V) and Coastal Saline Zone (Zone VI) underscore the resilience of small and marginal farmers in adapting to adverse conditions, such as the poor quality of soil and saline intrusions. Larger farms, constrained by inefficiencies such as fragmented holdings and reliance on hired labor, struggle to match the productivity of smaller farms. This critical weakness of larger farms, namely the high cost of monitoring hired labor, is a cornerstone of the theoretical explanation for the IPR, as formalized by Eswaran & Kotwal[45]. Our results concerning labor consistently support this model across zones. These findings emphasize the economic importance of small and marginal farmers in ensuring food security and sustaining rural livelihoods in West Bengal. Policy interventions, including improved access to high-quality inputs, credit support, irrigation infrastructure, and land consolidation schemes, are essential to enhance productivity further. The inverse relationship underscores the urgency for tailored, zone-specific policies that strengthen smallholders' resilience while addressing the structural challenges of larger farms.
Results for Punjab: farm size-productivity dynamics in wheat cultivation
-
Punjab's agricultural structure is dominated by medium and large-scale farms, supported by modern agricultural practices and a robust infrastructure. The analysis of wheat cultivation indicates that the association between size and productivity varies across the three zones. Whereas Zone I exhibits a positive and significant association, Zones II and III show more nuanced and mixed results, influenced by disparities in input use, mechanization, and land management practices.
Zone I (Gurdaspur, SBS Nagar, Rupnagar, Patiala, Fatehgarh Sahib, Amritsar, Tarn Taran, Hoshiarpur, and Ferozepur)
-
Zone I, distinguished by advanced mechanization and a well-developed irrigation infrastructure, exhibits a notable positive correlation between farm size and productivity. The detailed results are provided in Table 8.
Table 8. Farm size-productivity dynamics in Zone I of Punjab (wheat).
Particulars Linear model Log-linear model Coefficient Standard error p-value Coefficient Standard error p-value Constant 8.11 0.71 3.15E-04 0.92 0.04 0.01 Farm size 6.31E-03 0.01 0.05 4.65E-04 6.99E-04 5.00E-04 Family labor −3.37E-03 0.01 0.72 −4.45E-03 4.25E-04 0.93 Casual labor −7.70E-04 4.09E-03 0.85 −5.43E-03 2.10E-04 0.79 Seed 0.04 0.03 0.16 1.24E-03 1.42E-03 0.38 Fertilizer 5.23E-03 0.01 0.45 2.03E-04 3.57E-04 0.57 Bullock and machinery −0.20 0.08 0.02 −0.01 4.36E-03 0.01 Imputed rent of land 1.13E-04 3.66E-04 2.21E-04 5.81E-04 1.88 2.10E-03 R2 0.67 0.65 The coefficients for farm size (β = 0.006, p < 0.05) in the linear model and (β = 0.0004, p < 0.01) in the log-linear model reveal that larger farms achieve higher productivity. This can be attributed to economies of scale, efficient use of mechanization, and improved irrigation infrastructure in Zone I. The R2 values (0.67 and 0.65) suggest moderate explanatory power, indicating that additional factors also contribute to variatins in productivity. Interestingly, the coefficient for bullock and machinery use is negative (β = −0.20, p < 0.05), showing that over-reliance on mechanization without complementary practices like precision agriculture can limit productivity gains. The emergence of a positive and significant farm size-productivity relationship in Zone I of Punjab presents a critical exception to the prevailing inverse relationship documented in much of the developing world. This finding aligns with the theoretical conditions under which economies of scale are predicted to overturn the IR hypothesis, particularly in commercialized, mechanized agricultural systems[43]. Our results support the hypothesis that in regions with highly developed land rental markets, capital-intensive technologies, and standardized production protocols, which are hallmarks of the Green Revolution in Punjab, larger farms can leverage advantages that smallholders cannot. As noted by Singh[46], larger farms in Punjab's core regions benefit from better access to institutional credit, allowing for optimal investment in high-capacity machinery and timely purchase of inputs, which translates into higher productivity. The positive coefficient, though small in magnitude, is statistically robust and suggests that a different agrarian dynamic is at play, one where the management and capital constraints typically faced by large farms are alleviated.
Zone II (Moga, Ludhiana, Sangrur, Jalandhar, and Kapurthala)
-
Zone II, which includes transitional regions with varied access to inputs and infrastructure, exhibits a positive yet less pronounced correlation between farm size and productivity. The findings are detailed in Table 9.
Table 9. Farm size-productivity dynamics in Zone II of Punjab (wheat).
Particulars Linear model Log-linear model Coefficient Standard error p-value Coefficient Standard error p-value Constant 6.40 0.85 7.18E-03 0.84 0.04 1.78E-03 Farm size 0.01 0.01 0.50 6.15E-04 4.86E-04 2.09 Family labor −0.01 0.01 0.28 −5.40E-04 5.11 0.29 Casual labor −6.00E-03 0.01 0.61 −2.54 5.19 0.62 Seed 0.07 0.03 0.02 2.92E-03 1.31E-03 0.03 Fertilizer 0.03 0.01 6.33E-04 1.35E-03 3.88E-04 6.93E-04 Bullock and machinery 0.10 0.09 0.24 4.17E-03 3.89E-03 0.29 Imputed rent of land 1.21E-04 3.00E-04 1.01E-03 5.33E-03 0.01 0.09 R2 0.48 0.48 While farm size demonstrates a positive coefficient, it is statistically insignificant (p > 0.05) in both models. Instead, productivity is more strongly influenced by input variables such as seed (β = 0.07, p < 0.05) and fertilizer (β = 0.03, p < 0.01). These findings indicate that efficient and optimal utilization of inputs has a larger impact on productivity than farm size in this transitional zone. The transition to a statistically insignificant relationship between farm size and productivity in Zone II suggests a vanishing of the inverse relationship as agriculture modernizes, without the full realization of teh economies of scale seen in Zone I. This nuanced result is consistent with the findings of Bhalla & Singh[47], who argue that the IR hypothesis weakens with technological change but may not immediately reverse. The dominance of input variables like seed and fertilizer (p < 0.05) over farm size indicates that at this intermediate stage of development, managerial ability and input quality are more critical determinants of yield than operational scale. This echoes the work of Foster & Rosenzweig[48], who emphasize that the returns of management knowledge can be high in modern agriculture and may not be correlated with farm size in a simple way. The lower R2 values (0.48) also suggest that unobserved factors, such as microvariations in the soil or different levels of access to extension services, play a more substantial role here than in the more homogeneous Zone I.
Zone III (Sangrur, Mansa, Bhatinda, Sri Muktsar Sahib, and Fazika)
-
Zone III, characterized by variability in landholding sizes and input access, reveals minimal and statistically insignificant correlations between farm size and productivity. The detailed findings are presented in Table 10.
Table 10. Farm size-productivity dynamics in zone III of Punjab (wheat).
Particulars Linear model Log-linear model Coefficient Standard error p-value Coefficient Standard error p-value Constant 6.27 0.74 0.01 0.84 0.03 4.25E-03 Farm size 2.19E-03 1.46E-02 0.38 2.39E-04 6.98E-04 0.33 Family labour −0.02 0.01 0.04 −1.14E-03 0.06 0.05 Casual labour 0.02 0.01 0.10 0.07 4.00E-04 0.15 Seed 0.09 0.03 1.30E-03 3.35E-03 1.38E-03 0.02 Fertilizer 0.03 0.01 0.01 1.30E-03 5.07E-04 0.01 Bullock and machinery −3.43E-03 0.09 0.97 1.45E-03 4.71E-03 0.76 Imputed rent of land 1.74E-04 3.82E-03 9.20E-04 7.97E-03 1.36E-03 2.15E-03 R2 0.48 0.44 Farm size exhibits a negligible and statistically insignificant relationship (p > 0.05) with productivity in Zone III. However, input variables such as seed (β = 0.09, p < 0.01) and fertilizer (β = 0.03, p < 0.01) remain critical in driving productivity. The complete statistical insignificance of farm size in Zone III, coupled with the strong significance of inputs, reinforces that this region operates under a different paradigm from Zone I. The absence of a clear relationship suggests that the classic inverse relationship has broken down, likely because of widespread mechanization and market integration, but the positive economies of scale have not materialized. This could be attributed to the more challenging growing conditions and smaller average farm size in parts of this zone (e.g., water stress in the southern districts), which may negate potential scale advantages. Our findings align with studies by Kumar et al.[49] in other parts of Northwestern India, which found that in areas facing environmental constraints, the relationship between farm size and productivity becomes blurred and is often overshadowed by the quality of inputs applied. The persistent importance of seed and fertilizer highlights that the fundamental drivers of productivity are input-based and management-intensive, rather than simply a function of scale.
Punjab's wheat productivity benefits primarily from economies of scale in Zone I and optimal input use in Zones II and III. While farm size positively impacts productivity in Zone I, its significance diminishes in other zones where input utilization and land management practices play more substantial roles. This gradient of results across Punjab's zones offers a microcosm of the global debate on the farm size-productivity relationship. Our study demonstrates that the relationship is not a universal law but a context-specific outcome, heavily dependent on the local agro-ecological, institutional, and technological environment[41]. The positive relationship in Zone I is consistent with developed agricultural systems, while the breakdown of the inverse relationship in Zones II and III reflects a transitional state. Strategic investments in precision agriculture and balanced mechanization could enhance productivity across all zones. The results in Tables 9 and 10 show that in Zone II and Zone III, a positive relationship between farm size and productivity is seen, but it is not significant. Punjab has only 14% marginal farmers (Agricultural Census 2015−2016)[25]. Becasue of the dominance of large, semi-medium, and medium farmers, productivity increases with increasing farm size. However, any policy must be cautious. The pursuit of scale should not come at the expense of equity or environmental sustainability. As cautioned by Sidhu et al.[50], Punjab's agriculture already faces severe challenges of groundwater depletion and soil degradation. Future policies must therefore promote 'smart-scale' precision technologies and improved resource management that can benefit farms of all sizes, rather than blindly promoting land consolidation. The goal should be to replicate the efficiency advantages of Zone I's larger farms through improved resource management and adoption of technology adoption for smaller holders in Zones II and III, rather than only increasing their operational area.
-
This study provides a thorough and comprehensive analysis of the farm size-productivity dynamics across the agro-climatic zones of West Bengal and Punjab, offering nuanced insights into the dynamics of agricultural systems in India. The findings challenge the conventional generalization of the inverse farm size-productivity relationship, underscoring significant inter-state and intra-state variations. West Bengal consistently demonstrates an inverse relationship across all six zones, a reflection of its dominance by marginal and smallholder farmers. These farmers rely on intensive labor, precise resource management, and adaptability, which collectively enhance productivity per unit of land. In West Bengal, the persistence of the inverse relationship is rooted in historical land reforms, fragmented holdings, and labor-intensive farming practices. Marginal and smallholder farmers maximize land productivity through high labor inputs and efficient resource use. However, despite this productivity, these farmers remain constrained by limited access to mechanization, irrigation infrastructure, and high-quality inputs. While state schemes such as Krishak Bandhu and Bangla Shasya Bima provide critical social support, they fall short in addressing structural productivity gaps. To enhance agricultural outcomes, policy must pivot toward investment in decentralized irrigation, custom hiring centres, and integrated input services. Linking the State Agricultural Plan (SAP) with farmer producer organizations can also facilitate access to scale-appropriate technologies and collective marketing for smallholders. In contrast, Punjab presents a more diverse scenario. Zone I shows a positive size-productivity relationship, driven by economies of scale, mechanization, and a robust infrastructure. However, Zones II and III show weaker correlations, with input utilization and land management practices playing a more significant role in determining productivity than farm size alone. Punjab's farm size-productivity relationship is more conditional. While larger farms in Zone I benefit from mechanization and better infrastructure, the productivity gains taper in Zones II and III due to environmental saturation and declining marginal returns on input use. Overuse of water and fertilizers, encouraged by the Free Power Scheme and skewed subsidy regimes, has led to resource depletion and ecological stress. Redirecting public support toward sustainable practices is therefore essential. Policy measures should include a rationalization of input subsidies particularly for electricity and fertilizers, combined with incentives for adopting precision agriculture, direct-seeded rice, and site-specific nutrient management. The Punjab Agriculture Policy (2018) and Sub-Mission on Agricultural Mechanization (SMAE) should be recalibrated to account for agro-ecological diversity, promoting zone-wise mechanization and input optimization. The findings emphasize the importance of avoiding blanket generalizations of the farm size-productivity relationship but instead adopting region-specific strategies to address structural differences. For West Bengal, policies should focus on supporting smallholders through improved access to high-quality inputs and credit facilities and through developing infrastructure. In Punjab, enhancing the efficiency of irrigation, promoting balanced mechanization, and encouraging precision agriculture can help optimize productivity. This state-wise comparison highlights that land size alone does not determine productivity; rather, the outcomes are mediated by institutional contexts, input efficiency, and ecological constraints. In West Bengal, scaling up smallholders' productivity requires investment in public goods tailored to fragmented landholdings. In Punjab, the focus must shift from scale expansion to sustainability reorientation. Tools such as the Soil Health Card scheme, Promotion of Alternate Nutrients for Agriculture Management, and localized eco-zonal planning offer avenues to realign input use with ecological carrying capacity. The study underscores the urgency of tailoring agricultural policies to regional contexts to achieve sustainable productivity growth while safeguarding farmers' livelihoods. Finally, this study emphasizes that effective agricultural policy must internalize agro-ecological, institutional, and technological heterogeneity. Zone-wise evidence can guide the rational allocation of public investments, enabling state governments to target high-potential regions and rehabilitate stagnating ones. Further, future research should investigate the long-term effects of policy and technological interventions on these relationships, incorporating factors such as climate change, soil health, and market dynamics. These insights will provide valuable guidance for other developing countries in balancing the farm size-productivity relationship with equitable growth.
-
The data used during the current study is available from the corresponding author upon reasonable request.
-
Not applicable.
-
The authors confirm their contributions to the paper as follows: study conception and design: Gorain S; data collection, software, analysis and interpretation of the results, draft manuscript preparation: Gorain S, Dutta S; manuscript revision: Gorain S, Dutta S. Both authors reviewed the results and approved the final version of the manuscript.
-
The authors gratefully acknowledge the support of the Directorate of Economics and Statistics, Department of Agriculture and Farmers Welfare, for providing access to the plot-level summary data under the Cost of Cultivation Scheme (2016−2017). We also extend our sincere thanks to the sampled farmers for their valuable time and cooperation during the study.
-
The authors declare that they have no conflict of interest.
- Copyright: © 2025 by the author(s). Published by Maximum Academic Press, Fayetteville, GA. This article is an open access article distributed under Creative Commons Attribution License (CC BY 4.0), visit https://creativecommons.org/licenses/by/4.0/.
-
About this article
Cite this article
Gorain S, Dutta S. 2025. Farm size and productivity dynamics: evidence from two contrasting Indian states. Circular Agricultural Systems 5: e012 doi: 10.48130/cas-0025-0010 

Farm size and productivity dynamics: evidence from two contrasting Indian states
- Received: 24 December 2024
- Revised: 09 September 2025
- Accepted: 11 September 2025
- Published online: 28 October 2025
Abstract: The relationship between farm size and productivity has been widely studied in the context of developing economies, where agriculture serves as a vital component of rural livelihoods. Historically, the inverse farm size-productivity relationship was first observed in Russian agriculture, with explanations citing factors such as labor intensity, market imperfections, differences in land fertility, and management challenges. Nevertheless, this relationship is neither uniform across regions nor static, as it is shaped by evolving agricultural practices and regional characteristics. With this backdrop, this proposed study investigated the farm size-productivity dynamics in two agriculturally significant states of India, namely West Bengal and Punjab. This study uses the plot-level summary data from the Cost of Cultivation Scheme (2016−2017). West Bengal, with 83% of its farmers categorized as marginal, consistently demonstrates a significant inverse relationship between farm size and productivity in paddy cultivation across all six agro-climatic zones. This relationship is driven by smallholders' intensive use of labor, efficient resource management, and adaptability to local conditions. In contrast, Punjab, where only 14% of farmers are marginal, exhibits a more nuanced pattern. While Zone I shows a significant and positive relationship between farm size and the productivity of wheat, Zones II and III reveal weaker correlations, with input optimization emerging as a key determinant of productivity. The relationships declines over time as technological innovations and modern agricultural practices reshape the landscape. This study underscores the need for region-specific policies, focusing on smallholders' resilience in West Bengal and promoting balanced mechanization in Punjab, to achieve sustainable growth in productivity.
-
Key words:
- Farm size and productivity relationship /
- Paddy /
- Wheat /
- West bengal /
- Punjab /
- Agricultural sustainability /
- Linear model /
- Log-linear model