


-
Steadily increasing domestic consumption in recent years has boosted demand for arabica coffee beans from local factories, reinforcing the crop's importance in the highlands of northern Thailand. In 2016, coffee cultivation covered over 56,000 hectares nationally, with the arabica grown in the North accounting for 45.2% of this area (DOAE, 2016)[1]. By 2018, the primary northern provinces of Chiang Rai and Chiang Mai had a combined planting area of 60,400 Rai, yielding approximately 9,336 tons annually[2]. The cultivation includes diverse varieties like H528, POP5, P88, P90, Catuai, Caturra, and Bourbon, which produce cherries in hues of red, yellow, and orange[3−6]. The processing of green coffee beans creates substantial agricultural byproducts, including pulp, mucilage, and parchment layers constitute up to 55% of the cherry's total weight[7]. A significant amount of biomass is produced, but it is often dismissed as 'waste' and discarded without valuable valorisation. In an effort to reduce waste, coffee pulp is being recovered and repurposed for various applications, including bioethanol production[8], biogas[9], compost[10], animal feed[11], food[12], beverages[13], and botanicals[14]. A primary component of coffee pulp is rich in carbohydrates, including pectin (20%–35%), fibre (30%), and oligosaccharides, as well as proteins and minerals (especially potassium)[7,15]. The substance is also a source of bioactive compounds, particularly polyphenols, whose powerful antioxidant properties offer additional health advantages[8], and anthocyanins could be utilised as natural food colorants[16]. Coffee pulp is notably known for its high pectin content, which can reach up to 15% on a dry weight basis[17]. By 2028, the global pectin market is forecasted to reach a volume of roughly 100,710 metric tons, reflecting a compound annual growth rate (CAGR) of 3.1% over the preceding five years[18]. Pectin's chemical structure consists of a heteropolysaccharide backbone of α−(1→4) linked D-galacturonic acid monomers. The degree of esterification (DE)—the percentage of these monomers containing methoxyl groups—is the key parameter used to distinguish between high-methoxyl (HMP; DE ≥ 50%) and low-methoxyl (LMP; DE < 50%) pectins. This distinction is critical as it also governs their respective gelling mechanisms[19]. HMP requires high sugar content and acidic conditions to gel, whereas LMP forms gels when exposed to divalent cations like calcium ions without sugar. Within the food sector, HMP's application is centered on its properties as a thickener and gelling agent, while LMP is geared towards uses such as low-sugar formulations, edible films, and health supplements[17,20].
The potential to recover valuable bioactive compounds from the diverse arabica coffee varieties of northern Thailand remain largely unexplored. To address this, the present study characterised eight varieties of arabica coffee cherry pulp by determining their proximate compositions, phytochemical profiles, and mineral content. Furthermore, the research not only evaluated different solution-based methods for pectin extraction but also characterised the resulting pectin by determining its yield, type, and quality attributes. These findings establish a basis for tailoring the use of specific coffee pulps to different industrial needs, such as in food and drug formulation, and delivery systems.
-
Coffee pulps (CP) of different varieties, as visually determined by colour and size, were obtained through a wet processing method. They are sourced from the Highland Agricultural Research and Training Center, Khun Chang Kian, Chiang Mai, Thailand (18.840093525158775, 98.89823401100753). The characteristics of each variety are presented in Table 1. Raw material was dried until it reached a stable moisture content, and subsequently ground into a fine powder[21].
Table 1. Characteristics and origin of arabica coffee.
Coffee varieties Origin Feature Catuai (CAP) The Catuai coffee variety originated in Brazil and was developed by the Instituto Agronomico in the Campinas region of São Paulo. It was crossed from two natural arabica mutations: the compact and smaller Caturra and the highly productive Mundo Novo. This breeding aimed to combine Caturra's compact growth with Mundo Novo's yield and quality, resulting in a robust, high-yielding plant ideal for dense planting and efficient harvesting[3,4]. 
Caturra (CAPY) Originating as a natural Bourbon mutation found in Brazil (1915−1918), this variety's compact form and dense secondary branching immediately attracted plant breeders. These characteristics are advantageous as they permit closer plant spacing, which translates directly into higher overall fruit yields per area[5,6]. 
CaturraCatimor Catimor designates a range of cultivars resulting from a cross between the Timor hybrid and Caturra, a breeding effort driven primarily by the need for resistance to coffee leaf rust. The Catimor group includes several cultivars and breeding lines, such as H528, Populacao 5, and Progenies 88 and 90[22−24]. 
CatimorH528R and H528Y
A hybrid, H528, was created by crossing yellow-fruited Catuai with HW26. The H 528/21 cultivar produces beans comparable in weight and size to Caturra, while the H 528/46 cultivar shows resistance to coffee leaf rust in its fourth generation. This hybrid fruits later than Caturra[23, 25].
Catimor H528R
Catimor H528YPopulacao 5 (POP5)
This variety was developed through the selection of the fifth filial generation (F5) derived from ICFC 7958 (F4), which in turn originated from progenies of CIFC HW 26/5-3-45. Its lineage traces back to the Catimor variety from the Coffee Institute of Portugal[23,26].
Populacao 5Progeny 88 (P88) and Progeny 90 (P90)
Both Catimor coffee varieties originated in Colombia; however, the fourth filial generation (F4) seeds were obtained from a coffee research station in Kenya. Unlike the commonly known Catimor types developed primarily in Brazil and Portugal, these hybrids have a distinct parentage. Their genetic background includes hybrids such as Hybrido de Timor, Caturra, and HDT-CIFC 832/1 Portugal F6[23].
Catimor progeny 90
Catimor progeny 88Bourbon variety Bourbon (Coffea arabica var. bourbon) is believed to have originated as a natural mutation of the Typica variety. Bourbon is thought to have emerged naturally in the highlands of Ethiopia and was introduced to Bourbon Island (now Réunion) in 1740 CE. Bourbon leaves are broad with green-coloured young shoots. While the variety is susceptible to coffee leaf rust and environmental stresses[23,27].
Phanokkok (PNK)
Phanokkok, also known as orange Bourbon, is a cultivar of the Bourbon coffee variety characterised by its distinctive orange cherry colour. Bourbon itself is a natural mutation of the Typica coffee variety, originating originally from Ethiopia. This unique cultivar has been introduced to northern Thailand, where it is being developed and cultivated primarily by the Highland Agricultural Research and Training Center in Khun Chang Kian, Chiang Mai[23,27].
PhanokkokProximate analyses
-
Standard AOAC (Association of Official Analytical Chemists) official methods were employed for all proximate composition analyses of the CP samples. The determination of moisture content, for example, was performed by drying the samples to a constant weight at 105 °C[28]. Crude fat content in the CP samples was determined using Soxhlet extraction with dichloromethane as the solvent. Crude protein was determined using the Kjeldahl method[29]. Crude fibre content was also analysed using a standard procedure[28]. Once defatted, the samples were digested first in sulphuric acid (H2SO4) and subsequently with sodium hydroxide (NaOH). The ash content was quantified in accordance with the official AOAC method 923.03. Total carbohydrate content was estimated using Eq. (1):
$ \begin{split} \rm{C}arbohydrate\; (\text{%})=\; & \rm{1}00-[Moisture\; content\; (\text{%})\; +Crude\; protein\; (\text{%})\ + \\ &\rm{A}sh\; (\text{%})+Crude\; fat\; (\text{%})+Crude\; fibre\; (\text{%})] \end{split} $ (1) Mineral analyses
-
Atomic Absorption Spectrophotometry was employed to measure the sample's macro- and micro-minerals, according to the protocol previously described by Suksathan et al.[30]. Sample preparation began with digesting the dried material in a 6:1 mixture of perchloric acid (HClO4) and nitric acid (HNO3). Following digestion, a 1.0 g portion of the residue was moistened with deionised water and then dissolved in 2 mL of concentrated hydrochloric acid (HCl). Measurements of the final solution were conducted using a flame atomic absorption spectrometer (Model ContrAA 800, Analytik Jena, Germany). For the quantification of minerals, a series of standard solutions was formulated. Calibration standards for the microminerals covered the following ranges: potassium (K; 0–2.0 ppm), sodium (Na; 0–1 mg/L), calcium (Ca; 0–5 mg/L), and magnesium (Mg; 0.1–0.5 mg/L). For the micromineral iron (Fe), the standard concentration ranged from 0 to 5 mg/L. The phosphorus (P) content was quantified using a distinct colourimetric method. This analysis employed the vanadomolybdate yellow method, with standards from 5 to 10 mg/L prepared using potassium dihydrogen phosphate (KH2PO4)[31,32]. Analyses were performed in triplicate for all samples.
Quantitative polyphenol analyses
Methanolic extraction
-
The coffee pulp fine powder was extracted following the methods of Geremu et al.[8], and Huanhong et al.[11]. For extraction, 80% of methanol solvents were used for maceration at a 1:10 ratio (w/v), three times. After gathering the supernatant from each extraction, the solution was subjected to vacuum concentration to remove the solvent, using a speedvac system (UNIEQUIP UNIVAPO 100H, Uniequip, Munich, Germany).
Total Phenolic Content (TPC)
-
The TPC was quantified using a colorimetric Folin–Ciocalteu assay described by Huanhong et al.[11]. The reaction mixture contained 30 µL of sample extract, 150 µL of 10% Folin–Ciocalteu reagent, and 120 µL of 6.0% saturated sodium bicarbonate for neutralisation. After a one-hour incubation in the dark at room temperature, the absorbance was read at 765 nm on a SPECTROstar microplate reader (BMG LABTECH, Offenburg, Germany). A standard curve generated with gallic acid (10–200 mg/mL) was used to calculate the final results, which are presented as milligrams of gallic acid equivalents (GAE) per gram of dry weight (gDW).
Total Flavonoid Content (TFC)
-
The TFC was measured according to the procedure reported by Sangta et al.[21]. To 25 µL of the crude methanolic extract and 125 µL of distilled water, 7.5 µL of 5.0% sodium nitrite solution was added, and the mixture was incubated for 5 min at room temperature. Subsequently, 15 µL of 10.0% aluminium chloride hexahydrate was introduced for a 6-min reaction period, followed by the addition of 50 µL of 1 M sodium hydroxide and 27.5 µL of distilled water to complete the reaction. The TPC was determined by measuring absorbance at 510 nm with a microplate reader, with results calculated from a catechin calibration curve (30–300 mg/mL) and reported as mg CE per gram of dry weight (gDW).
Antioxidant activities
DPPH assay
-
The DPPH (2,2-diphenyl-1-picrylhydrazyl) radical scavenging activity was evaluated using a modified version of the method from Dos Santos et al.[33]. To initiate the reaction, 25 µL of the extract was mixed with 250 µL of a 0.2 mM DPPH solution. Following a 30-min incubation in the dark at room temperature, the absorbance was measured at 517 nm with a microplate reader. The final radical scavenging activity was then estimated using Eq. (2):
$ \begin{split}&\rm DPPH\; radical\; scavenging \;activity\;\left({\text{%}}\right)=\dfrac{Abs_{control}-{Abs}_{sample}}{Abs_{control}} \times 100\end{split} $ (2) where Abscontrol refers to the absorbance of the blank sample, consisting of the DPPH radical solution and methanol (blank), and Abssample signifies the absorbance measured for the test sample after the DPPH has reacted with the extract or standard.
ABTS assay
-
A modified ABTS assay, based on Nemzer et al.[34] and Sangta et al.[21], was used to assess antioxidant activity. The procedure involved measuring the change in absorbance at 734 nm after a 30-min incubation of 10 µL of extract, with 200 µL of a prepared ABTS working solution with 80% methanol to obtain an absorbance of ~0.70 ± 0.02. The final scavenging activity of the extract was calculated using Eq. (3):
$ \begin{split} & \rm{A}BTS\; radical\; scavenging\; activity\; \left(\text{%}\right)=\frac{Abs_{control}-Abs_{sample}}{Abs_{control}}\times 100\end{split} $ (3) where, Abscontrol refers to the absorbance of the ABTS radical solution mixed with 80% methanol (blank), and Abssample signifies the absorbance of the ABTS radical reacted with the sample extract or standard.
Pectin recovery from Coffee Pulp (CP)
-
The CP pectin was extracted following the method of Sunanta et al.[35], of initially using dichloromethane and ethanol as solvents. Subsequently, the extraction was carried out sequentially with hydrochloric acid/potassium chloride (HCl/KCl) buffer and ammonium oxalate solution ([NH4]2C2O4). The pectin was silted with concentrated ethanol and washed with isopropanol. After drying the sample in a hot air oven, its physicochemical characteristics were analysed, and the CP pectin yield was computed using Eq. (4):
$ \text{Yield}\;\left({\text{%}}\right)=\dfrac{{\text{W}}_{\text{0}}}{\text{W}}\times{100} $ (4) where, W0 (g) = dried pectin weight; W (g) = dried coffee pulp weight.
FTIR analysis and Degree of Esterification (FTIRDE) of CP pectin
-
The chemical structure of the extracted pectin was investigated using an FTIR spectrometer from Perkin Elmer (USA). The degree of esterification (DE) was subsequently calculated according to the procedure of Srikamwang et al.[36] using Eq. (5). A paired-samples t-test was conducted to compare the DE values obtained from the different extraction solutions, using IBM SPSS Statistics for Windows (Version 16.0).
$ \rm {FTIRDE\;({\text{%}})} =\dfrac{\text{A}_{1745}}{\text{A}_{1745} + {A}_{1630}}\times {100} $ (5) where, A1630 refers to the absorption intensity of non-methyl-esterified carboxyl groups at 1,630 cm−1. A1745 refers to the intensity of methyl-esterified carboxyl groups at 1,745 cm−1.
Statistical analyses
-
Analyses were performed using at least three biological replicates, each of which was assessed in technical triplicate. To compare mean values, the data were subjected to a one-way ANOVA followed by Duncan's multiple range test. A Principal Component Analysis (PCA) was also conducted to investigate the correlations among the coffee pulp's chemical properties (proximate, phytochemical, mineral) and its pectin quality. Statistical significance for all analyses was established at p ≤ 0.05. The software used for these computations was IBM SPSS Statistics for Windows (Version 16.0, IBM SPSS Modeler 16.0, IBM SPSS Software, Armonk, New York, USA). The TBtools-II (Toolbox for Biologists) version 1.108 program was applied to represent the expression-based heat maps.
-
The proximate analysis of various dried arabica coffee varieties, presented in Table 2. The samples exhibited a moisture content (wet basis) from 3.11% to 4.02%. This reflects a low water activity in the dried coffee pulp (CP), indicating that it is stable for long-term storage. This environment inhibits the growth of spoilage microorganisms, including yeasts and bacteria[37]. The primary constituent of the sample was carbohydrate. The identified polysaccharides include carbohydrate and fibres such as pectin, cellulose, and hemicellulose[38]. P88 had the highest carbohydrate content (67.77% ± 0.09%), while CAP had the lowest (62.54% ± 0.36%). Generally, carbohydrates compose the main nutrient in coffee pulp, typically ranging from 35.0% to 66.0%[39]. Among the carbohydrates, pectin was the most abundant at 20.5%, while reducing sugars constituted 5.4%.
Table 2. Nutritional composition of different arabica coffee pulp varieties.
Coffee varieties Moisture content (%) Carbohydrate (%) Crude fat (%) Crude fibre (%) Crude protein (%) Ash (%) CAP 3.43 ± 0.04cd 62.54 ± 0.36e 1.78 ± 0.03a 19.42 ± 0.41a 12.50 ± 0.12e 0.35 ± 0.02ab CAPY 3.34 ± 0.06d 66.22 ± 0.37b 1.72 ± 0.11a 17.07 ± 0.24b 11.34 ± 0.09f 0.33 ± 0.02bc H528Y 3.14 ± 0.02e 65.94 ± 0.03b 1.34 ± 0.04cd 15.71 ± 0.00d 13.53 ± 0.03c 0.35 ± 0.01ab H528R 3.11 ± 0.02e 65.05 ± 0.62c 0.93 ± 0.04g 15.18 ± 0.44ef 15.41 ± 0.22a 0.33 ± 0.00bc PNK 4.02 ± 0.01a 66.55 ± 0.24b 1.44 ± 0.01bc 14.72 ± 0.06f 12.91 ± 0.28d 0.36 ± 0.01a POP5 3.92 ± 0.03a 63.93 ± 0.29d 1.05 ± 0.04fg 16.51 ± 0.21c 14.28 ± 0.16b 0.32 ± 0.01c P88 3.49 ± 0.08c 67.77 ± 0.09a 1.25 ± 0.08de 15.57 ± 0.19de 11.59 ± 0.09f 0.35 ± 0.01ab P90 3.72 ± 0.02b 64.94 ± 0.18c 1.17 ± 0.02ef 16.80 ± 0.07bc 13.03 ± 0.03d 0.34 ± 0.02abc The data are given as the mean ± standard deviation. a–f Within each column, values with different letters denote statistically significant differences between the means (p ≤ 0.05, Duncan's multiple range test). CAP = Catuai, CAPY = Caturra, H528Y = Cartimor H528 Yellow, H528R = Cartimor H528 Red, PNK = Bourbon Phanokkok, POP5 = Cartimor Populacao 5, P88 = Cartimor Progeny 88, P90 = Cartimor Progeny 90. Crude fibre levels in the coffee pulp varied from a low of 15.01% in the PNK variety to a high of 19.42% in the CAP variety. This result aligns with existing literature that has established coffee pulp as high in dietary fibre, citing previously reported values near 33.6%[40]. Murthy & Naidu[41] reported that coffee pulp contains 28% total dietary fibre, with 18% ± 0.9% being soluble, and 10% ± 0.8% insoluble. Crude fibre is the residue left after a material has been treated with acid and alkali. It primarily consists of cellulose, along with smaller amounts of lignin and pentosans[42]. The specific variety of coffee pulp influenced its dietary fibre composition[43].
The protein content in the coffee pulp varied between 11.34% and 15.41%. H528R exhibited the maximum content, while CAPY showed the lowest. This result aligns previous research, including the 10.1% protein content reported by Costa et al.[44] and the 11.52% documented by Moreno et al.[40]. Such a substantial amount of protein suggests that the CP could be a valuable ingredient for improving the nutritional and functional properties of food products. In contrast, Abduh et al.[45] reported a lower protein range of 4.69% to 5.31%, which may reflect differences in cultivar, growing conditions, or processing techniques. The variation in protein content among the pulp varieties may be due to differences in their secretion of pectin-modifying enzymes—such as polygalacturonase, pectin methyl esterase, and galactosidase—throughout the maturation process[46]. Additionally, the protein content in coffee pulp is not constant; it is subject to variation based on the coffee's genetic variety and the elevation of its cultivation site[47].
Across all coffee varieties, the content of crude fat varied from 0.93% to 1.78%, with the greatest amount found in CAP and the least in H528R. According to other studies, the fat content in coffee pulp is typically between 0.8% and 7.0%[39]. When contrasted with other energy-yielding components like carbohydrates and proteins, the content of CP fat is observed to be quite low. The fat content of coffee pulp can vary because of various parametres, such as the specific coffee species and variety, the temperature and climate of the cultivation region, and the agricultural and post-harvest processing methods used[47].
Coffee pulp contains a relatively small amount of ash, around 0.30%, a finding consistent with the study by Sangta et al.[21]. The result is also consistent with the 0.25% ash in coffee pulp reported by Rohaya et al.[47]. Conversely, Malarat et al.[48] found a slightly higher ash content of 0.41%, while Romauli et al.[49] observed a significantly higher value of 2.14%. Based on their findings, the ash content in coffee pulp directly reflects the mineral availability in the soil; in other words, the higher the mineral content of the soil, the higher the ash content in the pulp. Generally, ash content analysis of coffee pulp serves as a useful initial parameter for assessing the total mineral composition. It can indicate the presence of various metallic elements, both major and trace, in processed coffee fruit pulp products[50].
Phytochemicals
-
As a group of secondary metabolites, polyphenols primarily comprise two major classes: flavonoids and phenolic acids[51]. Several studies have explored the potential to valorise these compounds from various coffee sources[52]. Table 3 presents a detailed comparison of total phenolic (TPC), and total flavonoid content (TFC), along with the antioxidant activity (DPPH and ABTS assays), across eight different coffee pulp varieties. The TPC varied from 4.21 to 6.85 mgGAE/gDW. The P88 variety contained the highest phenolic content (6.4 ± 0.04 mgGAE/gDW), whereas P90 showed the lowest (4.21 ± 0.06 mgGAE/gDW). In comparison, Kaisangsri et al.[53] reported a phenolic content of approximately 15.46 mgGAE/gDW dried sample for coffee pulp. Phenolic compounds, which are abundant in coffee by-products, contribute significantly to their antioxidant capacity by effectively neutralising free radicals. Research on coffee pulp highlights the contribution of polyphenolic compounds and their flavonoid content to these antioxidant effects[54,55]. The TFC varied from 6.07 to 10.28 mgCE/gDW. P88 showed the highest content (10.28 ± 1.14 mgCE/gDW), and the lowest was CAP (6.07 ± 0.67 mgCE/gDW). For comparison, Sangta et al.[21] reported a total flavonoid content of 32.0 mgCE/gDW in arabica coffee pulp.
Table 3. Phytochemical contents of different arabica coffee pulp varieties.
Coffee
varietiesTotal phenolic
content
(mgGAE/gDW)Total flavonoid
content
(mgCE/gDW)Antioxidant activity (%) DPPH ABTS CAP 5.09 ± 0.10cd 8.14 ± 0.25bcd 85.65 ± 3.59b 84.08 ± 0.87c CAPY 4.21 ± 0.06f 6.55 ± 0.34ef 85.58 ± 1.74b 88.80 ± 0.27a H528Y 5.30 ± 0.10b 8.44 ± 0.36bc 83.10 ± 0.43b 84.88 ± 0.56c H528R 4.66 ± 0.13e 7.17 ± 0.24de 83.63 ± 0.86b 86.37 ± 1.06bc PNK 4.90 ± 0.03d 7.50 ± 0.25cde 85.41 ± 0.11b 88.52 ± 0.74a POP5 4.94 ± 0.06d 7.30 ± 0.43de 84.08 ± 0.87b 84.97 ± 1.41c P88 6.41 ± 0.04a 10.28 ± 1.14a 88.81 ± 1.22a 88.80 ± 0.00a P90 4.31 ± 0.29f 6.07 ± 0.67f 83.58 ± 0.11b 85.72 ± 1.01c The data are given as the mean ± standard deviation. a–f Within each column, values with different letters denote statistically significant differences between the means (p ≤ 0.05, Duncan's multiple range test). CAP = Catuai, CAPY = Caturra, H528Y = Cartimor H528 Yellow, H528R = Cartimor H528 Red, PNK = Bourbon Phanokkok, POP5 = Cartimor Populacao 5, P88 = Cartimor Progeny 88, P90 = Cartimor Progeny 90. The primary function of an antioxidant is to inhibit free radicals, thereby preventing them from causing cellular damage. They do this by giving an electron to the free radical, which neutralises it and reduces its ability to cause harm[56]. Regarding the coffee pulp's antioxidant activity using DPPH and ABTS assays. Across all eight coffee varieties, the antioxidant activity was notably high, exceeding 83% as analysed by the protocols of DPPH and ABTS. The P88 variety was the top performer, showing 88.81% and 88.80% activity, respectively. As seen in previous studies[57,58], these findings indicate that higher TPC and TFC in the extracts correspond to greater antioxidant activity. Variations from other studies, such as Murthy & Naidu[41] who reported 65% activity, can be attributed to differences in variety, processing, and extraction methods. Additionally, pulp colour appeared to influence bioactive compound levels: darker pulp generally contained higher phenolic and flavonoid contents, resulting in greater antioxidant activity[41, 59]. Various applications of polyphenol extracted from coffee pulp, including Sangta et al.[14] who demonstrated a novel application for coffee pulp polyphenols, using the extracts in a pectin-based coating spray to inhibit the pathogen that causes coffee leaf spot. Huanhong et al.[11] reported that adding arabica coffee pulp extract to broiler chicken feed (at a 500 mg/kg dose) improved their growth and intestinal morphology, owing to the extract's antioxidant and anti-inflammatory compounds.
Mineral contents
-
An analysis of the nutrient content of eight varieties of dried arabica coffee pulps revealed a range of results, as shown in Table 4. Phosphorus was the most prevalent mineral in the CP, followed by magnesium and iron. These results are comparable to the findings of Hu et al.[60], who similarly identified high concentrations of minerals like potassium (410 mg/100 g DW), calcium (97.8 mg/100 g DW), and magnesium (24.5 mg/100 g DW) in their samples. Regarding Table 3, nitrogen ranged from 1.82% to 2.47%, with the maximum level obtained from H528R and the lowest in CAPY. Phosphorus content varied from 1,125.50 to 1,534.50 mg/kg, with the highest found in P90 and the lowest in CAPY. For potassium, the range was 2.11% to 3.21%, with S528R having the highest amount and P90 the lowest. Calcium content covered 1.03% to 1.47%, with PNK showing the most and H528Y the least. For magnesium (Mg), the highest concentration was in PNK (1,065.00 mg/kg), while the lowest was in P88 (834.00 mg/kg). Finally, the iron (Fe) content ranged from a low of 44.46 mg/kg in P88 to a high of 83.44 mg/kg in S528R. Based on these results, the H528R, PNK, and P90 varieties of arabica coffee pulp contained the highest overall mineral content. These findings indicate that the varieties could be used as a source of phosphorus and magnesium, two minerals vital for bone health. Potassium is also critical for bone health, as it helps regulate calcium levels in the body by managing its excretion. While the majority of adults achieve the US Recommended Dietary Allowance for phosphorus (700 mg/day), a deficiency can still arise from either insufficient intake or high levels of calcium[61].
Table 4. Mineral constituents of different arabica coffee pulp varieties.
Coffee varieties Nitrogen (%) Phosphorus (mg/kg) Potassium (%) Calcium (%) Magnesium (mg/kg) Iron (mg/kg) CAP 2.00 ± 0.02e 1343.75 ± 38.25c 2.73 ± 0.02b 1.14 ± 0.06d 918.50 ± 6.50c 50.14 ± 1.40e CAPY 1.82 ± 0.02f 1125.50 ± 2.50h 2.66 ± 0.01b 1.28 ± 0.03c 936.25 ± 31.25c 58.34 ± 2.18c H528Y 2.17 ± 0.01c 1310.50 ± 9.50d 2.73 ± 0.06b 1.03 ± 0.04e 867.50 ± 7.51de 61.92 ± 0.04b H528R 2.47 ± 0.04a 1376.50 ± 5.50b 3.21 ± 0.03a 1.28 ± 0.04c 1001.50 ± 4.01b 83.44 ± 0.26a PNK 2.07 ± 0.05d 1282.50 ± 3.50e 2.50 ± 0.22c 1.47 ± 0.05a 1065.00 ± 62.50a 51.50 ± 2.60e POP5 2.29 ± 0.03b 1347.25 ± 9.75c 2.26 ± 0.02d 1.09 ± 0.02d 841.25 ± 8.75e 62.27 ± 1.37b P88 1.86 ± 0.02f 1190.25 ± 6.25g 2.17 ± 0.03de 1.40 ± 0.02b 834.00 ± 8.50e 44.46 ± 1.23f P90 2.09 ± 0.01d 1534.50 ± 12.50a 2.11 ± 0.08e 1.38 ± 0.00b 1021.25 ± 8.75b 55.38 ± 1.98d The data are given as the mean ± standard deviation. a–f Within each column, values with different letters denote statistically significant differences between the means (p ≤ 0.05, Duncan's multiple range test). CAP = Catuai, CAPY = Caturra, H528Y = Cartimor H528 Yellow, H528R = Cartimor H528 Red, PNK = Bourbon Phanokkok, POP5 = Cartimor Populacao 5, P88 = Cartimor Progeny 88, P90 = Cartimor Progeny 90. To further understand the relationships among the proximate, phytochemicals, and mineral constituents in different varieties of arabica coffee pulp, principal component analysis (PCA) was performed as illustrated in Fig. 1. Over 70% of the total variance in the proximate composition data was explained by the PC1 and PC2, as shown in Fig. 1a. The biplot indicated a positive correlation between CAPY and crude fat, as well as between P88 and ash content. Carbohydrate and moisture content were positively associated with PNK and H528Y, respectively. Crude protein correlated with H528R and P90, whereas crude fibre correlated with CAP. As shown in Fig. 1b, the PC1 and PC2 captured over 90% of the total variance in the phytochemical data. The PNK and P80 varieties showed a strong positive correlation with antioxidant potency, as measured by both procedures of DPPH and ABTS. Similarly, the CAP variety was positively associated with TPC and TFC. In contrast, other varieties were negatively correlated with these phytochemical properties. The analysis of mineral composition (Fig. 1c) showed a strong positive correlation between the PNK and P90 varieties and the minerals calcium, magnesium, and phosphorus. The H528R and POP5 varieties were also positively associated with phosphorus, while H528Y was correlated with nitrogen, iron, and potassium. In contrast, P88, CAPY, and CAP were negatively correlated with all measured minerals. These results provide a comprehensive understanding that the biomass from arabica coffee processing is rich in valuable bioactive compounds. This allows for the selection of specific bioactive compounds based on application requirements. The findings are crucial for understanding the nutritional, phytochemical, and mineral compositions of coffee pulp, which can be applied to further research and commercial uses.
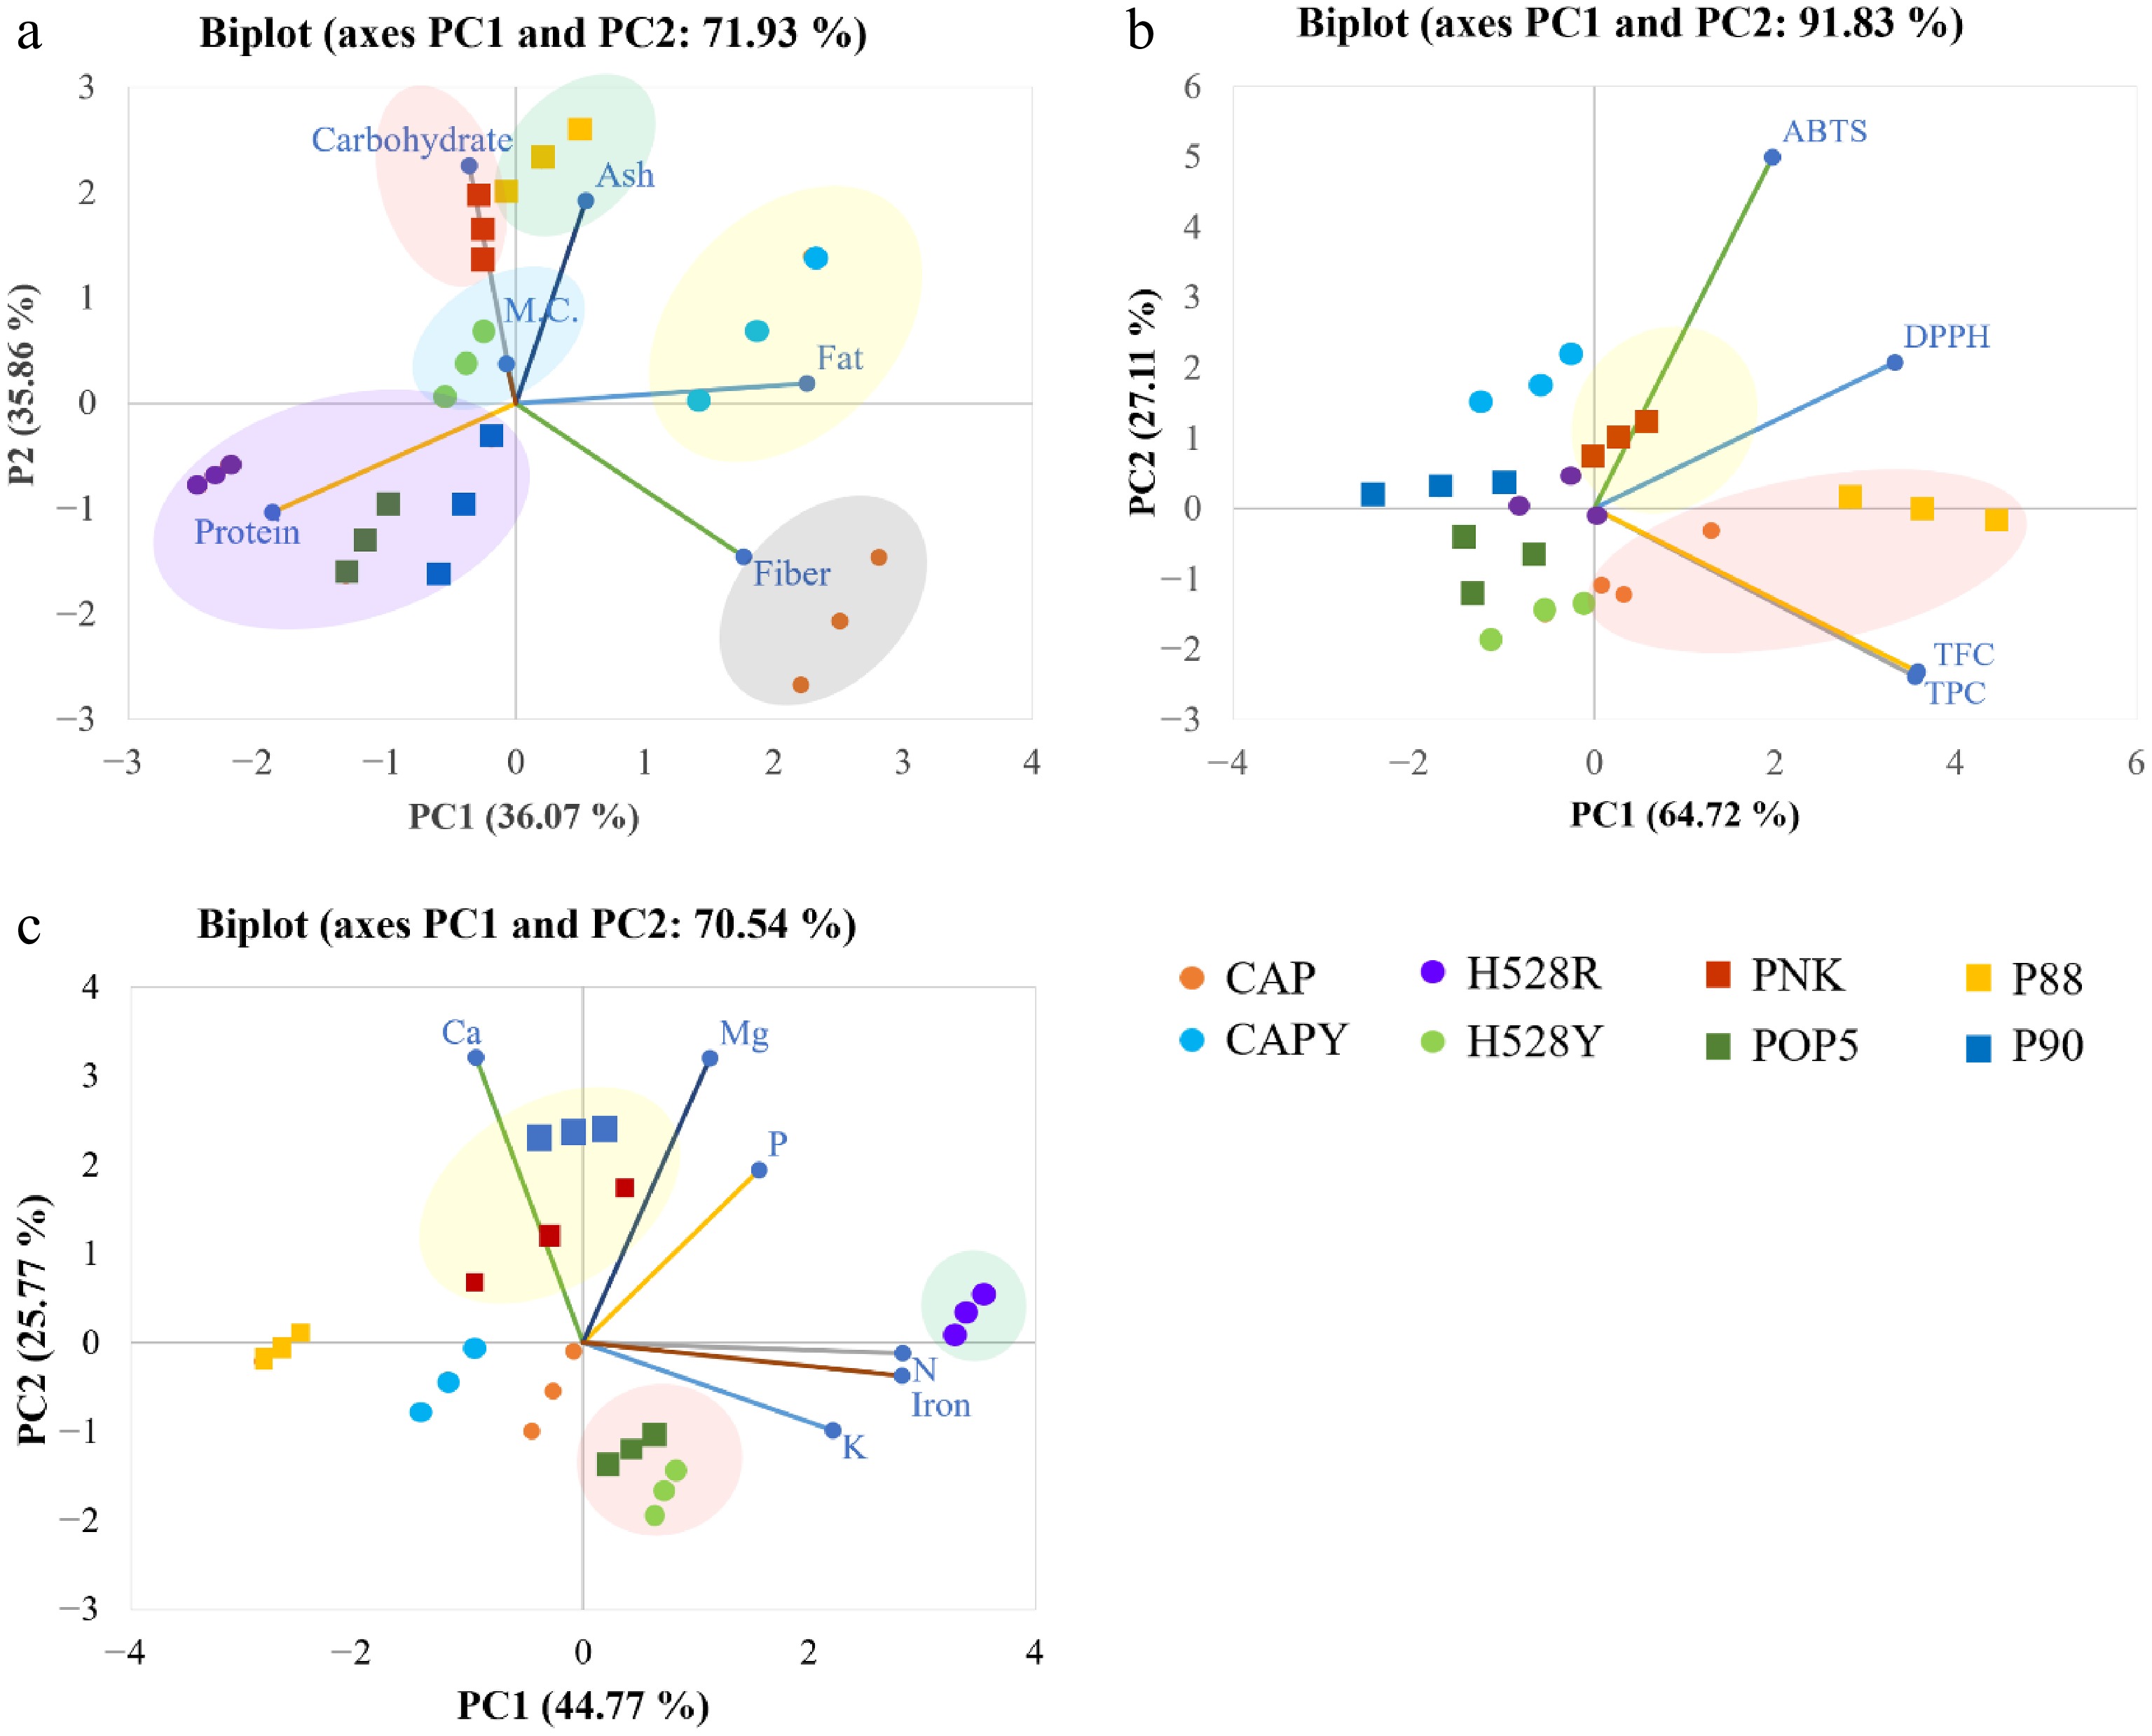
Figure 1.
The chemometric PCA biplots of the (a) proximate, (b) phytochemicals, and (c) mineral compositions in different varieties of arabica coffee pulp. CAP = Catuai, CAPY = Caturra, H528Y = Cartimor H528 Yellow, H528R = Cartimor H528 Red, PNK = Bourbon Phanokkok, POP5 = Cartimor Populacao 5, P88 = Cartimor Progeny 88, P90 = Cartimor Progeny 90, TFC = Total flavonoid compound, TPC = Total phenolic compound.
Characterisation of coffee pulp pectin (CPP)
CPP yield
-
Pectin is a functional food ingredient known for gels and its viscoelastic properties[62]. The CPP yield extracted from each variety with the sequential extraction method (HCl/KCl buffer and ammonium oxalate solution) is presented in Fig. 2. Overall, using ammonium oxalate as the extraction solvent resulted in high pectin yields for most coffee varieties. The highest yields were obtained from varieties CAPY (15.13% ± 1.33%), P90 (13.07% ± 1.06%), POP5 (12.38% ± 0.90%), and H528R (11.34% ± 1.23%). Conversely, the lowest yield observed was also from the POP5 variety, at just 2.05% ± 1.01%. These results correspond with those of Biratu et al.[18], whose work on arabica coffee also showed a lower pectin yield from acid extraction (12.20%) than from ammonium oxalate (15.13%). While acids facilitate pectin solubilisation, their harsh conditions can lead to degradation, which explains the lower overall yield. While it is well-documented that chelating agents are very effective for extracting pectin, the yield and structural characteristics of the final product are contingent upon both the material sources and the extraction parametres. For instance, while agents like ammonium oxalate and EDTA have produced high pectin yields, citric acid typically affords a more moderate amount. This indicates that the extraction process can be customised to yield pectin with desired functional characteristics for specific applications[63]. However, when considering the total yield of pectin extracted sequentially using HCl/KCl buffer and ammonium oxalate, CAPY exhibited the highest content (21.98% ± 1.30%), while P88 showed the lowest (8.49% ± 0.78%). This wide range in yields underscores that the final amount of pectin is highly dependent on factors such as the specific coffee variety, extraction method, and maturity stage[64].
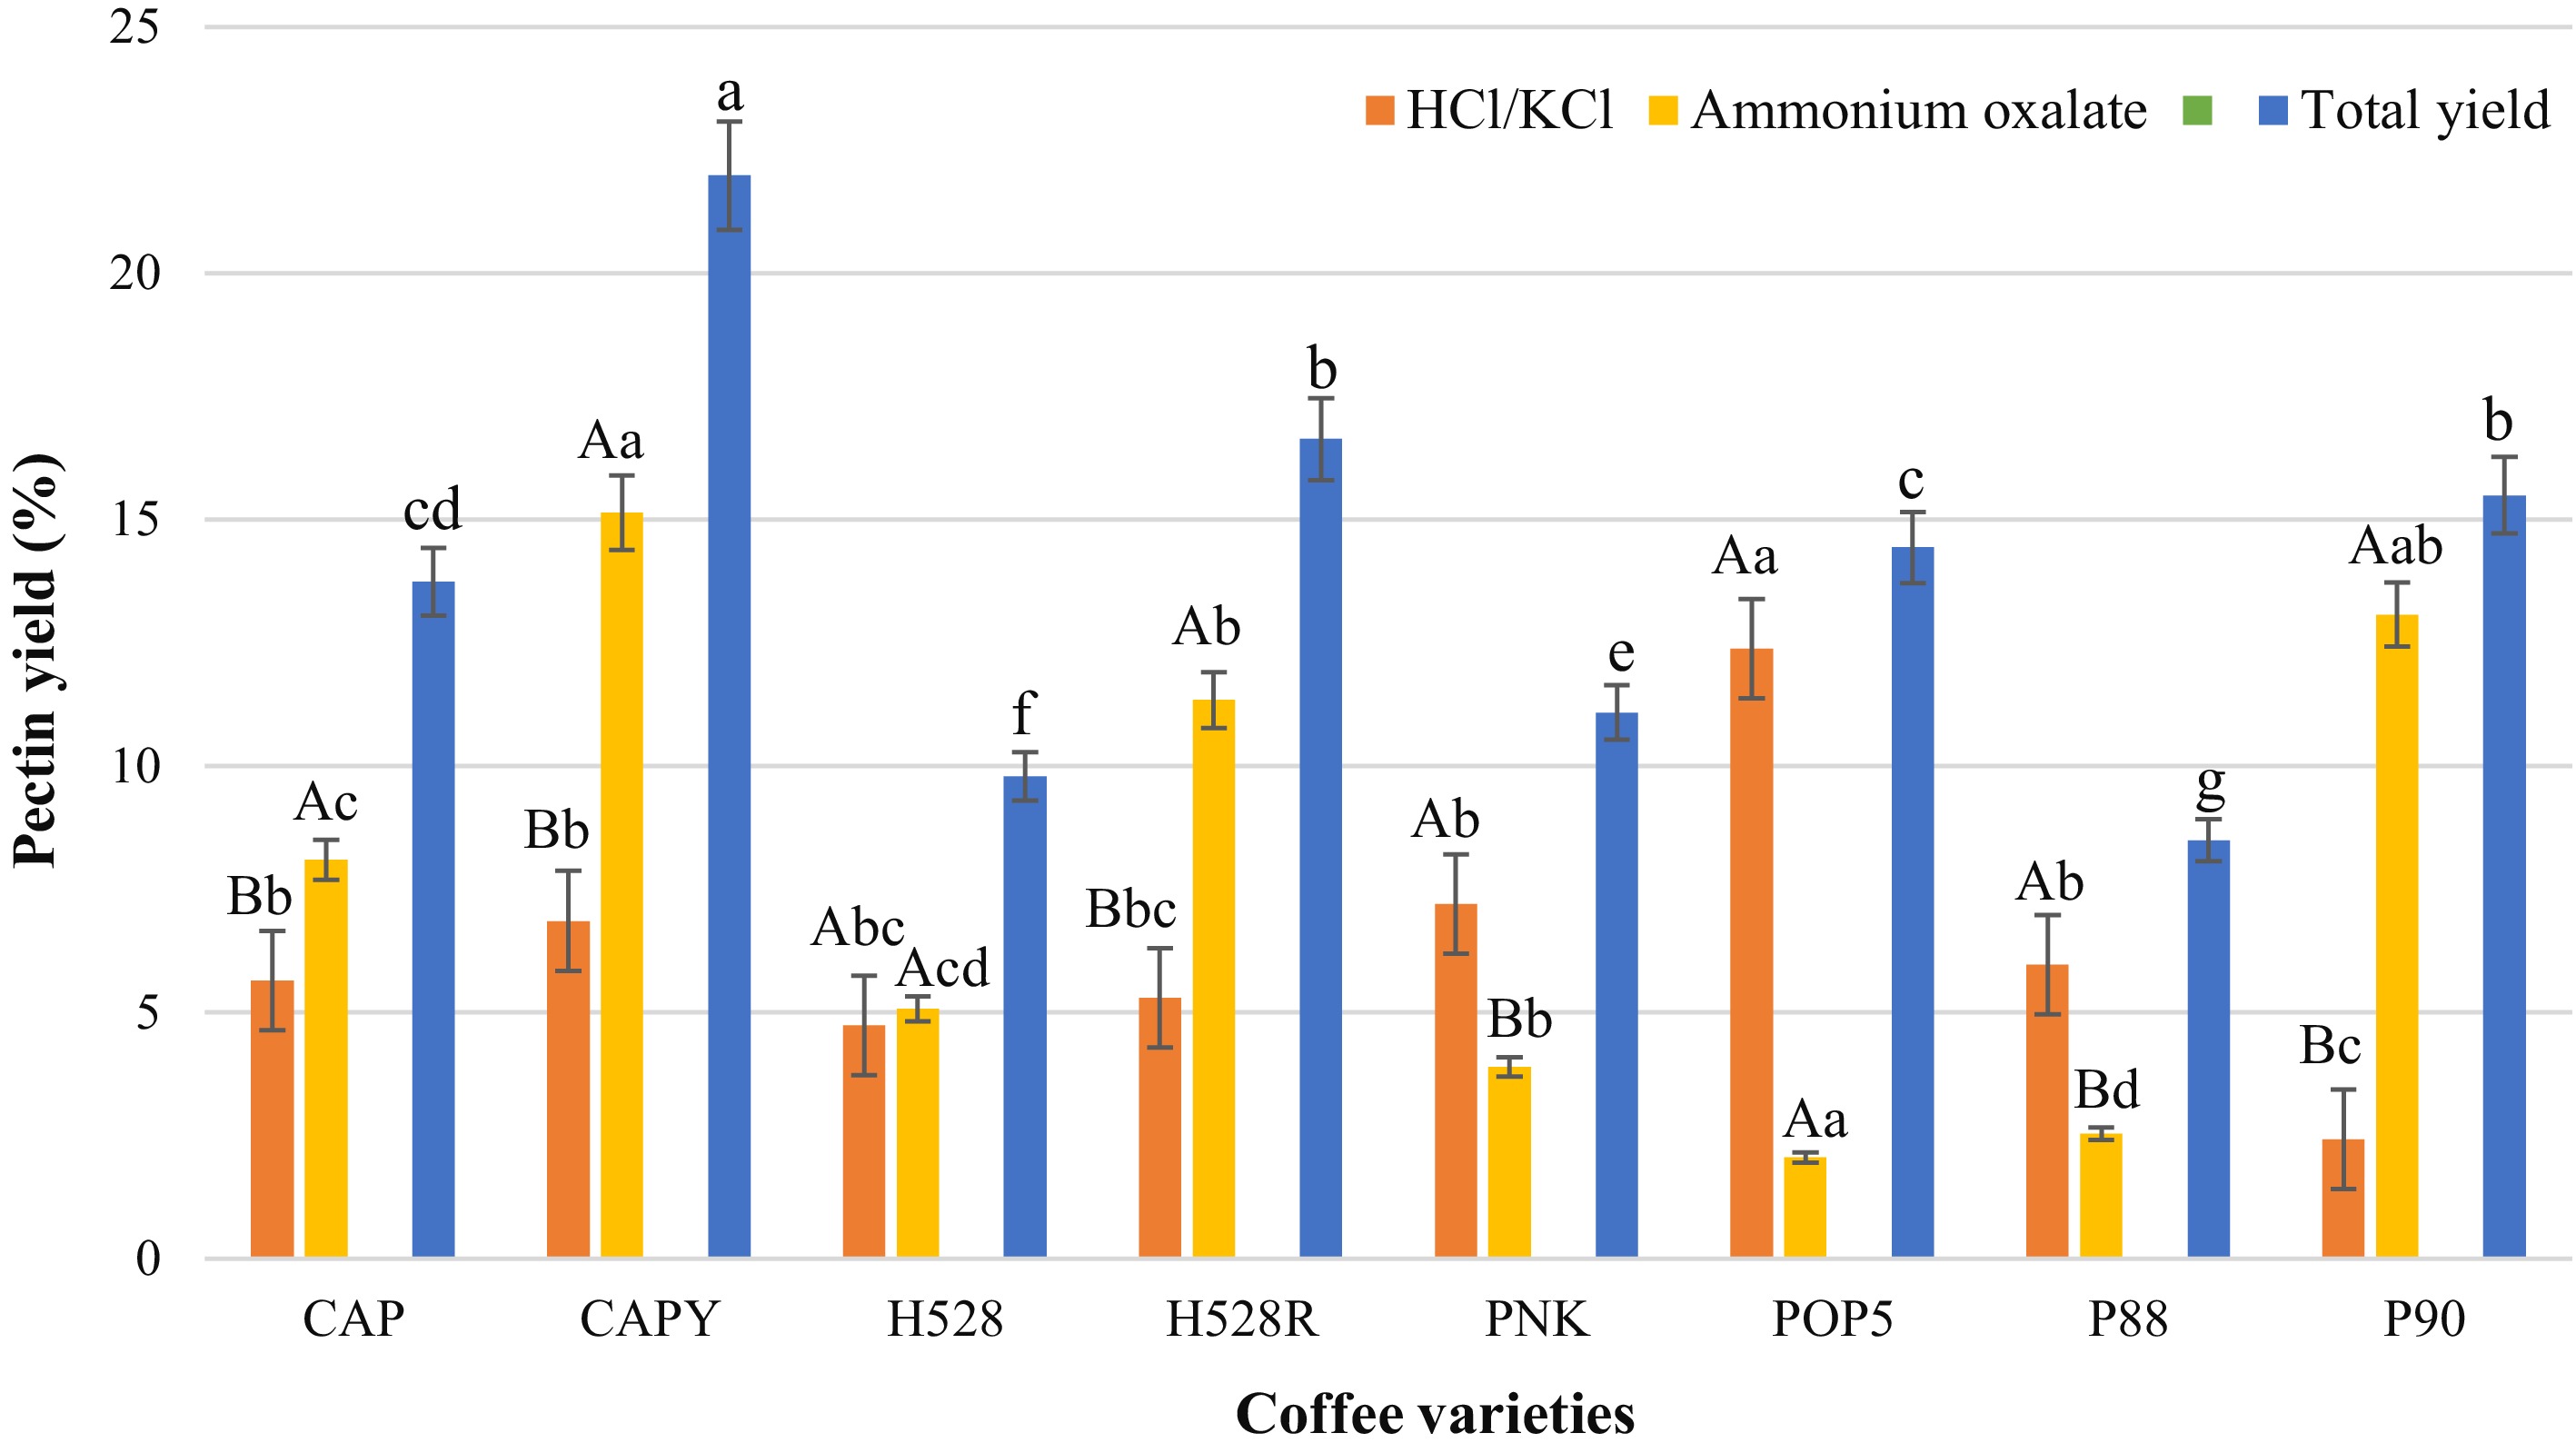
Figure 2.
Pectin content extracted from different CP varieties using HCl/KCl buffer and ammonium oxalate solution. CAP = Catuai, CAPY = Caturra, H528Y = Cartimor H528 Yellow, H528R = Cartimor H528 Red, PNK = Bourbon Phanokkok, POP5 = Cartimor Populacao 5, P88 = Cartimor Progeny 88, P90 = Cartimor Progeny 90. Means labelled with the same letters (uppercase, across different solutions; lowercase, across different coffee varieties), exhibit significant distinction based on Duncan's test. The error bars represent the standard deviation of the mean (p ≤ 0.05).
FTIR profile
-
The chemical characteristics of pectin extracted from eight different varieties of arabica coffee husks using HCl-KCl and ammonium oxalate solutions were analysed using infrared spectroscopy in a region ranging from 500 to 4,000 cm−1 (Fig. 3). The transmittance (%T) patterns for each coffee variety displayed similar profiles in terms of peak position, but showed significant differences in absorbance intensity based on the extraction solution. A prominent band at approximately 3,400 cm−1 was assigned to O-H stretching vibrations, while the weaker absorption at 2,919 cm−1 was attributed to C–H stretching in methylene (CH2) groups[65−67]. Several key functional groups were identified. The presence of ester groups was confirmed by a band at 1,734 cm−1 (C=O stretch)[68,69], and another around 1,312 cm−1 (O-acetyl vibrations). The carboxylate anion (COO−) was identified by its antisymmetric stretching vibration at 1,598 cm−1[70]. Lastly, a distinct peak at 1,412 cm−1 indicated the presence of methyl groups (CH3) within the pectin structure[68]. The presence of these acetyl groups is significant, as they are known to influence pectin's gel formation, viscosity, and solubility[71]. Furthermore, several absorptions in the fingerprint region, including bands at 1,238, 1,230, and 954 cm−1, were allocated to C-O single bond stretching and other skeletal vibrations characteristic of the pectin backbone. The structure of the pectin polysaccharide (polygalacturonic acid) was confirmed by a series of strong absorption bands. Specifically, peaks were observed at 954 cm−1 (C–O bending), 1,008 cm−1 (C–C stretching), 1,116 cm−1 (C–O stretching), and 1,238 cm−1 (C–H stretching)[72,73]. The spectral region from 1,200 and 950 cm−1 is known as the carbohydrate 'fingerprint' region, because it is highly sensitive to variations in sugar composition[74]. Based on the spectrum peaks observed here and elsewhere, these findings confirmed that all CP constituents were pectin.
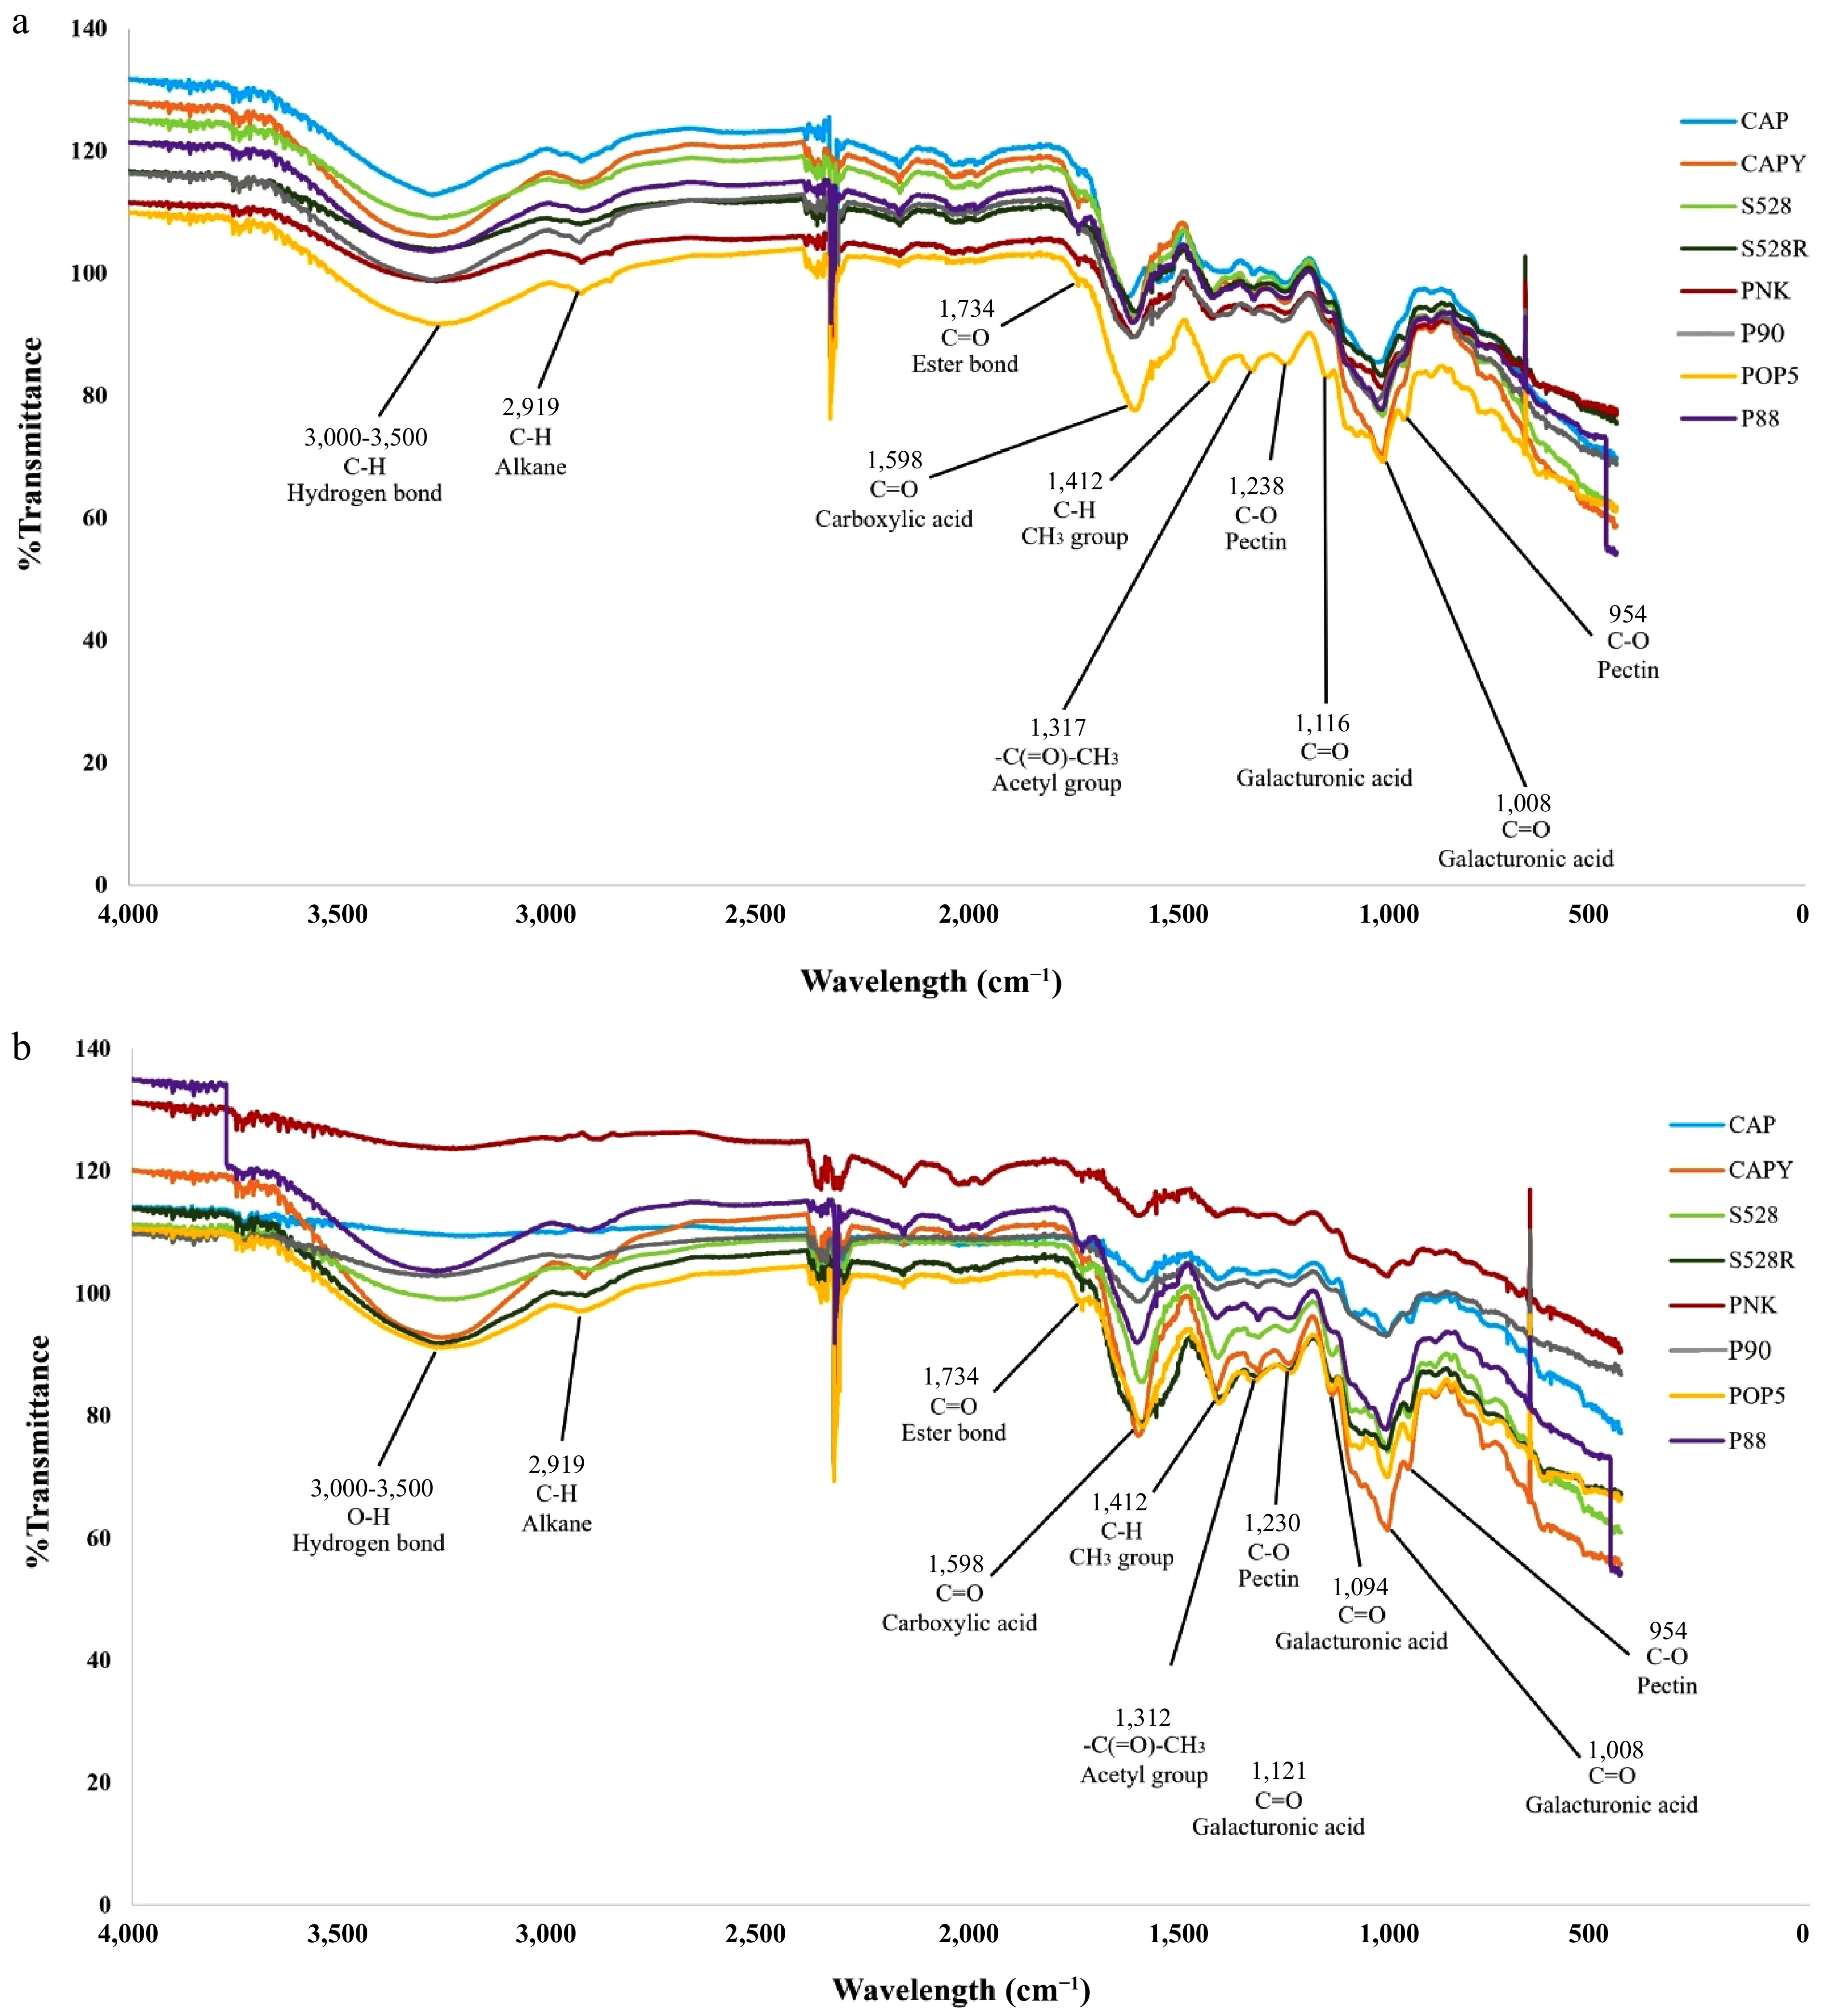
Figure 3.
The FT-IR spectra of pectin obtained from different arabica coffee pulps using (a) HCl-KCl buffer and (b) ammonium oxalate solution, from 4,000 to 500 cm−1 (x-axis). %T presents the transmittance percentage (y-axis). CAP = Catuai, CAPY = Caturra, H528Y = Cartimor H528 Yellow, H528R = Cartimor H528 Red, PNK = Bourbon Phanokkok, POP5 = Cartimor Populacao 5, P88 = Cartimor Progeny 88, P90 = Cartimor Progeny 90.
To understand how different coffee varieties and extraction solutions related to one another, PCA was applied to the FT-IR absorbance data. The resulting variable plot (Fig. 4) shows that PC1 explained 75.62% of the variance, while the second (PC2) showed 9.58%, for a cumulative total of 85.21%. The analysis revealed two main groups of positively correlated samples. The first group, which included AM-P90 and AM-P88, was associated with high-quality attributes. A second group containing other varieties also showed strong internal correlation. Within this latter group, the HCL-H528Y and HCL-P88 samples were positioned as having the highest quality. Pattarapisitporn & Noma[63] reported that the differences in pectin quality across coffee varieties are likely linked to their degree of esterification (DE). This is significant because the chelating agents used for extraction, hydrochloric acid and ammonium oxalate, have been shown to preserve both DE and molecular weight. Chelating agents offer a highly promising and sustainable method for efficiently extracting pectin, yielding a product with customizable physicochemical properties and minimal degradation.
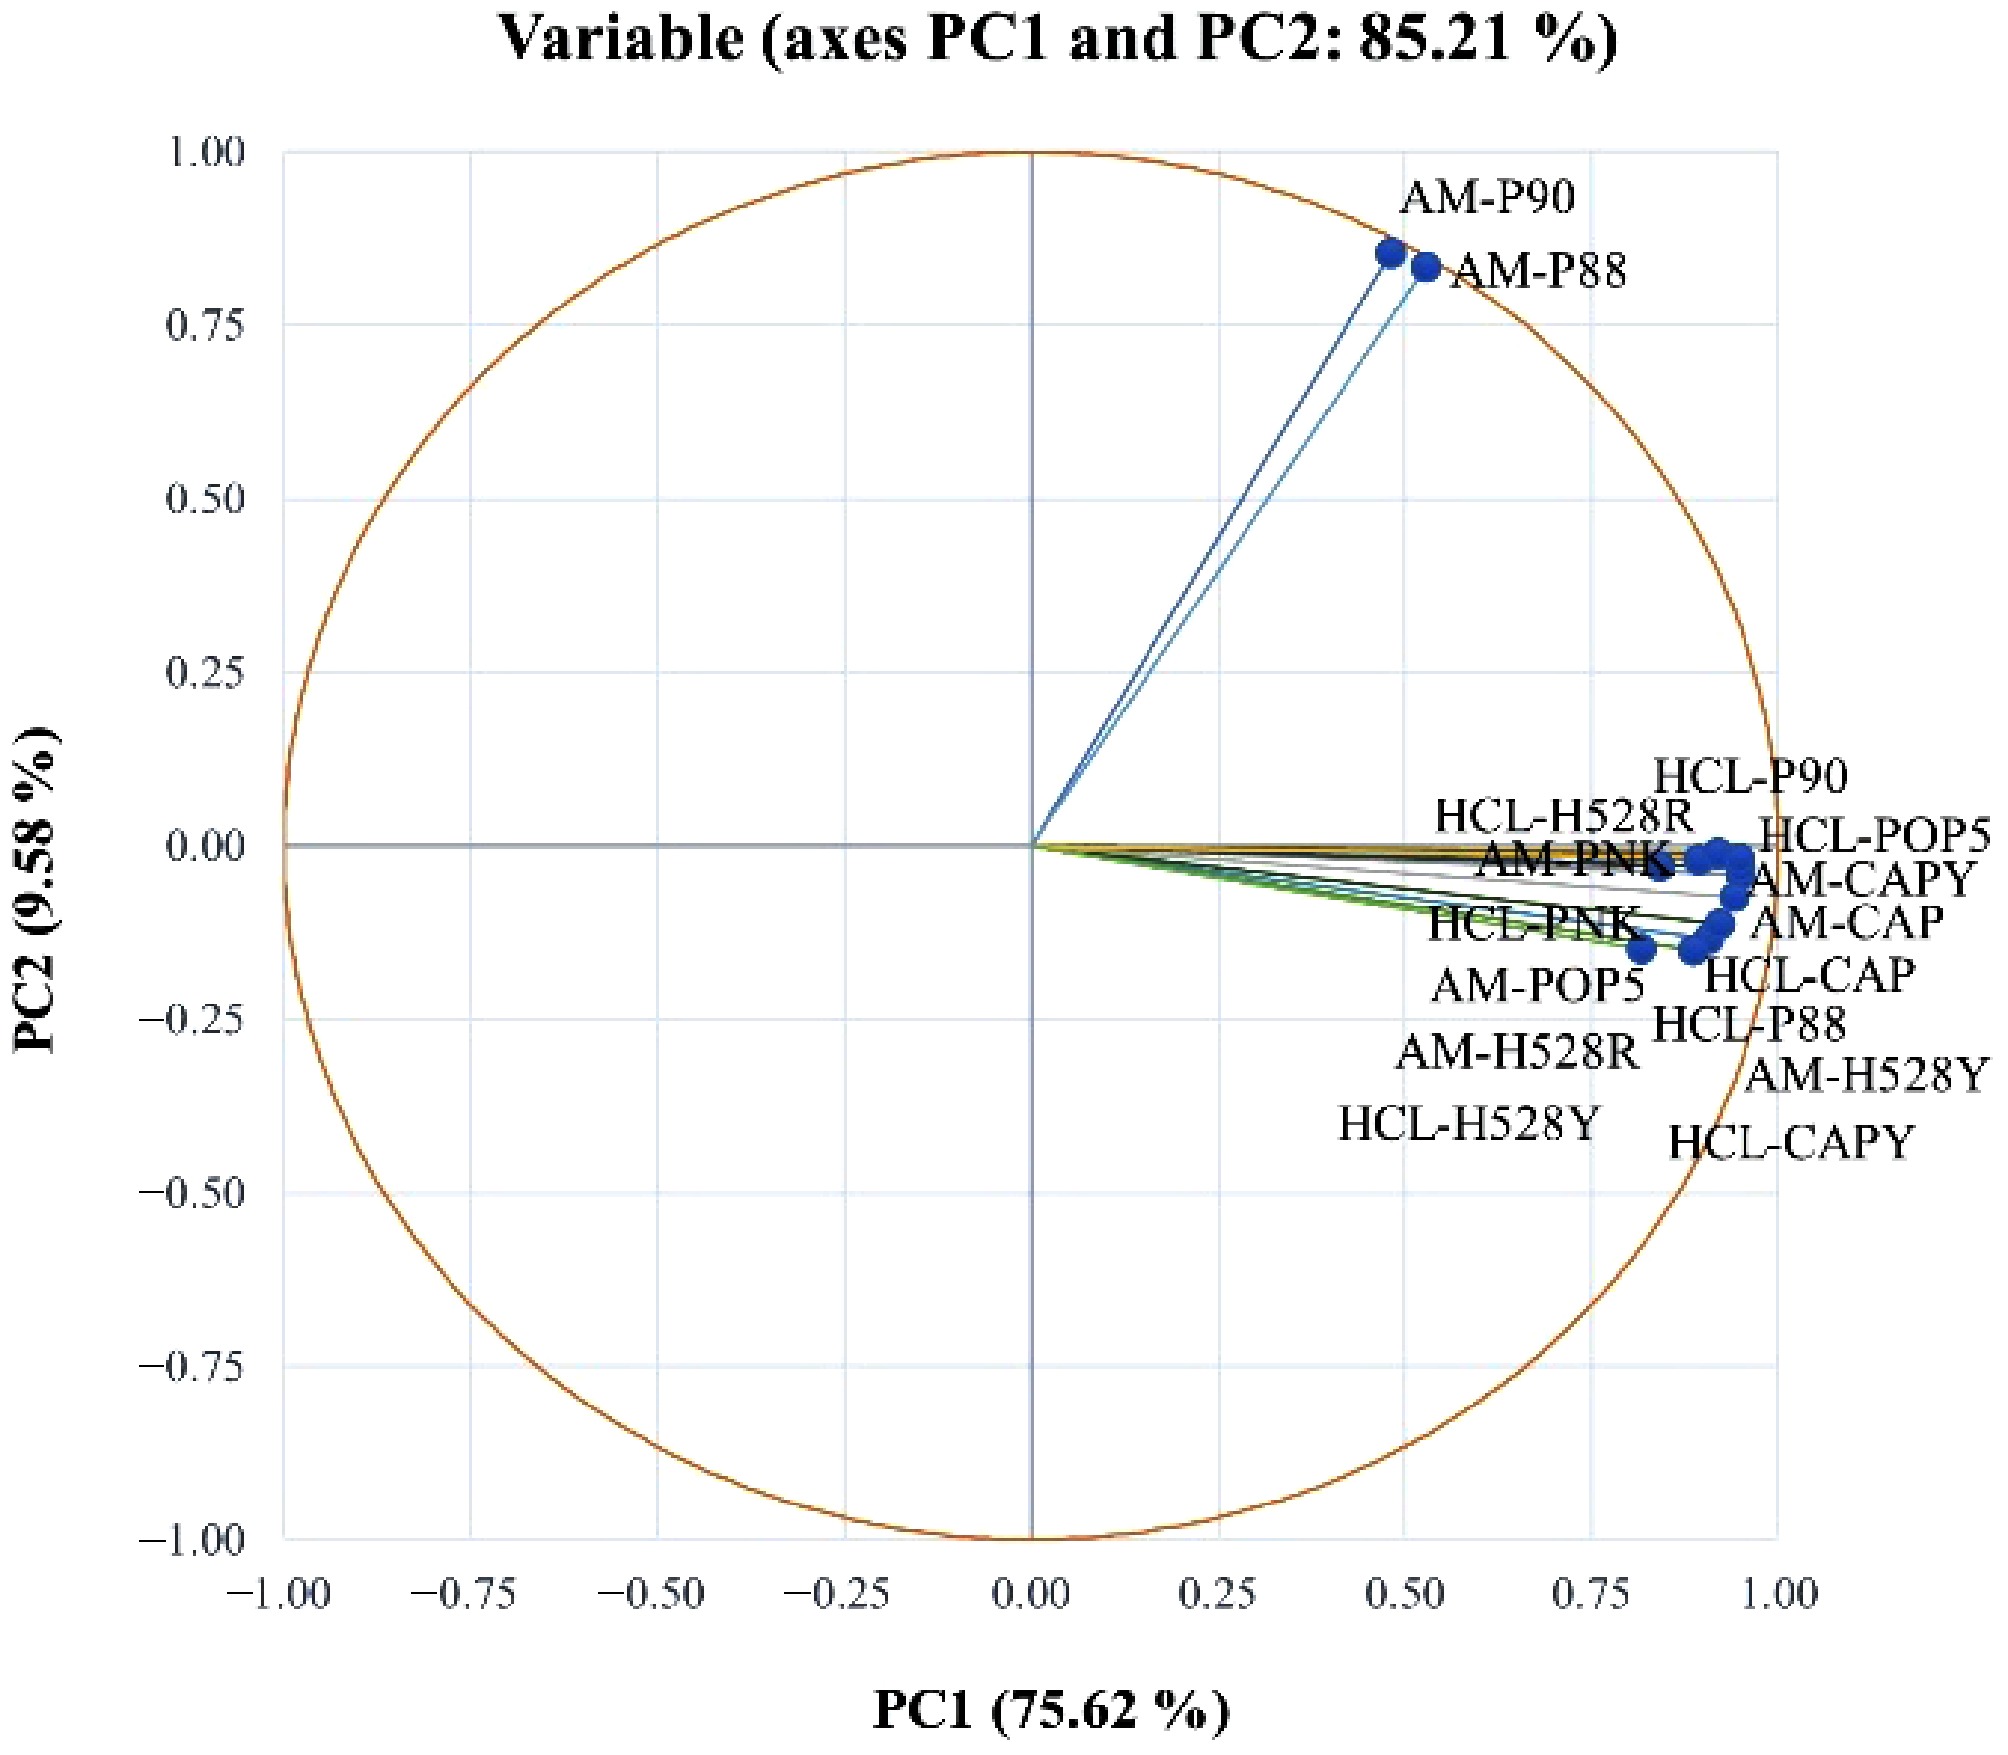
Figure 4.
Principal component analysis of FT-IR spectra of pectin obtained from different arabica CP using HCl-KCl (HCL) and ammonium oxalate (AM). CAP = Catuai, CAPY = Caturra, H528Y = Cartimor H528 Yellow, H528R = Cartimor H528 Red, PNK = Bourbon Phanokkok, POP5 = Cartimor Populacao 5, P88 = Cartimor Progeny 88, P90 = Cartimor Progeny 90.
Degree of esterification (DE)
-
The DE of CP pectin was computed from the FT-IR spectrum using the integrated areas of two key absorbance bands: the ester carbonyl (C=O) stretch at approximately 1,745 cm−1 and the carboxylate anion (COO−) antisymmetric stretch at approximately 1,630 cm−1[75]. As shown in Table 5, the DE for all pectin samples exceeded 50%, which were classified as HMP. A key characteristic of this pectin is its capacity to create a gel network via a combination of hydrogen bridges and hydrophobic interactions among its methoxyl groups[76]. Gel formation with this type of pectin requires specific conditions: a low pH (between 2.0 and 3.5) and a high concentration of sugar (above 60%)[77]. A comparison of the HCl/KCl and ammonium oxalate extraction methods revealed no statistically significant difference in the resulting DE values for any of the coffee varieties. This finding is noteworthy because both methods effectively preserve the DE, which aligns with previous research showing that chelating agents like ammonium oxalate and hydrochloric acid can maintain pectin's DE and molecular weight during extraction[63]. Conversely, the DE values differed significantly among the various coffee varieties under both extraction methods. These findings align with previous research, such as the 63.2% DE value for coffee pectin reported by Reichembach et al.[17] and the 53% to 68.5% range found by Biratu et al.[18]. Ultimately, these results demonstrate that pectin content and features, particularly the DE, depend heavily on the coffee variety, its origin, and the extraction technique. These findings confirm that arabica coffee is a promising source of high-grade pectin for food applications and simultaneously emphasize the importance of refining extraction techniques to improve product quality. Pectin can also have diverse applications, including its use in industrial materials like edible films, adhesives, paper substitutes, foams, and plasticisers. It is also valuable in the biomedical field for drug delivery, implants, and as a surface modifier for medical devices[78].
Table 5. Degree of esterification of different arabica coffee pulp pectins using HCl-KCl buffer and ammonium oxalate solutions.
Coffee varieties Degree of esterification (%) HCl-KCl Ammonium oxalate CAP* 54.30 ± 0.59ab 50.95 ± 0.14e CAPY* 53.28 ± 0.54cd 55.74 ± 0.19a H528Y* 53.68 ± 0.24bc 53.07 ± 0.10c H528R* 52.60 ± 0.21de 55.76 ± 0.17a PNK* 52.65 ± 0.10de 51.03 ± 0.13e POP5* 54.82 ± 0.22a 53.74 ± 0.28b P88* 52.81 ± 0.28de 53.22 ± 0.18c P90* 54.23 ± 0.23ab 51.96 ± 0.22d * There is no statistically significant difference within the same row using pair sample t-test analysis. a–e Different letters in the same column indicate significant differences (p ≤ 0.05) between means (one-way ANOVA and Duncan's multiple range test). CAP = Catuai, CAPY = Caturra, H528Y = Cartimor H528 Yellow, H528R = Cartimor H528 Red, PNK = Bourbon Phanokkok, POP5 = Cartimor Populacao 5, P88 = Cartimor Progeny 88, P90 = Cartimor Progeny 90. To further understand the relationship between different arabica coffee varieties and their corresponding chemical, phytochemical, and pectin characteristics, we then utilised the heatmap to categorise all data as presented in Fig. 5. The analysis revealed three distinct clusters. The first cluster comprised samples H528R (Cartimor) and CAPY (Caturra). The second cluster contained PNK (Bourbon), H528Y (Cartimor), CAP (Catuai), P90 (Cartimor), and POP5 (Cartimor). The third cluster consisted solely of sample P88 (Cartimor). The findings suggest that the chemical, phytochemical, and pectin profiles of arabica coffee pulps are not determined solely by their variety. Instead, these characteristics are likely shaped by various parameters, such as the genetic diversity of hybrid cultivars and the significant influence of plantation conditions and environmental factors[79]. A study by Biratu et al.[18] also found that for arabica coffee pulp sourced from four different producing regions, the pectin yield and its physicochemical properties depended on the extraction parameters, acid type, and coffee variety.
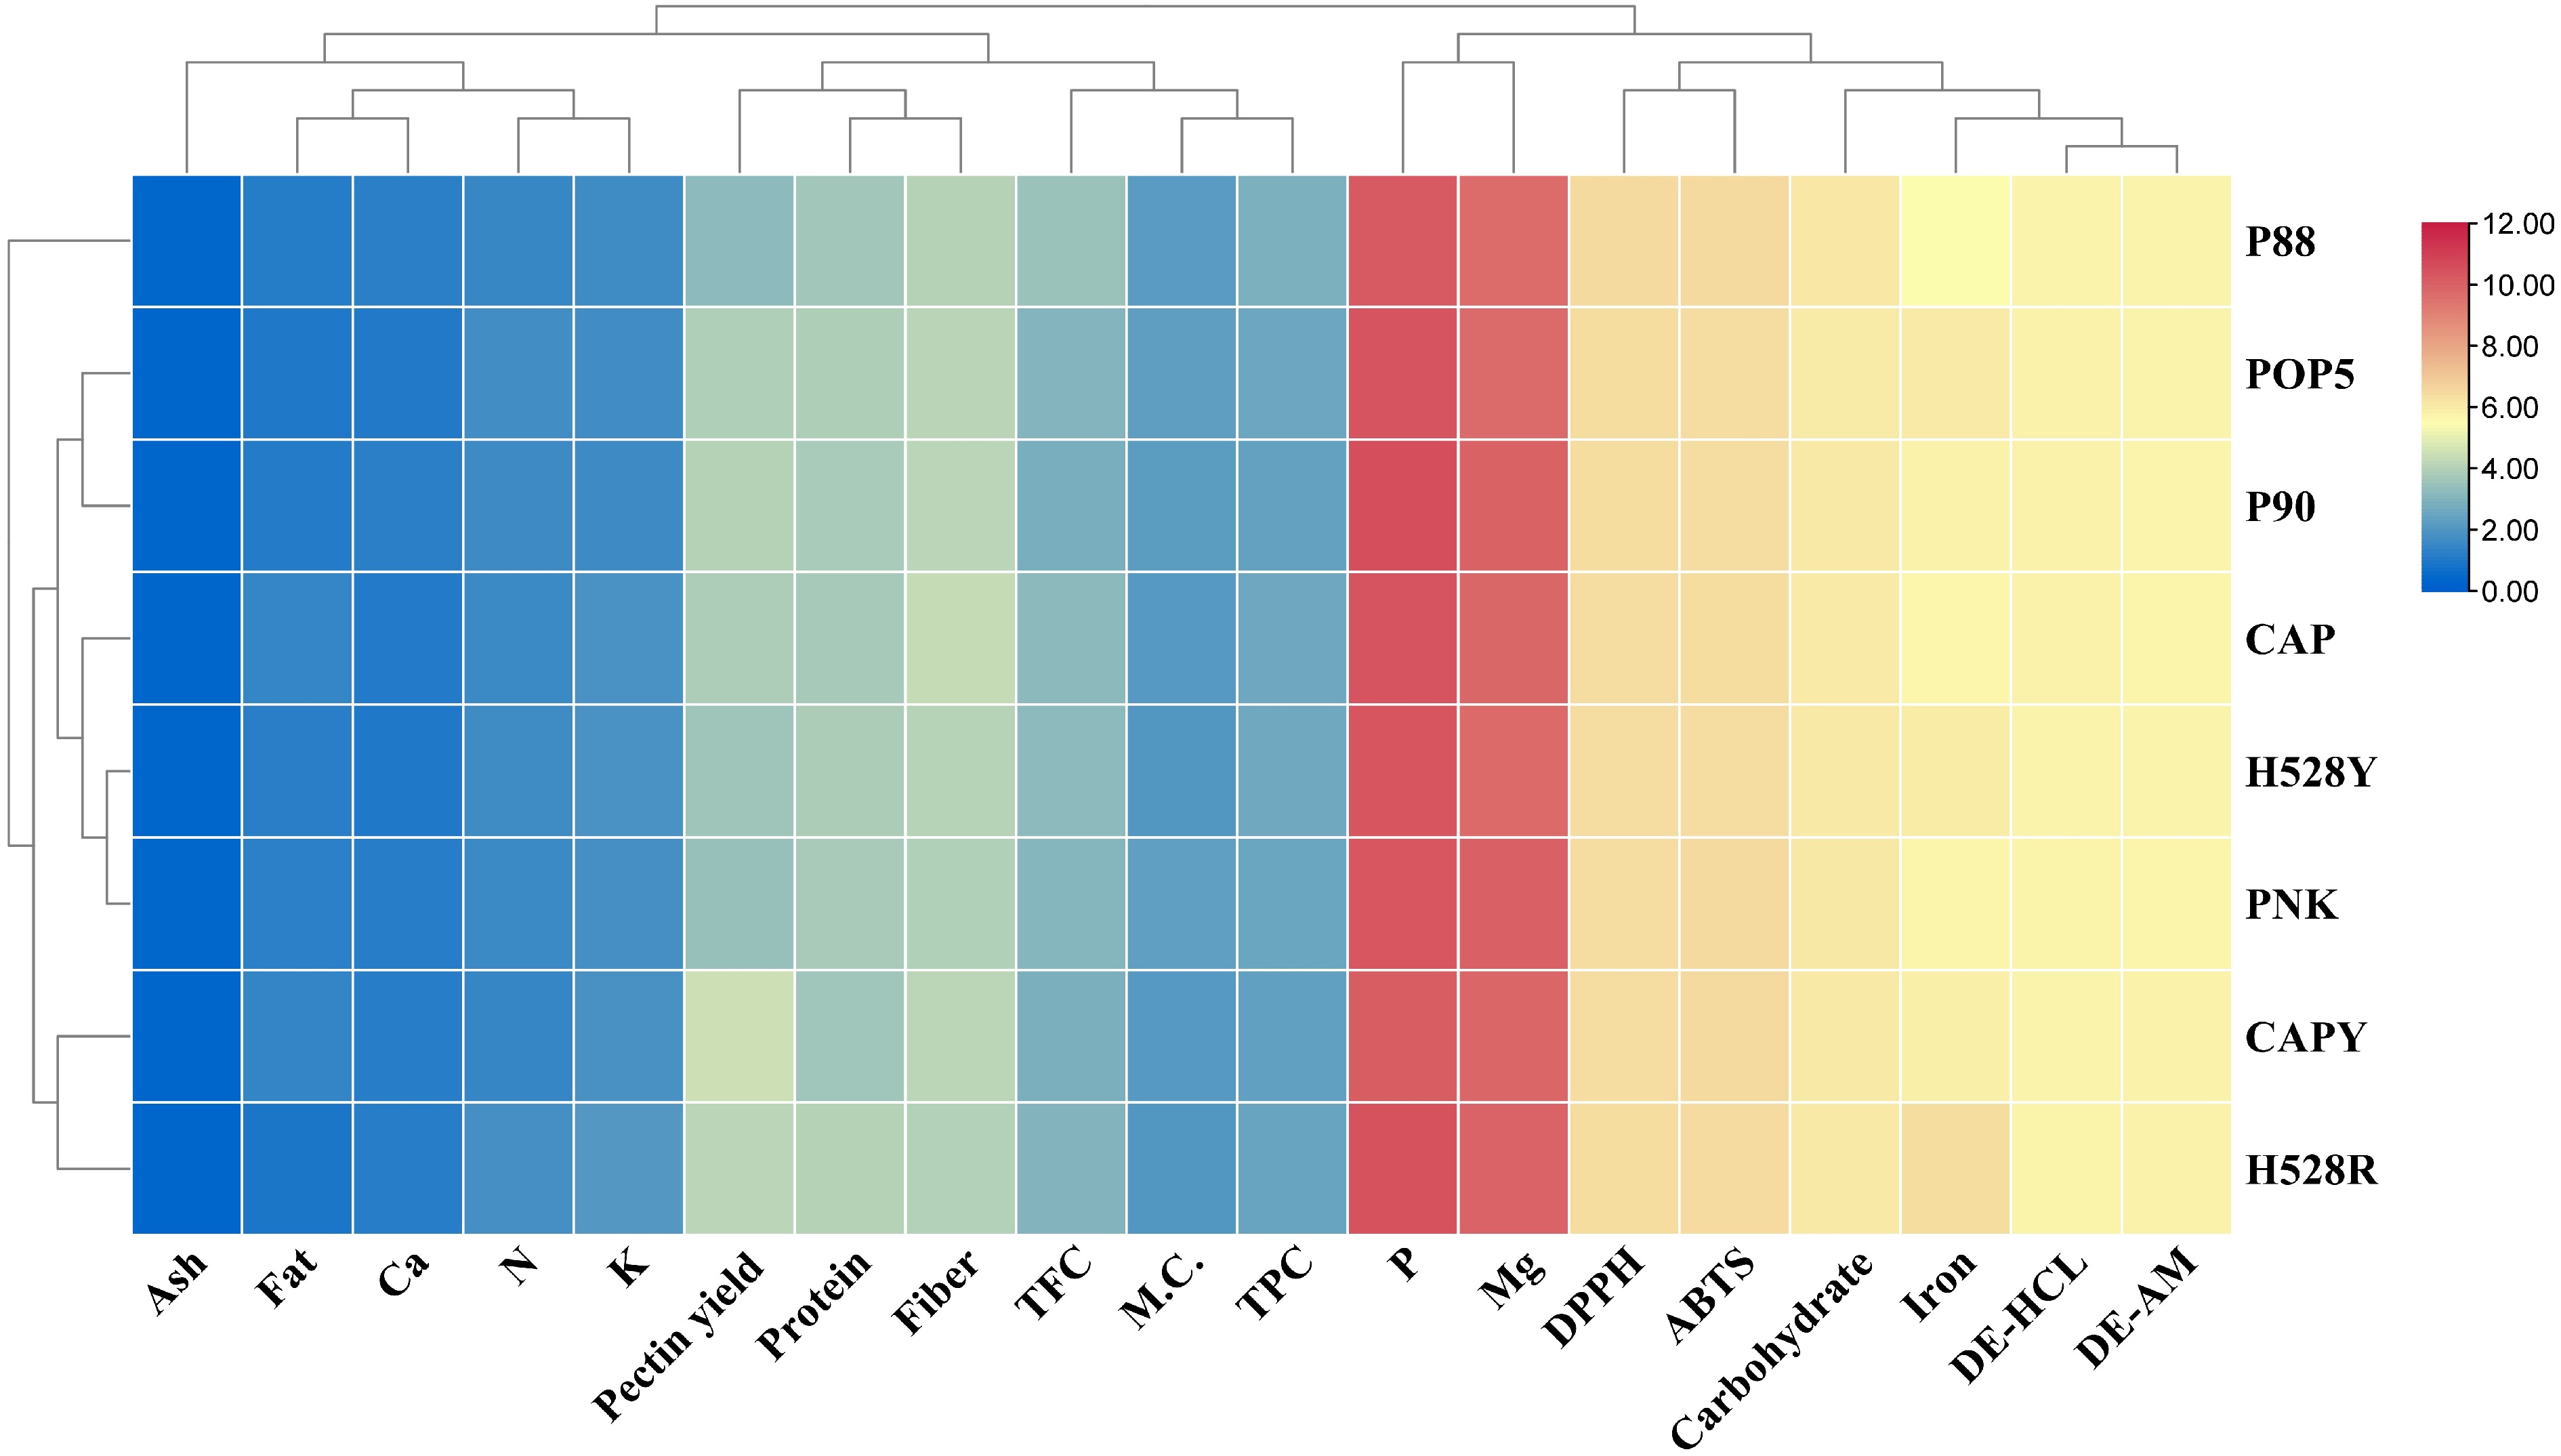
Figure 5.
Heat map illustrates the clustering of different arabica coffee pulps according to their chemical compositions, phytochemical profiles, and pectin characteristics. CAP = Catuai, CAPY = Caturra, H528Y = Cartimor H528 Yellow, H528R = Cartimor H528 Red, PNK = Bourbon Phanokkok, POP5 = Cartimor Populacao 5, P88 = Cartimor Progeny 88, P90 = Cartimor Progeny 90, M.C. = Moisture, TFC = Total flavonoid compound, content, TPC = Total phenolic compound, DE-HCL = DE of pectin obtained from HCl/KCl extraction, DE-AM = DE of pectin obtained from ammonium oxalate extraction.
-
To address the knowledge gap surrounding the phytochemical compositions in diverse varieties of northern Thai arabica coffee biomass, this study confirmed that coffee pulp is predominantly composed of carbohydrates, crude fibre, and protein. Among the cultivars analysed, Catimor progeny 88 (P88) was identified as a superior source of phytochemicals, with the maximum content of total phenolics (TPC), and flavonoids (TFC) correlating to the strongest antioxidant capacity. In terms of mineral content, the Catimor H528R, Bourbon Phanokkok (PNK), and Catimor progeny 90 (P90) varieties were notably rich in phosphorus, magnesium, and potassium. All extracted pectins were classified as HMP, with a degree of esterification exceeding 50%; however, the extraction method impacted yield, with ammonium oxalate proving more efficient than an HCl/KCl buffer. These findings are crucial for developing sustainable practices in the coffee processing industry. This enables the upcycling of arabica coffee byproducts into valuable materials for diverse applications, including as ingredients in food and cosmetics, or as pharmaceutical drug carriers, providing a significant boost to the local agricultural economy. Future work should focus on optimising extraction techniques and pilot-testing these variety-specific pulps and pectin in commercial food and pharmaceutical formulations.
-
Ethical approval was not required for this study, as it did not use human participants, animal subjects, or identifiable personal data.
-
The authors confirm their contributions to the paper as follows: conceptualisation, project administration: Sommano SR; methodology: Bunyarit T, Huanhong K, Tangpao T, Sunanta P, Muangsanguan A, Ruksiriwanich W; investigation: Bunyarit T, Huanhong K, Tangpao T, Sangta J, Muangsanguan A, Ruksiriwanich W; formal analysis: Bunyarit T, Sunanta P, Sangta J, Muangsanguan A; data curation: Wongkaew M; writing – original draft preparation: Bunyarit T, Huanhong K, Wongkaew M; writing-review and editing: Prasad SK, Sommano SR, Wongkaew M. All authors reviewed the results and approved the final version of the manuscript.
-
The datasets generated during and/or analyzed during the current study are available from the corresponding author on reasonable request.
-
We are grateful to the Faculty of Agriculture at Chiang Mai University for providing access to the necessary research facilities. This work was also partially supported by a grant from Chiang Mai University.
-
The authors declare that they have no conflict of interest.
- Copyright: © 2025 by the author(s). Published by Maximum Academic Press, Fayetteville, GA. This article is an open access article distributed under Creative Commons Attribution License (CC BY 4.0), visit https://creativecommons.org/licenses/by/4.0/.
-
About this article
Cite this article
Bunyarit T, Huanhong K, Tangpao T, Sunanta P, Sangta J, et al. 2025. Exploring value-adding components from different varieties of arabica coffee pulps for sustainable resource utilisation. Circular Agricultural Systems 5: e011 doi: 10.48130/cas-0025-0009 

Exploring value-adding components from different varieties of arabica coffee pulps for sustainable resource utilisation
- Received: 06 August 2025
- Revised: 16 August 2025
- Accepted: 18 August 2025
- Published online: 15 September 2025
Abstract: Coffee processing produces substantial agricultural byproducts, notably pulp, which is known to harbour valuable bioactive compounds. Nevertheless, a considerable knowledge gap remains concerning the phyto-compositions of the extracts from the diverse arabica varieties grown in northern Thailand. This study aimed to characterise value-adding components from the pulps of eight arabica coffee varieties by assessing their proximate compositions, phytochemical profiles, and mineral contents. Subsequently, the pectin characterisation was evaluated. Coffee pulp's primary constituents are carbohydrates, crude fibre, and protein, with a relatively low-fat and ash content. Specifically, the Catimor progeny P88 (P88) variety had the highest carbohydrate content (67.77% ± 0.09), while Catuai had the highest crude fibre (19.42% ± 0.41), and Catimor H528R (H528R) contained the maximum protein (15.41% ± 0.22). The P88 variety also proved to be a superior source of phytochemicals, exhibiting the highest levels of total phenolics (6.41 ± 0.04 mgGAE/gDW) and flavonoids (10.28 ± 1.14 mgCE/gDW), which corresponded to the strongest antioxidant activity in DPPH (88.81% ± 1.22), and ABTS (88.80% ± 0.00) assays. In terms of mineral content, the H528R, Bourbon Phanokkok, and Catimor progeny 90 varieties showed the highest overall levels, suggesting they are good sources of phosphorus, magnesium, and potassium. Analysis of the extracted pectin revealed that all samples were high-methoxyl pectin, with a degree of esterification (DE) exceeding 50%. The findings of this study indicate that arabica coffee pulp is an abundant source of beneficial bioactive substances and shows promise as a raw material for producing high-grade pectin for food manufacturing. These results represent an initial step toward valorisation, with further research required to explore potential applications and commercial uses.
-
Key words:
- Bioactive compound /
- Coffee biomass /
- Degree of esterification /
- Pectin /
- Polyphenols /
- Up-cycling by-product