


-
Accessibility to flexible transportation for persons with disabilities is currently a developing field. It can be very challenging for persons with disabilities, especially block-to-block movements when the distance is too long to walk and too short to drive. While persons without disabilities can choose whether to walk, bike, use scooters, or use skateboards over short distances, the disabled population is underserved in available transportation options[1,2]. Given the type of disability, persons with disabilities can be restricted to specific transportation modes such as walking or wheelchairs where infrastructure permits[3,4]. Public transportation is essential for most of this population[1,3,5]. Persons with disabilities have different transportation needs, even within the group. However, driver behavior is a common problem[6,7]. Fixed routes, public right of way, private taxicabs, flex service, and other nontraditional transit services are the primary ways transportation barriers in public transit can occur[8]. Barriers to transportation among persons with disabilities create a transportation inequality problem between persons with disabilities and those without disabilities.
Autonomous vehicle technology can address the existing transportation barriers by expanding transportation options among persons with disabilities[1]. The new technology provides room to improve transportation services among persons with disabilities because it can promote transportation justice by providing door-to-door transportation services[9−11]. It will also increase transportation independence among persons with disabilities[12]. However, how traditional transportation mediums and individuals would interact with autonomous vehicles is unknown. Specifically, how active transportation will perceive, interact, and behave with autonomous vehicles remains nebulous.
This study, therefore, intends to narrow the literature gap on this issue. The study focuses on understanding college students' perception of the autonomous shuttles on the walkways. Specifically, the study intends to understand how students perceive the service to people with disabilities and perceived risk when sharing the walkway with the shuttle. It is hypothesized that direct interaction with the shuttle would make a difference in terms of the risk but not in the service rendered by the shuttle. Several demographic factors are also considered for upscaled shuttle operations on other campuses. The study findings are expected to open opportunities for more testing of the service on other campuses to improve the movements of people with disabilities within campuses.
The remainder of the manuscript is arranged as follows: The literature review summarizing previous work on the perception of autonomous vehicle adoption, their acceptance by people with disabilities, and factors that increased positive perception towards adopting autonomous technology. Next is the description of the material and methods used in achieving the study's objective, in which the data description and analytical analysis are explained. It is followed by a results and discussion section whereby a summary of results from the analysis is performed; namely, the Bayesian ordered logit model and the text network analysis are presented. A detailed discussion of the results and their interpretation is also presented. The conclusion section concludes and summarizes the main observation of the study and also documents some study limitations, and highlights areas for future research. Lastly, the data availability statement and list of references are presented.
-
Due to its benefits on the traffic stream, autonomous vehicle technology in the form of first/last mile shuttles is getting more attention from researchers and practitioners in providing mobility for persons with disabilities[13,14]. Post-alterations to the conventional vehicle are necessary for a person with disabilities to own an accessible vehicle privately. These alterations, in turn, increase the final price of the vehicle compared to unaltered. Associated low income among persons with travel-limiting disabilities might be an obstacle to owning these vehicles privately. Furthermore, no automobile manufacturer manufactures accessible vehicles for the disabled market massively[1]. Research shows that the technology will provide mobility solutions to persons with disabilities by giving door-to-door services that promote transportation justice[9−11]. Also, people with disabilities usually depend on other people's assistance. Autonomous vehicles are expected to increase their independence[12]. The needless driver in autonomous shuttles makes them suitable options for persons with disabilities[1,15]. Hence, reducing the driver's attitude problem is commonly reported to hinder the use of public transportation by persons with travel-limiting disabilities[6,7].
Autonomous shuttles can address problems faced by persons with disabilities using public transportation services. For example, Mobility on Demand is a transportation service that is possible with autonomous shuttles[16−18]. Comfort and increased independence are among a few benefits directly addressing the needs of persons with disabilities[11,19,20]. Literature shows that using autonomous vehicles to provide transportation services to persons with disabilities is getting some acceptance from persons with disabilities[13,14,21].
A survey of people to study their willingness to use autonomous vehicles has been a widely used data collection tool in studying factors that impact people's perception and acceptance of autonomous vehicles[14,19,21−24]. Research by Jinuk & Hwang[21] studied the perception of persons with disabilities on autonomous vehicles as a viable transportation option for mobility. It revealed that persons with disabilities were more accepting of autonomous vehicle transportation. More than 70% believed that autonomous vehicle transportation would solve the transportation problem faced by persons with disabilities and meet their travel needs[21]. In another study, about 15% of occasional public transit riders were willing to ride autonomous buses[14].
Some preliminary evidence suggests variations in the public perception of autonomous vehicle technology. Payre et al. found a positive attitude toward adopting autonomous vehicles, whereas Haboucha et al. reported a great hesitation towards autonomous vehicle adoption. In the latter investigation, about 25% said they hesitated to travel with an autonomous vehicle even if the services were free[23,25]. Perceived usefulness, perceived safety risks, perceived ease of use, perceived private risks, initial trust, performance expectancy, users' enjoyment, and social influence are some factors that increased the positive attitude toward automated vehicles[24,26−28]. A study by Zhang et al. established that the initial trust is enhanced by improving the perceived usefulness and reducing the perceived safety risks. However, people with disabilities were not considered in most of these studies[28].
Furthermore, a significant number of the existing studies depend on the perceived perception of people who, in one way or another, have limited or absent experience with autonomous vehicles[23]. However, even for the few studies that investigate the interaction of pedestrians and AVs, they do so by testing an AV operating on the roadway; thus, the interaction studied is that when the pedestrian is crossing the road and not on any other areas such as pedestrian walkways[29]. There is a significant research gap evaluating a large group of non-users. Additionally, to the authors' knowledge, none of the previous studies have assessed the interaction of autonomous shuttles with pedestrians on pedestrian walkways. Due to the block-to-block type of transportation services to persons with disabilities, interaction with pedestrians is highly expected and unavoidable. Understanding how the public sympathizes with people with disabilities concerning the need for suitable and effective transportation, the usefulness of these shuttles', safety, comfort, and other factors is a critical research need to advance the technology. This research aimed to close the existing gap by analyzing people's perceptions of the usefulness and safety of the autonomous shuttle with an actual interaction with the shuttle. It also bridges the existing gap on the usefulness of the shuttle services for people with disabilities.
Consideration of AVs for people with disabilities in campus settings is challenging. While the public might not be willing to share the sidewalk with AVs, their feelings towards the improved mobilities for people with disabilities may change their stand. However, to this point, scarce studies that evaluated such a possibility are available. Furthermore, reasons for people's perceptions of AV operations may differ significantly. With such a great variation, predefined responses make it difficult to capture many reasons. This scenario makes the case for the application of open-ended responses. The next section presents the materials and methods applied in this study.
-
This section presents the materials and methods used in this study. It covers data description, which shows how the data was collected, and analytical approaches, which show the applied methods to analyze the data.
Data description
-
This study used an observational survey conducted from November 1st to December 31st, 2019, among college students to understand their sympathy concerning the need for transportation services specifically for students with disabilities and to investigate the safety of the shuttle operating on pedestrian walkways. This shuttle was designed by researchers from Pratt and Miller Engineering, Western Michigan University (WMU), Comet Mobility, the University of Michigan, Easterseals, and Kevadiya (WMU, 2019). It specifically operated on pedestrian walkways to provide transportation services for students with disabilities from the campus's main bus stop to different classroom blocks. It ran on campus for 11 d from October 21st to November 1st, 2019. The survey collected perceptions from two groups of pedestrians. One group interacted with the shuttle, and the other did not interact with the shuttle.
Since the shuttle operated on the WMU campus, only WMU students/members could participate in this study. The consistency within interaction and exposure of AV among participants allowed for a single perception assessment survey and legitimate aggregations and comparisons of perceptions. The survey was in English, and the team shared a blind link with participants via email. All participants must complete the survey individually and avoid undue coercion; no identifying information was collected. Participants were supposed to select either of the following responses: not at all, a little, a moderate amount, a lot, and a great deal.
● How do you compare the risk posed by an autonomous shuttle operating on a pedestrian walkway to that of a bicycle?
● How much sympathy did you feel for students with accessibility needs on campus who used this autonomous vehicle service?
Further, respondents were supposed to rank their perceived risk of AV.
● On a scale of 1−5, where one represents not at all and five represents very high, what level of safety risk does an autonomous vehicle on pedestrian walkways on campus pose to you?
In addition to the age, gender, and ethnicity of participants, respondents were also provided with a section to express their open-ended views. The question stated that.
● Please share your thoughts on how you feel regarding potentially having a fleet of such autonomous vehicles operating on campus.
Analytical approach
-
The Bayesian Ordered Logit Model and Test Network Analysis (TNA) were used to quantify how different demographic factors impact respondents' likelihood of perceptions and perceptions of sympathy and risk related to using autonomous shuttles on campus for students with disabilities.
Bayesian ordered logit model
-
Due to the limited time of data collection, the number of responses collected was relatively low (N = 396), which, upon further cleaning, declined to N = 310. With such a small sample size, Bayesian analysis performs better than traditional frequentist analysis[30,31]. Thus, this study applied a Bayesian approach to analyze the collected data.
Further, due to the ordinal nature of the responses collected, an ordered logistic regression was performed to investigate factors associated with the differences in the likelihood of pedestrians' perceptions[32]. For an ordinal outcome variable with N number of categories of the ordinal dependent variable, the generalized ordered logistic model is expressed as Eqn (1);
$ P\left(Yi \gt j\right)=\dfrac{exp({\alpha }_{j}+{X}_{i}{\beta }_{j})}{1+\left[exp({\alpha }_{j}+{X}_{i}{\beta }_{j})\right]} ,\;\; j = 1,2,3,...N-1 $ (1) The probability that Y will fall under any of the values 1 to N is given by Eqns (2)−(4):
$ P\left(Yi=1\right)= 1-g\left({X}_{i}{\beta }_{j}\right) $ (2) $ P\left(Yi=j\right)=g\left({X}_{i}{\beta }_{j-1}\right)-g\left({X}_{i}{\beta }_{j}\right) , \;\;j = 2,3,...N-1 $ (3) $ P\left(Yi=1\right)g\left({X}_{i}{\beta }_{N-1}\right) $ (4) In the Bayesian approach, priors must consider what is already known. Since no study has analyzed similar data to answer the questions, weakly informative priors (Normal (0,10)) were used[33]. The analysis was performed in the R environment using the brms package[34]. The analysis was performed in four chains with 200 iterations during warm-up and 4000 iterations post-warm-up.
The results are interpreted based on the estimates and credible intervals. Positive estimates are associated with higher ranking, while the opposite is true for negative estimates. Credible intervals are used to determine the credibility of the results[33,35].
In addition to the Bayesian Ordered Logit model, the open-ended responses provided an opportunity to understand why students either support or oppose the operation of autonomous shuttles.
Text Network Analysis (TNA)
-
Open-ended responses were used to understand the reasons for supporting or opposing the autonomous shuttle's operation. The TNA utilized nodes and arcs to expose the hidden pattern of keywords and connections among them[36−38]. Figure 1 presents a typical structure of the text network. The nodes represent keywords in this figure, while the links indicate co-occurrence. The distance between two nodes corresponds to the distance between keywords in the open-ended response. Keywords that appear next to each other are called collocated keywords and provide richer insights than co-occurring or single keywords. Furthermore, several keywords with similar themes are grouped to form a community[39,40].
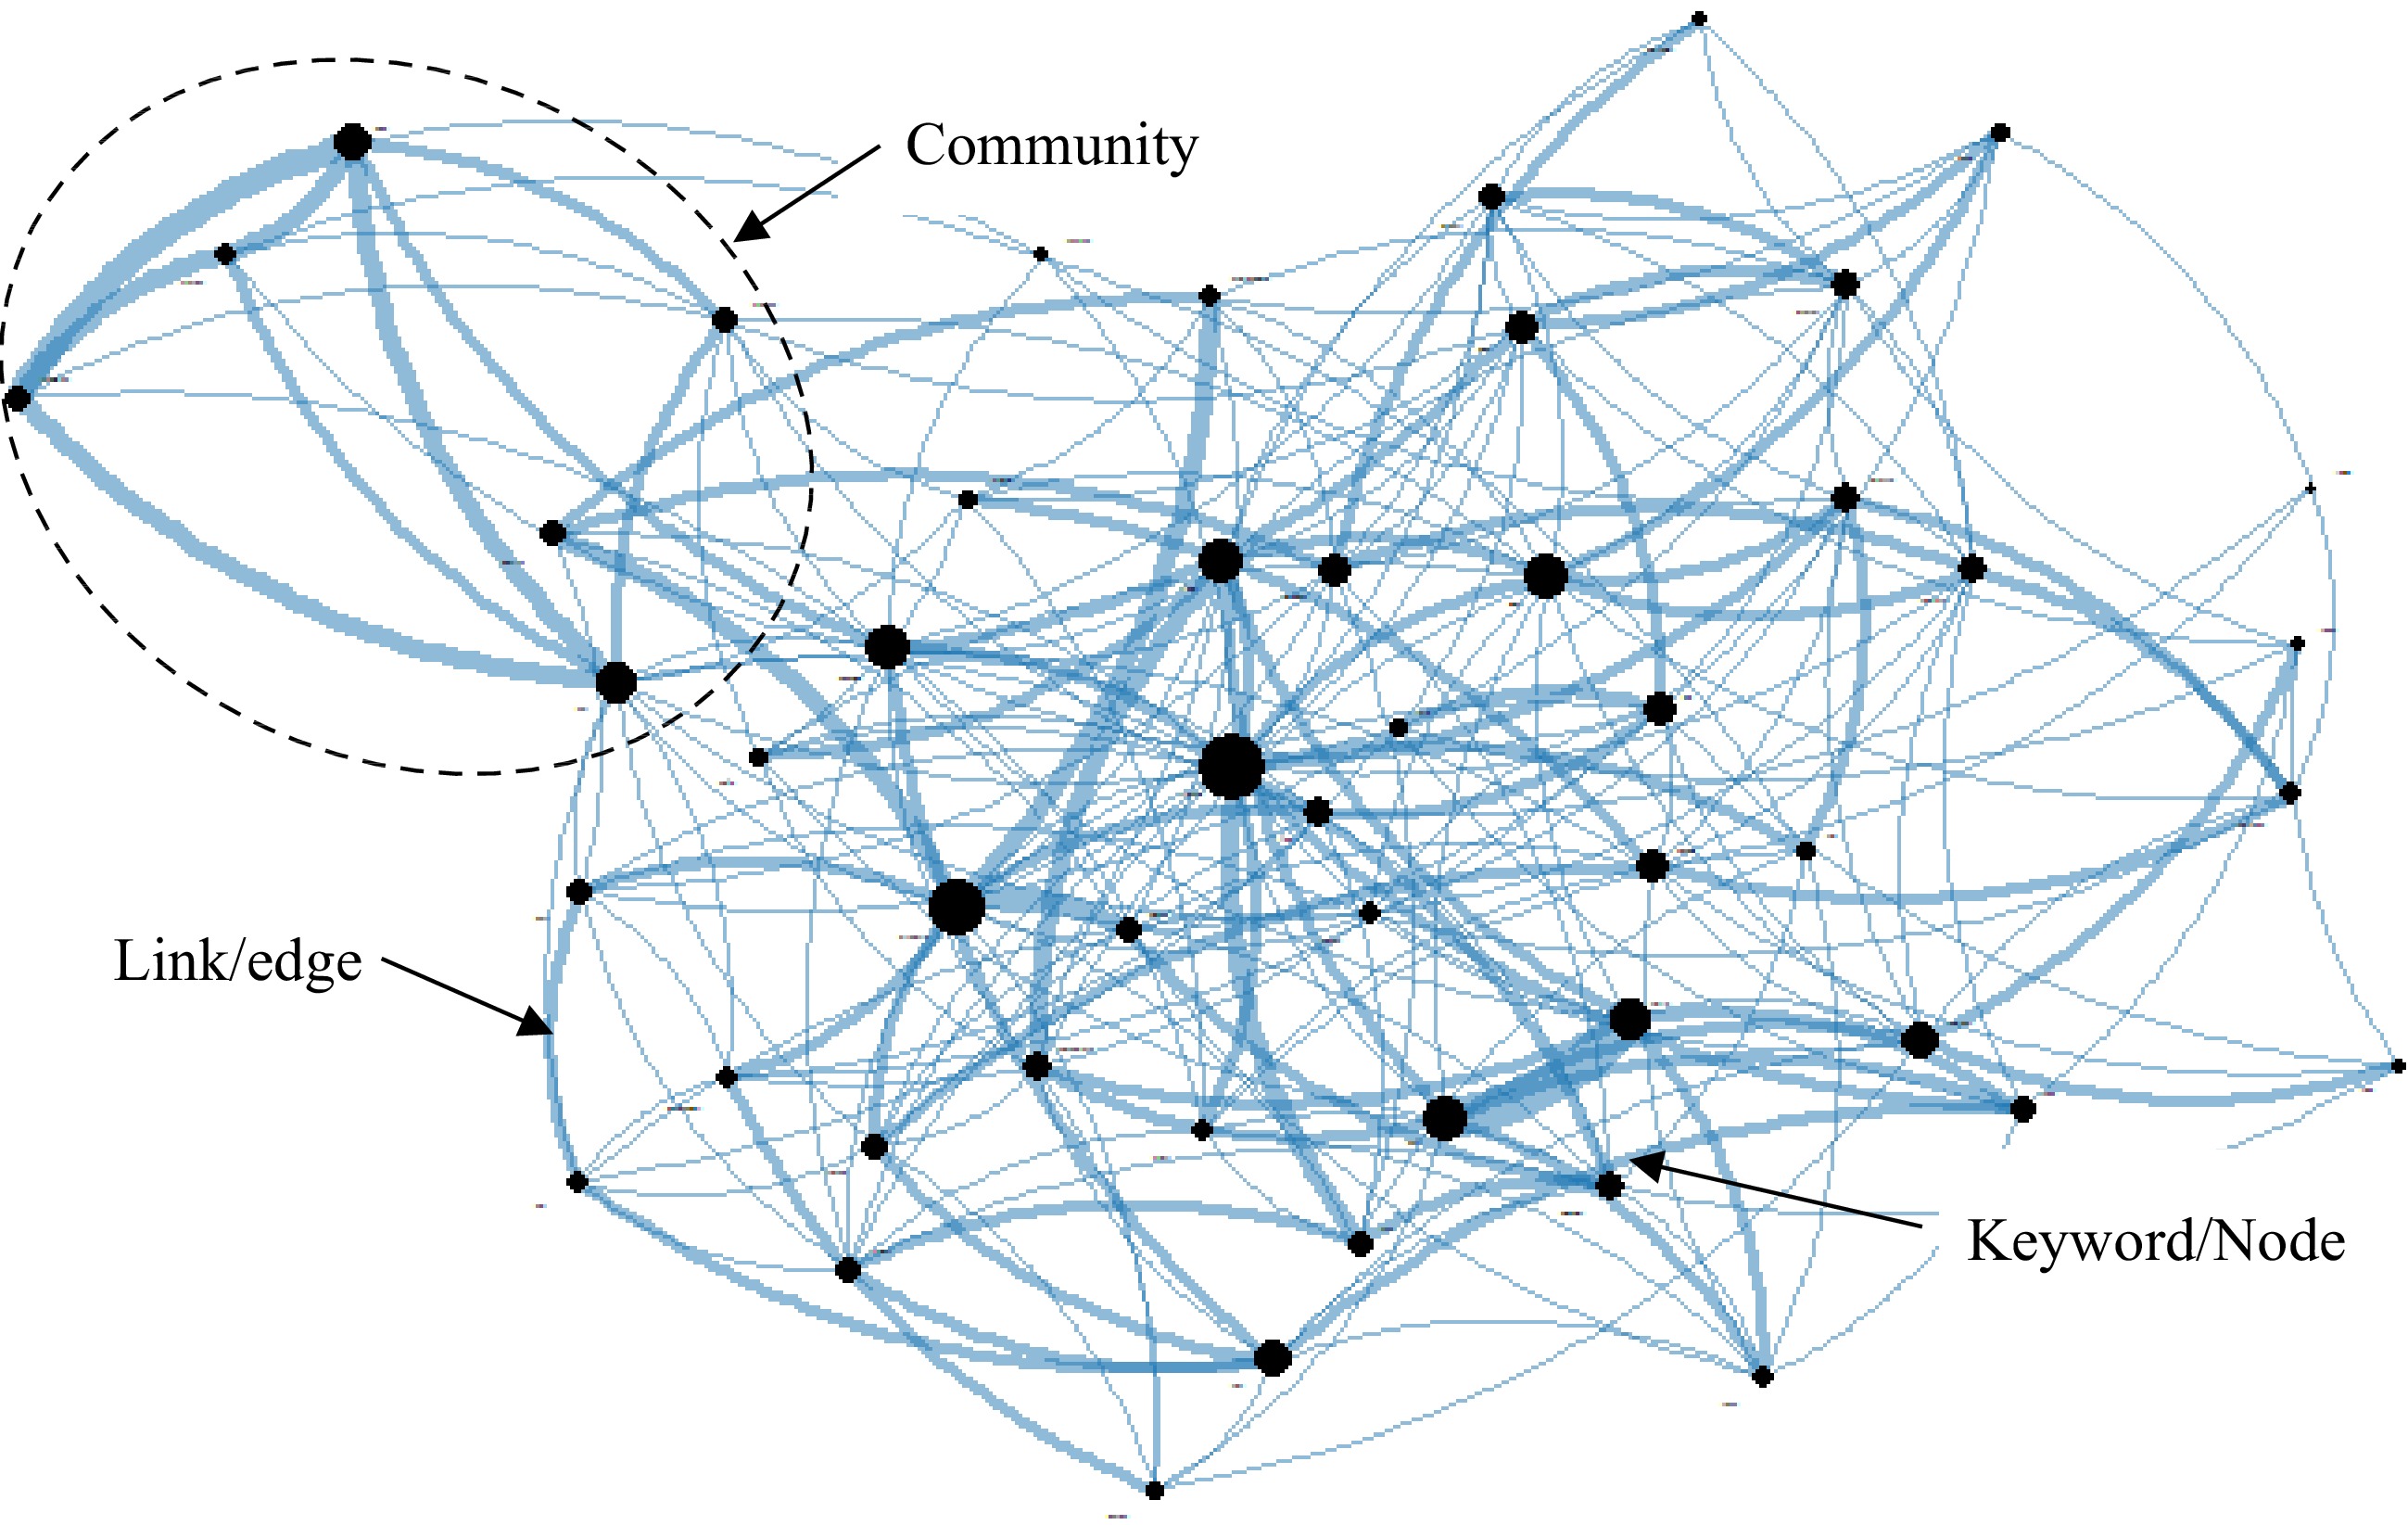
Figure 1.
A typical example of a text network.
Creating a network requires three main processes: normalization, transformation, and mapping. Normalization involves formatting responses to lower cases, removing special characters, and connecting words. Transformation covers changing the unstructured to structured data. In this process, the open-response text is converted into matrices of keywords with their associated frequencies. Lastly, the keywords are mapped. In this stage, the keywords are mapped from the matrices created in the previous stage[38,40,41].
The text network results can be interpreted based on keyword frequency, co-occurred frequency, collocated frequency, degree, centrality, and betweenness centrality, among other factors. However, keyword frequency and collocated keywords are used[36,39]. Only the top 50 most frequent keywords are mapped for computation time and power for analysis.
-
This section presents the results and discussion of the analyses conducted. These include descriptive statistics that provide a general picture of response distribution, the MWU test results, and the Bayesian ordered logistics results.
General descriptive statistics
-
Three hundred ninety-six pedestrians responded to the question asked, of which 148 (37.4%) identified as males and 111 (28%) as females. In addition, about 61.9% of the respondents were pedestrians aged 18−26 years, and 49% were Caucasians. The number of respondents for each question differed depending on the type of questions asked. About 47.2% (187 pedestrians) responded to the question about their sympathy toward using autonomous shuttle services for students with disabilities, and 310 pedestrians (78.3%) responded to the question about the perceived risk of the AV shuttle operating on the sidewalk compared to bicycles—moreover, the question related to the perceived risk of AV shuttles to pedestrians. Table 1 shows the rich demographic distribution of the participants.
Table 1. Descriptive analysis results.
Variable Category Sympathy
(N = 187)Risk to pedestrian
(N = 310)Risk (shuttle vs bicycle
(N = 310)Gender Male 103 146 146 Female 69 111 111 Didn't respond 15 53 53 Ethnicity Caucasian 133 192 192 Others 38 63 63 Didn't respond 16 55 55 Age 18–26 years 174 244 244 Others 10 34 34 Didn't respond 3 32 32 Further, the influence of the interaction with the shuttle was also evaluated in terms of sympathy and risk. Among the respondents, 214 (54%) interacted with the shuttle. Figure 2 shows the distribution of sympathy ratings and ratings by shuttle interaction. It can be observed that respondents who interacted with the shuttle showed a high level of sympathy for people with disabilities, as indicated by the size of the 'a great deal' and 'a lot' categories of sympathy. Further, a relatively large number of respondents who felt either a lot of sympathy or a great deal felt that operating the shuttle was risky to pedestrians. Furthermore, people who felt lower risk levels to pedestrians also showed either moderately lower or much lower risk of the shuttle on the sidewalk compared to the bicycle.
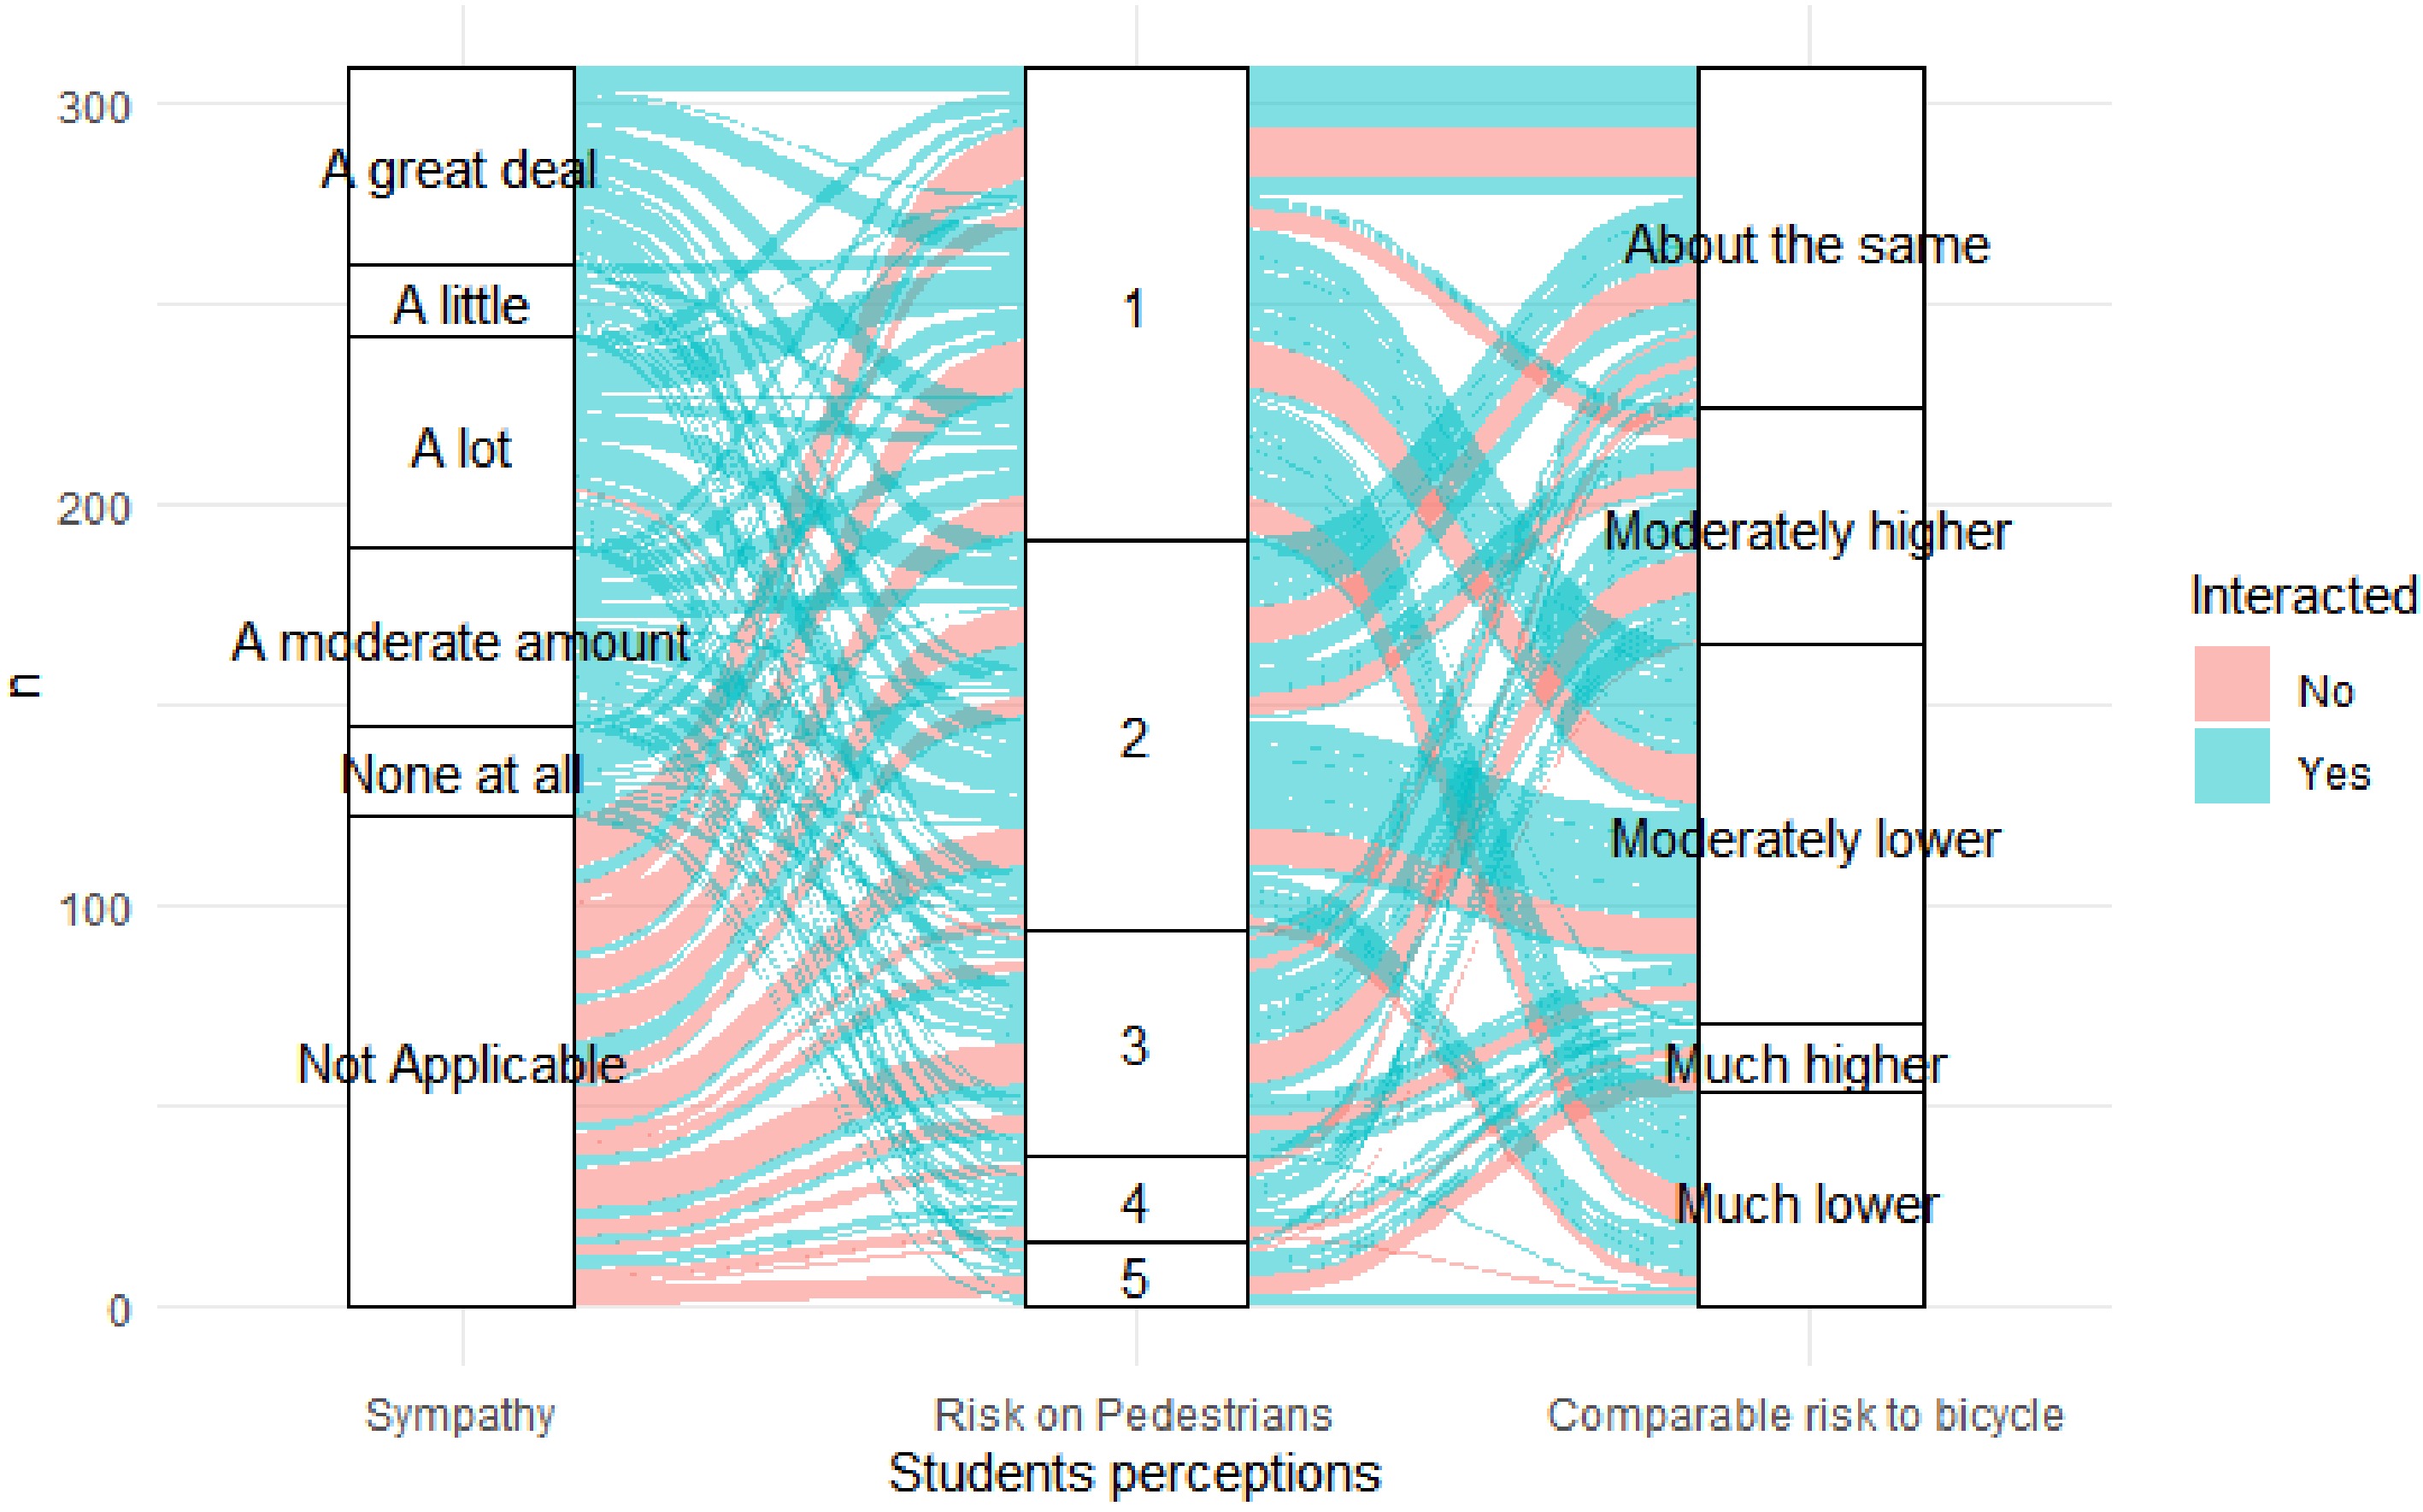
Figure 2.
Ratings of the sympathy and ratings by shuttle interaction.
Bayesian Ordered Logistic regression model results
-
Bayesian Ordered Logistic regression was performed for each question against explanatory variables, as presented in Table 2. For analysis purposes, gender, age, interaction with the autonomous vehicle, and ethnicity were used as binary independent variables. A reference group was created and used for each independent variable. Each survey response was treated as a dependent variable.
Table 2. Bayesian ordered regression model results.
Variable Estimate OR Est.
Error[95% CI] Estimate OR Est.
Error[95% CI] Estimate OR Est.
Error[95% CI] Sympathy Risk to pedestrian Risk (shuttle vs bicycle) Gender Female Male −0.53 0.59 0.29 −1.1 0.04 −0.45 0.64 0.23 −0.91 −0.01 −0.41 0.66 0.23 −0.87 0.05 Age group (years) 18–25 > 25 −1.59 0.20 0.82 −3.28 −0.04 0.11 1.12 0.39 −0.65 0.88 0.42 1.52 0.41 −0.36 1.24 Ethnicity Caucasian Non-Caucasian 0.7 2.01 0.35 0.03 1.39 −0.56 0.57 0.28 −1.13 −0.02 −0.54 0.58 0.27 −1.07 −0.01 Model summary /cut1 −3.37 0.03 0.89 −5.15 −1.66 −0.96 0.38 0.43 −1.8 −0.11 −1.73 0.18 0.46 −2.64 −0.82 /cut2 −2.59 0.08 0.89 −4.4 −0.89 0.42 1.52 0.43 −0.41 1.27 −0.19 0.83 0.45 −1.05 0.7 /cut3 −1.41 0.24 0.88 −3.19 0.27 1.49 4.44 0.44 0.65 2.37 1.02 2.77 0.45 0.15 1.92 /cut4 −0.13 0.88 0.87 −1.89 1.54 2.58 13.20 0.51 1.6 3.59 2.88 17.81 0.52 1.89 3.97 CI = Credible interval, OR = Odds Ratio, Est Error = Estimated error. Table 2 presents factors that influence the differences in pedestrian perceptions of the attributes of autonomous shuttles. The 95% credible interval was considered in this study. Other variables were added to the table for comparison purposes.
Results show that gender, age, and ethnicity are important factors contributing to differences in perceptions of the operation of the autonomous shuttle for people with disabilities in the three independent variables studied, specifically the importance of the AV shuttle to students with disabilities, the perceived risk of sidewalk operation of an autonomous shuttle on a pedestrian, and risk comparison between an autonomous shuttle and a bicycle on a sidewalk. It was revealed that while ethnicity was important in explaining the differences in perceptions of the three studied categories, gender, and age were significant in only one of the three independent variables.
Gender was a significant factor in the perceived risk of autonomous shuttles, and results show that males are 36% less likely than females to perceive high risks of autonomous shuttles on pedestrians. Although gender was not a significant factor at a 95% credible interval on the usefulness of the autonomous, results indicate that male pedestrians are 41% less likely than female pedestrians to perceive the autonomous shuttle as useful among students with a disability. Males are also 37% less likely than females to perceive higher autonomous shuttle risks than bicyclists operating on sidewalks.
Further, the study revealed that while age is not a significant factor in perceptions of risks of autonomous vehicles to pedestrians, gender and ethnicity were. Results show that male pedestrians were 36% less likely than females to perceive higher risks to pedestrians by an autonomous shuttle operating on sidewalks. In addition, non-Caucasian pedestrians are 43% less likely than Caucasians to perceive higher risks to pedestrians by an autonomous shuttle operating on sidewalks.
Regarding the perceived risks imposed by an autonomous shuttle to risks imposed by a bicycle operating on a sidewalk, results revealed that gender and ethnicity were the only determinant factors. Specifically, it was found that male pedestrians were 34% less likely to perceive higher risks of autonomous shuttles compared to bicycles than female pedestrians. It was also revealed that Caucasian pedestrians have lower odds (42% less likely) of perceiving higher risks of autonomous shuttles compared to bicycles than other ethnicities.
Similar results were also observed in the previous studies[14,20,22,42,43]. A survey by Hulse et al. revealed that age was among the factors associated with differences in people's perceptions. In their study, young adults accepted significantly autonomous cars[14,20]. A study by Battistini et al., who investigated contributing factors in autonomous shuttles (AS) for tourist purposes, revealed that gender and age were significant factors in users' perceptions of using the shuttle as a daily commute. Specifically, age was a significant factor in users' perceptions of using the shuttle as a daily commute; however, it was not an important factor in using the shuttle as tourism[22]. Further, a survey conducted among residents of the State of Qatar on the safety concerns of autonomous vehicles revealed that, compared to Arabs, non-Arabs reported higher concerns[43]. However, these studies did not focus on the perceived use of autonomous vehicles by people with disabilities.
The regression results provided the association between various aspects of autonomous shuttle operations on campus to provide services to students with disabilities. However, the results from open-ended questions were deemed necessary to understand the insights from the actual discussions. The next section presents the text network results.
Text network results
-
The text network results cover the overall perceived risks for pedestrians, perceived risks comparable to bicycles, and the sympathy for the people with disabilities who utilized the autonomous shuttle. Respondents with a scale of 4 and 5 were considered risky for the overall perceived risk to pedestrians, while the rest considered the autonomous shuttle as not risky. Considering the sympathy level, 'a great deal' and 'a lot' were considered high, while 'a little' and 'not' was considered low. Further, compared with bicycles, 'much' and 'moderately higher' were considered risky.
Perceived risk to pedestrians
-
Figure 3 presents the text network for responses to the perceived risk to pedestrians. According to the networks, a relatively small number of people perceived that the AVs are risky to pedestrians, as indicated by the denseness of the network. The network for the respondents who feel that the AV is dangerous to pedestrians focused on multiple issues, as indicated by the co-located and co-occurring keywords. The accessibility issue is one of the main focus points for this group. They perceived that operating AVs on walkways would solve accessibility issues for people with disabilities, but they did not feel safe interacting with them. The typical response stated: 'If it helps students with disabilities and accessibility issues, then it should be implemented for that only. They must be responsibly monitored and controlled to make it safe'. Previous studies have reported similar findings regarding AV interactions with pedestrians[44]. However, such studies did not involve people with disabilities.
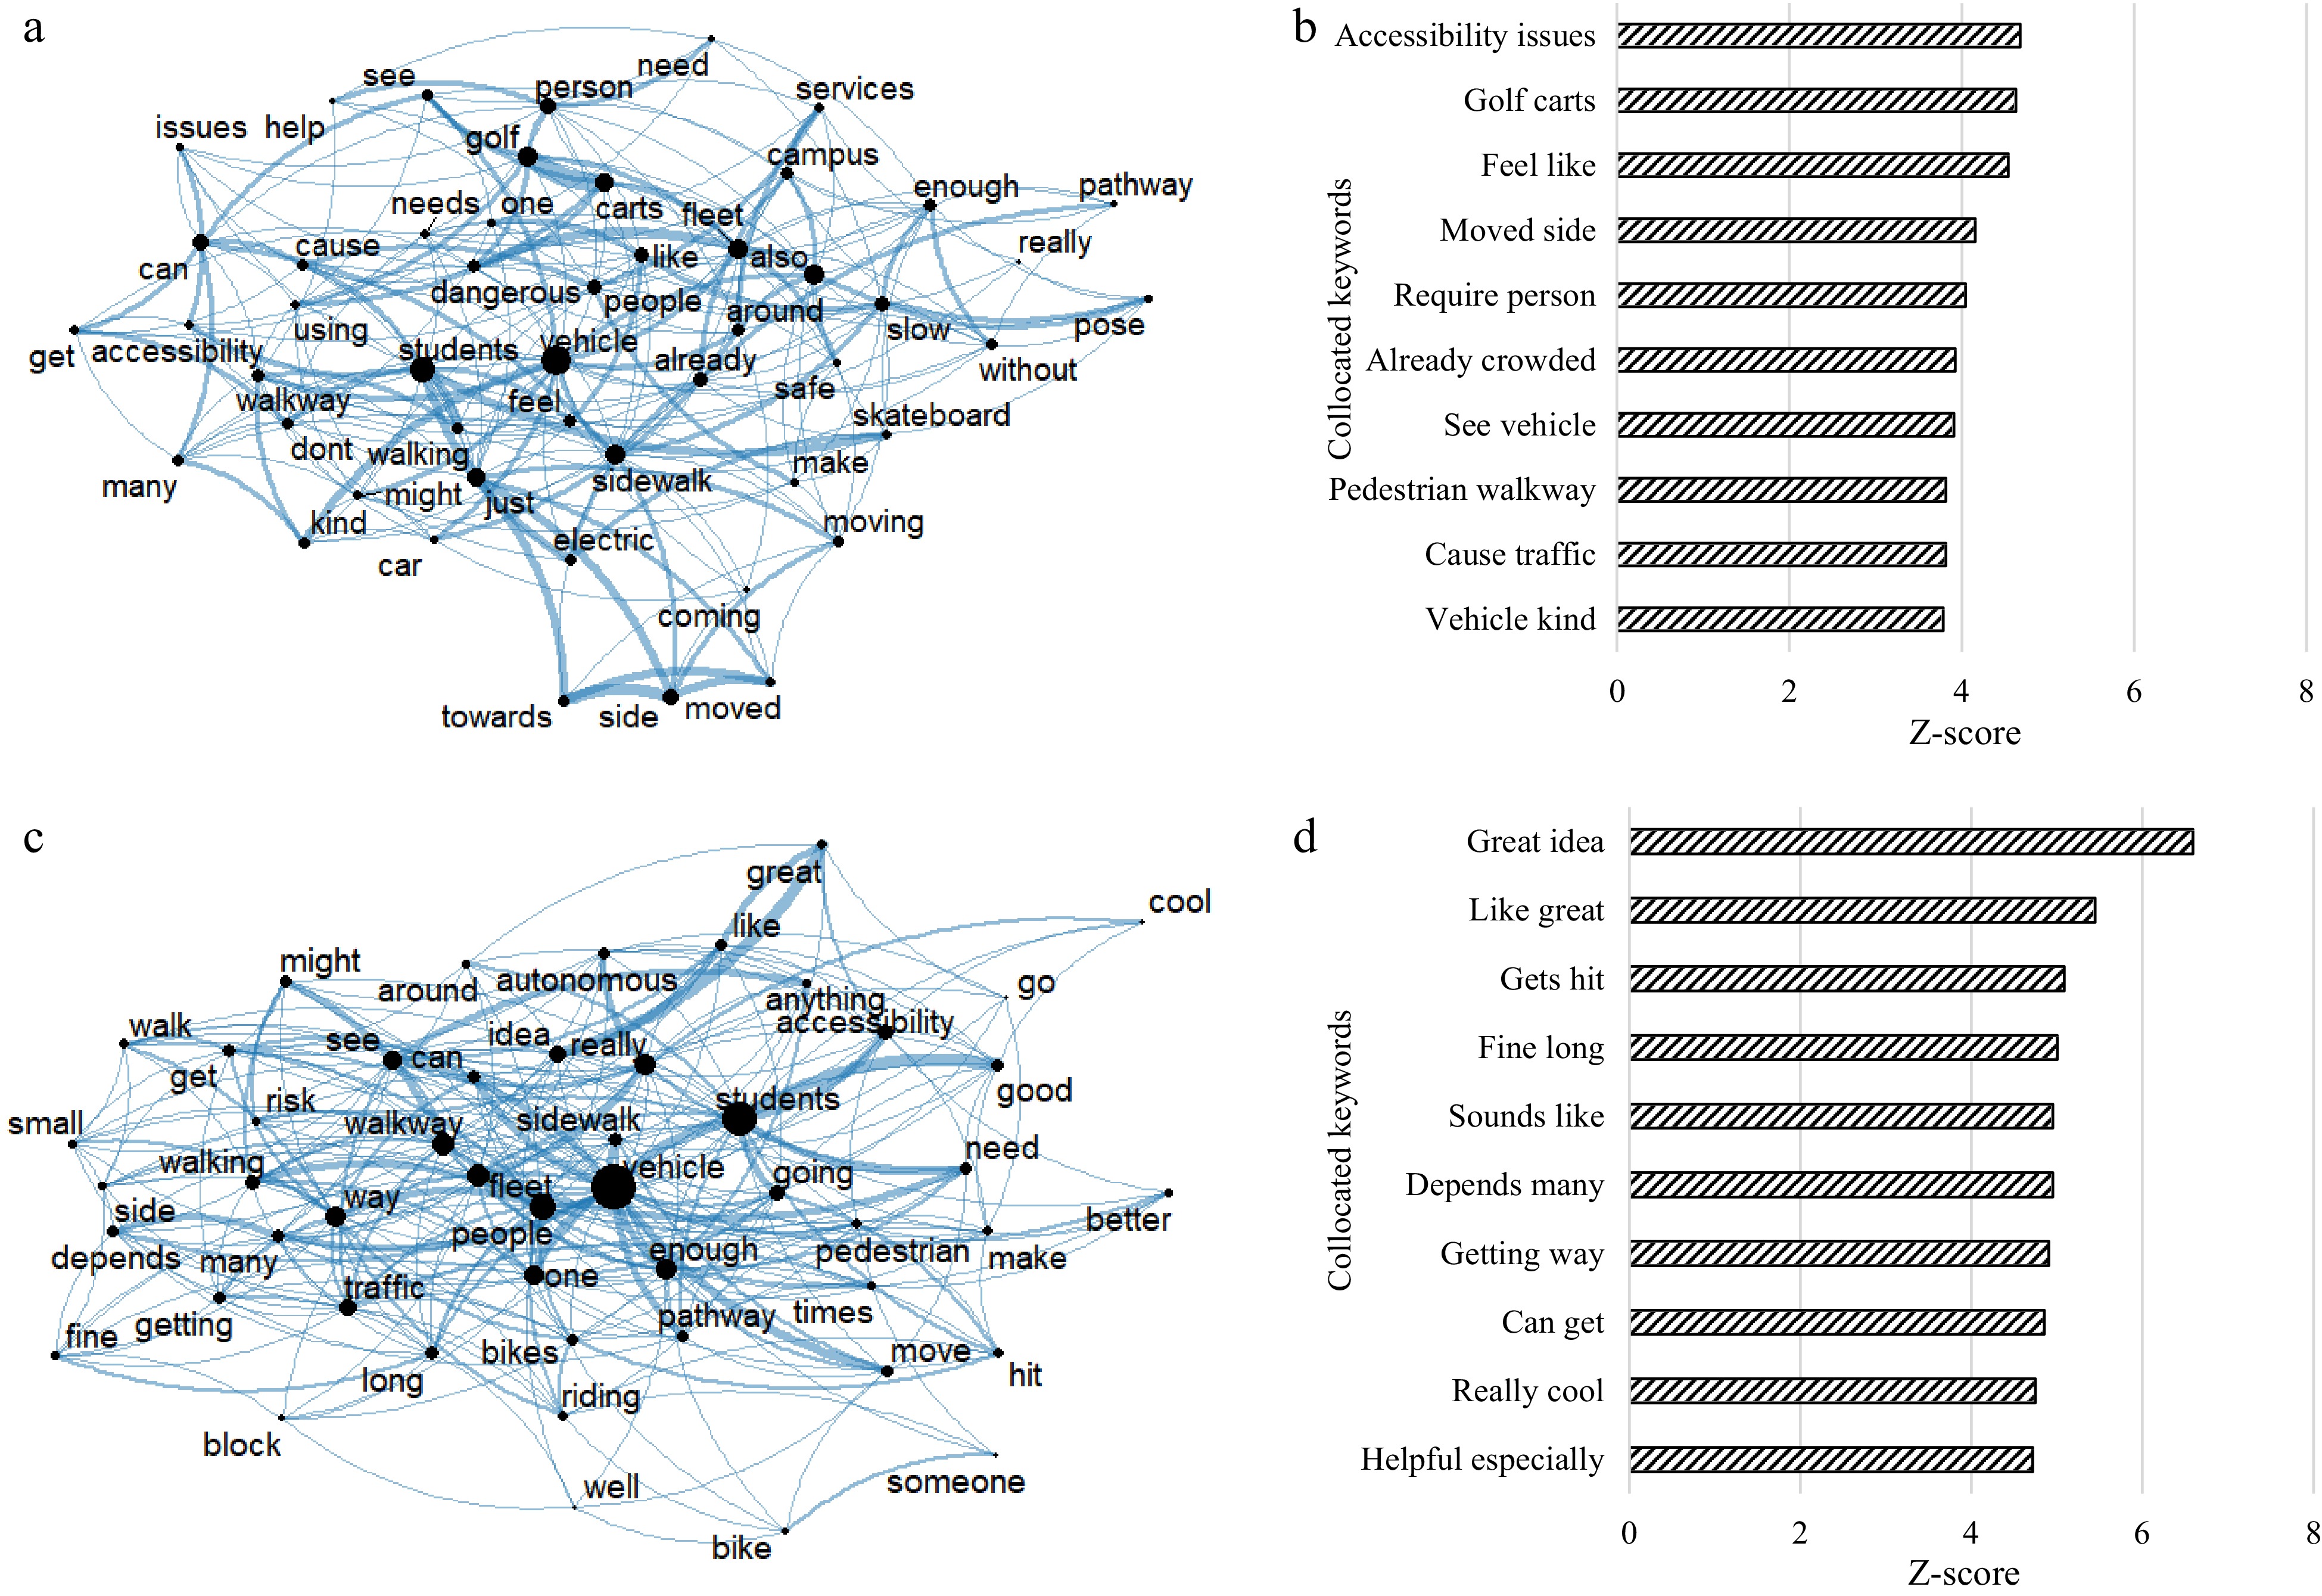
Figure 3.
Text networks and collocated keywords for perceived risk to pedestrians. (a) Text network for AV as risky to pedestrians, (b) collocated keywords for AV as risky to pedestrians, (c) text Network for AV as not risky to pedestrians, (d) collocated keywords for AV as not risky to pedestrians.
Furthermore, other respondents compared the AVs operating against the golf carts as indicated by the keywords golf carts. Respondents feel that the AV won't be any better than golf carts, "…I do not see the advantage of using autonomous vehicles over golf carts, though. Wouldn't golf carts be cheaper? And doesn't the autonomous vehicle require a person to be able to operate it?...". Other respondents showed concerns that, as it stands, the walkways are already crowded with other fleets, which makes operating AV more crowding the sidewalks: "Campus pathways are already crowded enough without a fleet of bulky, slow, ugly, and sidewalk-obscuring vehicles."
On the other hand, people who perceived it as not risky to pedestrians thought it was a great idea, especially for students with disabilities. Most comments pointed toward their greatness to disabled people but cautioned on their operations. Some people talked about hitting pedestrians. A typical response states: 'I think it would be a good idea given they stop if someone is standing in the way or at least slow down as not to hit them. I think it's a great idea for students with disabilities' and 'I don't mind them, but it would make bikes have to pass them and possibly hit a pedestrian'. Others had issues with the number of AVs operating, as indicated by the keyword fleet in Fig. 3c. One of the associated comments stated: 'Depending on the size of 'a fleet', I'd say the realistic risk is that a student may be looking at their phone and not notice a vehicle after turning a corner'.
Perceived risk for AV compared to bicycles
-
Figure 4 shows the text network for comparable risks of AV to bicycles on the sidewalks. People who feel that AVs are riskier pointed to the crowd-ness of the walkways, arguing that additional fleets of AVs will make things worse. For example, '…Campus sidewalks are already overcrowded with current construction projects claim some pathways and alternate routes to buildings...'. Others thought adding a fleet would increase tuition, which is a waste of money. For example, '…I don't think these vehicles are of good interest or good for money being spent on the vehicles. These will cause the tuition to increase even more and are not needed'.
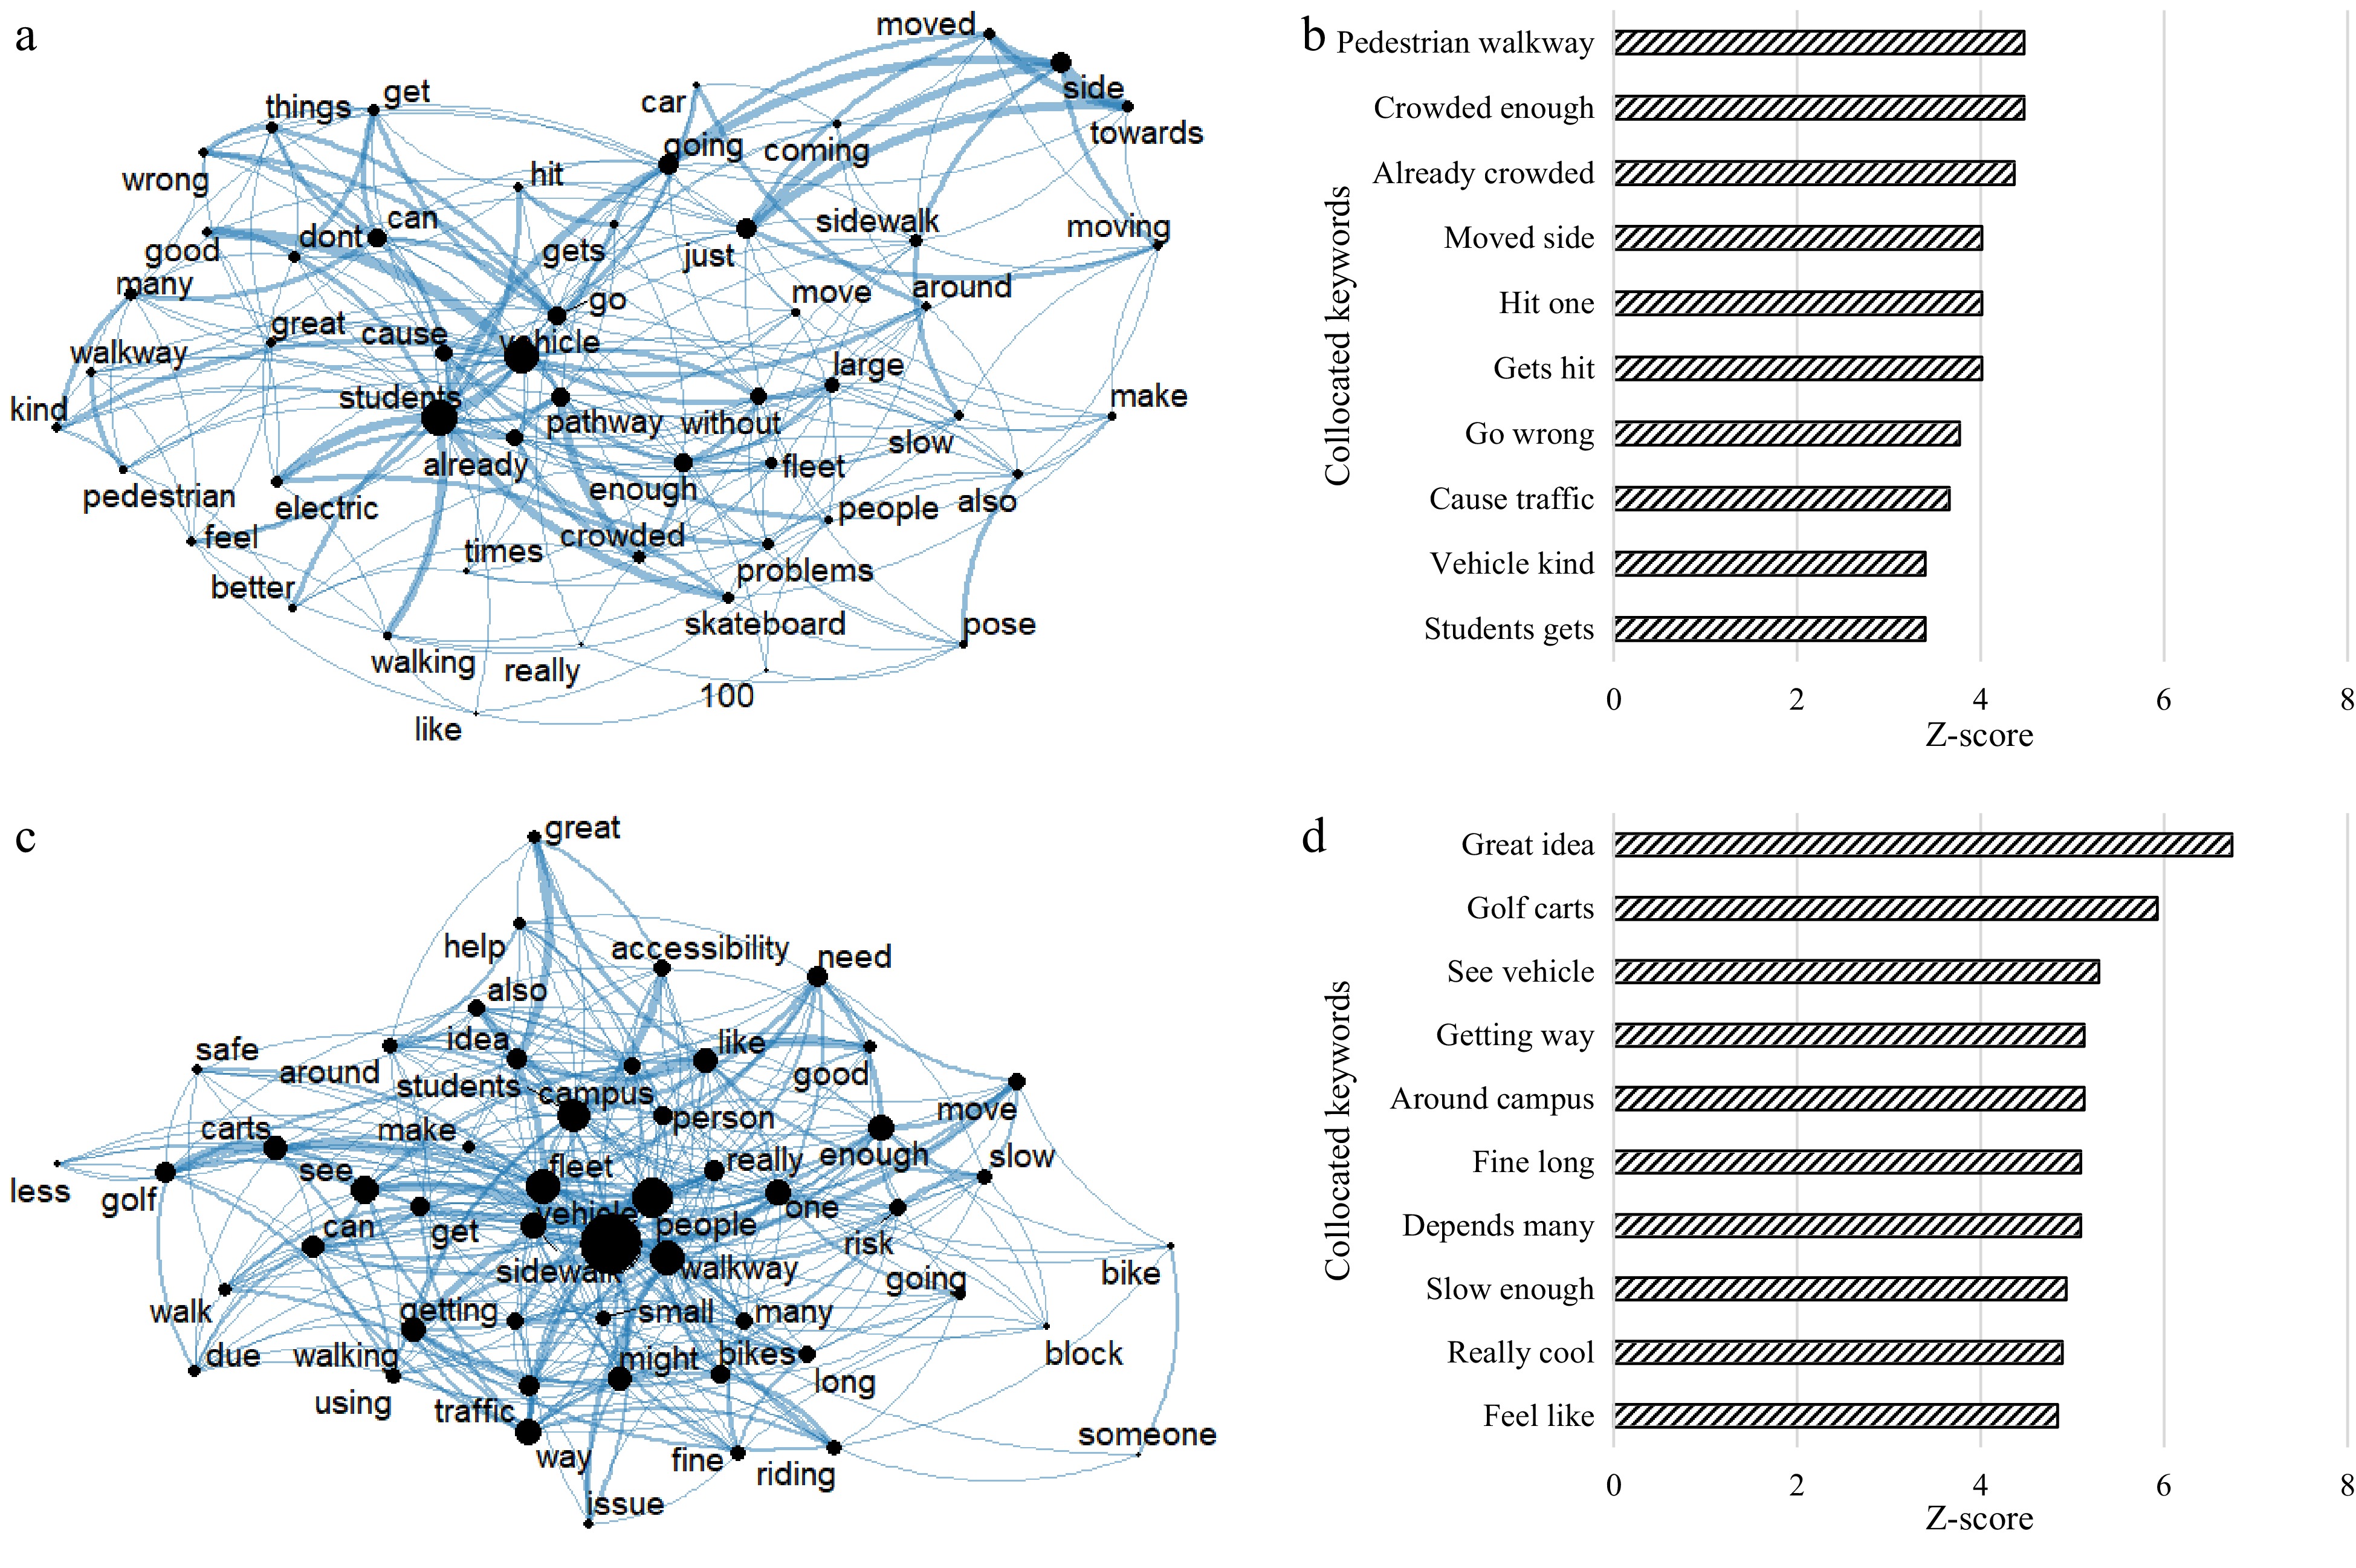
Figure 4.
Text networks and collocated keywords for perceived risk of AV compared to bicycles. (a) Text network for AV as risky compared to bicycles, (b) collocated keywords for AV were found to be risky compared to bicycles, (c) text network for AV is not risky compared to bicycles, (d) collocated keywords for AV are not risky compared to bicycles.
On the contrary, people who support the idea think it is great for disabled people and doesn't have much impact compared to a bicycle. The keyword sidewalk is the main topic in Fig. 4c since the discussion concerns the sidewalks. At least ten people mentioned sidewalks in their responses. Some pointed to already crowded sidewalks, others to the people's behavior on sidewalks. There is also a comparison between AVs and golf carts: '…I also think having a fleet of autonomous vehicles would not be more dangerous than having a fleet of golf carts and maybe less dangerous than bicyclists on the sidewalk…'. A sample of comments that showed the greatness of the shuttles stated: 'Great for accessibility and convenience for disabled students, curious to see how it affects bicycle traffic more than foot traffic', and '…The bikers on campus are terrible, I've almost been hit three times this semester'.
Sympathy for accessibility needs of people with disabilities (usefulness of the services)
-
Lastly, Fig. 5 presents the text networks of the sympathy level for people with disabilities. According to respondents with a high level of sympathy for people with disabilities (Fig.5a & b), operating an AV on the sidewalk is fine as long as it doesn't hit pedestrians. The fleet doesn't pose much safety risk as indicated by the keyword pose, much, and risk. A typical statement states: '…… What I've seen it's not too fast and poses little risk to pedestrians. And it is only a little annoying to walk around if it's blocking your path to class (but not a big deal)'. Some would be happy to see these fleets: 'I would be happy to see a fleet of autonomous vehicles'. However, others cautioned about the possible risks posed by AV operations, although they think it is a good idea for disabled people.
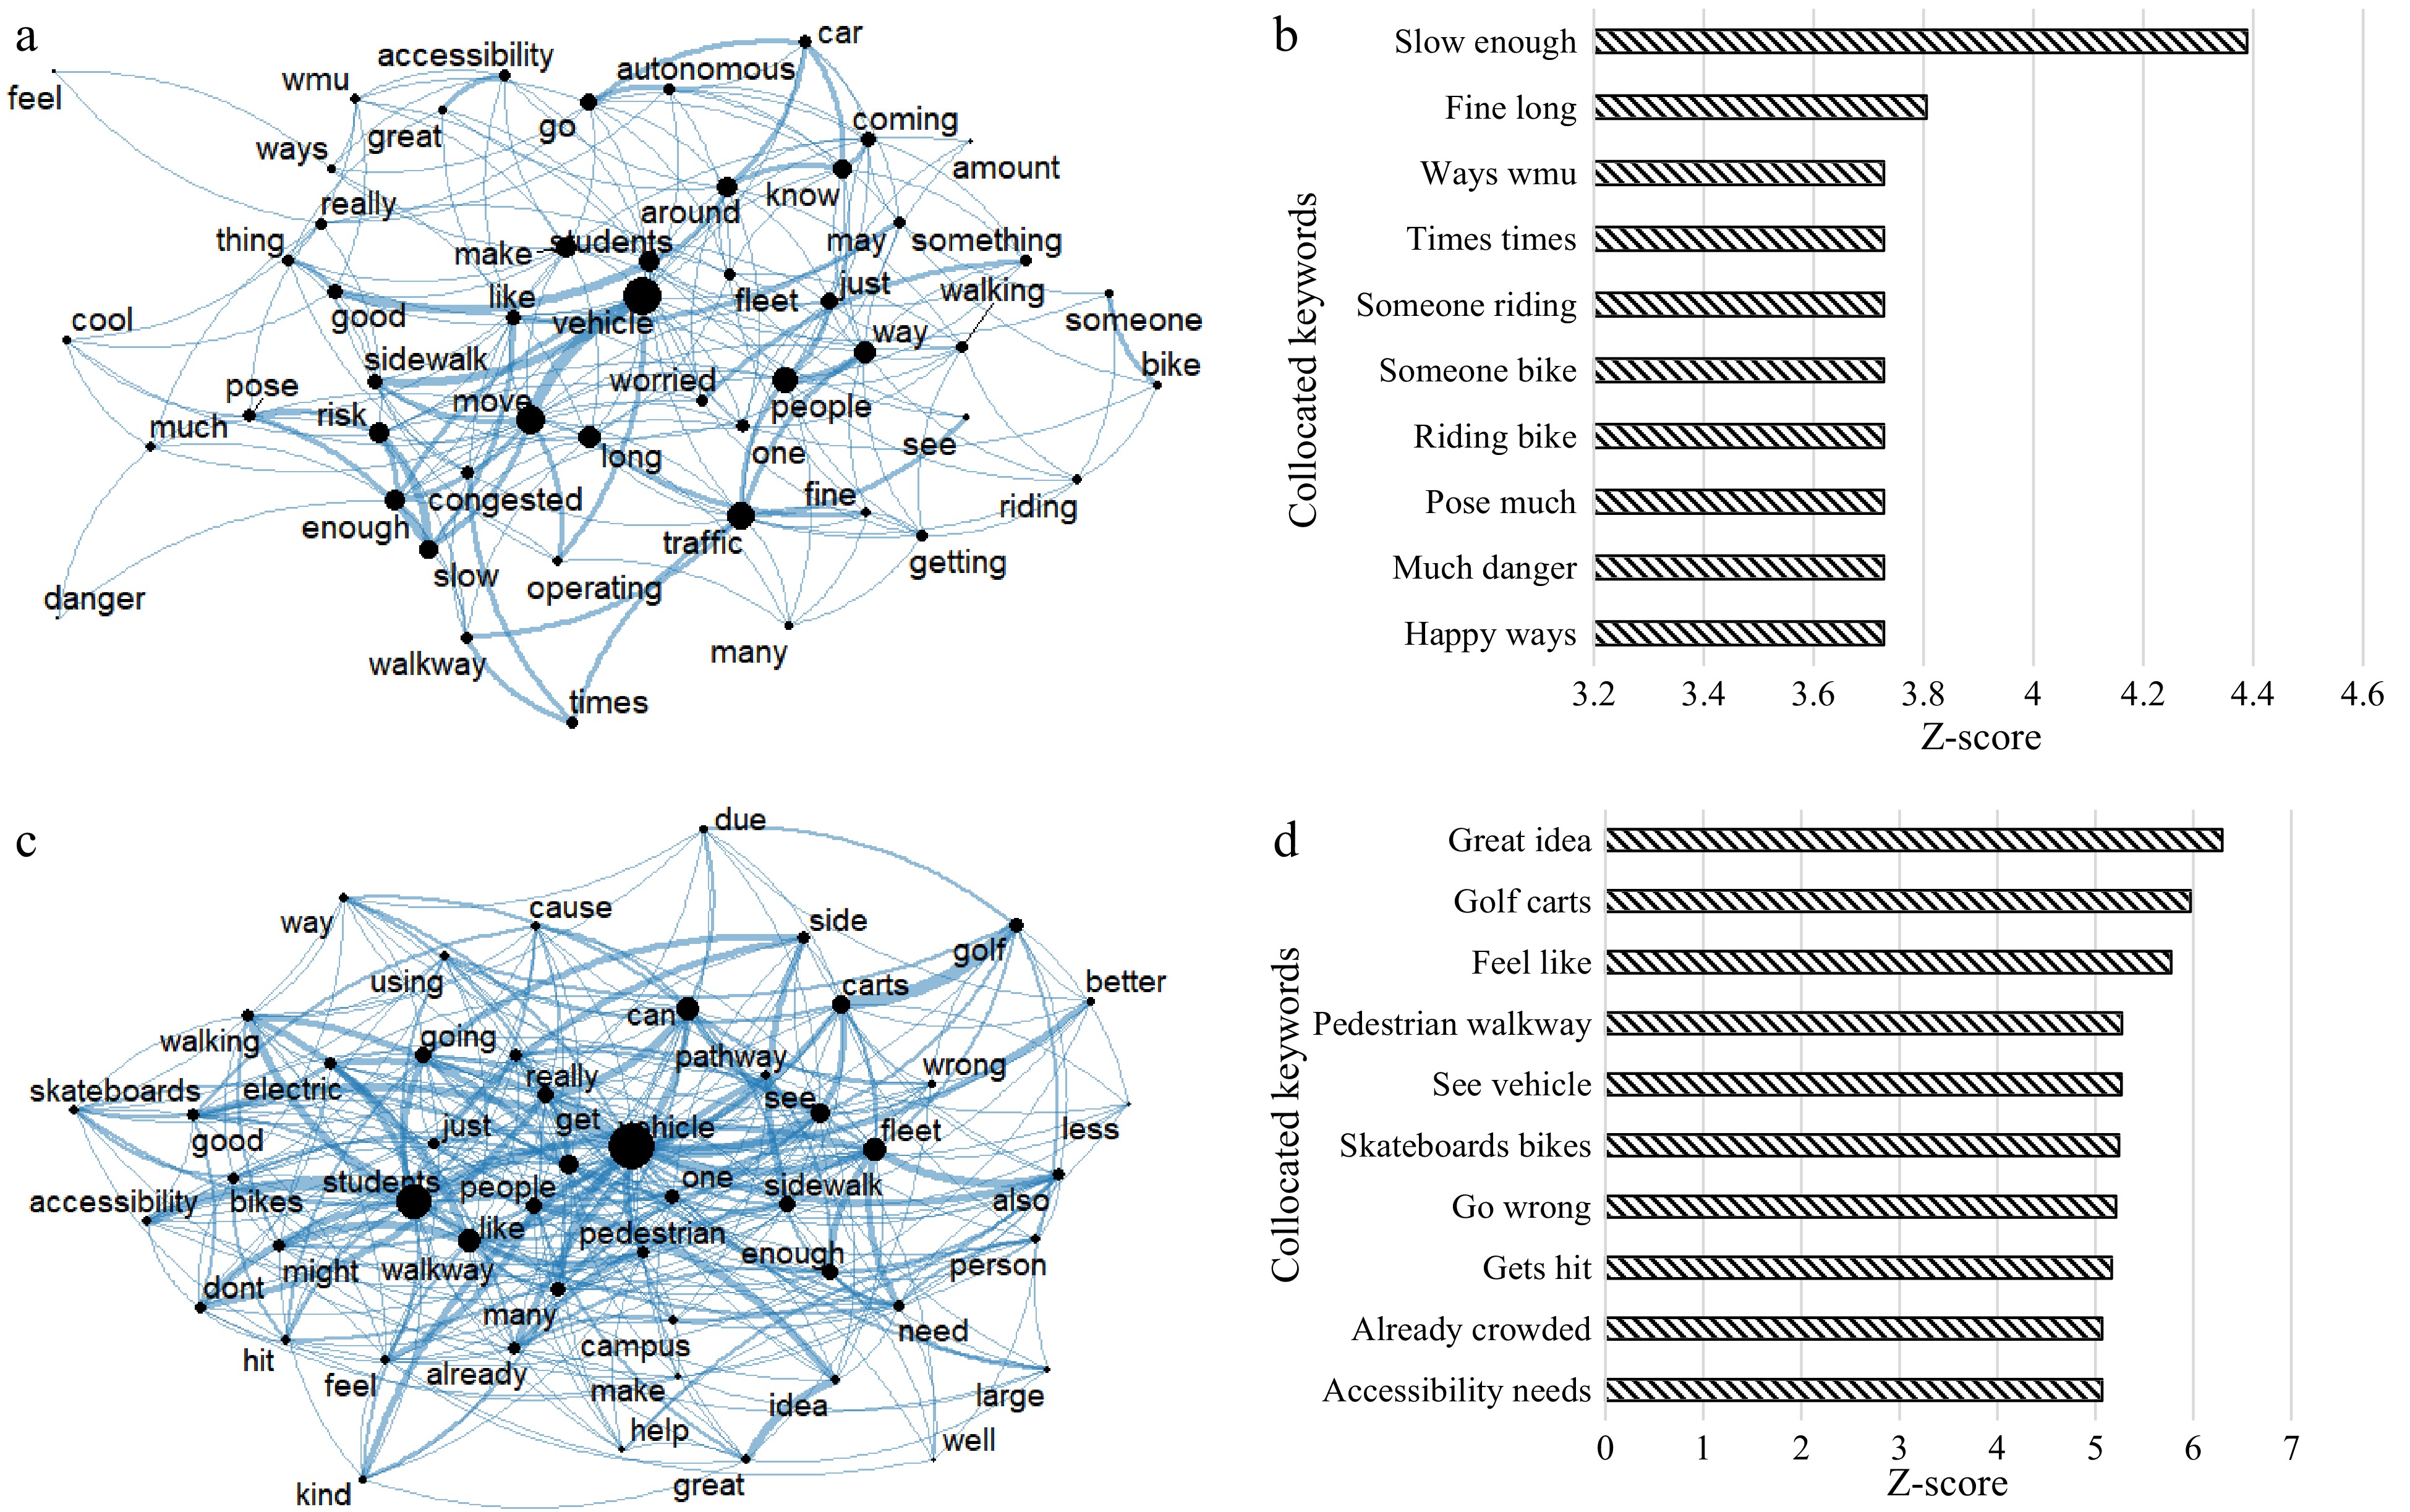
Figure 5.
Text networks and collocated keywords for perceived sympathy level. (a) Text network for high sympathy level, (b) top collocated keywords for high sympathy level, (c) text network for low sympathy level, (d) top collocated keywords for low sympathy level.
Furthermore, although some people showed low sympathy levels (Fig. 5c & d), they still think that it is a great idea that would benefit people with disabilities. Responses such as: 'I wouldn't mind if it helped people who needed it to get to class' signify such a sentiment. However, they warn about pedestrian obstruction, as indicated in one of the responses: 'If they don't obstruct pedestrians from walking, it is a valid idea'.
-
This paper analyzed pedestrians' perceptions of the safety risks of an autonomous shuttle operating on the WMU campus' pedestrian walkways. It leverages perceptual data towards autonomous shuttles to elucidate how using autonomous technology to solve mobility challenges can create safety concerns for other individuals not directly benefiting from the technology. Results show that actual interaction with the shuttle, age, ethnicity, and gender are significant factors affecting the pedestrian perception of the shuttle impacts. In summary, the results revealed the following.
• Compared to females, males are 41% less likely to perceive higher sympathy towards using autonomous shuttles for students with disabilities.
• Younger pedestrians are 78% less likely than adult pedestrians to perceive the shuttle as more important to students with disabilities.
• Caucasians are two times more likely than other ethnicities to perceive higher levels of importance of the shuttle to students with disabilities.
• Male pedestrians were 36% less likely than females to perceive higher-risk pedestrians by an autonomous shuttle operating on sidewalks.
• Caucasian pedestrians were 43% less likely than other races to perceive higher risks to pedestrians by an autonomous shuttle operating on sidewalks.
• Male pedestrians were 34% less likely than female pedestrians to perceive higher risks of autonomous shuttles compared to bicycles.
• Caucasian pedestrians were 42% less likely than other ethnicities to perceive higher risks of autonomous shuttles than bicycles.
On the other hand, the text mining results showed several reasons for accepting or rejecting the operation of the autonomous shuttle on the sidewalks. Safety and inconvenience were among the key attributes. Further, respondents showed that the sidewalks are already crowded, which means the operations of autonomous shuttles will complicate sidewalk accessibility even more.
Results from this research can be used to understand the pedestrian perception of autonomous vehicle operation. It addresses the non-user gap in the body of knowledge. In addition, it highlights the potential of these services to bring about transportation equity to people with disability specifically in providing end-mile transportation services (transportation on a distance that is too short to drive but too far to walk by a person with a disability). The findings from this investigation are expected to assist policymakers and vehicle manufacturers with pedestrian expectations and considerations related to risk and safety when sharing their walkways with the shuttle. Given that the study was performed on a college campus, the results presented here will also provide the impetus for further exploration of using pedestrian walkways on large campuses for autonomous vehicles to support student accessibility needs. A clear understanding of the associated risks of these types of shuttles paves the way to mobility provision to persons with disabilities for block-to-block movements.
Lastly, given the design of this study, causality cannot be ascertained due to a lack of experimental control. However, the uniqueness of deploying an actual autonomous shuttle and capturing non-users perceptions lends high ecological and external validity to the results presented in this study. These psychological investigations are typically only in controlled environments that compromise generalizability; thus, the authors collected data from a large and diverse sample of participants. Nevertheless, future research should seek to cross-validate the results reported in this study through controlled experimentations with high internal validity. Further, since the current research focused on the university campus, additional research is needed on using pedestrian walkways in other areas for autonomous shuttles to provide block-to-block mobility to persons with travel-limiting disabilities.
-
The authors confirm their contribution to the paper as follows: study conception and design: Lyimo SM, Kwigizile V, Asher ZD; data collection: Lyimo SM; analysis and interpretation of results: Lyimo SM, Kutela B, Kwigizile V; draft manuscript preparation: Lyimo SM, Kutela B, Kwigizile V. All authors reviewed the results and approved the final version of the manuscript.
-
The datasets generated during and/or analyzed during the current study are available from the corresponding author upon reasonable request.
-
The author wishes to acknowledge the contribution of Johan Fanas Rojas, PhD, and his 2018 Michigan Mobility Challenge team in making this study possible.
-
The authors declare that they have no conflict of interest.
- Copyright: © 2024 by the author(s). Published by Maximum Academic Press, Fayetteville, GA. This article is an open access article distributed under Creative Commons Attribution License (CC BY 4.0), visit https://creativecommons.org/licenses/by/4.0/.
-
About this article
Cite this article
Lyimo SM, Kwigizile V, Kutela B, Asher ZD. 2024. Understanding perceptions of college students on the operation of automated shuttle for persons with disabilities on campus walkways. Digital Transportation and Safety 3(2): 36−45 doi: 10.48130/dts-0024-0004 

Understanding perceptions of college students on the operation of automated shuttle for persons with disabilities on campus walkways
- Received: 07 December 2023
- Revised: 17 April 2024
- Accepted: 29 May 2024
- Published online: 27 June 2024
Abstract: Persons with disabilities have difficulties traveling from one point to the other due to the limited options of travel modes for the first and last mile. Western Michigan University tested using an autonomous shuttle on the main campus's sidewalks for persons with disabilities. This study's objectives are to understand the empathy college students without disabilities had on the need for suitable transportation services for students with disabilities and the perceived risks of the services' operation on sidewalks. The Bayesian ordered logit model and text mining analyzed 396 survey responses. The Bayesian ordered logistic regression results revealed that age, gender, and ethnicity are important factors that contribute to different opinions concerning perceived risks and sympathy brought by an autonomous shuttle operating on pedestrians' sidewalks. The text mining results revealed several patterns. While respondents who were against the operation focused on potential safety hazards and the crowdedness of the sidewalks, supporters focused on the expected improved mobility for people with disabilities. The findings from this study are expected to assist policymakers and vehicle manufacturers with pedestrian expectations and considerations related to risk and safety when sharing their walkways with the autonomous shuttle.
-
Key words:
- Autonomous shuttle /
- University campus /
- Disabled students /
- Sidewalk operations