-
Hydrogen energy, as an efficient and clean energy source, has garnered extensive attention due to its advantages of renewability, wide availability, and pollution-free nature, making it a promising energy carrier for the future[1]. Currently, hydrogen energy is widely applied in fuel-cell vehicles and is expected to make significant contributions to the transportation industry[2,3]. However, hydrogen is an extremely flammable gas, and the flammable gas mixture formed by its mixing with air is characterized by a relatively wide combustion range, spanning from 4.2% to 76.1%[4]. In case of leakage and exposure to an ignition source, it can easily lead to fire or explosion accidents, ultimately causing severe loss of life and property[5,6]. Furthermore, the current hydrogen storage tanks in fuel cell vehicles have pressures ranging from 35 to 70 MPa[7]. In the event of a leakage, the high-pressure hydrogen would rapidly diffuse outwards, further increasing the risk of combustion and explosion. Therefore, studying the leakage, diffusion patterns, and distribution states of hydrogen in confined spaces can provide scientific guidance for preventing fire and explosion accidents as well as emergency rescue operations.
Extensive research has been conducted by scholars on the hazards of accidental leakage, combustion, and explosion of hydrogen in confined spaces such as parking garages[8], and tunnels[9]. For instance, scholars like Worster & Huppert[10] have categorized diffusion models into the Filling box model for low pressure and low initial momentum, and the Fading up box model for high pressure and high initial momentum, based on the size of the space where the leakage occurs and the initial state of the jet. Barley & Gawlik[11] conducted experiments using helium instead of hydrogen to simulate fuel cell vehicle leakage in a parking garage, exploring the impacts of different ventilation conditions, leakage source heights, and leakage rates on the hydrogen leakage and diffusion process. Lacome et al.[12] experimentally studied the influence of leakage orifice diameter on the formation process of explosive mixtures. The results indicated that when the hydrogen leakage orifice diameter is large, the flammable gas mixture accumulates initially at the top of the confined space, and the thickness of the flammable gas cloud increases with time. However, when the leakage orifice diameter is small, the hydrogen concentration in the space is insufficient to reach the explosion limit. The experiments by Merilo et al.[13] demonstrated that combining natural ventilation with mechanical ventilation can effectively reduce the concentration of flammable gases in confined spaces. Brady et al.[14] conducted experimental research on hydrogen diffusion in confined spaces, showing that the number and location of ventilation openings affects hydrogen diffusion and leakage. Tamura et al.[15] found through experiments that after placing fans around hydrogen-powered vehicles, the hydrogen around and inside the vehicles was quickly diluted. Lee et al.[16] conducted CFD numerical simulations of hydrogen leakage in the outer casing of pressure regulator equipment, indicating that different ventilation opening configurations have significant impact on the hydrogen concentration in the space. There are three ventilation opening configurations: upward, cross, and upward-downward, with the upward-downward mode achieving the lowest hydrogen concentration. According to the standards of the International Electrotechnical Commission (IEC 60079-10-1:2020) and the International Organization for Standardization (ISO 19880-1:2020), a molar fraction of 1% is the maximum acceptable hydrogen concentration in buildings with hydrogen facilities. The 1% molar fraction hydrogen isosurface is primarily used for detecting hydrogen leakage, while a molar fraction of 4% is the lower flammable limit of hydrogen and is commonly used for detecting flammable gas clouds. Studying the range of 1% molar fraction hydrogen can detect early hydrogen leakage and reduce or eliminate the possibility of small leakage events escalating into uncontrollable leakage accidents[17]. Zhao et al.[18] placed helium concentration sensors in a parking garage model with a scale ratio of 1:24 to measure the helium concentration after helium leakage. They developed a helium leakage localization system using machine learning methods to accurately and quickly locate the leakage source after helium leakage. Lu et al.[19] conducted numerical simulations of the leakage and diffusion process of hydrogen storage tanks to obtain the velocity distribution and concentration distribution of hydrogen leakage and diffusion. Liu et al.[20] established a numerical analysis model for hydrogen leakage and diffusion in fuel cell vehicles, obtaining the distribution of dangerous areas after hydrogen leakage and diffusion inside the vehicles. Tang et al.[21] studied the impact of obstacles on liquid hydrogen leakage in ventilated parking sheds, indicating that horizontal diffusion is hindered by obstacles.
It can be observed that the current research by scholars on hydrogen leakage and diffusion in confined spaces has largely focused on various leakage scenarios and influencing factors such as gas parameters at the leakage point, leakage location, leakage mode, ventilation conditions, etc., yielding abundant results. However, there is a lack of research on the impact of obstacles in underground structures, such as concrete columns and beams that serve as load-bearing and stabilizing elements. In the design and planning of underground parking garages, 'bay' typically refers to the transverse distance between two adjacent columns within the garage, which determines the number of parking spaces that can be accommodated in that space. Within a given spatial scale, the number and distribution of columns and beams vary across different parking bay patterns, with the number of columns and beams increasing sequentially in patterns such as the 4-parking space bay pattern, 3-parking space bay pattern, and 2-parking space bay pattern. When there are numerous concrete columns in an underground parking garage, they can restrict visibility and reduce visual comfort for people. Additionally, concrete columns and beams, as essential structural components of underground parking garages can significantly impact the diffusion and distribution of hydrogen when a hydrogen leak occurs within the garage. Hydrogen, under the influence of buoyancy and momentum diffuses into the surrounding area. Therefore, this paper utilizes Ansys Fluent to conduct numerical simulations to investigate the influence of obstacles such as columns and beams on the diffusion and distribution of hydrogen leakage under different parking bay patterns in underground parking garages. Finally, by incorporating mechanical ventilation conditions, the paper studies the characteristics of the impact of the number of ventilation openings on hydrogen diffusion and distribution, aiming to provide references and insights for the safe design of hydrogen fuel cell vehicle parking garages.
-
The geometric model in this paper is determined based on the 'Code for Design of Garage Buildings' (JGJ100-2015) and the 'Code for Design of Concrete Structures' (GB50010-2010) (2015 edition). The length, width, and height of the underground garage are 21, 16.6, and 3.2 m, respectively. Each parking space has a length and width of 5.3 and 2.4 m, respectively. The hydrogen fuel cell vehicle has dimensions of 4.8 m in length, 1.8 m in width, and 1.4m in height, with a vertical parking arrangement. According to the specifications, the diameter of the columns should be no less than 0.3 m and no less than 1/6 of their height, with a maximum height of 12 m and no more than 20 times their diameter. Therefore, based on the actual situation, the cross-sectional dimensions of the columns in this paper are 0.6 m × 0.6 m, with a height of 3.2 m. For ease of analysis, the cross-sectional dimensions of the beams are also set to 0.6 m × 0.6 m. The distances between the columns in the garage under the 4-parking space bay pattern, 3-parking space bay pattern, and 2-parking space bay pattern are 9.6, 7.2, and 4.8 m, respectively. The geometric models of the three parking patterns designed in this paper and the bottom view of the garage under the 4-parking space bay pattern are shown in Fig. 1. The garage models under the 4-parking space bay pattern with different numbers of ventilation openings are shown in Fig. 2, where the garage doors are all open, with a width of 5 m and a height of 2.1 m. A total of six monitoring points are set in this paper, located at P (1.8, 15.6, 3.2), A (0, 11.9, 3.2), B (0, 16.6, 3.2), C (1.8, 16.6, 3.2), D (3, 16.6, 3.2), and E (3, 15.6, 3.2), respectively. Additionally, the hydrogen leak source in this paper is located at coordinates (1.8, 15.6, 1.4) within the space.
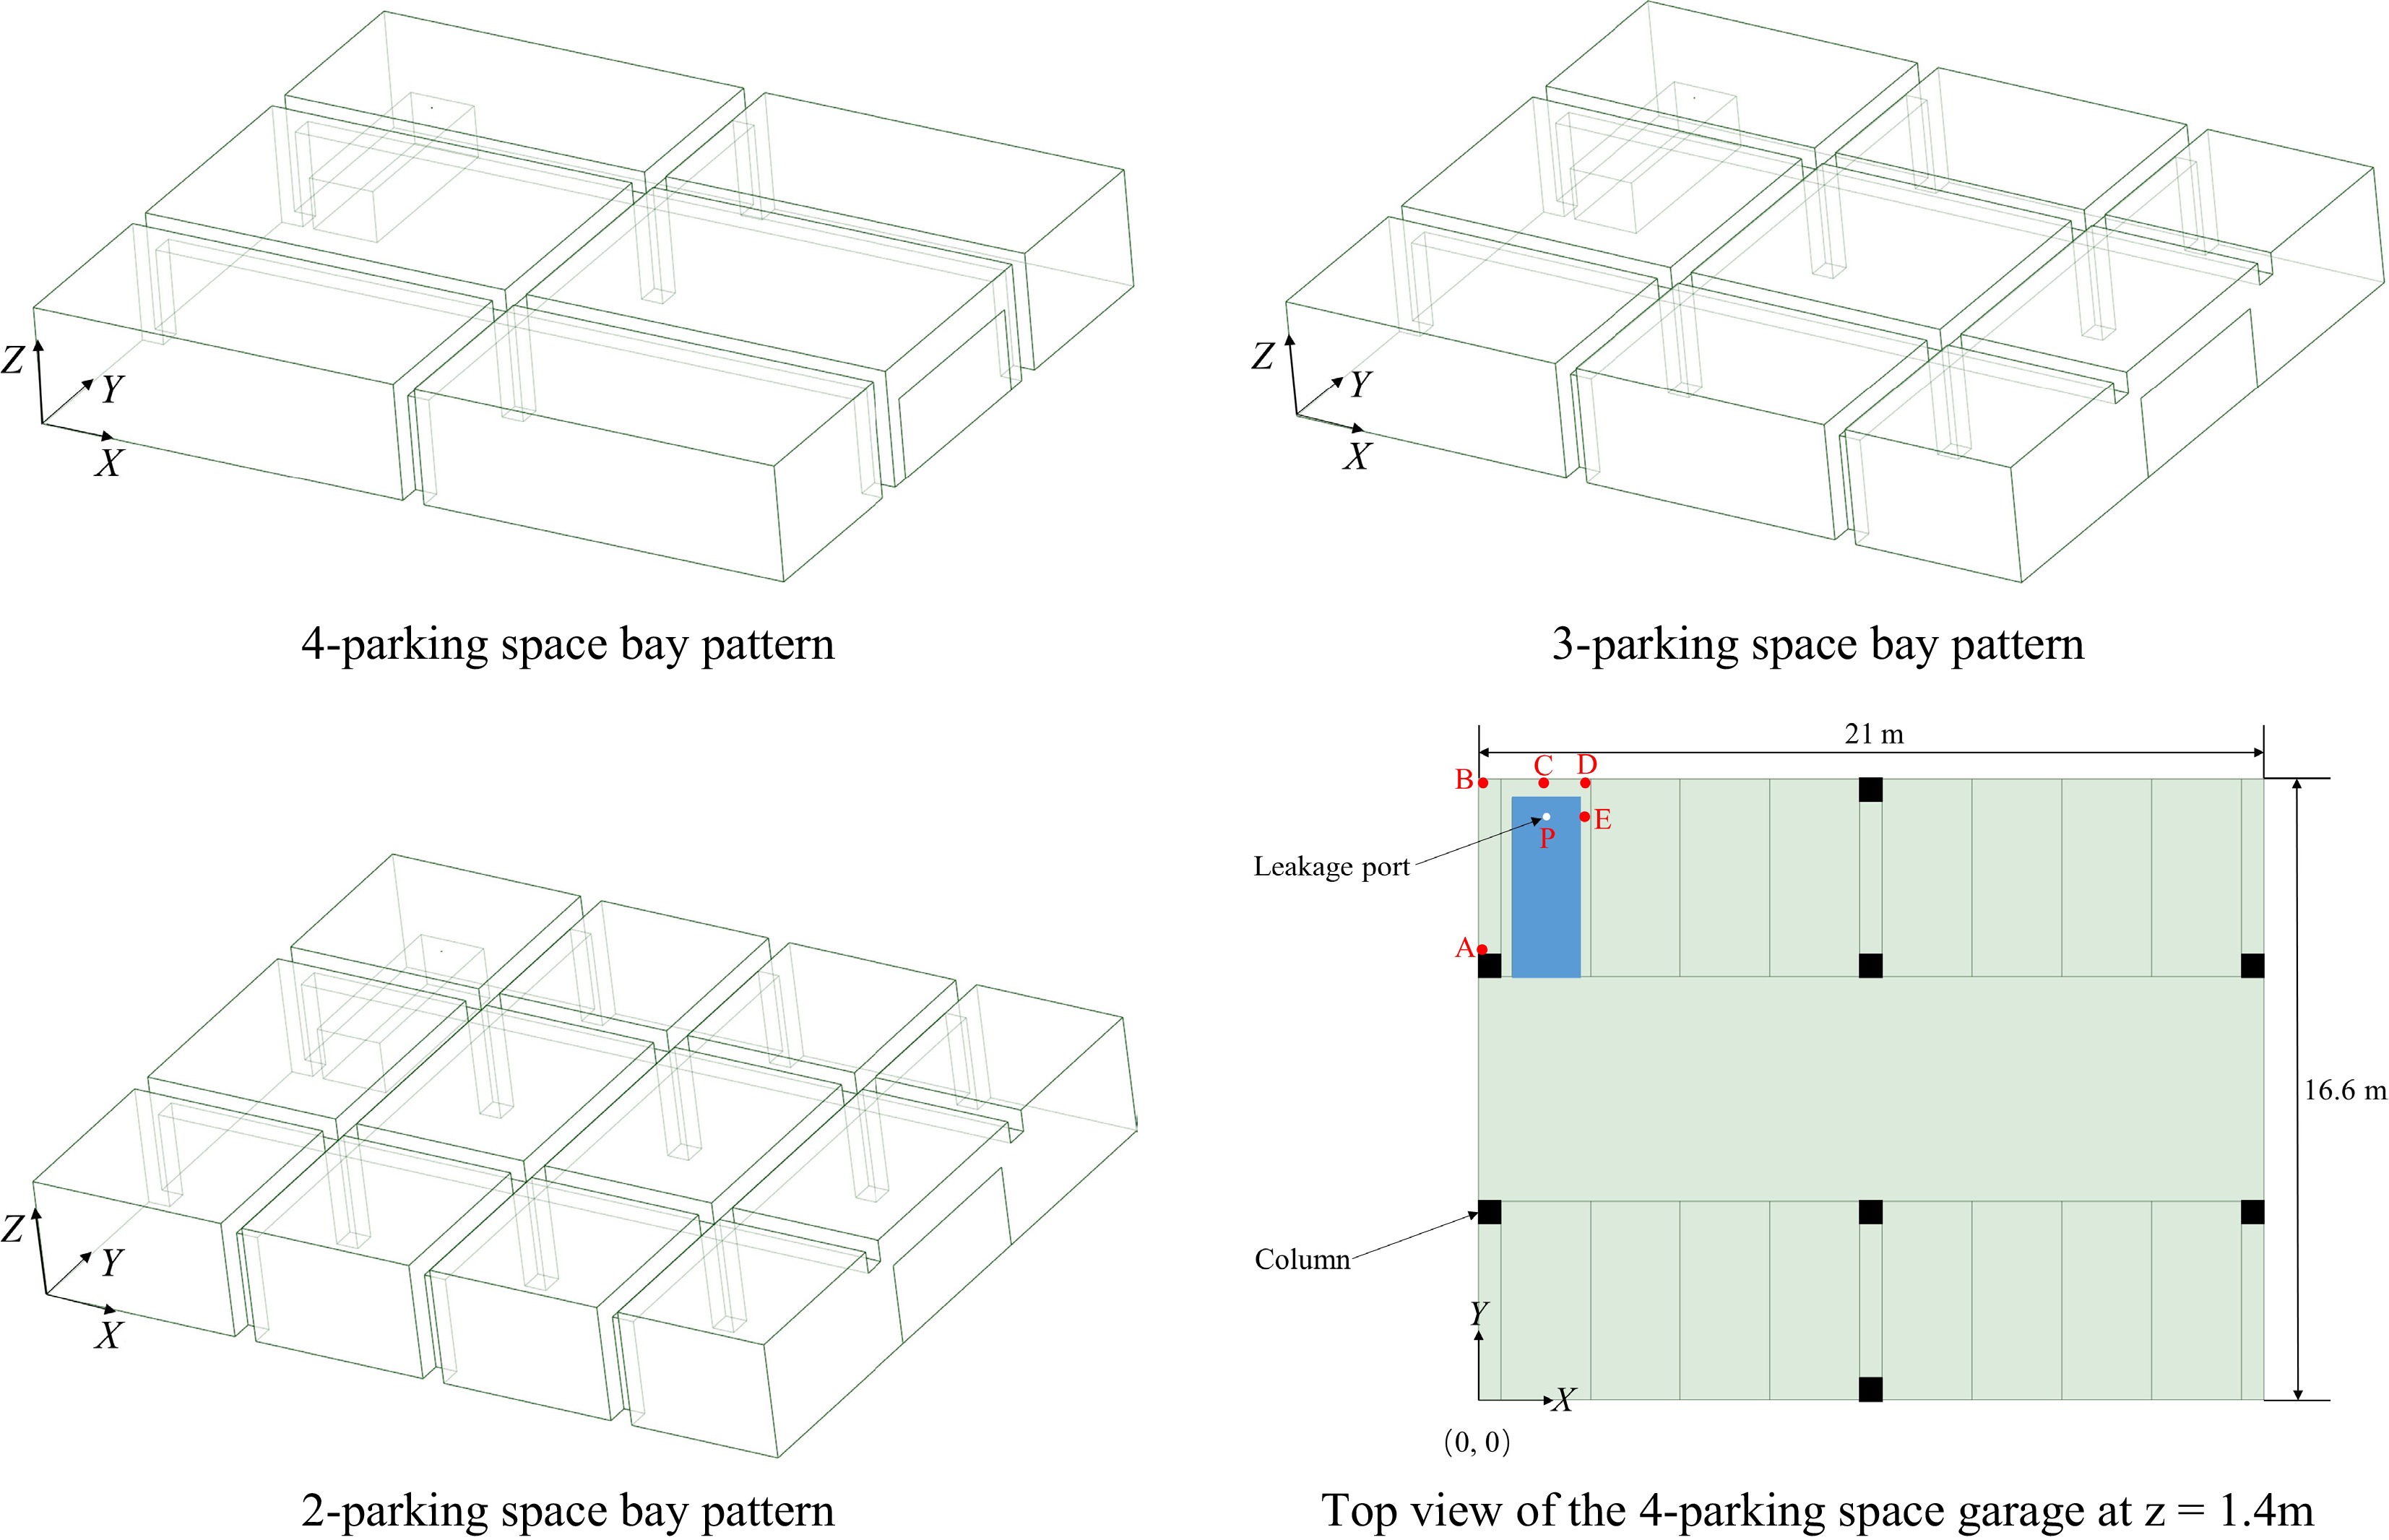
Figure 1.
Geometric model of the garage with different parking space modes and the base view of the garage with a 4-parking space mode.
Assuming that a hydrogen fuel cell vehicle parked at the corner of an underground garage experiences an accidental leakage, with hydrogen escaping upwards through a 2 mm circular leak hole. The internal pressure of the hydrogen tank is 35 MPa, while the temperature and pressure inside the underground garage are 300 K and 101.325 kPa, respectively. The parameters of the hydrogen leak hole are calculated using the modified Brich1987 virtual nozzle model, which incorporates the Abel-Nobel real gas equation of state[22]. According to the model, the hydrogen mass flow rate at the leak hole is determined to be 0.0678 kg/s. This leakage rate is used to investigate the diffusion and distribution patterns of high-pressure hydrogen in the event of accidental leakage within the underground garage. The specific parameters at the leakage point are presented in Table 1. The simulated conditions for this study are outlined in Table 2.
Table 1. Summary of hydrogen leakage port parameters.
Parameter Actual leakage port Virtual nozzle Diameter (mm) 2 21.8 Velocity (m/s) 1369.3 2217.9 Temperature (K) 249 300 Pressure (MPa) 18.4 0.101325 Pressure inside the bottle (MPa) 35 Temperature inside the bottle (K) 300 Ambient temperature (K) 300 Ambient pressure (MPa) 0.10325 Table 2. Summary of modelled conditions.
Serial number Parking space
bay patternVentilation mode No. of ventilation openings 1 2 No 0 2 3 No 0 3 4 No 0 4 4 Mechanical ventilation 2 5 4 Mechanical ventilation 4 Numerical method
-
In this paper, Fluent software is used to conduct a simulation study on hydrogen leakage and diffusion. During the calculation process, the mass conservation equation, energy conservation equation, momentum conservation equation, and species transport equation are employed to describe the behavior of hydrogen leakage and diffusion[23]. However, since the high-pressure hydrogen leakage studied in this paper also involves turbulent flow, the turbulence control equation must be considered as well. The following are the governing equations involved in this study:
(1) Mass conservation equation
$ \dfrac{\partial \rho }{\partial t}+\dfrac{\partial \left(\rho {u}_{i}\right)}{\partial {x}_{i}}=0 $ (1) where, ui is the component of the velocity vector in the direction of x, y, z, m/s; ρ is the density of the substance, kg/m3.
(2) Energy conservation equation
$\dfrac{\partial \left(\rho T\right)}{\partial t}+\dfrac{\partial \left(\rho {u}_{i}T\right)}{\partial {x}_{i}}=-\dfrac{\partial }{\partial {x}_{i}}\left(\dfrac{k}{{c}_{p}}\frac{\partial T}{\partial {x}_{i}}\right) $ (2) where, cp is the specific heat capacity, J/(kg K); k is the heat transfer coefficient of the fluid; T is the fluid temperature, K.
(3) Momentum conservation equation
$ \dfrac{\partial \left(\rho {u}_{i}\right)}{\partial t}+\dfrac{\partial \left(\rho {u}_{i}{u}_{j}\right)}{\partial {x}_{j}}=-\dfrac{\partial p}{\partial {x}_{i}}+\dfrac{\partial {\tau }_{ji}}{\partial {x}_{j}}+{F}_{i} $ (3) where, p is the pressure, Pa; τji is the component of the viscous force in the x, y, z direction; Fi is the component of the volumetric force in the x, y, z direction.
(4) Component transport equations
$\dfrac{\partial \left(\rho {c}_{s}\right)}{\partial t}+\dfrac{\partial \left(\rho {c}_{s}{u}_{i}\right)}{\partial {x}_{i}}=\dfrac{\partial }{\partial {x}_{i}}\left[{D}_{s}\dfrac{\partial \left(\rho {c}_{s}\right)}{\partial {x}_{i}}\right] $ (4) Where, cs is the volume fraction of component s; Ds is the diffusion coefficient of component s.
(5) Turbulence modelling
Currently, the widely used numerical simulation methods for turbulence can be classified into DNS (Direct Numerical Simulation), LES (Large Eddy Simulation), and RANS (Reynolds-Averaged Navier-Stokes). Compared to DNS and LES, RANS requires significantly fewer computational resources such as processor and memory, and it can significantly reduce the computation time. Therefore, RANS is widely used in practical engineering applications. The turbulence model adopted in this paper is the Realizable
$k-\epsilon $ $ \dfrac{\partial \left(\rho k\right)}{\partial t}+\dfrac{\partial \left(\rho k{u}_{i}\right)}{\partial {x}_{i}}=\dfrac{\partial }{\partial {x}_{j}}\left[\left(\mu +\dfrac{{\mu }_{t}}{{\sigma }_{k}}\right)\dfrac{\partial k}{\partial {x}_{j}}\right]+{G}_{k}-\rho \varepsilon $ (5) $ \dfrac{\partial \left(\rho \varepsilon \right)}{\partial t}+\dfrac{\partial \left(\rho \varepsilon {u}_{i}\right)}{\partial {x}_{i}}=\dfrac{\partial }{\partial {x}_{j}}\left[\left(\mu +\dfrac{{\mu }_{t}}{{\sigma }_{\varepsilon }}\right)\dfrac{\partial \varepsilon }{\partial {x}_{j}}\right]+\rho {C}_{1}E\varepsilon -\rho {C}_{2}\dfrac{{\varepsilon }^{2}}{k+\sqrt{\nu \varepsilon }} $ (6) where, μt is the turbulent viscosity; Gk is the generation term of turbulent kinetic energy k induced by the mean velocity gradient; σk and σε are the Prandtl numbers corresponding to the turbulent kinetic energy k and the turbulent dissipation rate ε, which are taken as 1.0 and 1.2, respectively; and C1 and C2 are the empirical constants, which are taken as 1.44 and 1.92, respectively.
The basic governing equations can be simplified based on several assumptions, which are outlined in this paper[25] as follows:
(1) Hydrogen is released at a constant leakage rate;
(2) No chemical reactions or phase changes occur after hydrogen leakage;
(3) The walls of the underground garage are isothermal, adiabatic, and smooth.
Boundary conditions, initial conditions, and meshing settings
Inlet boundary conditions
-
The inlet boundary is set as a mass flow inlet for hydrogen. Pure hydrogen is specified at the inlet, with a hydrogen mass flow rate calculated by the model as 0.0678 kg/s. The leakage direction at the inlet is set perpendicular to the inlet surface. When ventilation conditions are added, the supply air inlet is set as a velocity inlet with a magnitude of 3 m/s, and the velocity direction is set perpendicular to the inlet surface.
Outlet boundary conditions
-
The underground garage door studied in this paper is set as a pressure outlet boundary condition with a gauge pressure of 0. When ventilation is added, the exhaust outlet is also set as a pressure outlet boundary condition.
Wall boundary conditions
-
The walls, beams, columns, and surfaces of hydrogen fuel cell vehicles in the underground garage are all set as solid walls, adopting no-slip and no-mass penetration conditions.
Initial conditions
-
The simulation uses a pressure-based transient solver, with a time step interval set to 0.1 s. For all simulations, the Semi-Implicit Method for Pressure Linked Equations (SIMPLE) method and second-order spatial discretization are used. The gravitational acceleration is −9.81 m/s2, and the ambient temperature and pressure in the underground garage are 300 K and 1.01325 × 10⁵ Pa, respectively. Additionally, the total hydrogen leakage time is set to 74 s.
Mesh generation
-
This paper uses SpaceClaim under the WorkBench platform for 3D modeling. Considering the large spatial domain and small leakage port in this simulation, it is necessary to locally refine the mesh at the leakage port, the ceiling above the leakage port, ventilation ports, and garage doors to improve mesh quality and calculation accuracy. The fluid domain is divided into tetrahedral meshes with a minimum length set to 0.01 and a maximum length set to 0.1. After a mesh independence test, a mesh size of 700,000 is selected for subsequent calculation and simulation. Figure 3 shows the overall mesh and locally refined mesh diagrams of the underground garage in 4-parking space, 3-parking space, and 2-parking space bay modes, respectively.
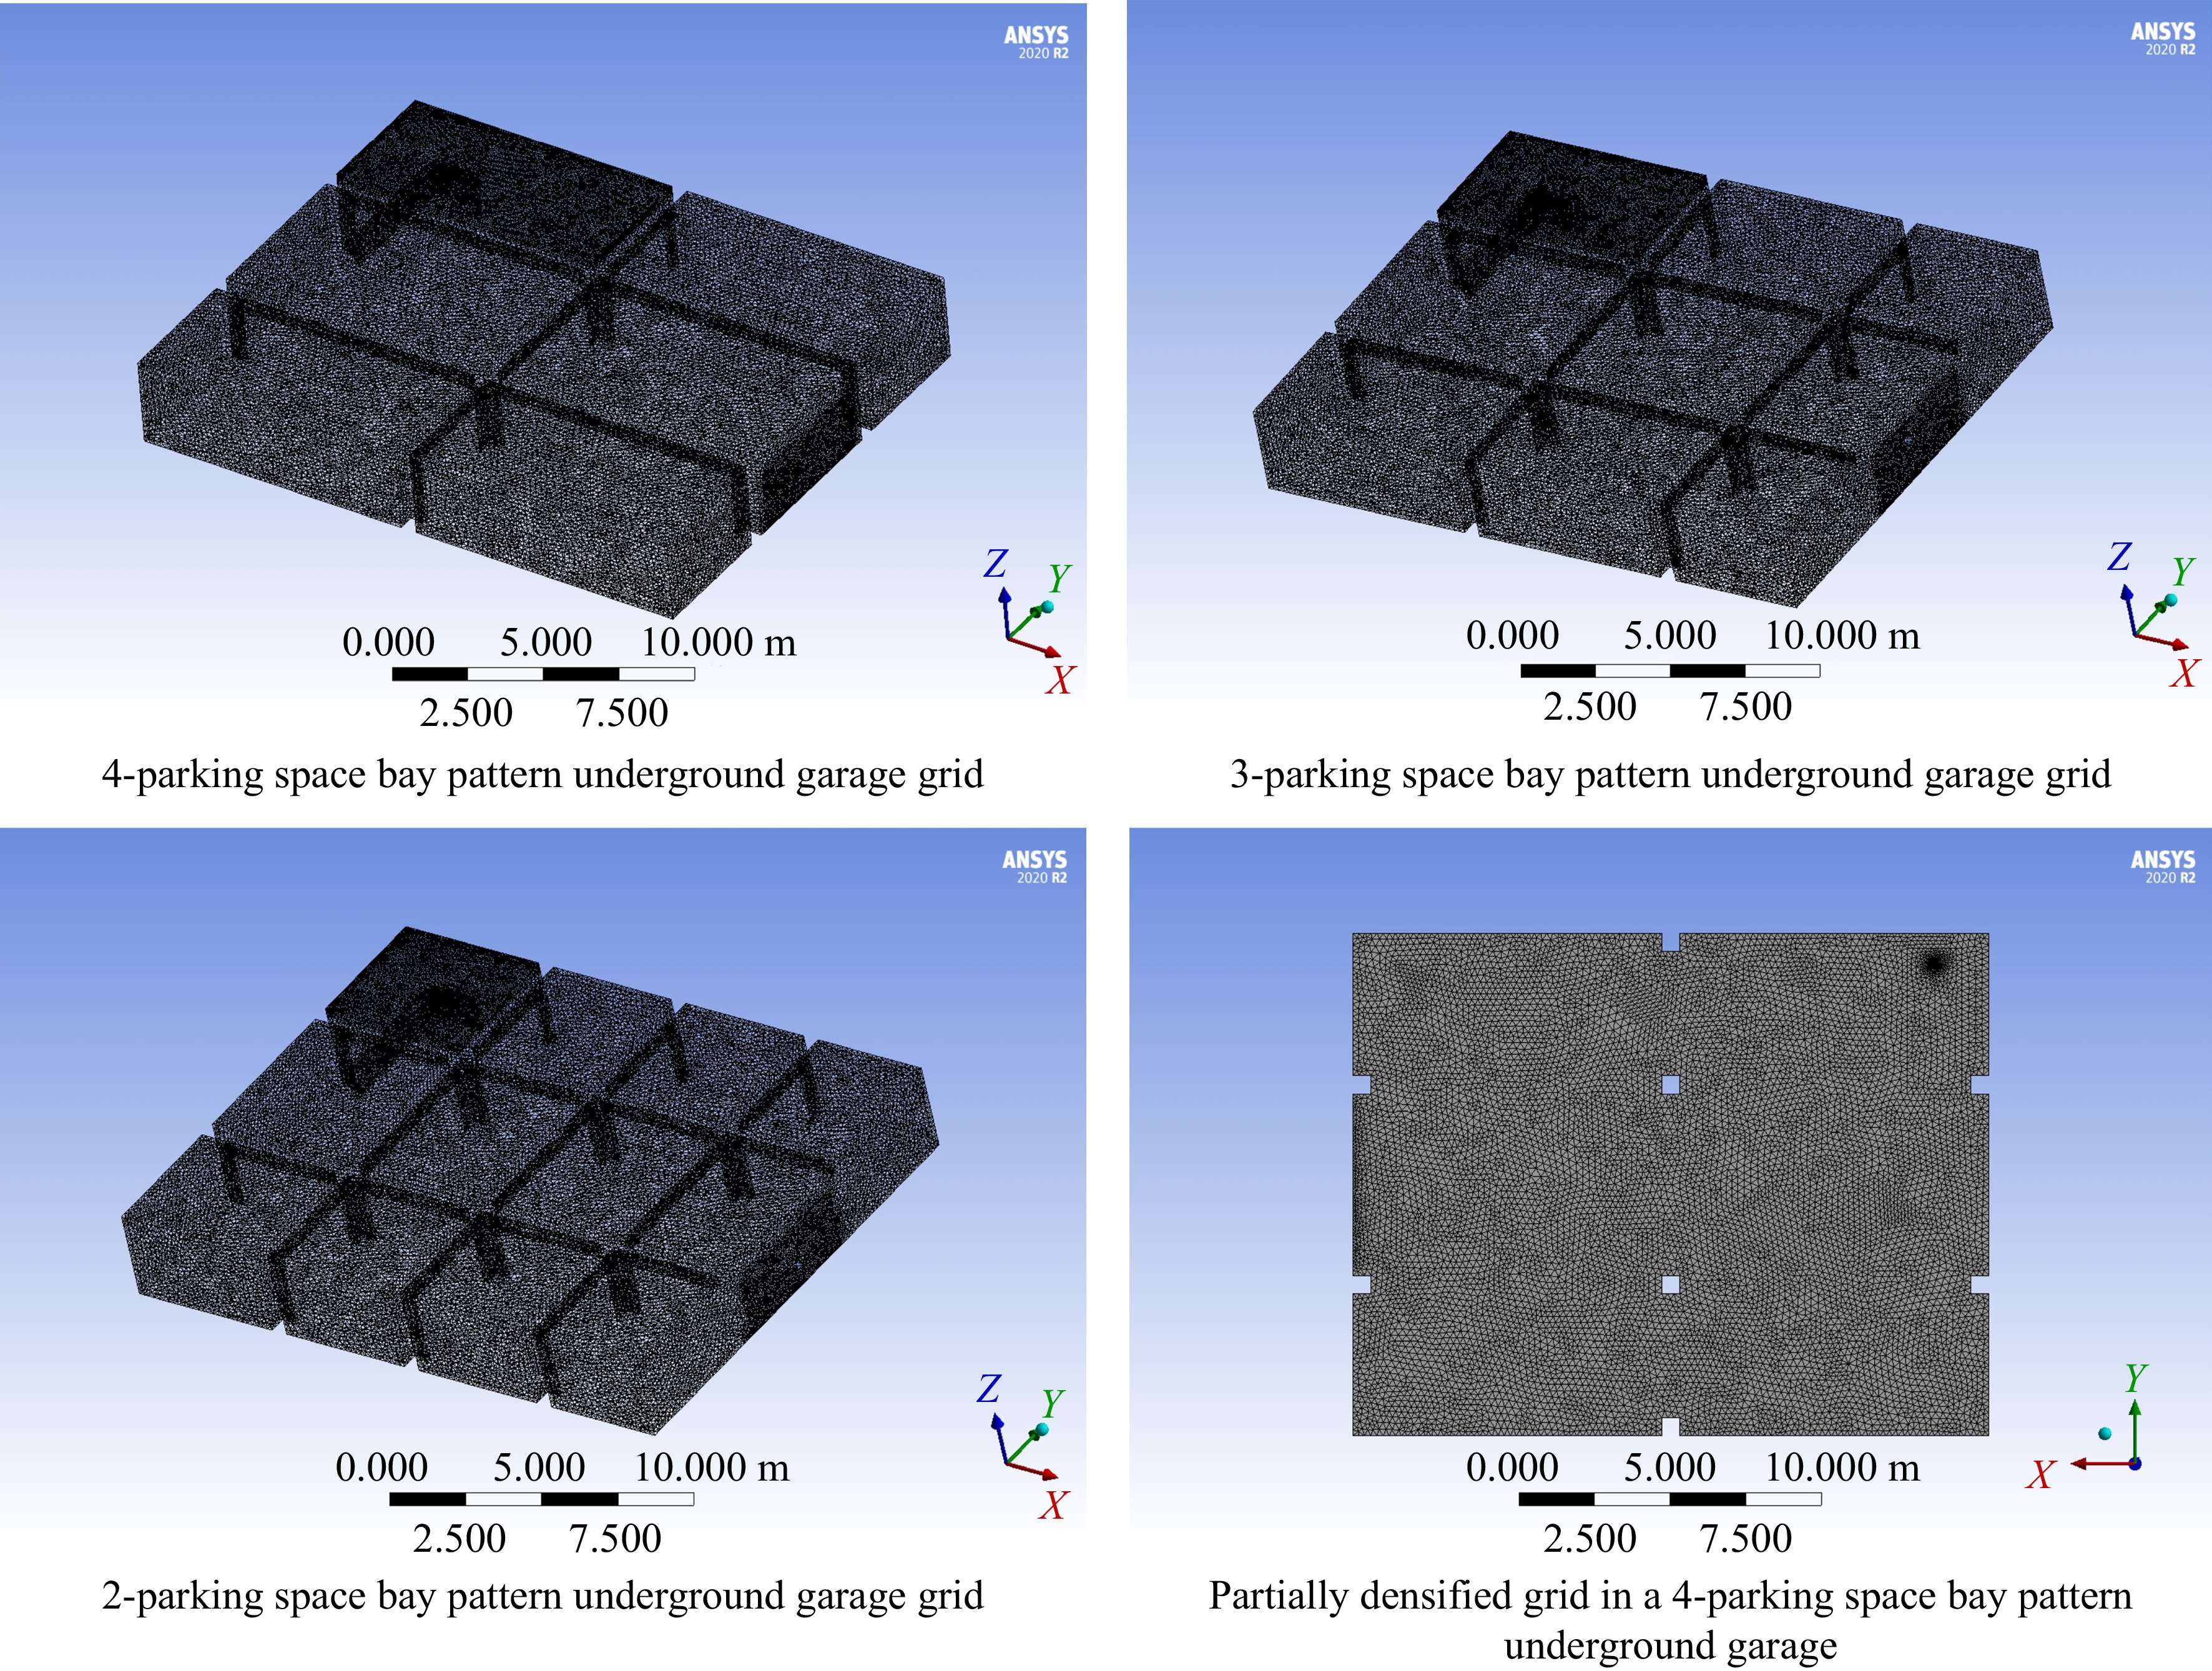
Figure 3.
Schematic diagram of grid division and local encrypted grid for underground garage with different parking space modes.
Validation of the accuracy of the numerical model
-
To verify the accuracy of the CFD model and method, this paper constructs a geometric model based on the experiment conducted by Pitts et al.[26], proceeds with simulations, and finally compares the simulation results with experimental data.
As shown in Fig. 4, Pitts et al.[26] built a garage model with dimensions of 6.10 m × 6.10 m × 3.05 m. There is a closed door with a width of 2.4 m and a height of 2.1 m on the front of the model. Two ventilation ports, each with dimensions of 0.2 m × 0.2 m, are located 2.3 m from the right side of the model. A square hydrogen leak source with dimensions of 0.305 m × 0.305 m × 0.15 m is placed at the center of the model and is connected to an external hydrogen storage cylinder. The external hydrogen cylinder supplies hydrogen at a uniform rate of 83.3 g/min, with a leakage duration of 3600 s. Two sensors are placed inside the garage to measure hydrogen concentration, located at (0, 2.44, 0.76) and (0, 2.44, 3.05), respectively.
To quickly generate the mesh and improve computational efficiency, the computational domain of the garage is divided into tetrahedral meshes and local refinement is applied to the leak source, ventilation ports, as well as horizontal and vertical directions of the leak source. This is done to enhance mesh quality and calculation accuracy. After a mesh independence test, a final mesh count of 640,000 is determined. The geometric model of the garage and the mesh division are shown in Fig. 5.
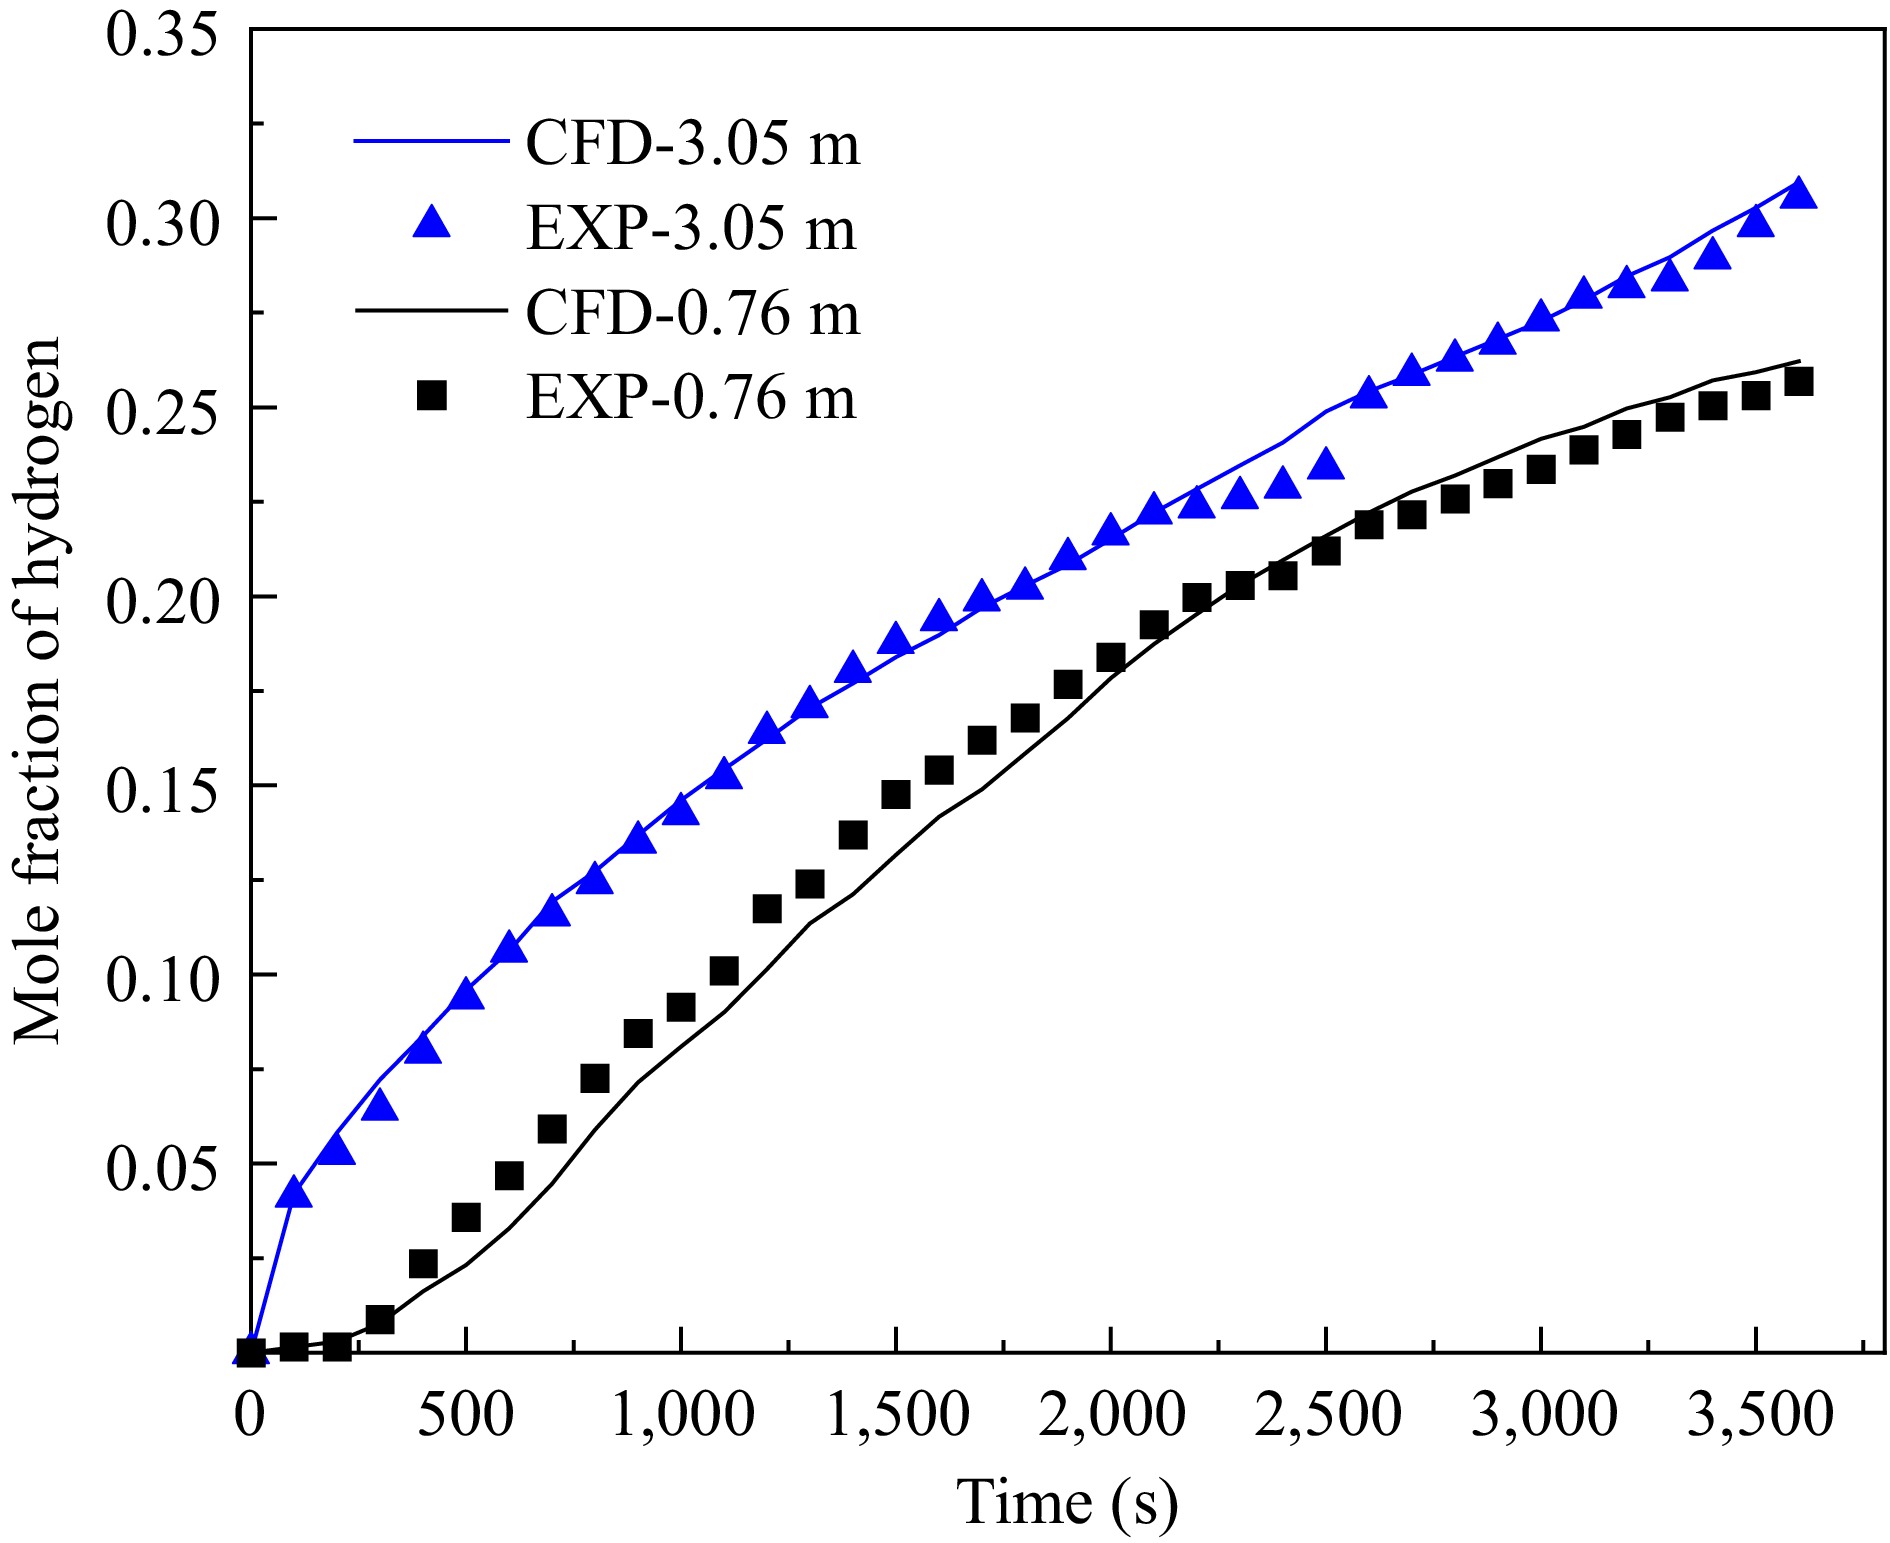
As can be seen from Fig. 6, the change curve of hydrogen mole fraction obtained from numerical simulation is consistent with the experimental data in trend and roughly similar in data, reflecting the characteristic that the hydrogen concentration is higher at higher locations. The error is within an acceptable range. Therefore, it can be considered that the use of CFD software for numerical simulation of hydrogen leakage scenarios in the garage matches well with the actual situation, indicating that this method is effective and feasible.
-
The internal structure of underground garages can vary depending on the parking space mode. As seen in Fig. 1, as the parking space mode changes from 4-parking space to 3-parking space, to 2-parking space mode, the number of columns and beams in the garage increase sequentially. Therefore, when a hydrogen leak occurs in the garage, these internal structures may affect the concentration distribution of hydrogen in the space.
Figure 7 depicts the changes in the volume fraction of the flammable hydrogen region in underground garages under different parking space modes. It can be observed that in the first 15 s of the leak, which is the initial stage, the volume fraction of the flammable hydrogen region in underground garages under different parking space modes changes regularly. During this phase, the explosion risk is the lowest in the 4-parking space mode, while it is the highest in the 2-parking space mode. When the leak duration exceeds 15 s, as the hydrogen leak time increases, the change pattern in the volume fraction of the flammable hydrogen region in garages under different parking space modes is opposite to that in the initial stage. This means that the explosion risk gradually becomes the highest in the 4-parking space mode, while it becomes the lowest in the 2-parking space mode. It is noteworthy that at 74 s, the volume fractions of the flammable region in the 4-parking space, 3-parking space, and 2-parking space modes are 56.6%, 48.7%, and 43.2%, respectively. There is a difference of 13.4% between the flammable region volume fractions in the 4-parking and 2-parking space modes, while the difference between the 3-parking and 2-parking space modes is 5.5%, which is relatively close. The aforementioned differences are mainly attributed to the varying number and positions of columns and beams in the garage under different parking space modes. For example, in the 4-parking space mode, there are eight columns and three rows of beams, which are relatively far from the leak location. After hydrogen leaks upwards into the air, due to its much lower density than air, it initially accumulates at the top of the garage and then diffuses around. When hydrogen diffuses to the beams and columns, it encounters obstructions from these internal barriers, which reduce its diffusion rate to the surrounding areas, causing accumulation and ultimately increasing the explosion risk in the garage. In the 3-parking and 2-parking space modes, the number of columns in the garage is 10 and 14, respectively, and the number of beams is four and five rows, respectively, which are closer to the leak location than in the 4-parking space mode. Among them, the internal obstacles in the 2-parking space mode are the closest to the leak location. Therefore, in the initial stage of the leak, the hydrogen around the leak hole of the hydrogen energy vehicle in the 2-parking space mode is the first to be obstructed by the beams and columns, causing hydrogen to accumulate there, which makes the volume fraction of the flammable hydrogen region in the garage higher than that in the 3-parking and 4-parking space modes during this period. As the leak time progresses, hydrogen gradually crosses the internal obstacles and continues to diffuse around. However, since the beams and columns in the garage under the 4-parking space mode are farther from the leak location compared to the 3-parking and 2-parking space modes, within the same time, the range of hydrogen diffusion in the garage under the 4-parking space mode is larger than that under the other two parking space modes. This ultimately results in the highest explosion risk in the garage space under the 4-parking space mode until the leak stops.
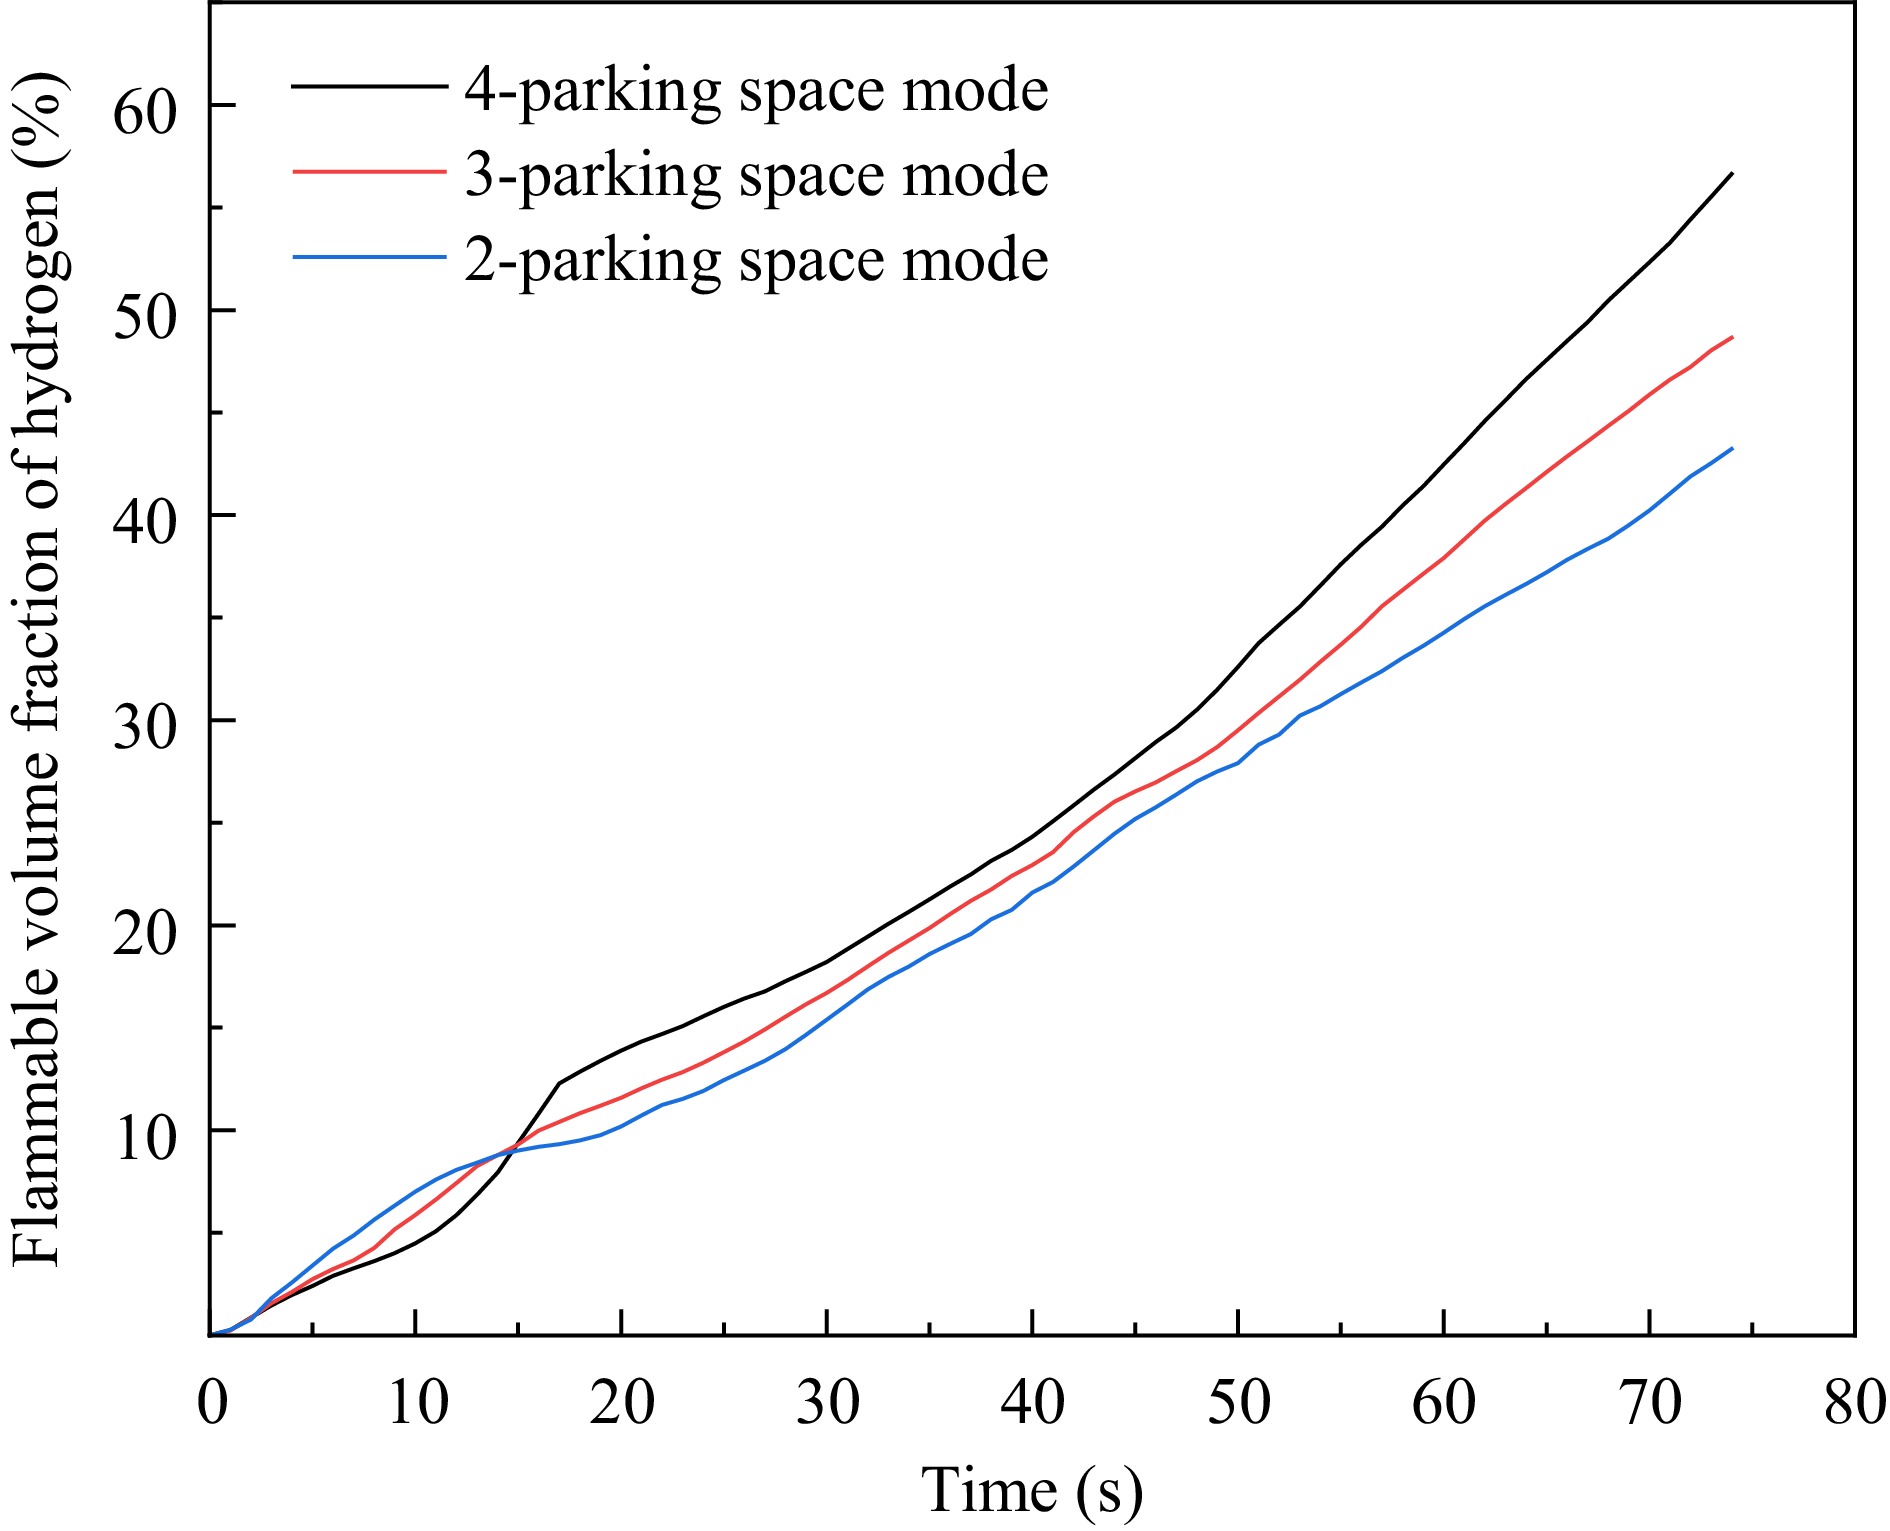
Figure 7.
Volume fraction of hydrogen flammable region in the garage for different parking space modes.
To accurately investigate the patterns of hydrogen volume fraction changes at various locations within the underground garage under the influence of different parking space modes, Fig. 8 presents the temporal variations of hydrogen volume fraction at each monitoring point. As observed from this figure, the evolution patterns of hydrogen volume fraction at the monitoring points are similar. Specifically, point P, due to its location at the top space of the leakage source, consistently exhibits a higher concentration than the other points, posing a greater risk of combustion and explosion. Upon the commencement of hydrogen leakage, the hydrogen volume fraction at each monitoring point rapidly increases within a short timeframe, subsequently experiencing a gradual deceleration in the growth rate. This phenomenon occurs because hydrogen has a much lower density compared to air, and the initial leakage velocity is high. Therefore, in the short period following the leakage, hydrogen accumulates at the top of the space, accelerating the growth rate of hydrogen concentration in the surrounding space of the hydrogen fuel cell vehicle. Subsequently, hydrogen surpasses obstacles such as beams and columns, diffusing into the surrounding area until it reaches the entrance and exit of the garage. At this point, a significant pressure difference exists between the interior and exterior spaces, making it more difficult for hydrogen to accumulate and thereby reducing the growth rate of hydrogen volume fraction. Consequently, the hydrogen volume fraction at each monitoring point gradually approaches a dynamic equilibrium. Furthermore, the hydrogen volume fraction at the monitoring points within the garage exhibits a regular pattern of variation under different parking modes. Specifically, the hydrogen concentration at the monitoring points within the garage is consistently the highest in the 2-parking space mode, while it is the lowest in the 4-parking space mode. This observation corresponds to the changes in the volume fraction of the flammable area within the garage during the initial stage of leakage, as displayed in Fig. 7. This is primarily because as the leak duration increases, hydrogen diffuses over a broader area in the 4-parking space mode, resulting in a more even distribution of hydrogen concentration within the garage, and high-concentration accumulations do not form at localized monitoring points. In contrast, in the 2-parking space mode, due to the larger number of obstacles closer to the leak point, hydrogen accumulates more severely in the overhead space, leading to relatively higher hydrogen concentrations at the monitoring points. This phenomenon reflects the significant differences in hydrogen diffusion characteristics under different parking space modes.
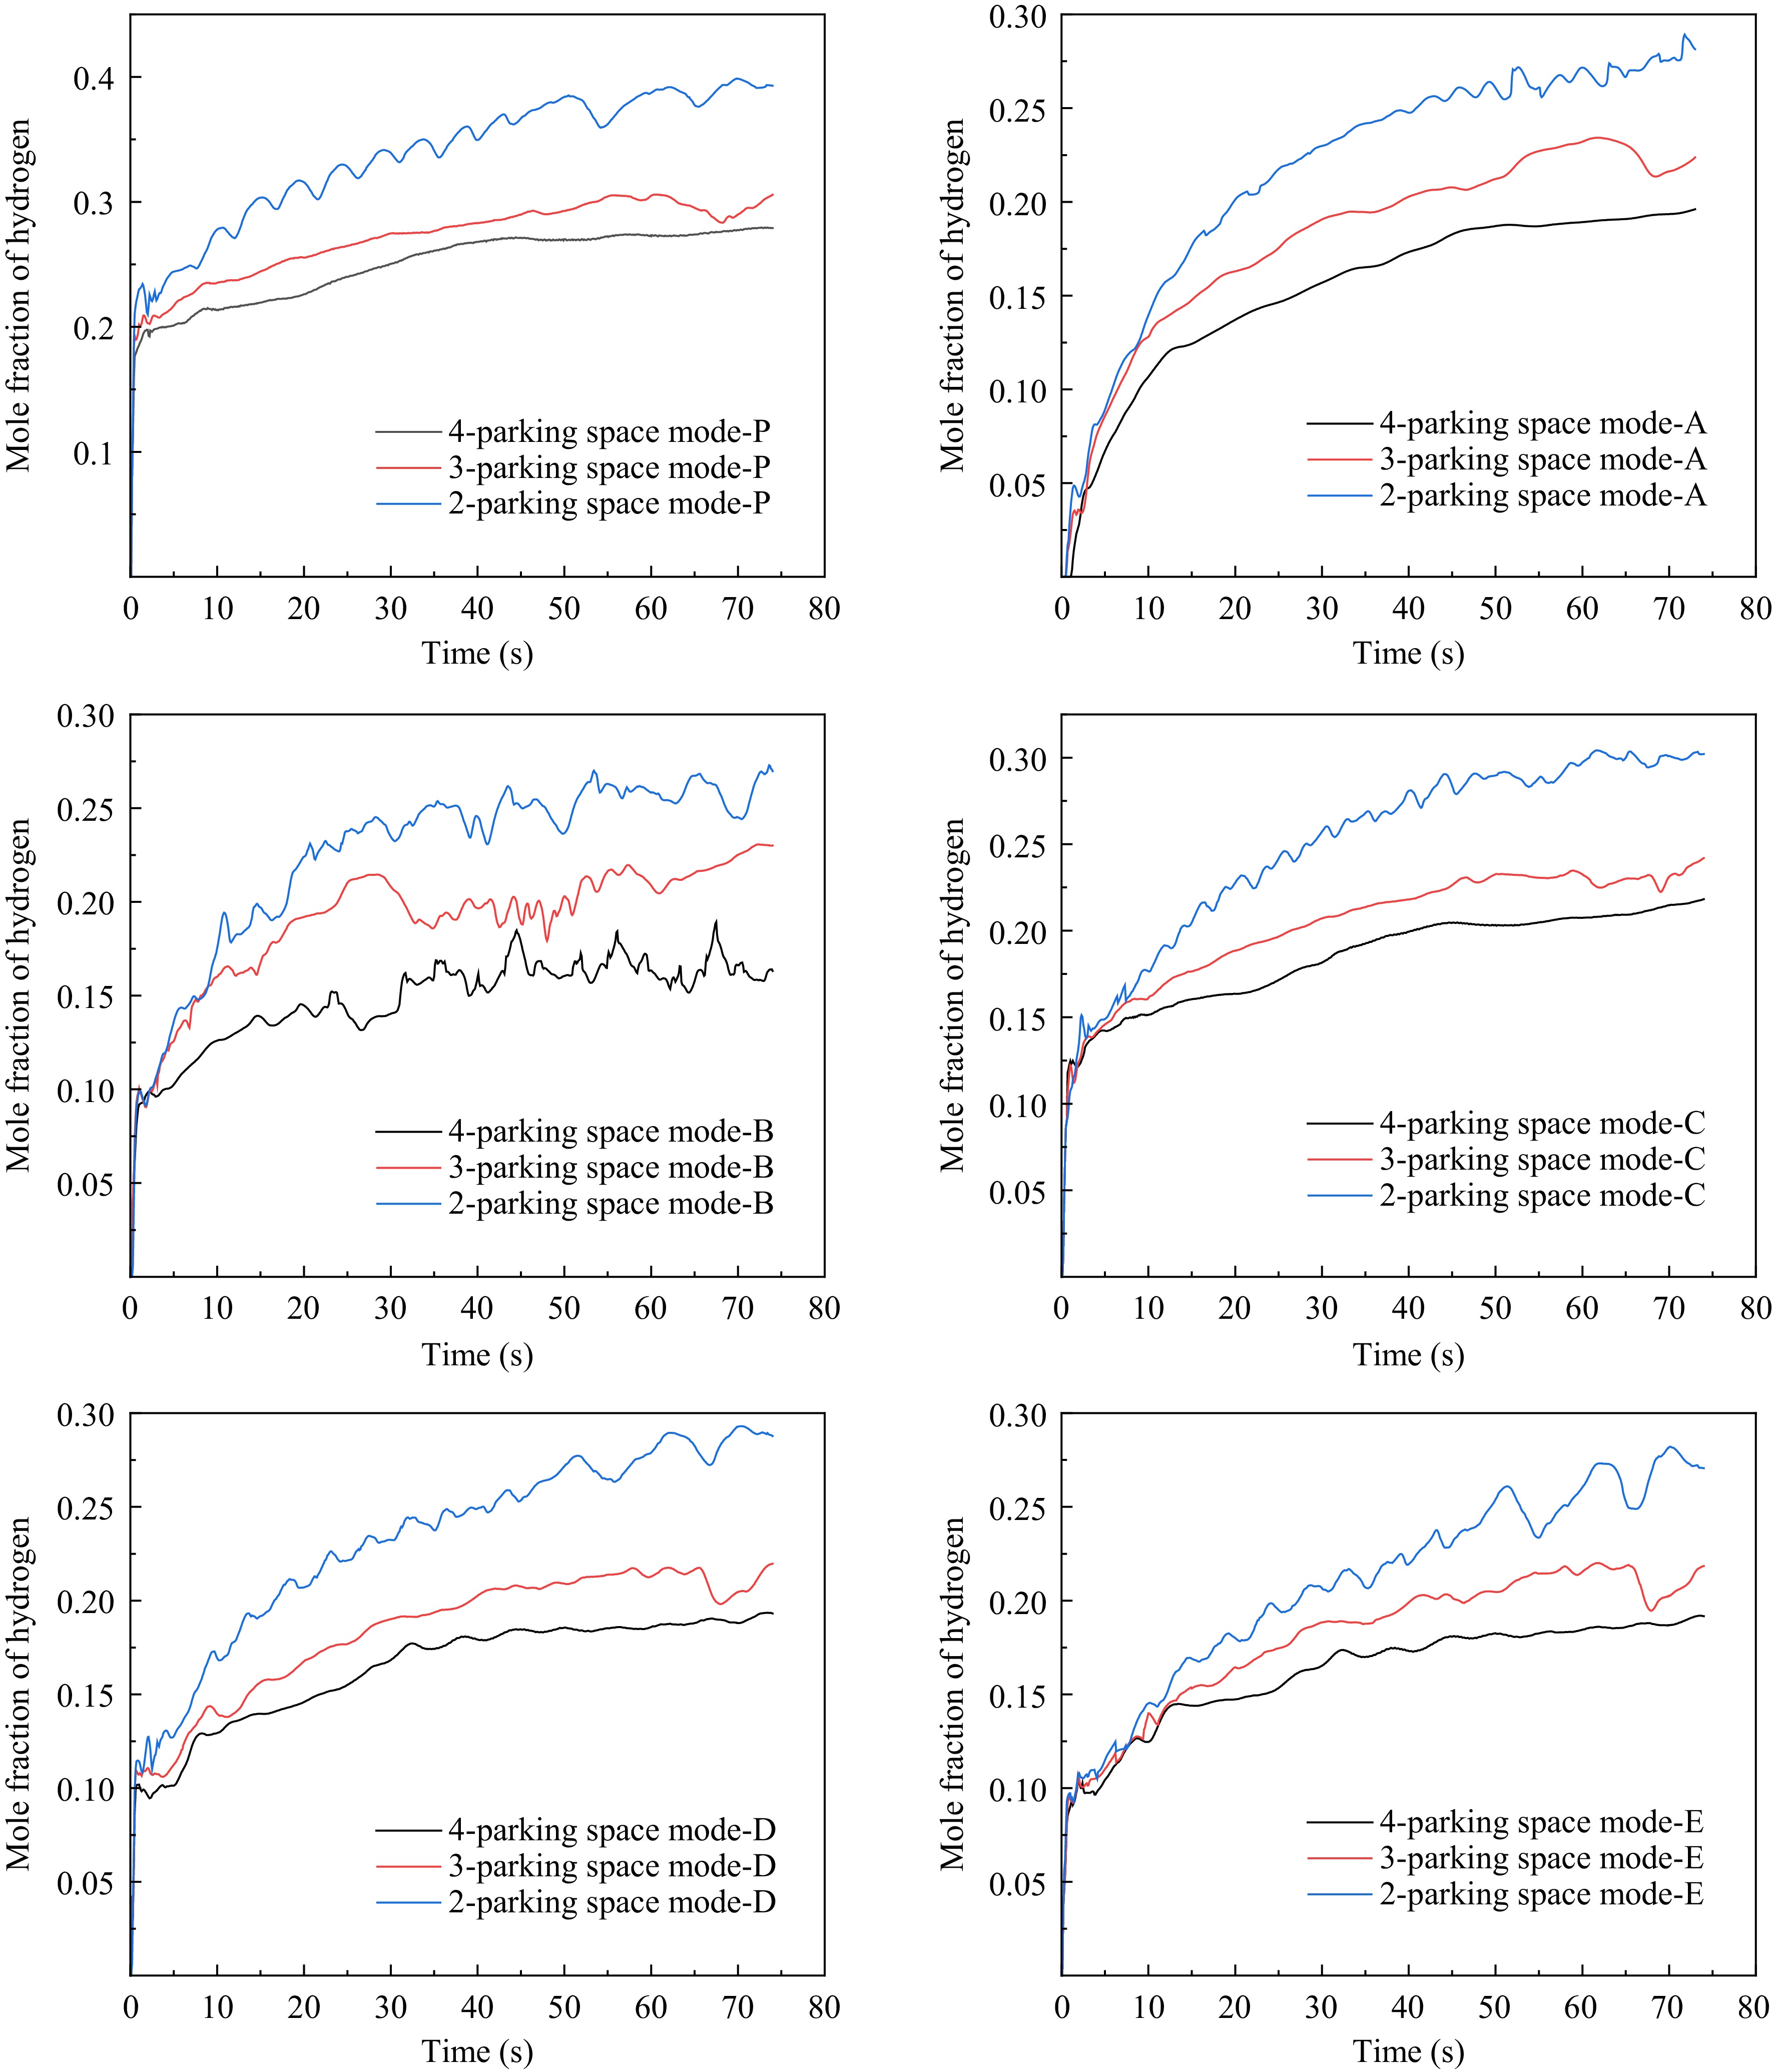
Figure 8.
Variation of hydrogen molar fraction at each monitoring point under different parking space modes.
Figures 9 and 10 respectively exhibit the distribution patterns of hydrogen concentration contours over time at different cross-sections of the leakage point within the garage under various parking modes.
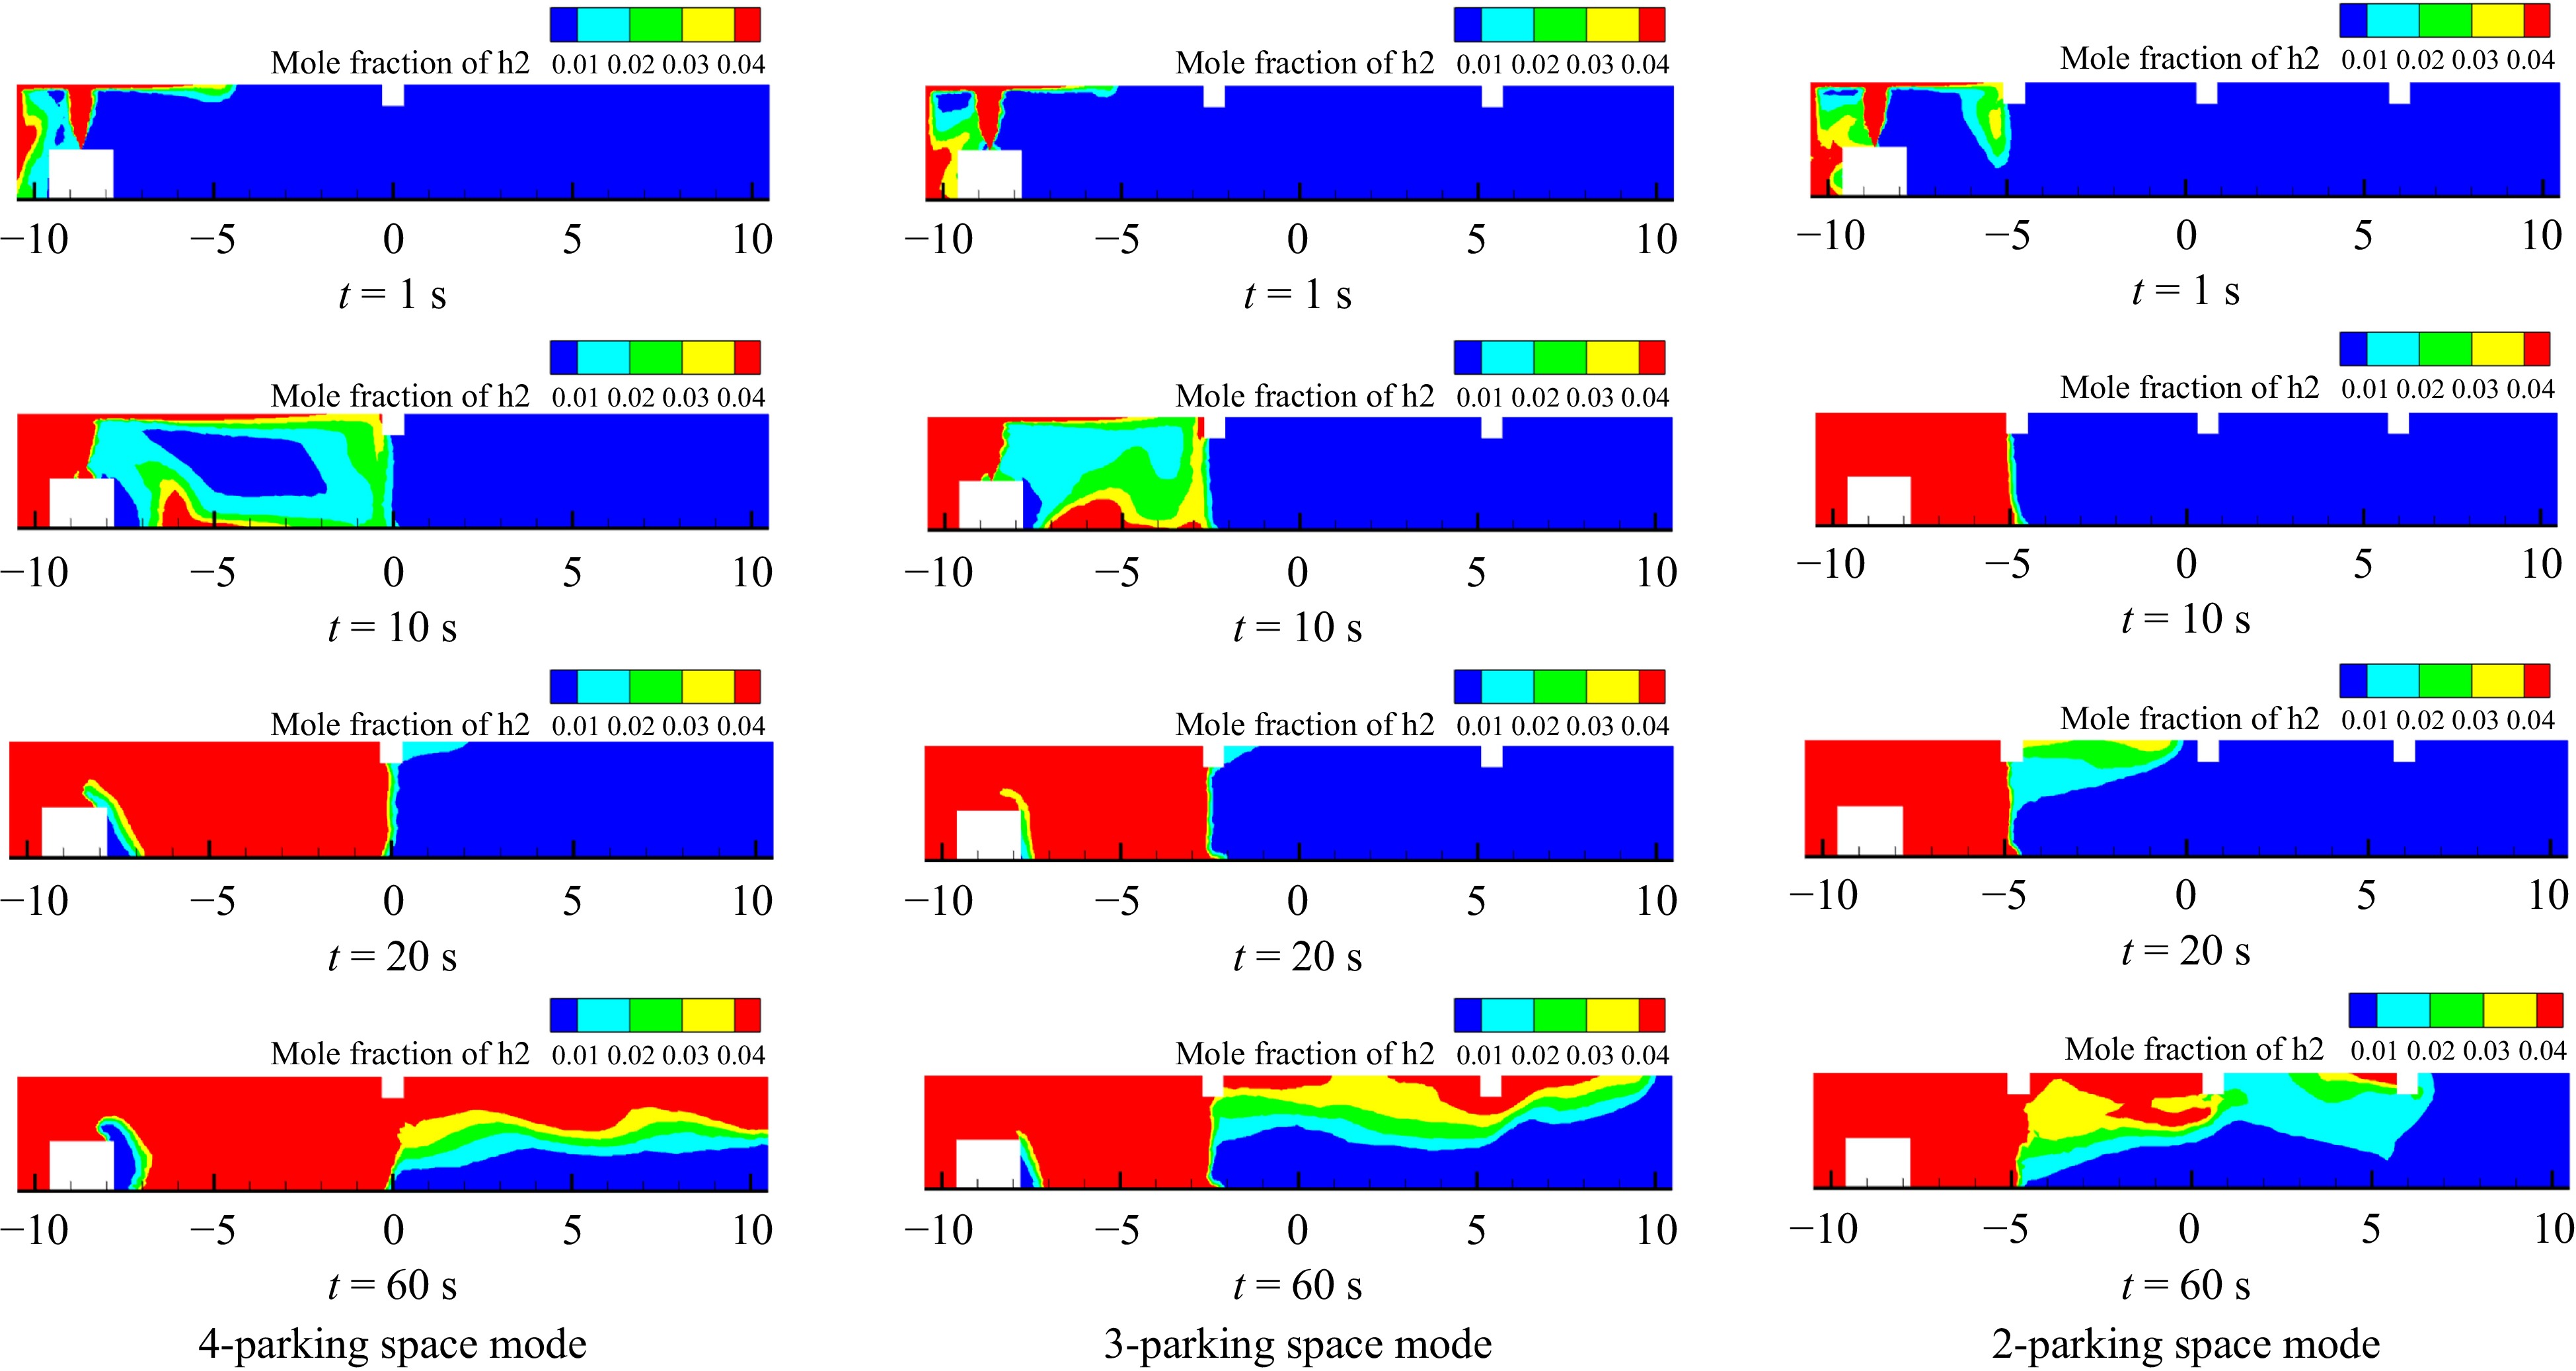
Figure 9.
Cloud plot of hydrogen concentration distribution in the garage at y = 7.3 m for different parking space modes.
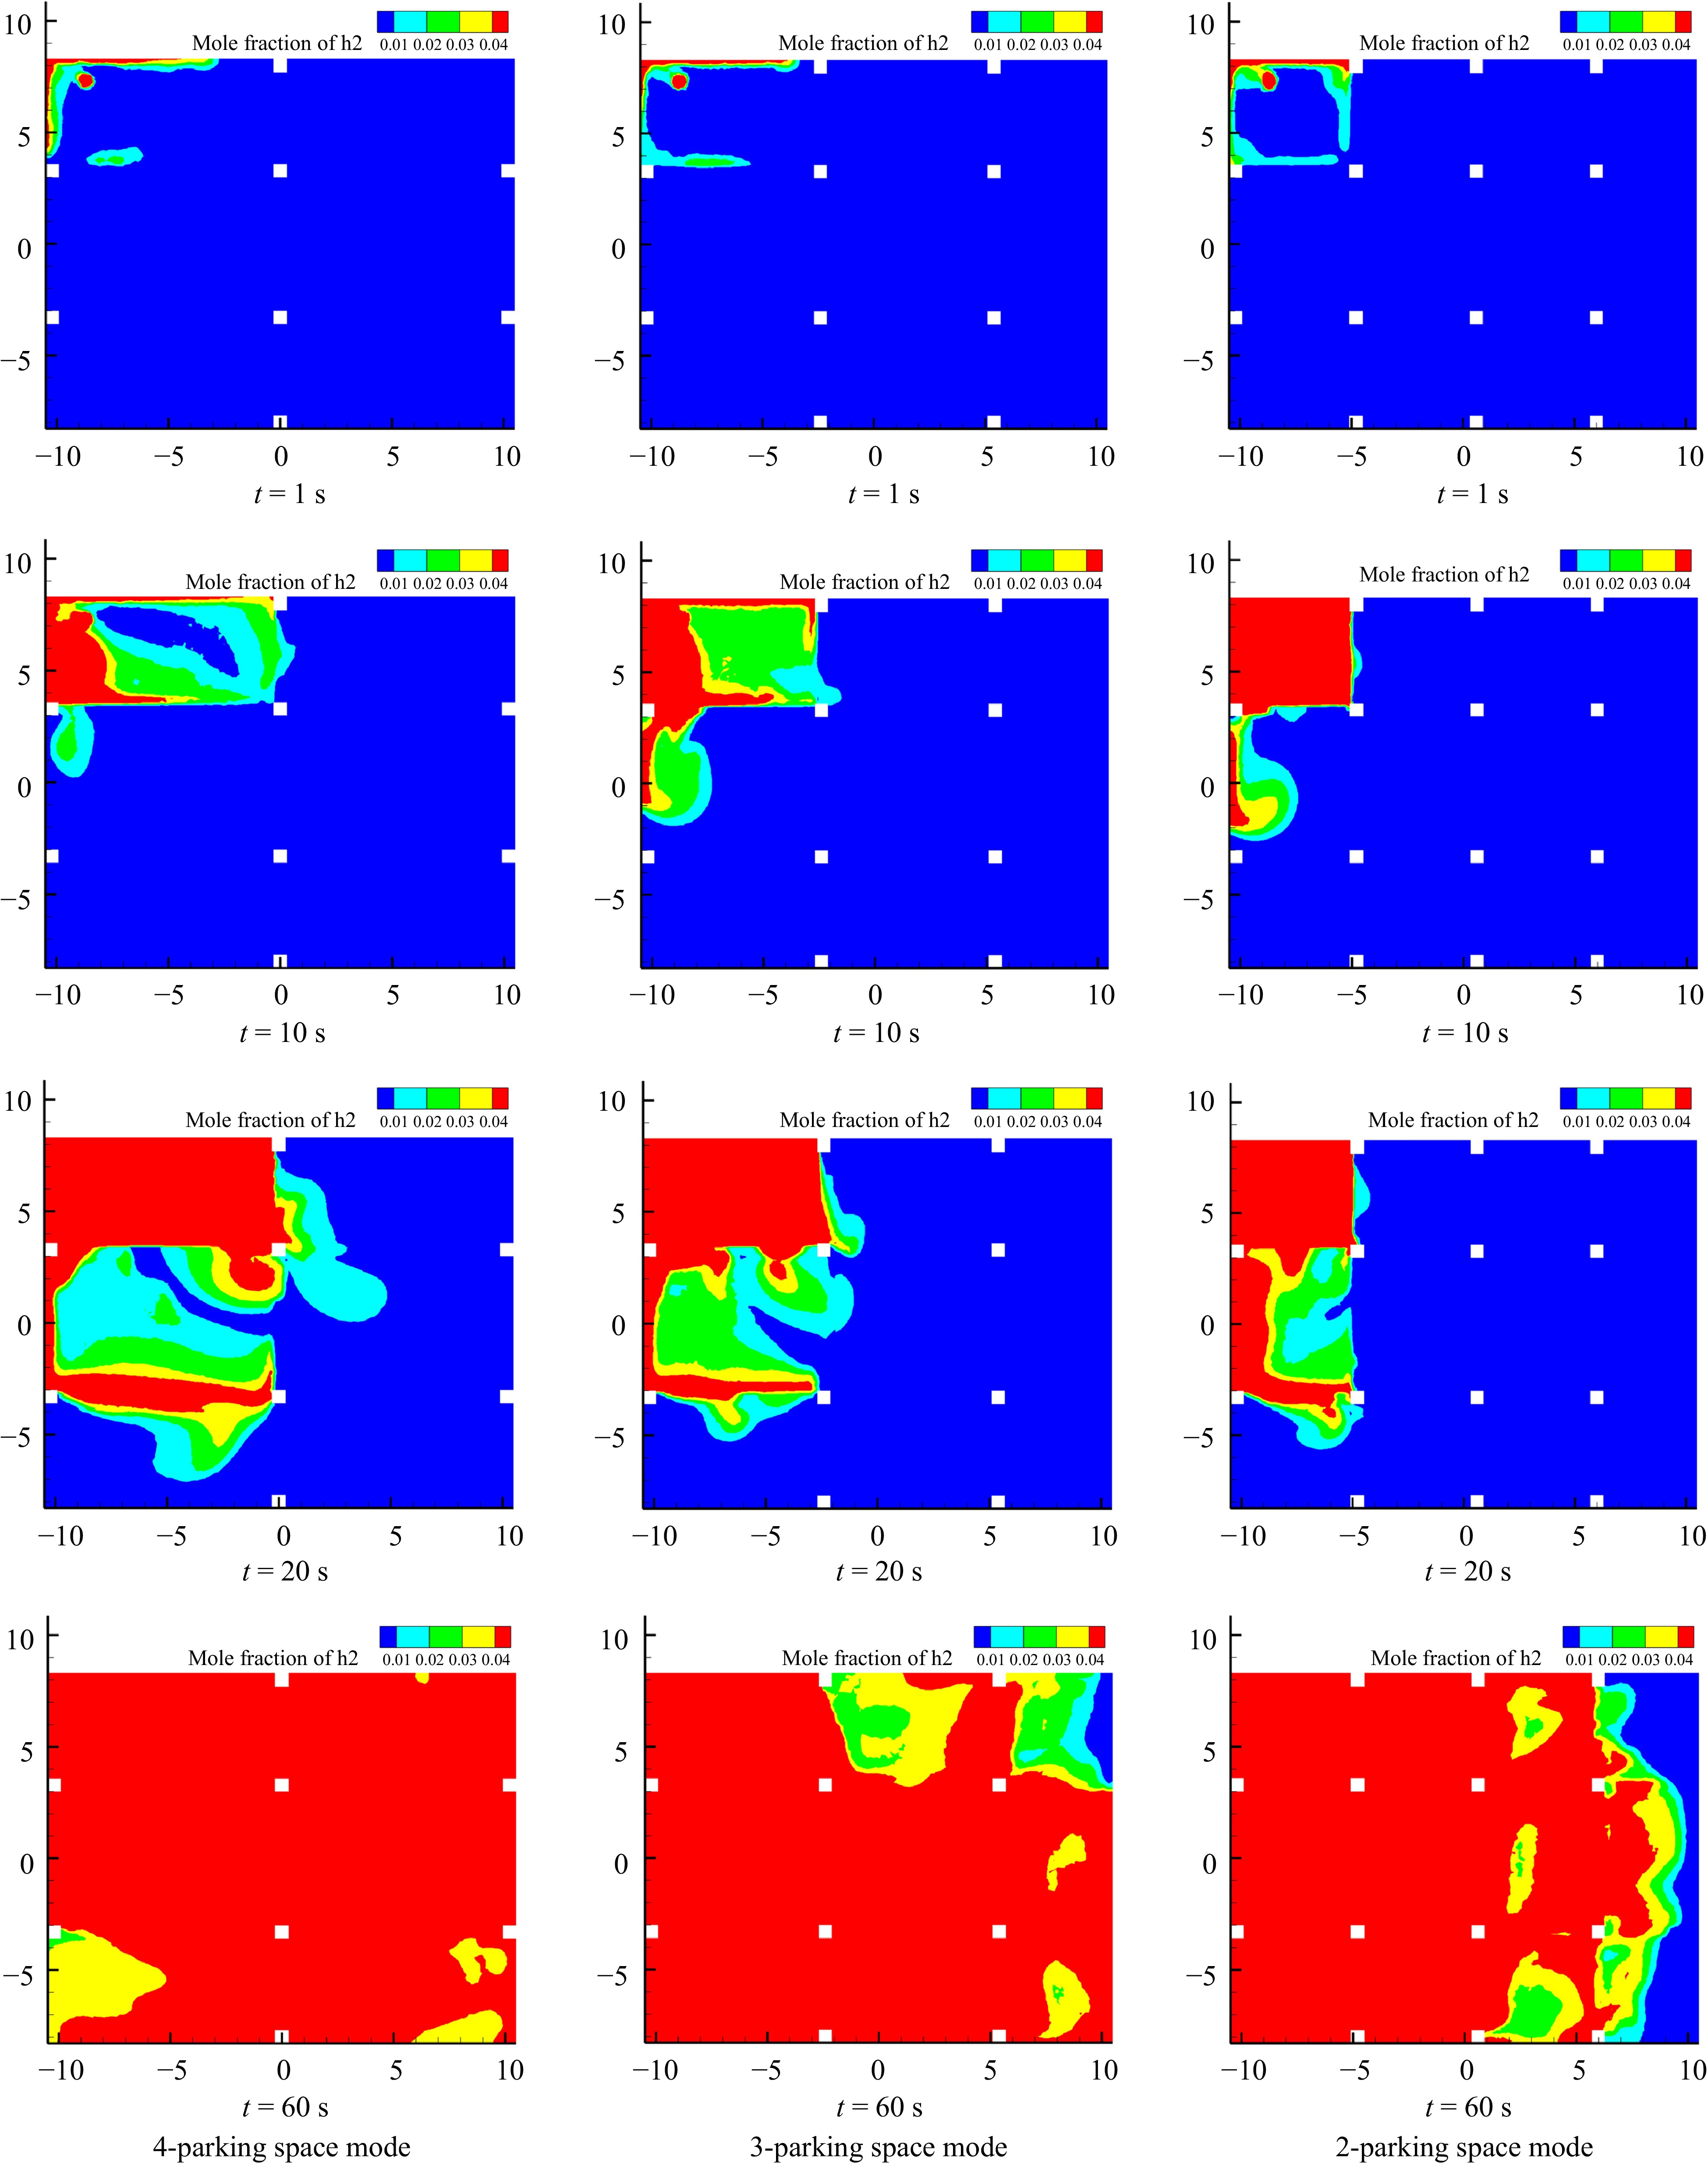
Figure 10.
Cloud plot of hydrogen concentration distribution in the garage at z = 2.6 m for different parking space modes.
For the cross-section at y = 7.3 m, at 1 s after the commencement of the leakage, the high-pressure hydrogen jet, driven by its high initial momentum and buoyancy, swiftly reaches the top of the garage and spreads to the surrounding areas. At this moment, due to the relatively close proximity of the beam to the leakage point in the 2-parking space mode compared to the other modes, it becomes the first to impede the hydrogen flow, causing the hydrogen to diffuse downwards and accumulate upon reaching the beam. By 10 s of continuous leakage, it is observed that the space adjacent to the hydrogen fuel cell vehicle within the garage in the 2-parking space mode is fully covered by flammable gas clouds. Conversely, the extent of flammable gas clouds in the garages under the 3-parking-space and 4-parking space modes is smaller than that in the 2-parking space mode, with the flammable hydrogen range under the 3-parking space mode being larger than that under the 4-parking space mode. These differences are primarily attributed to the fact that the beams and other obstacles in the garages under the 3-parking-space and 2-parking space modes are farther from the leakage point, resulting in less impediment to hydrogen flow compared to the 2-parking space mode. Additionally, the beams and other obstacles in the garage under the 3-parking space mode are closer to the leakage point than those in the garage under the 4-parking space mode. Therefore, it can be concluded that during the initial stage of the leakage, the garage under the 2-parking space mode poses a greater risk of local combustion and explosion, necessitating prompt ventilation measures to mitigate the risk of combustion and explosion within the garage.
At t = 20 s, it is observed that the areas surrounding the hydrogen-powered vehicles within the garages under the 4-parking-space and 3-parking space modes are also largely covered by flammable gas clouds, with the extent of flammable gas clouds in the garage under the 4-parking space mode being larger than that in the garage under the 3-parking space mode. Moreover, the risk level in the garage under the 3-parking space mode is higher than that in the garage under the 2-parking space mode.
By t = 60 s, the flammable gas mixture of hydrogen and air within the underground garage under the 4-parking space mode has reached the edge of the garage and accumulated to a certain thickness downwards. In the garage under the 3-parking space mode, the flammable gas mixture has horizontally traversed two rows of beams. In contrast, due to the presence of three rows of beams in the garage under the 2-parking space mode, which provides greater impedance to hydrogen diffusion, it can be observed from the contour plots that the risk of combustion and explosion within the garage under the 2-parking space mode is the lowest during this period. As explained previously, as the leakage duration increases, hydrogen diffuses towards the surroundings by bypassing obstacles such as beams. In the same direction, fewer obstacles or a greater distance from obstacles results in a larger diffusion range of hydrogen, ultimately leading to a higher risk of combustion and explosion within the same-sized underground garage.
On the cross-section at z = 2.6 m, we can visually observe the impact of columns on the hydrogen concentration distribution within the garage. At 1s after the commencement of the leakage, the flammable hydrogen above the leakage point initially accumulates at the top wall and corners of the garage then diffuses along the edges of the garage towards the surroundings. It can be seen that the flammable hydrogen within the garages under the 4-parking-space and 3-parking space modes has not reached the columns, while the flammable gas clouds within the garage under the 2-parking space mode have already diffused to the columns and accumulated there. This is because, within the same garage area, the garage under the 2-parking space mode has a higher number of columns, so the distance from the leakage point to the columns in the same direction is closer than that in the other two parking modes, making them the first to impede the diffusion of hydrogen.
At t = 10 s, due to the initial obstruction by the columns, the hydrogen within the garage under the 2-parking space mode continues to accumulate in the space above the leakage point, ultimately resulting in a larger flammable range at this time compared to the other two parking modes.
At t = 20 s, the flammable range of hydrogen within the garages under the 4-parking-space and 3-parking space modes fills the top space above the leakage point and is obstructed by the walls and columns on both sides. Meanwhile, the hydrogen within the garage under the 2-parking space mode diffuses towards the surroundings at the same time but quickly encounters obstructions such as columns. Therefore, it can be observed from the contour plots that the flammable range of hydrogen within the garage under the 2-parking space mode is the smallest, while that within the garage under the 4-parking space mode is the largest.
By t = 60 s, it can be seen that the flammable range of hydrogen within the garage under the 4-parking space mode almost fills the top space and is sequentially larger than that under the 3-parking-space and 2-parking-space modes. This is precisely due to the fewer obstructions such as columns within the garage under the 4-parking space mode, while the garages under the 3-parking-space and 2-parking space modes have more obstructions, leading to different degrees of impedance to hydrogen diffusion. Ultimately, until the leakage stops, the risk of hydrogen combustion and explosion within the garage under the 4-parking space mode remains the highest. This also corresponds to the variation pattern of the volume fraction of the flammable region within the garages under the different parking modes.
Impact of ventilation
-
Based on previous research, it is evident that the volume fraction of the flammable hydrogen region within underground garages vary differently over time under different parking modes. In the initial stage of the leakage, the explosion risk in the garage under the 2-parking space mode is slightly higher than that in the 3-parking space and 4-parking space modes. However, after t > 15 s, the explosion risk within the garage under the 4-parking space mode consistently remains the highest, and by t = 74 s, the volume fraction of the flammable region within the garage under this mode increases to a maximum of 56.6%, indicating a relatively high explosion risk throughout the garage. Therefore, immediate measures such as ventilation are necessary for safety protection. This section investigates the changes in hydrogen concentration within the garage under the 4-parking space mode by adding mechanical ventilation conditions.
As shown in Fig. 11, when the leakage time is relatively short, the addition of ventilation conditions has little impact on the hydrogen concentration within the garage. This is because the high-pressure hydrogen leakage has a high initial momentum, and the hydrogen jet sprays upwards from the leakage point, reaches the top space of the garage, and then immediately diffuses towards the surroundings. The air supply speed in both ventilation scenarios is much lower than the leakage speed of hydrogen, making it impossible to establish an effective gas flow path. Therefore, in the initial stage of the leakage, the two ventilation modes have little effect on the hydrogen concentration. As the leakage time increases, the impact of the two ventilation modes on the volume fraction of the flammable region within the garage begins to emerge, manifested as a gradual decrease in the growth rate of hydrogen concentration within the space. However, for the 2-ventilation-outlet mode, when the leakage time exceeds 60 s, the growth rate of the volume fraction of the flammable hydrogen region within the garage gradually increases, while in the 4-ventilation-outlet mode, the growth rate of the volume fraction of the flammable region is relatively slower. This indicates that the number of ventilation openings has a significant impact on the rate of change of hydrogen concentration within the garage. A larger number of ventilation openings can reduce the explosion risk of hydrogen within the underground garage to some extent. After the leakage stops, the volume fractions of the flammable hydrogen region within the garage under the two ventilation modes are 53.6% and 44.1%, respectively, indicating that the ventilation effect of the garage under the 4-ventilation-outlet mode is better than that under the 2-ventilation-outlet mode.
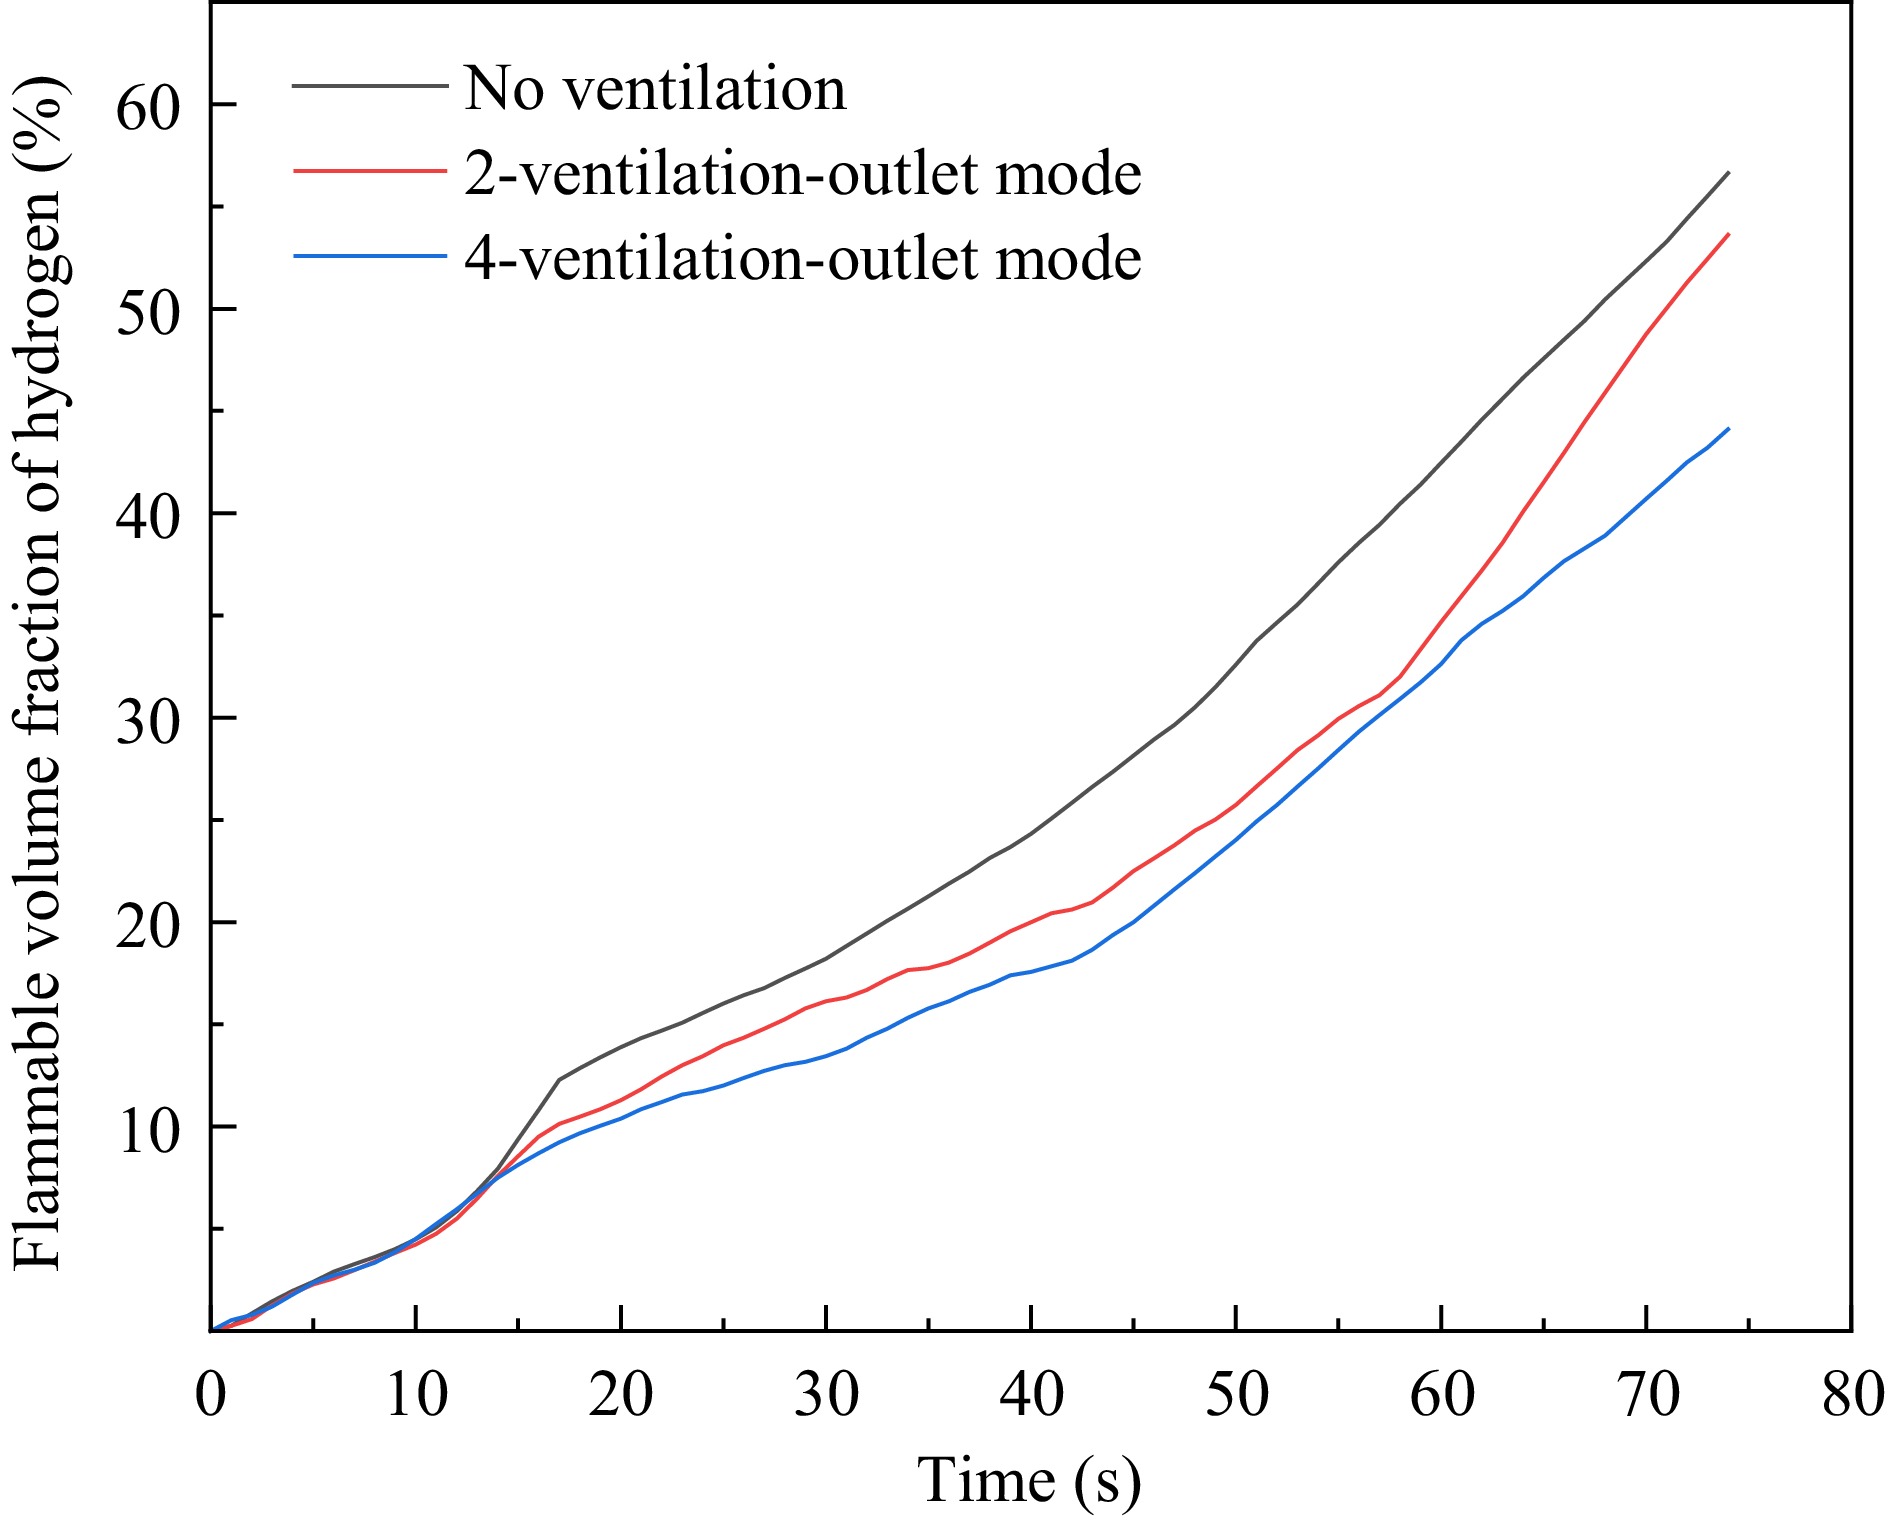
Figure 11.
Volume fraction of hydrogen flammable area in the garage under different ventilation conditions.
To further investigate the impact of the two ventilation modes on the changes in hydrogen concentration within the garage under the 4-parking space mode, the average hydrogen mole fractions at the six monitoring points selected earlier in this paper are calculated and plotted as a graph over time. This allows for the study of the variation in the average hydrogen concentration in the overhead space of the hydrogen fuel cell vehicle. As shown in Fig. 12, it can be observed that both ventilation modes have little effect on the hydrogen concentration within the garage during the initial stage of the leakage, which is consistent with the earlier pattern shown in Fig. 11. As the leakage time increases, the ventilation effects of the two modes on the hydrogen within the garage gradually emerge, manifested as a decreasing growth rate of hydrogen concentration within the garage. The 4-ventilation-outlet mode has the most significant impact on the hydrogen concentration, maintaining a relatively low concentration throughout, and over time, the average hydrogen concentration in the overhead space of the hydrogen fuel cell vehicle gradually stabilizes. When the leakage stops, the average hydrogen concentrations within the garage under the influence of the 4-ventilation-outlet and 2-ventilation-outlet modes are 0.15 and 0.16, respectively. Compared to the situation without ventilation, the two ventilation modes reduce the average hydrogen concentration in the overhead space of the hydrogen fuel cell vehicle within the garage by 28.6% and 23.8%, respectively. It is evident that the 4-ventilation-outlet mode is superior to the 2-ventilation-outlet mode.
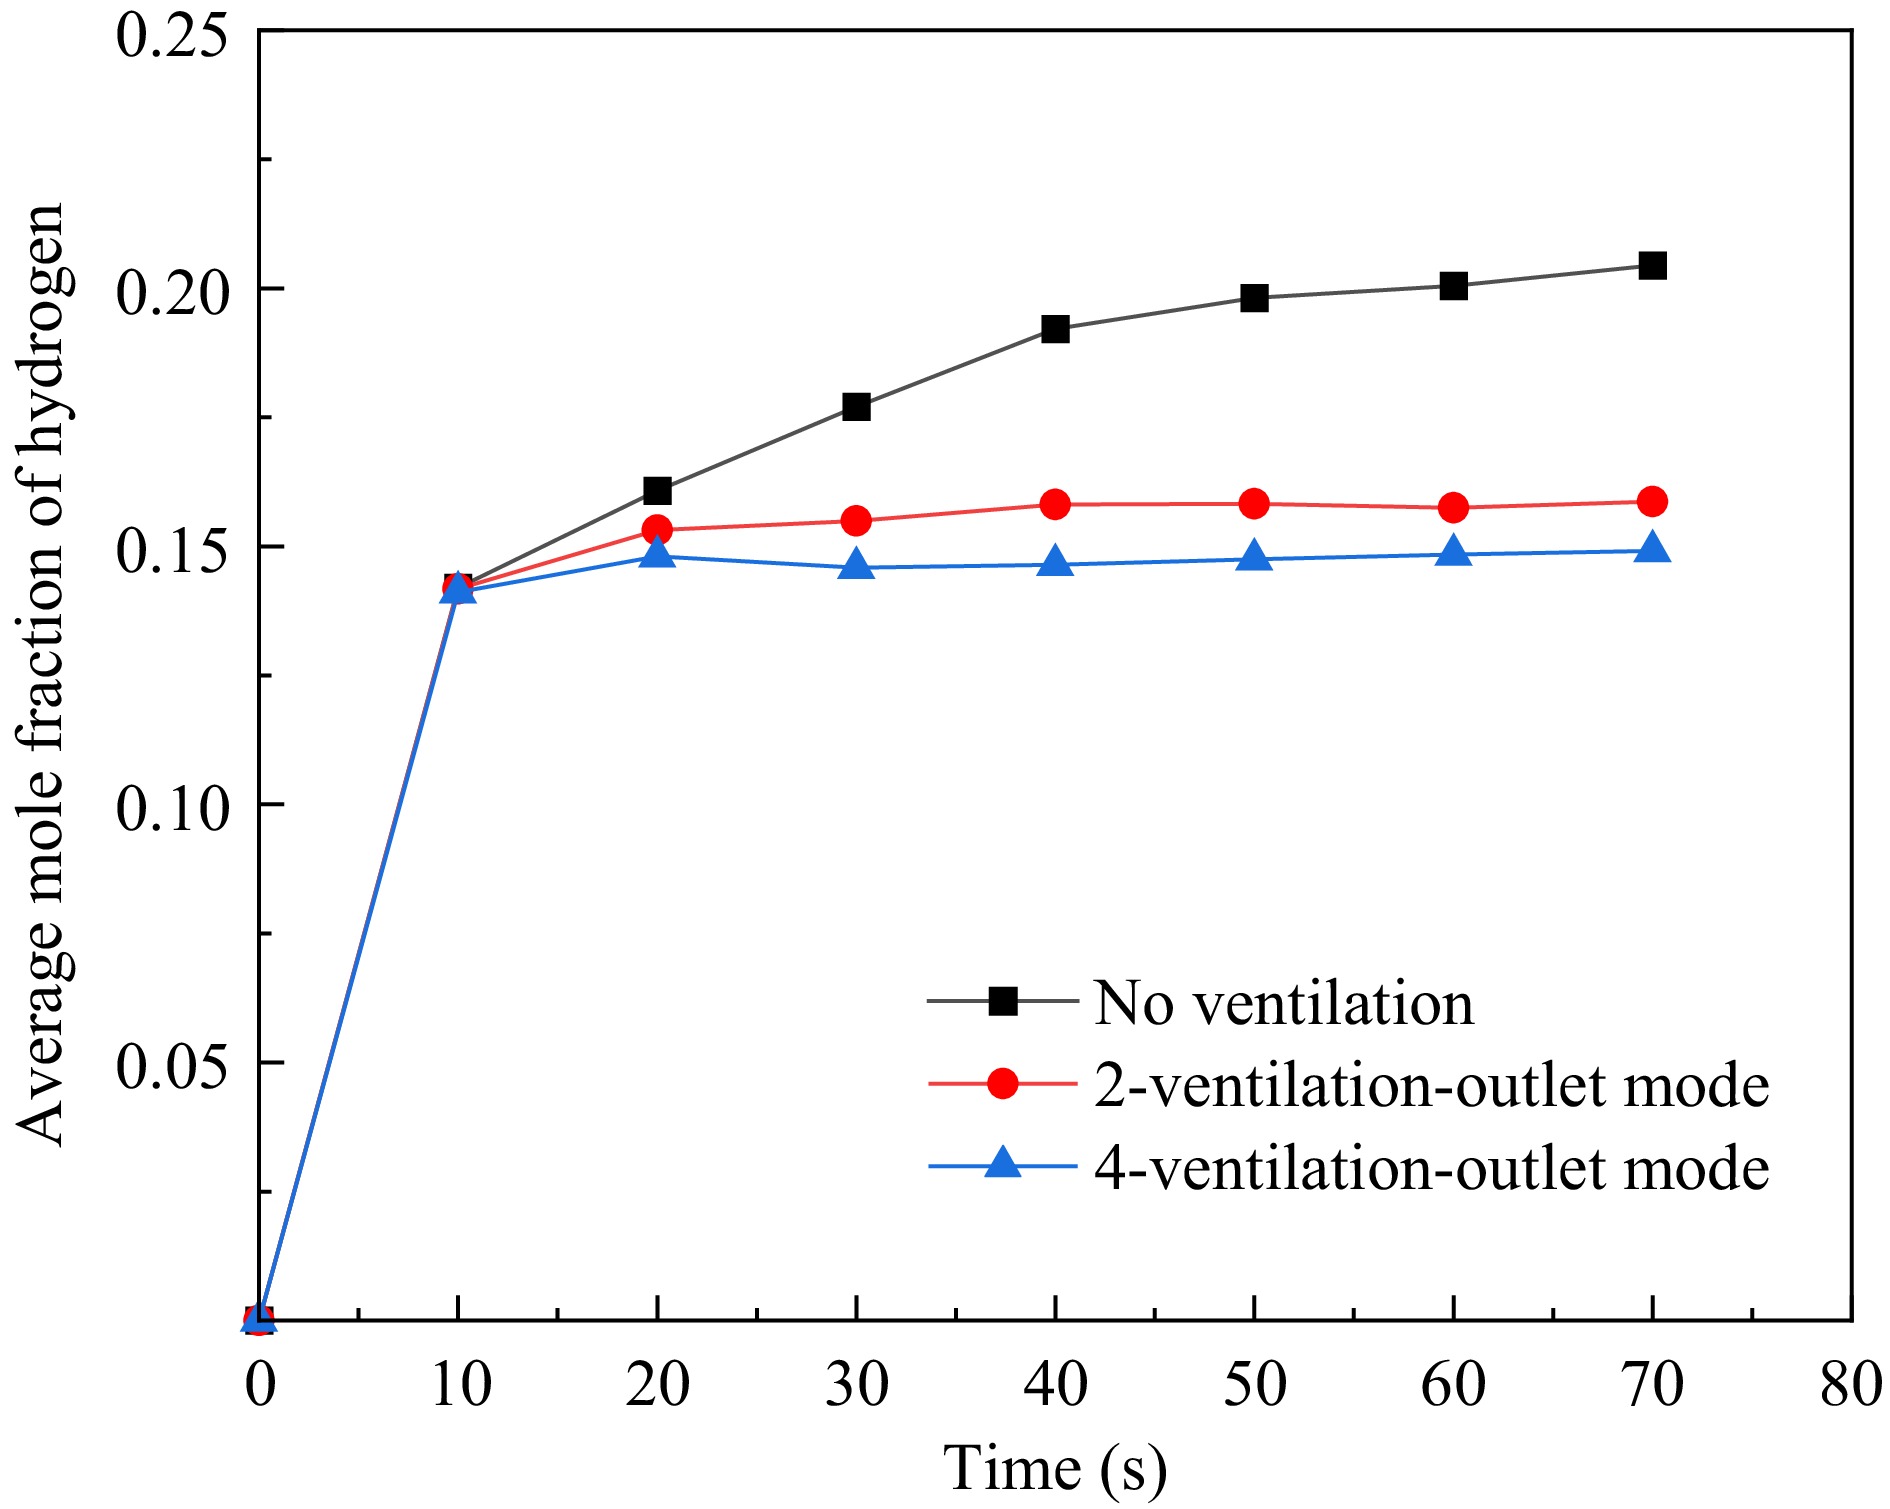
Figure 12.
Average hydrogen concentration at various monitoring points in the garage under different ventilation scenarios.
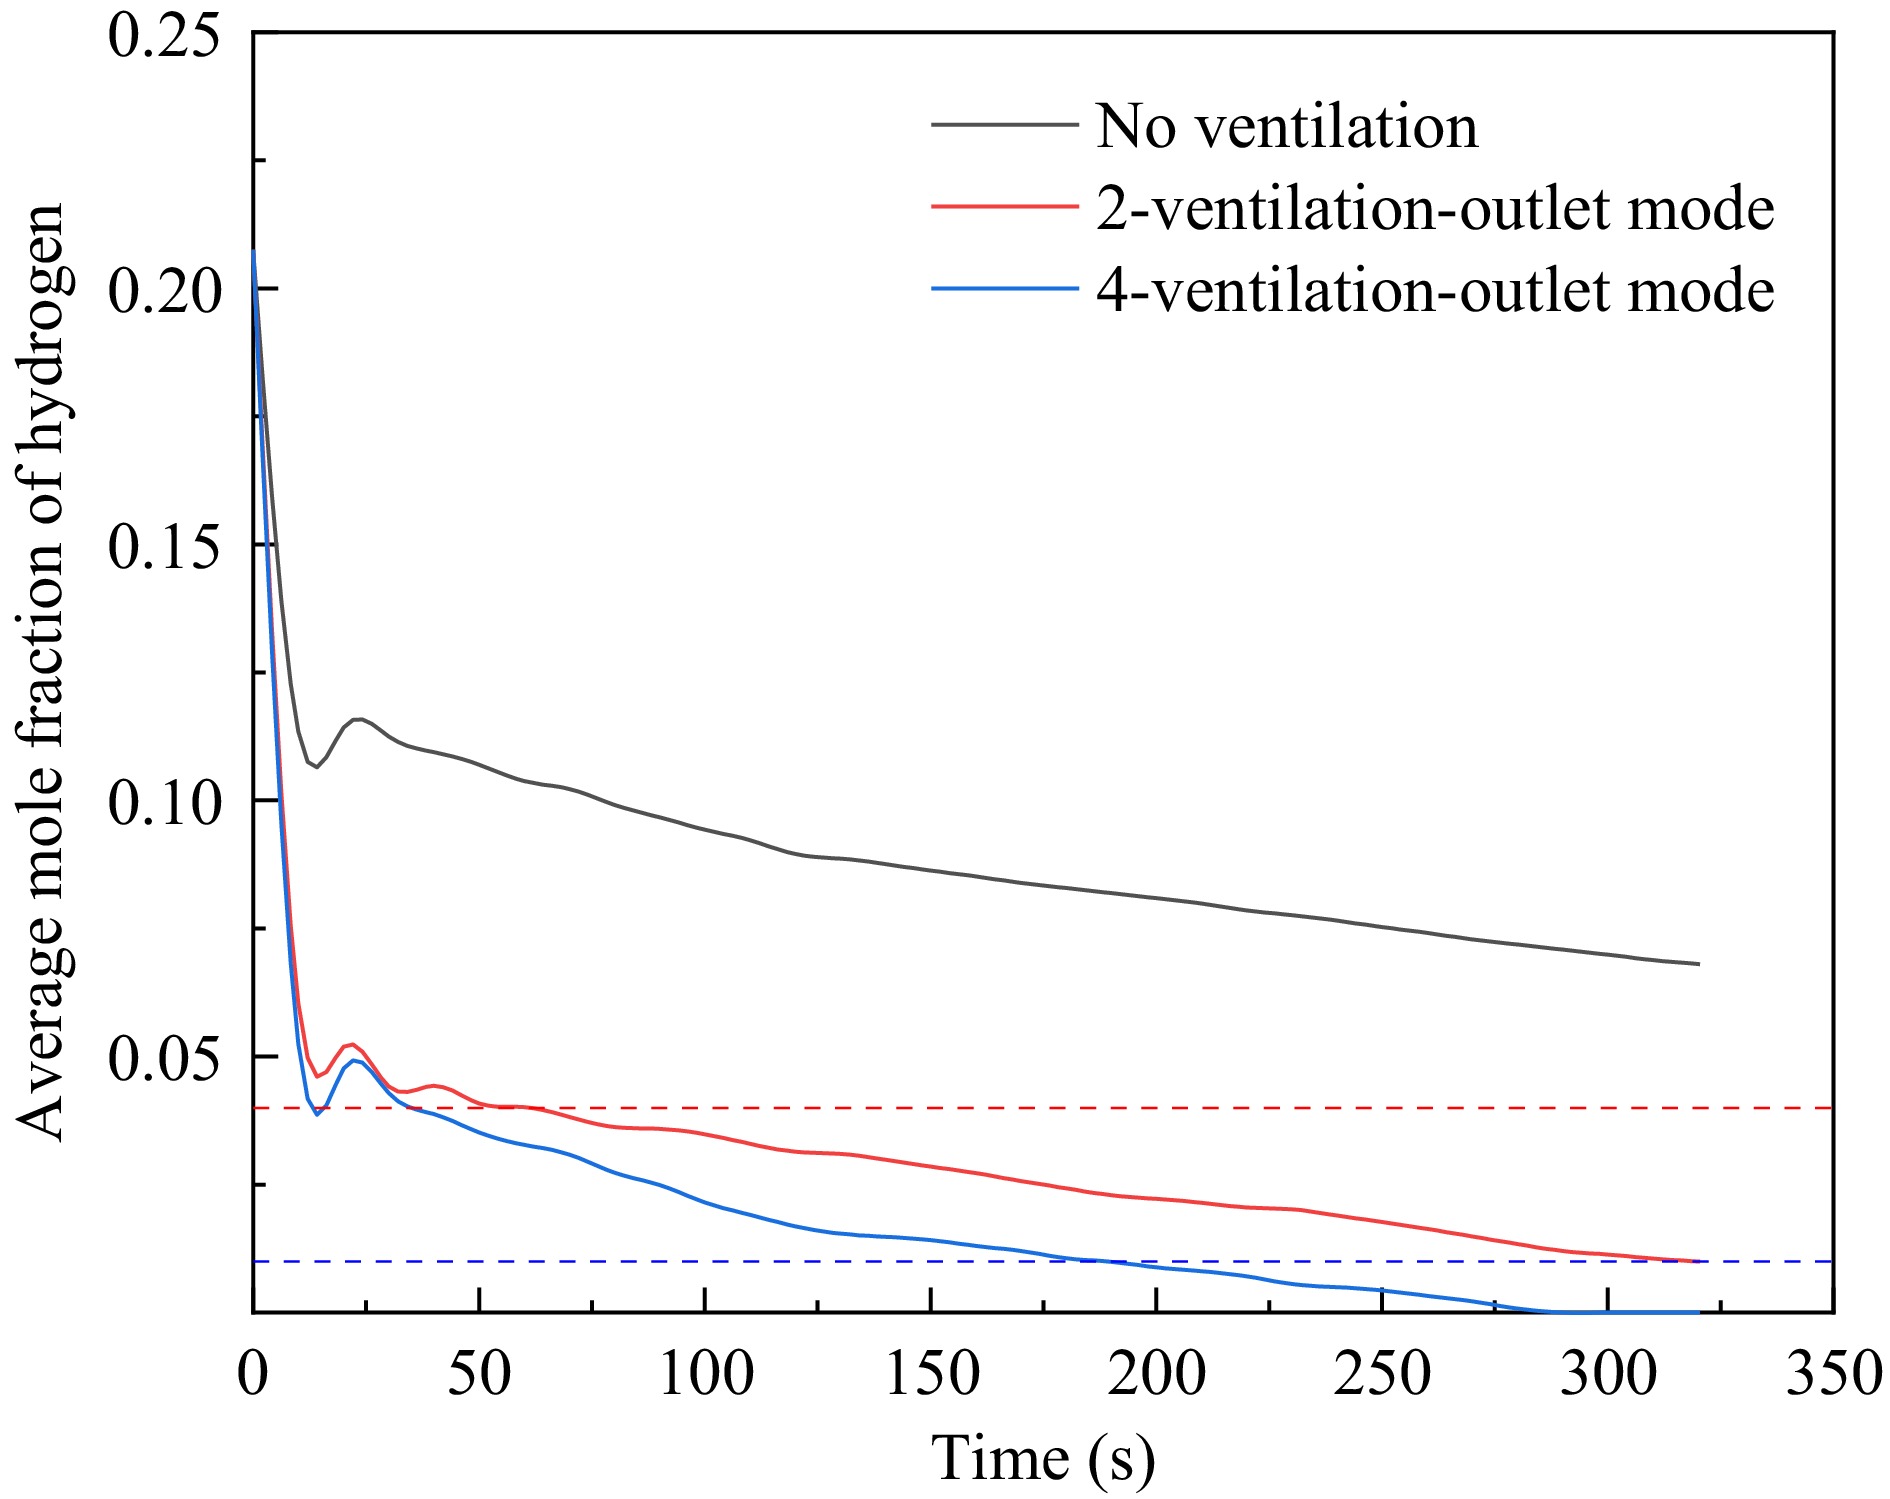
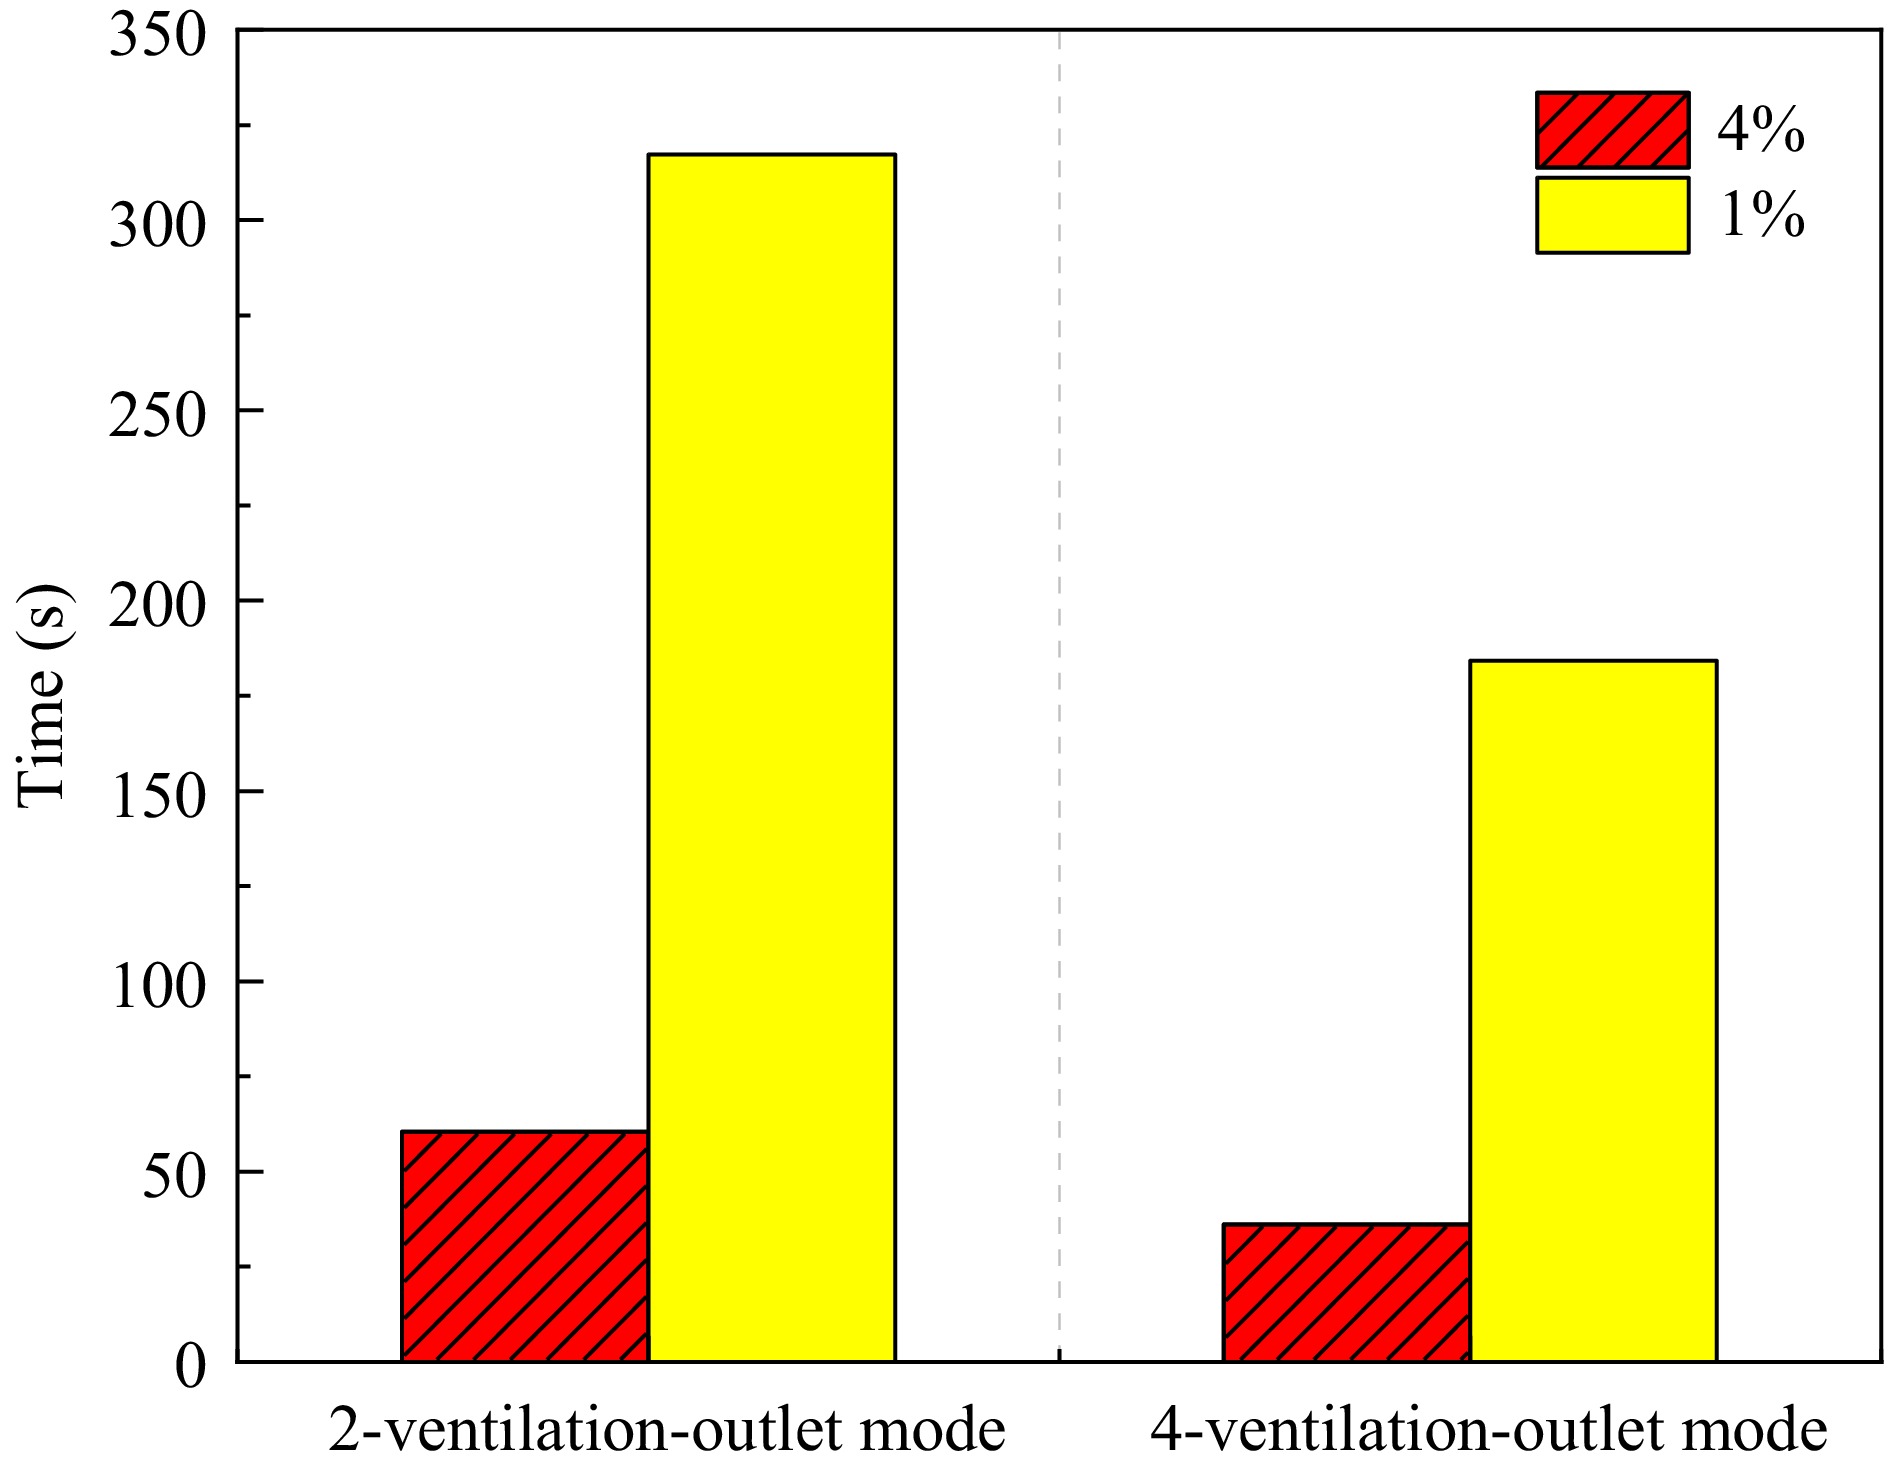
Finally, this paper investigates the impact of the two ventilation modes on the changes in hydrogen concentration within the underground garage after the hydrogen leakage stops. As can be seen from Fig. 13, the two ventilation modes exhibit similar patterns of influence on the hydrogen concentration, both leading to a rapid decrease in hydrogen concentration overall, and the rate of decrease in hydrogen concentration within the garage under the 4-ventilation-outlet mode is faster than that under the 2-ventilation-outlet mode. When t = 36.1 s, the average hydrogen concentration within the garage under the 4-ventilation-outlet mode drops below 4%, and at t = 184.2 s, the average hydrogen concentration decreases to below 1%. For the 2-ventilation-outlet mode, the average hydrogen concentration within the garage drops below 4% at t = 60.5 s and decreases to below 1% at t = 317.2 s. The specific details can be seen in Fig. 14. It is noteworthy that the time required for the hydrogen concentration within the garage to drop below 4% and 1% under the 4-ventilation-outlet mode is 24.4 and 133 s less, respectively, than that under the 2-ventilation-outlet mode. This again indicates that the ventilation effect of the garage under the 4-ventilation-outlet mode is better than that under the 2-ventilation-outlet mode, and increasing the number of ventilation openings can significantly reduce the time for the hydrogen concentration within the garage to decrease to levels acceptable within buildings, thereby reducing the risk of combustion and explosion in the underground garage.
-
This paper conducted a numerical simulation study on hydrogen leakage and diffusion in underground garages under different parking space modes using CFD software, and drew the following conclusions:
(1) In the initial stage of hydrogen leakage, the global explosion risk in the 2-parking space mode garage is slightly higher. As the leakage time extends, the overall explosion risk in the 4-parking space mode garage increases and becomes significantly higher than that in other modes, while the local explosion risk in the overhead space of hydrogen fuel cell vehicles remains the highest in the 2-parking space mode. Both excessive and insufficient parking space modes can increase the local or overall explosion risk in underground garages. To reduce the explosion risk in underground garages accommodating hydrogen fuel cell vehicles, this paper recommends adopting a 3-parking space mode for the design of underground garages.
(2) Under mechanical ventilation conditions, the impact of the number of ventilation openings on hydrogen concentration increases with leakage time. A greater number of ventilation openings lead to a more significant reduction in hydrogen concentration, thereby reducing the explosion risk.
(3) After the cessation of hydrogen leakage, increasing the number of ventilation openings can significantly shorten the time required for the hydrogen concentration within the garage to decrease to safe levels.
-
The authors confirm contribution to the paper as follows: data collection, processing: Cui P; manuscript: Tao G, Zhang L, Zhao C, Cui P. All authors reviewed the results and approved the final version of the manuscript.
-
All data generated or analyzed during this study are included in this published article.
-
Thanks to the two teachers and senior fellow for their advice and help in the process of writing this paper, thanks to each person who provided help in publishing this paper.
-
The authors declare that they have no conflict of interest.
- Copyright: © 2024 by the author(s). Published by Maximum Academic Press on behalf of Nanjing Tech University. This article is an open access article distributed under Creative Commons Attribution License (CC BY 4.0), visit https://creativecommons.org/licenses/by/4.0/.
-
About this article
Cite this article
Cui P, Tao G, Zhang L, Zhao C. 2024. Numerical simulation of hydrogen leakage diffusion in a small underground garage with different parking space modes. Emergency Management Science and Technology 4: e022 doi: 10.48130/emst-0024-0024
Numerical simulation of hydrogen leakage diffusion in a small underground garage with different parking space modes
- Received: 24 July 2024
- Revised: 28 September 2024
- Accepted: 08 October 2024
- Published online: 30 October 2024
Abstract: In recent years, hydrogen energy has been widely applied in various industries, but it may also bring a series of safety concerns. Especially in confined spaces like underground garages, where high-pressure hydrogen leaks can potentially cause combustion or explosions. To address this, this paper integrates numerical calculations and theoretical analysis to simulate the process of continuous high-pressure hydrogen leakage from hydrogen-powered vehicles within underground garages. Through investigating the influence of various parking space modes and the number of ventilation openings under mechanical ventilation conditions on hydrogen diffusion and distribution, it was discovered that, during the initial stages of leakage, the 2-parking space mode exhibited a slightly higher overall explosion risk in comparison to the 3- and 4-parking space modes. Notably, after 15 s, the 4-parking space mode shows the highest global explosion risk, while the 2-parking space mode consistently demonstrates the highest local explosion risk in the overhead space. Under mechanical ventilation, the number of ventilation openings significantly reduces hydrogen concentration over time. Specifically, after leakage cessation, increasing ventilation openings efficiently shortens the time required for hydrogen levels to drop to safe limits within the garage. The findings of this study can provide important references for the safety design of hydrogen fuel cell vehicle garages.
-
Key words:
- Underground garage /
- Columns /
- Beams /
- Hydrogen leakage and diffusion /
- Mechanical ventilation /
- Numerical simulation


