ARTICLE   Open Access    

Comprehensive evaluation of abiotic stress tolerance and graft compatibility of Citrus junos cv. 'Shuzhen No.1'

  • # Authors contributed equally: Wen He, Rui Xie

More Information
  • Received: 03 September 2023
    Revised: 31 October 2023
    Accepted: 13 November 2023
    Published online: 01 February 2024
    Fruit Research  4 Article number: e006 (2024)  |  Cite this article
  • Citrus is one of the world's most economically important fruit crops cultivated by grafting. To support the growth of scion cultivars, rootstock is the primary source of resistance to various abiotic stresses. Herein, seedlings of two genotypes of Citrus junos Sieb. ex Tanaka (the novel rootstock 'Shuzhen No.1' and commonly used rootstock 'Ziyang Xiangcheng'), as well as three commonly used rootstocks including citrange (Citrus sinensis Osbeck. × Poncirus trifoliata Raf.), trifoliate orange (P. trifoliata), and red tangerine (Citrus tangerine Hort. Ex Tanaka), were used as testing materials. The seed characteristics were evaluated, and the rootstock seedlings were subjected to flooding, drought, alkaline, and freezing treatments. Over time, the contents of chlorophyll, soluble sugar, proline, malondialdehyde, and the activity of superoxide dismutase, peroxidase, and catalase in the leaves under different treatments were examined. Furthermore, five citrus varieties were grafted as scions onto one-year-old seedlings from the four rootstocks. Graft success, shoot growth, and leaf greenness were measured and compared. The physiological and biochemical changes in 'Shuzhen No.1' were found to be similar to those in 'Ziyang Xiangcheng'. 'Shuzhen No.1' exhibited greater tolerance to flooding, alkaline, and freezing stress compared to the other four widely used citrus rootstocks, as indicated by physiological and biochemical indexes and principal component analysis. Moreover, the five citrus varieties grafted onto 'Shuzhen No.1' demonstrated vigorous growth and tree vigor. These findings provide valuable insights for the application of 'Shuzhen No.1' and future research on citrus rootstock.
  • The competition for consumer preference for fresh apples (Malus domestica) from exotic and tropical fruits is intense. Red-fleshed (RF) apple may not only provide a novel point of differentiation and enhanced visual quality, but also a source of increased concentration of potentially health-benefiting compounds within both the fresh fruit and snack/juice markets[1]. Two different types of RF apples have been characterised: Type 1 RF apple has red colouration not only in the fruit core and cortex, but also in vegetative tissues, including stems and leaves; Type 2 RF apples display red pigment only in the fruit cortex[1, 2]. To facilitate trade and lengthen the supply-window, harvested fruit are usually cold stored, which can induce a series of disorders, including physiological breakdown manifesting as a flesh browning disorder (FBD) in RF apples[3, 4]. FBD in RF apples can be caused by senescence, and there is also some evidence to suggest that a large proportion of RF apples are chilling-sensitive (Jason Johnston, Plant & Food Research Hawke's Bay, personal communication).

    Earlier studies suggested that Type 1 RF colour was determined by a promoter mutation of MdMYB10 that has a tandem replication of a myeloblastosis (MYB) binding cis-element (R6) within the promoter, resulting in autoregulation of MdMYB10[5]. However, van Nocker et al.[6] observed a large variation in the degree and pattern of red pigmentation within the cortex among the accessions carrying MdMYB10, and concluded that the presence of this gene alone was not sufficient to ensure the RF colour. A genome-wide association study (GWAS)[3], reported that, in addition to the MdMYB10 gene, other genetic factors (e.g. MdLAR1, a key enzyme in the flavonoid biosynthetic pathway) were associated with RF colour, too. Wang et al.[7] reported that many of the up-regulated genes in RF apples were associated with flavonoid biosynthesis (e.g., chalcone synthase (CHS), chalcone isomerase (CHI), dihydroflavonol 4-reductase (DFR), anthocyanin synthase (ANS), UDP-glucosyltransferase (UGT) and MYB transcription factors). Recently, MdNAC42 was shown to share similar expression patterns in RF fruit with MdMYB10 and MdTTG1, and it interacts with MdMYB10 to participate in the regulation of anthocyanin synthesis in the RF apple Redlove®[8].

    Several transcription factor genes (e.g., MYB, WRKY, bHLH, NAC, ERF, bZIP and HSF) were reported to be differentially expressed during cold-induced morphological and physiological changes in 'Golden Delicious' apples[9]. A study by Zhang et al.[10] showed that ERF1B was capable of interacting with the promotors of anthocyanin and proanthocyanidin (PA) MYB transcription factors, and suggested that ethylene regulation and anthocyanin regulation might be linked in either direction. It was reported that ethylene signal transduction pathway genes or response genes, such as ERS (ethylene response sensor), EIN3 (ethylene-insensitive3) and ERFs (ethylene response factors), may play an important role in the regulatory network of PA biosynthesis[11].

    Espley et al.[12] observed no incidence of FBD in cold-stored fruit of 'Royal Gala', but over-expression of MdMYB10 in 'Royal Gala' resulted in a high rate of FBD in RF fruit, which was hypothesised to be caused by elevated fruit ethylene concentrations before harvest and more anthocyanin, chlorogenic acid (CGA) and pro-cyanidins in RF fruit. In addition, the MYB10 transcription factor was shown to elevate the expression levels of MdACS, MdACO, and MdERF106 ethylene-regulating genes[12]. To elucidate the mechanism regulating the FBD of RF apples, Zuo et al.[13] analysed the transcriptome of tree-ripe apples at 0, 0.5 and 4 h after cutting, and reported that the differentially expressed genes at different sampling points were mainly related to plant–pathogen interactions.

    GWAS is a powerful technique for mining novel functional variants. One of the limitations of GWAS, using SNP arrays, is that they require genotyping of large numbers of individuals, which may be expensive for large populations. DNA pooling-based designs (i.e., bulk segregant analysis) test differential allele distributions in pools of individuals that exhibit extreme phenotypes (XP) in bi-parental populations, large germplasm collections or random mating populations[1416]. In addition to reducing the number of samples to be genotyped, the use of whole genome sequencing (WGS)-based XP-GWAS has the potential to identify small-effect loci and rare alleles via extreme phenotypic selection.

    In this WGS-based XP-GWAS, we investigated the genetic basis of RF and FBD by sequencing the pools of individuals that exhibited extreme phenotypes for these two traits, and analysed the differences in allele frequencies between phenotypic classes. This method combines the simplicity of genotyping pools with superior mapping resolution. We also examined the transcriptome from transgenic apple fruit harbouring the R6:MYB10 promoter as a model for red flesh in apple. Differences in gene expression of a highly pigmented line were compared with expression in control fruit and these genes were then used for comparison with the seedling population. Understanding the genetic basis of the link between RF and FBD will help in design of strategies for selection against FBD in high-quality Type 1 RF apple cultivars.

    A snapshot of visual variation in FBD and WCI is presented in Fig. 1. The average WCI and FBD across all ~900 seedlings ranged from 0 to 7, and from 0% to 58%, respectively. Based on the MLM analysis, the estimated narrow-sense heritability (h2) of WCI and FBD was 0.57 (standard error = 0.18) and 0.09 (standard error = 0.05), respectively. The estimated genetic correlation between WCI and FBD was 0.58, and several fruit quality traits displayed unfavourable correlations with WCI (Supplemental Fig. S1). Seedlings with higher WCI scores were generally characterised by poor firmness and crispness, plus higher astringency and sourness. Estimated phenotypic and genetic correlations between all pairs of traits are listed in Supplemental Table S1.

    Figure 1.  Transverse cross-sections of apple slices showing range in (a) flesh colouration, and (b) flesh browning disorder for Type 1 red-fleshed apple. The weighted cortical intensity (WCI) scores (0−9 scale) and the proportion of the cortex area showing symptoms of flesh browning disorder are also displayed.

    A few seedlings had no red pigment in the cortex, but the average WCI score across all seedlings was 2.25. About two-thirds of the seedlings did not display any FBD symptoms, but among the remaining seedlings, FBD ranged between 1% and 58% (Fig. 2). The average WCI score for the 'low' and 'high' WCI pool was 0.45 and 5.2, respectively, while the average FBD was 0% and 20.6% for the 'low' and 'high' FBD pool, respectively (Supplemental Table S2). The average WCI score of the seedlings in the FBD pools was similar (Low: 5.5; High: 4.6), while the average FBD of the high- and low-WCI pools was 4.5% and 0.1%, respectively.

    Figure 2.  The distribution of weighted cortex intensity (WCI) scores (a) and the internal flesh browning disorder IFBD%; (b) in the population of ~900 apple seedlings. The green and red circles highlight the individuals used to form the 'low' and 'high' pools of samples.

    After filtering, about 204,000 SNPs were used and the average sequencing depth of SNP loci was similar for the two pools (42 vs 44). There was a near-perfect correlation between the Z-test statistics and G-statistics, so only the latter are discussed hereafter. A plot of the G' values, smoothed over 2 Mb windows, is shown for all 17 chromosomes (Chrs) in Supplemental Fig. S2. XP-GWAS identified genomic regions significantly associated with FBD on 12 out of the 17 Chrs (Fig. 3), and putative candidate genes within ±1.0 Mb distanceof the significant G' peaks were identified (Table 1). Additional genomic regions, which did not meet the significance threshold but displayed distinguished G' peaks, were also identified across all chromosomes (Supplemental Table S3).

    Figure 3.  G'-statistics across the linkage groups (LG) showing significant association with the flesh browning disorder (FBD) in apple The horizontal red lines indicate the significance threshold. The putative candidate genes (refer to Table 1) underpinning various G' peaks are also shown.
    Table 1.  A list of the genomic regions associated with internal flesh browning disorder (FBD) in apples. Putative candidate genes residing within these regions are also listed using GDDH13v1.1 reference genome assembly.
    ChrGenomic region (Mb)Putative genes functions
    221.9–23.5Ethylene-responsive element binding factor 13 (MdERF13: MD02G1213600);
    33.1–4.9cinnamate 4-hydroxylase (C4H) enzyme (MD03G1051100, MD03G1050900 and MD03G1051000); MdWRKY2: MD03G1044400; MdWRKY33 (MD03G1057400)
    38.2–9.6ascorbate peroxidase 1 (MdAPX1: MD03G1108200, MD03G1108300)
    314.7–16.6senescence-related MdNAC90 (MD03G1148500)
    336.5–37.5Ethylene response sensor 1 (MdERS1: MD03G1292200); flavonoid biosynthesis protein MdMYB12 (MD03G1297100); Heat shock protein DnaJ (MD03G1296600, MD03G1297000); pectin methylesterase (MdPME) inhibitor protein (MD03G1290800, MD03G1290900, MD03G1291000).
    411.0–13.0phenylalanine and lignin biosynthesis protein MdMYB85 (MD04G1080600)
    422.1–24.4MYB domain protein 1 (MD04G1142200); HSP20-like protein (MD04G1140600); UDP-glucosyltransferase (UGT) proteins UGT85A7 (MD04G1140700, MD04G1140900); UGT85A3 (MD04G1140800); UGT (MD04G1141000, MD04G1141300); UGT85A2 (MD04G1141400); UGT85A4 (MD04G1141500); DNAJ heat shock protein (MD04G1153800, MD04G1153900, MD04G1154100)
    427.6–29.6HCT/HQT regulatory genes MD04G1188000 and MD04G1188400
    629.8–31.7Volz et al. (2013) QTL for IFBD; anthocyanin regulatory proteins MdMYB86 (MD06G1167200); triterpene biosynthesis transcription factor MdMYB66 (MD06G1174200); Cytochrome P450 (MD06G1162600; MD06G1162700, MD06G1162800, MD06G1163100, MD06G1163300, MD06G1163400, MD06G1163500, MD06G1163600, MD06G1163800, MD06G1164000, MD06G1164100, MD06G1164300, MD06G1164400, MD06G1164500, MD06G1164700)
    713.9–15.9heat shock protein 70B (MD07G1116300)
    717.4–19.0Drought-stress WRKY DNA-binding proteins (MdWRKY56: MD07G1131000, MD07G1131400)
    723.6–25.2MdPAL2 (MD07G1172700); drought-stress gene NGA1 (MD07G1162400); DNAJ heat shock family protein (MD07G1162300, MD07G1162200), stress-response protein (MdNAC69: MD07G1163700, MD07G1164000)
    97.9–11.8MD09G1110500 involved in ascorbate oxidase (AO); MdUGT proteins (MD09G1141200, MD09G1141300, MD09G1141500, MD09G1141600, MD09G1141700, MD09G1141800, MD09G1142000, MD09G1142500, MD09G1142600, MD09G1142800, MD09G1142900, MD09G1143000, MD09G1143200, MD09G1143400) involved in flavonoids biosynthesis; heat shock proteins 89.1 (MD09G1122200) and HSP70 (MD09G1137300); Ethylene-forming enzyme MD09G1114800; Anthocyanin regulatory protein MdNAC42 (MD09G1147500, MD09G1147600)
    914.9–16.5triterpene biosynthesis transcription factor protein MdMYB66 (MD09G1183800);
    111.7–3.0ethylene response factor proteins (MdEIN-like 3: MD11G1022400)
    1138.6–40.6Senescence-related gene 1 (MD11G1271400, MD11G1272300, MD11G1272000, MD11G1272100, MD11G1272300, MD11G1272400, and MD11G1272500); Chalcone-flavanone isomerase (CHI) protein (MD11G1273600) and MdbHLH3 (MD11G1286900, MDP0000225680); cytochrome P450 enzyme (MD11G1274000, MD11G1274100, MD11G1274200, MD11G1274300, MD11G1274500, and MD11G1274600); heat shock transcription factor A6B (MdHSFA6B: MD11G1278900) – involved in ABA-mediated heat response and flavonoid biosynthesis.
    122.2–3.5heat shock protein 70-1 ((MD12G1025600, MD12G1025700 and MD12G1026300) and heat shock protein 70 (MD12G1025800 and MD12G1025900 and MD12G1026000); ethylene (MD12G1032000) and auxin-responsive (MD12G1027600) proteins.
    127.2–8.4DNAJ heat shock domain-containing protein (MD12G1065200 and MD12G1067400)
    1327.5–30.5MD13G1257800 involved in polyphenol 4-coumarate:CoA ligase (4CL)
    1337.5–39.5pectin methyl esterase inhibitor superfamily protein MdPMEI (MD13G1278600)
    1425.4–27.5Drought-stress response gene MdWRKY45 (MD14G1154500); chalcone synthase (CHS) family proteins (MD14G1160800 and MD14G1160900); triterpene biosynthesis transcription factor MdMYB66 (MD14G1180700, MD14G1181000, MD14G1180900); anthocyanin biosynthesis protein (MdMYB86: MD14G1172900); cytochrome P450 proteins (MD14G1169000, MD14G1169200, MD14G1169600, MD14G1169700)
    150–1.5Ethylene synthesis proteins (MD15G1020100, MD15G1020300 and MD15G1020500); dihydroflavonol reductase (DFR) gene (MD15G1024100)
    154.6–6.8MdMYB73 (MD15G1076600, MD15G1088000) modulates malate transportation/accumulation via interaction with MdMYB1/10; MdNAC52: MD15G1079400) regulates anthocyanin/PA; heat shock transcription factor B4 (MD15G1080700); stress-response protein MdWRKY7 (MD15G1078200)
    1553.5–54.9MdC3H (MD15G1436500) involved in chlorogenic acid biosynthesis; MdEIN3 (MD15G1441000) involved in regulating ethylene synthesis and anthocyanin accumulation
    168.9–10.9SAUR-like auxin-responsive protein (MD16G1124300) and MdNAC83: (MD16G1125800) associated with fruit ripening; MD16G1140800 regulates proanthocyanidin; MdPAE genes (MD16G1132100, MD16G1140500) regulates ethylene production.
     | Show Table
    DownLoad: CSV

    The ethylene-responsive factor 13 (MdERF13: MD02G1213600) resided within the significant region (21.9–23.5 Mb) on Chr2, while the ascorbate peroxidase 3 (MdAPX3: MD02G1127800, MD02G1132200) resided in the prominent region between 9.45 and 11.28 Mb) (Fig. 3, Table 1). There were several genomic regions showing association with FBD on Chr3. The first region (8.2–9.5 Mb) flanked MdAPX1 (MD03G1108200, MD03G1108300), while MdERF3 (MD03G1194300) and heat shock protein 70 (HSP70: MD03G1201800, D03G1201700) resided within the prominent peak region (25.5–27.5 Mb). Another significant region (36.5–37.5 Mb) at the bottom on Chr3 harboured ethylene response sensor 1 (MdERS1: MD03G1292200), a flavonoid-biosynthesis related protein MdMYB12 (MD03G1297100), HSP DnaJ and pectin methyl esterase (PME) inhibitor proteins (Fig. 3, Table 1).

    The significant G' region (27.6–29.6 Mb) on Chr4 flanked the genes MD04G1188000 and MD04G1188400 involved in the biosynthesis of hydroxycinnamoyl CoA shikimate/quinate hydroxycinnamoyl transferase (HCT/HQT), while the adjacent region (22.1–24.3 Mb) harboured a cluster of UDP-glucosyltransferase (UGT) proteins and HSP (Table 1). Another region between 11.0 and 13.0 Mb encompassed phenylalanine and lignin biosynthesis gene MYB85 (MD04G1080600)[17]. The only significant region associated with FBD on Chr6 spanned between 29.8 and 31.7 Mb, which included a SNP earlier reported associated with FBD[4]. This region also harboured several MYB proteins (MdMYB86: MD06G1167200; MdMYB98: MD06G1172900; MdMYB66: MD06G1174200) and a large cluster of cytochrome P450 proteins (Table 1).

    A significant FBD-associated region (13.9–15.9 Mb) on Chr7 encompassed the HSP 70B (MD07G1116300), while another significant region between 23.6 Mb and 25.2 Mb flanked the gene coding for phenylalanine ammonia lyase 2 (MdPAL2: MD07G1172700), a drought stress gene NGA1 (MD07G1162400), DNAJ HSP, and stress-response protein (MdNAC69: MD07G1163700, MD07G1164000) (Fig. 3, Table 1). A large significant region spanning between 7.9 and 11.8 Mb on Chr9 encompassed the gene MD09G1110500 putatively involved in ascorbate oxidase (AO), HSP (HSP70: MD09G1137300; HSP89.1: MD09G1122200), an ethylene-forming enzyme (MD09G1114800), and MdNAC42 (MD09G1147500, MD09G1147600). Another significant genomic region on Chr9 was between 14.9 and 16.5 Mb, which harbours the MYB domain protein MdMYB66 (MD09G1183800) (Table 1).

    A sharp G' peak region (1.7–3.0 Mb) on Chr11 associated with FBD encompassed ethylene insensitive 3 (MdEIN3: MD11G1022400) along with a cluster of UGT proteins, WD-40, and bHLHL proteins (Table 1). A significant region between 38.6 and 40.6 Mb at the bottom of Chr11 was dominated by clusters of senescence-related genes and cytochrome P450 enzymes. This genomic region also flanked a chalcone-flavanone isomerase (CHI) family protein (MD11G1273600) and a bHLH protein (MdbHLH3: MD11G1286900, MDP0000225680), along with the heat shock transcription factor A6B (HSFA6B: MD11G1278900) (Table 1, Supplemental Table S3).

    The region (2.2–3.3 Mb) associated with FBD on Chr12 flanked genes for the HSP 70 and 70-1, NAC proteins, ethylene and auxin-responsive proteins (Table 1). An adjacent significant region (7.2–8.4 Mb) flanked DNAJ HSP, along with bZIP, bHLH and WD-40 repeat-like proteins (Table 1; Supplemental Table S3). There was a large genomic region on Chr13 showing a significant association with FBD. In this region, the first G' peak (27.5–30.5 Mb) harboured MD13G1257800, which regulates polyphenol 4-coumarate: CoA ligase (4CL) synthesis. The second G' peak region (32.6–34.7 Mb) corresponded to an earlier mapped QTL for flesh browning in white-fleshed apples[18].

    The significant region (25.4–27.5 Mb) on Chr14 harboured various genes for proteins with different putative functions, such as AP2 proteins, WD-40 repeat family proteins, bHLH proteins, MdNAC83 (MD14G1150900), MdWRKY45 (MD14G1154500), chalcone synthase (CHS) family proteins (MD14G1160800 and MD14G1160900), cytochrome P450 proteins, and several MYB domain proteins (MdMYB86: MD14G1172900; MdMYB98: MD14G1179000; MdMYB66: MD14G1180700, MD14G1181000, MD14G1180900) (Fig. 3, Table 1, Supplemental Table S3). A sharp G' peak (15.2–17.2 Mb) on Chr14 did not meet the significance threshold corresponding to the FBD QTL in white-fleshed apples[18].

    The upper 1.5 Mb region on Chr15 associated with FBD encompassed several transcription factor families, including WD-40 repeats, bHLH, bZIP, ethylene synthesis proteins, and dihydroflavonol reductase (DFR) protein (MD15G1024100) (Fig. 3, Table 1; Supplemental Table S3). Another significant region on Chr15 (4.6−6.8 Mb) harboured HSF B4, MdMYB73 (which interacts with MdMYB1/10 to modulate malate transportation) and MdNAC52 (MD15G1079400), which regulates anthocyanin and PA synthesis by directly regulating MdLAR[19]. A significantly associated region at the bottom of Chr15 (53.5–54.9 Mb) harboured MdNAC35 (MD15G1444700), MdC3H (MD15G1436500) involved in the production of p-coumarate 3-hydroxylase (C3H) enzyme, which plays a role in chlorogenic acid biosynthesis, and MdEIN3 (MD15G1441000).

    The significant region between 8.9 and 10.9 Mb on Chr16 harboured a gene for SAUR-like auxin-responsive protein (MD16G1124300) and MdNAC83 (MD16G1125800), both of which have been reportedly associated with apple fruit ripening[20]. This region also encompassed MD16G1140800, which regulates PA[11], and a gene for the pectin acetyl esterase protein MdPAE10 (MD16G1132100) involved in ethylene production and shelf-life[21]. A sharp G' peak region (20.4–22.4 Mb) in the middle of Chr16 flanked MdERF1B (MD16G1216900) and MdMYB15 (MD16G1218000 and MD16G1218900), involved in altering anthocyanin and PA concentrations[10] (Fig. 3, Table 1, Supplemental Table S3).

    The average sequencing depth of the SNP loci (~160,000) retained for marker-trait association was similar for the two WCI pools (41 vs 44). The significant regions were located on Chrs 2, 4, 6, 7, 10, 15 and 16 (Fig. 4). The genomic intervals within ±1.0 Mb of the significant G' peaks, and the putative candidate genes within those intervals, are listed in Table 2. Additional genomic regions, which did not meet the significance threshold but displayed distinct G' peaks, were also identified across most chromosomes ( Supplemental Fig. S2, Supplemental Table S3). A significant region on Chr4 encompassed chalcone synthase (CHS) genes, along with an ERF (MD04G1009000) involved in regulating PA biosynthesis[11].

    Figure 4.  G’-statistics across the linkage groups (LG) showing significant association with the weighted cortex intensity (WCI) in apple. The horizontal red lines indicate the significance threshold. The putative candidate genes (refer to Table 2) underpinning various G' peaks are also shown.
    Table 2.  A list of the genomic regions significantly associated with the weighted cortex intensity (WCI) in apples. Putative candidate genes residing within these regions are also listed using GDDH13v1.1 reference genome assembly.
    ChrGenomic region (Mb)Putative genes functions
    211.2–13.2UDP-glucosyltransferase (UGT) proteins (MD02G1153000, MD02G1153100, MD02G1153200, MD02G1153300; MD02G1153400; MD02G1153500; MD02G1153700; MD02G1153800; MD02G1153900);
    40–1.2Chalcone synthase (CHS) genes (MD04G1003000; MD04G1003300 and MD04G1003400); DNAJ heat shock protein (MD04G1003500); MdERF (MD04G1009000) involved in regulating PA biosynthesis.
    69.5–11.0Ubiquitin protein (MD06G1061100); stress-response WRKY protein MdWRKY21 (MD06G1062800);
    612.1–13.6pectin methylesterase inhibitor superfamily protein (MdPME: MD06G1064700); phenylalanine and lignin biosynthesis gene (MdMYB85)
    616.0–17.6MD06G1071600 (MDP0000360447) involved in leucoanthocyanidin dioxygenase (LDOX) synthesis
    624.0–26.0UDP-glycosyltransferase proteins (MD06G1103300, MD06G1103400, MD06G1103500 and MD06G1103600); auxin response factor 9 (MdARF9: MD06G1111100) and heat shock protein 70 (Hsp 70; MD06G1113000).
    74.1–5.6Ethylene insensitive 3 protein (MdEIN3: MD07G1053500 and MD07G1053800) involved in proanthocyanidins (PA) biosynthesis; ubiquitin-specific protease (MD07G1051000, MD07G1051100, MD07G1051200, MD07G1051500, MD07G1051300, MD07G1051700 and MD07G1051800).
    1015.9–18.3bHLH proteins (MD10G1098900, MD10G1104300, and MD10G1104600); UGT protein (MD10G1101200); UGT 74D1 (MD10G1110800), UGT 74F1 (MD10G1111100), UGT 74F2 (MD10G1111000).
    1035.6–38.6Stress-response WRKY proteins (MdWRKY28: MD10G1266400; MdWRKY65: MD10G1275800). ethylene responsive factors (MdERF2: MD10G1286300; MdERF4: MD10G1290400, and MdERF12: MD10G1290900) and a NAC domain protein (MdNAC73: MD10G1288300); polyphenol oxidase (PPO) genes ((MD10G1298200; MD10G1298300; MD10G1298400; MD10G1298500; MD10G1298700; MD10G1299100; MD10G1299300; MD10G1299400).
    1524.8–26.8heat shock factor 4 (MD15G1283700), drought-stress response WRKY protein 7 (MdWRKY7: MD15G1287300), MdMYB73 (MD15G1288600) involved in ubiquitination and malate synthesis
    1531.7–34.2MYB domain protein 93 (MdMYB93: MD15G1323500) regulates flavonoids and suberin accumulation (Legay et al. 2016); ubiquitin -specific protease 3 (MD15G1318500),
    161.5–3.4MYB domain proteins (MD16G1029400) regulates anthocyanin; senescence-associated gene 12 (MD16G1031600); ethylene response factor proteins (MdERF118: MD16G1043500, and MD16G1047700 (MdRAV1); MdMYB62 ( MD16G1040800) flavonol regulation; malate transporter MdMa2 (MD16G1045000: MDP0000244249), Ubiquitin-like superfamily protein (MD16G1036000),
    165.4–7.4MdMYB88 (MD16G1076100) regulates phenylpropanoid synthesis and ABA-mediated anthocyanin biosynthesis; MdMYB66 (MD16G1093200) regulates triterpene biosynthesis, MdWRKY72 (MD16G1077700) mediates ultraviolet B-induced anthocyanin synthesis.
     | Show Table
    DownLoad: CSV

    There were distinct G' peaks within a large genomic region (spanning between 9.0 and 18.0 Mb) significantly associated with WCI on Chr6 (Fig. 4). The G' peak region 12.1–13.6 Mb encompassed MdMYB85 (MD06G1064300), and a gene for a pectin methyl esterase

    (PME) inhibitor protein (MD06G1064700); while the region between 16.0 and 17.6 Mb flanked the genes involved in leucoanthocyanidin dioxygenase (LDOX) synthesis (Table 2). The auxin response factor 9 (MdARF9: MD06G1111100) and the HSP70 (MD06G1113000) resided in the significant region between 24.0 and 26.0 Mb on Chr6 (Table 2).

    The genomic region (4.1–5.6 Mb) with significant association with WCI on Chr7 flanked MdEIN3 (MD07G1053500, MD07G1053800), which plays an important role in the regulatory network of PA biosynthesis[11]. A significant region (35.6–38.7 Mb) on Chr10 encompassed gene clusters for bHLH and WRKY proteins along with an ethylene repressor factor (MdERF2: MD10G1286300) (Fig. 4, Table 2; Supplemental Table S3). This region also harboured MdERF4 (MD10G1290400), MdERF12 (MD10G1290900) and NAC domain genes (MdNAC73: MD10G1288300), which have been reported to be associated with fruit ripening[20]. In addition, there was a cluster of polyphenol oxidase (PPO) genes residing in this region (Table 2).

    On Chr15, the significant WCI-associated region spanning between 31.7 Mb and 34.2 Mb encompassed several TF families, including MdMYB93 (MD15G1323500) (Fig. 4, Table 2, Supplemental Table S3). A distinguished G' peak region (24.9–26.9 Mb) on Chr15 harboured genes for WD-40 repeat-like proteins, bHLH proteins, redox responsive transcription factor 1 (MD15G1283200), cytochrome P450 proteins, HSF4 (MD15G1283700), and MdWRKY7 (MD15G1287300). The MdMYB73 (MD15G1288600) residing in this region has been shown to interact with MdMYB1/10 and regulates several functions, including cold-stress response, ubiquitination and malate synthesis[22, 23].

    The significant 1.5–3.4 Mb region on Chr16 flanked an anthocyanin repressor MYB protein (MD16G1029400), senescence-associated gene 12 (MD16G1031600), malate transporter MdMa2 (MD16G1045000: MDP0000244249), and two ethylene response factor genes (MdERF118: MD16G1043500; MdRAV1: MD16G1047700), which interact in retaining flesh firmness[24]. The MdMYB62 (MD16G1040800) gene residing in this region is phylogenetically linked to MdMYB8 (MD06G1217200), which plays a major role in flavonoid biosynthesis[25]. Another significant region (5.4–7.4 Mb) on Chr16 harboured several bHLH genes, including MdMYB88 (MD16G1076100) involved in phenylpropanoid synthesis resulting in drought resistance[26] and ABA-mediated anthocyanin production[27]. The MdMYB66 (MD16G1093200) gene, which is involved in triterpene biosynthesis, and the MdWRKY72 (MD16G1077700) gene involved in anthocyanin synthesis, were also present in this region (Table 2, Fig. 4).

    The genomic regions tagged by XP-GWAS were enriched for regulatory functions, and several of these have a paralog (Table 3). For example, paralogues for a trio of genes (MdMYB86, MdMYB98 and Cytochrome 450) resided in the FBD-associated genomic regions on Chr6 and Chr14. Several pairs of genes resided together in the FBD-associated paralog regions; for example, MdNAC90 and germin-like protein 10 on Chr3 and Chr11; WRKY55 and WRKY70 on Chr1 and Chr7; and ERF1 and ERF5 on Chr4 and Chr6. The ethylene response factor MdERF1B had a paralog in the FBD-associated region on Chr13 and Chr16. Interestingly, three copies of MdNAC83 (Chrs 14, 16 17) and four copies of MdMYB66 (Chrs 4, 6, 9 and 14) resided in the FBD-associated regions. A pair of genes (RAV1 and MYB62) resided together in the WCI-associated paralog regions on Chrs13 and 16 (Table 3).

    Table 3.  A list of homologues genes/genomic regions associated with the internal flesh browning disorder (IFBD) and red flesh (WCI) in apples. Putative candidate genes residing within these regions are also listed using GDDH13v1.1 reference genome assembly.
    TraitChr (genomic region: Mb)Gene namePredicted gene IDPutative function
    IFBDChr6 (29.8–31.7 Mb)MdMYB66MD06G1174200Suberin/triterpene deposition
    IFBDChr14 (25.4–27.5 Mb)MdMYB66MD14G1180700, MD14G1181000, MD14G1180900Suberin/triterpene deposition
    IFBDChr4 (7.0–8.1 Mb)MdMYB66MD04G1060200Suberin/triterpene deposition
    IFBDChr9 (14.9–16.5 Mb)MdMYB66MD09G1183800Suberin/triterpene deposition
    IFBDChr6 (29.8–31.7 Mb)MdMYB86MD06G1167200Anthocyanin regulation
    IFBDChr14 (25.4–27.5 Mb)MdMYB86MD14G1172900Anthocyanin regulation
    IFBDChr6 (29.8–31.7 Mb)MdMYB98MD06G1172900Drought stress response
    IFBDChr14 (25.4–27.5 Mb)MdMYB98MD14G1179000Drought stress response
    IFBDChr6 (29.8–31.7 Mb)Cytochrome P450MD06G1162600, MD06G1162700, MD06G1162800, MD06G1163100, MD06G1163300, MD06G1163400, MD06G1163500, MD06G1163600, MD06G1163800, MD06G1164000, MD06G1164100, MD06G1164300, MD06G1164400, MD06G1164500, MD06G1164700Flavonoid and triterpenic metabolism
    IFBDChr14 (25.4–27.5 Mb)Cytochrome P450MD14G1169000, MD14G1169200, MD14G1169600, MD14G1169700Flavonoid and triterpenic metabolism
    IFBDChr3 (14.7–16.6 Mb)MdNAC90MD03G1148500Senescence-related
    IFBDChr11 (16.5–18.5 Mb)MdNAC90MD11G11679000Senescence-related
    IFBDChr14 (25.4–27.5 Mb)MdNAC83MD14G1150900Senescence/ripening-related
    IFBDChr16 (8.9–10.9 Mb)MdNAC83MD16G1125800Senescence/ripening-related
    IFBDChr17 (0–0. 7 Mb)MdNAC83MD17G1010300Senescence/ripening-related
    IFBDChr3 (14.7–16.6 Mb)Germin-like protein 10MD03G1148000Polyphenol oxidase
    IFBDChr11 (16.5–18.5 Mb)Germin-like protein 10MD11G1167000, MD11G1167100, MD11G1167400, MD11G1169200Polyphenol oxidase
    IFBDChr1 (26.9–28.5 Mb)MdWRKY55MD01G1168500Drought stress response
    IFBDChr7 (30.3–31.9 Mb)MdWRKY55MD07G1234600Drought stress response
    IFBDChr1 (26.9–28.5 Mb)MdWRKY70MD01G1168600Drought stress response
    IFBDChr7 (30.3–31.9 Mb)MdWRKY70MD07G1234700Drought stress response
    IFBDChr4 (7.0–8.1 Mb)MdERF1MD04G1058000Ethylene responsive factor
    IFBDChr6 (5.5–7.3 Mb)MdERF1MD06G1051800Ethylene responsive factor
    IFBDChr4 (7.0–8.1 Mb)MdERF5MD04G1058200Ethylene responsive factor
    IFBDChr6 (5.5–7.3 Mb)MdERF5MD06G1051900Ethylene responsive factor
    IFBDChr13 (18.0–20.0 Mb)MdERF1BMD13G1213100Ethylene response factor 1
    IFBDChr16 (20.4–22.4 Mb)MdERF1BMD16G1216900Ethylene response factor 1
    WCIChr13 (2.6–4.4 Mb)MdRAV1MD13G1046100Ethylene responsive factor
    WCIChr16 (1.5–3.4 Mb)MdRAV1MD16G1047700Ethylene responsive factor
    WCIChr13 (2.6–4.4 Mb)MdMYB62MD13G1039900Flavonol biosynthesis
    WCIChr16 (1.5–3.4 Mb)MdMYB62MD16G1040800Flavonol biosynthesis
    IFBDChr9 (7.9–11.8 Mb)MdNAC42MD09G1147500, MD09G1147600Anthocyanin accumulation
    WCIChr17 (11.4–12.4 Mb)MdNAC42MD17G1134400Anthocyanin accumulation
    IFBDChr9 (7.9–11.8 Mb)HSP 70MD09G1137300Heat stress response
    WCIChr17 (11.4–12.4 Mb)HSP 70MD17G1127600Heat stress response
    IFBDChr4 (11.0–13.0 Mb)MdMYB85MD04G1080600Phenylalanine and lignin biosynthesis
    WCIChr6 (12.1–13.6 Mb)MdMYB85MD06G1064300Phenylalanine and lignin biosynthesis
    IFBDChr15 (13.2–14.2 Mb)MdEBF1MD15G1171800Ethylene inhibition
    WCIChr8 (15.2–17.2 Mb)MdEBF1MD08G1150200Ethylene inhibition
    IFBDChr15 (53.5–54.9 Mb)MdEIN3MD15G1441000Ethylene insensitive 3 protein
    WCIChr8 (30.3–31.6 Mb)MdEIN3MD08G1245800Ethylene insensitive 3 protein
    IFBDChr11 (1.7–3.0 Mb)MdEIN3MD11G1022400Ethylene insensitive 3 protein
    WCIChr7 (4.1–5.6 Mb)MdEIN3MD07G1053500, MD07G1053800Ethylene insensitive 3 protein
    IFBDChr15 (4.6–6.8 Mb)MdMYB73MD15G1076600, MD15G1088000Cold-stress response & malate accumulation
    WCIChr15 (24.8–26.8 Mb)MdMYB73MD15G1288600Cold-stress response & malate accumulation
    IFBDChr15 (4.6–6.8M b)MdWRKY7MD15G1078200Anthocyanin accumulation
    WCIChr15 (24.8–26.8 Mb)MdWRKY7MD15G1287300Anthocyanin accumulation
    IFBDChr15 (43.5–45.5 Mb)MdMYB93MD15G1369700Flavonoid & suberin accumulation
    WCIChr15 (31.7–34.2 Mb)MdMYB93MD15G1323500Flavonoid & suberin accumulation
     | Show Table
    DownLoad: CSV

    Paralogs of several regulatory functions were also found in the regions associated with either FBD or WCI; for example, a significant region (7.9–11.8 Mb) harbouring a gene trio (MdNAC42, HSP70 and HSP89.1) on Chr9 was associated with FBD, but the paralogs of this trio also resided in a distinct G' region associated with WCI on Chr17 (Table 3, Supplemental Table S3). Some other examples included MdMYB85 (Chr4 for FBD, and Chr6 for WCI), MdEBF1 (Chr8 for WCI, and Chr15 for FBD), MdEIN3 (Chr8 for WCI, and Chr15 for FBD), and EIN3 (Chr7 for WCI, and Chr11 for FBD). A pair of genes (MdMYB73 and MdWRKY7) resided together in the separate regions associated with FBD (4.6–6.8 Mb) and WCI (24.8–26.8 Mb) within Chr15 (Table 3).

    The red pigmentation in fruit flesh differed amongst transgenic lines, with fruit from line A10 presenting the most deeply pigmented tissues (Supplemental Fig. S3), while those from lines A2 and A4 were similar in having a lower intensity of pigmentation. No pigmentation was observed in the flesh of control 'Royal Gala' (RG) fruit. RNAseq analysis of a representative transgenic line (A2) compared with RG revealed that a total of 1,379 genes were differentially expressed (log 2-fold), with 658 genes upregulated and 721 genes downregulated. This list was then assessed for commonality with the genomic regions and candidate genes from the XP-GWAS.

    Genes that contained mis-sense SNPs (which would result in a change in predicted protein) and that were also differentially expressed between A2 red-fleshed transgenic line and white-fleshed 'Royal Gala' (control) apples included anthocyanin-related flavanone 3-hydroxylase, chalcone synthase and dihydroflavonol 4-reductase (Table 2 & 4). Many more upstream DNA variants (e.g. in potential promoter-controlling elements) were seen in this group of differentially expressed genes (DEGs) that were also in regions underlying WCI or FBD. Genes encoding enzymes that may be involved in FBD, such as a Rho GTPase activating protein, peroxidase, lipoxygenase 1, and ethylene-forming enzyme (ACO4), were DEGs and showed mis-sense SNPs, including a potential stop codon in the Rho GTPase-activating protein (Table 4). This intersection between DNA change and differential expression warrants further research to evaluate the functions of these genes.

    Table 4.  List of candidate genes associated with WCI or FBD in the XP-GWA and R6:MdMYB10 apple datasets.
    Mutations in GWAS apple populationPredicted gene functionExpression in R6 and ‘Royal Gala’ apples
    GeneMissense
    SNPs
    SNP
    Stop
    Upstream
    variants
    DatasetLocusAnnotation and TAIR IDAverage
    RPKM
    R6 flesh
    Average RPKM
    WT flesh
    log2Fold
    Change
    MD02G11322001FBD Supplemental Table S3Chr02:9450615-11289014flavanone 3-hydroxylase
    (F3H, TT6, F3'H) AT3G51240
    387752.47
    MD02G11336003FBD Supplemental Table S3Chr02:9450615-11289014fatty acid desaturase 5
    (FAD5) AT3G15850
    18109.98
    MD02G11537001WCI Table 2Chr02:11278254-13234556UDP-Glycosyltransferase, lignin related AT2G1856010385341.03
    MD03G10592002FBD Supplemental Table S3Chr03:3177994-4910866Peroxidase AT5G053402514.21
    MD03G1143300422FBD Table 1Chr03:14797661-16611554bZIP transcription factor (DPBF2, AtbZIP67) AT3G44460114852-2.80
    MD03G1147700121FBD Table 1Chr03:14797661-16611554Rho GTPase activating protein AT5G22400205891.29
    MD04G1003400331WCI Table 2Chr04:1-1284894Chalcone synthase (CHS, TT4) AT5G1393014433122.34
    MD04G120410063FBD Table 1Chr04:27629536-29612282lipoxygenase 1 (LOX1, ATLOX1) AT1G550205462681.09
    MD06G1160700129FBD Table 1Chr06:29862341-31737341peptide met sulfoxide reductase AT4G251302121254562.04
    MD06G116140014FBD Table 1Chr06:29862341-31737341Pectin lyase-like protein AT5G63180614129530-2.22
    MD07G1240700126FBD Supplemental Table S3Chr07:30357332-31979025Fe superoxide dismutase 2 AT5G511001051826-3.99
    MD07G13069006FBD Supplemental Table S3Chr07:34607570-36531467UDP-glucosyl transferase 78D2 AT5G170506771112.78
    MD08G12491002WCI Supplemental Table S3Chr08:30486569-31607516HSP20-like chaperone (ATHSP22.0) AT4G102503186456.12
    MD09G111400032FBD Table 1Chr09:7999212-11883202fatty acid desaturase 5 (FAD5) AT3G158507608.68
    MD09G11468001FBD Table 1Chr09:7999212-11883202PHYTOENE SYNTHASE (PSY) AT5G1723038456160901.32
    MD10G132810045FBD Supplemental Table S3Chr10:40235258-41736791ethylene-forming enzyme (ACO4) AT1G050108769033910331.21
    MD15G10236001FBD Table 1Chr15:1-1487288jasmonic acid carboxyl methyltransferase (JMT) AT1G19640472111552.07
    MD15G10241008FBD Table 1Chr15:1-1487288dihydroflavonol 4-reductase (DFR, TT3, M318) AT5G428008723091.63
    MD17G11334004WCI Supplemental Table S3Chr17:11422073-12433463PHYTOENE SYNTHASE (PSY) AT5G172306001721.87
    MD17G12606002FBD Supplemental Table S3Chr17:31098955-32776972dehydroascorbate reductase 1 (DHAR3) AT5G167101867−1.78
     | Show Table
    DownLoad: CSV

    Several gene families (e.g. chalcone synthase, UGT, anthocyanin synthase, HSP, PAL, ERF, WRKY proteins, ABA, and bZIP transcription factors) residing in WCI-associated genomic regions have been reported to be associated with RF in apple[7, 12, 28]. Several of these genes are implicated in stress responses, suggesting that flavonoids and anthocyanin biosynthesis could also be associated with stress (e.g., drought, water loss) tolerance of RF apples[7].

    MdMYB73, which may play a role in the cold-stress response[23, 29], resided in the WCI-associated regions. Ethylene is among the various modulators of environmental stresses induced by factors such as drought and cold temperatures[9, 28]. Several ERF proteins (e.g. MdERF1B, MdERF3) interact with the promoters of MYB domain proteins to regulate anthocyanin and proanthocyanidin (PA) accumulation in apple[10, 11, 30]. The WCI-associated genomic regions in our study flanked several ERFs previously reported to have roles in anthocyanin and PA regulation. MdERF4 (MD10G1290400), one of the three ERFs residing in the WCI-associated region on Chr10, has high phylogenetic similarity with MdERF38, which interacts with MdMYB1 to regulate drought-related anthocyanin biosynthesis[31]. Some ERFs (e.g. MdERF2: MD10G1286300; MdERF4: MD10G1290400, and MdERF12: MD10G1290900) and MdNAC73 residing in the WCI-associated regions have been reported to be associated with fruit maturation[20] – suggesting an interaction between ethylene production and RF colour[12].

    The WCI-associated region on Chr15 included a gene MdMYB73 (MD15G1288600) involved in malate acid synthesis. Previous studies have reported that MdMYB1 regulates both anthocyanin and malate accumulation, and perhaps MdBT2 regulates MdMYB73-mediated anthocyanin accumulation[22, 23]. The malate transporter gene MdMa2 and the MdMYB7 gene, involved in the regulation of anthocyanin and flavanols in RF apple[32], resided together in the WCI-associated upper region of LG16. Taken together, these results support the hypothesis that there is interplay between anthocyanin and malate accumulation in the RF apple. There was a cluster of ubiquitin-specific proteases underpinning the WCI-associated regions on Chrs 7 and 15, which is supported by earlier reports suggesting that ubiquitin-specific proteases respond to auxin and might suppress anthocyanin biosynthesis proteins[33]. The auxin response factor 9 (MdARF9: MD06G1111100), which has also been shown to suppress anthocyanin biosynthesis in RF callus samples[33], also resided in the WCI-associated genomic region on LG7.

    Seedlings in both the low- and high-FBD pools carried the MdMYB10 gene, which suggests that MdMYB10 itself is not the causal factor of FBD in RF apples. Long-term cold storage generally results in senescence-related flesh breakdown, and several transcription factor genes (e.g. MYB, WRKY, NAC, ERF, cytochrome P450, and HSP) have been shown to express differentially during long-term cold storage[9]. The FBD-associated genomic regions in our study harboured several ERFs, suggesting that ethylene synthesis proteins may be contributing to cell wall disassembly, allowing PPO enzymes to come into contact with phenolic compounds and potentially leading to FBD symptoms[18].

    Pectin methyl esterase (PME) genes resided in the FBD-associated significant regions on Chrs 3, 13 and 17. Volatile generation and senescence degradation have been suggested to be bio-markers of FBD, and the expression levels of methyl esters were found to be associated with FBD and senescence in 'Fuji' apples after cold storage[34]. The MdPME2 gene has also been reported to be associated with apple flesh firmness and mealiness[21, 35]. The co-location of genes encoding cell wall-degrading enzymes (MdPME) and QTLs for FBD has been reported in apple[18, 36].

    The clusters of cytochrome P450 enzymes and senescence-related genes resided in some of the FBD-associated regions in this study. There are no earlier reports of the involvement of P450 enzymes in apple FBD expression, but some genes related to cytochrome P450 were found to be upregulated during litchi fruit senescence[37]. Pericarp browning in litchi is mainly attributable to the degradation of anthocyanin, and the ABA-initiated oxidation of phenolic compounds by PPO[37]. Flavonoids are among the major polyphenols in RF apples[5], and cytochrome P450 is part of the regulatory mechanism for flavonoid metabolism[38]. Association of FBD with the genomic region harbouring P450 would suggest its role in enhanced polyphenol synthesis causing FBD. The co-occurrence of a senescence-related gene MdNAC90 (MD03G1148500; MD11G11679000) and the PPO regulator germin-like proteins (in the FBD-associated paralog regions on Chrs 3 and 11) lends support to an interplay between senescence and oxidation of phenolics and anthocyanins.

    A significant region on Chr9 encompassed a cluster of UGT proteins, which play a role in the regulation of flavonoids and phenolic compounds, as well as converting phloretin to phloridzin[39]. Cytochrome P450, which resided within several FBD-associated regions, is reportedly involved in flavonoid metabolism, such as chlorogenic acid (CGA) acid and phloridzin, which have also been positively associated with suberin production and cell wall disassembly[40, 41].

    Reactive oxygen species (ROS) play an important role in regulating physiological processes in plants, such as senescence[37]. Legay et al.[42] suggested that MdMYB93 (MD15G1369700), found residing in the FBD-associated regions in this study, plays a critical role in remobilisation of flavonoid/phenolic compounds, which can be utilised for detoxification of ROS in the case of oxidative stress. However, flavonoid biosynthesis has also been linked with suberin production causing cuticle cracks in apples[42, 43], and the development of cuticular cracks could accelerate flesh browning as a result of an enhanced oxidative process[44].

    Several HSP (e.g. HSP70, HSP70-1, HSP60, HSP89.1, and HSP DNAJ) and HSF (e.g. HSF4, HSFB4, HSFA6B) resided in the FBD-associated genomic regions. Ferguson et al.[45] showed that, during summer, apple flesh temperature could reach as high as 43 °C, and that an increase in the expression of HSP in apples was associated with high daily flesh temperatures, suggesting a role of HSP to counter heat stress. HSPs have been reported to interact with AP2/ERFs and to play a role in flavonoid biosynthesis and drought tolerance in apple[46]. Heat stress affects lignin accumulation and its substrate, O-phenols, and has been reported to play role in enzymatic browning[47]. Additionally, HSF that regulate HSP expression have also been reported to be regulated by cold stress to generate heat-induced cold tolerance in banana[48]. HSF1 was shown to transcriptionally regulate the promoters of HSP to enhance chilling tolerance in loquat fruit[49]. Activity of the enzymes (PAL, C4H, 4CL) of the phenylpropanoid pathway was positively correlated with loquat fruit lignification, whilst suppression of their expression by heat shock treatment and low-temperature conditioning significantly reduced fruit lignification[50].

    Wang et al.[7] showed that ascorbate peroxidase (APX) was among the genes that were upregulated in RF apple compared with in white-fleshed apples. Several genes (e.g. MdAPX1, MdAPX3, MdAPX4, and MdDHAR1) involved in ascorbate synthesis resided in the genomic regions associated with FBD. Co-localisation of MdDHAR and ascorbic acid (AsA) synthesis genes in the FBD-linked genomic regions have been reported[51], suggesting that the low AsA content increases fruit susceptibility to FBD[52]. It has been shown that the expression of MdMYB1 and MdDHAR genes was strongly correlated in RF apples, and that AO and APX were upregulated by anthocyanin regulatory genes[31].

    There were several genes associated with CGA biosynthesis residing in the FBD-associated regions on various linkage groups, including the genes MYB19 (MD07G1268000) and MdC3H (MD15G1436500). Higher concentrations of CGA were reported in transgenic apple lines carrying MdMYB10[12], suggesting a role of CGA metabolism in the expression of FBD[53]. Interestingly, some of the FBD-associated regions (e.g. Chrs 9, 11, 13, 14 and 17) reported here in RF apples coincide with those reported earlier for FBD in white-fleshed apples[18, 36, 53], suggesting some common underlying genetic mechanisms.

    As discussed above, ERFs have been reported to be involved in the accumulation of anthocyanin and PA biosynthesis, while ethylene synthesis proteins also contribute to cell membrane breakdown, allowing the PPO enzyme to come into contact with phenolic compounds, potentially leading to FBD symptoms[12, 18]. We observed clusters of anthocyanin biosynthesis proteins (bHLH), ERFs (MdERF2, MdERF4, MdERF12) and PPO genes together in the genomic region associated with WCI on Chr10. The co-occurrence of these gene families perhaps facilitates potential interactions that contribute to the genetic correlation between WCI and FBD. We noted that genes involved in flavonoid regulation and ethylene synthesis occurred together in the FBD-associated regions on several chromosomes (e.g. MD16G1140800 and MdPAE10: MD16G1132100; MdERF1B: MD16G1216900 and MdMYB15: MD16G1218000, MD16G1218900) – suggesting these genes could be in linkage disequilibrium and this would contribute to the expression of WCI and FBD.

    MYB7 (MD16G1029400) resided in the WCI-associated upper region of Chr16, and the expression level of MYB7 was shown to be correlated with that of LAR1 in peach fruit[54]. The MdLAR1 protein (MDP0000376284), which is located about 1.2 Mb upstream of MYB7 (MD16G1029400), was reported to be associated with WCI and FBD in apple[3]. Mellidou et al.[36] reported that 4CL (MD13G1257800 in the FBD-linked region on Chr13), which catalyses the last step of the phenylpropanoid pathway, leading either to lignin or to flavonoids, was upregulated in browning-affected flesh tissues. The gene MdMYB85, involved in the regulation of flavonoid and lignin biosynthesis, resided in the WCI-associated region on Chr6 and FBD-associated paralogous region on Chr4. Metabolic interactions between anthocyanin and lignin biosynthesis have been reported for apple[55] and strawberry[56], while flesh lignification and internal browning during low-temperature storage in a red-fleshed loquat cultivar was shown to be modulated by the interplay between ERF39 and MYB8[57].

    The co-localisation of MdMYB66 and cytochrome P450 proteins, along with the anthocyanin regulatory protein MdMYB86, in paralogous FBD-associated genomic regions on Chr6 and Chr14 suggests that these genes interact as a 'hub' contributing to the WCI-FBD genetic link. The paralogs of some other genes were found to be residing in the regions associated with either WCI or FBD. For example, MdNAC42 and HSP70 co-localised in the FBD-associated region on Chr9, but this same pair of genes also resided in the most prominent region associated with WCI on Chr17. Similarly, paralogs of MdEIN3 resided in the WCI-associated region on Chr7 (MD07G1053500, MD07G1053800) and FBD-associated region on Chr11 (MD11G1022400). Interestingly, the paralogs of MdMYB73 and MdWRKY7 co-localised in the WCI- (24.6–26.8 Mb) and FBD-associated (4.6–6.8 Mb) regions on Chr15. The WCI-associated region at the bottom of Chr11 hosted a cluster of senescence-related genes, along with the anthocyanin biosynthesis gene MdbHLH3 (MD11G1286900), suggesting they might interact in the genetic nexus between FBD and WCI.

    FBD in RF apples can be caused by senescence, injury via extreme temperature exposure (chilling or heat), or enzymatic (cut fruit) reaction. Genes reported to be connected to all three factors were located in various FBD-associated genomic regions in this study. Postharvest strategies that both delay senescence and limit exposure to low temperatures may be needed to manage FBD. We also hypothesise that high ascorbic acid content could help to minimise expression of FBD in Type-1 RF cultivars. The adverse genetic correlation between WCI and FBD appears to arise from dual and/or interactive roles of several transcription factors, which would pose challenges for designing a conventional marker-assisted selection strategy. The use of bivariate genomic BLUP to estimate breeding values to simultaneously improve adversely correlated polygenic traits (e.g. WCI and FBD), could be an alternative approach[58, 59].

    A population of 900 apple seedlings composed of 24 full-sib families was generated in 2011 by selected crossings between six red-leaved pollen parents and six white-fleshed female parents. All six pollen parents inherited their red-leaf phenotype from the same great-grandparent 'Redfield'[1]. Each pollen parent was involved in four crosses, and the female parents were involved in three to six crosses each. Foliage colour of young seedlings is a phenotypic marker for Type 1 RF apple. The main purpose of this trial was to understand the flesh colour variation and FBD in the Type 1 RF seedlings, so only the seedlings with red foliage (i.e. carrying MdMYB10) were kept for this trial. The number of seedlings per family varied from 10 to 95. The seedlings were grafted onto 'M9' rootstock and were planted in duplicate at the Plant & Food Research orchard in Hawke's Bay, New Zealand (39°39′ S, 176°53′ E) in 2015.

    Phenotyping for RF and FBD was conducted over two consecutive fruiting seasons (2017 and 2018). Fruit were harvested once, when judged mature, based on a change in skin background colour from green to yellow, and when the starch pattern index (SPI) was between 1.0 and 2.0 (on a scale of 0 to 7). In each season, six fruit were harvested from each plant and stored for 70 d at 0.5 °C, followed by 7 d at 20 °C before fruit evaluation. Fruit were cut in half across the equator and the proportion of the cortex area (PRA) that was red in colour, and the intensity of the red colour (RI) (= 1 (low) to 9 (high)) was scored. A weighted cortical intensity (WCI) was then calculated (PRA × RI) as an estimation of the amount of red pigment in the fruit. The proportion of the cortex area showing symptoms of FBD was also recorded. WCI and FBD were averaged over all fruit for a particular seedling. Fruit were also assessed for the following eating quality traits on a 1 (lowest) to 9 (highest) scale: firmness, crispness, juiciness, sweetness, sourness and astringency, to understand the genetic correlations of eating-quality traits with WCI and FBD.

    The binary vector pSA277-R6:MYB10 was transferred into Agrobacterium tumefaciens strain LAB4404 by electroporation. Transgenic 'Royal Gala' plants were generated by Agrobacterium-mediated transformation of leaf pieces, using a method previously reported[5]. Wild-type 'Royal Gala' and three independent transgenic lines (A2, A4 and A10) of R6:MdMYB10 were grown under glasshouse conditions in full potting mix with natural light. The resulting fruit were assessed for flesh colour phenotypes at harvest (around 135 d after full bloom). Fruit peel and cortex from three biological replicates were collected and frozen in liquid nitrogen, with each replicate compiled from five pooled mature fruit for each transgenic line or wild-type control.

    Total RNA of 36 samples (3 R6:MYB10 lines and 1 wild type control, 3 time points, 3 biological replicates) was extracted, using Spectrum Plant Total RNA Kit (SIGMA). Removal of genomic DNA contamination and first-strand cDNA synthesis were carried out using the mixture of oligo (dT) and random primers according to the manufacturer's instructions (QuantiTect Reverse Transcription Kit, Qiagen). Real-time qPCR DNA amplification and analysis was carried out using the LightCycler 480 Real-Time PCR System (Roche), with LightCycler 480 software version 1.5. The LightCycler 480 SYBR Green I Master Mix (Roche) was used following the manufacturer's method. The qPCR conditions were 5 min at 95 °C, followed by 45 cycles of 5 s at 95 °C, 5 s at 60°C, and 10 s at 72 °C, followed by 65 °C to 95 °C melting curve detection. The qPCR efficiency of each gene was obtained by analyzing the standard curve of a cDNA serial dilution of that gene. The expression was normalized to Malus × domestica elongation factor 1-alpha MdEF1α (XM_008367439) due to its consistent transcript levels throughout samples, with crossing threshold values changing by less than 2.

    Individual fruit measurements were first averaged for each seedling. As the phenotyping was repeated over two years, we used a mixed linear model (MLM) accounting for this 'permanent environmental effect', as previously described[58]. Pedigree-based additive genetic relationships among seedlings were taken into account for estimation of genetic parameters using ASReml software[60]. Product-moment correlations between best linear unbiased predictions (BLUP) of breeding values of all seedlings for different traits were used as estimates of genetic correlation among traits.

    A selective DNA pooling procedure was adopted to construct DNA pools. A high-pool and a low-pool were constructed separately for the two traits (WCI and FBD). Genomic DNA was extracted from the leaves of selected seedlings, and quantified by fluorimetry using the picogreen reagent (Cat#P11496, Thermo). The low and high pools consisted of 35 seedlings each, and normalised amounts (~300 ng) of DNA from individuals were pooled. The pools were dried down with DNA Stable reagent (Cat#93021001, Biomatrica) in a centrifugal evaporator and shipped for sequencing. Each DNA pool was sequenced using paired-end 125 bp reads on the Illumina HiSeq 2500 platform. The quality of raw sequence reads was checked with FastQC/0.11.2 and MultiQC/1.2. Based on the quality control reports, the reads were aligned to the published apple reference genome GDDH13 v1.1[61] using the program bowtie2/2.3.4.3[62] with trimming from both ends before alignments and aligning in full read length ("-5 6 -3 5 –end-to-end"). The mapping results were marked for duplicate alignments, sorted, compressed and indexed with samtools/1.12[63]. Based on the alignment of binary alignment map (BAM) files of the high and low pools, single nucleotide polymorphism (SNP) identification was performed using samtools/1.12 ('samtools mpileup') and bcftools/1.12 ('bcftools call –mv')[63, 64]. Variant sites with missing genotype in any of the pools, or having the same genotype between the pools, were discarded. To minimise the influence of sequencing quality on association analysis, the identified SNPs were further filtered according to the following criteria: 1) a Phred-scaled quality score > 20; and 2) the read depth in each pool was neither < 35, nor > 500.

    The allele frequencies between each pair of bulk DNAs (low versus high WCI; low versus high FBD) were compared at each SNP locus. Differences in the allele frequencies between the low and high pool were expected to be negligible for unlinked SNP markers, but allele frequency differences would be larger for SNPs closely linked to the underlying quantitative trait loci (QTLs) contributing to the extreme phenotypes. A nonparametric test (G-statistic = 2 × Σni ln(ni/nexp), where ni (i = 1 to 4) represented counts of reference and alternate alleles at a particular SNP generated from sequencing of the low and high pool, and nexp was the expected allele count assuming no allele frequency divergence between the two DNA pools[65].

    We then calculated a modified statistic (G'), which took into account read count variation caused by sampling of segregants as well as variability inherent in short-read sequencing of pooled samples[65]. Using R package QTLseqr[66], firstly a G-statistic was calculated for each SNP marker, and then a weighted average using Nadaraya-Watson kernel was obtained to yield a G' statistic for a sliding genomic window of 2 Mb size. The Nadaraya-Watson method weights neighbouring markers' G-values by their distance from the focal SNP so that closer SNPs receive higher weights. The 95th percentile value of G' was used as a threshold to identify significant hotspots and to identify the putative candidate genes residing within the ±1 Mb region around the G' peak. For comparison purposes, a standard two-sided Z-test[14] was also performed to determine the significance of allele frequency differences at SNP loci between the pools for each trait.

    The GDDH gene models intersecting with the XP-GWA hotspots were pulled out with bedtools/2.30.0 ("bedtools intersect -wo -nonamecheck"). The selected genes were further blasted to TAIR10 ("-evalue 1e-5") and the annotated functions from Arabidopsis genes with the best blast score, the highest % identity, and the longest aligned length, were used. Then the expressions of genes located in the GWA hotspots were extracted from the RNAseq analysis of the R6:MdMYB10 representative transgenic line, and the log 2-fold change between the R6:MdMYB10 and 'Royal Gala' apples were calculated.

    This research was funded in 2017/18 by the Strategic Science Investment Fund of the New Zealand Ministry of Business, Innovation and Employment (MBIE) and from 2019 by the Plant & Food Research Technology Development – Pipfruit programme. We thank our colleague Jason Johnston for providing some pictures of the flesh browning disorder in red-fleshed apples. Richard Volz and Jason Johnston provided constructive comments and suggestions on the manuscript.

  • The authors declare that they have no conflict of interest.

  • [1]

    Wu GA, Terol J, Ibanez V, López-García A, Pérez-Román E, et al. 2018. Genomics of the origin and evolution of Citrus. Nature 554:311−16

    doi: 10.1038/nature25447

    CrossRef   Google Scholar

    [2]

    Xie R, Zheng L, Jiao Y, Huang X. 2021. Understanding physiological and molecular mechanisms of citrus rootstock seedlings in response to root zone hypoxia by RNA-Seq. Environmental and Experimental Botany 192:104647

    doi: 10.1016/j.envexpbot.2021.104647

    CrossRef   Google Scholar

    [3]

    Balfagón D, Rambla JL, Granell A, Arbona V, Gómez-Cadenas A. 2022. Grafting improves tolerance to combined drought and heat stresses by modifying metabolism in citrus scion. Environmental and Experimental Botany 195:104793

    doi: 10.1016/j.envexpbot.2022.104793

    CrossRef   Google Scholar

    [4]

    Primo-Capella A, Forner-Giner MÁ, Martínez-Cuenca M, Terol J. 2022. Comparative transcriptomic analyses of citrus cold-resistant vs. sensitive rootstocks might suggest a relevant role of ABA signaling in triggering cold scion adaption. BMC Plant Biology 22:209

    doi: 10.1186/s12870-022-03578-w

    CrossRef   Google Scholar

    [5]

    Wu J, Cao J, Su M, Feng G, Xu Y, et al. 2019. Genome-wide comprehensive analysis of transcriptomes and small RNAs offers insights into the molecular mechanism of alkaline stress tolerance in a citrus rootstock. Horticulture Research 6:33

    doi: 10.1038/s41438-018-0116-0

    CrossRef   Google Scholar

    [6]

    Fan Z, Wu Y, Zhao L, Fu L, Deng L, et al. 2022. MYB308-mediated transcriptional activation of plasma membrane H+ -ATPase 6 promotes iron uptake in citrus. Horticulture Research 9:uhac88

    doi: 10.1093/hr/uhac088

    CrossRef   Google Scholar

    [7]

    Habibi F, Liu T, Folta K, Sarkhosh A. 2022. Physiological, biochemical, and molecular aspects of grafting in fruit trees. Horticulture Research 9:uhac32

    doi: 10.1093/hr/uhac032

    CrossRef   Google Scholar

    [8]

    Yang L, Xia L, Zeng Y, Han Q, Zhang S. 2022. Grafting enhances plants drought resistance: current understanding, mechanisms, and future perspectives. Frontiers in Plant Science 13:1015317

    doi: 10.3389/fpls.2022.1015317

    CrossRef   Google Scholar

    [9]

    Warschefsky EJ, Klein LL, Frank MH, Chitwood DH, Londo JP, et al. 2016. Rootstocks: Diversity, domestication, and impacts on shoot phenotypes. Trends in Plant Science 21:418−37

    doi: 10.1016/j.tplants.2015.11.008

    CrossRef   Google Scholar

    [10]

    Raiol-Junior LL, de Carvalho EV, Moreira AS, Marques JPR, Stuchi ES, et al. 2022. Graft compatibility classification within Aurantioideae based on biometric traits and the anatomy of graft union. Agriculture 12:76

    doi: 10.3390/agriculture12010076

    CrossRef   Google Scholar

    [11]

    Shimada T, Endo T, Fujii H, Nakano M, Sugiyama A, et al. 2018. MITE insertion-dependent expression of CitRKD1 with a RWP-RK domain regulates somatic embryogenesis in citrus nucellar tissues. BMC Plant Biology 18:166

    doi: 10.1186/s12870-018-1369-3

    CrossRef   Google Scholar

    [12]

    Wang X, Xu Y, Zhang S, Cao L, Huang Y, et al. 2017. Genomic analyses of primitive, wild and cultivated citrus provide insights into asexual reproduction. Nature Genetics 49:765−72

    doi: 10.1038/ng.3839

    CrossRef   Google Scholar

    [13]

    Peng Z, Bredeson JV, Wu GA, Shu S, Rawat N, et al. 2020. A chromosome-scale reference genome of trifoliate orange (Poncirus trifoliata) provides insights into disease resistance, cold tolerance and genome evolution in Citrus. The Plant Journal 104:1215−32

    doi: 10.1111/tpj.14993

    CrossRef   Google Scholar

    [14]

    He W, Xie R, Luo L, Chai J, Wang H, et al. 2022. Comparative transcriptomic analysis of inarching invigorating rootstock onto incompatible grafts in Citrus. International Journal of Molecular Sciences 23:14523

    doi: 10.3390/ijms232314523

    CrossRef   Google Scholar

    [15]

    He W, Xie R, Wang Y, Chen Q, Wang H, et al. 2022. Comparative transcriptomic analysis on compatible/incompatible grafts in Citrus. Horticulture Research 9:uhab72

    doi: 10.1093/hr/uhab072

    CrossRef   Google Scholar

    [16]

    He W, Wang Y, Chen Q, Sun B, Tang H, et al. 2018. Dissection of the mechanism for compatible and incompatible graft combinations of Citrus grandis (L.) Osbeck ('Hongmian Miyou'). International Journal of Molecular Sciences 19:505

    doi: 10.3390/ijms19020505

    CrossRef   Google Scholar

    [17]

    Zhu S, Nong J, Luo G, Li Q, Wang F, et al. 2021. Varied tolerance and different responses of five citrus rootstocks to acid stress by principle component analysis and orthogonal analysis. Scientia Horticulturae 278:109853

    doi: 10.1016/j.scienta.2020.109853

    CrossRef   Google Scholar

    [18]

    Balfagón D, Terán F, de Oliveira TDR, Santa-Catarina C, Gómez-Cadenas A. 2022. Citrus rootstocks modify scion antioxidant system under drought and heat stress combination. Plant Cell Reports 41:593−602

    doi: 10.1007/s00299-021-02744-y

    CrossRef   Google Scholar

    [19]

    Zhu S, Chen J, Ma Y, Yan S, Zhong G. 2013. Advances in the studies on citrus rootstock evaluation and application. Acta Horticulturae Sinica 40:1669−78

    Google Scholar

    [20]

    Jiang J, Hou R, Yang N, Li L, Deng J, et al. 2021. Physiological and TMT-labeled proteomic analyses reveal important roles of sugar and secondary metabolism in Citrus junos under cold stress. Journal of Proteomics 237:104145

    doi: 10.1016/j.jprot.2021.104145

    CrossRef   Google Scholar

    [21]

    Hasanuzzaman M, Nahar K, Alam MM, Roychowdhury R, Fujita M. 2013. Physiological, biochemical, and molecular mechanisms of heat stress tolerance in plants. International Journal of Molecular Sciences 14:9643−84

    doi: 10.3390/ijms14059643

    CrossRef   Google Scholar

    [22]

    Dumanović J, Nepovimova E, Natić M, Kuča K, Jaćević V. 2021. The significance of reactive oxygen species and antioxidant defense system in plants: a concise overview. Frontiers in Plant Science 11:552969

    doi: 10.3389/fpls.2020.552969

    CrossRef   Google Scholar

    [23]

    Gill SS, Tuteja N. 2010. Reactive oxygen species and antioxidant machinery in abiotic stress tolerance in crop plants. Plant Physiology and Biochemistry 48:909−30

    doi: 10.1016/j.plaphy.2010.08.016

    CrossRef   Google Scholar

    [24]

    Ozgur R, Uzilday B, Sekmen AH, Turkan I. 2013. Reactive oxygen species regulation and antioxidant defence in halophytes. Functional Plant Biology 40:832−47

    doi: 10.1071/FP12389

    CrossRef   Google Scholar

    [25]

    Jiang M, Zhang J. 2002. Water stress - induced abscisic acid accumulation triggers the increased generation of reactive oxygen species and up - regulates the activities of antioxidant enzymes in maize leaves. Journal of Experimental Botany 53:2401−10

    doi: 10.1093/jxb/erf090

    CrossRef   Google Scholar

    [26]

    Xie R, He W, Chai J, Luo L, Wang Y, et al. 2022. A study of scion phenotypes in pummelo grafted onto a new citrus rootstock Citrus junos 'Pujiang Xiangcheng'. Horticulturae 8:1039

    doi: 10.3390/horticulturae8111039

    CrossRef   Google Scholar

    [27]

    Fu X, Huang X, Chen T, Zhang J, Wang Y, et al. 2017. A new citrus rootstock 'Pujiang Xiangcheng' (Citrus junos). Journal of Fruit Science 34:917−20

    doi: 10.13925/j.cnki.gsxb.20170069

    CrossRef   Google Scholar

    [28]

    Wellburn AR, Lichtenthaler H. 1984. Formulae and program to determine total carotenoids and chlorophylls a and b of leaf extracts in different solvents. In Advances in Photosynthesis Research. Advances in Agricultural Biotechnology, ed. Sybesma C, vol 2. Springer, Dordrecht. pp. 9−12. https://doi.org/10.1007/978-94-017-6368-4_3

    [29]

    Shahid MA, Balal RM, Khan N, Simón-Grao S, Alfosea-Simón M, et al. 2019. Rootstocks influence the salt tolerance of Kinnow mandarin trees by altering the antioxidant defense system, osmolyte concentration, and toxic ion accumulation. Scientia Horticulturae 250:1−11

    doi: 10.1016/j.scienta.2019.02.028

    CrossRef   Google Scholar

    [30]

    Landi M. 2017. Commentary to: "Improving the thiobarbituric acid-reactive-substances assay for estimating lipid peroxidation in plant tissues containing anthocyanin and other interfering compounds" by Hodges et al., Planta (1999) 207:604–611. Planta 245:1067

    doi: 10.1007/s00425-017-2699-3

    CrossRef   Google Scholar

    [31]

    Zaher-Ara T, Boroomand N, Sadat-Hosseini M. 2016. Physiological and morphological response to drought stress in seedlings of ten citrus. Trees 30:985−93

    doi: 10.1007/s00468-016-1372-y

    CrossRef   Google Scholar

    [32]

    Ko D, Helariutta Y. 2017. Shoot–root communication in flowering plants. Current Biology 27:R973−R978

    doi: 10.1016/j.cub.2017.06.054

    CrossRef   Google Scholar

    [33]

    Dong D, Shi Y, Mou Z, Chen S, Zhao D. 2022. Grafting: a potential method to reveal the differential accumulation mechanism of secondary metabolites. Horticulture Research 9:uhac50

    doi: 10.1093/hr/uhac050

    CrossRef   Google Scholar

    [34]

    Mahmoud LM, Huyck PJ, Vincent CI, Gmitter FG Jr, Grosser JW, et al. 2021. Physiological responses and gene expression patterns in open-pollinated seedlings of a pummelo-mandarin hybrid rootstock exposed to salt stress and Huanglongbing. Plants 10:1439

    doi: 10.3390/plants10071439

    CrossRef   Google Scholar

    [35]

    Ziogas V, Tanou G, Filippou P, Diamantidis G, Vasilakakis M, et al. 2013. Nitrosative responses in citrus plants exposed to six abiotic stress conditions. Plant Physiology and Biochemistry 68:118−26

    doi: 10.1016/j.plaphy.2013.04.004

    CrossRef   Google Scholar

    [36]

    Lawson T, Blatt MR. 2014. Stomatal size, speed, and responsiveness impact on photosynthesis and water use efficiency. Plant Physiology 164:1556−70

    doi: 10.1104/pp.114.237107

    CrossRef   Google Scholar

    [37]

    García-Caparrós P, De Filippis L, Gul A, Hasanuzzaman M, Ozturk M, et al. 2021. Oxidative stress and antioxidant metabolism under adverse environmental conditions: a review. The Botanical Review 87:421−66

    doi: 10.1007/s12229-020-09231-1

    CrossRef   Google Scholar

    [38]

    Yang C, Wang P, Li C, Shi D, Wang D. 2008. Comparison of effects of salt and alkali stresses on the growth and photosynthesis of wheat. Photosynthetica 46:107−14

    doi: 10.1007/s11099-008-0018-8

    CrossRef   Google Scholar

    [39]

    Pietrini F, Chaudhuri D, Thapliyal AP, Massacci A. 2005. Analysis of chlorophyll fluorescence transients in mandarin leaves during a photo-oxidative cold shock and recovery. Agriculture, Ecosystems & Environment 106:189−98

    doi: 10.1016/j.agee.2004.10.007

    CrossRef   Google Scholar

    [40]

    Khan M, Hu J, Dahro B, Ming R, Zhang Y, et al. 2021. ERF108 from Poncirus trifoliata (L.) Raf. functions in cold tolerance by modulating raffinose synthesis through transcriptional regulation of PtrRafS. The Plant Journal 108:705−24

    doi: 10.1111/tpj.15465

    CrossRef   Google Scholar

    [41]

    Zhang Y, Ming R, Khan M, Wang Y, Dahro B, et al. 2022. ERF9 of Poncirus trifoliata (L.) Raf. undergoes feedback regulation by ethylene and modulates cold tolerance via regulating a glutathione S-transferase U17 gene. Plant Biotechnology Journal 20:183−200

    Google Scholar

    [42]

    Geng J, Wei T, Wang Y, Huang X, Liu J, et al. 2019. Overexpression of PtrbHLH, a basic helix-loop-helix transcription factor from Poncirus trifoliata, confers enhanced cold tolerance in pummelo (Citrus grandis) by modulation of H2O2 level via regulating a CAT gene. Tree Physiology 39:2045−54

    doi: 10.1093/treephys/tpz081

    CrossRef   Google Scholar

    [43]

    Arbona V, Hossain Z, López-Climent MF, Pérez-Clemente RM, Gómez-Cadenas A. 2008. Antioxidant enzymatic activity is linked to waterlogging stress tolerance in citrus. Physiologia Plantarum 132:452−66

    doi: 10.1111/j.1399-3054.2007.01029.x

    CrossRef   Google Scholar

    [44]

    De Carvalho DU, Leite RP Junior, Yada IFU, Tazima ZH. 2022. Trifoliate orange-related rootstocks enhance the horticultural performance of 'Shamouti' sweet orange under humid subtropical condition. Agriculture 12:1782

    doi: 10.3390/agriculture12111782

    CrossRef   Google Scholar

    [45]

    Zhu S, Huang T, Yu X, Hong Q, Xiang J, et al. 2020. The effects of rootstocks on performances of three late-ripening navel orange varieties. Journal of Integrative Agriculture 19:1802−12

    doi: 10.1016/S2095-3119(20)63212-9

    CrossRef   Google Scholar

    [46]

    Cantuarias-Avilés T, Mourão Filho FDAA, Stuchi ES, Da Silva SR, Espinoza-Nuñez E. 2011. Horticultural performance of 'Folha Murcha' sweet orange onto twelve rootstocks. Scientia Horticulturae 129:259−65

    doi: 10.1016/j.scienta.2011.03.039

    CrossRef   Google Scholar

  • Cite this article

    He W, Xie R, Chai J, Wang H, Wang Y, et al. 2024. Comprehensive evaluation of abiotic stress tolerance and graft compatibility of Citrus junos cv. 'Shuzhen No.1'. Fruit Research 4: e006 doi: 10.48130/frures-0023-0042
    He W, Xie R, Chai J, Wang H, Wang Y, et al. 2024. Comprehensive evaluation of abiotic stress tolerance and graft compatibility of Citrus junos cv. 'Shuzhen No.1'. Fruit Research 4: e006 doi: 10.48130/frures-0023-0042

Figures(2)  /  Tables(6)

Article Metrics

Article views(3794) PDF downloads(465)

ARTICLE   Open Access    

Comprehensive evaluation of abiotic stress tolerance and graft compatibility of Citrus junos cv. 'Shuzhen No.1'

Fruit Research  4 Article number: e006  (2024)  |  Cite this article

Abstract: Citrus is one of the world's most economically important fruit crops cultivated by grafting. To support the growth of scion cultivars, rootstock is the primary source of resistance to various abiotic stresses. Herein, seedlings of two genotypes of Citrus junos Sieb. ex Tanaka (the novel rootstock 'Shuzhen No.1' and commonly used rootstock 'Ziyang Xiangcheng'), as well as three commonly used rootstocks including citrange (Citrus sinensis Osbeck. × Poncirus trifoliata Raf.), trifoliate orange (P. trifoliata), and red tangerine (Citrus tangerine Hort. Ex Tanaka), were used as testing materials. The seed characteristics were evaluated, and the rootstock seedlings were subjected to flooding, drought, alkaline, and freezing treatments. Over time, the contents of chlorophyll, soluble sugar, proline, malondialdehyde, and the activity of superoxide dismutase, peroxidase, and catalase in the leaves under different treatments were examined. Furthermore, five citrus varieties were grafted as scions onto one-year-old seedlings from the four rootstocks. Graft success, shoot growth, and leaf greenness were measured and compared. The physiological and biochemical changes in 'Shuzhen No.1' were found to be similar to those in 'Ziyang Xiangcheng'. 'Shuzhen No.1' exhibited greater tolerance to flooding, alkaline, and freezing stress compared to the other four widely used citrus rootstocks, as indicated by physiological and biochemical indexes and principal component analysis. Moreover, the five citrus varieties grafted onto 'Shuzhen No.1' demonstrated vigorous growth and tree vigor. These findings provide valuable insights for the application of 'Shuzhen No.1' and future research on citrus rootstock.

    • Citrus is the world's most economically important fruit crop, and the majority of citrus is grown in mountainous regions with barren soil[1]. Citrus productivity can be greatly affected by environmental changes, such as brief periods of flooding, drought, or cold[24]. Moreover, citrus is susceptible to alkaline soils and exhibits leaf/shoot chlorosis, limiting its geographical distribution[5,6]. Citrus is cultivated through grafting, and rootstock can modify scion architecture and act as the core source of resistance to various stresses, allowing the upper section growth of scion cultivars to thrive[7,8]. With growing interest in perennial crops as valuable components of sustainable agriculture, rootstocks provide an approach for improving and expanding citrus perennial cultivation under various environmental conditions[9].

      Generally, rootstock selection and use are mainly determined by compatibility, orchard soil conditions, and local citriculture practice[10]. Germplasm with polyembryonicity, which can develop one or more somatic embryos that are genetically identical to the mother tree, is often selected for citrus rootstock due to genetically uniform rootstocks which can feasibly be prepared solely by sowing seeds[11,12]. Many rootstocks are used in citrus cultivation. Trifoliate orange (Poncirus trifoliata (L.) Raf) is widely used in citrus breeding owing to its cold hardiness and disease resistance[13]. However, trifoliate orange is sensitive to alkalinity and mineral deficiency and is incompatible with some citrus cultivars[5,1416]. Citrange (Citrus sinensis × P. trifoliata) is drought tolerant yet susceptible to salt and alkalinity[17,18]. Red tangerine (Citrus reticulata Blanco) is resistant to B-deficiency and citrus exocortis viroid (CEVd); however, the fruit quality of scion degrades when red tangerine is used as a rootstock[19]. Citrus junos Sieb. Ex Tanaka is an iron-deficient, alkaline-, cold- and acid-tolerant citrus rootstock native to southwest China[5,17,20]. Abiotic stresses can alter osmotic equilibrium and induce oxidative stress in plants through excessive generation of reactive oxygen species (ROS)[21,22]. Plants neutralize these ROS through different mechanisms, which can be classified as non-enzymatic and enzymatic antioxidant systems, including antioxidant enzymes superoxide dismutase (SOD), peroxidases (POD), and catalase (CAT)[2325]. Tolerant species or genotypes exhibit higher antioxidant enzyme activities than sensitive genotypes. Investigating tolerance to different abiotic stresses is critical for identifying the genetic resource for abiotic stress tolerance. Although rootstock can influence the agronomic performance of citrus trees, some widely used rootstocks may still demonstrate graft incompatibility in the orchard[9, 10]. Graft compatibility of intergeneric and intrafamilial species represents a tremendous agronomic potential for genetic improvement and improved crop management by combining unique traits from wild relative rootstocks with commercial citrus scion varieties[7].

      In our previous citrus rootstock breeding effort, we reported a novel rootstock cultivar, C. junos cv. Shuzhen No.1, with vigorous growth, spherical crown, upright and dense hard branches, cold resistance, and robust adaptation to basic soil conditions[26, 27]. Therefore, this study compared the differences in seed germination characteristics, abiotic tolerance (drought, flooding, alkaline, and freezing), and grafted plant performance between 'Shuzhen No.1' and other common citrus rootstocks. This study determined the polyembryony and seedling emergence traits of five citrus rootstocks, comprehensively evaluated the tolerance responses of different genotypes of citrus rootstock, and provided information on the performances of five citrus varieties on rootstocks. Our findings provide insights into rootstock selection and promote the utilization of the new citrus rootstock 'Shuzhen No.1'.

    • Mature fruits of 'Shuzhen No.1' (abbreviated CjSz), trifoliate orange (Pt), red tangerine (Ct), citrange (Cp), and 'Ziyang Xiangcheng' (CjZy) were harvested for collecting seeds from the Citrus Germplasms Repository of Sichuan Province, Chengdu, China. Isolated seeds were surface sterilized using 0.5 M NaOH as described previously[17]. Uniform-sized seedlings were selected and grown in a growth chamber in perlite-filled pots. All seedlings were cultured for approximately six months with normal watering and fertilization.

    • Two hundred viable seeds (not replicated) were selected from each rootstock, and the following parameters were assessed: (1) cumulative seedling number, (2) percentage of single seed emergence, and (3) polyembryony. CitRWP plays a principal role in regulating somatic embryogenesis in citrus nucellar tissues, and its alleles were divided into two types and polyembryonic alleles with a MITE insertion[11,12]. The absence or presence of the MITE insertion was evaluated with genomic PCR using the following primer set: forward 5ʹ-GTTACTTGGAGACGGCCTAACG-3ʹ and reverse 5'-TCGATCATGTAATGCTGACTC-3ʹ[11].

    • Abiotic stress treatments included flooding (roots submerged in water with only stem and leaves exposed to the environment for 6 and 7 weeks), drought (20% soil water content for 1 and 2 weeks), alkalinity (watering distilled water with pH 8.0 and 9.0 for 8 weeks), and freezing (–10 °C for 1 and 2 h) were performed. Three biological replicates (five seedlings per replicate) were set randomly for each treatment. All leaves were sampled from five rootstocks, frozen in liquid nitrogen, and stored at –80 °C.

    • The total chlorophyll and carotenoid contents were measured using the method reported by Lichtenthaler & Buschmann[28]. Fresh leaves (1 g) were ground in a freezing mortar and pestle with 10 mL of 80% acetone. Following filtering, the pigment solution's optical density (OD) was measured at 470, 645, and 663 nm to determine carotenoid, chlorophyll (Chl) a, Chl b, and total Chl content, respectively. The assessed photosynthetic pigments were presented in mg/g fresh weight (FW). Antioxidant enzyme activities of SOD (EC 1.15.1.1), guaiacol peroxidase (POD, EC 1.11.1.7), and CAT (EC 1.11.1.6) were determined as previously described[29]. Malondialdehyde (MDA) content was measured using the thiobarbituric acid (TBA) method[30]. Soluble sugars and proteins were analyzed as previously described[31]. To minimize the differences between different genotypes, the data were expressed as ratios relative to the values of control groups.

    • 'Chunjian' (C. reticulata × (C. reticulata × C. sinensis)), 'Buzhihuo' (C. unshiu × C. sinensis), 'Mingrijian' ((C. unshiu × C. hassaku) × C. sinensis), 'Dafen' (C. unshiu), and 'Tarocco' (C. sinensis) were grafted onto four rootstocks, including CjSz, CjZy, Ct, and Pt. Ninety seedlings were cultured for 1 month with normal watering and fertilization, and their survival rates were measured on March 30th, 2019. Tree growth and leaf greenness were assessed in 5–10 grafted trees in each cultivar. Stem thicknesses below and above the graft joint were measured using a vernier caliper on October 30th, 2020. Shoot length and longitudinal and horizontal growth of trees were recorded using a tape measure from summer shoots on October 30th, 2020. Ten mature leaves from summer shoots were selected from each tree to measure soil-plant analysis development (SPAD) with a SPAD-502 chlorophyll meter.

    • Microsoft Excel was used to prepare the collected data. Significant differences between grafted combinations were analyzed using Tukey's method, and Pearson correlation and principal component analyses were performed using SPSS 20.0 software. All figures were drawn using GraphPad Prism (v. 7.04).

    • Compared with CjZy, CjSz has a spherical crown and upright and dense hard branches (Fig. 1a, b). CjSz and CjZy had solitary flowers (Fig. 1c, d). However, the lateral petals of CjSz are purple from bud to bloom, with a flower diameter of 2.0 cm (Fig. 1c). The fruits of both CjSz and CjZy were orange in color at maturity (Fig. 1c, d) and both were polyembryonic (Fig. 1c, d). Citrus rootstock seeds germinated 40–45 d after seeding and stopped germinating 95–100 d later (Fig. 1e). CjSz had the greatest emergence rate and polyembryonic ratio among the tested rootstocks, reaching 160.77% and 70.69%, respectively (Fig. 1e, f). The germination potential was 25.50%, which was lower than that of trifoliate orange (29.00%) but higher than that of CjZy, citrange, and red tangerine (Fig. 1e). According to statistics on single seed emergences, CjSz had the most single seed emergences (two, up to 44.83%), slightly lower than CjZy (46.76%) but higher than Pt, Ct, and Cp. The proportion of CjSz was highest among the five tested rootstocks, at 18.72% (three seedlings), 4.39% (four seedlings), 1.48% (five seedlings), and 0.49% (six seedlings). Additionally, the maximum number of seedlings per grain was seven (Fig. 1f). These results are consistent with the MITE insertion detection results (Fig. 1g). Apomixis in citrus is sporophytic and highly stable across commercial varieties. Citrus junos fruits were densely seeded, with most of the seeds being plump and polyembryonic, which can generate large numbers of uniform rootstocks from seeds[12,31].

      Figure 1. 

      Comparison of morphology between two genotypes of Citrus junos. (a), (b) Six year old trees; (c), (d) flowers, fruits and seeds; (e) cumulative number of seedlings; (f) percentage of single seed emergence; (g) MITE insertion in five rootstock germplasms. CjSz: Shuzhen No.1 (Citrus. junos Sieb. Tanaka); CjZy: Ziyang Xiangcheng (C. junos Sieb. Tanaka); Cp: citrange (C. sinensis Osbeck. × Poncirus trifoliate Raf.); Pt: trifoliate orange (P. trifoliate [L.] Raf) and Ct: Red tangerine (C. tangerine Hort. Ex Tanaka). Scale bars = 1 cm.

    • All genotypes developed leaf chlorosis at the end of the abiotic stress treatments (Fig. 2). Almost all treatments reduced the content of leaf photosynthetic pigments in all rootstocks (Table 1). Comparing the pigment content data among the different rootstocks, it is evident that CjSz demonstrated better adaptability to alkaline and freezing stresses (Table 1, Fig. 2). Specifically, under alkaline treatment with a pH of 8.0, CjSz exhibited the smallest decrease in leaf photosynthetic pigments content. In the case of alkaline treatment with a pH of 9.0, CjSz displayed similar levels of leaf chlorina compared to Cp, followed by CjZy, Pt and Ct. Similarly, under freezing treatment for 1 h, the ratios of Chl a, total Chl and total carotenoids in CjSz were higher than in other rootstocks, although the differences were not statistically significant. More specifically, among the different treatments, CjSz experienced the greatest decrease in Chl a, Chl b, and total Chl under 2 weeks of drought treatment, with ratios of 0.48, 0.64, and 0.53, respectively. Conversely, CjSz demonstrated the least decrease under freezing treatment for 1 h, with ratios of 0.96, 1.05, and 0.99, respectively (Table 1). The total carotenoid content in CjSz experienced the most significant decrease after 2 weeks of drought treatment, while the least decrease occurred under alkaline treatment with a pH of 8.0 (Table 1).
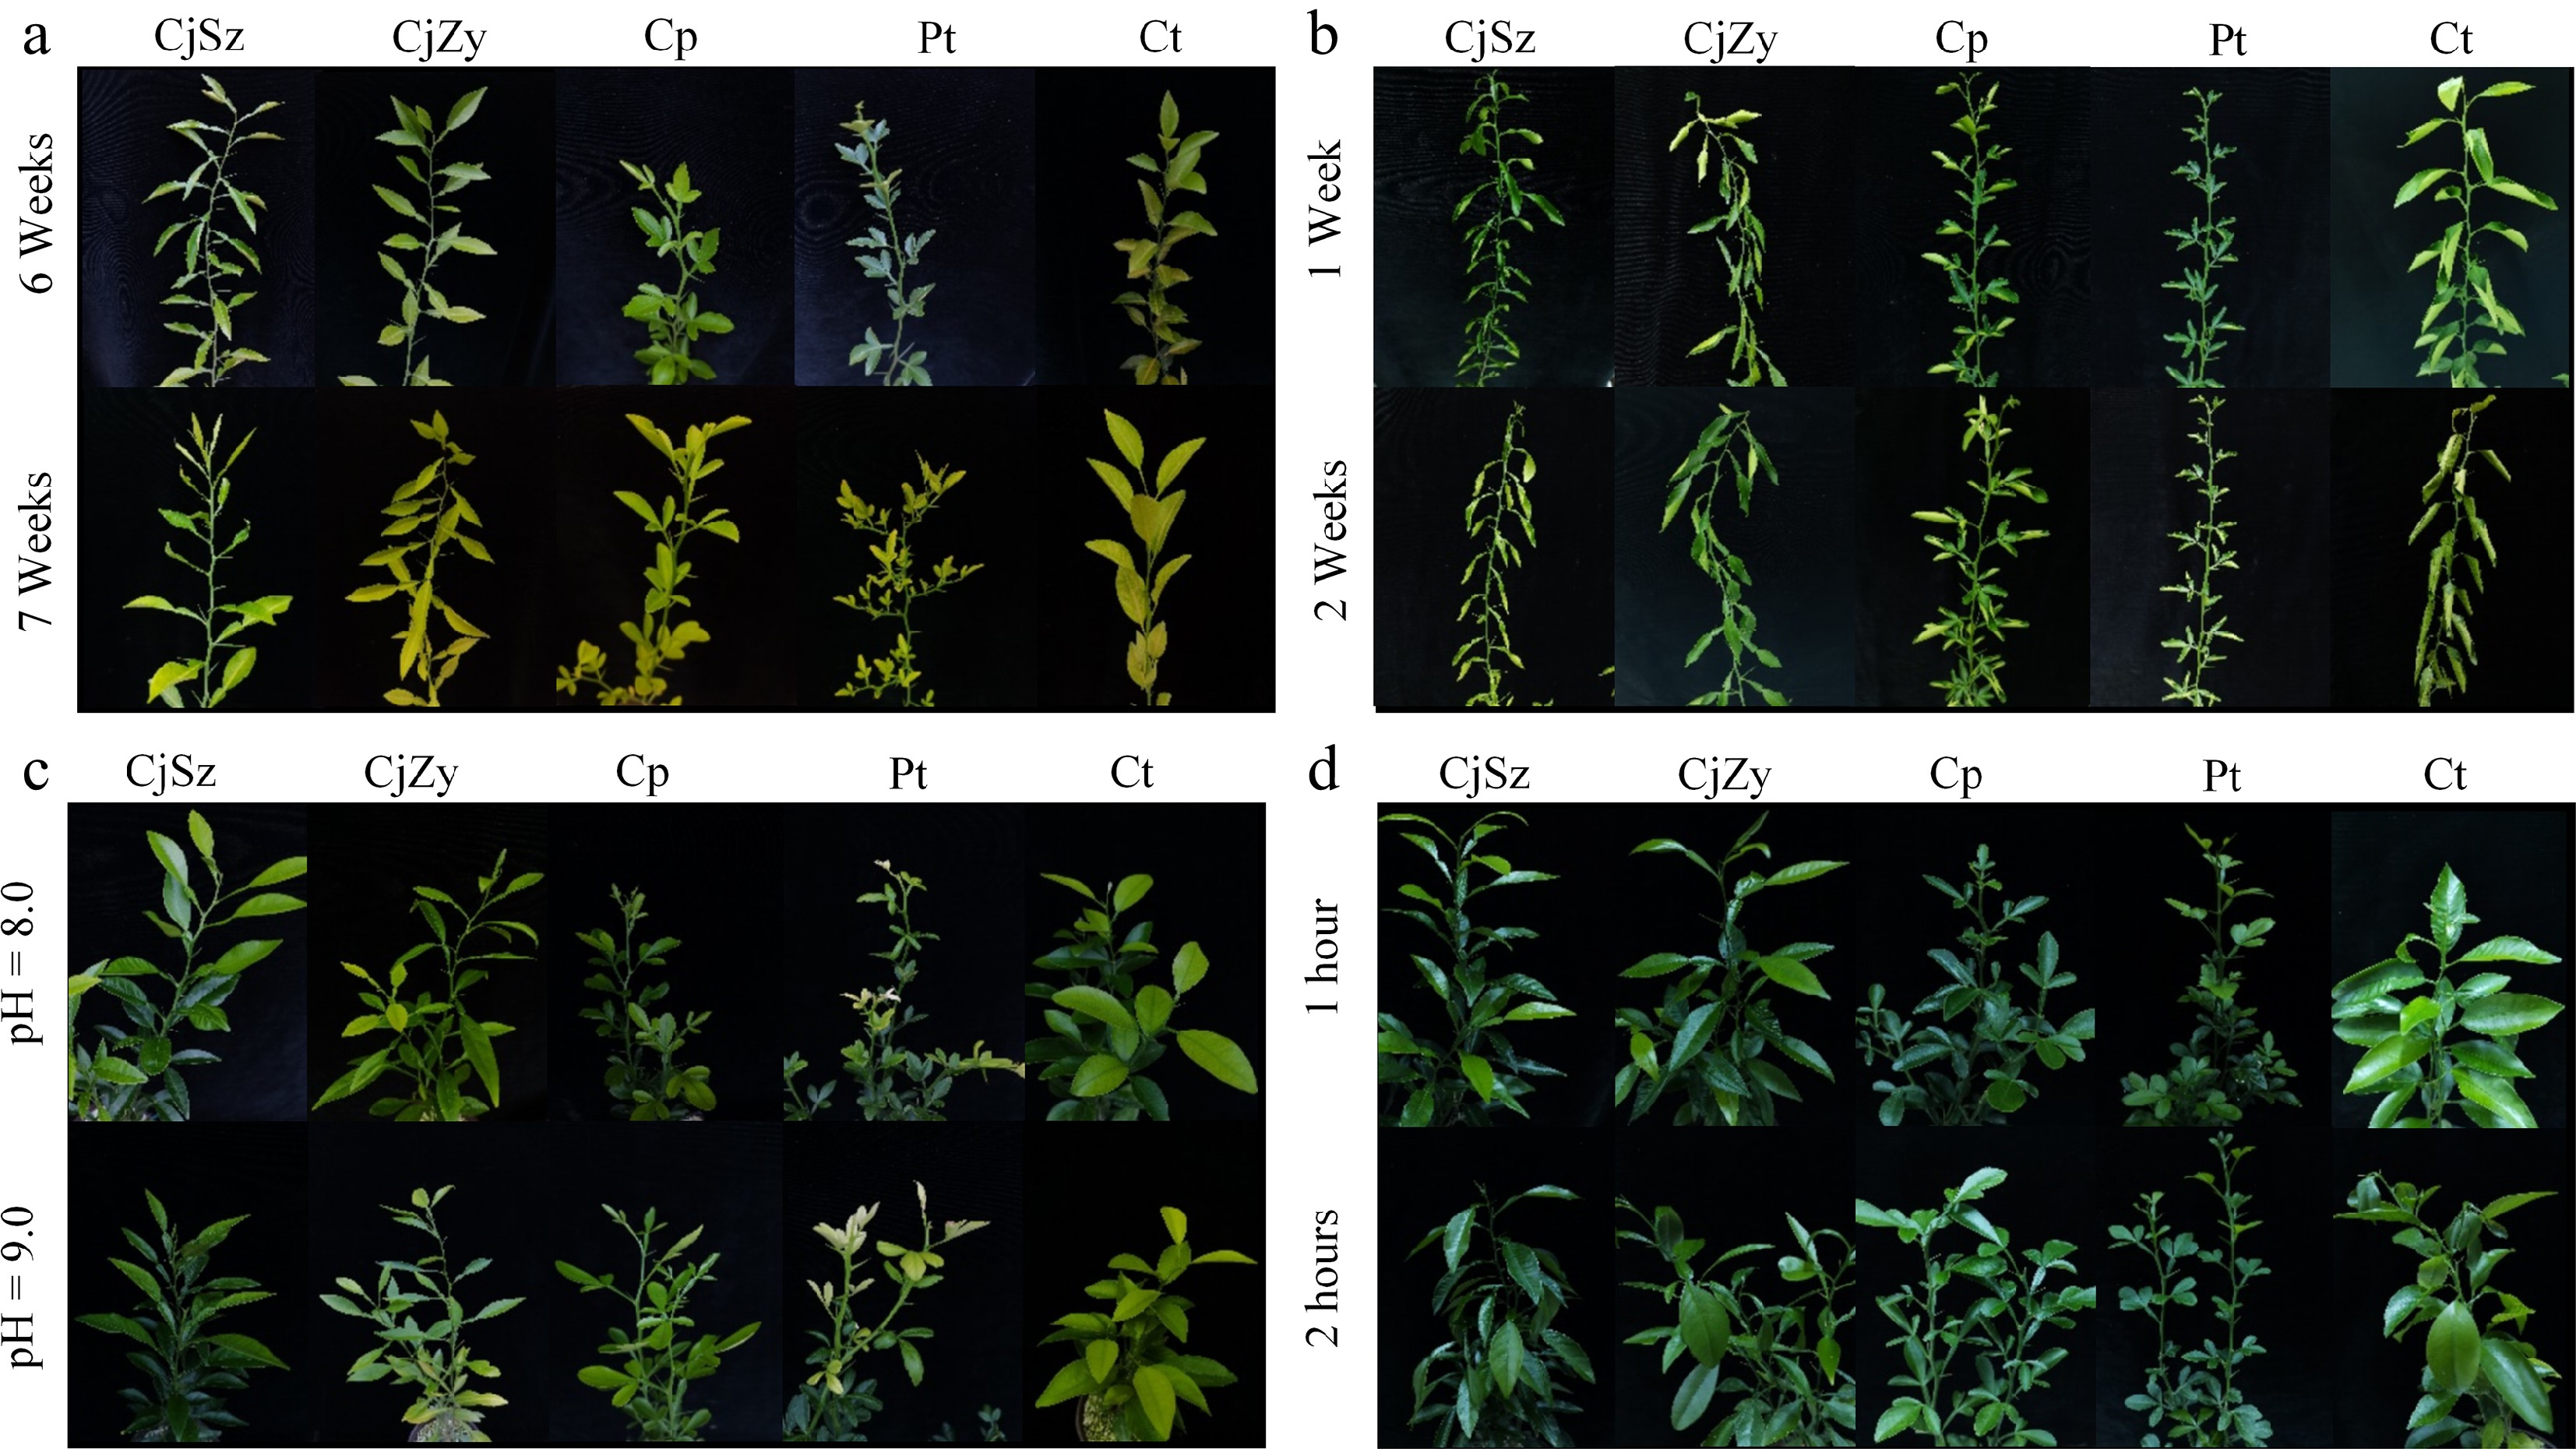
      Figure 2. 

      Growth state of five rootstocks under abiotic stresses. (a) Flooding stress; (b) drought stress; (c) alkaline stress (pH = 8.0 and pH = 9.0); (d) freezing stress.

      Table 1.  Statistics for chlorophyll a, chlorophyll b, total chlorophyll and total carotenoid compared with controls.

      SpeciesFlooding stressDrought stressAlkaline stressFreezing stress
      6 weeks7 weeks1 week2 weekspH = 8.0pH = 9.01 h2 h
      Chl aCjSz0.72 ± 0.12a0.60 ± 0.04a0.53 ± 0.08a0.48 ± 0.15a0.86 ± 0.26a0.74 ± 0.35ab0.96 ± 0.24a0.83 ± 0.11a
      CjZy0.67 ± 0.22a0.68 ± 0.09a0.59 ± 0.16a0.45 ± 0.22a0.79 ± 0.14a0.69 ± 0.19ab0.85 ± 0.17a0.79 ± 0.19a
      Cp0.77 ± 0.26a0.69 ± 0.26a0.66 ± 0.28a0.61 ± 0.16a0.83 ± 0.26a0.77 ± 0.20a0.88 ± 0.12a0.85 ± 0.18a
      Pt0.63 ± 0.06ab0.63 ± 0.19a0.63 ± 0.03a0.60 ± 0.08a0.72 ± 0.03ab0.68 ± 0.07ab0.91 ± 0.20a0.88 ± 0.05a
      Ct0.44 ± 0.10b0.38 ± 0.09b0.28 ± 0.05b0.23 ± 0.07b0.48 ± 0.04b0.47 ± 0.07b0.92 ± 0.06a0.69 ± 0.15a
      Chl bCjSz0.78 ± 0.12a0.70 ± 0.08a0.67 ± 0.14a0.64 ± 0.15a0.87 ± 0.26a0.77 ± 0.31a1.05 ± 0.22a1.00 ± 0.12a
      CjZy0.70 ± 0.20a0.65 ± 0.09a0.72 ± 0.09a0.52 ± 0.20a0.76 ± 0.11a0.74 ± 0.13a0.86 ± 0.11ab0.92 ± 0.17ab
      Cp0.76 ± 0.24a0.68 ± 0.25a0.71 ± 0.25a0.68 ± 0.15a0.85 ± 0.18a0.78 ± 0.16a0.82 ± 0.09b0.83 ± 0.11b
      Pt0.71 ± 0.13a0.66 ± 0.20a0.66 ± 0.05a0.68 ± 0.11a0.69 ± 0.09ab0.66 ± 0.08ab0.86 ± 0.19ab0.87 ± 0.11ab
      Ct0.47 ± 0.09b0.50 ± 0.12a0.39 ± 0.04b0.33 ± 0.06b0.51 ± 0.04b0.47 ± 0.05b1.00 ± 0.10ab0.64 ± 0.12c
      TotalCjSz0.74 ± 0.12a0.63 ± 0.05ab0.57 ± 0.10a0.53 ± 0.15a0.86 ± 0.26a0.75 ± 0.33a0.99 ± 0.23a0.89 ± 0.12a
      ChlCjZy0.68 ± 0.21a0.67 ± 0.09a0.63 ± 0.14a0.47 ± 0.21a0.78 ± 0.13a0.71 ± 0.17ab0.85 ± 0.15a0.84 ± 0.19ab
      Cp0.76 ± 0.25a0.68 ± 0.26a0.67 ± 0.27a0.63 ± 0.16a0.84 ± 0.23a0.77 ± 0.19a0.86 ± 0.11a0.84 ± 0.15ab
      Pt0.65 ± 0.08ab0.64 ± 0.19a0.63 ± 0.03a0.63 ± 0.09a0.71 ± 0.05ab0.67 ± 0.07ab0.89 ± 0.19a0.87 ± 0.07a
      Ct0.45 ± 0.10b0.42 ± 0.10b0.32 ± 0.04b0.27 ± 0.07b0.49 ± 0.03b0.47 ± 0.06b0.95 ± 0.08a0.67 ± 0.14b
      TotalCjSz0.83 ± 0.12a0.65 ± 0.10a0.68 ± 0.11a0.55 ± 0.18ab0.96 ± 0.30a0.71 ± 0.27a0.96 ± 0.20a0.95 ± 0.13a
      CarCjZy0.62 ± 0.15bc0.65 ± 0.08a0.56 ± 0.14a0.51 ± 0.25ab0.68 ± 0.11bc0.69 ± 0.12ab0.77 ± 0.14a0.76 ± 0.12bc
      Cp0.76 ± 0.24ab0.67 ± 0.23a0.63 ± 0.19a0.69 ± 0.13a0.79 ± 0.15ab0.75 ± 0.17a0.92 ± 0.06a0.86 ± 0.14ab
      Pt0.69 ± 0.08ab0.62 ± 0.16ab0.64 ± 0.04a0.65 ± 0.09a0.73 ± 0.04b0.63 ± 0.05ab0.91 ± 0.23a0.95 ± 0.05a
      Ct0.45 ± 0.12c0.43 ± 0.13b0.38 ± 0.05b0.37 ± 0.10b0.47 ± 0.03c0.49 ± 0.05b0.89 ± 0.14a0.67 ± 0.14c
      Note: Chl: chlorophyll, Car: carotenoids. Data shown in the table are expressed as ratios relative to the values obtained on control seedlings. Three biological replicates (five seedlings per replicate) were set randomly for each treatment. Significance was tested for indicators of different rootstocks in the same treatment, and different lowercase letters indicate significant differences at p < 0.05.
    • The levels of MDA, and the activities of SOD, POD, and CAT were significantly influenced by abiotic stresses (Table 2). CAT activity decreased under flooding, alkaline, and freezing stress, but slightly increased under drought stress. MDA levels and SOD and POD activities increased under flooding, drought, alkaline, and freezing stresses in all citrus rootstock genotypes (Table 2). However, CAT activity decreased under abiotic stress. Among the genotypes, CjSz exhibited the highest increase in MDA levels during 7 weeks of flooding treatment, and the lowest increase during 1 h of freezing treatment. SOD activity in CjSz showed the greatest increase after 7 weeks of flooding treatment and the smallest increase after alkaline stress treatment at pH 8.0. CjSz had the highest POD activity ratio of 1.62 under freezing stress, and the lowest value of 1.25 under 2 weeks of drought treatment. In comparison to the other four rootstocks, CjSz had the highest SOD ratio value (1.71) under 7 weeks of flooding stress. Additionally, CjSz exhibited the highest POD ratio value under alkaline (1.37 and 1.46) and freezing stresses (1.62). Under drought stress, CjSz had significantly lower MDA and POD ratio values than the other four rootstocks.

      Table 2.  Mean comparison of malondialdehyde (MDA), superoxide dismutase (SOD), catalase (CAT) and peroxidase (POD).

      SpeciesFlooding stressDrought stressAlkaline stressFreezing stress
      6 weeks7 weeks1 week2 weekspH = 8.0pH = 9.01 h2 h
      MDACjSz1.42 ± 0.30bc2.02 ± 0.16ab1.07 ± 0.11d1.90 ± 0.26b1.11 ± 0.11b1.50 ± 0.13c1.02 ± 0.22b1.24 ± 0.39b
      CjZy1.45 ± 0.17bc1.81 ± 0.30b1.79 ± 0.22b2.10 ± 0.14a1.47 ± 0.30ab1.75 ± 0.28bc1.02 ± 0.13b1.15 ± 0.27b
      Cp1.67 ± 0.20ab1.84 ± 0.41b1.31 ± 0.23cd2.25 ± 0.61a1.33 ± 0.39ab1.36 ± 0.20c1.49 ± 0.29a1.92 ± 0.63a
      Pt1.26 ± 0.16c1.48 ± 0.34b1.45 ± 0.31bc2.03 ± 0.43a1.84 ± 0.40a2.41 ± 0.42a0.91 ± 0.34b1.01 ± 0.54b
      Ct1.75 ± 0.25a2.42 ± 0.66a2.30 ± 0.36a2.29 ± 0.37a1.36 ± 0.10ab1.92 ± 0.36b1.00 ± 0.17b1.46 ± 0.26ab
      SODCjSz1.60 ± 0.26a1.71 ± 0.03a1.53 ± 0.02ab1.63 ± 0.11a1.25 ± 0.08a1.31 ± 0.15ab1.31 ± 0.06ab1.35 ± 0.16a
      CjZy1.65 ± 0.10a1.70 ± 0.07a1.62 ± 0.07a1.71 ± 0.06a1.31 ± 0.29a1.36 ± 0.29a1.12 ± 0.27b1.54 ± 0.21a
      Cp1.25 ± 0.18c1.19 ± 0.18b1.18 ± 0.16c1.15 ± 0.15b1.12 ± 0.05ab1.26 ± 0.02ab1.25 ± 0.17ab1.05 ± 0.23b
      Pt1.56 ± 0.10ab1.50 ± 0.46ab1.69 ± 0.16a1.51 ± 0.28a0.94 ± 0.30b0.94 ± 0.39c1.39 ± 0.19a1.56 ± 0.11a
      Ct1.36 ± 0.10bc1.61 ± 0.18a1.35 ± 0.17bc1.23 ± 0.18b1.08 ± 0.07ab1.04 ± 0.09bc1.18 ± 0.24ab1.07 ± 0.08b
      PODCjSz1.40 ± 0.31a1.50 ± 0.10ab1.25 ± 0.38c1.45 ± 0.61b1.37 ± 0.49a1.46 ± 0.22a1.62 ± 0.32ab1.62 ± 0.37a
      CjZy1.61 ± 0.33a1.62 ± 0.38ab2.23 ± 0.68ab2.69 ± 0.72a1.29 ± 0.24a1.38 ± 0.54a1.25 ± 0.66b1.55 ± 0.59a
      Cp1.45 ± 0.16a2.16 ± 0.86a2.59 ± 1.09a2.90 ± 0.70a1.27 ± 0.28a1.31 ± 0.32a1.28 ± 0.44b1.46 ± 0.49a
      Pt0.85 ± 0.17b1.25 ± 0.21b1.40 ± 0.41bc1.57 ± 0.50b0.83 ± 0.22b1.17 ± 0.32a1.85 ± 0.28a1.83 ± 0.23a
      Ct1.00 ± 0.26b1.99 ± 0.65a2.64 ± 0.67a2.25 ± 1.20ab0.80 ± 0.24b1.06 ± 0.32a1.21 ± 0.21b1.25 ± 0.48a
      CATCjSz0.98 ± 0.20ab0.77 ± 0.10a1.14 ± 0.14ab1.00 ± 0.10ab0.91 ± 0.30a0.67 ± 0.09c0.87 ± 0.14a0.67 ± 0.10c
      CjZy0.74 ± 0.03b0.91 ± 0.09a1.52 ± 0.28a0.93 ± 0.08b0.57 ± 0.17a1.08 ± 0.17b0.71 ± 0.09ab1.56 ± 0.24a
      Cp0.90 ± 0.06ab0.79 ± 0.18a0.91 ± 0.04b1.08 ± 0.14ab0.70 ± 0.14a1.59 ± 0.10a0.90 ± 0.08a0.61 ± 0.03c
      Pt1.08 ± 0.11a0.72 ± 0.02a0.47 ± 0.06c1.28 ± 0.08a1.04 ± 0.14a0.84 ± 0.15bc0.53 ± 0.14b0.85 ± 0.10bc
      Ct0.77 ± 0.10 ab0.66 ± 0.12 a1.33 ± 0.44 a1.15 ± 0.15 ab0.79 ± 0.11 a0.88 ± 0.11 bc0.70 ± 0.13 ab1.09 ± 0.19 b
      Note: Data showed in the table are expressed as ratios relative to the values obtained on control seedling. Different lowercase letters indicate significant differences at p < 0.05.

      The regulation of soluble protein and sugar contents in response to abiotic stressors varied among the citrus rootstock genotypes (Table 3). Compared with other rootstocks, CjSz had the lowest ratio of soluble proteins during 7 weeks of flooding stress, but the highest ratio under drought, alkaline, and freezing stresses. CjSz exhibited the greatest increase in soluble sugars under 7 weeks of flooding stress and 1 week of drought stress, whereas other rootstocks showed moderate increases. Specifically, the overall ratio of soluble proteins in CjSz was the highest (2.16) under 2 h of freezing stress and the lowest (1.10) during 7 weeks of flooding stress. However, the ratio of soluble sugars displayed opposite trends.

      Table 3.  Mean comparison of soluble proteins and soluble sugars.

      SpeciesFlooding stressDrought stressAlkaline stressFreezing stress
      6 weeks7 weeks1 week2 weekspH = 8.0pH = 9.01 h2 h
      Soluble proteinsCjSz1.11 ± 0.17bc1.10 ± 0.26d1.35 ± 0.36a1.52 ± 0.08ab1.86 ± 0.18a2.04 ± 0.17a2.15 ± 0.18a2.16 ± 0.17a
      CjZy1.01 ± 0.17c1.46 ± 0.28bc1.19 ± 0.19a1.17 ± 0.28b1.81 ± 0.06a1.82 ± 0.31a1.58 ± 0.09c1.77 ± 0.32b
      Cp1.59 ± 0.19a1.88 ± 0.19a1.29 ± 0.32a1.67 ± 0.28a1.62 ± 0.10b1.83 ± 0.18a1.74 ± 0.17bc1.77 ± 0.17b
      Pt1.09 ± 0.07bc1.24 ± 0.17cd1.13 ± 0.19a1.11 ± 0.17b1.13 ± 0.13c1.19 ± 0.26b1.84 ± 0.09b1.93 ± 0.10ab
      Ct1.26 ± 0.02b1.54 ± 0.12b1.21 ± 0.55a1.35 ± 0.51ab1.23 ± 0.15c1.30 ± 0.15b1.28 ± 0.23d1.36 ± 0.17c
      Soluble sugarsCjSz2.78 ± 0.48a3.24 ± 0.40a2.50 ± 0.62a1.87 ± 0.71bc1.77 ± 0.23ab2.08 ± 0.51b1.37 ± 0.20a1.25 ± 0.21b
      CjZy1.52 ± 0.45c1.79 ± 0.10b1.36 ± 0.37b1.62 ± 0.13bc1.42 ± 0.37bc2.32 ± 0.44ab1.29 ± 0.13a1.53 ± 0.23ab
      Cp2.80 ± 0.15a2.83 ± 0.53a1.96 ± 0.30ab2.76 ± 0.92a2.22 ± 0.63a2.77 ± 0.37a1.14 ± 0.41a1.74 ± 0.22a
      Pt2.12 ± 0.49b2.13 ± 0.33b1.86 ± 0.13ab1.26 ± 0.43c0.98 ± 0.16c1.15 ± 0.16c1.23 ± 0.28a1.41 ± 0.32ab
      Ct3.06 ± 0.26a3.16 ± 0.64a2.44 ± 0.93a2.25 ± 0.17ab1.01 ± 0.24c1.18 ± 0.25c1.17 ± 0.33a1.63 ± 0.31a
      Note: Data shown in the table were expressed as ratios relative to the values obtained on control seedling. Different lowercase letters indicate significant differences at p < 0.05.
    • To provide a comprehensive assessment of the tolerance of different rootstocks, we conducted a principal component analysis to calculate various physiological and biochemical parameters. By comparing the comprehensive evaluation values of all citrus rootstocks, we observed that the ranking of tolerance for each rootstock varied with treatment time. The comprehensive evaluation values were determined using a membership function and weight calculation, which allowed us to assess the performance of each rootstock under each different abiotic stress treatment (Table 4).

      Table 4.  Comprehensive evaluation of five genotypes citrus rootstocks under different stresses.

      TreatmentVarietyComprehensive evaluationMembership functionComprehensive evaluation valueOrder
      F1F2F3U1U2U3
      Flooding 6 weeksCjSz2.778−0.1450.1541.0000.3970.6770.7101
      CjZy−0.703−1.6780.9980.1300.0001.0000.2294
      Cp−1.2220.6200.5690.0000.5960.8360.3753
      Pt−0.2702.180−0.1080.2381.0000.5770.5922
      Ct−0.582−0.978−1.6140.1600.1810.0000.1415
      Weights0.4400.3880.172
      Flooding 7 weeksCjSz2.2611.4810.1191.0001.0000.6210.9661
      CjZy0.985−1.1060.8660.7150.0001.0000.5652
      Cp−1.878−0.4640.2690.0750.2480.6980.1745
      Pt−2.2151.047−0.1460.0000.8320.4870.2494
      Ct0.847−0.957−1.1080.6840.0580.0000.4683
      Weights0.6630.2460.091
      Drought 1 weekCjSz−0.4681.5810.3030.2391.0000.5040.5162
      CjZy−1.5450.762−0.9460.0000.7550.0000.2284
      Cp0.003−1.758−0.9430.3430.0000.0010.1785
      Pt2.9640.3490.0501.0000.6310.4010.7811
      Ct−0.954−0.9341.5350.1310.2471.0000.3213
      Weights0.5190.3020.179
      Drought 2 weeksCjSz−0.0051.3861.2510.3861.0001.0000.6722
      CjZy−1.7870.898−1.0240.0000.8640.0000.2874
      Cp0.0050.146−0.1500.3880.6540.3840.4763
      Pt2.826−0.236−0.4921.0000.5470.2340.7471
      Ct−1.039−2.1940.4150.1620.0000.6320.1715
      Weights0.5350.3320.133
      Alkaline pH = 8.0CjSz0.4921.8310.8730.6741.0001.0000.8101
      CjZy2.0560.273−0.9411.0000.5510.0000.7612
      Cp1.059−1.0870.2260.7920.1600.6430.5743
      Pt−2.7490.626−0.5980.0000.6530.1890.2295
      Ct−0.859−1.6430.4400.3930.0000.7610.3014
      Weights0.5820.3230.094
      Alkaline pH = 9.0CjSz0.1781.765−0.9920.6811.0000.0000.6992
      CjZy1.2440.9690.6890.9410.7700.9900.8851
      Cp1.484−1.1540.5901.0000.1560.9320.6763
      Pt−2.6140.1150.7060.0000.5231.0000.3424
      Ct−0.292−1.695−0.9930.5670.0000.0000.2725
      Weights0.4810.3720.148
      Freezing 1 hCjSz−0.1270.6001.8420.3300.6441.0000.5682
      CjZy−1.364−1.396−0.1330.0210.0000.2840.0685
      Cp2.5490.457−0.4471.0000.5980.1700.7011
      Pt−1.4471.702−0.9160.0001.0000.0000.3243
      Ct0.389−1.364−0.3460.4590.0100.2070.2634
      Weights0.4730.3240.203
      Freezing 2 hCjSz1.2790.579−0.0310.9070.6500.4160.7491
      CjZy−1.9461.7080.6030.0001.0000.7140.4434
      Cp0.900−1.4261.2090.8000.0291.0000.5673
      Pt1.6090.661−0.9151.0000.6760.0000.7462
      Ct−1.843−1.521−0.8660.0290.0000.0230.0185
      Weights0.5160.3400.144

      The results showed that CjSz had the highest comprehensive evaluation values during 6 and 7 weeks of flooding (0.710 and 0.966), at pH 8.0 (0.810), and after 2 h of freezing treatment (0.749). On the other hand, Ct exhibited the lowest comprehensive evaluation values during 6 weeks of flooding (0.141), and 2 weeks of drought (0.171), at pH 9.0 (0.272), and after 2 h of freezing treatment (0.018) (Table 4).

    • Among the different graft combinations, the success rate of grafting 'Chunjian' and 'Mingrijian' onto Pt rootstocks wad below 80%, with success rates of 70.67% and 79.33%, respectively (Table 5). The highest survival rates of 100% were observed in 'Buzhihuo' was grafted onto CjSz and 'Dafen' grafted onto Ct. In terms of graft joint thickness (Ta), 'Dafen' grafted onto CjSz had the highest value of 20.13 mm, while 'Mingrijian' grafted onto Pt had the lowest value of 6.65 mm. The stem thickness below the graft joint (Tb) was the highest in 'Mingrijian' grafted onto CjSz (28.62 mm) and the lowest in 'Buzhihuo' grafted onto Pt (11.80 mm). The Ta/Tb ratio, which indicates the relative thickness above the blow the graft joint, was the highest in 'Tarocco' grafted onto CjZy and 'Tarocco' grafted onto Ct (0.82 for both), followed by 'Dafen' and 'Buzhihuo' grafted onto Ct (0.81 and 0.80, respectively). The lowest Ta/Tb ratio was observed in 'Mingrijian' and 'Chunjian' grafted onto Pt (0.52 and 0.58, respectively).

      Table 5.  Survival rate and graft union situation of different graft combinations.

      Graft combinationSurvival rate (%)Diameter of scion (mm)Diameter of rootstock (mm)Ration of scion to rootstock
      RootstockScion
      CjSzChunjian95.6718.81 ± 0.35ab26.52 ± 2.75b0.70 ± 0.03ab
      Buzhihuo100.0018.31 ± 2.34ab23.96 ± 2.49c0.77 ± 0.02a
      Mingrijian91.3317.87 ± 1.95b28.62 ± 2.88a0.63 ± 0.06c
      Dafen90.6720.13 ± 2.52a28.40 ± 3.42ab0.70 ± 0.06ab
      Tarocco95.5020.10 ± 1.68a30.12 ± 2.74a0.67 ± 0.01bc
      CjZyChunjian86.3311.92 ± 0.94b16.00 ± 0.46b0.75 ± 0.05ab
      Buzhihuo95.5012.59 ± 1.87b16.05 ± 1.39b0.78 ± 0.06ab
      Mingrijian81.6711.26 ± 1.28b16.01 ± 1.52b0.71 ± 0.01b
      Dafen95.5014.78 ± 1.99a20.48 ± 2.29a0.74 ± 0.12ab
      Tarocco90.6714.82 ± 2.01a17.66 ± 2.85ab0.82 ± 0.05a
      CtChunjian91.3315.94 ± 1.64ab21.17 ± 1.71a0.75 ± 0.03ab
      Buzhihuo95.6714.77 ± 2.50b18.83 ± 2.51ac0.80 ± 0.12ab
      Mingrijian90.6715.02 ± 2.48b20.91 ± 2.27ab0.72 ± 0.05b
      Dafen100.0016.44 ± 0.81ab21.60 ± 3.82a0.81 ± 0.09a
      Tarocco87.3317.37 ± 1.07a21.28 ± 1.65a0.82 ± 0.03a
      PtChunjian70.678.19 ± 0.49bc14.10 ± 2.02abc0.58 ± 0.05ab
      Buzhihuo95.676.66 ± 0.66c11.80 ± 0.44c0.57 ± 0.07ab
      Mingrijian79.336.65 ± 0.76c12.81 ± 1.13bc0.52 ± 0.06b
      Dafen91.6710.94 ± 0.97a17.01 ± 1.67a0.65 ± 0.07a
      Tarocco91.3310.36 ± 1.84ab16.55 ± 0.68ab0.62 ± 0.18a

      The tree growth was significantly affected by different rootstocks (Table 6). The citrus scions grafted onto CjSz rootstock exhibited strong tree vigor, followed by Ct, CjZy, and Pt (Table 6). The leaf greenness, as indicated by the SPAD value, was the highest in trees with 'Tarocco' grafted onto CjZy (86.46) and 'Buzhihuo' grafted onto CjSz (85.79), while it was lowest for 'Mingrijian', 'Chunjian', and 'Buzhihuo' grafted onto Pt (71.43, 75.63, and 75.70, respectively). Overall, the results suggest that CjSz exhibited good graft compatibility with the test scions.

      Table 6.  The growth situation of different graft combinations.

      Graft combinationScion length (cm)Crown breadthLeaf greenness
      (SPAD)
      RootstockScionLongitudinal (cm)Horizontal (cm)
      CjSzChunjian97.54 ± 9.53b87.83 ± 14.42a89.18 ± 16.32b82.98 ± 0.74abc
      Buzhihuo79.11 ± 10.63d73.67 ± 5.78b78.00 ± 17.04c85.79 ±1.85a
      Mingrijian115.78 ± 8.88a91.33 ± 13.53a110.38 ± 19.01a84.97 ± 0.47a
      Dafen88.11 ± 5.98c97.33 ± 20.63a98.00 ± 18.89ab81.34 ± 0.14c
      Tarocco81.11 ± 12.07cd61.56 ± 11.59c65.56 ± 9.19d84.36 ± 1.55ab
      CjZyChunjian69.67 ± 11.15ab66.99 ± 4.20a66.88 ± 15.99a82.16 ± 2.12b
      Buzhihuo55.89 ± 9.71c52.33 ± 3.71b61.11 ± 3.20ab82.93 ± 0.57b
      Mingrijian69.67 ± 5.93ab58.33 ± 14.25ab71.00 ± 13.91a79.54 ± 3.83c
      Dafen73.56 ± 6.00a72.17 ± 16.54a71.33 ± 18.34a84.93 ± 3.30ab
      Tarocco57.56 ± 10.84bc64.22 ± 11.52a52.67 ± 20.54b86.46 ± 0.80a
      CtChunjian96.11 ± 10.24a77.44 ± 12.30a83.33 ± 14.88ab81.37 ± 1.92ab
      Buzhihuo82.44 ± 15.61b62.56 ± 8.55bc69.22 ± 14.34b81.36 ± 1.68abc
      Mingrijian97.89 ± 9.34a76.89 ± 5.43ab77.67 ± 31.56ab78.81 ± 1.97bcd
      Dafen87.33 ± 5.46ab89.22 ± 1.26a92.67 ± 20.85a83.47 ± 1.70a
      Tarocco73.22 ± 13.77c55.22 ± 12.85c53.33 ± 16.68c83.43 ± 1.28a
      PtChunjian41.18 ± 7.44ab38.09 ± 12.96ab42.13 ± 14.27a75.63 ± 2.67b
      Buzhihuo25.56 ± 3.17c18.89 ± 1.92c15.56 ± 1.50bc75.70 ± 2.04b
      Mingrijian32.11 ± 7.93bc20.78 ± 5.23bc15.11 ± 2.12c71.43 ± 4.99c
      Dafen51.44 ± 4.17a50.56 ± 10.40a48.00 ± 6.66a80.92 ± 4.33a
      Tarocco42.13 ± 16.27ab27.89 ± 10.00bc33.89 ± 15.79ab81.71 ± 0.70a
    • Grafting is widely used in citrus propagation and provides many agronomical advantages to scion[32,33]. Rootstock is vital for the citrus industry as it provides resistance to multiple stresses[3,34]. The rootstocks used in citrus have certain issues with stress resistance, disease resistance, or grafting compatibility[1416], rendering them inflexible to the varying soil environment and climatic conditions, and consequently, cannot be widely used in various cultivars[17]. Therefore, citrus rootstock cultivation and evaluation are critical for the industry's healthy, stable, and sustainable development[27].

      In this study, abiotic stress altered the physiological, metabolic, and molecular processes[17,35]. Almost all rootstock leaf photosynthetic pigments (Chl a, Chl b, total Chl, and carotenoid) were decreased under abiotic stress treatments (Table 1), creating an imbalance in the photosynthetic machinery[36]. Under stress conditions, MDA, soluble protein, soluble sugar contents, and antioxidant enzyme activities were in an unbalanced equilibrium state[23, 24,37]. Alkaline stress inhibits plant growth far more than salt stress[38]. CjZy is widely used as an alkaline-tolerant citrus rootstock in calcareous soil areas in China[5]. Under alkaline stress, CjSz performed similarly to CjZy. Low temperatures cause the leaves to wilt and dehydrate, reducing the photosynthesis rate[39]. The disruption of photosynthetic mechanisms causes excessive production of ROS, leading to oxidative stress, one of the most damaging consequences of freezing stress. Pt has shown the highest resistance to cold stress[4042]. CjSz and Pt undergo similar physiological and biochemical changes, indicating that CjSz is also highly resistant to freezing. Flooding is a seasonal stress factor affecting Chinese citrus production areas[2]. Under flooding stress, the MDA content in Ct was the highest, and that in Pt was the lowest. Comprehensive analysis revealed that Cp is the most flood-resistant genotype, correlating with previous research findings[43]. CjSz had reasonable flooding resistance. Cp has been considered drought-resistant citrus rootstocks owing to its higher chlorophyll content and POD activity under drought stress than CjSz. CjSz had less MDA content than Cp but more soluble sugar and soluble protein content. The comprehensive evaluation revealed that CjSz's drought tolerance was second only to Pt and superior to other rootstocks.

      Rootstocks significantly affect tree performance in multiple aspects[9]. Several studies have indicated that rootstocks have a significant effect on shoot growth[3,18]. In this study, the effects of rootstocks on the horticultural performance of scion varieties were investigated. Rootstock genotypes influence compatibility[9]. In our study, the graft success rate of CjSz with five citrus cultivars ranged from 91.33% to 100%. Scions on CjSz developed faster than those on Pt, suggests that graft compatibility is related to the genetic relationship between scion and rootstock. The supply of root-derived nutrients, such as water and minerals, to the shoots may be limited due to incompatibility, leading to poor shoot growth and leaf function[44]. Scions on Pt exhibited a much smaller canopy size and lower SPAD value than those on other rootstocks, consistent with the findings in three late-ripening navel oranges[45] and Folha Murcha sweet oranges[46]. These results suggest that Pt can be used for dense planting and that two genotypes of C. junos are preferable for sparse planting, consistent with previous findings[45]. Therefore, scion-rootstock compatibility based on graft success and tree vigor supports that 'Shuzhen No.1' has a high potential for usage as a citrus rootstock.

    • The authors confirm contribution to the paper as follows: conceptualization and supervision: Wang X; methodology: He W; investigation: Chai J, Wang Y, Wu Z, Li M, Lin Y, Luo Y, Yong Zhang, Yunting Zhang, Wang H; bioinformatic analyses: He W, Chai J; data curation: He W, Xie R, Chai J; manuscript preparation: He W; writing—review and editing: He W, Tang H, Wang X. All authors reviewed the results and approved the final version of the manuscript.

    • Data sharing not applicable to this article as no datasets were generated or analyzed during the current study.

      • This work was financially supported by Sichuan Provincial Postdoctoral Science Foundation, Sichuan Science and Technology Program (2020ZHCG0027), and Shuangzhi Project Innovation Team of Sichuan Agricultural University (Grant No. P202107).

      • The authors declare that they have no conflict of interest.

      • # Authors contributed equally: Wen He, Rui Xie

      • Copyright: © 2024 by the author(s). Published by Maximum Academic Press, Fayetteville, GA. This article is an open access article distributed under Creative Commons Attribution License (CC BY 4.0), visit https://creativecommons.org/licenses/by/4.0/.
    Figure (2)  Table (6) References (46)
  • About this article
    Cite this article
    He W, Xie R, Chai J, Wang H, Wang Y, et al. 2024. Comprehensive evaluation of abiotic stress tolerance and graft compatibility of Citrus junos cv. 'Shuzhen No.1'. Fruit Research 4: e006 doi: 10.48130/frures-0023-0042
    He W, Xie R, Chai J, Wang H, Wang Y, et al. 2024. Comprehensive evaluation of abiotic stress tolerance and graft compatibility of Citrus junos cv. 'Shuzhen No.1'. Fruit Research 4: e006 doi: 10.48130/frures-0023-0042

Catalog

  • About this article

/

DownLoad:  Full-Size Img  PowerPoint
Return
Return