


-
Xanthoceras sorbifolium Bunge is a small deciduous tree or shrub of the Xanthoceras genus in the Sapindaceae family. This species is a woody oil tree unique to China and produces excellent raw material for manufacturing biodiesel[1]. In addition, this plant is used to produce high-grade edible oil[2]. The oil content of the seed kernel is high (45.54%−56.26%), and it is rich in unsaturated fatty acids, which has high nutritional value and is beneficial to human health[3]. X. sorbifolia Bunge is rich in phytosterols, tocopherols, fatty acids, and rare organic acids involved in nervous system development[4]. Consequently, X. sorbifolia Bunge oil has extremely high nutritional value and health benefits. The use of this species in various fields has significantly increased the demand for X. sorbifolia Bunge oil. Moreover, this species is an excellent biomass energy source, ornamental tree species, and barren hill greening tree species. Therefore, it is widely cultivated in over ten provinces and cities, such as Inner Mongolia, Shanxi, and Hebei[5]. The cultivation area of X. sorbifolia has increased from 1.33 × 10⁵ to 2.6 × 10⁵ ha due to its significant economic value[6−8]. However, the monoculture of X. sorbifolium Bunge is adopted without any rotation due to the increasing scarcity of land and the impacts of agricultural industrialization. This practice is prevalent in China, resulting in poor growth after years of continuous planting.
Continuous planting of crops often leads to the occurrence of replanting diseases. Furthermore, repeated monoculture leads to reduced plant strength, low yield, poor fruit quality, increased risks of pests and diseases, and death of the trees[9]. Wang et al.[10] observed that the Fusarium pathogen caused apple replanting disease in the Bohai Bay area of China. Allelopathic autotoxic substances such as amygdalin and benzoic acid are observed in the soil of aged peach orchards and significantly inhibit the growth of replanted plants[11]. Qin et al.[12] reported that amygdalin, an allelotoxic substance in old cherry orchard soil, significantly inhibits the growth of replanted plants. These findings indicate that the production of allelopathic substances, changes in the soil's physicochemical properties, an imbalance in soil nutrients, and changes in the soil microbial community structure increase the risk of diseases and poor plant growth characteristics[13]. Notably, the replanting challenges are not caused by a change in a single factor but by an interaction between soil, environmental, and plant-related factors[14−16]. Soil microorganisms are involved in soil nutrient transformation and soil structure stability, affecting plant growth[17]. Multiple factors cause a decrease in yield and increased risk of diseases in continuously cropped X. sorbifolium Bunge. Notably, replanting challenges in some crops are caused by changes in the soil microbial community, with changes in the soil fungal community structure as the primary factor[18]. The total bacterial abundance decreased under continuous monoculture tobacco, and the soil bacterial community structure changed significantly[19]. Continuous cropping of cucumber increases soil Fusarium abundance and the occurrence of cucumber Fusarium wilt, affecting cucumber production globally[17]. Konjac soft rot caused by Pectinobacillus causes significant losses to Konjac farming annually due to the continuous cultivation of this crop. This bacteria is the main challenge in the Konjac industry worldwide[20]. Li et al. observed that the continuous cropping of peanuts markedly reduced the crop quality and yield. A previous study demonstrated that the accumulation of fungal pathogens in the soil increases the occurrence of continuous cropping diseases in peanuts at the expense of plant-beneficial fungi[21].
Increased occurrence of diseases and pests in continuous monoculture farming[22] has prompted the development of various strategies, such as chemical treatments, crop variety selection, and biological control methods, to increase crop yields and minimize continuous cropping challenges[23−26]. Examples include using beneficial microorganisms for biological control and the application of Rhizobia and arbuscular mycorrhizal fungi (AMF) to mitigate replanting diseases in various crops and enhance crop yield[27]. Bacillus cereus WL08 effectively breaks down the autotoxic substances of pinellia, significantly improving the photosynthesis, growth, yield, and quality of the plant[28]. Ceratobasidum stevensi effectively increases the watermelon growth rate, enhances the activity of key defense enzymes, modulates the soil microbiome, and alleviates watermelon repeated cropping challenges[29]. However, the failure to effectively prevent continuous cropping challenges is mainly due to a lack of understanding of the underlying mechanisms. X. sorbifolium Bunge is an important oil woody crop. However, only a few studies have explored the challenges associated with the replanting of X. sorbifolium Bunge.
In this study, the effects of continuous planting of X. sorbifolium Bunge on soil physicochemical properties and soil microbial community structure in different areas was examined. The purpose of this study is to analyze the relative abundance and structure of soil microbial community after continuous planting of X. sorbifolia Bunge in high-throughput sequencing, with a single planting site as the control, and to further explore the mechanism of yield reduction caused by continuous cropping obstacles of X. sorbifolium.
-
The experimental materials were collected from Xilao Village (36°99' N, 118°28'E), Fenghuang Town, Linzi District, Zibo City, Shandong Province (China), the altitude is 69 m; Hengdi Village, Changyi City, Weifang City (36°99' N, 119°39' E), the altitude is 55 m; and Meiyu Village, Huiqu Town, Anqiu City, Weifang City (36°27' N, 119°01' E), the altitude is 23 m, during the cropping season in 2022. Red Xanthoceras sorbifolium varieties were used for the experiments.
Experimental design and treatments
-
Anqiu, Weifang (AQ), Linzi, Zibo (LZ), and Changyi, Weifang (CY) were selected as the study sites. Twenty-year-old Red X. sorbifolium orchards continuously planted Red X. sorbifolium seedlings were used as the cropping samples (AQCK, LZCK, and CYCK). The land adjacent to the old orchards, without Red X. sorbifolium seedlings was used as the control group (AQ, LZ, and CY). The continuous cropping and control treatments were compared separately for each region. Healthy 3–4-leaves seedlings exhibiting consistent growth and no pests or diseases were transplanted in mid-April, with 20 replicates per treatment used for each study site[30]. The roots of the seedlings were washed before planting to minimize the presence of microorganisms in the roots.
Three plants were randomly selected for each treatment to represent three biological replicates. Topsoil within 30 cm of the trunk was removed by digging 0–5 cm deep, lightly attached to roots removed, tightly attached soil collected with a sterile bristle brush, and filtered out of the soil impurities with a 2 mm screen. Subsequently, the soil samples were divided into three portions[30]. Two portions of the samples were stored at 4 °C and −80 °C. Using fresh samples stored at −80°C for soil DNA extraction, high throughput sequencing. The third portion was air-dried to determine soil physicochemical properties and evaluation of soil-related indicators. The plant tissue samples were stored under low-temperature conditions in liquid nitrogen during the study to ensure the tissue activity was effectively preserved.
Measurement index
Biomass determination
-
Sampling was conducted in May, June, and July. During sampling, the plant height and stem diameter of the plants were measured using a tape measure and a Vernier caliper, respectively.
Determination of root activity
-
The 2,3,5-triphenyltetrazolium chloride (TTC) method was used to evaluate the seedling root activity. The procedure for assessment of root activity was adopted from a study by Liu et al.[31].
Assessment of soil physicochemical properties
-
Soil organic matter was evaluated using the organic potassium dichromate volumetric method. The contents of ammonium nitrogen and nitrate nitrogen (NH4+-N and NO3–-N) were assessed using the CaCl2 extraction flow injection analyzer method. The level of available phosphorus (P2O5) was determined by the molybdenum–antimony resistance colorimetric method. The amount of available potassium (K2O) was evaluated with flame spectrophotometry. Soil physicochemical properties were evaluated following methods described by Bao[32].
Soil microbial community structure analysis
-
Total DNA was extracted from each soil sample using the E.Z.N.A. Soil DNA Kit (Omega Bio-tek Inc., Norcross, GA, USA) according to the manufacturer's protocols. The quality of soil DNA extraction was detected by 1% agarose gel electrophoresis, and the samples were sent to Majorbio Bio-pharma Technology Co., Ltd. (Shanghai, China) for testing. High-throughput sequencing was performed to explore soil fungi and bacteria structure and abundance. Amplification was performed using universal primers 338F/806R and ITS1F/ITS2R for bacteria and fungi. Soil microbial community structure analysis was conducted following methods described by Bennett et al. and Wang et al.[33,34].
Statistical analysis
-
All data were expressed as the mean ± standard deviation of three replicates. Microsoft Excel was used for data processing. Graphs were generated using GraphPad Prism 8.0 (San Diego, CA 92108, USA). Statistical analysis was conducted using SPSS 26.0 software. T-test or one-way ANOVA was used to explore differences between the groups. p < 0.05 indicated statistically significant differences between groups.
-
The results showed that the biomass of X. sorbifolium Bunge was significantly lower in seedlings planted in soils from areas under repeated cropping compared to those grown in soil under regular cropping (Fig. 1). The plant height and stem diameter of the seedlings planted in July, August, and September in the AQ region were significantly inhibited by continuous cropping compared to the control group.
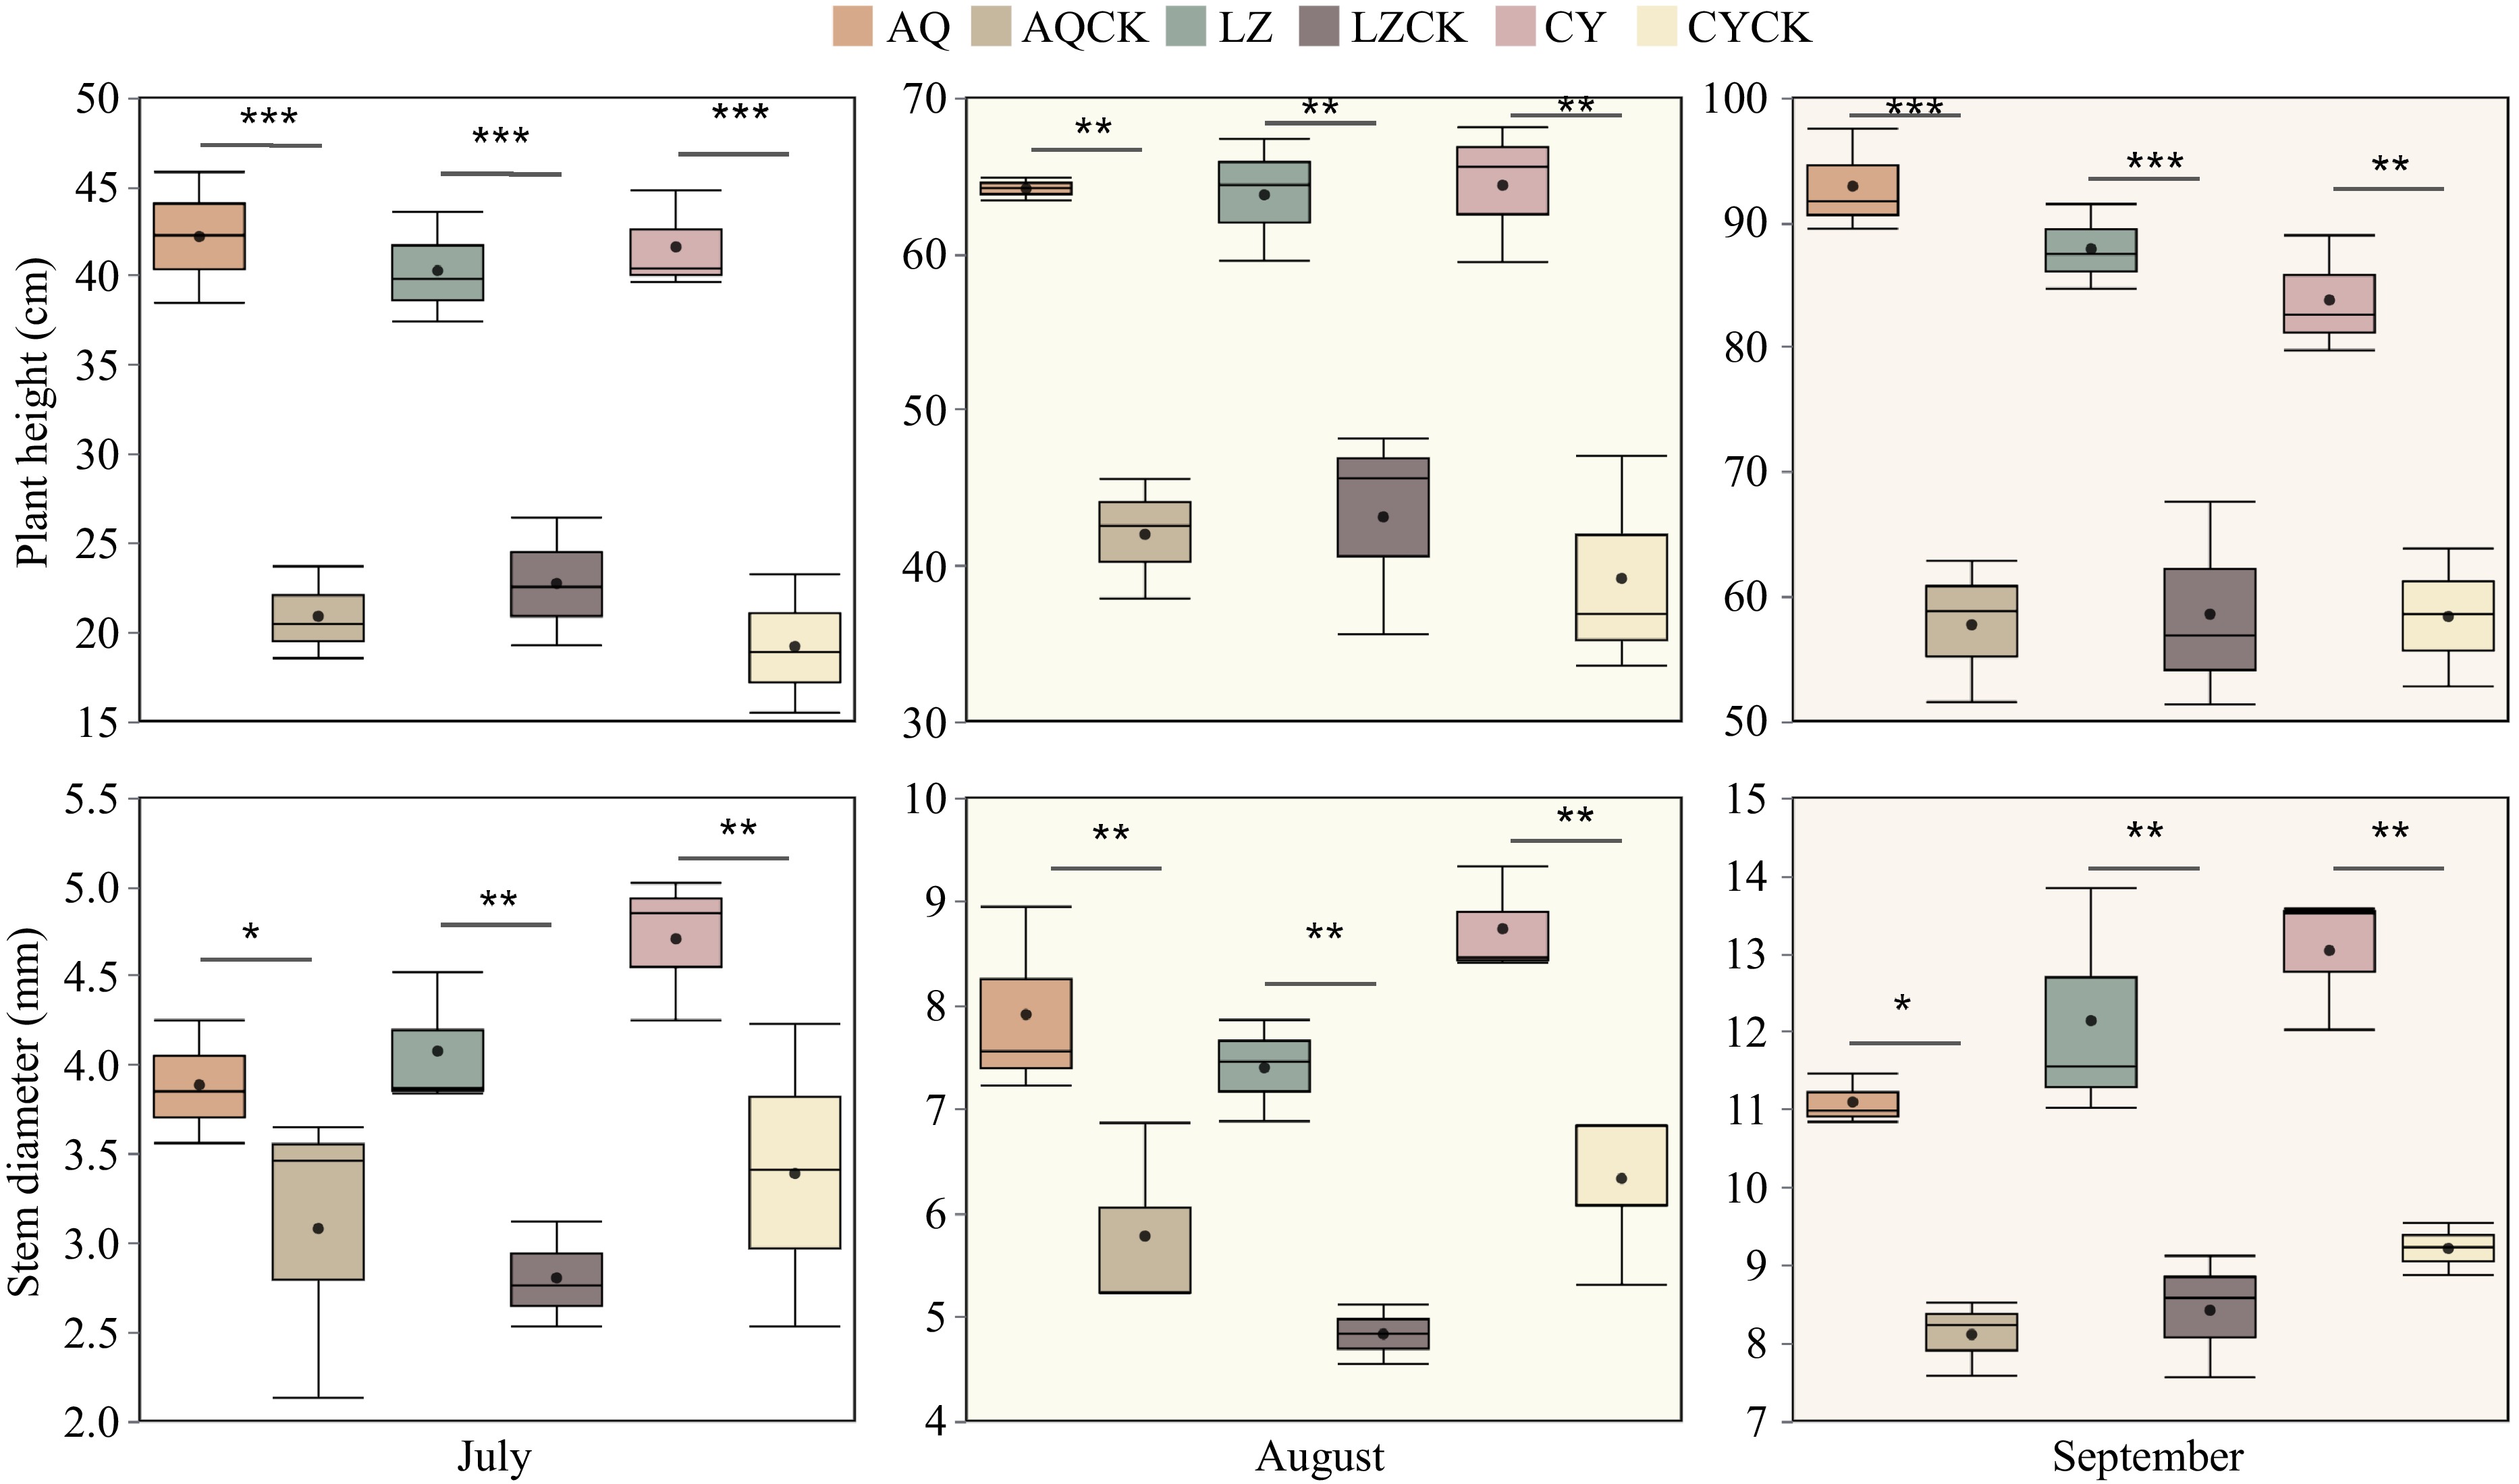
Figure 1.
Effects of continuous cropping on seedling biomass of X. sorbifolium Bunge planted in different regions. A t-test was used to determine the significant differences between the two treatment groups. Data in the box plots are expressed as mean ± SE. AQ: Untreated soil in Anqiu; AQCK: Continuous planting of X. sorbifolium Bunge in Anqiu; LZ: Untreated soil in Linzi; LZCK: Continuous planting of X. sorbifolium Bunge in Linzi; CY: Untreated soil in Changyi; CYCK: Continuous planting of X. sorbifolium Bunge in Changyi. Significant differences are presented as follows: * 0.01 ≤ p < 0.05, ** 0.001 < p ≤0.01, and *** p ≤ 0.001.
Effects of root activity of X. sorbifolia Bunge in different areas
-
The results demonstrated that the root activity of the X. sorbifolium Bunge planted in continuous cropping soil was significantly lower compared to plants planted in regular cropping soil (Table 1). The AQ, LZ, and CY soils exhibited significantly higher root activity than the continuous cropping soil. The root activity of seedlings planted in the regular soil was significantly different compared to that of seedlings planted in continuous cropping soil in the CY region. The root activity of the seedlings planted in continuous cropping soil in the CY region decreased by 57.8% compared to the seedlings in the regular soil.
Table 1. Root activity of crown fruit in different regions.
AQ
(μgTTF·g−1·h−1)LZ
(μgTTF·g−1·h−1)CY
(μgTTF·g−1·h−1)T1 13.46 ± 0.68** 14.59 ± 1.68* 15.73 ± 0.50*** CK 7.40 ± 0.54 7.21 ± 0.83 6.64 ± 0.50 A t-test was used to determine the significant differences between the two treatment groups. Data in the table are expressed as mean ± SE. T1 represents untreated soil; CK denotes continuous planting of X. sorbifolium Bunge. Significant differences are presented as follows: * 0.01 ≤ p < 0.05, ** 0.001 < p ≤ 0.01, and *** p ≤ 0.001. Effects of continuous cultivation of X. sorbifolium Bunge on soil physicochemical properties in different regions
-
Analysis of the soil physicochemical properties in the three regions showed that continuous cropping of X. sorbifolium Bunge significantly reduced the available potassium content in the soil (Table 2). Notably, the available potassium levels in the CY area showing the most significant decline, with a 49.82% decrease compared to the regular soil. The three regions exhibited a reduction in available phosphorus content, with the most significant decrease observed in the AQ area at 43.63%. Notably, the difference in the amount of available phosphorus between the two treatment groups in the CY area was not significant. The contents of nitrate nitrogen and ammonium nitrogen decreased significantly in the three regions. Continuous cropping of X. sorbifolium Bunge significantly decreased the soil nitrogen content compared to the regular soil. The soil organic matter content decreased significantly after years of X. sorbifolium Bunge planting. The most significant decrease in soil organic matter content was observed under continuous cropping in the LZ area, with a 27.54% decrease compared to the regular soil.
Table 2. Soil physicochemical properties in different areas.
Treatment Organic matter
(g·kg−1)Nitrate nitrogen
(mg·kg−1)Ammonium nitrogen
(mg·kg−1)Available phosphorus
(mg·kg−1)Available potassium
(mg·kg−1)AQ 10.58 ± 0.20* 1.23 ± 0.00** 0.09 ± 0.00** 1.13 ± 0.06*** 16.79 ± 0.11*** AQCK 9.47 ± 0.19 0.23 ± 0.01 0.06 ± 0.00 0.75 ± 0.01 14.56 ± 0.56 LZ 11.62 ± 0.20*** 0.32 ± 0.01*** 0.10 ± 0.00** 0.10 ± 0.01** 15.13 ± 0.09** LZCK 8.42 ± 0.37 0.14 ± 0.00 0.08 ± 0.00 0.86 ± 0.01 13.54 ± 0.17 CY 10.59 ± 0.19** 0.27 ± 0.01** 0.09 ± 0.01*** 1.24 ± 0.03* 12.81 ± 0.03*** CYCK 9.34 ± 0.07 0.17 ± 0.01 0.08 ± 0.01 1.06 ± 0.03 8.50 ± 0.20 A t-test was used to determine the significant differences between the two treatment methods. Data in the table are expressed as mean ± SE. AQ: Untreated soil in Anqiu; AQCK: continuous planting of X. sorbifolium Bunge in Anqiu; LZ: Untreated soil in Linzi; LZCK: Continuous planting of X. sorbifolium Bunge in Linzi; CY: Untreated soil in Changyi; CYCK: Continuous planting of X. sorbifolium Bunge in Changyi. Significant differences are denoted as follows: * 0.01 ≤ p < 0.05, ** 0.001 < p ≤ 0.01, and *** p ≤ 0.001. Effects of continuous cropping of X. sorbifolia Bunge planted in different areas on soil enzyme activities
-
The soil enzyme activities significantly differed between the regular soil and continuous cropping soil in the three regions. AQ, LZ, and CY soils exhibited a significant decrease in urease activity under continuous cropping compared to the regular soil (Fig. 2a–c). The urease activity under the continuous cropping treatment in the CY region was significantly (29.20%) lower compared to the regular cropping soil. Soil sucrase activity was significantly lower under the continuous cropping treatment in the three regions, with 18.24%, 22.55%, and 31.03% decreases compared to the regular cropping soil (Fig. 2d–f). The phosphatase activity was significantly lower under the continuous cropping treatment compared to the regular soil. The continuously cropped X. sorbifolium Bunge induced the most significant decrease in soil phosphatase activity in the CY area, with a 32.73% decrease relative to the regular soil (Fig. 2g–i). Catalase activity decreased after the continuous cropping of X. sorbifolium Bunge compared to the regular soil treatment (Fig. 2j–l).
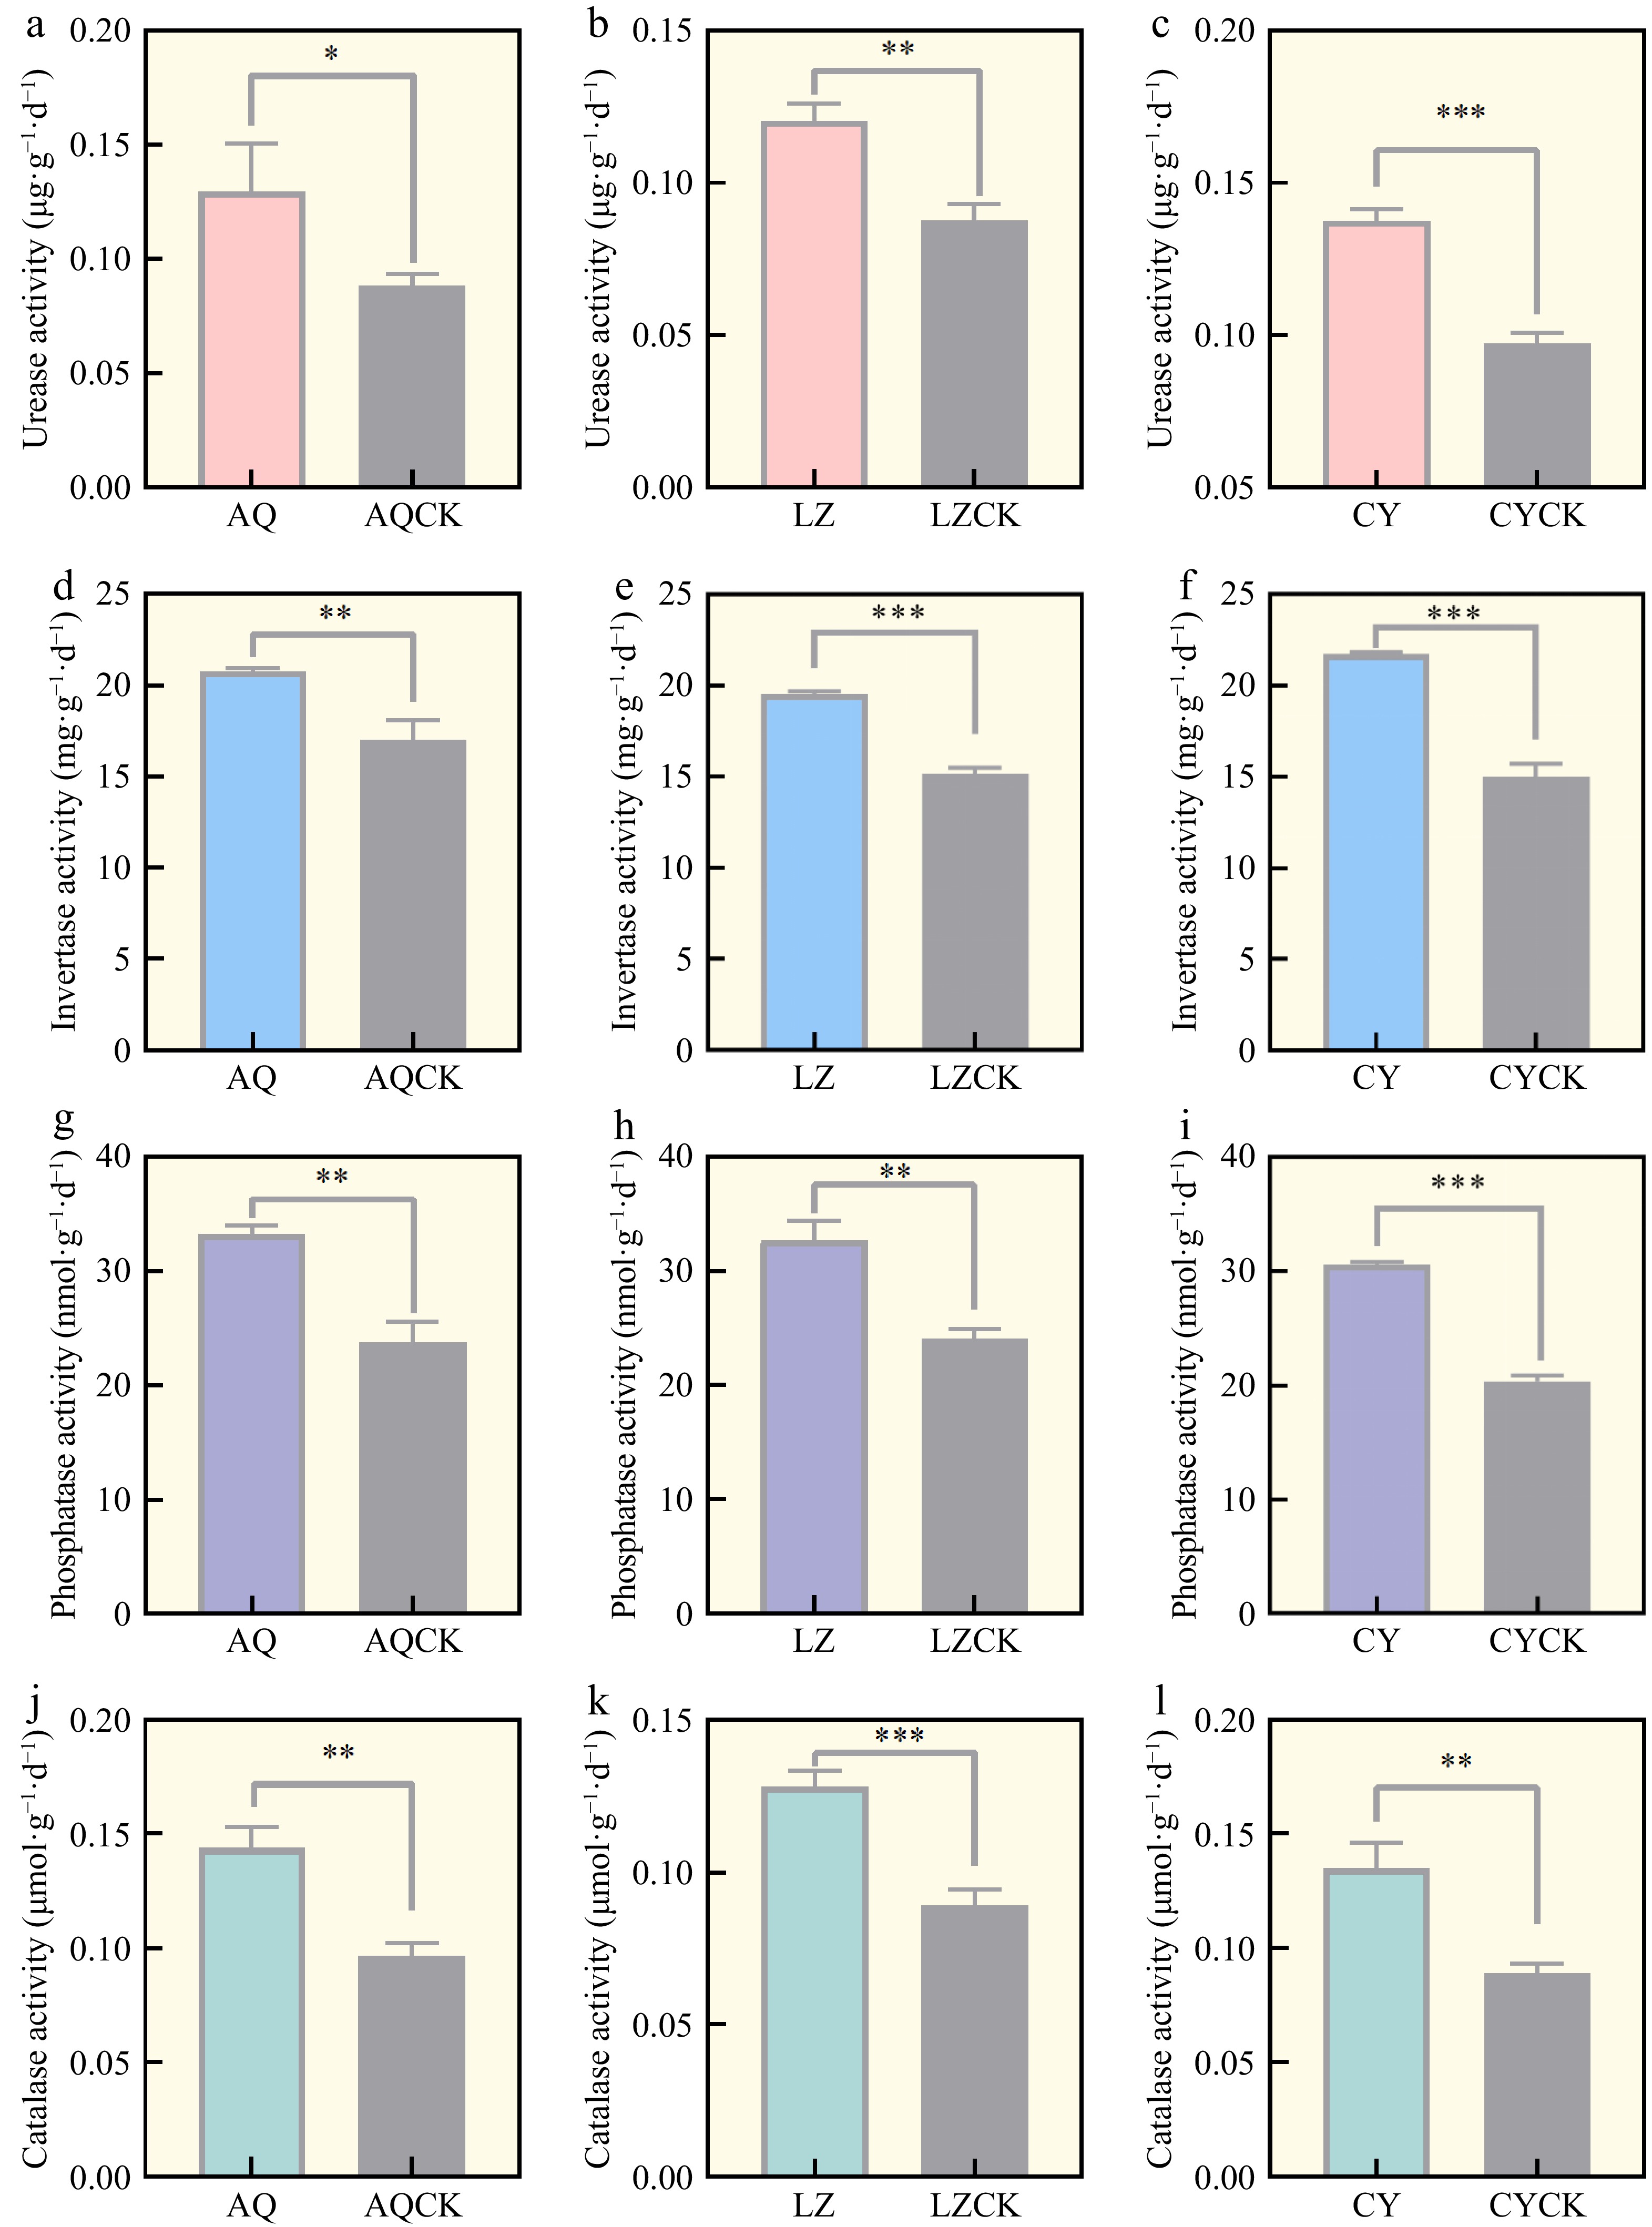
Figure 2.
Soil enzyme activities in different regions. AQ: Untreated soil in Linzi; AQCK: Continuous planting of X. sorbifolium Bunge in Linzi; LZ: Untreated soil in Cangyi; LZCK: Continuous planting of X. sorbifolium Bunge in Cangyi; CY: Untreated soil in Anqiu; CYCK: Continuous planting of X. sorbifolium Bunge in Anqiu. T-test analysis was conducted to determine the significant differences between the two treatment methods. Data are expressed as mean ± SE. Significant differences are represented as follows: * 0.01 ≤ p < 0.05, ** 0.001 < p ≤ 0.01, and *** p ≤ 0.001.
Effects of continuous cropping of X. sorbifolia Bunge planted in different regions on soil microbial community structure
Effects of continuous cropping of X. sorbifolia Bunge on soil bacterial community structure and abundance in the AQ area
-
The compositions of bacterial genera with relative abundances greater than 0.5% were evaluated (Fig. 3a, d). Continuous cropping of X. sorbifolium Bunge in the AQ area significantly affected the horizontal relative abundance of soil bacteria. The average relative abundance of Bacillus, Streptomyces, and Blastococcus in the soil decreased significantly, whereas the relative abundance of Gaiella, Rubrobacter, and Arthrobacter increased significantly after continuous cropping of X. sorbifolium. The average relative abundance of Aeromicrobium (p < 0.05) and Lysobacter (p < 0.05) in the AQCK group significantly increased compared to the AQ treatment (Fig. 3e). The average relative abundance of Chujaibacter (p < 0.001) decreased significantly after continuous cropping of X. sorbifolium Bunge. The abundance of Bacillus (p < 0.05), Streptomyces (p < 0.05), Rubrobacter (p < 0.05), and Amycolatopsis (p < 0.05) also decreased significantly in the AQCK group relative to the AQ treatment.
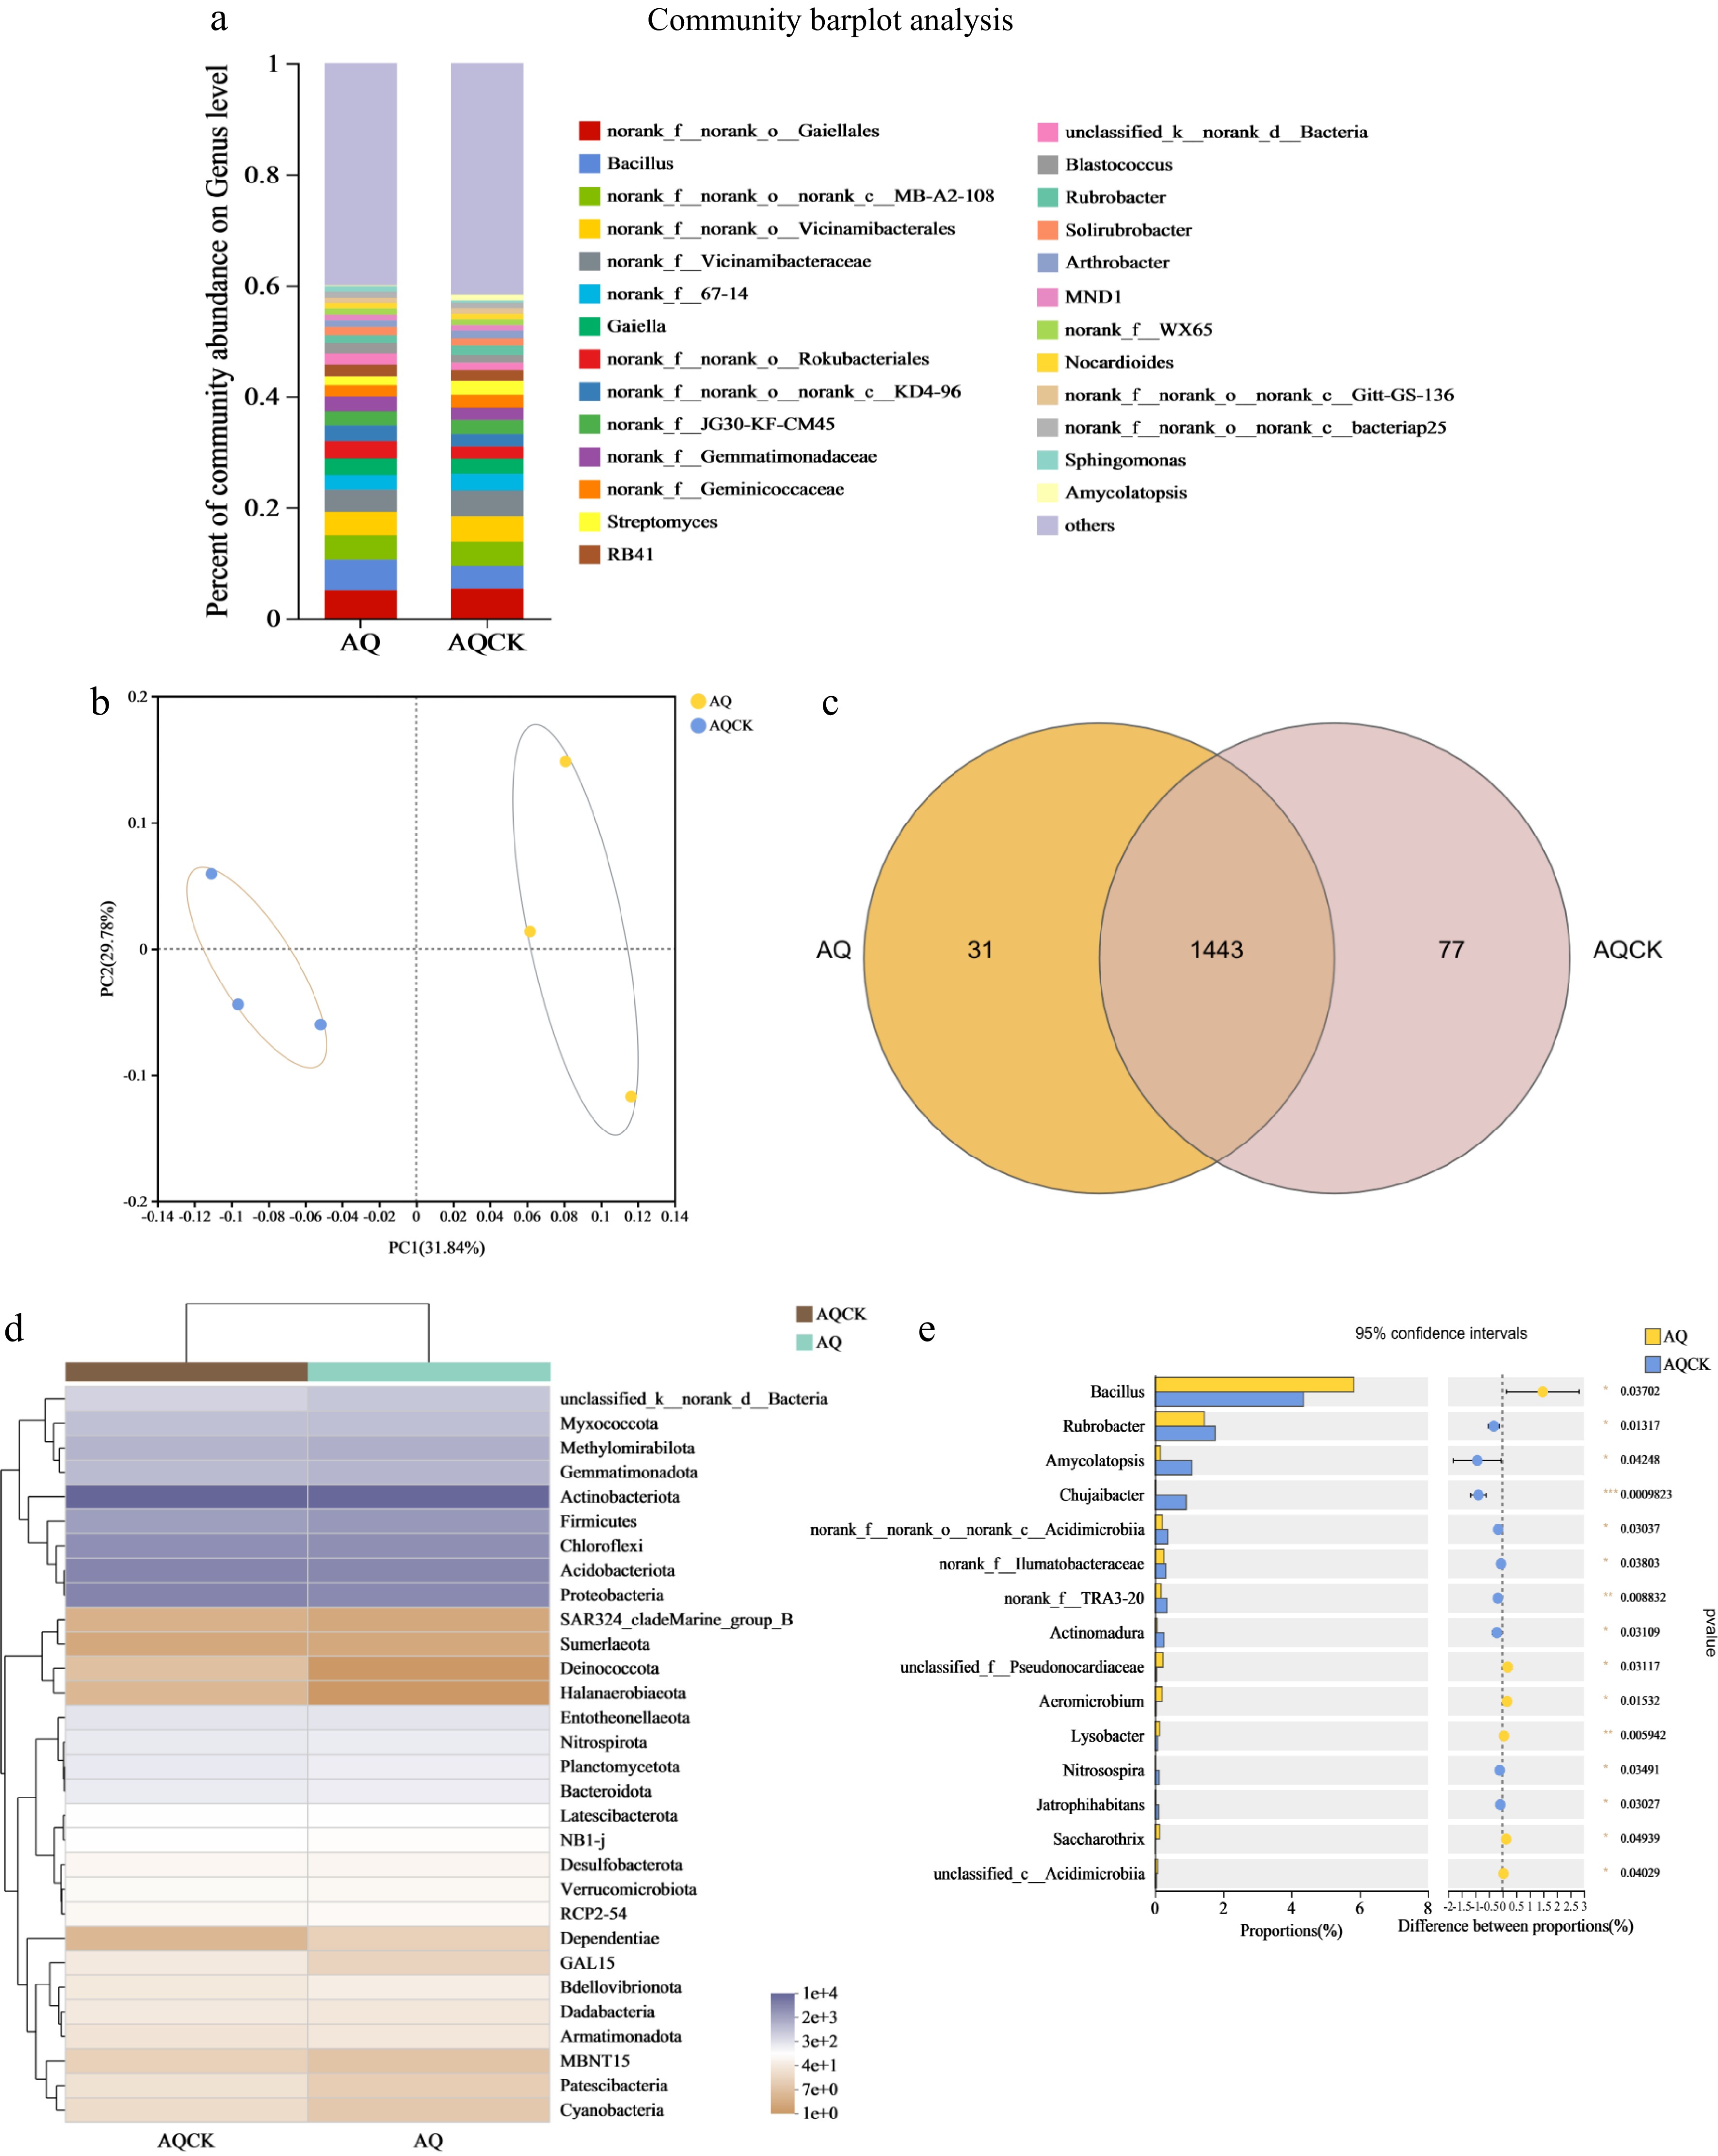
Figure 3.
Effects of continuous cropping of X. sorbifolium Bunge on soil bacterial community structure in the AQ area. (a) Horizontal abundance analysis of bacterial genera; (b) PCoA plot showing the distribution of bacteria genera; (c) Venn diagram showing the distribution of bacterial species; (d) A heat map showing the bacterial community composition; (e) Bacterial community differences at the genus level between the treatment groups. AQ: Untreated soil in Anqiu; AQCK: Continuous planting of X. sorbifolium Bunge in Anqiu.
Venn diagram analysis (Fig. 3c) of soil microorganisms showed that the number of soil bacterial OTU species changed after continuous planting of crown fruit. The results showed 31 endemic species in the regular soil and 77 unique bacterial species were observed under the continuous cropping treatment. The soil bacterial OTU profile markedly changed after continuous cropping.
PCoA of the soil bacteria (Fig. 2b) showed that the continuous cropping soil treatment formed a distinct cluster away from the AQCK treatment, exhibiting different quadrants. These findings indicate that the continuous cropping treatment significantly changed the diversity of the soil bacterial community compared to the control treatment. The PC1 and PC2 values were 31.84% and 29.78%, explaining 61.62% of the bacterial diversity differences.
Effects of X. sorbifolia Bunge on the soil fungi community structure and abundance in the AQ region
-
The continuous planting of X. sorbifolium Bunge in the AQ region significantly affected the soil fungal community (Fig. 4a–e). Aspergillus genus exhibited the highest abundance in the AQ region, followed by Solicoccozyma, Chaetomium, Mortierella, and Penicillium (Fig. 4a). The abundances of Aspergillus, Fusarium, Penicillium, and Neocosmospora were significantly higher in the continuous cropping soil compared to the regular soil. Conversely, the relative abundances of Mortierella, Kernia, Solicoccozyma, and Coniochaeta were higher in the AQCK treatment than in the AQ treatment. The results demonstrated that the average relative abundance of some soil fungi genus decreased significantly after continuous cropping, whereas the average relative abundance of Mortierella increased significantly (p < 0.05; Fig. 4e). The relative abundances of Coniochaeta (p < 0.05) and Trichoderma (p < 0.05) were significantly higher in the AQCK treatment relative to the AQ treatment. At the phylum level, the relative abundance of Ascomycota, Monoblepharomycota, and Glomeromycota decreased significantly after continuous cropping relative to the regular soil treatment (Fig. 4d).
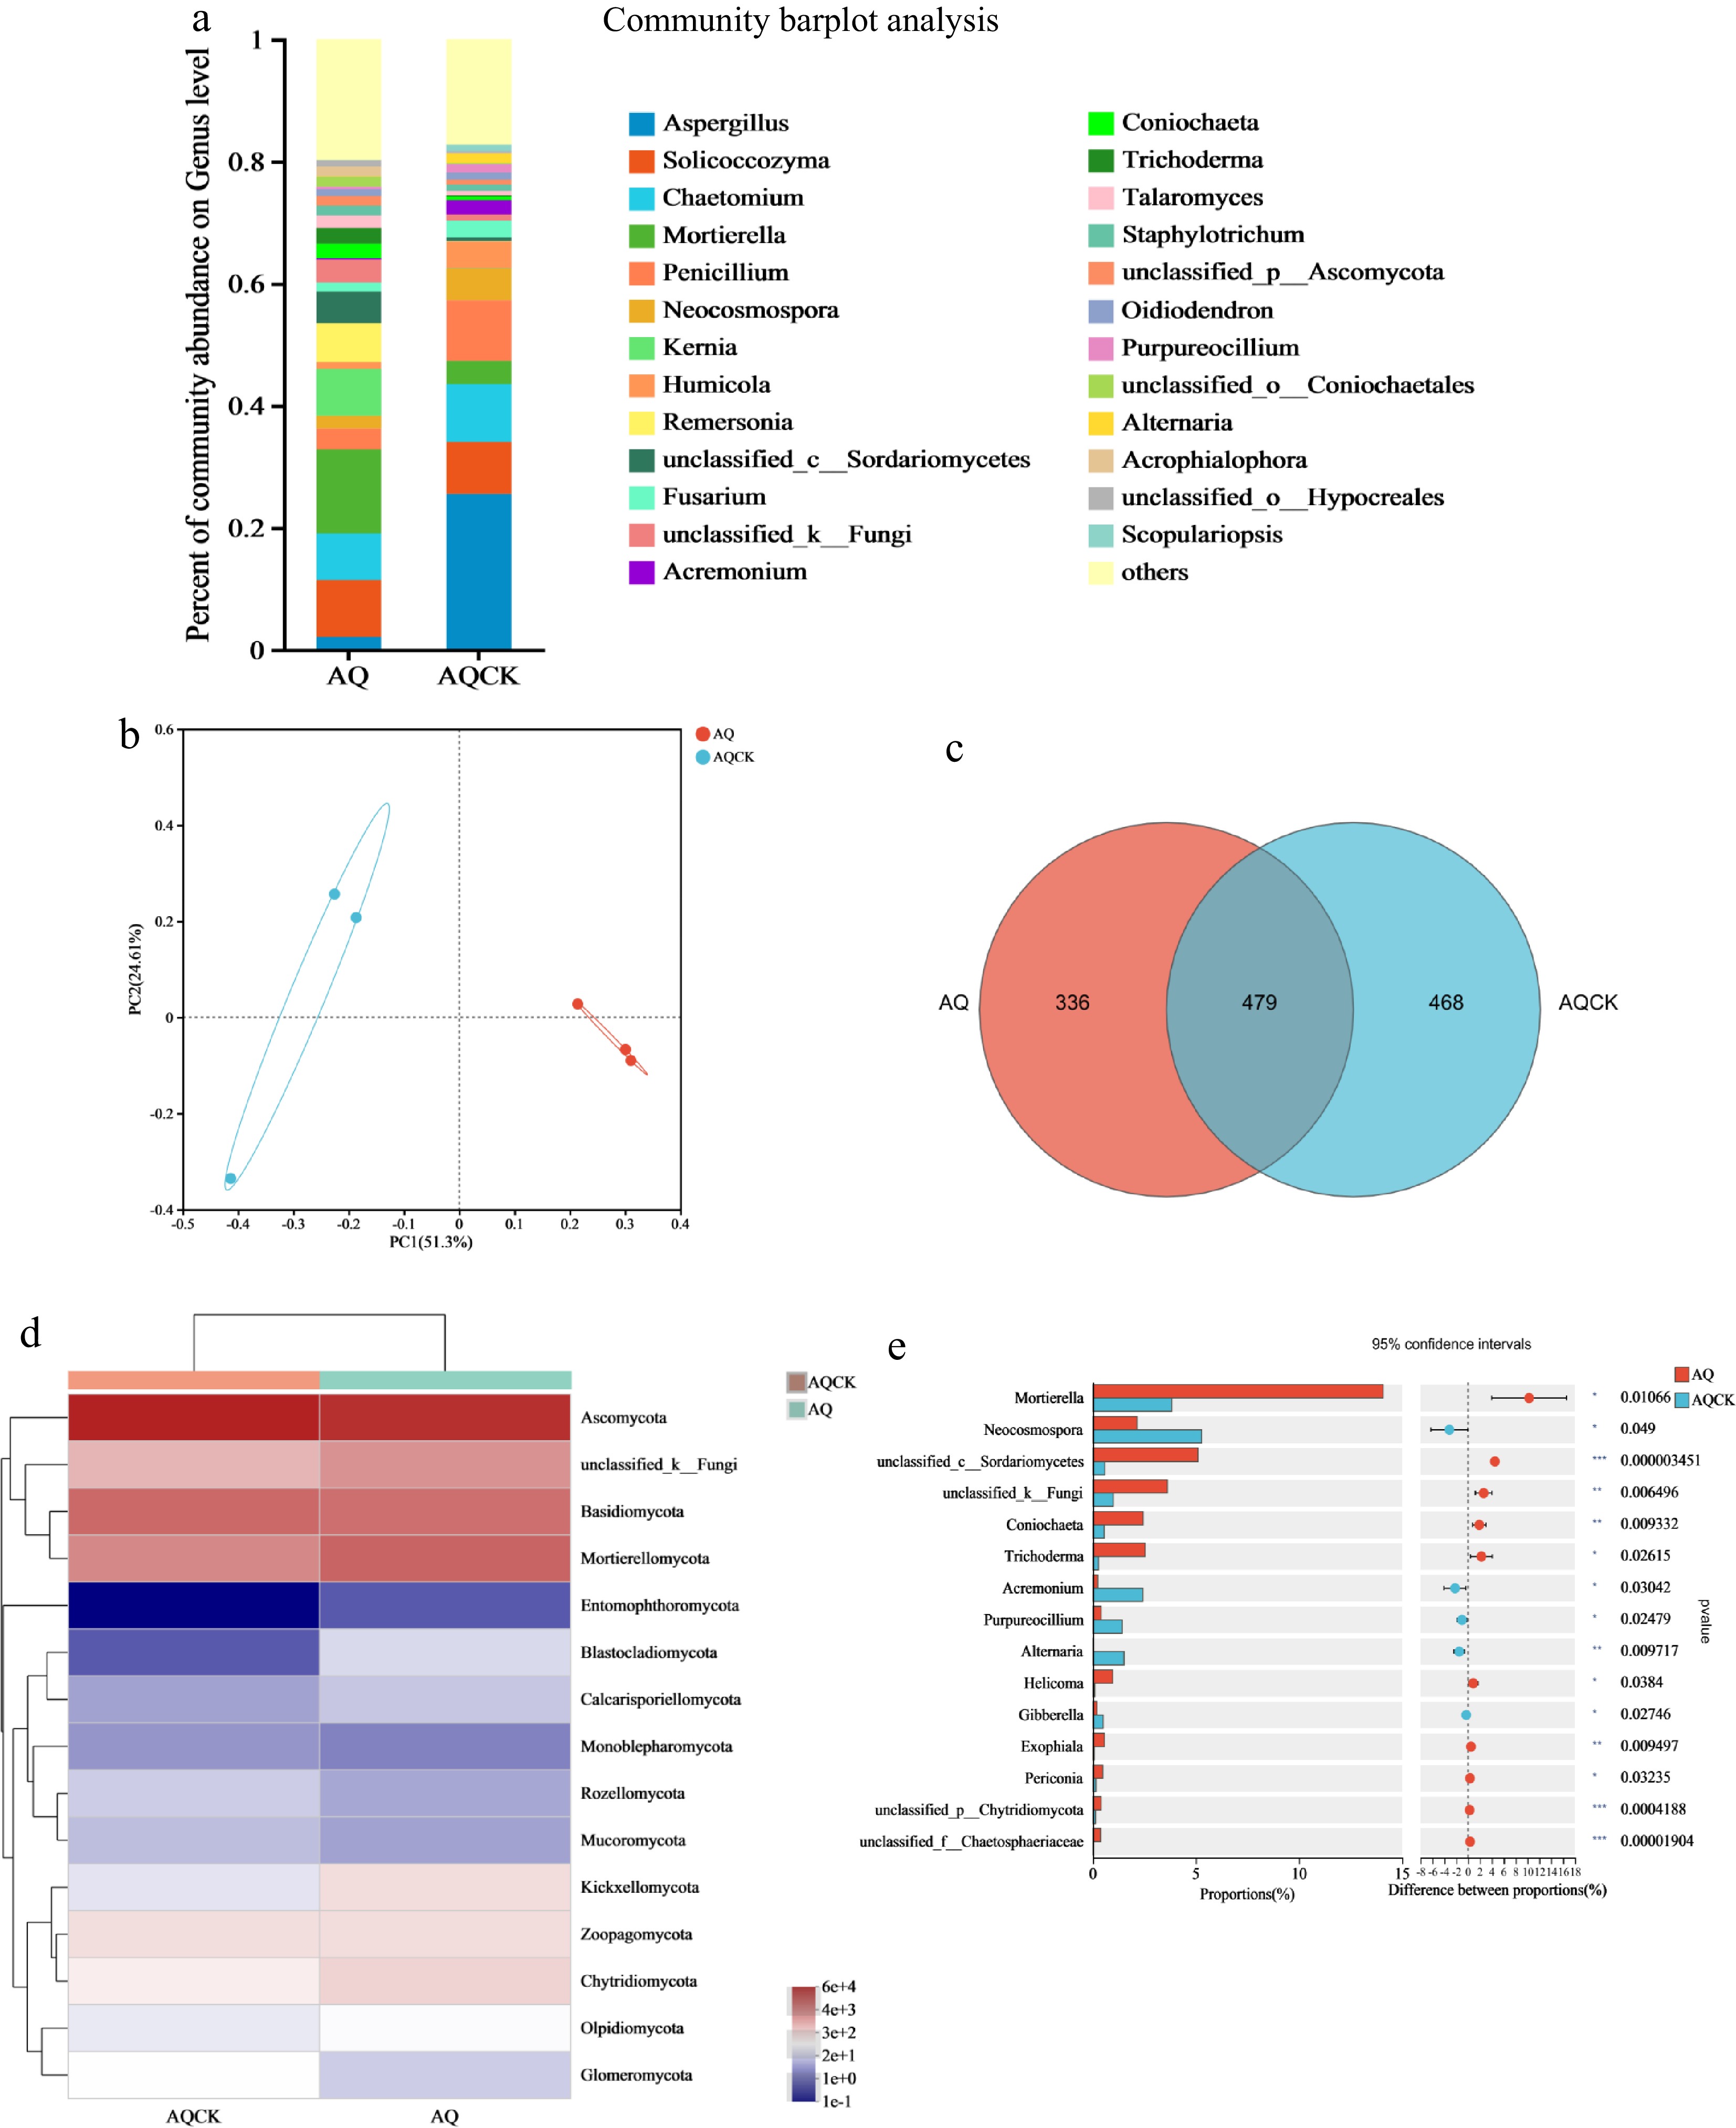
Figure 4.
Effects of continuous cropping of X. sorbifolium Bunge on soil fungal community structure in the AQ area. (a) Horizontal abundance of fungi at the genus level; (b) PCoA plot illustrating fungi distribution under the two treatments; (c) Venn diagram showing the distribution of fungal OTU species; (d) A heat map showing fungal community composition; (e) Differences in the fungal horizontal community between the two treatment groups. AQ: Untreated soil in Anqiu; AQCK: Continuous planting of X. sorbifolium Bunge in Anqiu.
A Venn diagram based on the abundance of soil microorganisms showed that the number of OTU species of soil fungi was significantly affected after continuous planting of X. sorbifolium Bunge (Fig. 4c). The results revealed 336 endemic species in the regular soil and 468 species of unique fungi species in the AQCK treatment. Notably, 28.21% more endemic fungi were observed under the continuous cropping treatment relative to the AQ treatment.
PCoA showed that the fungi under the continuous cropping soil treatment clustered distantly from the regular soil treatment and in different quadrants (Fig. 4b). This finding indicates that the continuous cropping soil treatment significantly changed the structure and composition of the soil fungal community compared with the control treatment. The values of PC1 and PC2 were 51.30% and 24.61%, explaining 75.91% of the fungal diversity difference between the groups.
Effects of continuous cropping of X. sorbifolia Bunge on soil bacterial community structure and abundance in the LZ area
-
Continuous cropping of X. sorbifolium Bunge significantly changed the community structure and abundance of soil bacteria and microorganisms in LZ. At the genus level, Bacillus, Gaiella, and Streptomyces were the dominant genera with significantly higher relative abundance under the continuous cropping soil treatment compared to the regular soil. The abundance of Norank_f_geminicoccaceae and Solirubrobacter was lower in the LZ treatment than in the LZCK treatment (Fig. 5a). Further analysis showed that the abundance of Gaiella (p < 0.05) and MnD1 (p < 0.05) were significantly higher in the continuous cropping soil than in the regular soil (Fig. 5e). In addition, the relative abundances of Blastococcus (p < 0.001), Sphingomonas (p < 0.01), and Solirubirobacter were significantly higher in the continuous cropping soil than in the regular soil. At the phylum-level analysis, the relative abundances of Fibrobacterota, Sumerlaeota, and Patescibacteria in the LZCK treatment were significantly lower compared to the LZ treatment (Fig. 5d). Conversely, the relative abundances of Dependentiae, Methylomirabilota, and Acidobacteriota were significantly higher in the regular cropping soil relative to the LZCK treatment (Fig. 5d).
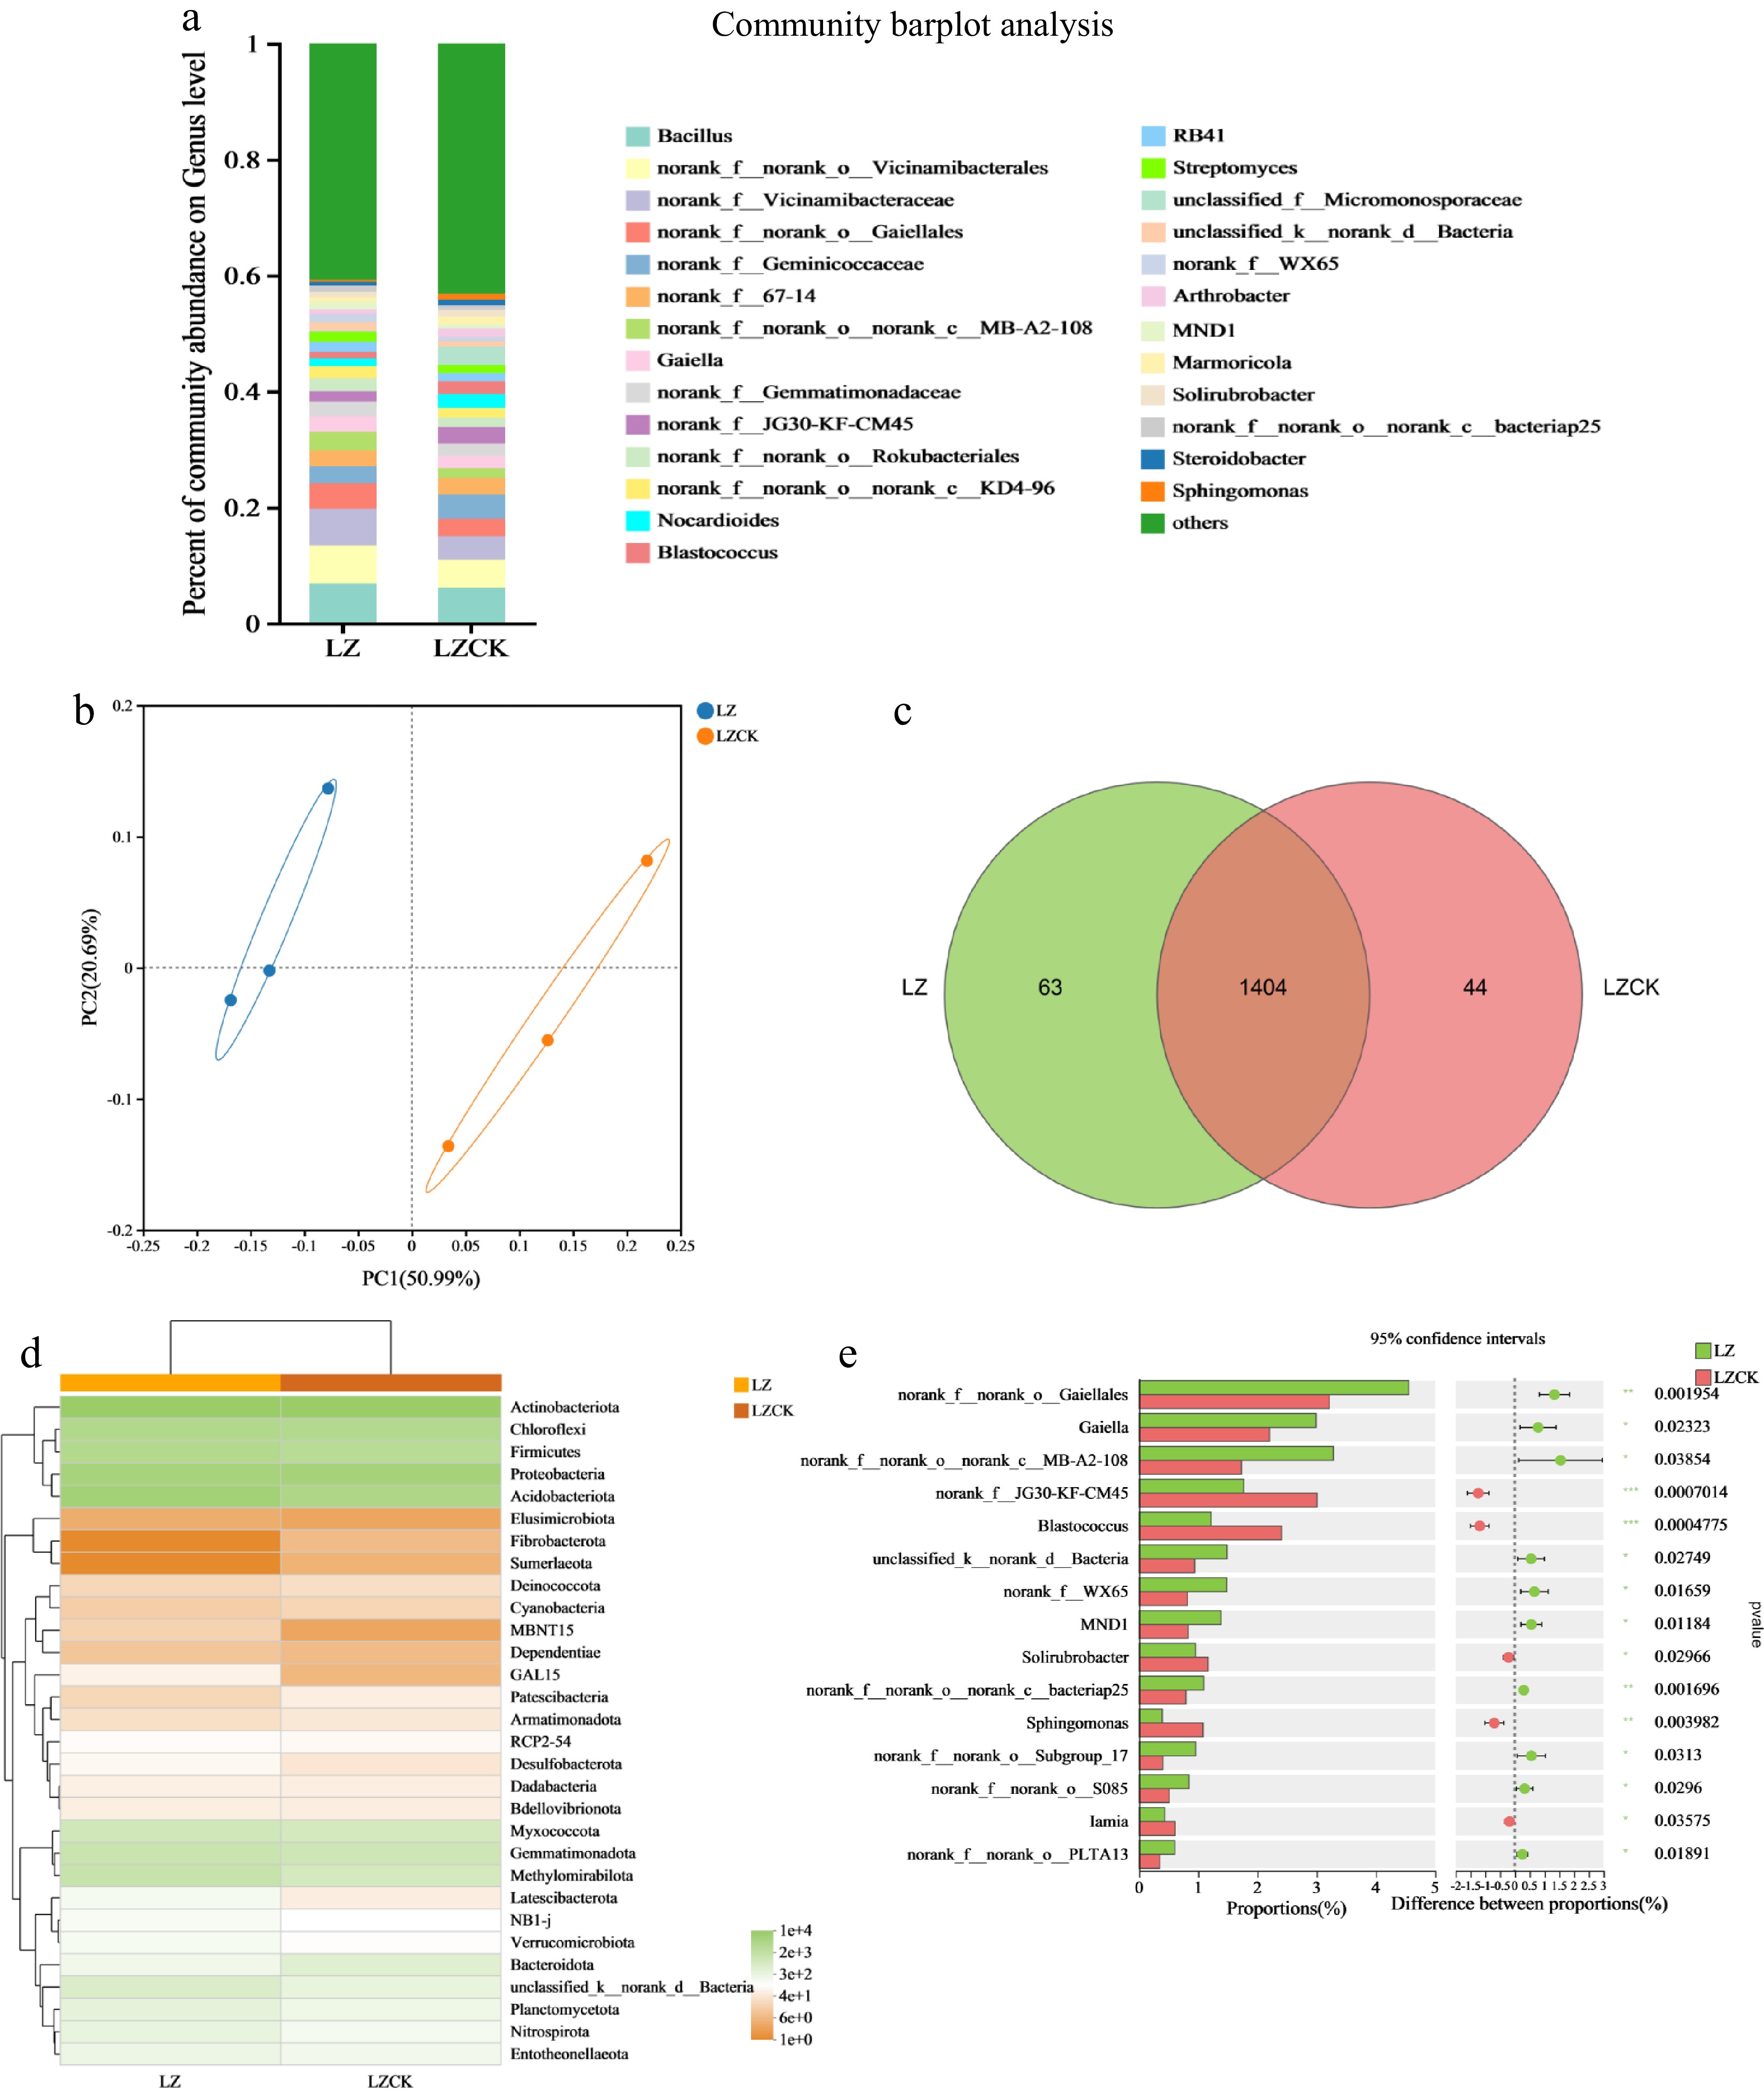
Figure 5.
Effect of continuous cropping of X. sorbifolium Bunge on soil bacterial community structure in the LZ area. (a) Horizontal abundance of bacterial genera; (b) Bacterial PCoA illustrating the distribution of bacteria genera under the two treatments; (c) Venn diagram analysis showing differences in bacterial species under the two treatments; (d) A heat map showing bacterial community composition under the two treatments; (e) Community differences at the bacterial genus level between the two groups. LZ: Untreated soil in Linzi; LZCK: Continuous planting of X. sorbifolium Bunge in Linzi.
Venn diagram analysis revealed that the continuous cropping of X. sorbifolium significantly changed the soil fungal OTU species, with the endemic bacteria increasing by 30.16% under the continuous cropping soil relative to the control treatment in the LZ region (Fig. 5c).
PCoA demonstrated a significant distance between the soil bacteria under the regular soil treatment and the continuous cropping treatment, with bacteria under the two treatments clustering in different quadrants (Fig. 5b). These findings indicate that the continuous cropping treatment significantly changed the diversity of the soil bacteria community compared to the regular soil treatment. The value for PC1 was 50.99%, whereas the PC2 value was 20.69%, explaining 71.68% of the bacterial diversity difference.
Effects of X. sorbifolia Bunge on the community structure and abundance of soil fungi in the LZ region
-
The soil fungal microbial community structure in the fungus LZ region changed significantly after long-term continuous cropping of X. sorbifolium Bunge. Chaetomium, Neocosmospora, Mortierella, Humicola, and Penicillium were the most abundant fungi genera in the soil samples from LZ (Fig. 6a). At the genus level, the relative abundance of Neocosmopora, Humicola, Penicillium, and Pyrenochaetopsis was significantly higher in the continuous cropping soil than in the LZ treatment. The relative abundance of Mortierella and Solicoccozyma was significantly higher in the regular cropping soil than in the LZCK (Fig. 6a). T-test analysis showed that the relative abundance of Mortierella (p < 0.05) and Acremonium (p < 0.01) was significantly higher in the regular cropping soil than in the LZCK treatment. Conversely, the relative abundance of Neocosmopora (p < 0.01), Humicola (p < 0.05), and Penicillium (p < 0.05) was lower in the regular cropping soil compared to the LZCK treatment. At the phylum level, the relative abundances of Ascomycota, Basidiomycota, and Chytridiomycota were significantly higher under the LZCK treatment than in the LZ treatment (Fig. 6d).
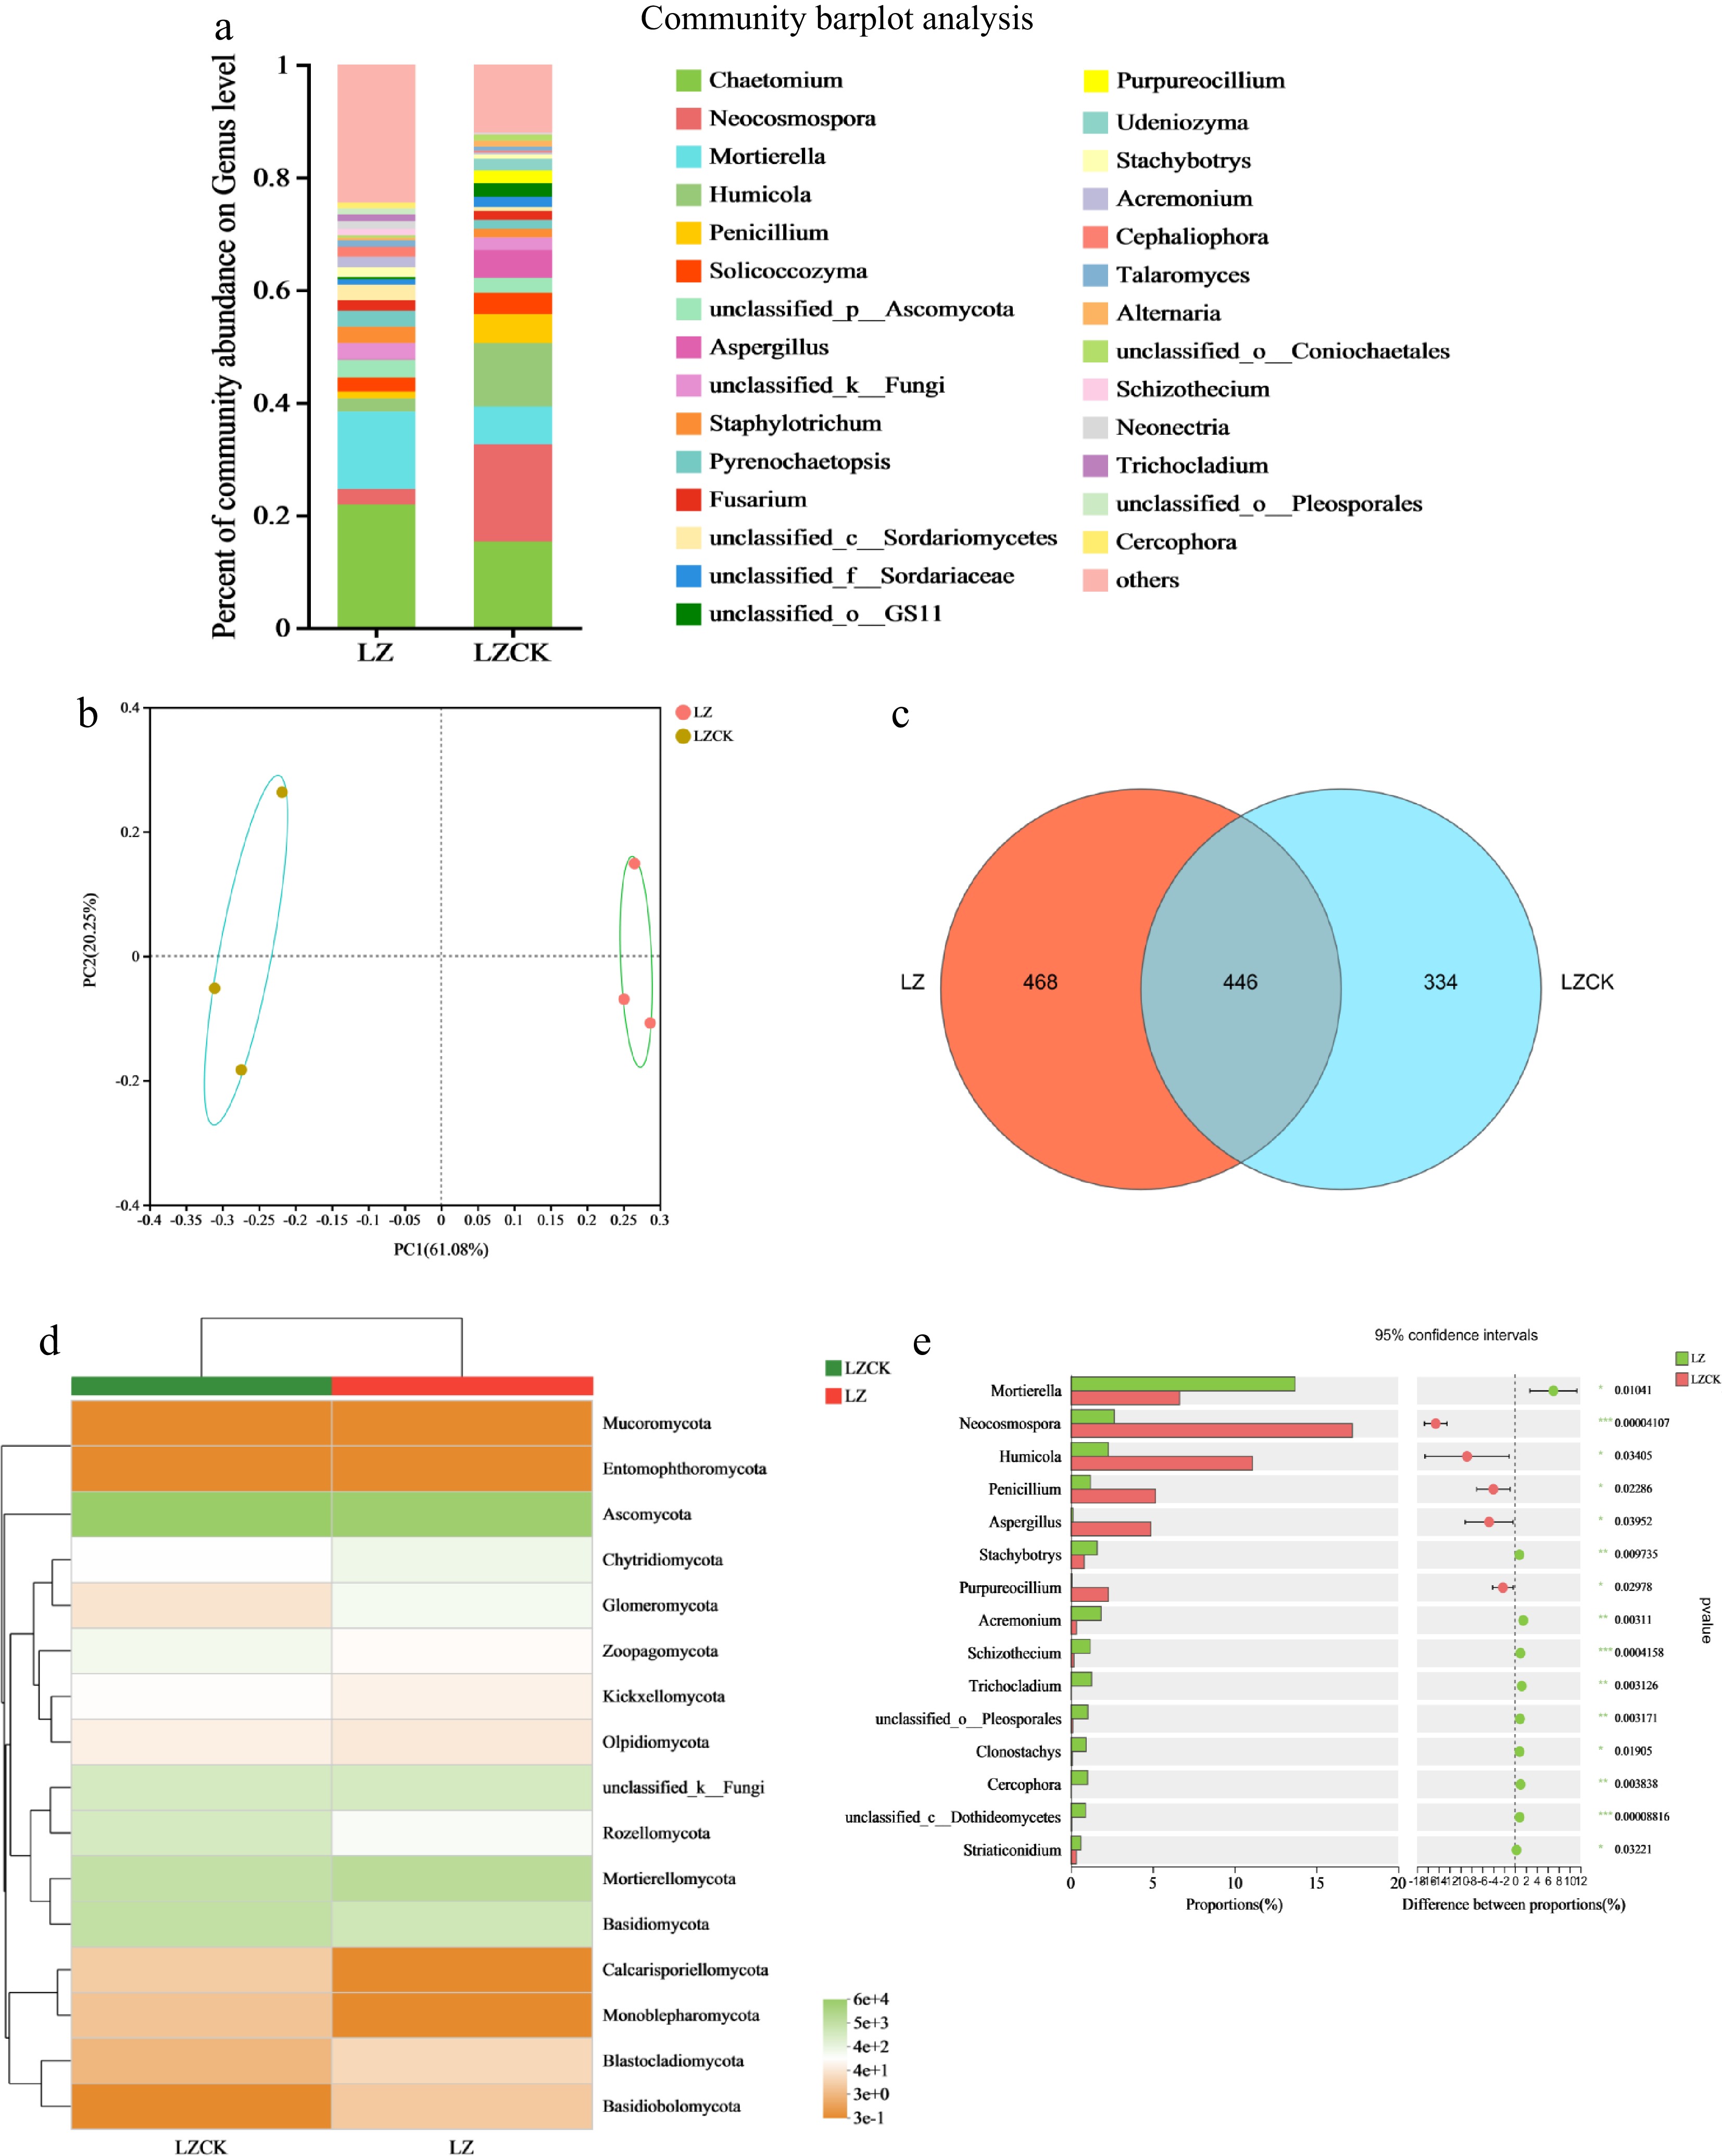
Figure 6.
Effects of continuous cropping of X. sorbifolium Bunge on soil fungal community structure in the LZ area. (a) Horizontal abundance of fungi at the genus level; (b) PCoA showing fungal distribution; (c) Venn diagram analysis of fungal OTU species; (d) A heat map showing fungal community composition under the two treatments; (e) Differences in fungal horizontal community between two treatment groups. LZ: Untreated soil in Linzi; LZCK: Continuous planting of X. sorbifolium Bunge in Linzi.
Venn diagram analysis showed that the continuous cropping of X. sorbifolium Bunge significantly influenced the number of soil fungal species in the LZ region. The relative abundance of fungal species increased by 28.63% in the continuous cropping soil compared with the regular soil. PCoA of the soil fungi revealed that the LZ treatment clustered distantly from the LZCK treatment and in different quadrants (Fig. 6b). These results indicate that the LZCK treatment significantly changed the diversity of the soil fungi community compared with the LZ treatment. The values of PC1 and PC2 were 61.08% and 20.25%, explaining 81.33% of the fungal diversity differences.
Effects of continuous cropping of X. sorbifolia Bunge on soil bacterial community structure and abundance in the CY area
-
At the genus level, the bacterial community structure and abundance exhibited significant differences between the regular cropping soil and continuous cropping soil in the CY region. The relative abundance of Bacillus, Sporomonas, and Streptomyces was significantly higher in the CY treatment compared to the CYCK treatment. Notably, Bacillus, Sporomonas, and Streptomyces were the most dominant genera in the CY area. The t-test results showed that the relative abundance of Bacillus (p < 0.05), Streptomyces (p < 0.01), and _TK10 (p < 0.01) was significantly higher under the CY treatment than in the CYCK treatment. At the phylum level, the relative abundance of Armatimonadota increased, whereas Deferrisomatota abundance decreased in the CYCK treatment relative to the regular cropping soil (Fig. 7d).
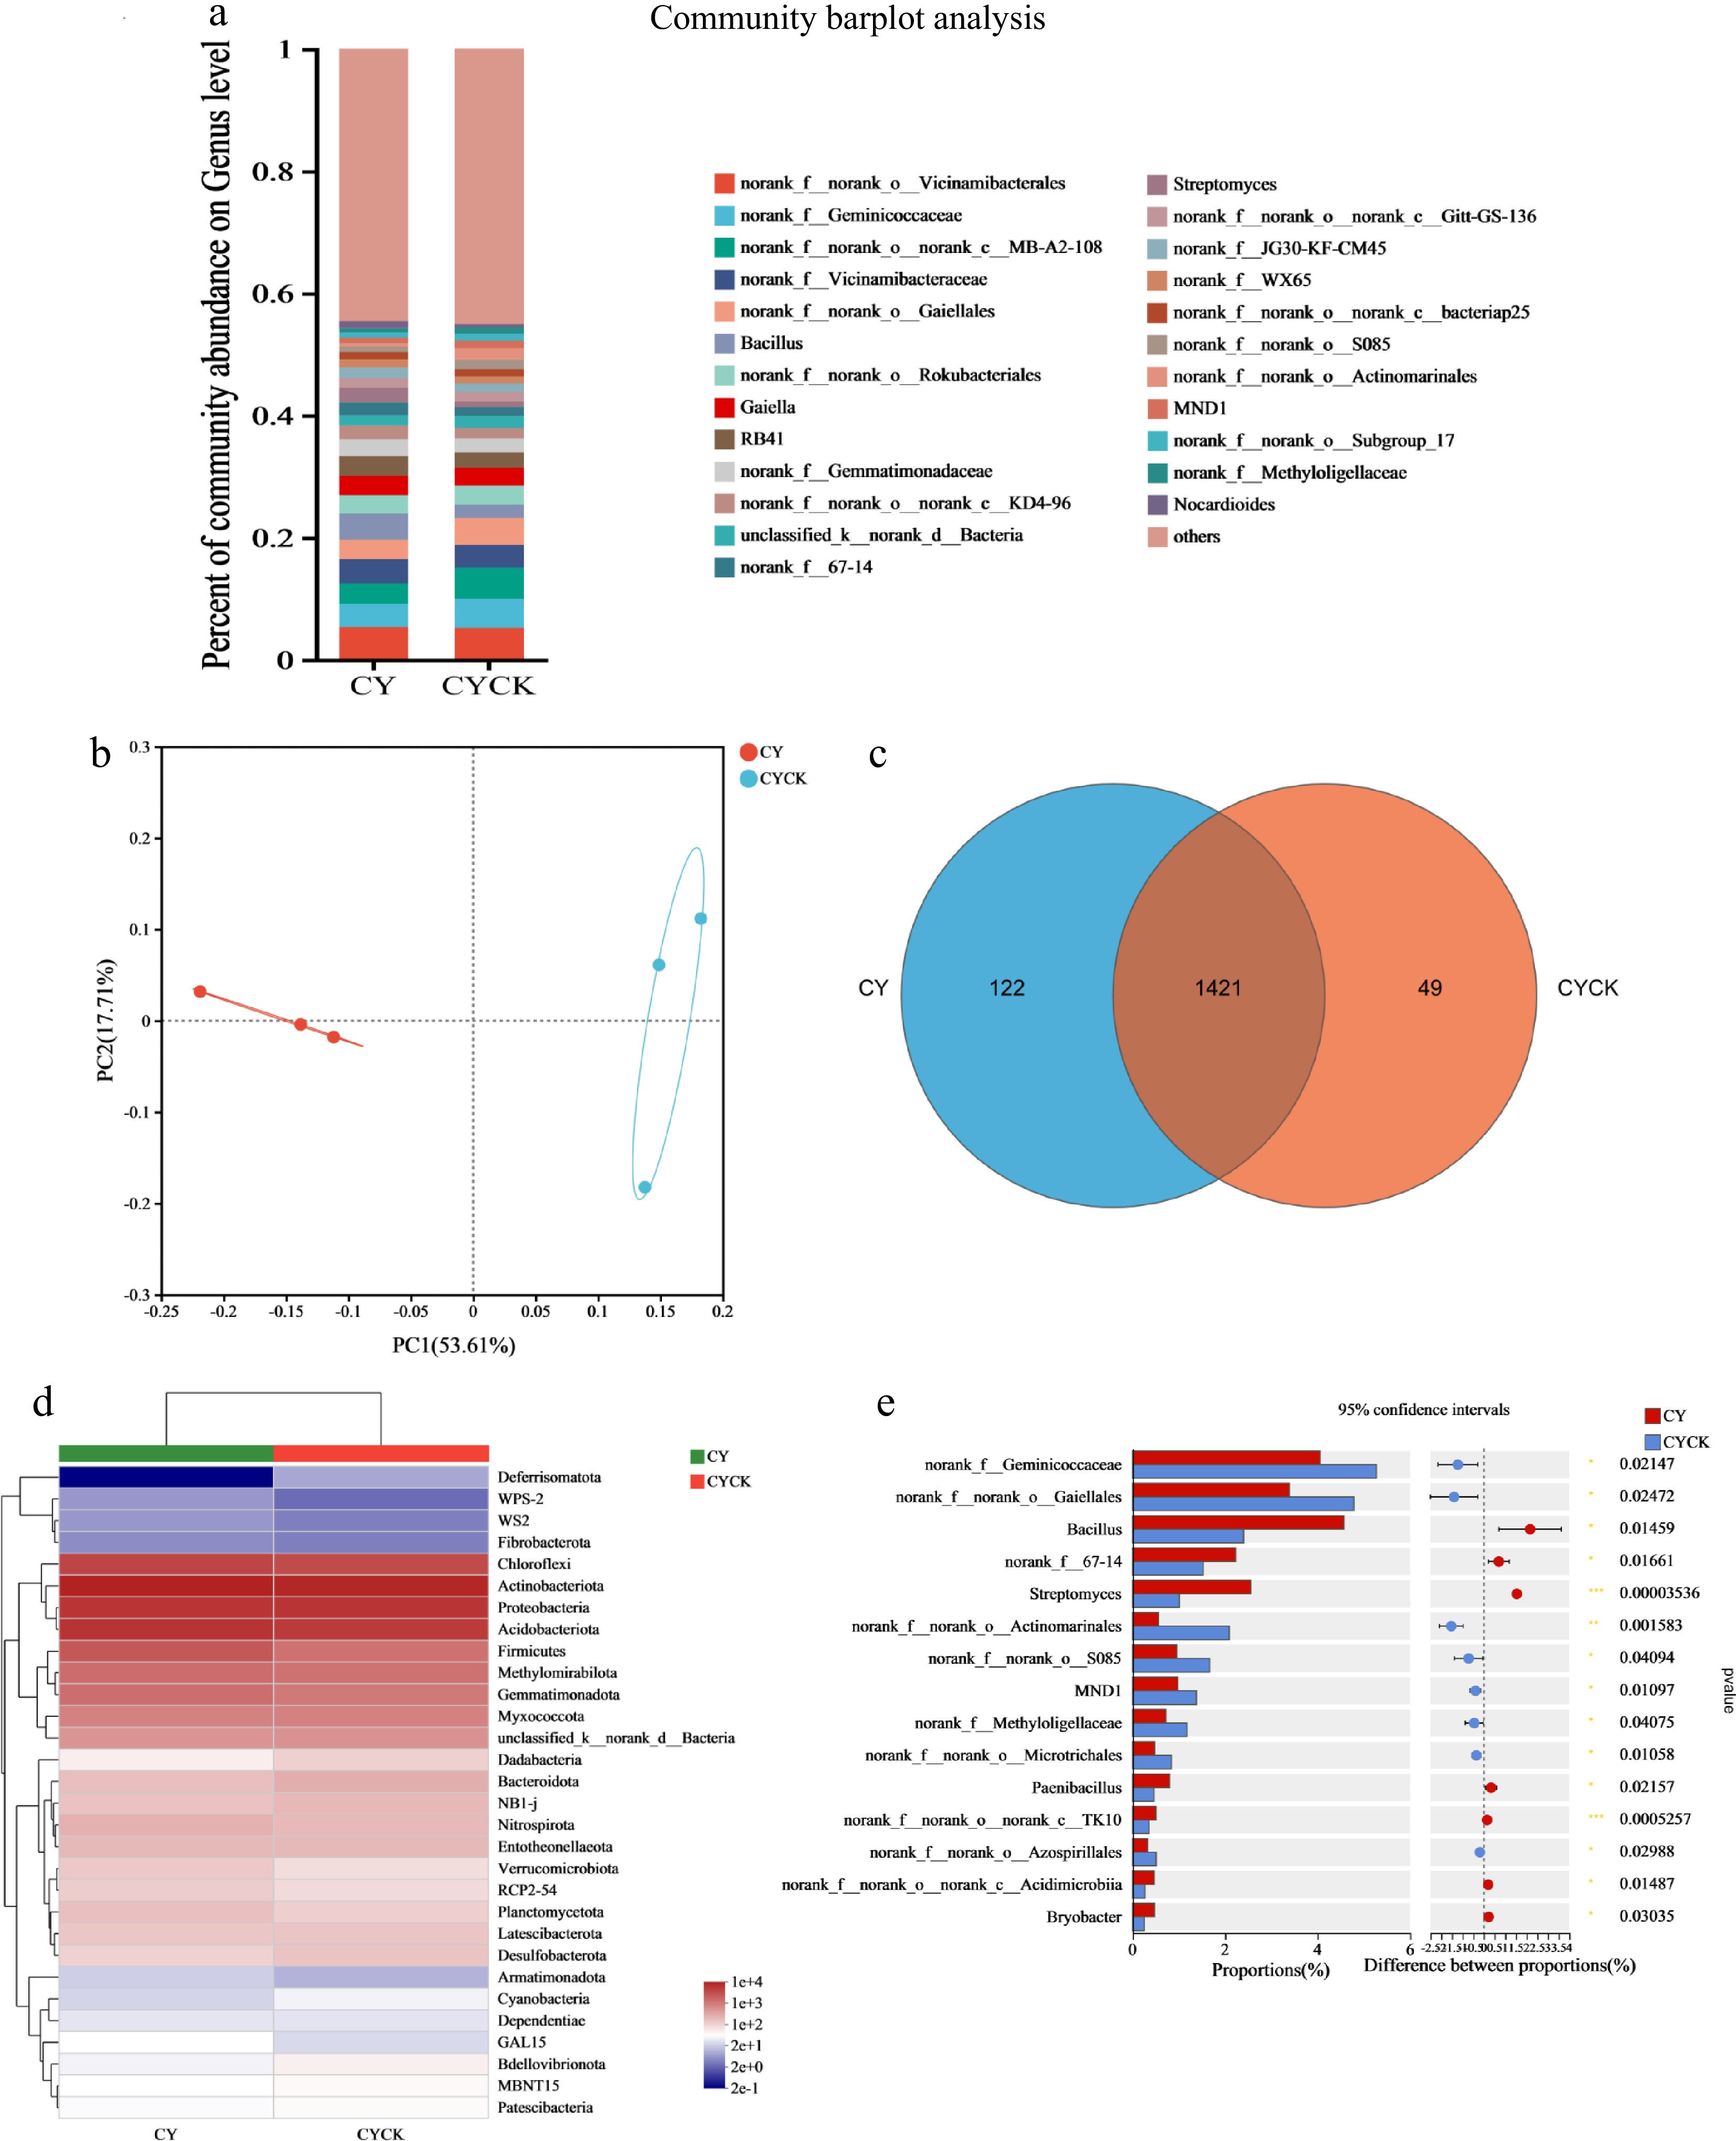
Figure 7.
Effect of continuous cropping of X. sorbifolia Bunge on soil bacterial community structure in the CY area. (a) Horizontal abundance and distribution of bacterial genera; (b) PCoA plot showing bacterial distribution under the two treatments; (c) Venn diagram analysis of bacterial species distribution; (d) A heat map showing bacterial community composition; (e) Community differences at the bacterial genus level between the two treatment groups. CY: Untreated soil in Changyi; CYCK: Continuous planting of X. sorbifolium Bunge in Changyi.
PCoA of the soil bacteria demonstrated that the bacteria under the CYCK treatment clustered away from the CY treatment and in different quadrants (Fig. 7b). This finding indicates that the CYCK treatment significantly changed the diversity of the soil bacterial community compared to the control. PC1 and PC2 values were 53.61% and 17.71%, explaining 71.32% of the bacterial diversity difference. Venn diagram analysis showed that the number of unique species in the soil bacterial community decreased significantly after the continuous cropping of X. sorbifolium Bunge, exhibiting a 59.84% decrease compared to the regular soil (Fig. 7c).
Effects of X. sorbifolia Bunge on the community structure and abundance of soil fungi in the CY region
-
The classification results showed that Tausonia, Neocosmospora, Mortierella, Penicillium, and Solicoccozyma were the top five fungal genera in the CY area. The relative abundance of these genera was significantly lower in the CYCK treatment compared to the CY treatment (Fig. 8a). The relative abundance of Talaromycetes was markedly higher (p < 0.001) in the CYCK treatment compared to the abundance in the regular soil. The relative abundances of Clonostachys (p < 0.01), Chordomyces (p < 0.05), and Mrakia (p < 0.05) genera were significantly higher in abundance in the CYCK treatment compared to the regular soil. At the phylum level, the relative abundance of Cladosporium and Glomus was lower under the CY treatment than the CYCK treatment. Conversely, the relative abundance of Ascomycota and Mortierellomycota increased significantly in the CY treatment than the CYCK treatment (Fig. 8d).
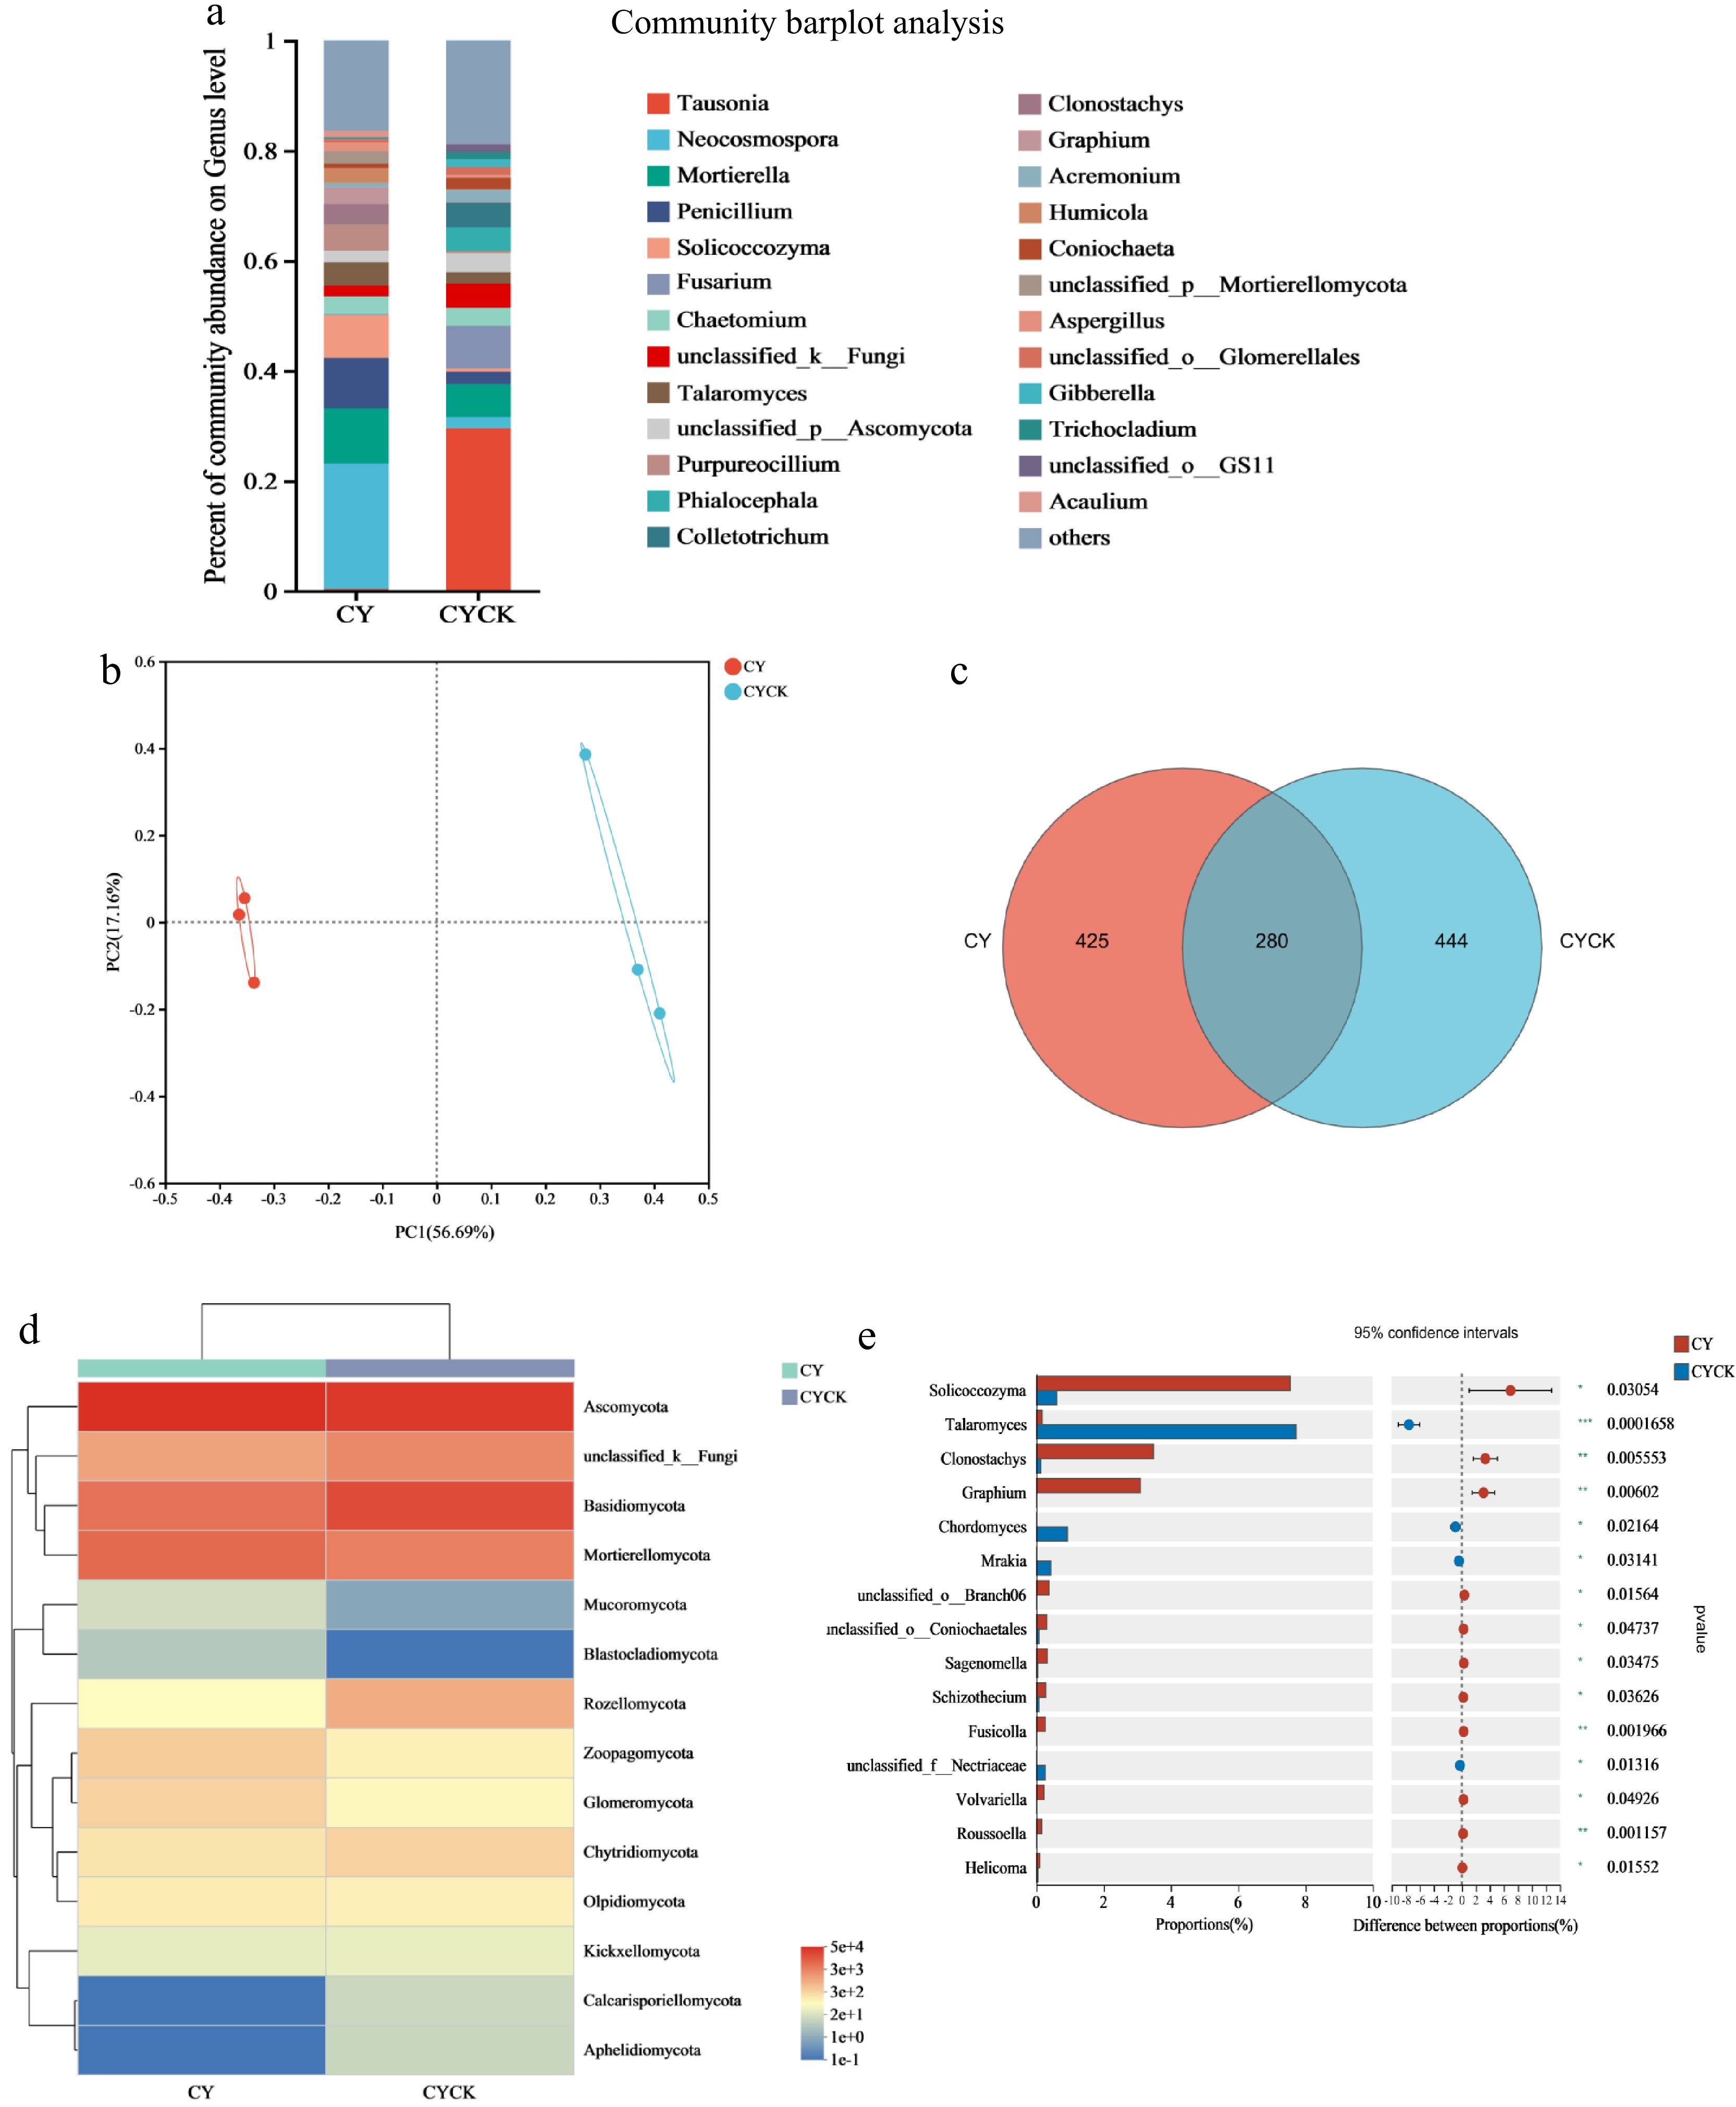
Figure 8.
Effects of continuous cropping of X. sorbifolium Bunge on soil fungal community structure in CY area. (a) Relative abundance of fungi under the two treatments; (b) PCoA plot showing the fungal distribution under the two treatments; (c) Venn diagram showing the distribution of fungal OTU species; (d) A heat map showing fungal community composition in the two groups; (e) Differences in the fungal horizontal community between the two treatment groups. CY: Untreated soil in Changyi; CYCK: Continuous planting of X. sorbifolium Bunge in Changyi.
PCoA of the relative abundance of soil fungi showed distinct clustering of the fungi under CY treatment at different quadrants from the CYCK treatment (Fig. 8b). These results indicate that the CYCK treatment significantly changed the diversity of the soil fungi community compared with the CY treatment. The PC1 and PC2 values were 56.69% and 17.16%, explaining 73.85% of the fungal diversity difference. Venn diagram analysis of the soil OTU level revealed significant differences in fungal microbial species between the two treatments, with only 280 common microbial species (Fig. 8c).
Co-occurrence networks of soil microbial communities between the two groups
-
The influence of continuous cropping on soil microbial communities was primarily reflected in the weakening of interactions between microbial communities. The effect of continuous cropping of X. sorbifolium Bunge on soil microbial interactions was explored by constructing a microbial co-occurrence network (Fig. 9). Co-occurrence network analysis showed that different phyla in the same family appeared in different co-occurrence networks, indicating that they exhibit different relative abundances and play different network roles. Co-occurrence network analysis of soil bacteria demonstrated that Proteobacteria accounted for a higher proportion and played a more significant role in the interaction network (Fig. 9a). Notably, the proportion of Proteobacteria in soil increased significantly after the continuous cropping of X. sorbifolium Bunge, and the interactions across the bacterial communities at the phylum levels were closer. The abundance ratio of Gammaproteobacteria, Myxococcia, Chloroflexia, and other bacteria decreased after continuous cropping, with decreased interactions. Co-occurrence network analysis of soil fungi demonstrated that Basidiomycetes was the most dominant soil microbial phyla before and after the continuous cropping of X. sorbifolium Bunge (Fig. 9b). However, after continuous cropping, the interactions of the soil fungal communities became closer, the abundance of fungi increased, and the abundance of Mortierellomycota decreased. In addition, the importance of Mortierellomycota in the interactions of soil fungi decreased after continuous cropping.
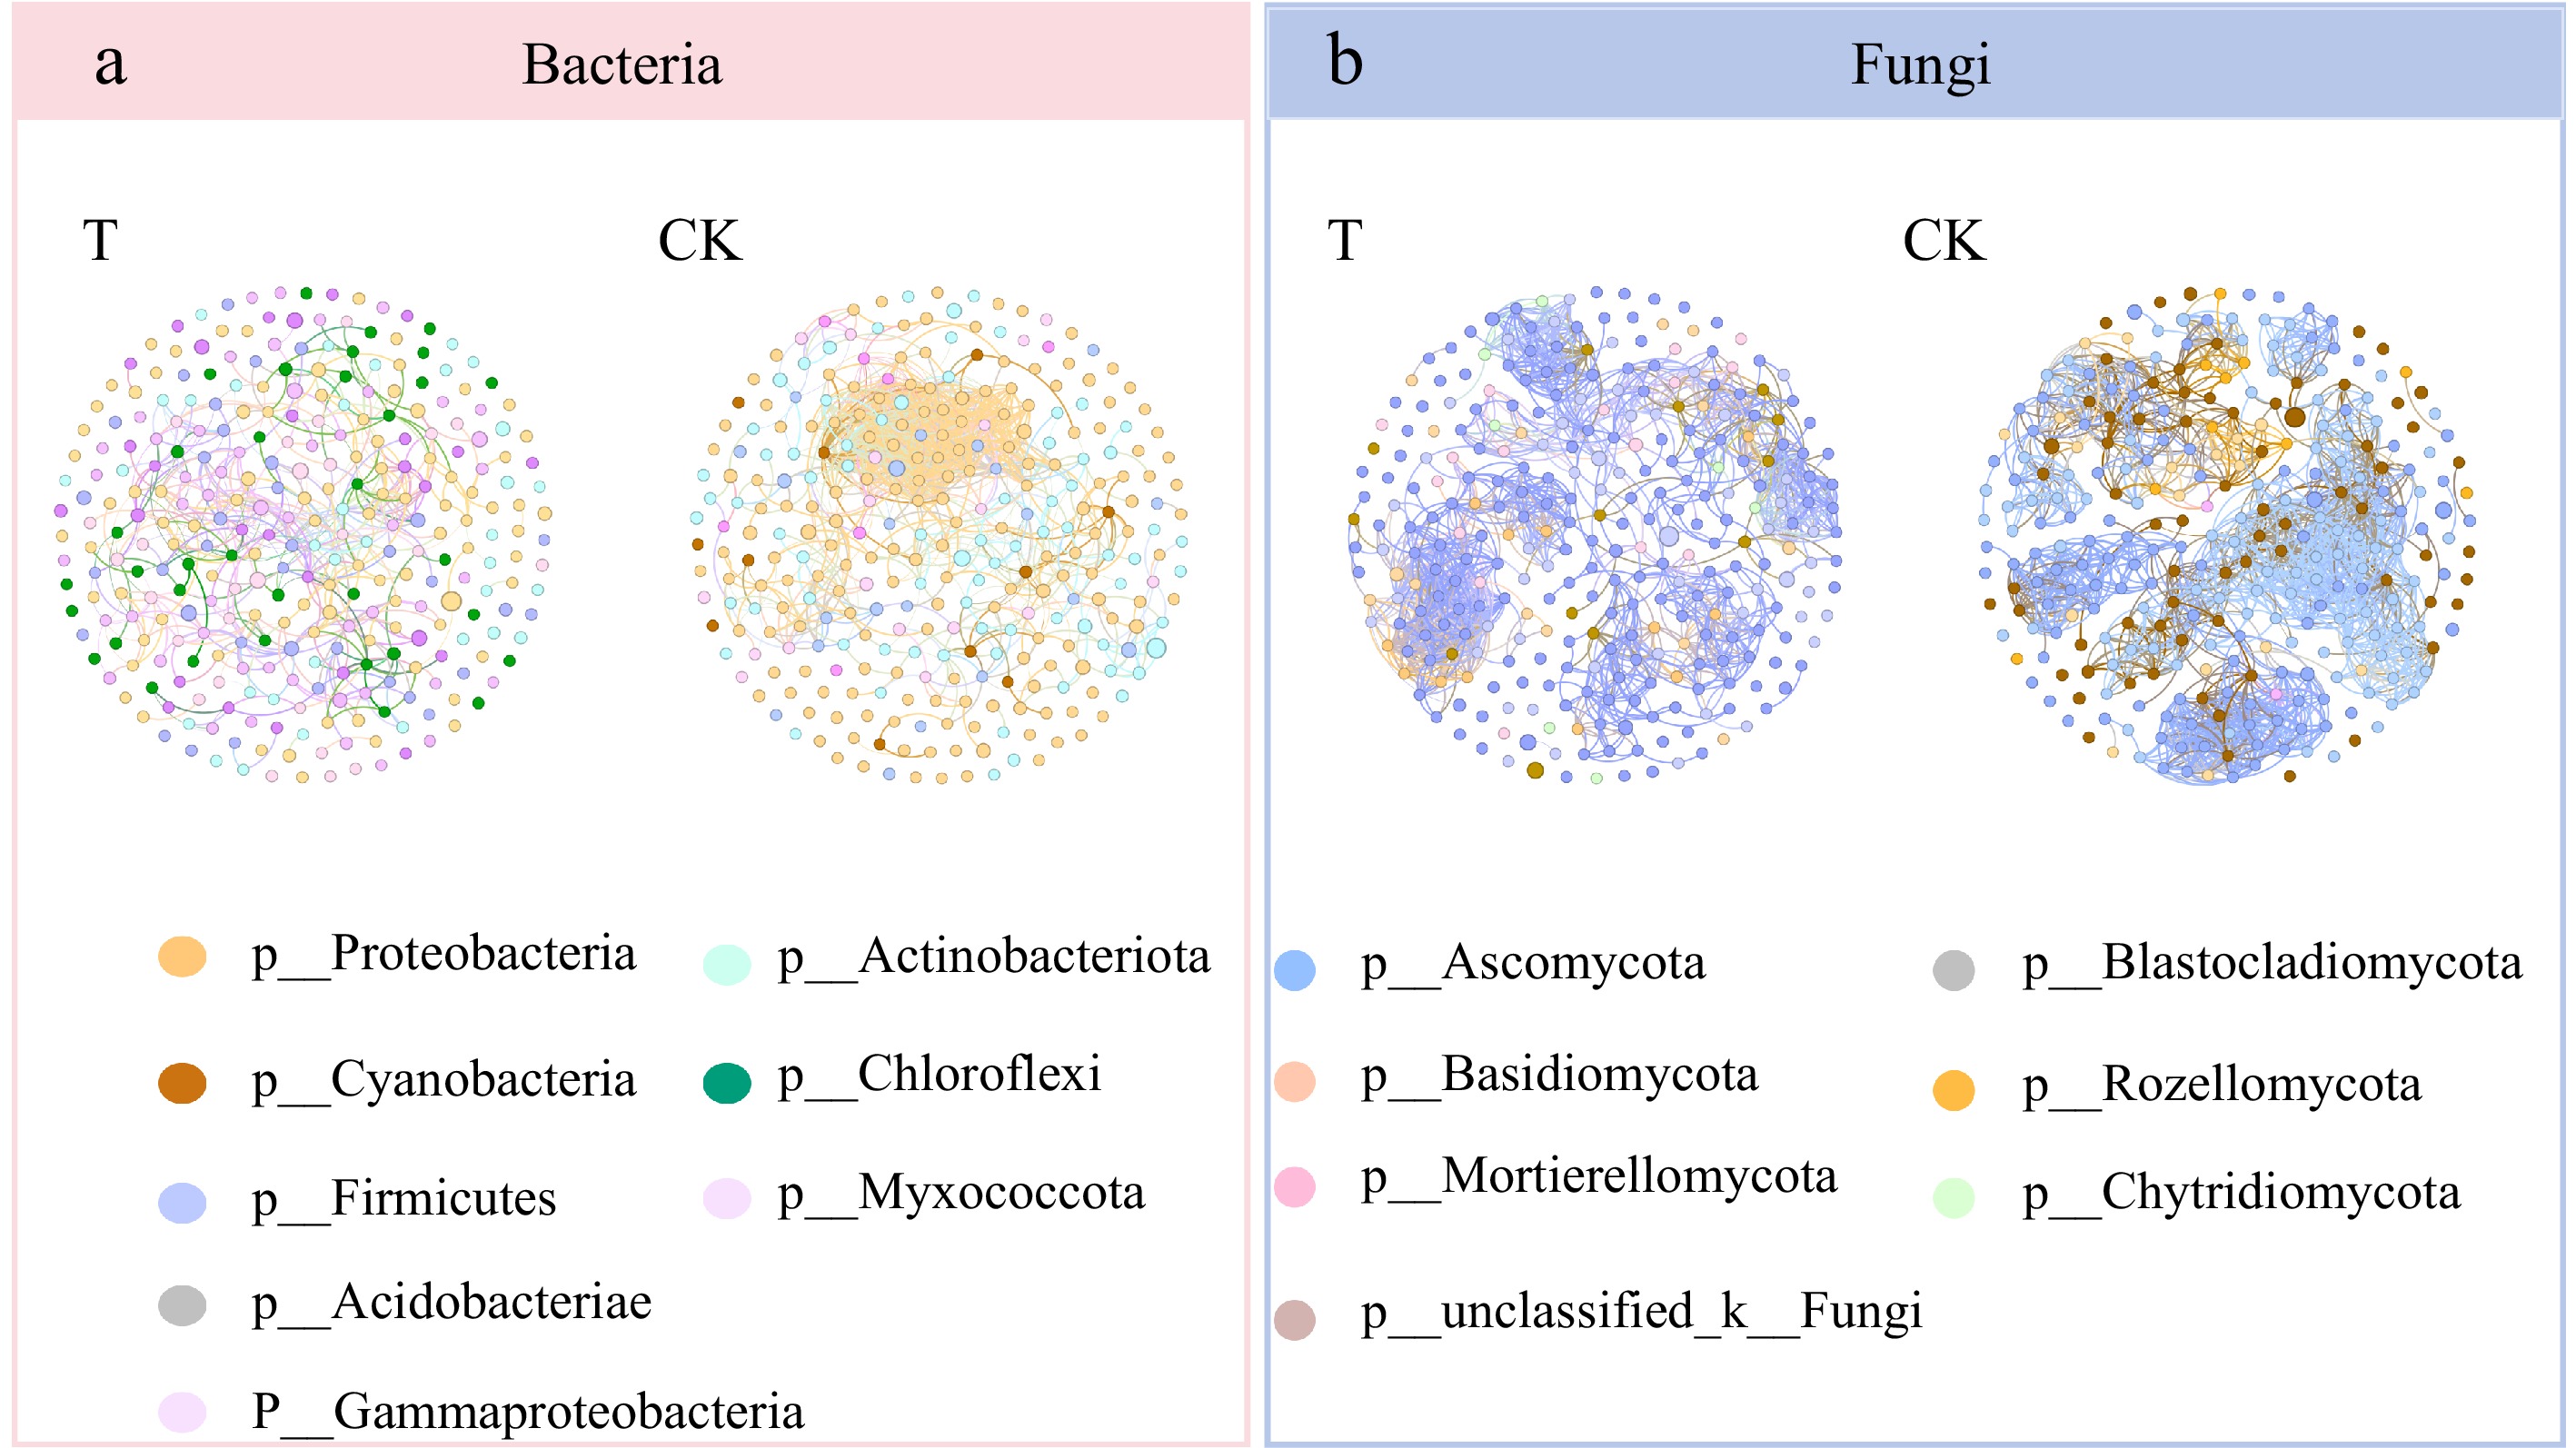
Figure 9.
Soil microbial OTU co-occurrence network ((a) bacteria, (b) fungi) for the continuously cropped X. sorbifolium Bunge based on Spearman's coefficient. Each point represents a genus, the color indicates the bacterial or fungal phylum, and the size of the point represents the relative abundance. T: Untreated soil; CK: Continuous planting of X. sorbifolium Bunge. Species information with an absolute value of correlation coefficient greater than or equal to 0.6, p < 0.05 for the two treatment conditions is displayed.
Redundancy Analysis (RDA) of soil microbial community structure and soil physicochemical properties after continuous cropping of X. sorbifolium Bunge
-
Bacterial RDA showed that (Fig. 10a), with soil physicochemical properties as influencing factors, RDA1 accounted for 34.85% of the explanatory weight ratio, whereas RDA2 accounted for 26.10%. Available potassium (AK) had a greater explanatory weight in explaining the composition of the bacterial community in the regular cropping soil used for planting X. sorbifolium Bunge. All soil physicochemical properties were positively correlated with the soil bacterial community. In addition, all soil physicochemical properties exhibited a positive correlation with the bacterial community structural changes under the regular cropping soil. OTU4225, OTU4751, OTU5234, and OTU5023, the strains used to demonstrate the changes in soil physicochemical properties, showed a significant correlation between soil physicochemical properties and soil bacterial communities. Fungal RDA demonstrated that the explanatory weight ratio of RDA1 was 30.75% and RDA2 was 23.73% (Fig. 10b). The findings revealed that the soil physicochemical properties significantly influenced the distribution of soil fungal communities under continuous cropping of X. sorbifolium Bunge in the AQ and CY regions. Soil physicochemical properties were negatively correlated with soil fungal microbial communities. OTU998, OTU1086, OTU1102, OTU935, and OTU1011 represented the response strains to the changes in soil physicochemical properties. These strains showed significant correlation between soil physicochemical properties and soil fungal communities.
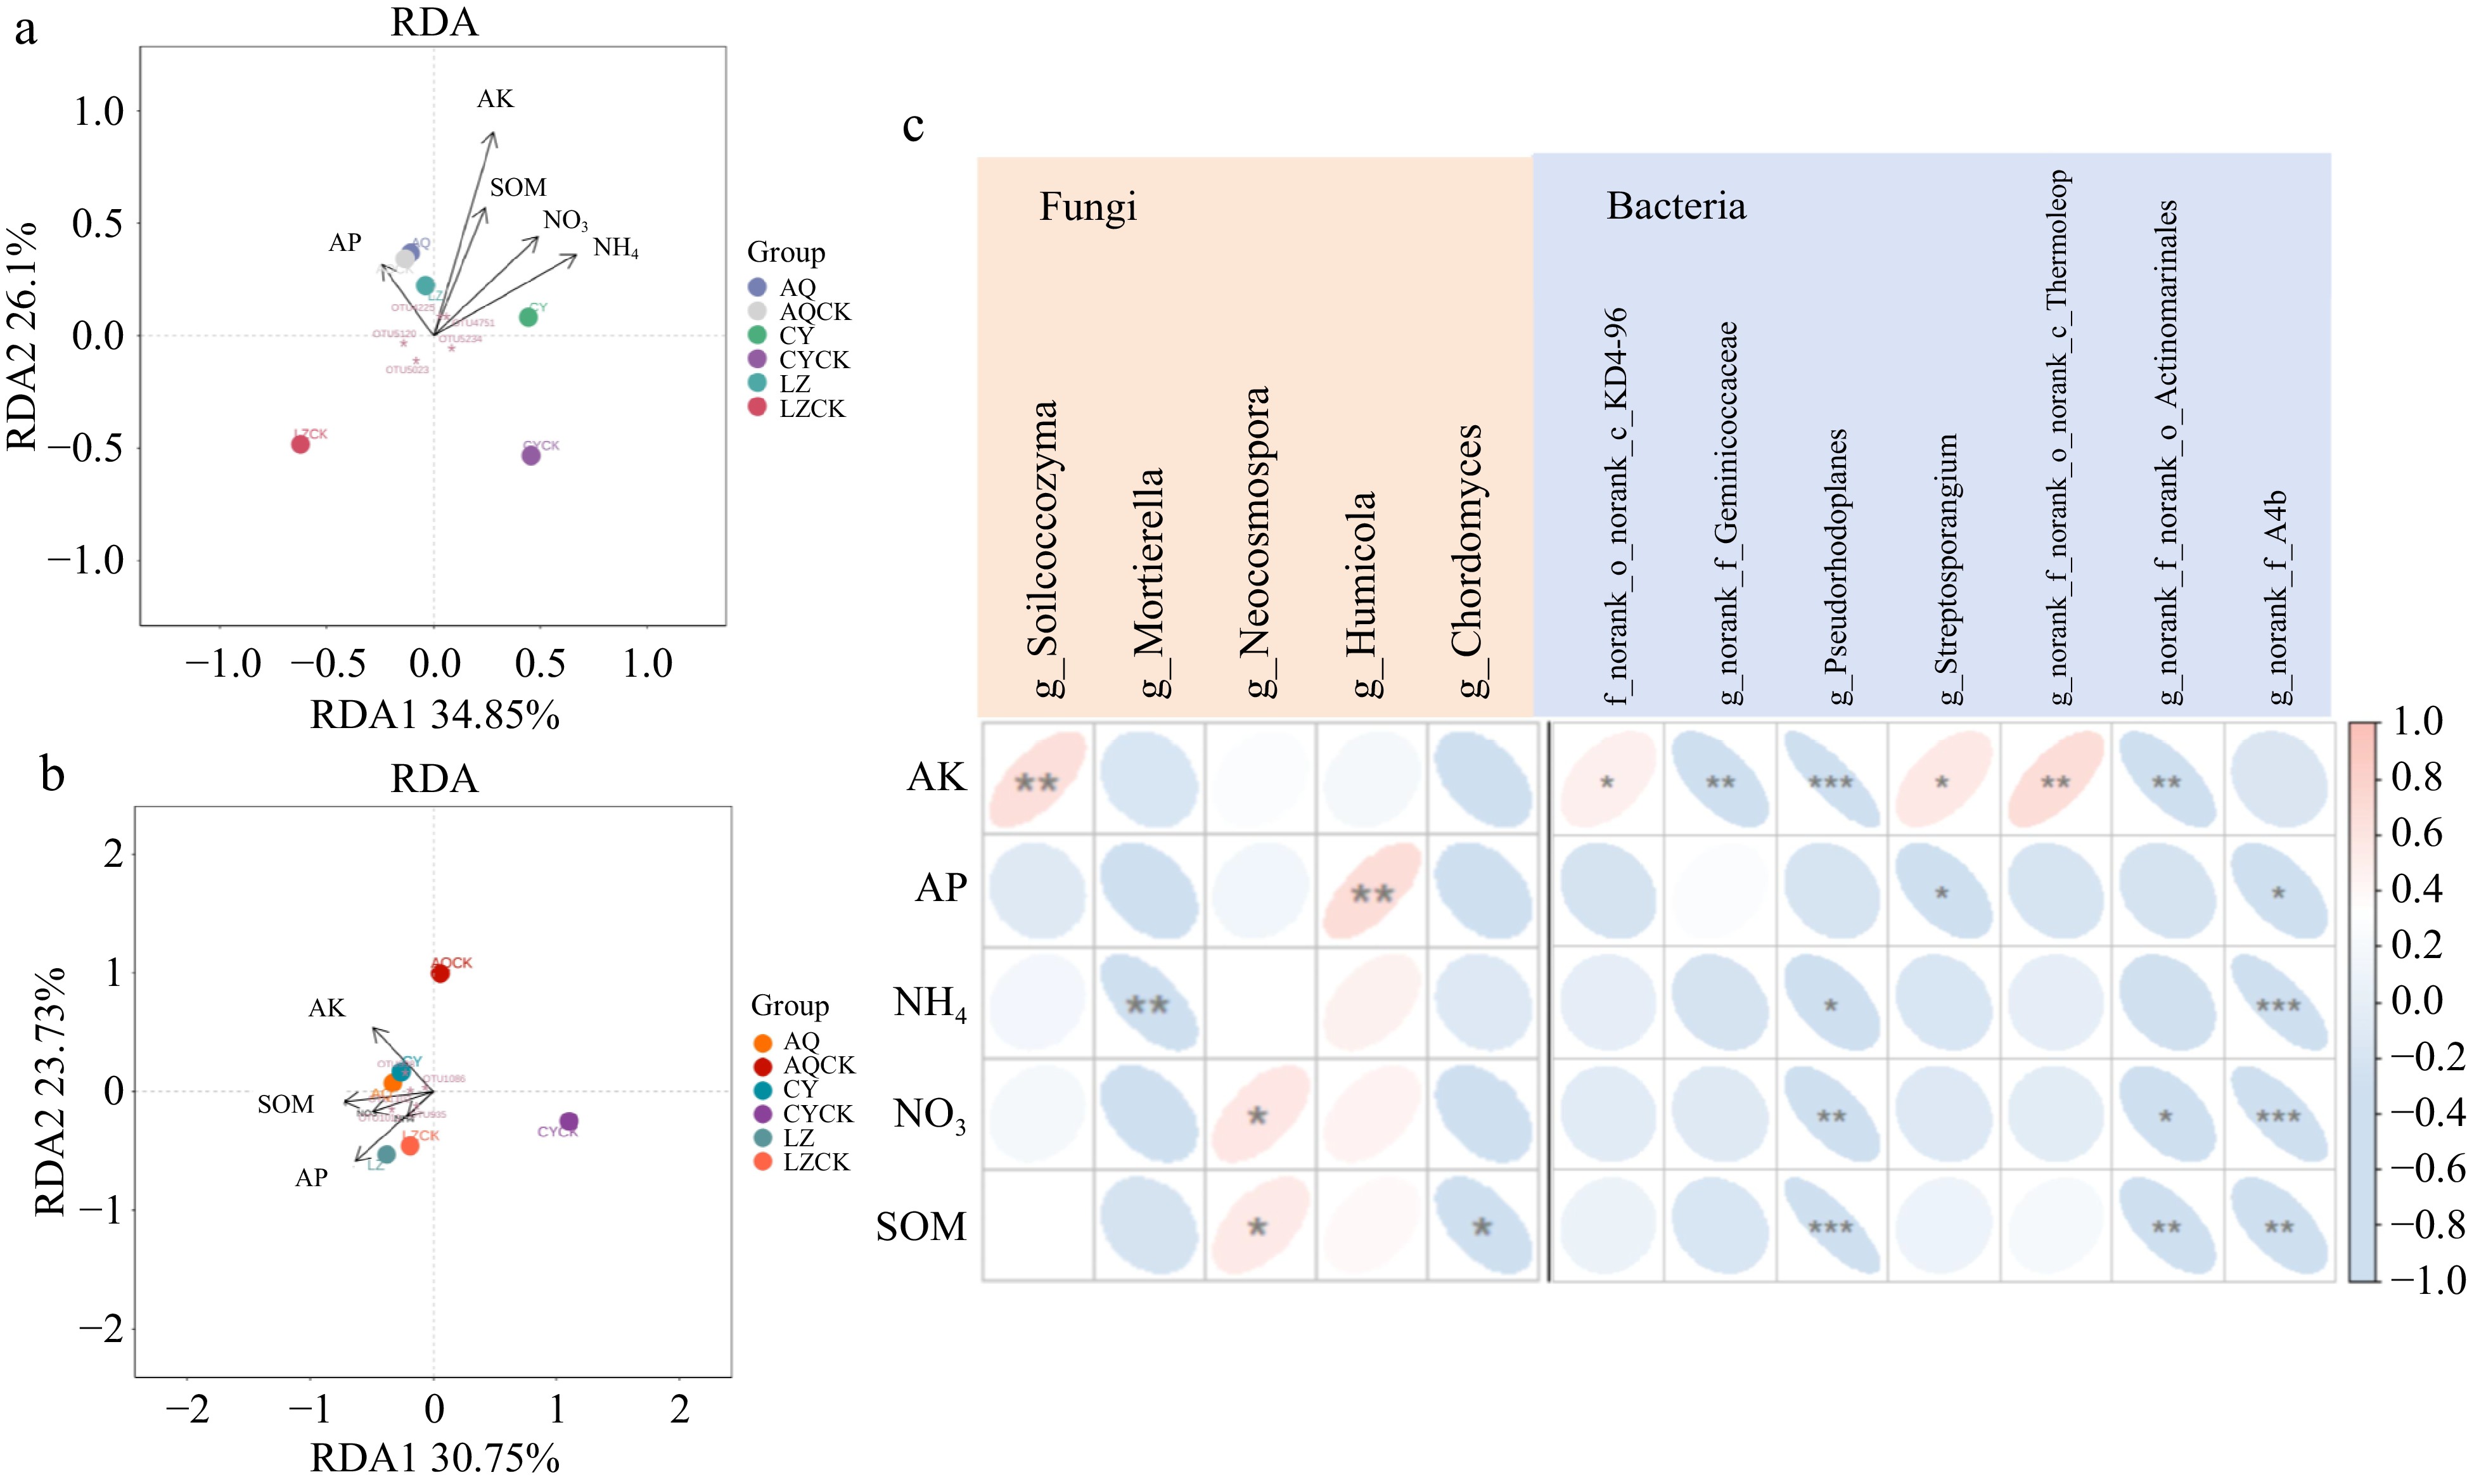
Figure 10.
A scatter diagram of RDA of X. sorbifolium Bunge continuous cropping. (a) RDA of the correlation between soil physicochemical properties and soil bacterial community; (b) RDA of the correlation between soil physicochemical properties and soil fungal community; (c) The relationships between soil physicochemical properties and strains representing soil microbial community changes. SOM: organic matter, NH4: Ammonium nitrogen, NO3: Nitrate nitrogen , AP: Available phosphorus, AK: Available potassium. Different colors in the heat map represent positive and negative correlation, color depth represents positive and negative correlation, and asterisks in color blocks represent the significance level. * 0.01 ≤ p < 0.05, ** 0.001 < p ≤ 0.01, *** p ≤ 0.001.
The relationships between soil physicochemical properties and strains representing soil microbial community changes
-
Correlation analysis was conducted to explore the relationship between the abundance of microorganisms and the change in the soil physicochemical properties (Fig. 10c). Analysis of the soil fungal community showed that the abundance of Silicocozyma was positively correlated with the level of available potassium (AK). Conversely, the abundance of Mortierella was negatively correlated with ammonium nitrogen (NH4+-N) level. The abundance of Neocosmospora was positively correlated with soil nitrate nitrogen (NO3−-N) content and organic matter (SOM) amount. Analysis of soil bacterial community revealed that the levels of ammonium nitrogen, NO3−-N, and SOM were negatively correlated with the abundance of Pseudohodoplanes and A4b.
The relationships between soil indicator microorganisms and plant biomass indicators
-
Correlation analysis was conducted to explore the relationship between the core microorganisms and plant biomass index. Analysis of the bacterial microbial community revealed that the abundance of Streptosporangium was significantly positively correlated with the biomass of X. sorbifolium Bunge in the three locations (Fig. 11a). The relative abundance of Streptosporangium was significantly correlated with the stem diameter of X. sorbifolium Bunge. Correlation analysis of the fungal microbial community demonstrated that the abundance of Mortierella was positively correlated with the biomass of X. sorbifolium Bunge and positively correlated with the stem diameter of X. sorbifolium Bunge (Fig. 11b). Conversely, significant negative correlations were observed between the relative abundances of Neocosmospora, Phialemoniopsis, Aspergillus, and the biomass of X. sorbifolium Bunge in the three places. Notably, the change in the relative abundance of Neocosmospora had a significantly higher influence on the change in X. sorbifolium biomass.
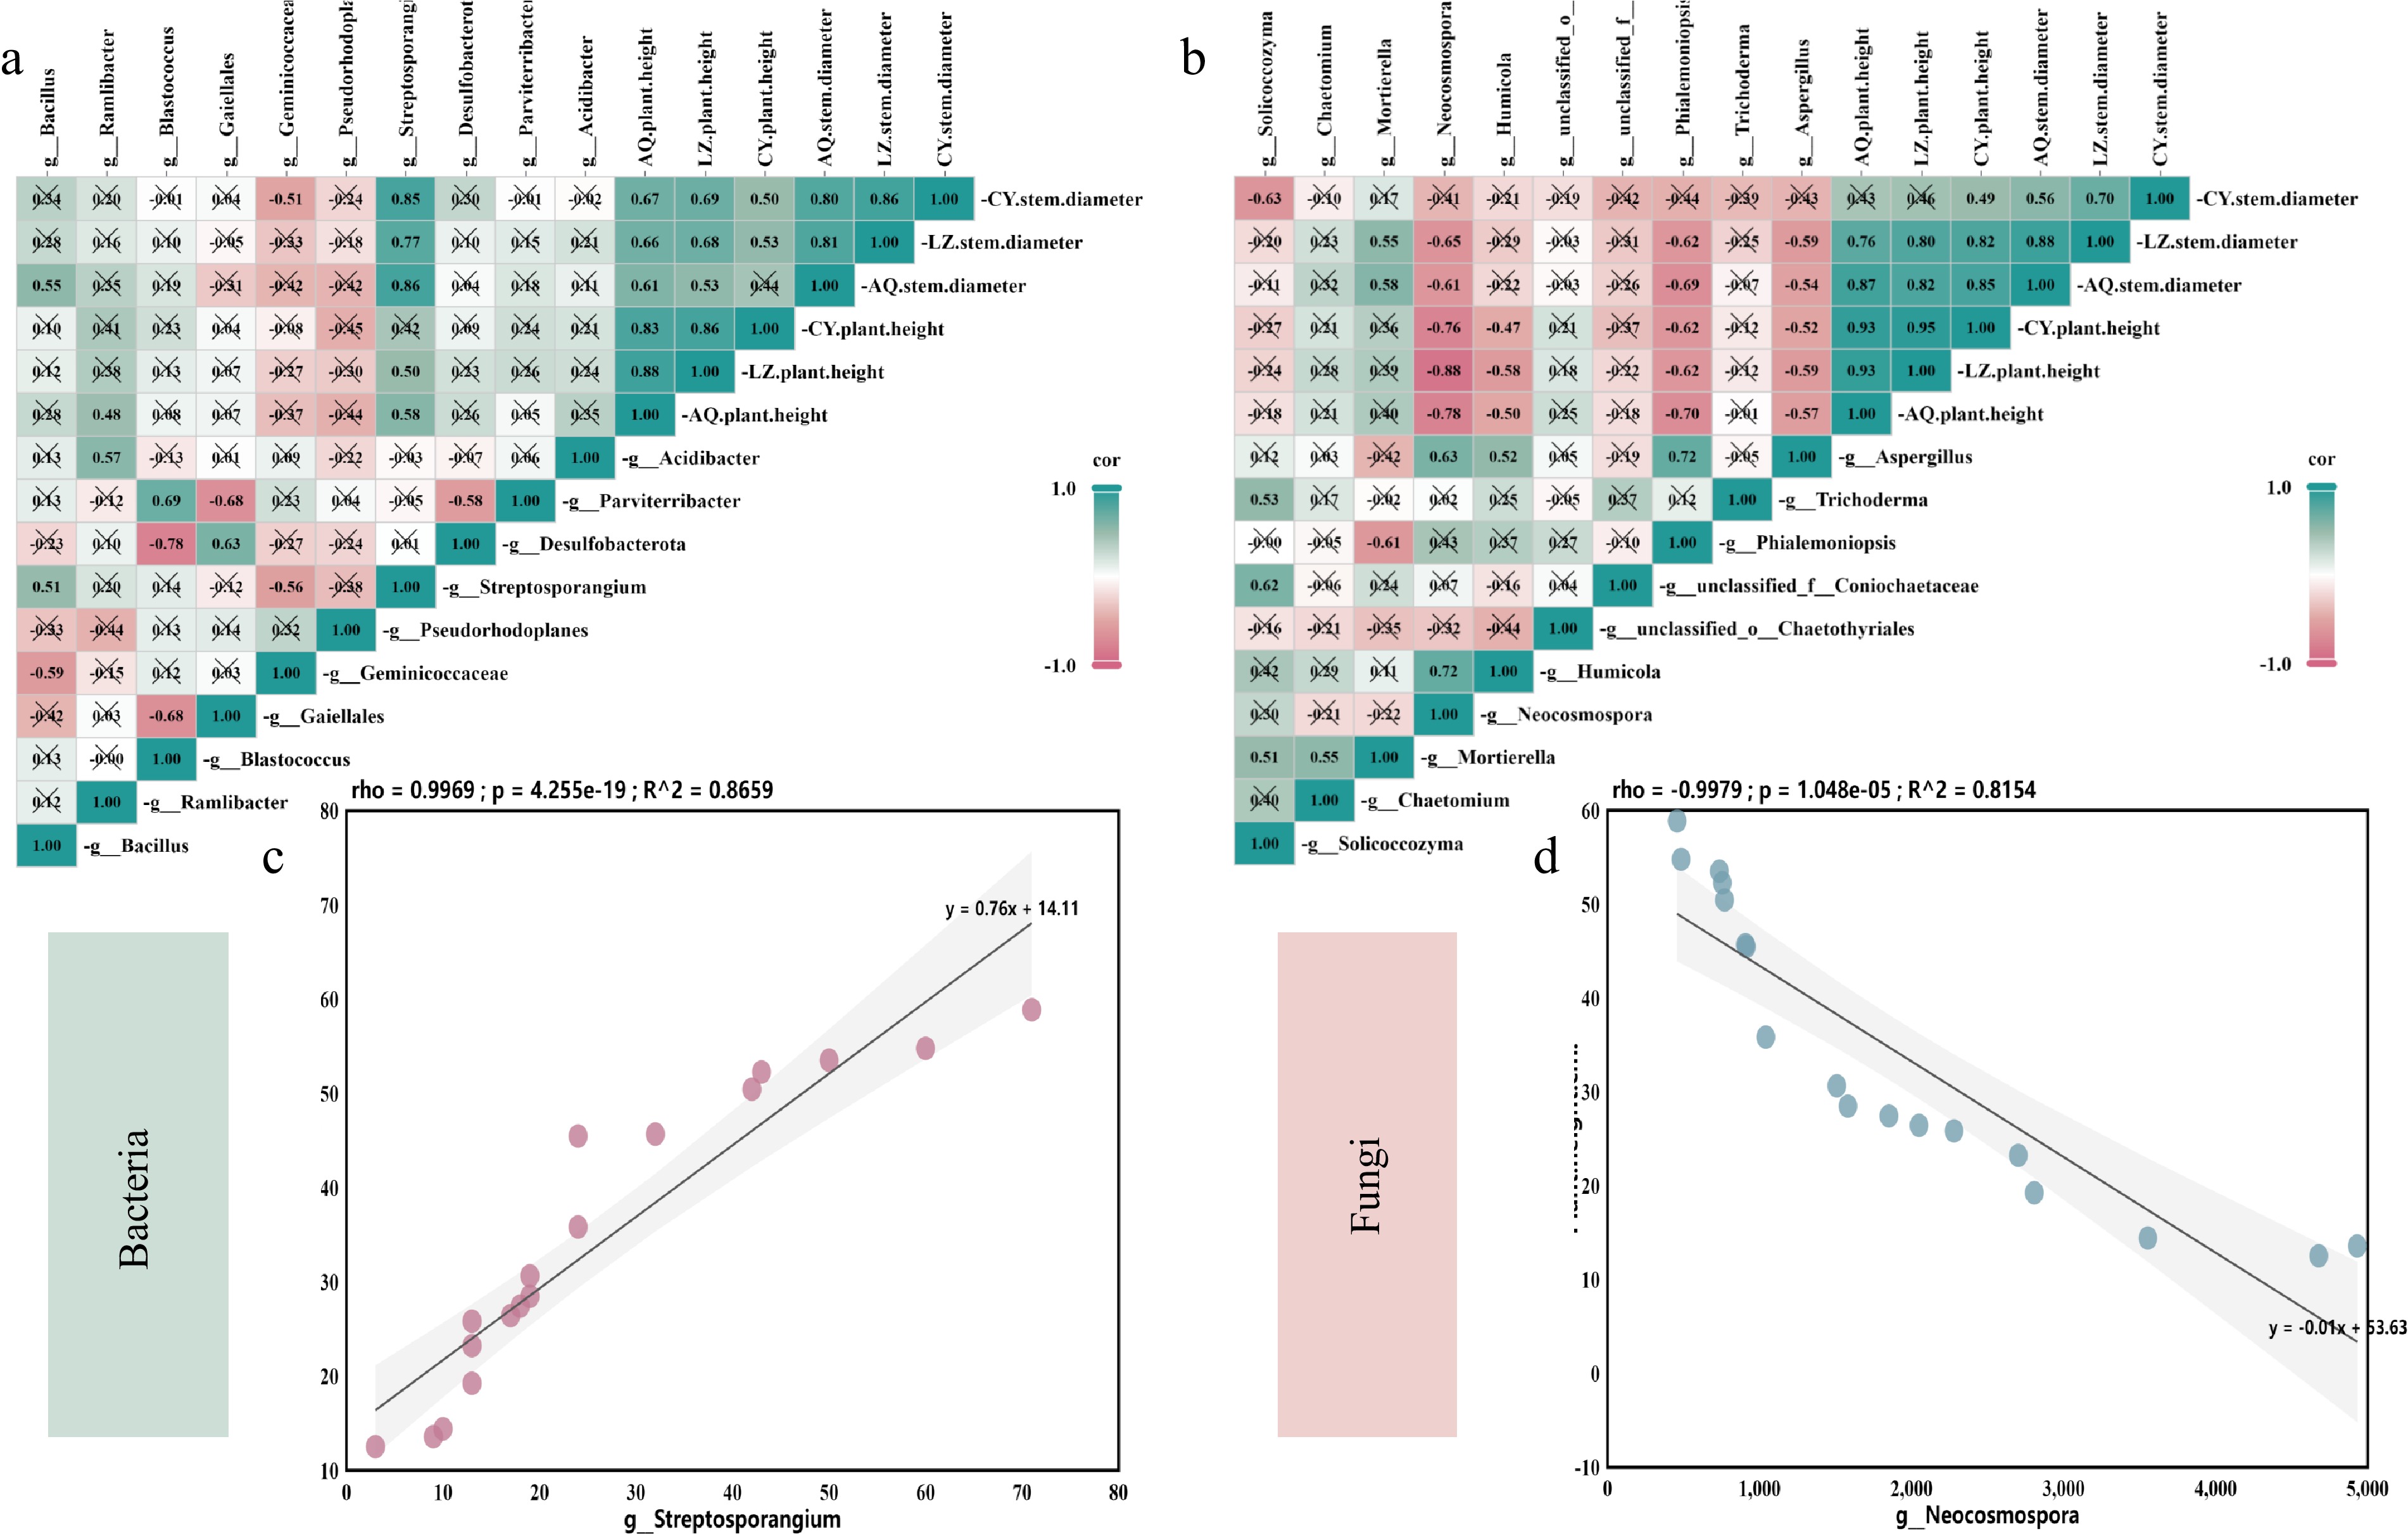
Figure 11.
Correlation between rhizosphere microbial abundance and X. sorbifolia biomass under continuous cropping. (a) Correlation between the biomass of X. sorbifolium Bunge and soil bacterial community; (b) Correlation between the biomass of X. sorbifolium Bunge and soil fungal community. Different colors in the heat map represent positive and negative correlation; color depth represents positive and negative correlation; * in color blocks represents statistical significance. * 0.01 ≤ p < 0.05, ** 0.001 < p ≤ 0.01, *** p ≤ 0.001; (c) The relationships between soil indicator microorganisms and plant biomass indicators. Pearson correlation coefficient indicates the linear correlation between two random variables. The value of R ranges from −1~1, with R > 0 denoting a positive correlation and R < 0 representing a negative correlation. The p value represents the significance of the correlation degree.
Correlation analysis was conducted to explore the relationship between the plant height in July and the abundance of Streptosporangium and Neocosmopora. The results showed a significant negative correlation between the height of X. sorbifolium Bunge and the abundance of Neocosmospora, with a correlation coefficient of −0.9979 (Fig. 11d). Conversely, a positive correlation was observed between Streptosporangium and the height of X. sorbifolium Bunge, with a correlation coefficient of 0.9969, indicating a positive relationship between (Fig. 11c).
-
Successive crop planting often leads to the occurrence of continuous cropping diseases, which result in weakened plant growth, reduced nutrient absorption and decreased yield[34−35]. Long-term single monoculture of coffee changes the soil pH, reduces the organic matter content, and significantly decreases the abundance of soil bacteria and fungi, affecting coffee production[36]. Continuous monoculture of wheat, corn, and soybeans reduce organic carbon and nitrogen contents in the soil, significantly affecting the crop yield[37]. Moreover, long-term continuous cropping of cotton induces significant changes in the soil physicochemical properties, with dysregulated levels of soil nitrogen, phosphorus, and potassium, and a decrease in soil enzyme activity within a short period (1 to 10 years), significantly affecting crop production[38]. In this study, the continuous cropping of X. sorbifolium Bunge significantly reduced the plant height and stem diameter and inhibited the root activity of plant seedlings. The physicochemical properties of various soils have changed, and the contents of available nutrients such as nitrate nitrogen, ammonium nitrogen, available phosphorus, and available potassium have decreased. The amount of nutrients directly available to plants depends on the community structure and corresponding functions of soil microorganisms. As the main source of plant nutrients, soil microorganisms can effectively promote the turnover of soil organic matter[39]. Therefore, due to the decrease of available nutrients of soil plants, the growth of X. sorbifolia Bunge is slowed down and the resistance is reduced, which leads to continuous cropping obstacles.
High-throughput sequencing provides qualitative and semi-quantitative information on the composition and abundance of the soil microbial communities and reveals more taxonomic groups of soil fungi compared to conventional methods[40]. The present study revealed that continuous cropping of X. sorbifolium Bunge leads to continuous cropping diseases, inhibiting plant growth. Significant differences in the soil microbial community structure were observed under the different planting systems. Analysis of 16S rRNA gene sequencing data demonstrated that the planting sequence of peanuts changes the soil microbial community[19]. However, studies have not explored the effects of continuous cropping of X. sorbifolium Bunge on soil microbial community structure. Continuous cropping of this species in three areas significantly decreased the relative abundance of Ascomycetes and Basidiomycetes compared to the regular cropping soil. Conversely, the relative abundance of Mucor, Cladosporium, and Glomus significantly increased after continuous cropping. These results show that, at the phylum level, the fungal community structure is similar across different locations and soil types.
Changes in fungal microbial community structure in plant rhizosphere, caused by fungal pathogens, are the main challenge in the continuous cropping of various plants. For example, continuous cropping of peas leads to the occurrence of soil fungi and oomycetes, forming a pathogen complex. At the genus level, the abundance of Ascomycota, Basidiomycota, Phoma, Podospora Pseudaleuria Veronaea in the rhizosphere of diseased peas is correlated with plant morbidity[41]. Analysis of successive poplar planting demonstrated changes in the composition, diversity, and structure of the soil fungal community. In addition, the abundance of pathogenic fungi was significantly higher after successive poplar planting compared to non-continuous cropping soil, significantly affecting poplar growth[42]. The abundance of Candida, Hypocrea, and Sistotrema increased significantly after continuous cropping of Andrographis paniculate. Moreover, the community structure of root fungi changed significantly compared to non-continuous cropping, leading to a decrease in Andrographis paniculata yield and challenges in continuous cropping[43]. In this study, the relative abundance of common soil fungi such as Fusarium, Chaetomium and Pseudosclerotium changed significantly after continuous cropping of X. sorbifolia Bunge. These findings imply that the instability of the rhizosphere fungal community structure caused by the continuous cropping of X. sorbifolia Bunge is the leading cause of the continuous cropping challenges of this plant.
The relative abundance of other primary pathogens in the continuous cropping soil did not change. Degens et al. observed a significant positive correlation between the abundance of Phoma sp. in peas and the severity of diseases[44]. Moreover, continuous cultivation of Panax Notoginseng increases the risk of root infection by pathogenic bacteria. Previous findings indicate that Leotiomycetes, Cylindrocarpon, Fusarium, and Mycocentrospora are potential pathogens that prevent the continuous cultivation of Panax notoginseng[45]. These microorganisms are obligate pathogens, so they are dominant in roots rather than inhabiting the soil, leading to plant diseases. The present research results are consistent with findings from previous research that an increase in Neocosmospora abundance is a significant factor that limits the continuous cropping of X. sorbifolium Bunge. Neocosmospora was identified as the dominant pathogenic fungus in this study. This fungus typically inhabits soil, plant debris, living wood, or grass matrix and is occasionally observed in water and air[46]. Consequently, it may be the primary pathogen that causes continuous cropping diseases in X. sorbifolium Bunge farms.
The relative abundance of Operational Taxonomic Unit (OTU) identified as Mortierella, Talaromyces, and Solicoccozyma in the continuously cropped X. sorbifolium Bunge field was significantly lower than in the control field. Moreover, the abundance of Mortierella in the three study sites was negatively correlated with continuously cropped X. sorbifolium Bunge. These fungi have been used as soil biocontrol strategies for bacteria. Previous findings report that Mortierella transforms nutrients, promotes crop growth, improves soil quality, and prevents soil degradation[47]. Talaromyces produces secondary compounds with a significant broad-spectrum antibacterial activity and is widely used in the agricultural industry[48]. Some species with a low abundance, including Penicillium, Mucor, and Burkholderia, are involved in nutrient transformation and promoting crop growth in the rhizosphere of continuously cropped tobacco plants. Notably, these species are negatively correlated with the relative abundance of continuously cropped tobacco pathogens[49]. Researchers inoculated rhizobia and endophytic fungi in the continuous cropping of Panax notoginseng. They observed increased diversity of Ascomycota, Zygomycota, and Basidiomycota, subsequently alleviating the challenges associated with the continuous cropping of this plant[45].
In this study, the bacterial community structure in the soil of X. sorbifolium Bunge also changed substantially after continuous cropping. The relative abundances of Bacillus, Blastococcus, Solirurobacter, Dependentiae, Methylomirabilota, and Acidobacteriota were negatively correlated with continuous cropping. Conversely, the relative abundances of Blastococcus, Solirurobacter, and Dependentiae increased under regular cropping. Previous studies report that soil bacteria undergo significant changes under continuous cropping[50]. Continuous cropping of cotton leads to a decline in the abundance of beneficial bacteria such as Actinomycetes, Acidobacteriota, Sessilebacteria, and nitrifying bacteria in the soil[51]. Dynamic changes are observed in the abundance and diversity of beneficial bacteria during the continuous planting of peanuts. These findings demonstrate that bacterial populations, especially beneficial ones, can be used to minimize continuous cropping diseases[52]. Pearson correlation analysis of all categories showed that the abundances of Actinomycetes, Basidiomycetes, Bacteroides, Verruca, and fungi were negatively correlated with the disease index (DI) of vanilla after continuous cropping[53]. These findings imply a decline in the abundance of beneficial microorganisms may occur under the monoculture of continuous cropping of X. sorbifolium Bunge, ultimately reducing the biological inhibition of other regular soil microorganisms on continuous cropping diseases.
In summary, the results of this study show that the continuous monoculture of X. sorbifolium Bunge leads to slow growth, reduced vitality, and low yield, resulting in continuous cropping diseases. Among them, the soil microbial community changed, and the relative abundance of pathogenic fungi including Neocosmospora and Alternaria is the main reason for the continuous cropping obstacle of X. sorbifolia. Hence, continuous cropping diseases can be mitigated by changing the soil microbial community structure. These findings provide insights for formulating strategies for the prevention and control of replanting diseases. Soil fumigation and disinfection should be adopted to reduce fungal pathogens, optimize microbial community structure, and prevent continuous cropping diseases.
This research was supported by The Improved Variety Program of Shandong Province of China (2020LZGC0904).
-
The authors confirm contribution to the paper as follows: study conception and design: Zhao Y, Lv J; data collection: Wang G; analysis and interpretation of results: Wang G, Wang L, Yu M, Wu D, Lu L, Xie X; draft manuscript preparation: Wang G, Wang L, Yu M, Wu D, Lu L, Xie X. All authors reviewed the results and approved the final version of the manuscript.
-
The datasets generated and/or analyzed during the current study are available from the corresponding author on reasonable request.
-
The authors declare that they have no conflict of interest.
-
# Authors contributed equally: Gongshuai Wang, Lei Wang
- Copyright: © 2024 by the author(s). Published by Maximum Academic Press, Fayetteville, GA. This article is an open access article distributed under Creative Commons Attribution License (CC BY 4.0), visit https://creativecommons.org/licenses/by/4.0/.
-
About this article
Cite this article
Wang G, Wang L, Yu M, Wu D, Lu L, et al. 2024. Continuous monoculture of Xanthoceras sorbifolia Bunge leads to continuous cropping challenges due to fungal pathogen accumulation and reduced beneficial bacteria abundance. Fruit Research 4: e040 doi: 10.48130/frures-0024-0034 

Continuous monoculture of Xanthoceras sorbifolia Bunge leads to continuous cropping challenges due to fungal pathogen accumulation and reduced beneficial bacteria abundance
- Received: 09 August 2024
- Revised: 29 October 2024
- Accepted: 30 October 2024
- Published online: 25 December 2024
Abstract: Xanthoceras sorbifolium Bunge, a unique oil crop native to northern China, has a long history of cultivation. In this study, X. sorbifolium Bunge was continuously planted in Zibo and Weifang, Shandong Province, to explore the factors that cause a decline in X. sorbifolium Bunge yield and fruit quality after long-term continuous planting. The results showed that the continuous cropping of X. sorbifolium Bunge led to a significant decrease in the biomass of the plant's seedlings, markedly reduced the root activity, and reduced the soil nutrient content. A significant change in the soil microbial community structure was observed after years of X. sorbifolia Bunge monoculture. At the genus level, the relative abundance of soil pathogenic fungi, such as Neocosmospora, Aspergillus, and Penicillium, significantly increased after continuous cropping, with the relative abundance of Neocosmospora increasing significantly in the three study sites. The abundance of common soil bacterial genera, such as Mortierella, Bacillus, and Streptomyces, is significantly lower under continuous cropping than in regular soil. The number of soil-specific bacteria was also reduced. The results showed that the accumulation of fungal pathogens, particularly Neocosmospora, may be the main challenge in the continuous cropping of X. sorbifolium Bunge, as it reduces the abundance of beneficial bacteria, primarily Bacillus, Streptomyces, and Mortierella.
-
Key words:
- Xanthoceras sorbifolium Bunge /
- Replant disease /
- Soil environment /
- Neocosmospora