


-
Apricot (Prunus armeniaca L.) is one of the most appreciated temperate fruit tree crops with a global production of about 4 Mt in 2020[1]. Initially believed to have originated in Armenia, its domestication was later traced back to Central Asia[2,3]. The continual pursuit of tastier apricots is encouraging organoleptic renewal and differentiation, stimulating the inclusion of superior eating flavor, nutritional properties, and outward features in newly bred cultivars[4−11].
In addition to the synteny with other Prunus species[12−14], apricot germplasm disclosed a remarkable phenotypic variability for many pomological attributes, including fruit acidity and organic acid content[15−18]. Selection of lower titratable acidity (TA) levels has been instrumental in enhancing fruit palatability during domestication[19]. This trait still influences the acceptance of consumers, who tend to appreciate apricots with moderate acidity (in the range of 10−15 g·L−1), typical of many cultivars destined for fresh consumption[10,17,20]. In contrast, low acidic cultivars are primarily used for drying, mostly including Turkish accessions (i.e. 'Hacıhaliloglu', 'Kabaası' and etc.). A certain tendency to reduce acidity can be noticed in some recently released varieties for the fresh market (such as 'Lady Cot'), a characteristic which allows earlier harvest, often before full physiological maturity stage[21−26].
The content of organic acids (OAs) reflects a dynamic equilibrium between biosynthesis, degradation, and vacuole storage[27,28]. OAs represent an energetic pool for other metabolic pathways in fleshy ripe fruit, supplying substrates for respiratory processes and exhibiting content variations throughout the ripening process[29,30]. Quantitative and qualitative OAs composition play a role in sweetness taste perception (influencing the ratio between the total content of sugars and acids) and affect the in-mouth perception of other compounds, such as those related to aroma[21,23,26,29,31−35]. Malate (MAL), citrate (CIT) and succinate (SUC) are the most abundant tricarboxylic acid (TCA) cycle intermediates observed in fully ripe apricots, with similar profiles between pulp and skin[26,29,36−42]. Previous studies reported a genotype-dependence and consistency of MAL and CIT concentration across years both in mesocarp (pulp) and pericarp (skin) tissues, suggesting that their accumulation is only slightly affected by agronomic and/or seasonal factors[30,36,38]. In turn, fully ripe apricot fruits seem to accumulate preferentially MAL or CIT both in pulp and skin with an apparently simple inheritance in various segregating[26,37,43−45] progenies, providing a foundation for further genetic investigations.
Genomics-assisted breeding has been successfully applied in other fruit crops to speed up seedling selection. For instance, in peach, the D Locus on Linkage Group (LG) 5 has enabled a target and efficient selection of low-acid trait[46−48]. In apple, two large-effect QTLs associated with high acidity at maturity (Ma1 on LG 16 and Ma3 on LG 8) have been identified, facilitating marker-assisted-selection (MAS) in ongoing breeding programs[49−53]. MAL is the most abundant OA in apples and it is stored in cell vacuoles after being actively trans-membrane transported by two proteins encoded by an aluminium-activated malate transporter gene (ALMT1 and ALMT2) in Ma locus[28,54−56]. In acidless Citrus species, the reduced TA content seems to depend on large deletions or insertions by retrotransposons at Noemi gene[57] and/or on down-regulated expression of PH1 and PH5 genes coding for carriers at vacuole membranes in mesocarp cells[58]. Furthermore, low CIT concentrations in Citrus fruits seem to rely on acitric gene expression[59]. In strawberry, two clusters (positioned on linkage groups V-2 and V-4, respectively) seemed to co-locate with QTLs responsible for soluble solids content (SSC), TA, pH, and several OAs contents, indicating the presence of genes with pleiotropic effects on the accumulation of different metabolites[60]. Unfortunately, the regulation of OA metabolism remains poorly understood in apricot; the citrate-synthase gene family seems to be expanded in apricot compared to other Prunus species, probably as a consequence of a tandem duplication during its evolution[61]. However, a causal relationship between CIT content and additional copies of citrate-synthase has not been demonstrated. QTLs associated with TA and MAL content in apricots were detected in various chromosomes, depending on the segregating progenies, advancing the hypothesis of a polygenic inheritance[62].
Understanding the genetic bases of the observed phenotypic variations among apricot accessions would aid the wide exploitation of apricot germplasm resources in breeding and the development of novel superior ideotypes setting fruits with target acidity and OA levels. These goals are facilitated by recent advances such as the availability of an assembled apricot genome[61] and the continuous improvements of high-throughput and affordable customized genotyping approaches, such as Single Primer Enrichment Technology (SPET). Among other reduced-representation sequencing approaches, SPET is extremely versatile and suitable to capture the genetic variability in the flanking sites of target SNPs, only using a single primer extension reaction[63,64]. SPET ability of detecting additional sequence variants seemed extremely promising also in perennial crops[42,64], corroborating the expansion of advanced molecular breeding toward fruit tree crops such as apricot.
In this work, an apricot breeding collection was evaluated for fruit acidity-related attributes along three consecutive harvest seasons to dissect the bases of qualitative and quantitative OAs profile in both fruit pulp and skin tissues. Association analyses revealed a major locus on chromosome (chr) 8 largely controlling the balance between MAL and CIT, the most abundant organic acids in apricot fruit. In contrast, the genetic bases behind the quantitative abundance of specific OAs, total OAs content and overall TA levels was more complex, as regulated by several minor effect QTLs on chr 1, 2, 3, 4, 6, and 7, affected by seasonal variability and probably, effects of maturity date loci. The presence and effects of some of these QTLs were further evaluated by linkage mapping in bi-parental cross-progenies (newly characterized or available from published datasets), providing a reliable overview of the genetic architecture of acidity-related traits and perspectives for their use in assisted breeding.
-
The plant materials used in the study encompassed an apricot breeding germplasm collection of 131 accessions (Supplementary Table S1) and two F1 progenies: 54 individuals from 'BO96621030' (B1) × 'Harostar' (H) and 37 from 'Fiamma' (F) × 'BO93623033' (B2). Trees of both accessions and progenies were part of the MAS.PES breeding program and located at ASTRA - M. Neri experimental farm in Imola, Emilia-Romagna region (Italy) with coordinate: 44°20'11.6304" latitude and 11°45'20.9664" longitude. Two to four trees per accession were grafted onto '29C Myrobalan' rootstock, with an age comprising between 8–12 years old. Trees were trained according to the open vase system, regularly spaced at a distance of 4 m × 2.5 m (within and between rows, respectively). The F1 seedlings of B1 × H and F × B2 progenies were own-rooted and planted at a distance of 1 m × 4 m (within and between rows, respectively) and trained as a free spindle system. Cultural practices were framed within the integrated management system. Trees were regularly irrigated by drip irrigation system maintaining water capacity close to maximum soil capacity throughout the growing season. Trees were pruned according to their growing habitus using winter and summer interventions and fertilized according to nutrient output balance. Manual thinning was carried out before pit hardening to standardize fruit load based on apricot tree vigor and fruit number/trunk-section cross area (TCSA) index, comprised between values of 3–4 fruits per cm2 TCSA.
Phenotyping for fruit acidity-related traits
-
Ten uniform fruits were randomly sampled within the canopy and harvested at physiological ripening during seasons 2017, 2018, and 2019. Climatic trends over the three years were comparable, resembling the typical traits of temperate sub-continental with a hot and humid summers. Harvest time criteria were defined based on both visual assessment and non-destructive evaluation, using the IAD index of absorbance difference (measured by a DA-meter portable spectrometer, Sintéleia S.r.l., Bologna, Italy). Both assessessments were further confirmed by pulp firmness measured by a digital penetrometer, Andilog Centor AC TEXT08. Fresh and dry fruit weight were also recorded. Three biological replicates of fruit pulp juices were prepared for each accession. For skin juice preparation, 4 g of fresh weighted skin were ground and blended with 1:10 (w·v−1) bi-distilled water. Titratable acidity (TA) measurements were performed by an auto-titrator instrument (CRISON, Crison Instrument, Spain), by adding 0.1 N NaOH up to pH 8.30 and expressed as g·L−1 of malic acid. Detection of ten organic acids (OAs) was performed as previously described[65]. Briefly, calibration curves were established by injecting sequential dilutions of OA standards (Fluka-Sigma-Aldrich; St. Louis, MO, USA). Retention times were determined by injecting standard solutions alone and in mixtures. EDTA was added to standard solutions and juices to prevent calcium ion interference. Samples were filtered through a 0.45 μm nylon membrane before HPLC analysis. Clarified supernatants from flesh and skin samples were centrifuged and injected into a Perkin Elmer LC200 HPLC system, equipped with a Jasko 975 UV/VIS detector and an Aminex HPX-87 Ion Exclusion column. The analysis conditions included a column temperature of 65 °C, a flow rate of 0.6 mL·min–1, and 4 mM H2SO4 as the elution solvent under isocratic elution. Data processing identified OA peaks by comparing retention times, with manual integration to avoid overestimation. Concentrations were quantified using calibration curves. Additionally, OA profiles were validated through an UHPLC-HRMS instrument using an Acquity UHPLC separation module with an Exactive Orbitrap MS for electrospray ionization in negative ion mode. Separation conditions included a 1.8 μm HSS T3 column with a flow rate of 0.45 mL·min–1 and specific elution gradients. The eluate was analyzed in full scan MS mode within a range of 50–1000 m·z–1. OA content was expressed in mg·mL−1 or ng·μL−1 depending on the specific abundance. Total OA content and malate (MAL) and/or citrate (CIT) concentrations balance (MCratio) were calculated in fruit pulp and skin, separately, of each accession.
Statistical analyses on phenotypic data
-
RStat, ggplot2, and corrplot packages of RStudio environment (v1.3.1056) were used for descriptive statistics. A total of 66, 112, and 116 accessions were analyzed in harvest seasons 2017, 2018, and 2019, respectively. According to the experimental design, a general linear mixed model (LMM) equation for each fruit-acidity related trait was used.
$\rm FT=\mu_{FT}+A_{FT}+Y_{FT}+r$ where: μFT is the overall mean for the considered trait, YFT is the year of observation, AFT accession-related effect across years, and r residuals. Fixed effects included μFT while random effects were AFT and YFT. As no interactions between AFT and YFT were observed, these effects were not included in the more parsimonious LMM. Restricted Maximum Likelihood using ASReml-R (v4) software[66] (VSN International) implemented for R environment was used to estimate variance components.
Genotyping and population structure analysis
-
Plant materials was genotyped using single-primer enrichment technology (SPET) assays as previously described[42] consisting in a total of 32,492 SNPs spanning the eight chromosomes of apricot V1 genome reference[61]. SNPs were filtered for MAF (minor allele frequency) lower than 0.05 and linkage disequilibrium (LD) below 0.3, finally retaining a total of 25,704 SNPs with an average spacing of about 10.6 Kb. LD decay was estimated in the order of 10 Kb for an R < 0.2. Population structure was inferred using ADMIXTURE software (v1.22)[67] setting the number of cluster K based on the ΔK method[68]. Principal Component Analysis (PCA) and Kinship matrix (K*) were calculated in Tassel (v5.2.15). Further PC analysis was carried out combining the population stratification with the fruit acidity-related best linear unbiased predictors (BLUPs) using factoextra package in RStudio (v1.3.1056).
Genome-wide association analyses
-
Genome-wide association (GWA) analyses were performed in GAPIT (v3)[69], on testing different algorithms (MLMM, FarmCPU, and Blink). The performance of each algorithm was assessed through inspection of quantile-quantile plots (QQ) reporting the relationship between the observed (on the y-axis) vs the expected (on the x-axis) negative logarithms base 10 of the p-values, assuming a uniform distribution under the null hypothesis of no associations between SNPs and target trait. SNP-trait associations were considered significant based on a conservative threshold inferred by Bonferroni's correction for a type-I error rate of 0.05 and a non-parametric permutation test. MVP-R package (v1.0-14) was used for Manhattan plots. SNP-based broad-sense heritability was estimated by the GREML method using the GCTA tool (v1.93.2), after fitting the top significant SNPs. Statistical significance of single-marker-trait associations were inferred using one-way ANOVA with Student-Newman-Keuls (SNK) post-hoc test or Kruskal-Wallis H-test, depending on phenotype distribution.
Linkage map construction, and QTL-mapping
-
A total of 54 individuals from crosses 'BO96621030' (B1) × 'Harostar' (H), 37 from 'Fiamma' (F) x 'BO93623033' (B2) and 25 from 'Lito' × 'BO81604311' (B) were genotyped using Single Primer Enrichment Technology (SPET) assay, while genotyping-by-sequencing (GBS) markers of 153 seedlings from the cross 'Goldrich' (G) × 'Moniqui' (M) were retrieved from Nsibi et al.[70]. Both SPET and GBS markers were re-aligned on the apricot V1 reference genome[61]. According to JoinMap nomenclature, polymorphic markers were grouped based on parental segregation: lm × ll and nn × np configurations, respectively for mother-seed and father-pollen donor, or hk x hk. After filtering for redundant loci (> 0.95 similarity) and distorted markers (chi-square goodness-of-fit tests at p ≤ 0.05), and according to trait segregation, a final set of 6,340, 5,157, and 4,999 lm × ll markers (B1, F and G, respectively); 4,354, 4,964, and 2,876 nn × np (H, B2 and M, respectively); 3038 hk × hk in L × B. GLM algorithm implemented in Tassel (v5.2.15) was used for single-marker analysis. A minimum logarithm of odds (LOD)[71] value of 10.0 was adopted for defining linkage group (LG), using the Kosambi mapping function as the regression algorithm, with a recombination frequency threshold of 0.4, LOD value of 1.0 and a goodness-of-fit jump of 5.0. R/qtl package in single-QTL model was used for mapping, calculating genome-wide significance thresholds by permutation test. Mapped QTLs and LOD plots were drawn using MapChart (v2.1) software[72]. Identification of recombination events at qMCr8.1 locus in L × B was performed manually.
-
The apricot germplasm selected for this study is highly representative of the genetic variability currently used across breeding programs of various countries and includes traditional accessions, modern varieties, and breeding selections. Structure analysis supported the presence of two main sub-populations largely in agreement with the breeding or geographical origin (Supplementary Fig. S1 & Supplementary Table S1): a cluster (Q1) of materials (mostly accessions or old varieties) from Mediterranean Basin or Continental Europe, a cluster (Q2) from North American breeding programs used for the introgression of Plum Pox Virus (PPV) resistance and admixed individuals (mostly advanced selections and recently patented PPV-resistant cultivars).
Over three consecutive harvesting seasons (2017 to 2019), the apricot collection showed a wide diversity for organic acid (OA)-related traits both in fruit pulp and skin (Supplementary Table S2). Correlations among traits, tissues, and across years are shown in Supplementary Fig. S2. Variance components estimates from a linear mixed model indicated a prevalent genetic control for the most abundant OAs, although seasonality exerted a certain influence, particularly on TA (Supplementary Table S3). Cross-seasons correlation coefficients (ρ) ranged from 0.37 for galacturonate (GAL) to 0.82 for citrate (CIT)[73] in pulp, and from 0.48 for fumarate (FUM) to 0.80 for CIT and malate (MAL) in skin. Titratable acidity (TA) concentration varied on average from less than 5 g·L−1 (of malic acid) in both pulp and skin in 'BO06603111' to over 20 g·L−1 in 'Pricia'. TA distribution was slightly skewed towards moderate-to-high levels in pulp, a similar average content in skin (around 12 g·L−1), and yearly correlations from 0.66 to 0.75 between the two fruit tissues (Supplementary Fig. S3a). Across years, TA correlation ranged from 0.64 to 0.83 in pulp and from 0.63 to 0.66 in skin, suggesting a moderate consistency. MAL and CIT were the most abundant OAs, exhibiting a wide range of concentrations and a consistent pattern between pulp and skin (ρ range 0.43−0.85) in each year (Supplementary Fig. S3b & c). In pulp, CIT varied from 1.32 to 14.4 mg·mL−1 in 'Amabile Vecchioni' and 'Gilgat', while MAL from 1.95 to 20.83 mg·mL–1 in 'Gilgat' and 'Bora'. Also, the balance between MAL and CIT (MCratio) was highly differentiated among accessions, being quite stable over the three harvesting seasons; most accessions showed ratios in the range of 1.44–2.40 in pulp and of 1.6−3.21 in skin (Supplementary Fig. S3d). Apart from succinate (SUC), ranging from 0.44 to 0.21 mg·mL−1, abundance of others OAs was lower, some of them only present in trace amount and/or undetectable (Supplementary Table S2). Best Linear Unbiased Predictors (BLUPs) were estimated to account for seasonal effects on acidity-related traits. As shown by Spearman's correlation coefficients, TA levels were highly correlated with total OA contents (Fig. 1a). Additionally, a significant negative correlation was observed between TA and the maturity date (MD) (−0.54 and −0.43). The decrease of TA levels along the maturity calendar is particularly evident when dividing accessions into 10-d harvesting intervals (Fig. 1b). Only CIT content was moderately correlated to TA level in both pulp and skin (0.51 and 0.57, respectively) while MCratio seemed largely independent from TA.
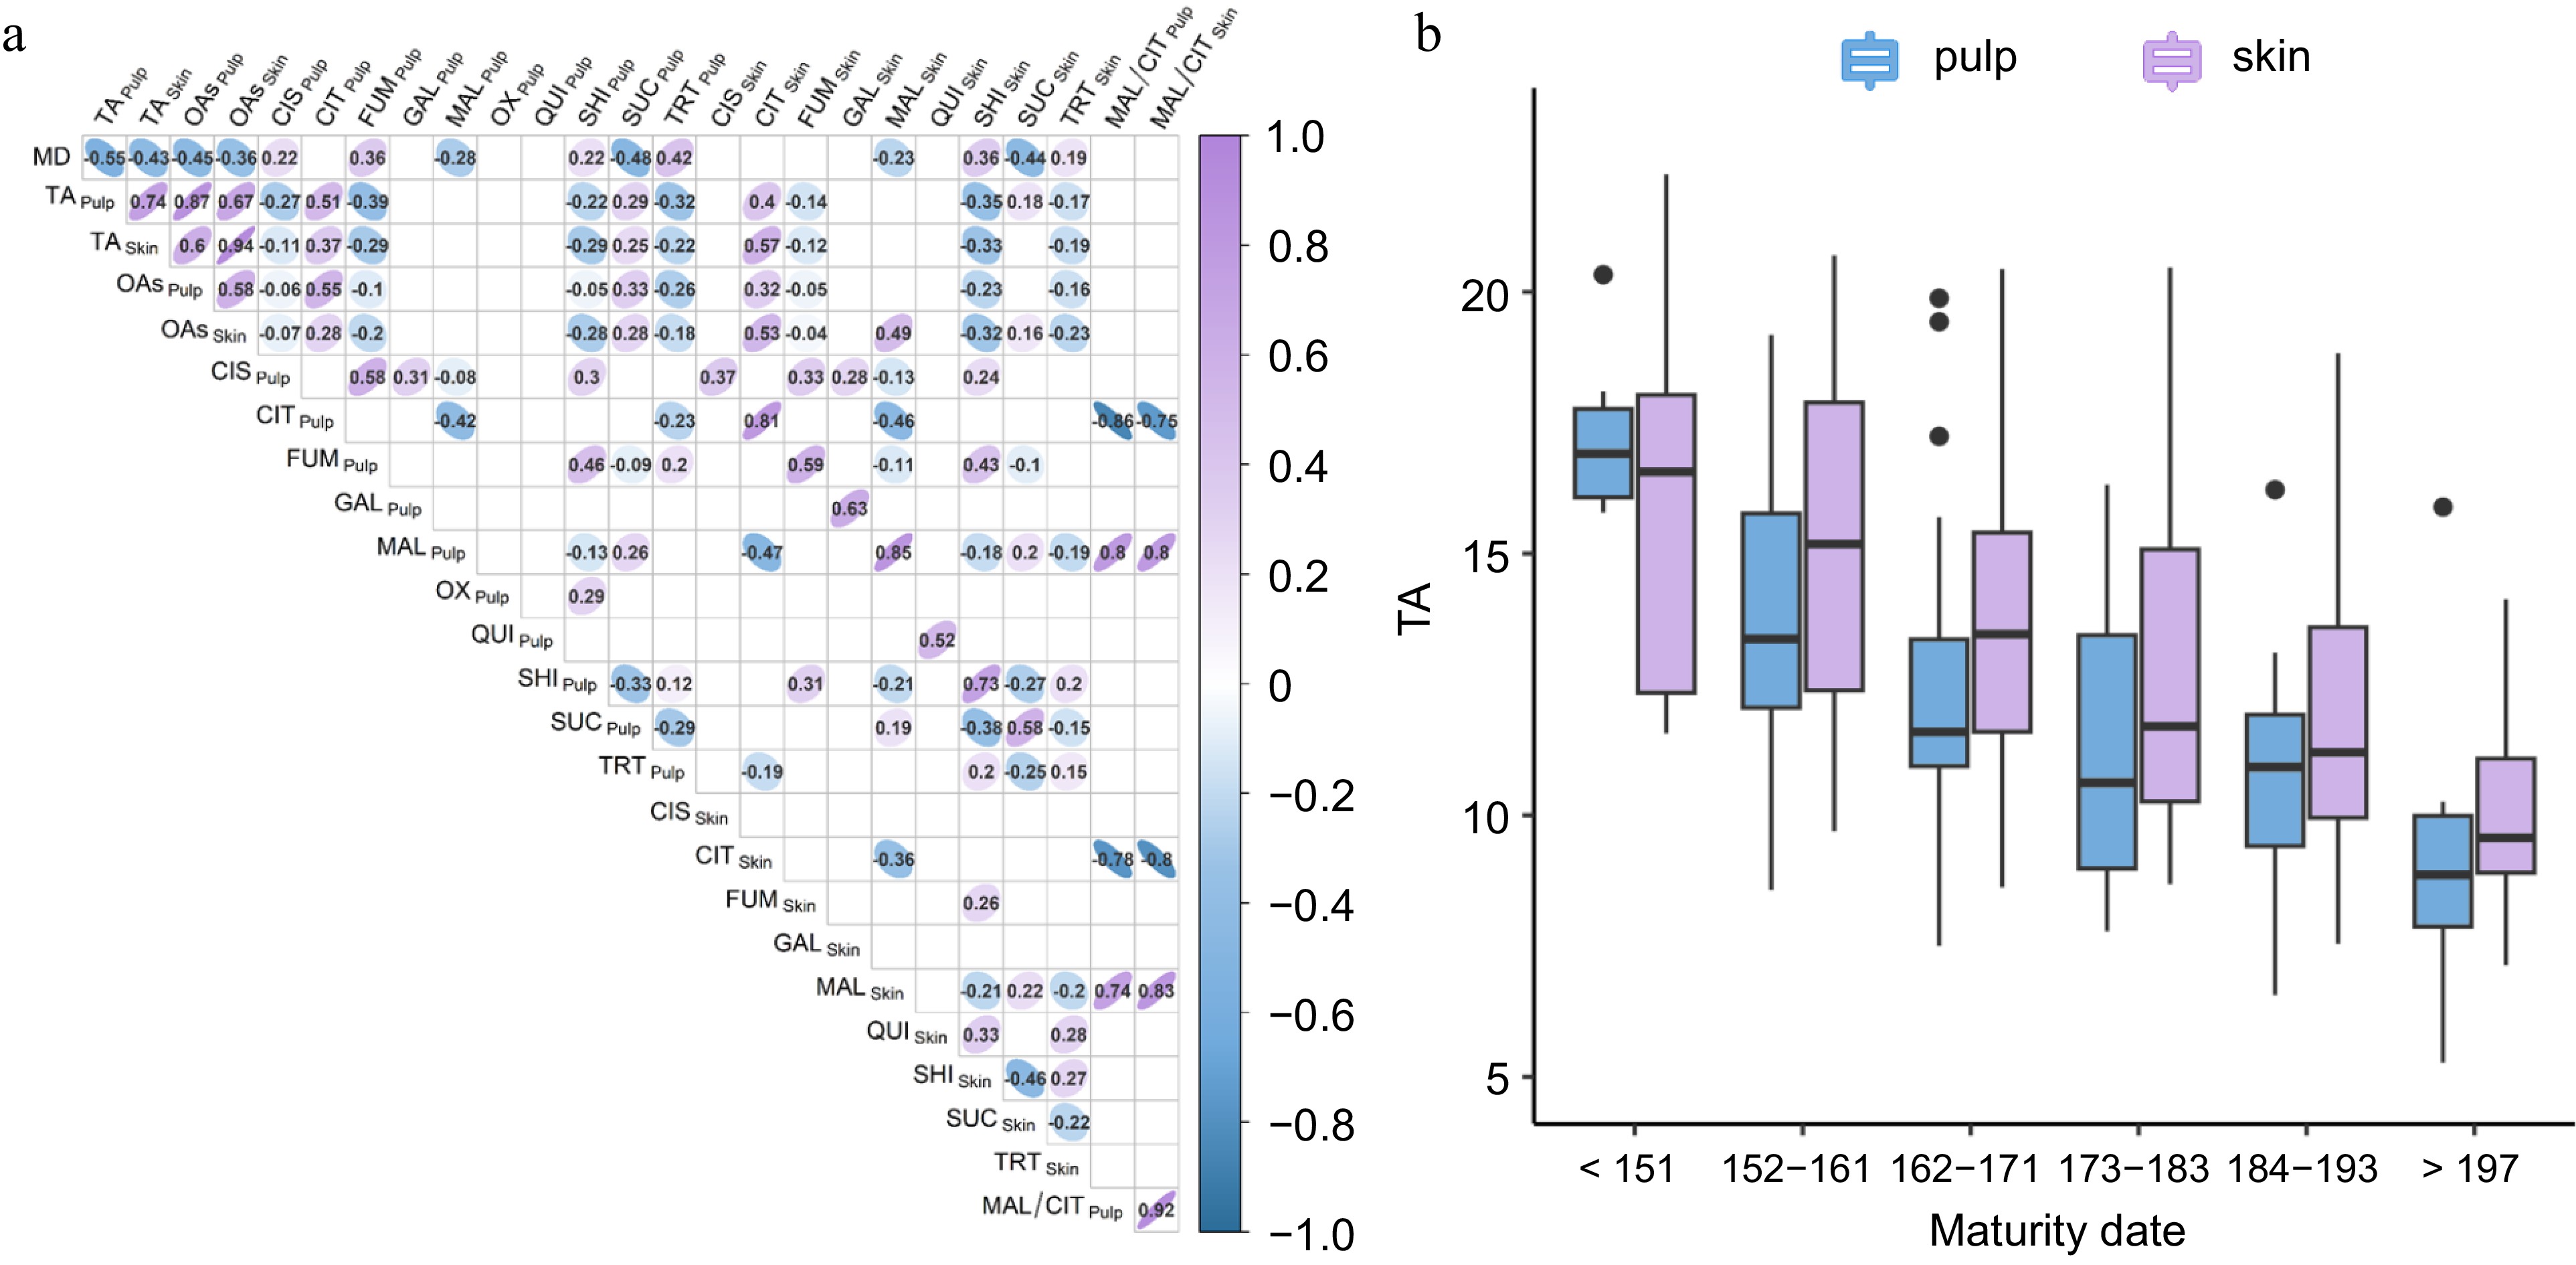
Figure 1.
(a) Spearman's correlation coefficient between TA and organics acids contents in pulp and skin in the analysed apricot set; (b) Variation of TA content in fruit pulp (light blue) and skin (violet) across 10-d harvest windows. Abbreviations: MD, maturity date; TA, titratable acidity; OAs, total content of the ten organic acids; CIS, cis-aconitate; CIT, citrate; FUM, fumarate; GAL, galacturonate; MAL, malate; OX, oxalate; QUI, quinate; SHK, shikimate; SUC, succinate; TRT, tartrate.
Principal component analysis (PCA) identified two distinct genetic clusters with admixed accessions occupying central positions (Supplementary Fig. S4). The first two PCs (Dim1 and Dim2) accounted for 31.8% of the total observed variability in TA level and OAs content. In general, population structure did not appear to influence acidity traits, although TA, MAL and CIT were oriented towards two different PCA quadrants, negatively contributing to Dim1. Interestingly, accessions (such as 'Goldrich' and 'Pricia') with larger TA levels and OAs contents belonged to the Q1 cluster, also sharing PPV-resistance and earliness of ripening. Two accessions were positioned outside their membership groups: 'BO92618086' (Q2) and 'Bora' (Q1), as respectively characterized by very high SHK and MAL content both in fruit pulp and skin.
GWA analysis for malate, citrate, and their balance in apricots pulp and skin
-
Significant SNPs (above Bonferroni's correction threshold) associated with acidity-related traits identified by different Genome-wide-association (GWA) models on BLUP data are summarized in Table 1.
Table 1. Summary of SNPs associated to BLUP of fruit acidity-related traits in the apricot accessions panel.
SNP Chr* Position (bp)* p-value Trait Fruit tissue Best model SNP12585 1 15,342,498 3.56E-06 TA Pulp FarmCPU SNP14038 1 20,961,590 6.62E-06 TA Skin FarmCPU, MLMM SNP22411 1 38,691,257 1.30E-06 CIT Skin Blink SNP23067 1 40,962,943 1.02E-13, 3.70E-08 MCratio Pulp, skin Blink SNP37816 2 482,379 1.79E-09 GAL Skin Blink SNP38501 2 4,306,256 1.58E-07 QUI Skin Blink SNP39168 2 11,017,000 9.01E-16 OX Pulp FarmCPU SNP39549 2 13,211,197 1.10E-08 QUI Skin Blink SNP40618 2 17,447,353 3.38E-10 FUM Skin Blink SNP40835 2 18,090,890 1.10E-06 TA Pulp FarmCPU SNP41430 2 19,296,508 3.82E-06 TA Skin FarmCPU SNP41753 2 20,477,404 6.85E-07 MAL Skin MLMM SNP42290 2 22,156,402 3.71E-07 MCratio Pulp, skin Blink SNP42444 2 22,474,569 2.70E-10 CIT Skin Blink SNP42515 2 22,628,715 1.14E-09 CIT Pulp Blink SNP42730 2 23,081,253 2.53E-06 MAL Pulp MLMM SNP35941 3 20,241,635 7.30E-09 TA Pulp FarmCPU SNP36441 3 22,026,005 1.11E-08 TA Skin Blink SNP25460 4 10,712,890 1.22E-06 TA Pulp FarmCPU SNP25558 4 11,398,395 1.69E-08 TA Skin Blink SNP29553 4 23,963,190 1.60E-10 OX Pulp FarmCPU SNP53375 5 10,674,138 4.40E-07 GAL Skin Blink SNP54563 5 13,222,476 1.87E-15 QUI Pulp MLMM SNP54563 5 13,222,476 8.95E-27, 1.76E-28 SHK Skin, pulp MLMM, Blink SNP54585 5 13,270,051 2.68E-10, 8.17E-23 QUI, SHK Pulp, skin MLMM SNP55378 5 15,163,890 8.34E-07 OX Pulp FarmCPU SNP56541 5 17,961,164 8.67E-06 MCratio Pulp Blink SNP56292 5 17,426,390 1.25E-09 MCratio Skin Blink SNP4310 6 14,694,019 3.82E-07 CIT Skin FarmCPU SNP4771 6 16,436,115 4.24E-06 CIT Pulp FarmCPU SNP4919 6 16,755,770 6.01E-07, 1.01E-06 MCratio Pulp, skin Blink SNP5129 6 17,093,858 1.15E-08 TRT Skin Blink SNP5234 6 17,428,425 1.81E-06 TA Pulp FarmCPU SNP58520 7 10,229,477 6.83E-08 GAL Skin Blink SNP58781 7 11,025,623 2.68E-10 QUI Pulp FarmCPU SNP59439 7 12,955,009 4.95E-06 TA Pulp Blink SNP59231 7 12,551,007 3.23E-11 SHK Pulp FarmCPU SNP59495 7 13,089,613 2.89E-09 MCratio Skin Blink SNP59575 7 13,367,263 8.17E-23 SHK Skin FarmCPU SNP59768 7 13,778,391 6.42E-06 CIT Pulp FarmCPU SNP59786 7 13,795,723 7.56E-06 CIT Skin Blink SNP60128 7 15,175,420 3.47E-06 MAL Skin MLMM SNP46027 8 3,461,859 1.62E-13 OX Skin FarmCPU SNP46814 8 5,943,907 4.47E-12 CIT Skin FarmCPU, Blink, MLMM SNP46877 8 6,044,576 2.03E-13 MAL Pulp FarmCPU, Blink, MLMM SNP46906 8 6,193,099 2.09E-10 MAL Skin FarmCPU, Blink, MLMM SNP46961 8 6,316,393 2.93E-16, 8.00E-14 MCratio Pulp FarmCPU, Blink, MLMM SNP47073 8 6,524,584 1.90E-16 CIT Skin, pulp FarmCPU, Blink, MLMM *Genome coordinates referred to the apricot genome reference assembly of 'Chuanzhihong' cultivar genome[61] recalibrated based on the linkage group of Prunus reference map[91]. Regarding main apricot fruit OAs (CIT, MAL, and MCratio), the cumulative heritability estimated using the GCTA algorithm ranged from 0.68 and 0.60 for CIT, 0.63 and 0.61 for MAL, and 0.94 and 0.89 for MCratio, respectively in pulp and skin. Association analyses (GWAS) identified signals on chromosome (chr) 1, 2, 4, 5, 6, 7, and 8, although not all stable across seasons (Fig. 2, Supplementary Fig. S5 & Supplementary Table S4). The most stable loci were found on chr 2 and 8, bearing a cluster of multi-trait signals present in both pulp and skin. The highest p-values were observed for a hotspot on chr 8 (named qMCr8.1), hosting closely positioned signals spanning about 0.7 Mb (from 5,943,907 to 6,524,584 bp) associated with CIT (SNP46814 and SNP46961), MAL (SNP46877 and SNP46906) and MCratio (SNP47073). Similarly, a QTLs cluster on chr 2 (qMCr2.1) was identified in a 2.7 Mb region (20,477,404−23,081,253 bp) associated to CIT, MAL, and MCratio in both. Analysis of linkage disequilibrium (LD) around qMCr8.1 region showed two adjacent blocks with moderate LD levels and several haplotype blocks (Supplementary Fig. S6), while the pattern was less clear for qMCr2.1 (Supplementary Fig. S7). A quantile regression was fitted for identifying SNPs with the highest pseudo-r-squared and for an approximate estimation of the percentage of explained phenotypic variance (PEV). At qMCr8.1, allelic variation at SNP46961 (at 6,316,393 bp) showed a Mendelian-like effect, explaining a large percentage of variation across tissues, from 52%−47% for MCratio to 42%−29% for CIT and 32%−34% for MAL, respectively (Fig. 3). The frequency of minor allele 'T' was associated with a decrease of CIT and an increase of MAL content (and consequently of MCratio). At qMCr2.1, the highest pseudo-r-squared were observed for three SNPs, respectively associated with CIT (SNP42515), MAL (SNP41746) and MCratio (SNP43076). PEV varied from 14% to 12% for MCratio, 11%−12% for CIT and 13%−10% for MAL in pulp and skin. The pattern was similar across seasons, albeit the effect appeared as non-additive.
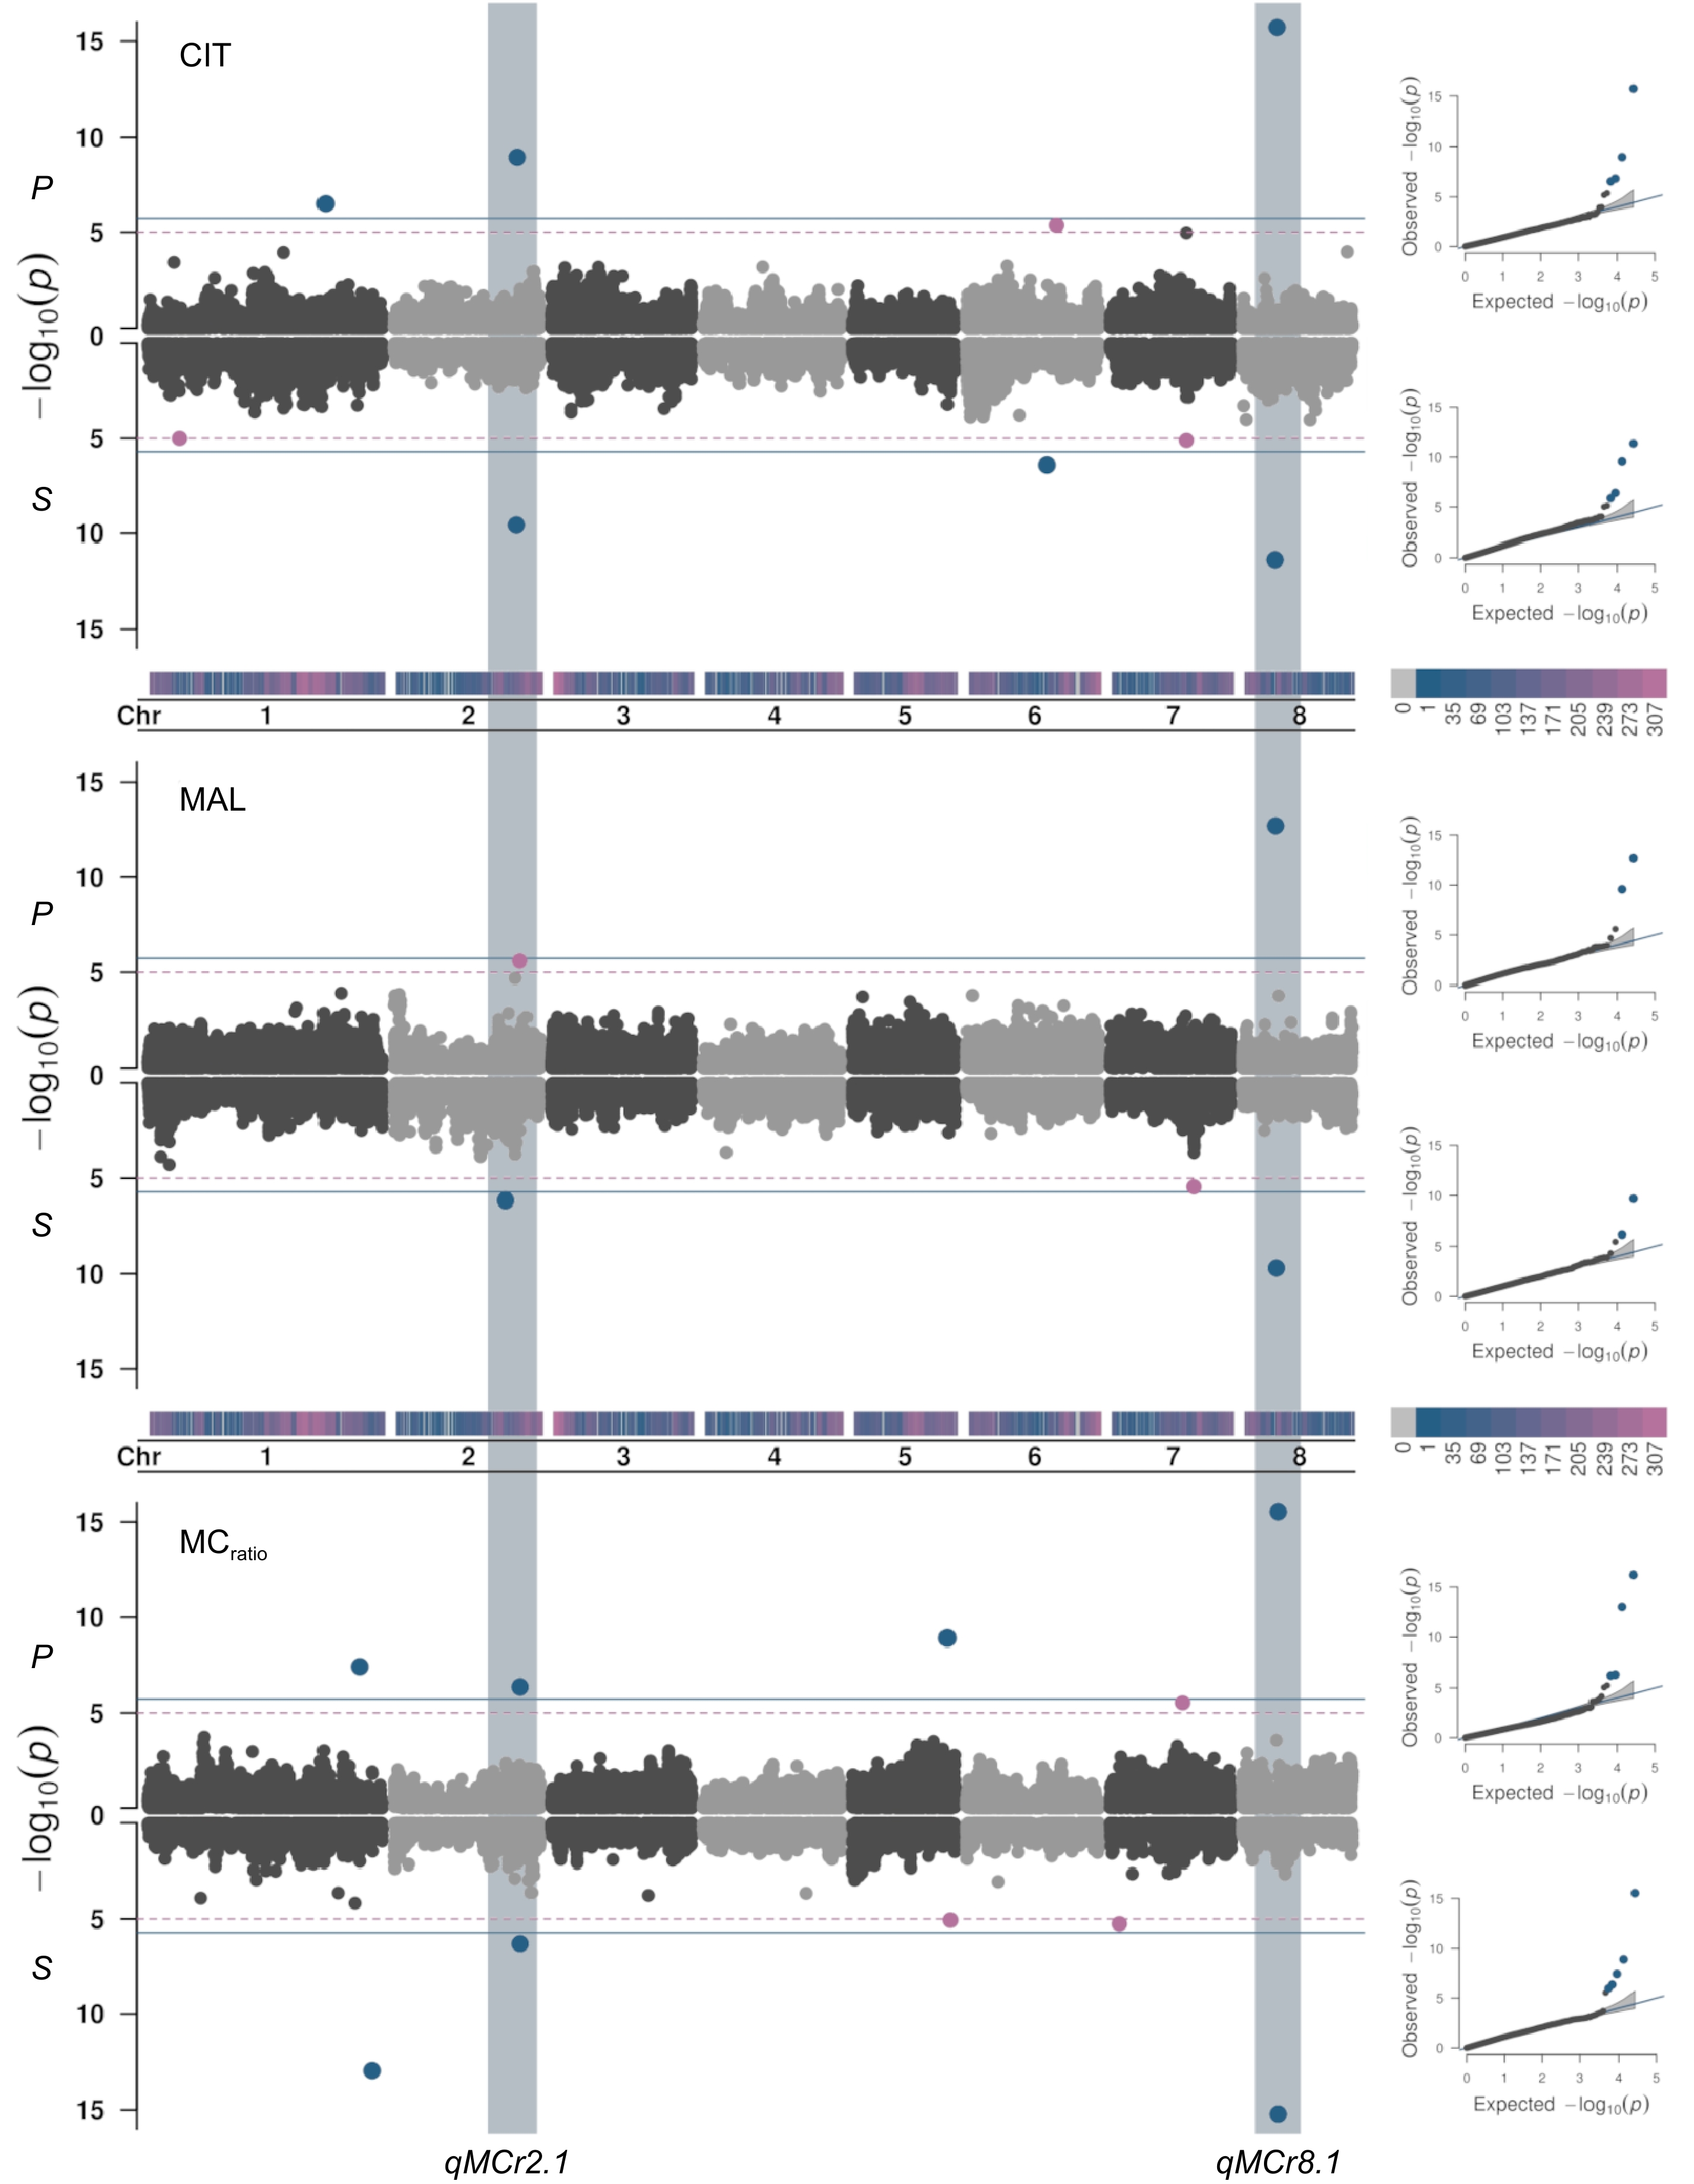
Figure 2.
Manhattan and QQ-plots (right panel) estimated from BLUPs of citrate (CIT, mg·mL−1), malate (MAL, mg·mL−1) and malate/citrate ratio (MCratio) in fruit pulp (P) and skin (S) combining Blink, FarmCPU, and MLMM models (see Table 1 for signals common or specifics of each model) adjusted for population structure (Q = 2) in the apricot panel of 131 accessions. The continuous horizontal line indicates the Bonferroni's adjusted-threshold for a type one error rate of 0.05 based on the effective number of independent tests (1.86E-06), while dashed line corresponds to the permutation test (1.14E-05). Main associated loci were identified on chr 2 (qMCr2.1) and chr 8 (qMCr8.1), hosting a cluster of multi-trait signals controlling CIT and MAL content, and MCratio in both pulp and skin.

Figure 3.
Boxplots of the marker-trait association of significant SNPs at qMCr2.1 (SNP42515, SNP41746, and SNP43076 on chr 2) and at qMCr8.1 (SNP46961 on chr 8) loci with the content of citrate (CIT, mg·mL−1) and malate (MAL, mg·mL−1), and malate/citrate ratio (MCratio) using seasonal and BLUP data in the germplasm panel. Letters and asterisks indicate significant differences between classes (p < 0.01) as inferred by one-way ANOVA (CIT and MAL) or Kruskal-Wallis rank-sum test (MCratio).
GWA analysis for titratable acidity in apricot pulp and skin
-
Signals associated with BLUP of TA levels were identified on chr 2, 3, and 4 while those on chr 1, 6, and 7 were only detected in pulp (Fig. 4). Most of them were unstable across seasons and some did not co-localize with those for main OAs. Cumulative heritability explained by GWAS loci was moderate, 0.61 and 0.63 respectively for pulp and skin. Across-years, stable loci were only observed on chr 3 (qTA3.1) and 4 (qTA4.1). At qTA3.1, SNP35941 (at 18,989,703 bp) for pulp and SNP36328 for skin (at 21,600,578 bp) showed the strongest association (p-value of 7.30E-09 and 1.11E-08, respectively) spanning a region of about 1.8 Mb with a rather complex LD pattern (data not shown). On average, PEV of SNP36328 and SNP35604 varied from 32% in skin to 25% in pulp, although significance was affected by season (Fig. 4). At qTA4.1, two strongly linked markers SNP25460 and SNP25558 were associated to pulp and skin TA levels and included in a large LD region spanning about 2.0 Mb (Supplementary Fig. S8). On average, PEV varied from 20% in skin to 32% in pulp, even if affected by season. SNP25460 also co-localizes with a major QTL for MD[42], as expected from the correlation between MD and TA levels. For the other signals, differences were less evident and significance was affected by year-to-year variability: qTA2.1, close to qMCr2.1 locus, with a PEV of 17% to 19% respectively for SNP41612 (skin) and SNP42454 (pulp), while PEV for qTA6.1 ranged from 9% to 16% for SNP5137 (Supplementary Fig. S9).
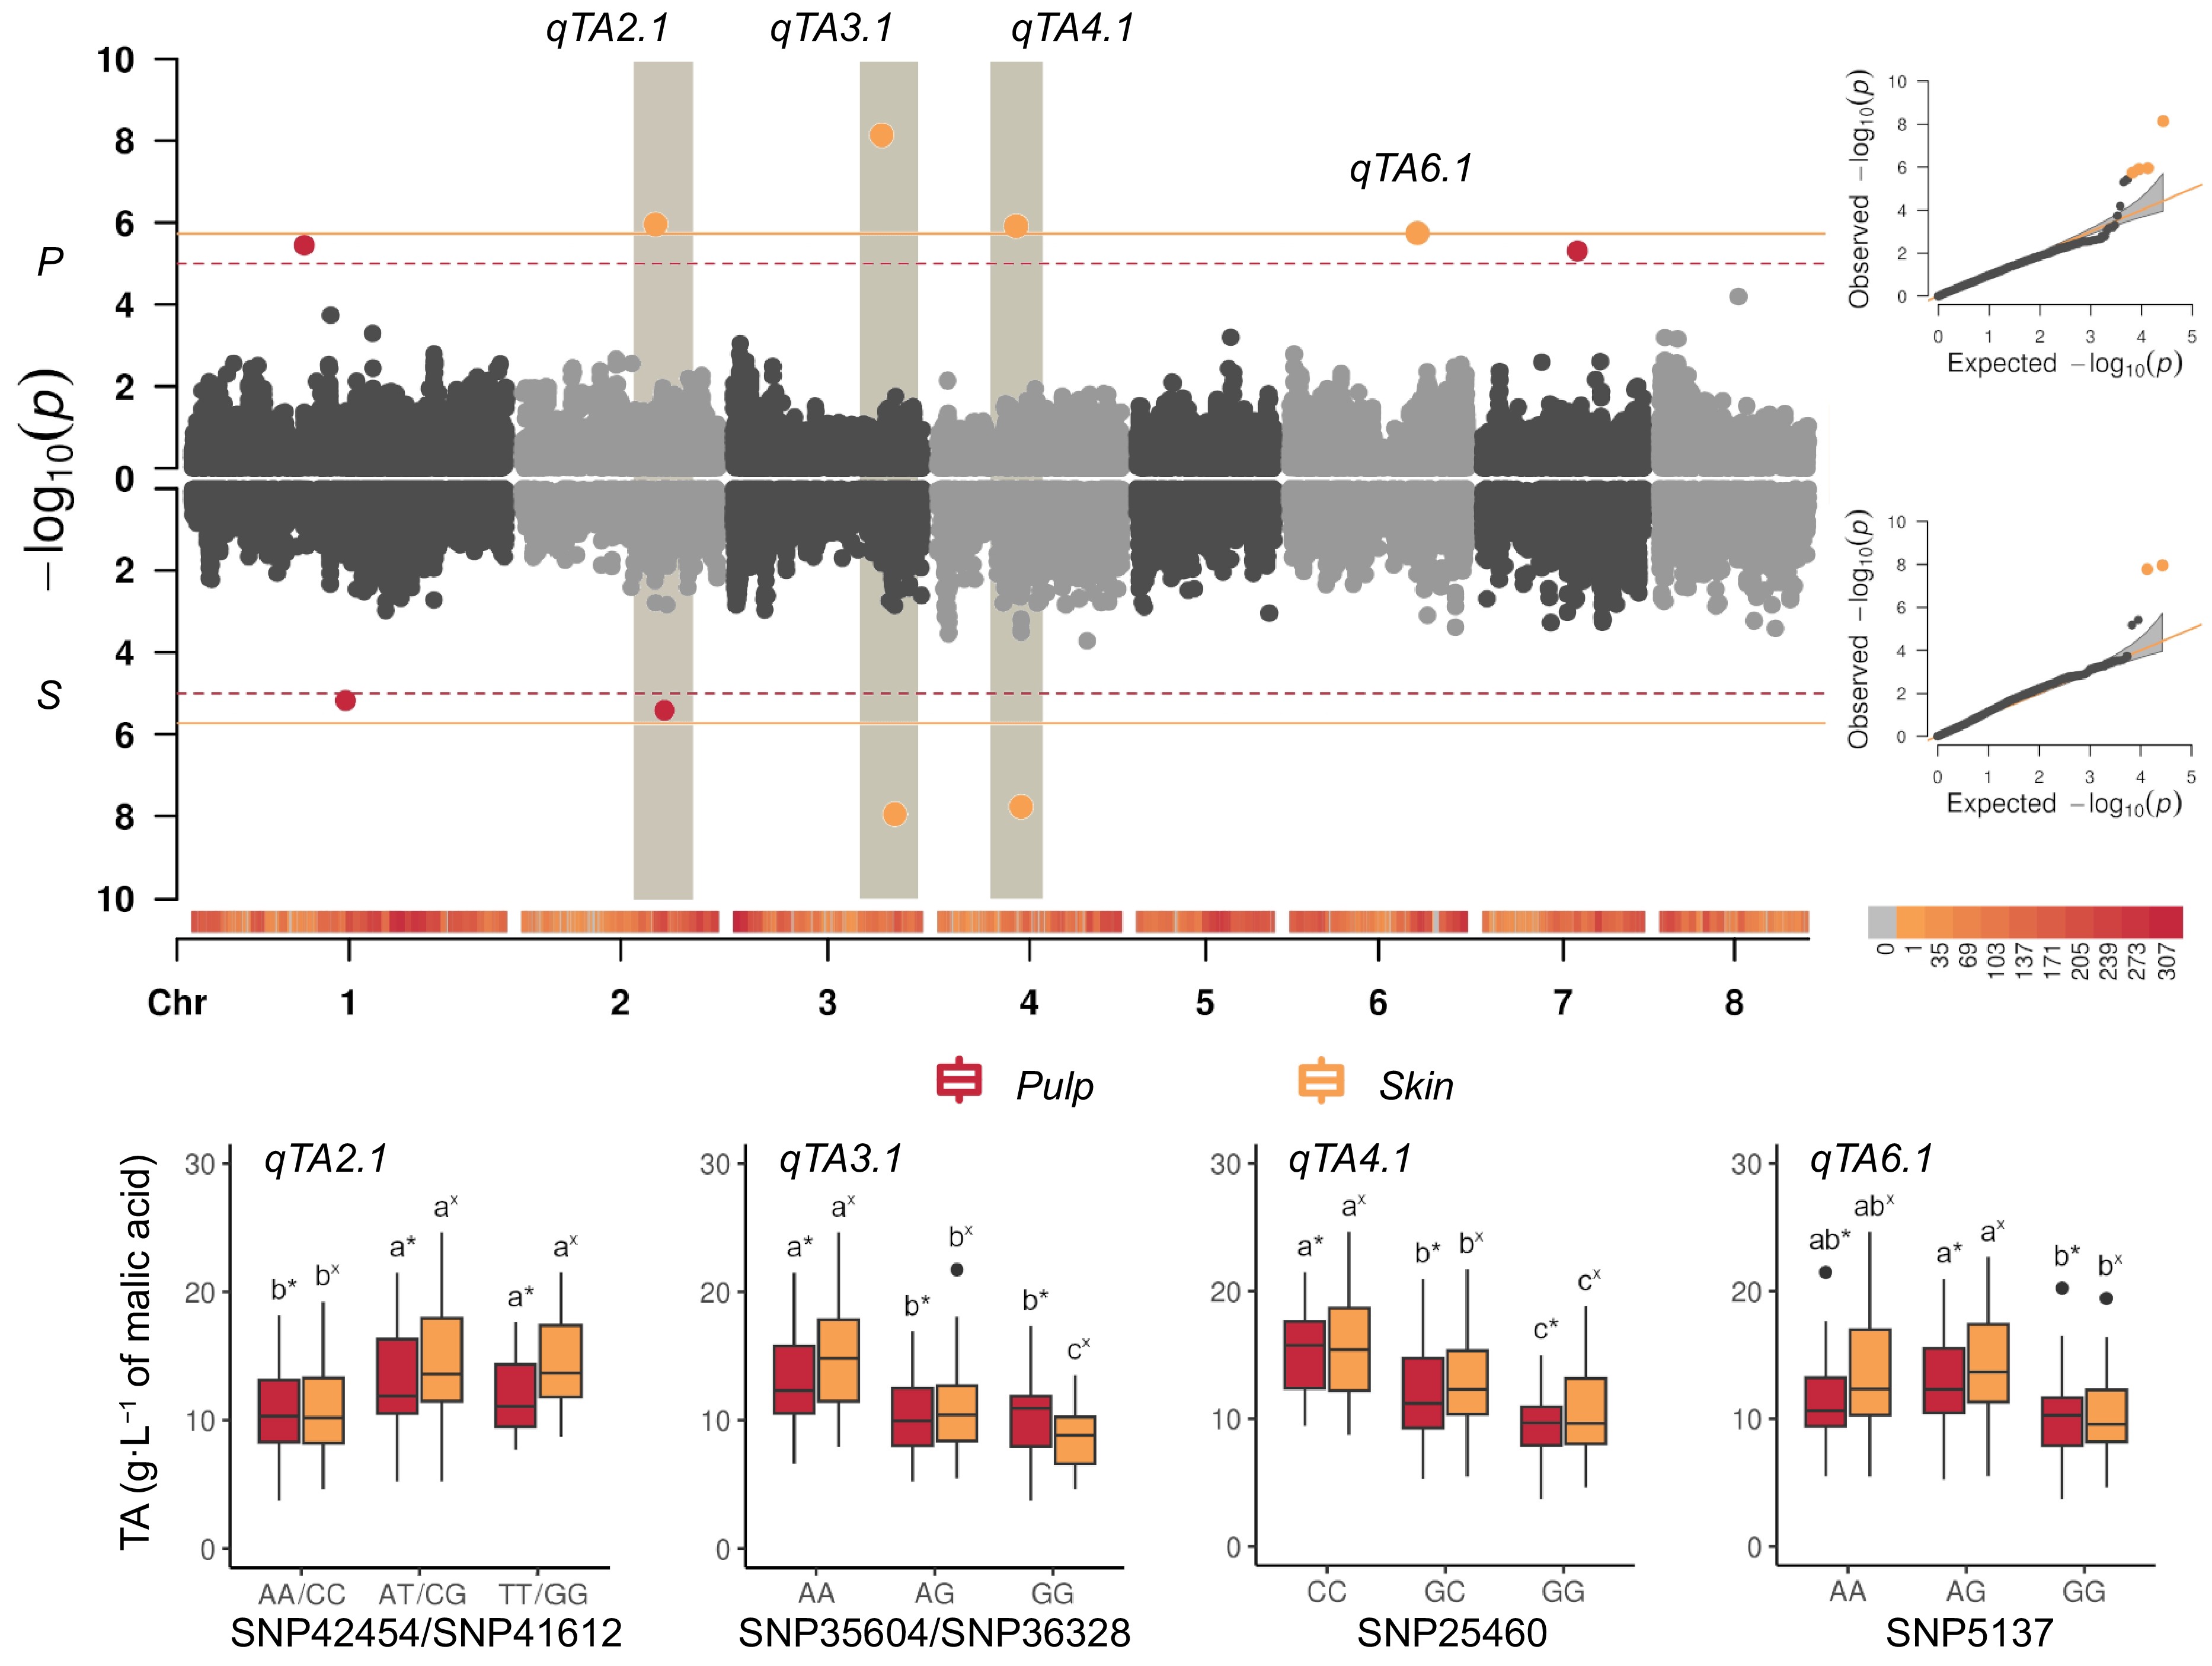
Figure 4.
(a) Manhattan and QQ-plots (right panel) estimated from BLUPs of titratable acidity (TA, in g·L−1 of malic acid) in fruit pulp (P), and skin (S), combining Blink, FarmCPU, and MLMM models (see Table 1 for signals common or specifics of each model) adjusted for population structure (Q = 2) in the apricot panel of 131 accessions. The continuous horizontal line indicates the Bonferroni's adjusted-threshold for a type one error rate of 0.05 based on the effective number of independent tests (1.86E-06), while dashed line corresponds to the permutation test (1.11E-05). Main signals were detected on: chr 3 (qTA3.1), peaking at SNP35941 (~18.9 Mbp) and SNP36328 (~21.6 Mbp) in pulp and skin, respectively; on chr 4 (qTA4.1) peaking at SNP25460 (~10.7 Mbp) and SNP25558 (~11.4 Mbp); on chr 2 (qTA2.1) peaking at SNP40835 (~18.1 Mbp) and SNP41430 (~19.2 Mbp, close to qMCr2.1 locus); on chr 6 (qTA6.1) peaking at SNP5234 (~17.4 Mbp) only in pulp tissue. (b) Boxplots of the marker-trait association of SNPs explaining highest PEV for titratable acidity (TA, expressed as g·L−1) identified in the LD region around qTA2.1 (SNP425454 and SNP41612, respectively in pulp and skin), qTA3.1 (SNP35604 and SNP36328), qTA4.1 (SNP25460) and qTA6.1 (SNP5137) in the germplasm panel. Letters and asterisks indicate significant differences between classes (p < 0.01) as inferred by one-way ANOVA.
GWA analysis for TCA and non-TCA cycle organic acids
-
Among the OAs synthesized through the tricarboxylic acid (TCA) cycle, no significant signals were detected above the Bonferroni's threshold for cis-aconitate (CIS) and succinate (SUC) (Supplementary Fig. S10), despite SUC being the third most abundant OA found in the analyzed panel. A potentially strong effect SNP (SNP40618 with a p-value equal to 3.38E-10) was identified for fumarate (FUM) content in fruit skin and located on chr 2, not far from the qTA2.1 region. For oxalate (OX) content, SNPs were detected on chr 2, 4, and 5 (Supplementary Fig. S10). In skin, a signal peak was identified at SNP46027 on chr 8, though the inflated p-values of QQ-plot suggested potential over-fitting issues in the linear mixed model due to the very low concentrations of this OA. Analyses for non-TCA OAs, such as galacturonate (GAL), quinate (QUI), shikimate (SHK)[74], and tartrate (TRT) revealed significant regions on chr 5 and 7. For instance, SNP54563 on chr 5 was associated to SHK and QUI content in both skin and pulp (Supplementary Fig. S11). Other SNPs were found on chr 2, 5, 6, and 7 for QUI, GAL, and TRT content in skin (Supplementary Fig. S11), but without particular metabolic cross-links with other OAs.
Linkage mapping
-
To provide further confirmation of the major loci associated to acidity-related traits in fruit pulp (CIT, MAL, MCratio, and TA), four F1 bi-parental progenies derived from parents within the accession panel were analysed: 'BO96621030' × 'Harostar' (B1 × H), 'Fiamma' × 'BO93623033' (F × B2), 'Lito' × 'BO81604311' (L × B) (data obtained from Dondini et al.[75]), and 'Goldrich' × 'Moniqui' (G × M) (data obtained from Nsibi et al.[70]). Progenies B1 × H, F × B2, and L × B were genotyped with a Single Primer Enrichment Technology (SPET) array while genotyping-by-sequencing (GBS) markers of G × M were re-positioned on the apricot V1 reference genome[61]. First, a single marker analysis (SMA) was performed for traits TA, MAL, CIT, and MCratio to identify or confirm the presence of novel or previously reported QTLs (Supplementary Fig. S12). In B1 × H, loci above permutation thresholds were identified for TA and CIT content on chr 1 in the B1 parent, while in F × B2 for CIT, TA, and MCratio on chr 6 in the F parent. Previously identified loci on chr 2, 6, and 8 for CIT, MAL, MCratio, and TA were confirmed in L × B and G × M. Linkage maps at these loci were built to further complement information of association mapping.
On chr 8, a major QTL for CIT and MAL was previously positioned in a wide region surrounding the SSR marker UDAp409 on respective L and B parents' maps[75]. A subset of the progenies was genotyped with SPET array to improve marker density and verify the co-localization of this locus within the genomic regions identified by GWAS at qMCr8.1. As deduced from SMA, the segregation of this QTL is coherent with a heterozygous state in both parents, allowing its positioning within a region roughly comprised between 2.0 and 7.8 Mb in the LG/chr 8 integrated map (Fig. 5; Supplementary File 1). Maximum logarithm of odds (LOD) peak values ranged from 6 for MAL to 18 for MCratio, within an interval delimited by markers SNP46532 and SNP47375 (4,576,394 and 7,444,049 bp) which also include the GWAS peaks at the qMCr8.1 locus (Fig. 5). Also, MCratio allowed the easy tracking of informative recombination events to further restrict the mapped interval to about 1 Mb (from 5.46 to 6.55 Mb). Moreover, the haplotypes A and B (from L and B parents, respectively) delimited by SNP46688 and SNP47104 showed a Mendelian-like inheritance, explaining almost all variance for CIT, MAL, and MCratio (r-squared from 0.79 to 0.95), grouping seedlings into three classes (Fig. 6 and Supplementary File 1). In this progeny, qMCr8.1 also slightly but significantly (r-squared up to 0.28) affected overall TA, since individuals with higher absolute CIT content (thus, with lower MCratio) and carrying on the A haplotype also showed higher TA levels (Supplementary Fig. S13).

Figure 5.
QTL mapping of citrate (CIT, in mg·mL−1), malate (MAL, in mg·mL−1), malate/citrate balance (MCratio), and titratable acidity (TA, in g·L−1 of malic acid) in 'Goldrich' × 'Moniqui' (G × M) and 'Lito' × 'BO81604311' (L × B) segregating progenies. Linkage mapping and LOD profiles confirmed the presence of two major loci regulating CIT, MAL, MCratio, and TA on LG2 in 'G × M' (left) and on LG8 in the L × B (right) integrated maps. Markers names are shown in Supplementary File 1.
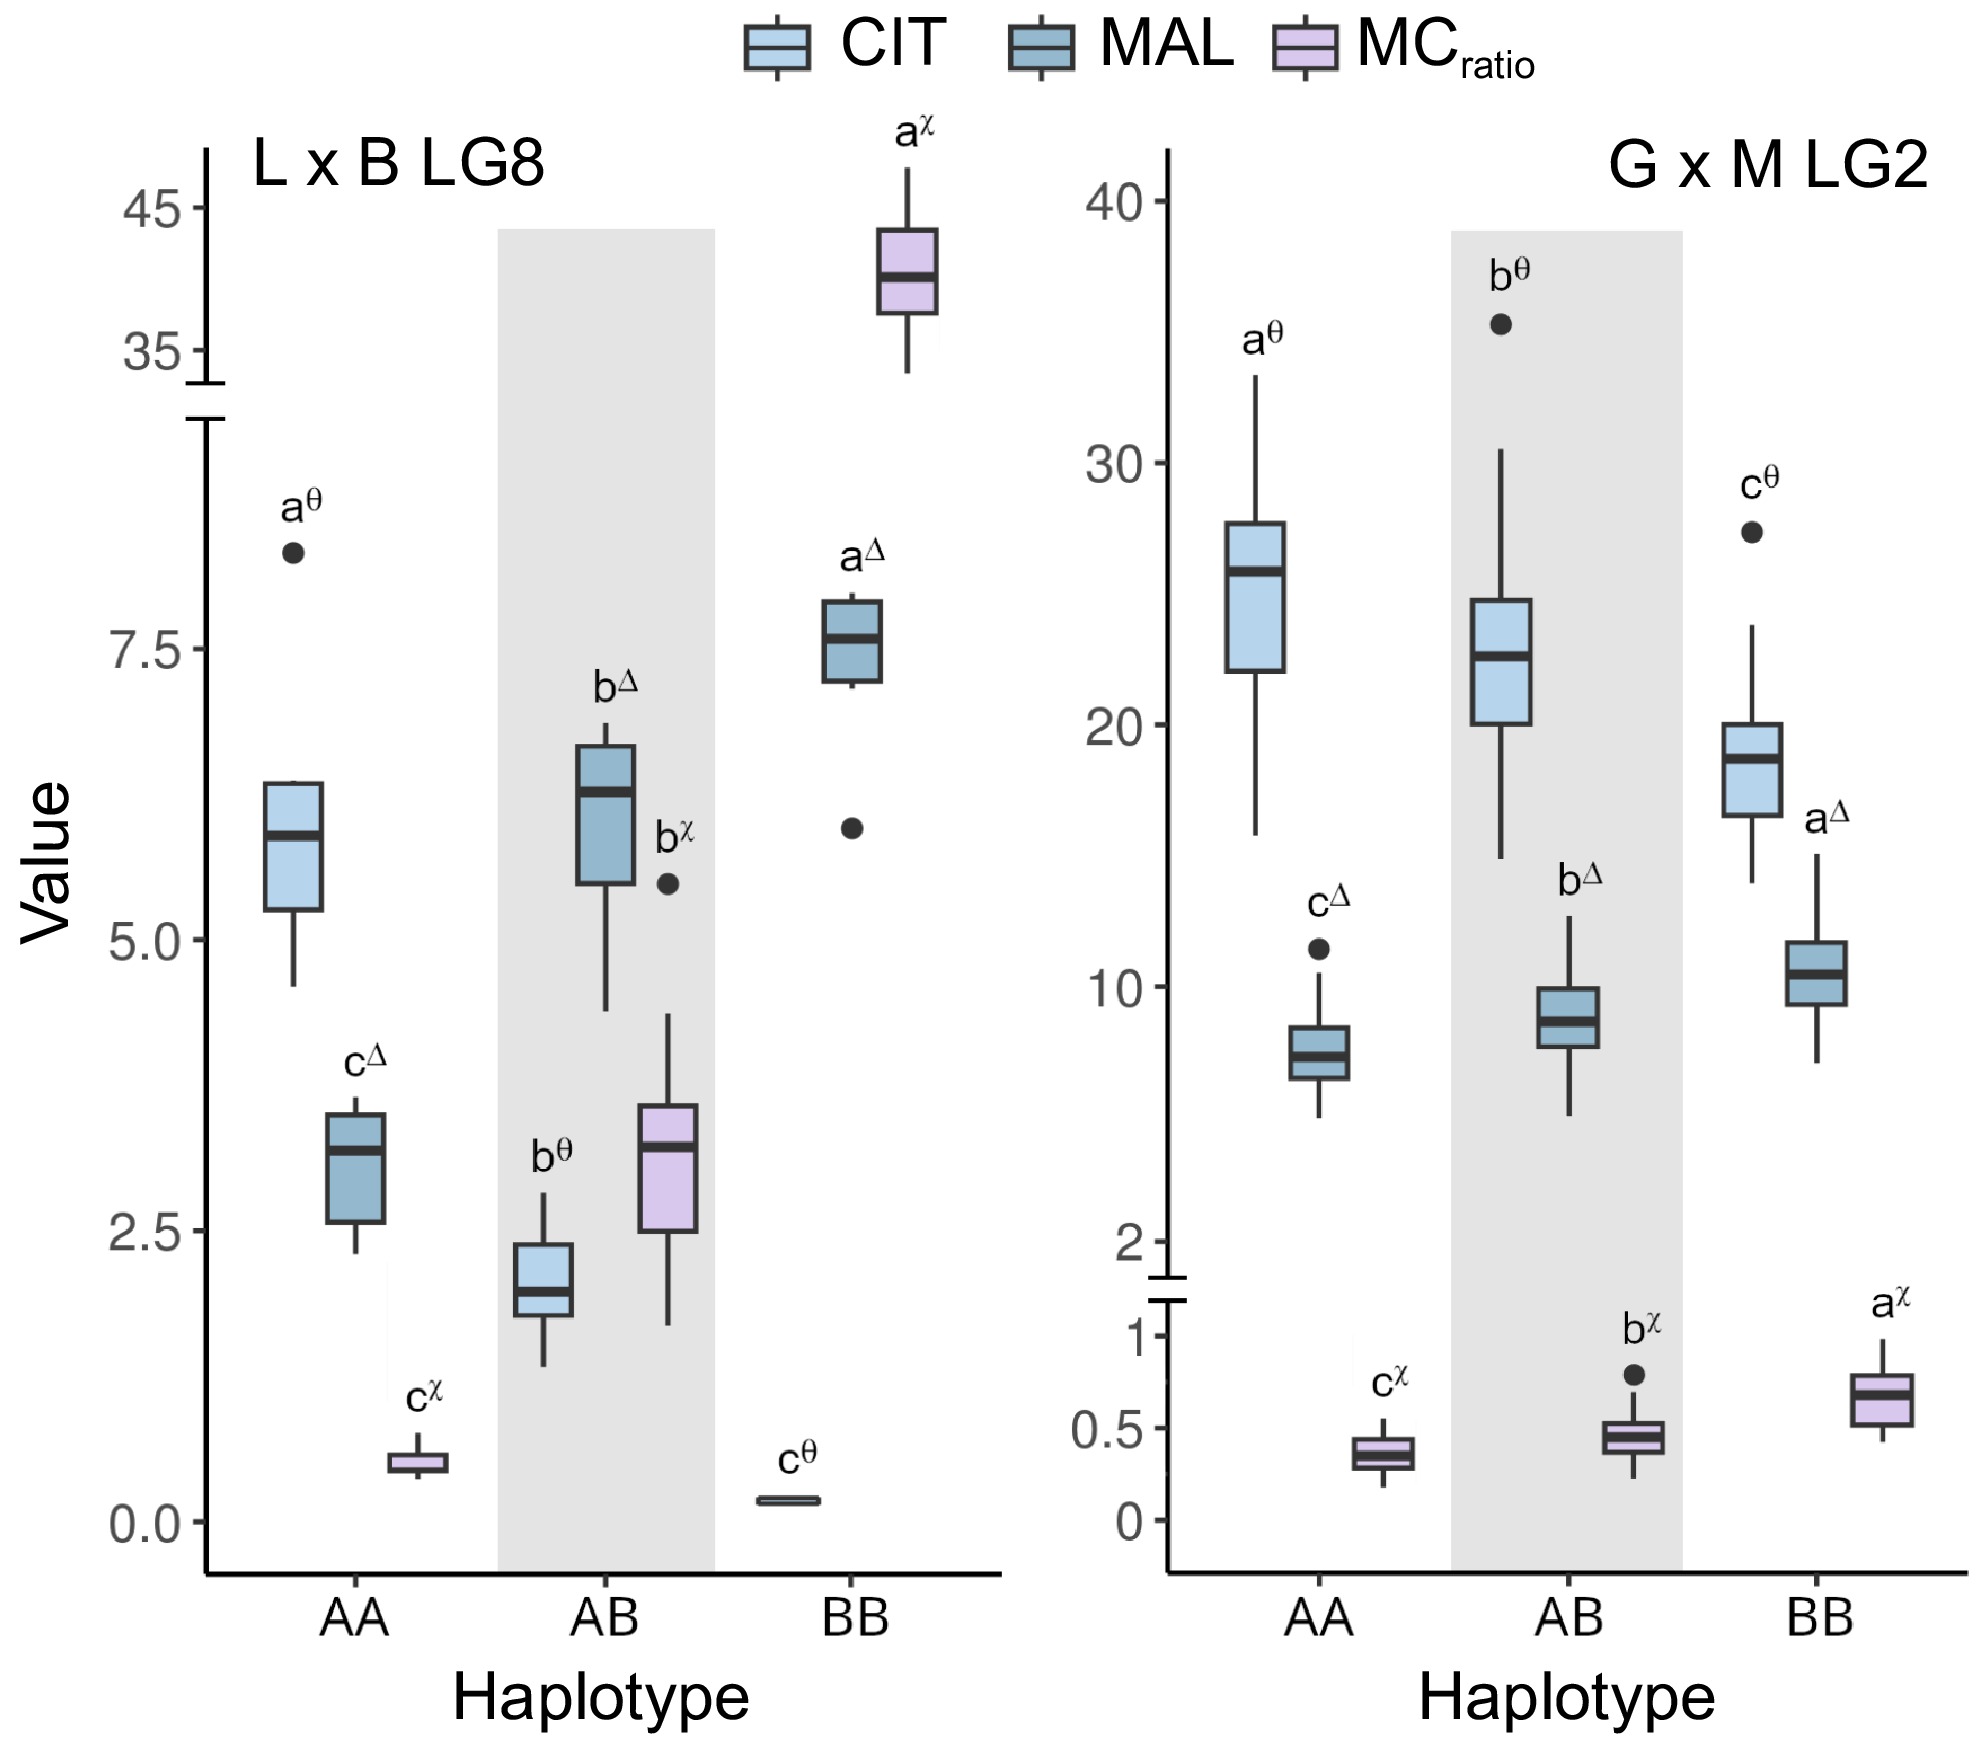
Figure 6.
Boxplots of the associations between haplotypes at qMCr8.1 (LG8) and qMCr2.1 loci (LG2) with citrate (CIT, in mg·mL−1), malate (MAL, in mg·mL−1), and malate/citrate ratio (MCratio). Haplotypes at qMCr8.1 were defined by the fine-mapped interval between markers SNP46688 and SNP47104 in 'Lito' × 'BO81604311' (haplotype A and B, respectively) (right) while haplotypes at qMCr2.1 were delimited by markers Pp02:22857329_T/G and Pp02:26399548_T/A in 'Goldrich' × 'Moniqui' (haplotype A and B, respectively) (left). Letters and asterisks indicate significant differences between classes (p < 0.01) as inferred by one-way ANOVA and SNK test for multiple comparisons. Haplotypes intervals and markers are shown in Supplementary File 1.
Another major QTL for CIT and MAL has been previously located on the LG2 map[70] although anchored on the peach genome[76]. After re-anchoring markers on the apricot reference genome, this QTL was located between 58 and 104 cM in the G × M integrated map, assuming a contribution of both parents to these traits. Maximum LOD fall within the haplotype A and B (from G and M parents, respectively) interval delimited by GBS markers Pp02:22809141 and Pp02:26399548 at about 18.7 and 22.6 Mb (Fig. 5 & Supplementary File 1). Notably, this interval included most GWAS peak markers at qMCr2.1. Haplotype-phenotype association using two-season average data showed r-squared of 0.27 and 0.24 for CIT and MAL, respectively, up to 0.41 for MCratio (Fig. 6). In this progeny, CIT abundance was always higher than MAL (i.e. a ratio < 1.0), in agreement with the presence of 'AA' allelic pattern at qMCr8.1 SNP46961 in both parents (and, thus, no apparent segregation of qMCr8.1). Effects of qMCr2.1 on TA were lower (r-squared of 0.10) and correlated with CIT content. Parents' contribution appeared unclear since only G haplotype segregation appears to affect TA levels (Supplementary Fig. S13).
On chr 6, a QTL cluster for TA was confirmed in G, L, and F parental maps, although extended over wide and only partially overlapping regions (Fig. 7). Mapping resolution was not enough to define a unique haplotype. These QTLs were also linked to variation in CIT content, as particularly evident in F × B2 and L × B. Squared-QTLs effects estimated using LOD-peak markers varied from 0.09 in G × M (Pp06:12455040_G/C at 11,560,617 bp) to 0.15 in F × B2 (SNP4487 at 15,195,450), and 0.24 in L × B (SNP4121 at 13,919,092 bp).
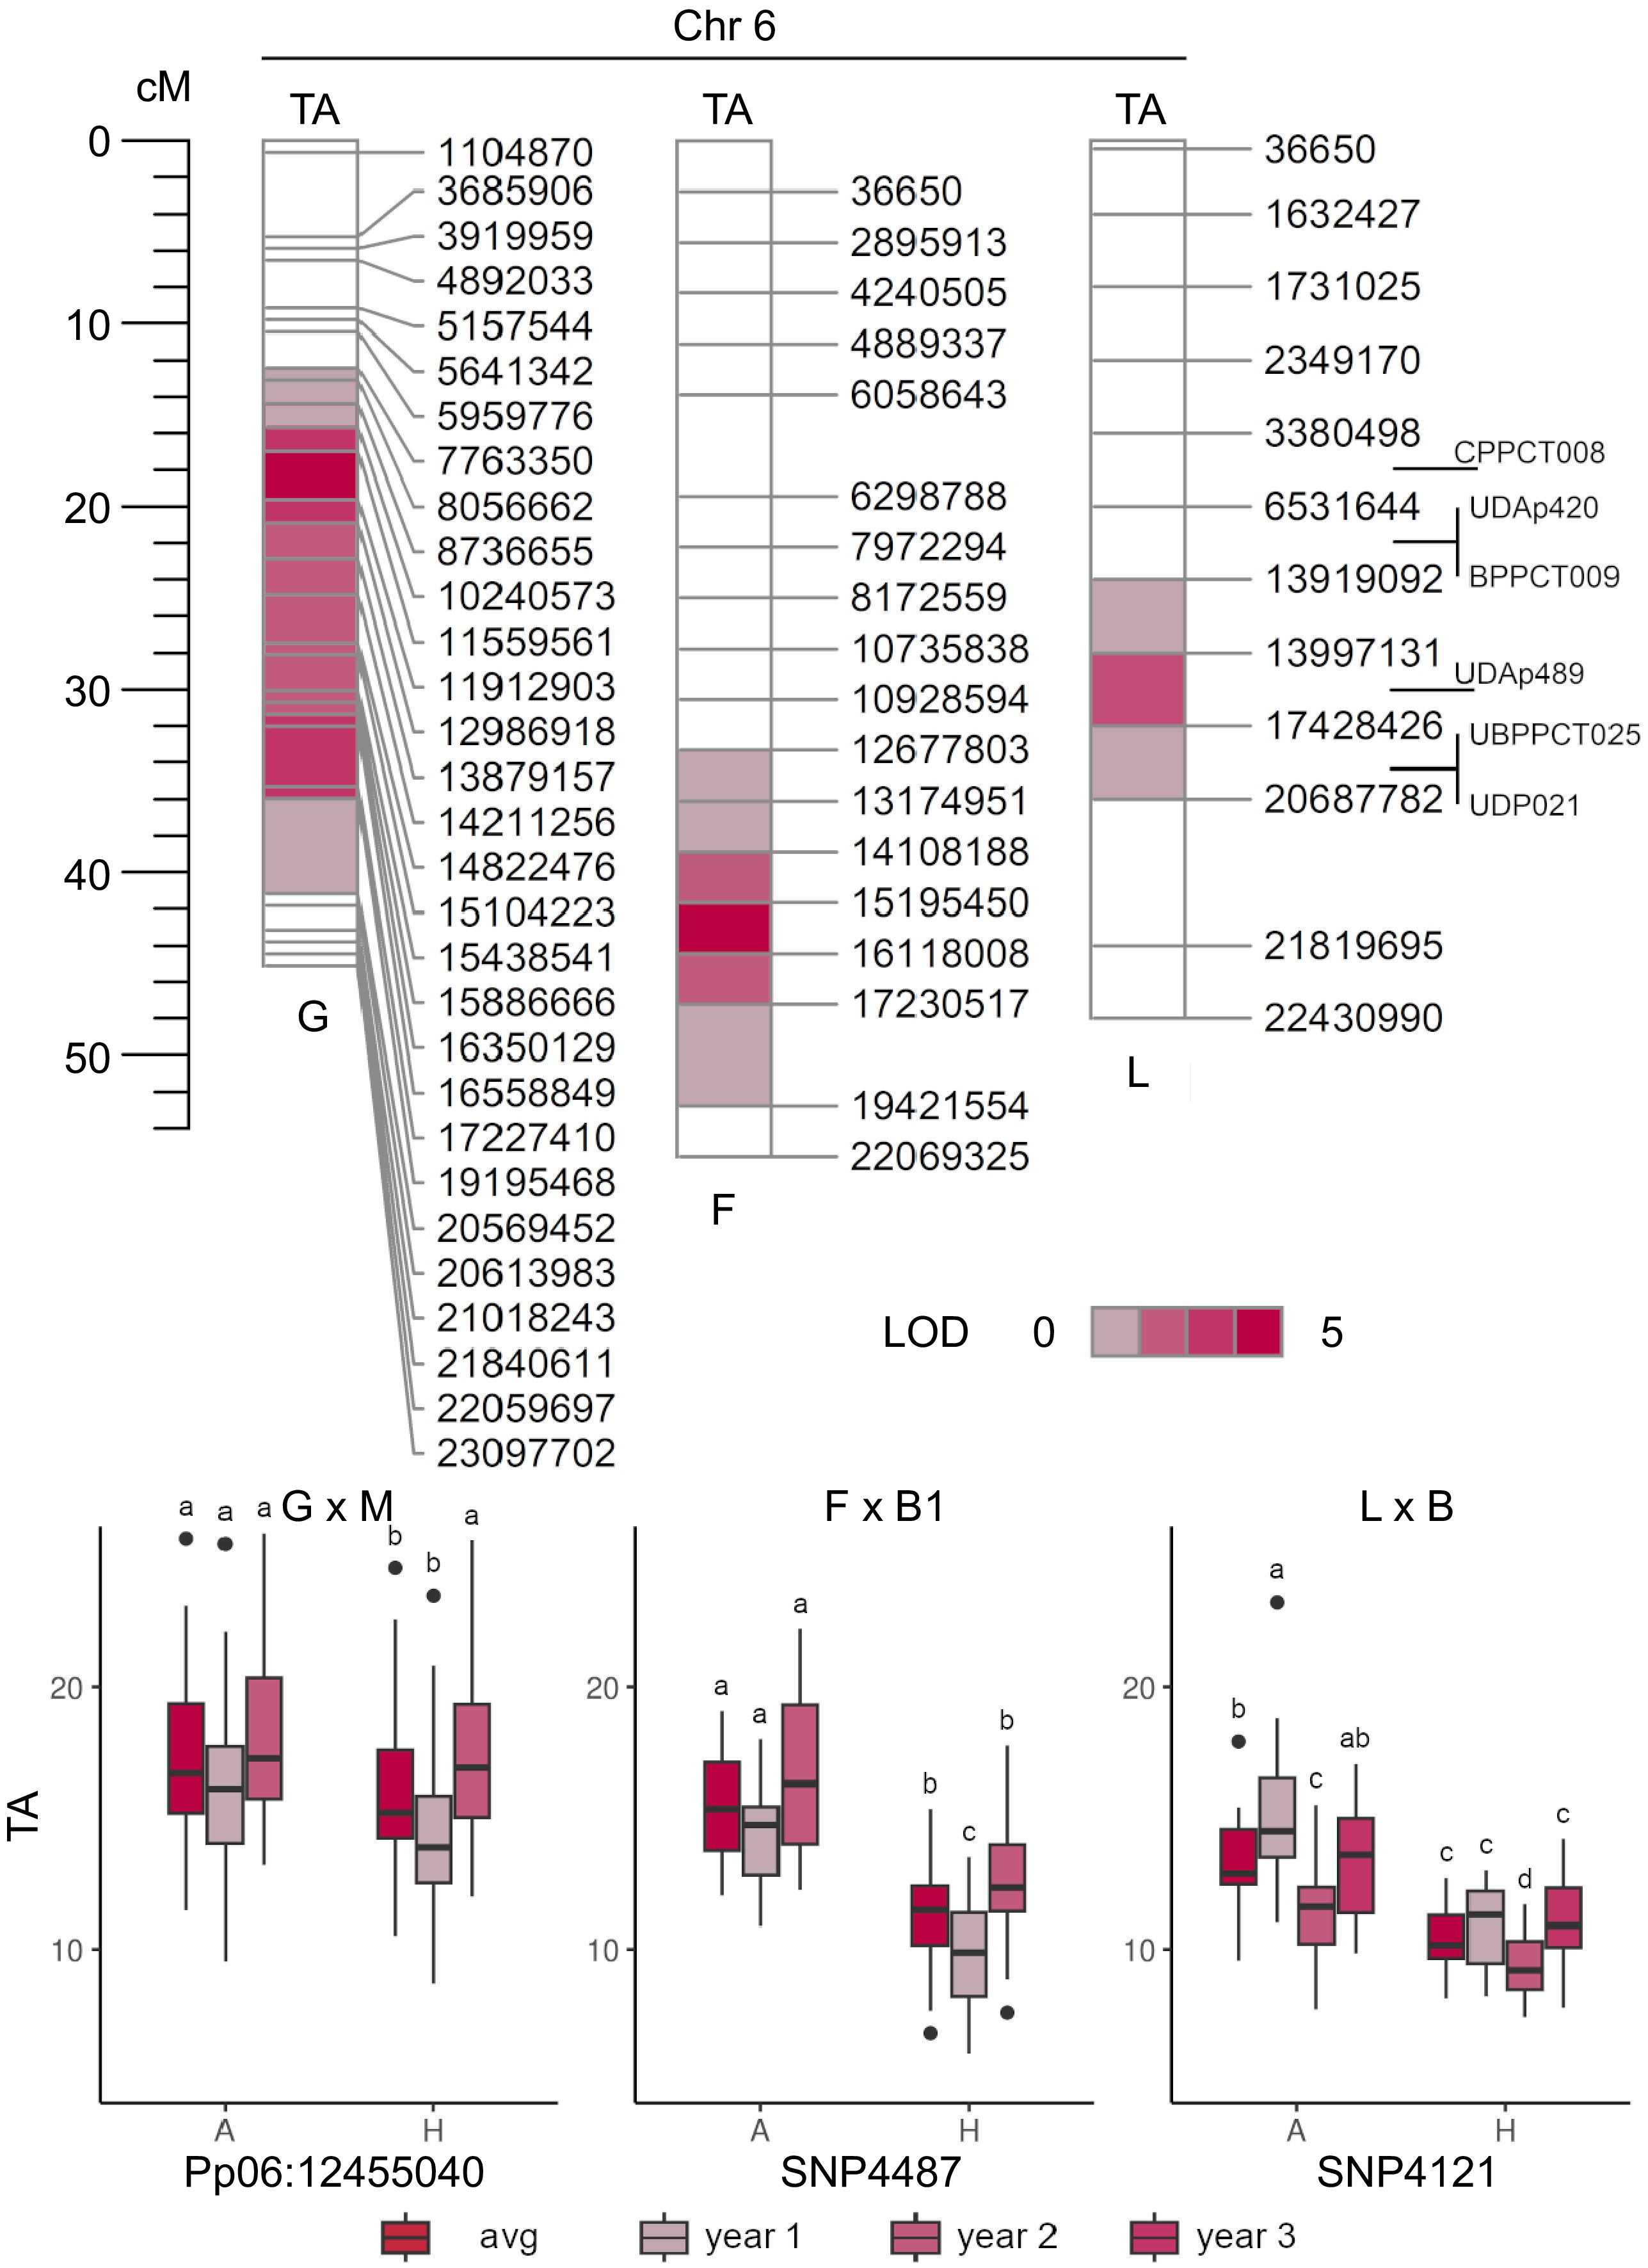
Figure 7.
QTL mapping of titratable acidity (TA, in g·L−1 of malic acid) in 'Goldrich' × 'Moniqui' (G × M), 'Fiamma' × 'BO93623033' (F × B2) and 'Lito' × 'BO81604311' (L × B) segregating progenies showing the presence of minor loci on LG6 (top). Boxplots of the marker-trait associations of LOD-peaks Pp06:12455040 (~11.6 Mbp), SNP4487 (~15.2 Mbp) and SNP4121 (~13.9 Mbp) and TA content in 'Goldrich', 'Fiamma' and 'Lito' parents, respectively (bottom).
Finally, another QTL for both TA and CIT was mapped in B1 × H on LG1 'Harostar' map, in the 2-LOD interval comprised between markers SNP9887 (3,586,038 bp) and SNP10912 (8,155,776 bp) with an LOD peak of 5.8 at SNP10508 (5,806,710 bp). On average, this QTL showed a r-squared of 0.21, although located far from the locus identified by the GWAS, at around 15 Mb (Supplementary Fig. S14).
-
After huge progress in the introgression of Sharka disease (Plum Pox Virus, PPV) resistance and extension of the harvest calendar, improving fruit taste has become a primary objective in apricot breeding programs to sustain fresh consumption[5,8,77−80]. Acidity-related traits (including titratable acidity and organic acids) are pivotal predictors of sourness, strongly affecting the overall palatability and, thus, consumer appreciation[17,26,32,35,38,77,81].
In this study, analyses of an apricot germplasm collection revealed a consistent physiological ripening stage (pulp firmness assessment; Supplementary Table S6) and a huge range of variability for titratable acidity (TA), total organic acids (OAs) content, and profile. Citrate (CIT) and malate (MAL) were confirmed as the most abundant OAs in both fruit pulp and skin, in agreement with previous reports in apricot[26,37,40,82] and also other Prunus species[28,83]. Despite seasonal fluctuations (Supplementary Fig. S15) in absolute concentrations, MAL and CIT profiles showed a consistent qualitative pattern across seasons, with comparable amounts between pulp and skin, suggesting a strong genotype-dependent component. Indeed, apricot accessions showed a rather specific and stable MAL/CIT balance (ranging from about 0.10 to over 20 in terms of MCratio). The variation of MCratio tends to be perceived by panelists and likely contribute to different sensory properties[35]. Seasonal effects were more pronounced on minor OAs, although succinate (SUC), quinate (QUI), and shikimate (SHK), detected in notable concentrations) appeared less sensitive. In peach, QUI content decreases along fruit development and can alter flavor perception over certain quantitative thresholds[27,29,71]. Noteworthy, biosynthesis of QUI and SHK is regulated by the Shikimate pathway through a series of enzymes only partially characterized in fruit species (such as quinate dehydrogenase, dehydroquinate dehydratase, and shikimate dehydrogenase)[84].
As for absolute CIT and MAL content, fruit TA was affected by seasonality influence, only showing a moderate correlation across years. For this trait, environmental and physiological effects (particularly those related to temperature pattern during fruit ripening) were previously documented. For example, in a segregating apricot progeny, significant year and genotype-by-year interaction (tentatively ascribed to seasonal variation in temperature regimes) were observed while the effects of fruit maturity degree at harvest were almost negligible[70]. Also, a correlation of TA with ethylene production was reported, probably associated to an increase of respiratory demand. At the germplasm level, TA levels tended to be more correlated with absolute CIT content (i.e., TA increase along CIT content) than MAL, similarly to what was observed in some segregating progenies. For example, in G × M and L × B, higher TA levels were moderately or highly associated with elevated absolute CIT content. Nevertheless, one of the accessions with the highest TA (i.e., 'Bora' with an average of about 20 g·L−1) mostly accumulated MAL, indicating the relationship between TA and individual OA contents as not univocal. Accumulation of MAL and CIT as well as overall TA levels seemed highly dependent and negatively correlated with maturity date (MD) both in pulp and skin. Also, other minor OAs appear affected by ripening period, with early-ripening accessions showing higher content of fumarate (FUM), cis-aconitate (CIS), and SHK, while late-ripening ones exhibited elevated levels of SUC, QUI, and oxalate (OX). Whether the MD effects on acidity-related traits are dependent on developmental and/or environmental (i.e., temperature-mediated tricarboxylic acid cycle metabolism) factors would deserve further investigation, particularly to disentangle non-genetic effects on these attributes. From a breeding perspective, the expansion of the harvest calendar with ultra-late apricot varieties currently represents a challenge from a qualitative point of view, especially in relation to the very low acidic components of the fruits. Other germplasm collections, wild apricot materials, or cultivated apricot from other geographic origins, can be a further source of phenotypic (and genetic) variability for acidity-related traits.
Genetic architecture of apricot OAs contents and acidity
-
This study represents a first germplasm-level effort to dissect the genetic basis of acidity trait variation in apricot. Even if a direct comparison with other apricot materials was not possible, however, our panel includes modern varieties from various programs (including those largely used for introducing PPV resistance), traditional accessions, and advanced selections well-representing the phenotypic variability currently available for breeding.
Concerning the architecture of acidity-related traits, the qualitative profile of the two most abundant OAs (i.e. the reciprocal content of MAL and CIT) was characterized by an oligogenic (almost Mendelian-like) inheritance, regulated by a major QTL on chr 8 explaining most of the variability across the analyzed germplasm. This finding agrees with previous phenotypic observations across different breeding progenies[15,37]. Based on allelic variation at qMCr8.1, accessions can be grouped into three classes (MAL- or CIT-predominant, or balanced) independently from MAL and CIT absolute content. The qMCr8.1 interval was narrowed down using an L × B segregating progenies (where QTLs for CIT and MAL have previously been positioned[75]), further restricting this locus within a region of about 1 Mb (5.46 to 6.55). Although the resolution is still insufficient for reliable identification of candidate genes and/or variants, some promising transcripts involved in MAL/CIT accumulation were tentatively identified: a V-type proton ATPase subunit B2 (PruarS.8G258400 at 6,012,766 bp), a mitochondrial Isocitrate dehydrogenase (NAD) regulatory subunit 1 (PruarS.8G269300 at 5,293,940 bp) and a glyoxisomal Malate dehydrogenase (PruarS.8G247000 at 6,680,668), both outside but near the mapped interval. Isolation of the causative gene/sequence variant underpinning this major QTL will be fundamental to understand the specific biochemical mechanism(s) involved, although it will require specifically dedicated efforts. In several species, fruit MAL and CIT content depends on a complex interaction between metabolism, transport and vacuolar storage; apart from their biosynthesis, regulated by the interplay of several pathways (including tricarboxyic acid cycle in the mitochondrion, the glyoxylate cycle in the glyoxysome, and citrate catabolism in the cytosol), their accumulation levels seem largely determined by the cytosol-to-vacuole transport, mediated by multiple transporters, ion channels, and carriers[28]. Other minor QTLs affecting MCratio were identified in the accession panel, in particular on chr 2 (qMCr2.1), as also confirmed in G × M segregating progeny. Although the effects of qMCr8.1 and qMCr2.1 appear additive, other types of genetic interaction (i.e. dominance or epistasis) remain to be elucidated, maybe by developing specific crossing progenies simultaneously segregating for both loci. In contrast to MAL and CIT, the genetic basis of the variability of minor OAs remains unclear, mostly due to their strong variability across years. For QUI and SHK, two non-tricarboxylic acid cycle (TCA) derived OAs with sensorial impact on fruit flavor, signals were found on chr 5 and 7. Interestingly, these QTLs were also found in the L × B progeny[75]. Considering the non-negligible environmental and/or genotype-by-environment interaction effects, the study of minor OAs will require specifically dedicated experiments, maybe including a narrow genetic background (i.e. bi-parental crossing with accurate selection of parents) and multi-environment trials.
Different from the qualitative profile, the total OA content (strictly correlated with the absolute concentration of either MAL or CIT and overall TA levels) showed a more complex and quantitative architecture, regulated by several minor effect QTLs, influenced by the environment and, probably, by pleiotropic effects of other traits. In our study, QTLs were spread on several chromosomes, some of them being specific for CIT, MAL, or TA. At the germplasm level, the most stable loci associated with TA levels were identified on chr 2 (qTA2.1), 3 (qTA3.1), and 4 (qTA4.1). Interestingly, top scoring markers at qTA4.1 (SNP25460 and SNP25558) co-localized with a major QTL for MD[42]. The correlation between MD and TA is evident when observing the decreasing trend of TA across harvest windows, particularly in late and ultra-late ripening accessions. Such correlations can be explained by several hypotheses, including close-linked QTL (or QTLs), pleiotropic effects of MD on TA, or a narrow genetic base in late-ripening accessions (most of which were only recently bred). A QTL for TA was previously found in the middle of LG4 in 'Z701-1' × 'Palsteyn', co-localizing with a major locus for MD, around UDAp-439 (at 13.4 Mb), although this QTL explain only about 10% of TA variance with no evident correlation with MD[62]. Regarding qTA2.1, the presence of TA-associated QTLs was already detected on chr 2 in various apricot segregating progenies, probably introduced in breeding programmes from some high-acidity North American materials (such as 'Goldrich' and 'Orange Red') widely adopted to introduce PPV resistance. In 'Z701-1' × 'Palsteyn', a TA-LG2 QTL was mapped around SSR markers UDAp-473 and AMPA-116 (24.9−25.4 Mb interval on apricot V1)[62], in 'Goldrich' × 'Currot' around S2_18992724 and UDAp456 (around 15 Mb)[14] while in 'Goldrich × 'Moniqui' around GBS markers Pp02:22809141 and Pp02:26399548 (18.7−22.6 Mb interval on apricot V1). In these progenies, explained phenotypic variance (PEV) was low-to-moderate, ranging between 10%–20%. Also, the wide confidence intervals make uncertain whether all these associations underlie a single QTL or multiple close-localized QTLs. Although not evident from GWAS analyses, a QTL for TA was identified on chr 8 in L × B progenies, co-segregating with CIT, MAL, and MCratio at qMCr8.1 locus. This QTL explained a low-to-moderate percentage of variance, depending on the season. An increase of TA is additively linked to the CIT-predominant haplotype, suggesting that the different acidic strength between CIT and MAL (i.e. CIT is a stronger acid than MAL, with pKa of 3.13 and 4.74 vs 3.46 and 5.1, respectively) could be responsible for the QTL effect on TA. Similarly, also minor QTLs on chr 1 and 6 were detected by both GWAS and linkage mapping, both linked to CIT content and TA. However, the resolution of these QTLs is still low for tracing their inheritance.
Compared to other Prunus species, the selective accumulation of CIT and/or MAL appears a peculiarity of apricot species. Indeed, main stone fruits such as peach, sweet cherry and plum, mainly accumulated MAL, with minor CIT content. In peach and interspecific hybrids, TA-associated QTLs have been identified on LGs 2, 3, 4, 5, and 6[85−87]. However, the major locus on LG5 (D Locus) has been reported as the major determinant, accounting for most of the TA variability in various germplasms and allow to differentiate acid from sub-acid accessions[88,89]. In sweet cherry, a major QTL has been identified on LG6 (qP-TA6.1m)[90] as also reported in a homologous region in peach[91], although with a PEV of only 10%–20%.
Perspectives of DNA-informed breeding applications for acidity-related traits in apricot
-
This work provides an initial framework to develop DNA-informed approaches to assist in the selection of acidity traits in apricot breeding.
Concerning the qualitative composition of main OAs (MAL and CIT), the high percentage of variability explained by the major locus qMCr8.1 and its resolution in terms of mapping interval allows the effective targeting of the desired MCratio profile either in cross-progenies or germplasm collections. The usefulness of the MAS approach to select for the qualitative profile of main OAs is justified by the complexity of phenotyping, which requires a fine metabolites analysis (such as HPLC or other). The performance of the most predictive marker SNP46961 (positioned at 6,316,393) was further validated in a small panel of independent accessions characterized in other germplasms (Supplementary Table S5), opening the possibility of its reliable application in marker-assisted breeding. Narrowing of the mapping intervals and/or the identification of underlying variant(s) will further improve this approach, allowing tracing this QTL also in unknown materials. Not negligible, qMCr8.1 could be informative for a preliminary screening of TA levels (associated to increased CIT content), since able to explain up to 20% of its variability.
Conversely, MAS approaches for selecting TA and/or absolute MAL or CIT amounts in apricot fruits appears less feasible, since their architecture seems controlled by several and basically minor QTLs and affected by the environment. An exception could be represented by the simultaneous adoption of markers at qMCr8.1 (as discussed above) and qMCr2.1, this last accounting for up to 20% of phenotypic variation. Nevertheless, tightly associated markers for this locus and amenable for MAS were not identified, since neither association nor linkage mapping allowed us to reach an adequate resolution. Also, the type of interactions among these two QTLs (additive, dominant, and/or epistatic) remains to be elucidated. Moreover, the putative pleiotropic interaction between TA and MD (particularly evident in late maturing accessions and supported at both phenotypic and genetic levels by the co-localization of a major QTL on chr 4) could have practical breeding implications and deserve further studies; the observed negative correlations can be explained by several hypotheses, including close-linked QTL (or QTLs), pleiotropic effects of MD on TA or a narrow genetic base in late-ripening accessions (most of which were only recently bred). For these reasons, the implementation of genomic-selection (GS) approaches in apricot could be an attractive alternative to MAS for complex traits such as TA. The potential of different GS models in apricot has been recently explored to predict some fruit quality attributes (including TA) with promising results, albeit obtained only from the analysis of a single segregating progeny[70]. From this perspective, it will be necessary to develop predictive models on the basis of broader genetic diversity (including also wild apricot or cultivated apricots from other germplasms) and their validation across various crossing materials. Also, considering the relevant environment and/or pleiotropy effects on TA and OAs content, information from multi-season and/or multi-environment trials should be integrated, to disentangle the non-genetic components, maybe including genotype-by-environment interaction.
We are grateful to Martina Lama and Stefano Foschi for their technical assistance in the field. This work has been partially supported by FREECLIMB project, in the framework of MAS.PES, an Italian project coordinated by RINOVA and the University of Milan, aimed at apricot and peach breeding and funded by Italian growers' and nurseries' organizations. This study was in part carried out within the Agritech National Research Center and received funding from the European Union Next-GenerationEU (PIANO NAZIONALE DI RIPRESA E RESILIENZA (PNRR) – MISSIONE 4 COMPONENTE 2, INVESTIMENTO 1.4 – D.D. 1032 17/06/2022, CN00000022). This manuscript reflects only the authors' views and opinions, neither the European Union nor the European Commission can be considered responsible for them.
-
The authors confirm contribution to the paper as follows: study conception and design: Baccichet I, Cirilli M; phenotypic and genotypic data collection: Baccichet I, Chiozzotto R, Tagliabue AG, Tartarini S, da Silva Linge C; Tura D; phenotypic analyses: Baccichet I, Spinardi A, Cirilli M; interpretation of genotypic data: Baccichet I, Rossini L, Bassi D, Cirilli M; manuscript writing: Baccichet I. All authors reviewed the results and approved the final version of the manuscript.
-
Prof. Marco Cirilli and Laura Rossini were in charge of the formal management of the plant materials. A voucher specimen of these materials has not been deposited, but available upon reasonable request and with the permission of the University of Milan and MAS.PES project partners. The datasets generated and analyzed during the current study are available in the Sequence Read Archive (SRA) repository (https://www.ncbi.nlm.nih.gov/sra) under the accession number BioProject 'PRJNA821640' or included as Supplementary files.
-
The authors declare that they have no conflict of interest.
- Supplementary Table S1 Origins of plant materials used in this study and cluster assignment inferred by the ADMIXTURE analysis.
- Supplementary Table S2 Descriptive statistics summary of the different traits recorded on the whole apricot germplasm collection along three harvesting seasons (2017, 2018 and 2019). CIS, cis-aconitate content; CIT, citrate content; FUM, fumarate content; GAL, galacturonate content; MAL, malate content; MAL/CIT, ratio; OX, oxalate content; QUI, quinate content; SHIK, shikimate content; SUC, succinate content; TA, titratable acidity; Total OAs, total content of OAs detected in each apricot accession; n.d. non-detected.
- Supplementary Table S3 Variance components and harvesting year-related coefficients estimated from the data fitting with the linear mixed model (LMMs) equation developed for each fruit quality trait. Phenotypic data of each trait was fitted separately in fruit pulp and skin in order to calculate the best linear unbiased predictors (BLUPs) of apricot accessions. CIS, cis-aconitate content; CIT, citrate content; FUM, fumarate content; GAL, galacturonate content; MAL, malate content; OX, oxalate content; QUI, quinate content; SHIK, shikimate content; SUC, succinate content; TA, titratable acidity.
- Supplementary Table S4 Summary of SNPs associated to seasonal data of fruit acidity-related traits in the apricot accessions panel.
- Supplementary Table S5 Association of top significant SNP (SNP46961, on chr 8) at qMCR8.1 locus with the content of citrate, malate (MAL) and malate/citrate ratio (MCratio) using data from Gurrieri et al. [38] and genotypic data extracted from publicly available SRA datasets.
- Supplementary Table S6 Harvest date and ripening parameters (IAD index and firmness, kg·cm−2) of apricot fruits sample collected during seasons 2017, 2018 and 2019.
- Supplementary File 1 Integrated maps of chr (LG) 8 and chr (LG) 2 in L × B and G × M progenies. Markers are indicated using Joint Map nomenclature, indicating the Apricot Reference Genome positions and QTLs associated haplotypes.
- Supplementary Fig. S1 Population structure of the apricot accessions panel estimated for K (number of a priori cluster) equal to 2.
- Supplementary Fig. S2 Spearman's rank correlation test among acidity-related traits in fruit pulp and skin recorded for three consecutive harvesting seasons (2017 – 2019) on an apricot panel of 131 accessions. Correlations were significant ‘*’ at the 5%, '**' at the 1% and '***' at the 0.1 % level.
- Supplementary Fig. S3 Phenotypic variation and Spearman’s correlation coefficient between pulp and skin contents in the apricot accession panel along three harvesting seasons for A) titratable acidity (TA, in g·L−1 of malic acid), B) citrate (CIT, in mg·mL−1), C) malate (MAL, in mg·mL−1) and D) malate/citrate ratio (MCratio).
- Supplementary Fig. S4 Scatter plot of the first two principal components (Dim1 and Dim2) of the genetic relationship matrix. The first two PCs (i.e. Dim1 and Dim2) captured the 31.8% of the explained phenotypic variability for TA and ten OAs (CIS, cis-aconitate; CIT, citrate; FUM, fumarate; GAL, galacturonate; MAL, malate; OX, oxalate; QUI, quinate; SHI, shikimate; SUC, succinate; TRT, tartrate) contents in both fruit pulp and skin.
- Supplementary Fig. S5 Manhattan and QQ-plots of −log p values estimated using 3-year seasonal data using FarmCPU algorithm for citrate, malate (MAL), malate/citrate ratio (MCratio) and titratable acidity (TA) in the apricot accession panel. Model was adjusted for population structure (Q = 2). Horizontal lines indicate the Bonferroni-adjusted threshold for a type one error rate of 0.05 based on the effective number of independent tests (continuous line, 1.86E−06) and permutation test (dashed lines, 1.18E-05). Major loci on chr 2 and 8 controlling MAL, CIT and MCratio were stably detected across seasons while those for TA were more variable.
- Supplementary Fig. S6 Linkage disequilibrium pattern around qMCr8.1 on chr 8.
- Supplementary Fig. S7 Linkage disequilibrium pattern around qMCr2.1 on chr 2.
- Supplementary Fig. S8 Linkage disequilibrium pattern around qTA4.1 on chr 4.
- Supplementary Fig. S9 Boxplots of the marker-trait association between SNP42454 (pulp) and SNP41612 (skin) at qMCr2.1 (chr 2), and SNP5137 at qTA6.1 (chr 6) with titratable acidity values (TA, in g·L−1 of malic acid) collected during three consecutive seasons in the apricot accession panel. Letters and asterisks indicate significant differences between classes (p < 0.01) as inferred by one-way ANOVA and SNK test for multiple comparisons.
- Supplementary Fig. S10 Manhattan and QQ-plots (right panel) estimated from BLUPs (mg·mL−1) using Blink, FarmCPU, and MLMM models (Table 1) adjusted for population structure (Q = 2) for succinate (SUC), cis-aconitate (CIS), fumarate (FUM) and oxaloacetate (OX) content in fruit pulp (P) and skin (S) in the apricot accession panel. The continuous horizontal line indicates the Bonferroni's adjusted-threshold for a type one error rate of 0.05 based on the effective number of independent tests (1.86E-06), while dashed line corresponds to the permutation test (1.04E-05).
- Supplementary Fig. S11 Manhattan and QQ-plots (right panel) estimated from BLUPs (mg·mL−1) using Blink, FarmCPU, and MLMM models adjusted for population structure (Q = 2) for quinate (QUI), shikimate (SHK), galacturonate (GAL) and tartrate (TRT) content in fruit pulp (P) and skin (S) in the apricot accession panel. The continuous horizontal line indicates the Bonferroni's adjusted-threshold for a type one error rate of 0.05 based on the effective number of independent tests (1.86e-06), while dashed line corresponds to the permutation test (1.02E-05).
- Supplementary Fig. S12 Single-marker analyses of markers-trait association for average citrate (CIT), malate (MAL), malate/citrate ratio (MCratio) and titratable acidity (TA) in cross-parents of four F1 progenies: 'BO96621030' (B1) × 'Harostar' (H), 'Fiamma' (F) × 'BO93623033' (B2), 'Goldrich' (G) × 'Moniqui' (M) and 'Lito' (L) × 'BO81604311' (B). SNPs markers were selected based on parental segregation, lm × ll and nn × np types according to JointMap nomenclature, respectively for mother and seed parents (the number of markers is reported in Materials & Methods section).
- Supplementary Fig. S13 Boxplots of the associations between haplotypes at qMCr8.1 (LG8) and qMCr2.1 loci (LG2) with titratable acidity (TA, in g·L−1 of malic acid). Haplotypes at qMCr8.1 were defined by the fine-mapped interval between markers SNP46688 and SNP47104 in 'Lito' × 'BO81604311' (haplotype A and B, respectively) (left) while haplotypes at qMCr2.1 were delimited by markers Pp02:22857329_T/G and Pp02:26399548_T/A in ‘Goldrich’ × ‘Moniqui’ (haplotype A and B, respectively) (right). Letters and asterisks indicate significant differences between classes (p < 0.01) as inferred by one-way ANOVA and SNK test for multiple comparisons. Haplotypes intervals and markers are shown in Supplementary File 1.
- Supplementary Fig. S14 (A) Linkage mapping for citrate (CIT, in mg·mL−1) and titratable acidity (TA, in g·L−1 of malic acid) in fruit pulp of B2 × H segregating progenies. Significance of QTL analysis was calculated using LOD score; markers position on apricot V1 genome are also indicated; (B) Box-plot of marker-trait association of LOD peak SNP10508 (at 5.8 Mb), CIT and TA levels. Letters and asterisks indicate significant differences between classes (p < 0.01) as inferred by one-way ANOVA and SNK test for multiple comparisons.
- Supplementary Fig. S15 Climate trend at the experimental fields located in Imola (Emilia-Romagna region, Italy) in terms of minimum (Tmin) and maximum (Tmax) temperatures during the seasons 2017, 2018 and 2019.
- Copyright: © 2025 by the author(s). Published by Maximum Academic Press, Fayetteville, GA. This article is an open access article distributed under Creative Commons Attribution License (CC BY 4.0), visit https://creativecommons.org/licenses/by/4.0/.
-
About this article
Cite this article
Baccichet I, Chiozzotto R, Tura D, Tagliabue AG, Tartarini S, et al. 2025. Dissection of acidity-related traits in an apricot (Prunus armeniaca L.) germplasm collection revealed the genetic architecture of organic acids content and profile. Fruit Research 5: e005 doi: 10.48130/frures-0024-0040 

Dissection of acidity-related traits in an apricot (Prunus armeniaca L.) germplasm collection revealed the genetic architecture of organic acids content and profile
- Received: 31 July 2024
- Revised: 26 November 2024
- Accepted: 02 December 2024
- Published online: 13 February 2025
Abstract: Fruit acidity-related traits significantly influence consumer preferences for apricots (Prunus armeniaca L.). This study evaluated the variability associated with overall fruit acidity, and the content and profiles of ten organic acids (cis-aconitate, citrate, fumarate, galacturonate, malate, oxalate, quinate, shikimate, succinate and tartrate) separately in pulp and skin tissues across three consecutive harvesting seasons in an apricot germplasm collection. The phenotypic dataset was integrated with genotyping data from a customized 25K target SNPs assay to perform genome-wide association studies and complemented with linkage mapping in four segregating progenies. A major locus was identified on chromosome 8 (qMCr8.1) showing a Mendelian-like effect on the qualitative profile of malate and citrate, the most abundant organic acids in apricot fruits. This locus segregated accessions into three groups: citrate- or malate-predominant, or balanced. In contrast, the quantitative abundance of specific organic acids (OAs) and total OAs content (strictly correlated to titratable acidity) exhibited a more complex genetic architecture, controlled by several minor QTLs on different chromosomes, with significant seasonal variability and a strong correlation with maturity date. Beyond establishing the genetic determinants of fruit acidity traits, this study provides valuable insights for future implementation of marker and/or genomics-assisted approaches in apricot breeding.
-
Key words:
- Acidity /
- Organic acids /
- Apricot germplasm /
- Fruit quality /
- GWAS /
- Malate /
- Citrate /
- Prunus armeniaca