


-
Plant products are generally valued based on their visual appearance, particularly their color. Fruit color is closely linked to anthocyanin accumulation[1], a water-soluble pigment belonging to the phenolic group that is responsible for the vivid red, purple, and blue tonalities of many plants[2]. Increasing anthocyanin contents in fruits and vegetables is a breeding target for many species[3]. In apple, efforts in developing commercial dessert red-flesh fruits have enabled the development of red-flesh cultivars combining appealing flesh color and valuable organoleptic properties. Two different types of red-flesh apples have been identified. Type 1 red-flesh phenotype is characterized by anthocyanin accumulation throughout the fruit, flowers, and vegetative tissues. In contrast, the type 2 red-flesh apple phenotype is characterized by green vegetative tissues, yellow-orange fruit skin, and pink fleshy fruits[4]. Type 1 red-flesh development is linked to the presence of a particular allele of the MdMYB10 gene[5] causing anthocyanin ectopic accumulation[6].
During fruit storage and under specific post-harvest conditions (temperature, CO2), apple fruits may develop internal physiological disorders that are not externally visible. 'Browning' in apple is a generic term for internal disorders related to storage and characterized by brown patches within fruit flesh[7]. Polyphenol oxidases (PPOs) catalyze the oxidation of phenolic compounds to quinones, which produce a series of brown pigments, such as insoluble brown polymers (melanins)[8]. These reactions are thought to be the major cause of the enzymatic browning during handling (fresh-cut apple browning), storage (internal flesh browning - IFB), and processing (cider making)[9]. During each reaction, cells can be damaged, leading to contact between PPO (stored in vacuoles) and phenolic compounds (located in plastids), triggering enzymatic browning reactions. The loss of cellular integrity could be linked to wounding, as well as processing, or fruit senescence. Flesh browning affects many yellow-flesh cultivars and results from membrane disruption (cutting surface) followed by enzymatic browning by PPOs producing brown-colored pigments[10]. Consequently, phenolic metabolism (PPO activity and phenolic compounds accumulation) and tissue structures (cellular integrity) are concomitant to enzymatic browning reactions throughout fruit senescence.
Multiple PPO genes have been identified and located on chromosomes 2, 5, and 10[11] in the apple genome[12]. In two apple F1 progenies ('Fuji × Pink Lady' and 'Golden Delicious × Braeburn'), QTLs associated with fresh-cut apple browning were identified on LG9, LG10, LG11, LG13, LG14, and LG16[11]. Further haplotype analysis on LG10 confirmed that LG10-QTL colocalized with PPO genes suggesting that fresh-cut browning susceptibility was associated with allelic variations among these genes. Further expression studies confirmed a differential expression of MdPPO during browning (the highest expression is reached 60 min after fruit cutting) and provided insights into flesh browning physiology[11]. Another QTL analysis performed on a hybrid population derived from a cross between 'Jonathan' and 'Golden Delicious' enabled the identification of three QTLs on LG10, LG15, and LG17 related to fresh-cut browning[13]. More recently, a QTL analysis including the non-browning cultivar 'Aori 27' identified a major QTL on LG16 linked to multiple browning-related traits[14].
Some red-flesh cultivars are prone to a physiological breakdown similar to IFB[15,16]. Espley et al.[17], hypothesized that flesh browning in red-flesh cultivars may be caused by elevated fruit ethylene concentrations before harvest combined with higher anthocyanin, chlorogenic acid, and flavan-3-ols. Indeed, chlorogenic acid and flavan-3-ols are preferential subtracts of PPO and could drive PPO-mediated enzymatic browning[18]. A recent study based on extreme-phenotype genome-wide association study (XP-GWAS) identified multiple loci involved in internal browning and suggested that this phenotype may be caused by senescence, extreme temperature exposure, and/or enzymatic browning where they did not identify loci linked to known PPO genes[19]. However, phenotypic estimation of flesh browning was limited to visual notation of internal browning surface (after fruits were cut) at one acquisition time after 70 d at 0.5°C, followed by 7 d at 20 °C.
Among investigations on apples, various computer vision systems have been developed to evaluate apple fruit color[20,21], and an index based on color measurements in CIEL*a*b* has been established to characterize enzymatic browning of apple slices[22,23]. In the CIEL*a*b* color space, L* is the lightness of the color (L* = 0 means black and L* = 100 refers to white) while a* is related to color variations from red (+) to green (−), and b* is associated with yellow (+) to blue (−) color variations. CIEL*a*b* color descriptors are not well suited in discriminating red-flesh from internal browning, because color variations are associated with red-flesh color intensity (a* paramater)[20], and also flesh browning symptoms (a* and b* parameters). As a consequence, red-flesh color intensity and flesh browning symptoms are confounded when considering a* parameter. Recently, deep and shallow techniques have been used to overcome the limitations of pixel color information (confounding effects and continuity of colors) in the case of complex plant vegetation segmentation[24]. In this study, we conducted a pedigree-based QTL analysis (PBA-QTL) including four F1 red-flesh apple progenies (256 genotypes), supplemented with genetic data from parents, grandparents, and founders (totaling 347 genotypes). Given the intricate and temporal nature of the flesh browning process in apple, we used visual notations (ratio) and shallow methods (brown flesh surface estimation) to evaluate internal browning symptoms at 60 and 120 d after harvest.
To better characterize internal browning, the whole fruit (and not just a section) needs to be considered. Moreover, not all red-flesh apples develop internal browning at the same time or at the same speed, and these processes can be affected by environmental factors during fruit growth, ripening, and senescence, which emphasizes the importance of developing a non-destructive method to kinetically estimate browning symptoms. Fruit firmness, considered to be a major fruit quality parameter, is intimately associated with cell structure[25], and is considered to be one of the major factors contributing to internal browning in red-flesh apples[17,19]. During fruit storage, the cellular de-compartmentalization can lead to interactions between phenolic compounds from the vacuole and PPOs from the plastids and vacuoles into the cytosol. Previous studies identified that cell integrity was lost in brown tissues, while unaffected tissues exhibited healthy cells[10]. Furthermore, it has been observed that highly colored red-flesh fruits were generally characterized by poor firmness and crispness, with higher astringency and sourness[19].
Apple defect detection traditionally relies on destructive methods that are tedious, laborious, and generate subsequent losses. While much progress has been made on quality evaluation of apples using spectroscopic and imaging techniques[7,26], these methods remain expensive and time consuming, limiting their applicability for routine quality testing. Acoustic sensors have been extensively used in different fruits species for quality testing, including firmness evaluation[27]. Recently, acoustic analysis enabled the identification of internal browning in mango (Mangifera indica L.)[28]. This study aimed at: (i) identifying QTLs linked to browning traits in four hybrid families; and (ii) investigating acoustic signals in a single parent cv. 'R201' as a non-destructive method to detect internal browning.
-
Three families derived from crosses between a type 1 red-flesh and a white-flesh parent (RF1-1 to RF1-3, plantation year: 2018), and one family derived from a cross between two type 1 red-flesh parents (RF1-5, plantation year: 2017) were used in this study[29]. Genotypes were selected at the seedling stage for red-leaf color (phenotypic marker of MdMYB10[5]) and resistance to apple scab. Consequently, all hybrid genotypes contained at least one R6-MdMYB10 allele[29]. Each genotype was represented by one tree. Fruit harvest was conducted over three years (2021, 2022, and 2023) from August to October in IFO orchards (L'Anguicherie, 49140 Seiches-sur-le-Loir, France/GCS: 47°37'52.5" N 0°19'38.4" W). Fruits that were positioned in the middle of the tree, at similar light exposure, same developmental stage and similar diameter were picked preferentially to limit intra- and inter-tree bias. A previous QTL analysis identified a QTL on LG16 linked to the means of a* values, a quantitative color descriptor of red color intensity[20], that colocalized with a QTL identified in a red-flesh biparental population[29]. To exclude low-colored genotypes that could display alleles favouring internal browning, a subset of genotypes were filtered out for the presence of LG16-QTL 'F' allele at haploblock HB-16-5 (approximately 8 cM)[29]. Following this selection, 256 F1 red-flesh genotypes remained for QTL detection. Fruits were harvested at maturity, based on brix values and starch index (between 6 and 8), ten representative fruits were stored at 4 °C for estimation of internal browning to reproduce post-harvest storage conditions. A two-stage data acquisition (60 and 120 d) was performed to detect early and late susceptibility to browning. Five fruits were evaluated after 60 and 120 d of storage, respectively, and the ratios of brown fruits to non-brown fruits were calculated. Breeders generally observe first browning symptoms after 60 d of storage while severe symptoms are observed after 120 d for most sensitive fruits. Major phenolic compounds (anthocyanins, flavonols, flavan-3-ols, dihydrochalcones, and hydroxycinnamic acids) and color descriptors data were compiled from previous studies[20,29].
Image analysis and estimation of brown flesh
-
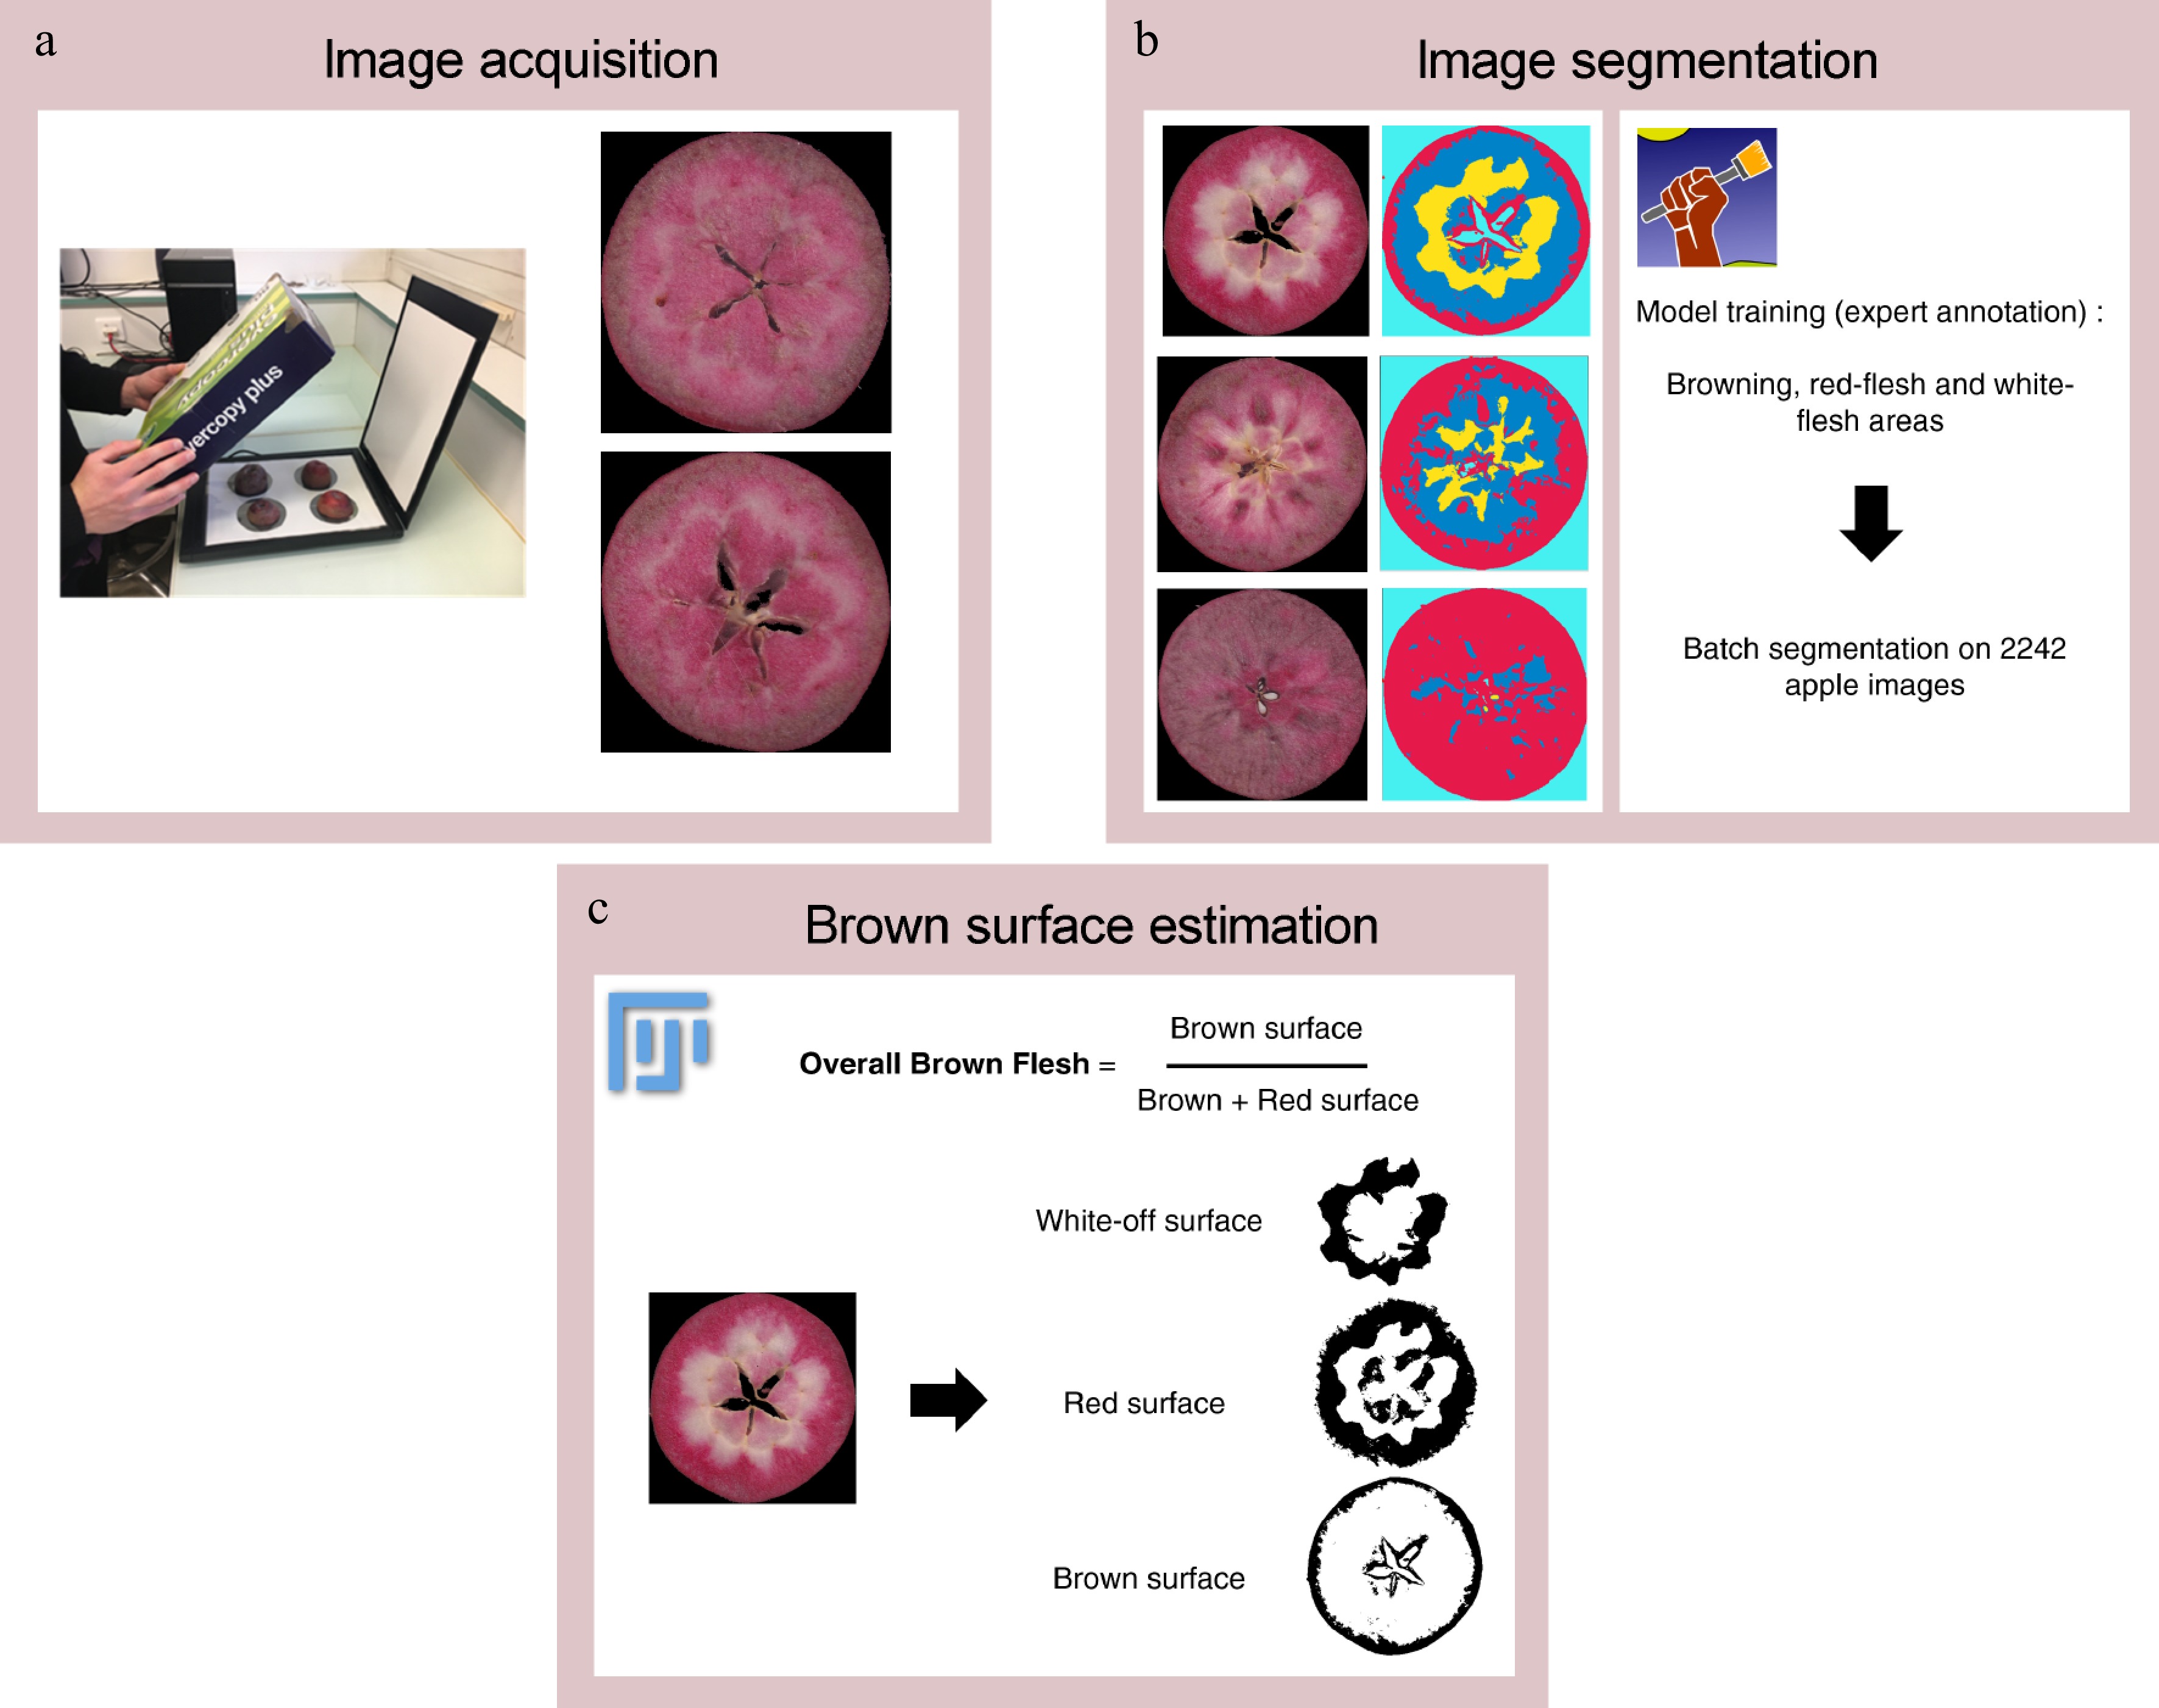
Before image acquisition, transversal sections of each fruit were visually evaluated for internal browning based on the presence/absence of internal browning, and then immediately scanned to avoid enzymatic browning. The ratio of brown fruits was defined as the number of brown fruits divided by the total number of evaluated fruits. Images of brown fruits were acquired using an RGB flatbed scanner Canon LIDE 400, totaling 2,242 images for three years (Fig. 1a).
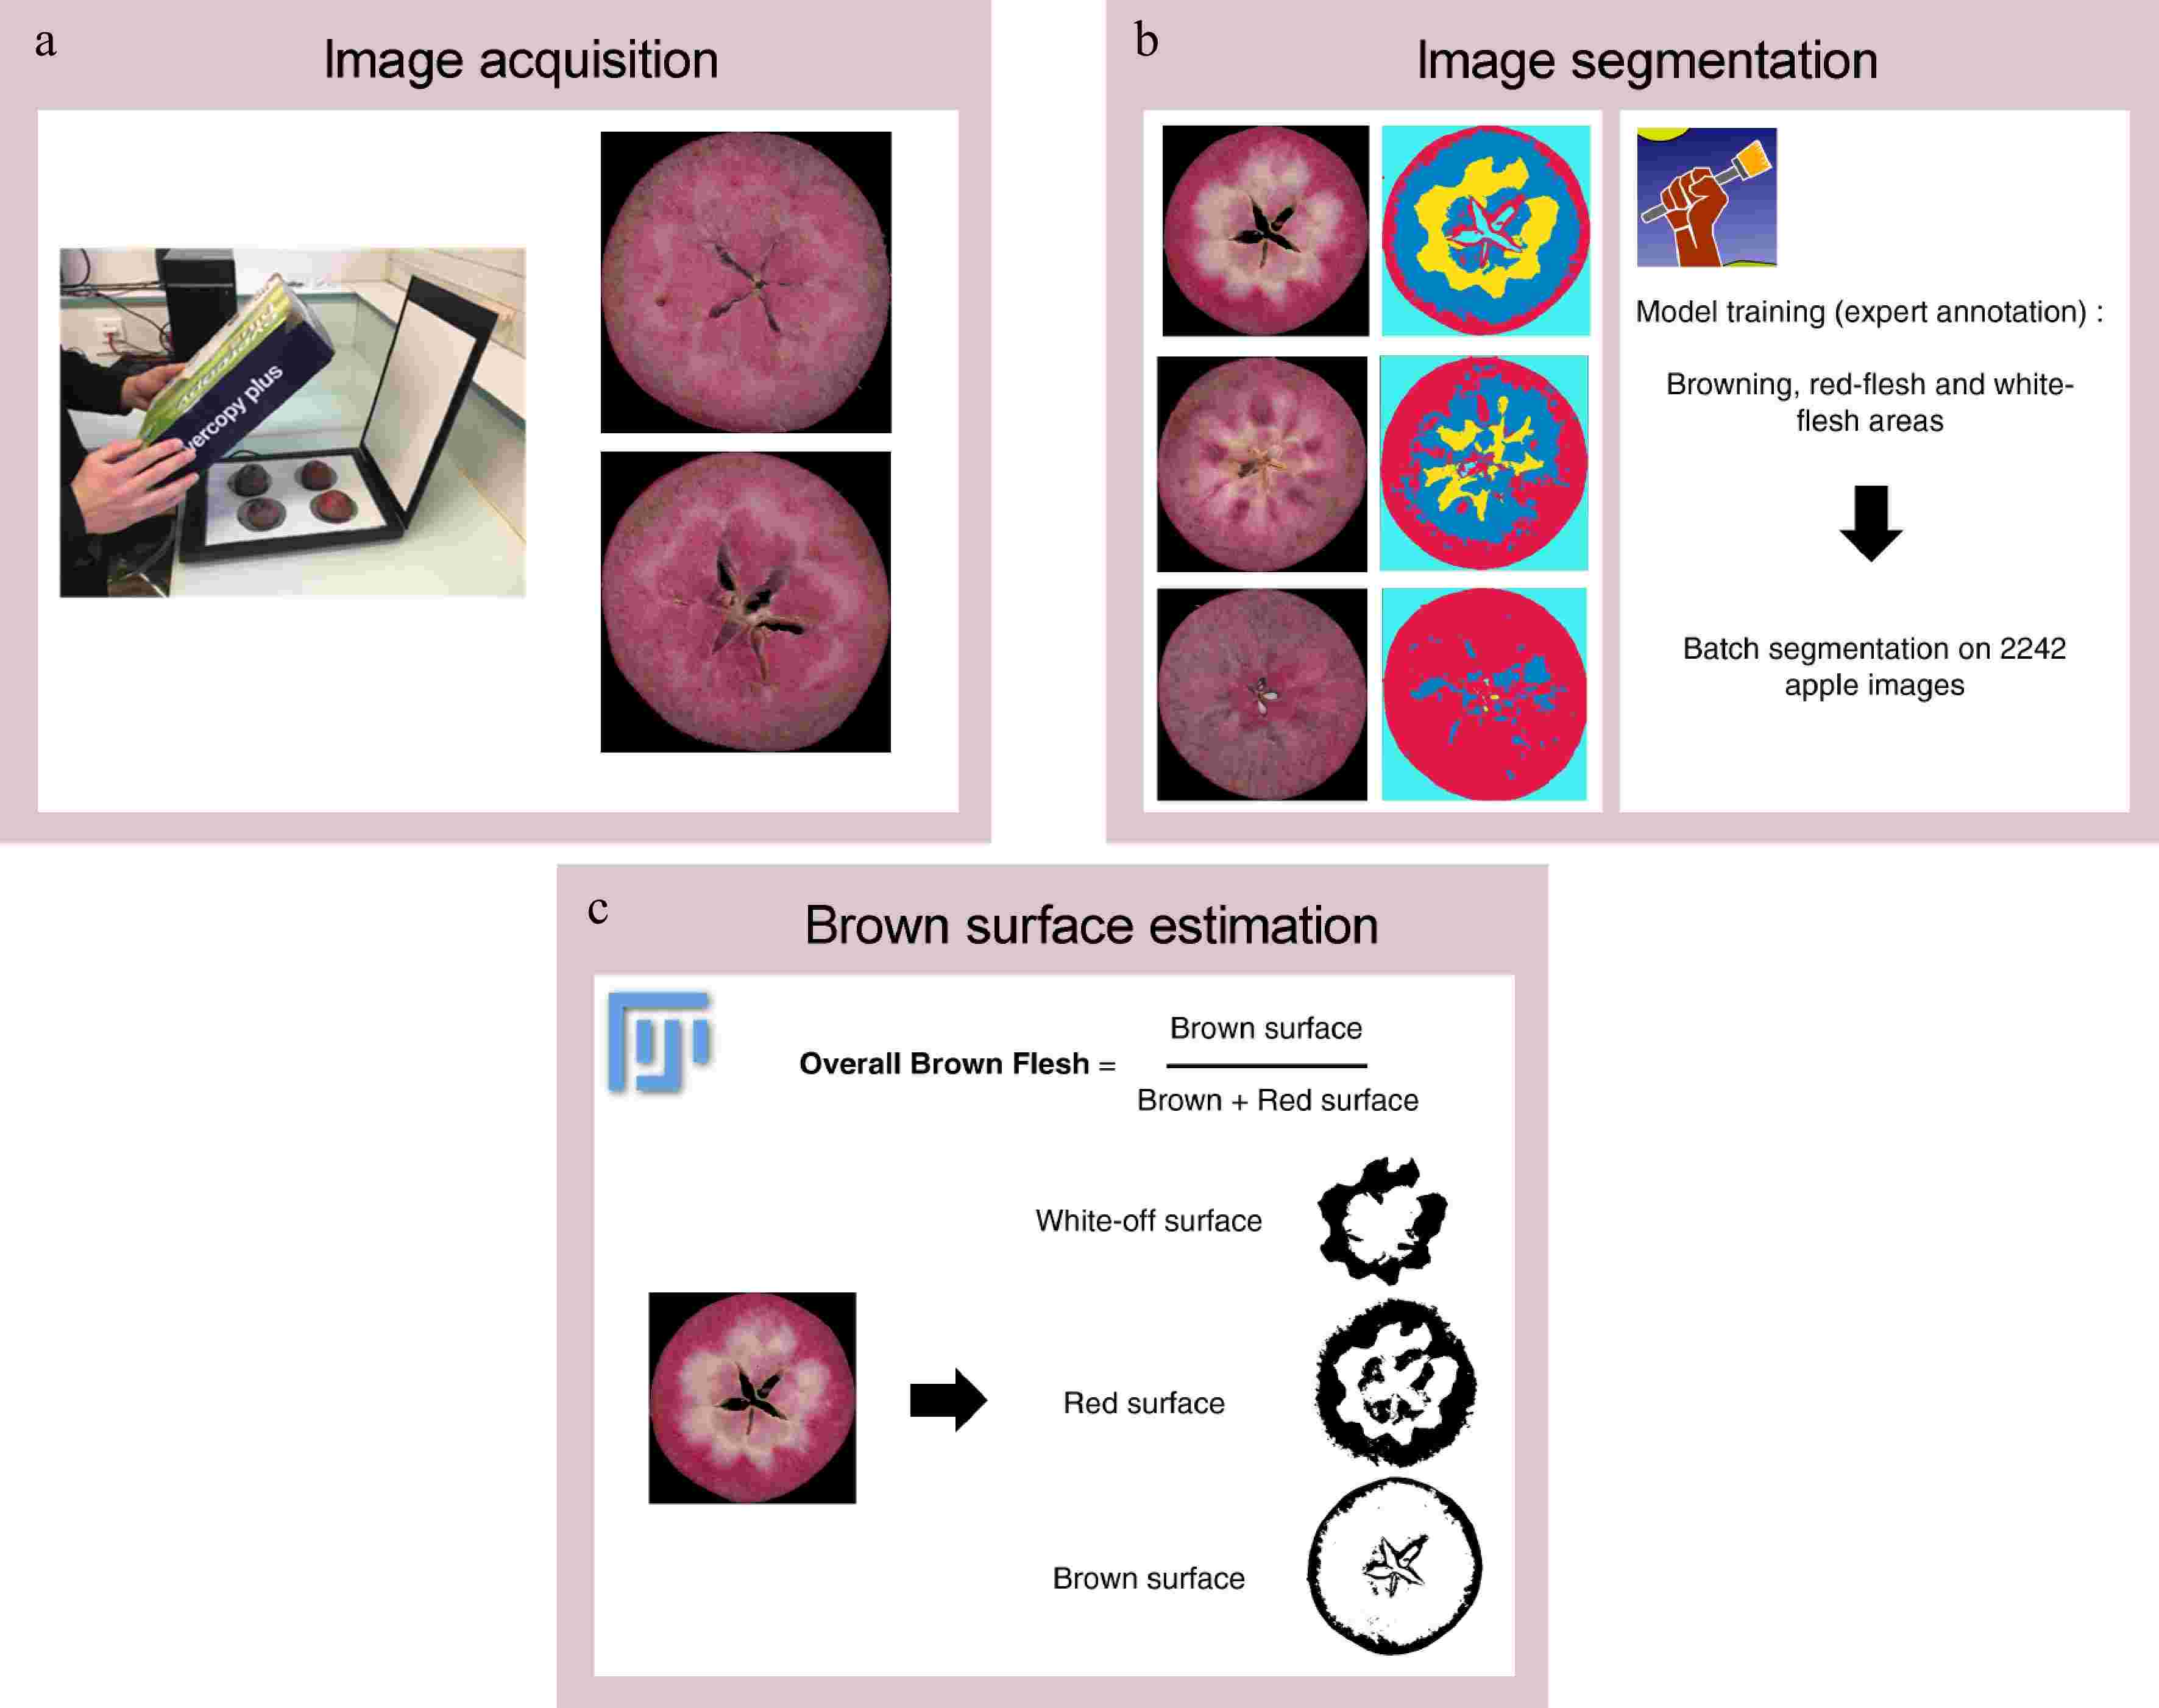
Figure 1.
Overview of image analysis workflow. (a) Image acquisition is performed with a RGB flatbed scanner. (b) Image segmentation is performed with Ilastik software and extract 'brown', 'red- flesh', 'white-flesh', 'background' pixel classes. (c) Brown flesh is estimated from segmented images (number of pixels annotated as 'brown' divided by sum of number of pixels annotated as 'brown' and number of pixels annotated as 'red-flesh') with an ImageJ macro.
Image segmentation was performed with Ilastik software that implemented a RandomForest Classifier[30]. Each image was segmented according to four labels: 'brown flesh', 'red-flesh', 'white-flesh', and 'background' (Fig. 1b). After segmentation, a Fiji[31] macro was written to calculate and compile overall brown flesh from segmented images (Fig. 1c). Overall brown flesh at 60 and 120 d was estimated as follows:
Overallbrownflesh=BrownfleshBrownflesh+Redflesh QTL analysis
-
Best linear unbiased prediction (BLUP) and broad-sense heritability was estimated for each trait as calculated by Bouillon et al.[29]. BLUPs were estimated from 2021-2022-2023 data for the ratio of brown fruits at 60 d (ratio 60d), the ratio of brown fruits at 120 d (ratio 120d), overall brown flesh at 60 d (surface 60d), and overall brown flesh at 120 d (surface 120d). Knowing that internal flesh browning is related to red-flesh color[19], the mean of a* values was also used as a measure of red-flesh intensity[20].
Genotype acquisition, SNP curation, and haplotype determination were performed as described in Bouillon et al.[29]. Genotyping data included a total of 4,220 informative SNP grouped in 1,104 haploblocks which were well distributed across the 17 chromosomes. QTL analyses were performed using the FlexQTL™ software, which implements PBA-QTL analysis via Markov Chain Monte Carlo (MCMC) simulation (
www.flexqtl.nl )[32]. Parameters for the analyses are reported in Bouillon et al.[29]. The significance of a putative QTL was assessed using Bayes Factor (BF; 2lnBF10), with evidence for a QTL categorized as positive, strong, or decisive based on BF ranges: 2 to 5, 5 to 10, and above 10, respectively[29]. The proportion of phenotypic variance explained (PVE) by a QTL was calculated by dividing the reported variance explained by the whole phenotypic variance[33]. Haplotype effects were inferred via analyses of SNP haplotypes within QTL intervals as described in Bouillon et al.[29]. To determine if means of BLUP values were significantly different for the presence vs absence of a given QTL haplotype, one-way analysis of variance (ANOVA) and Tukey's honest significant difference (HSD) were calculated for each trait[34]. Candidate genes were screened in QTL regions using the 'GDDH13.v1.1' apple genome[12] as a reference.Acoustic signal based detection of internal browning
Experimental procedure
-
A total of 200 fruits from the cultivar cv. 'R201' were harvested (harvest date: 31/10/2023) at IFO orchards (L'Anguicherie, 49140 Seiches-sur-le-Loir, France/GCS: 47°37'52.5" N 0°19'38.4" W). Fruits were stored at 4 °C and acoustic signals, as illustrated in Fig. 2, of 20 fruits were measured every two weeks from 15/11/2023 to 07/03/2024. After testing, fruits were cut and internal browning was evaluated (from 0 to 10) by experts.
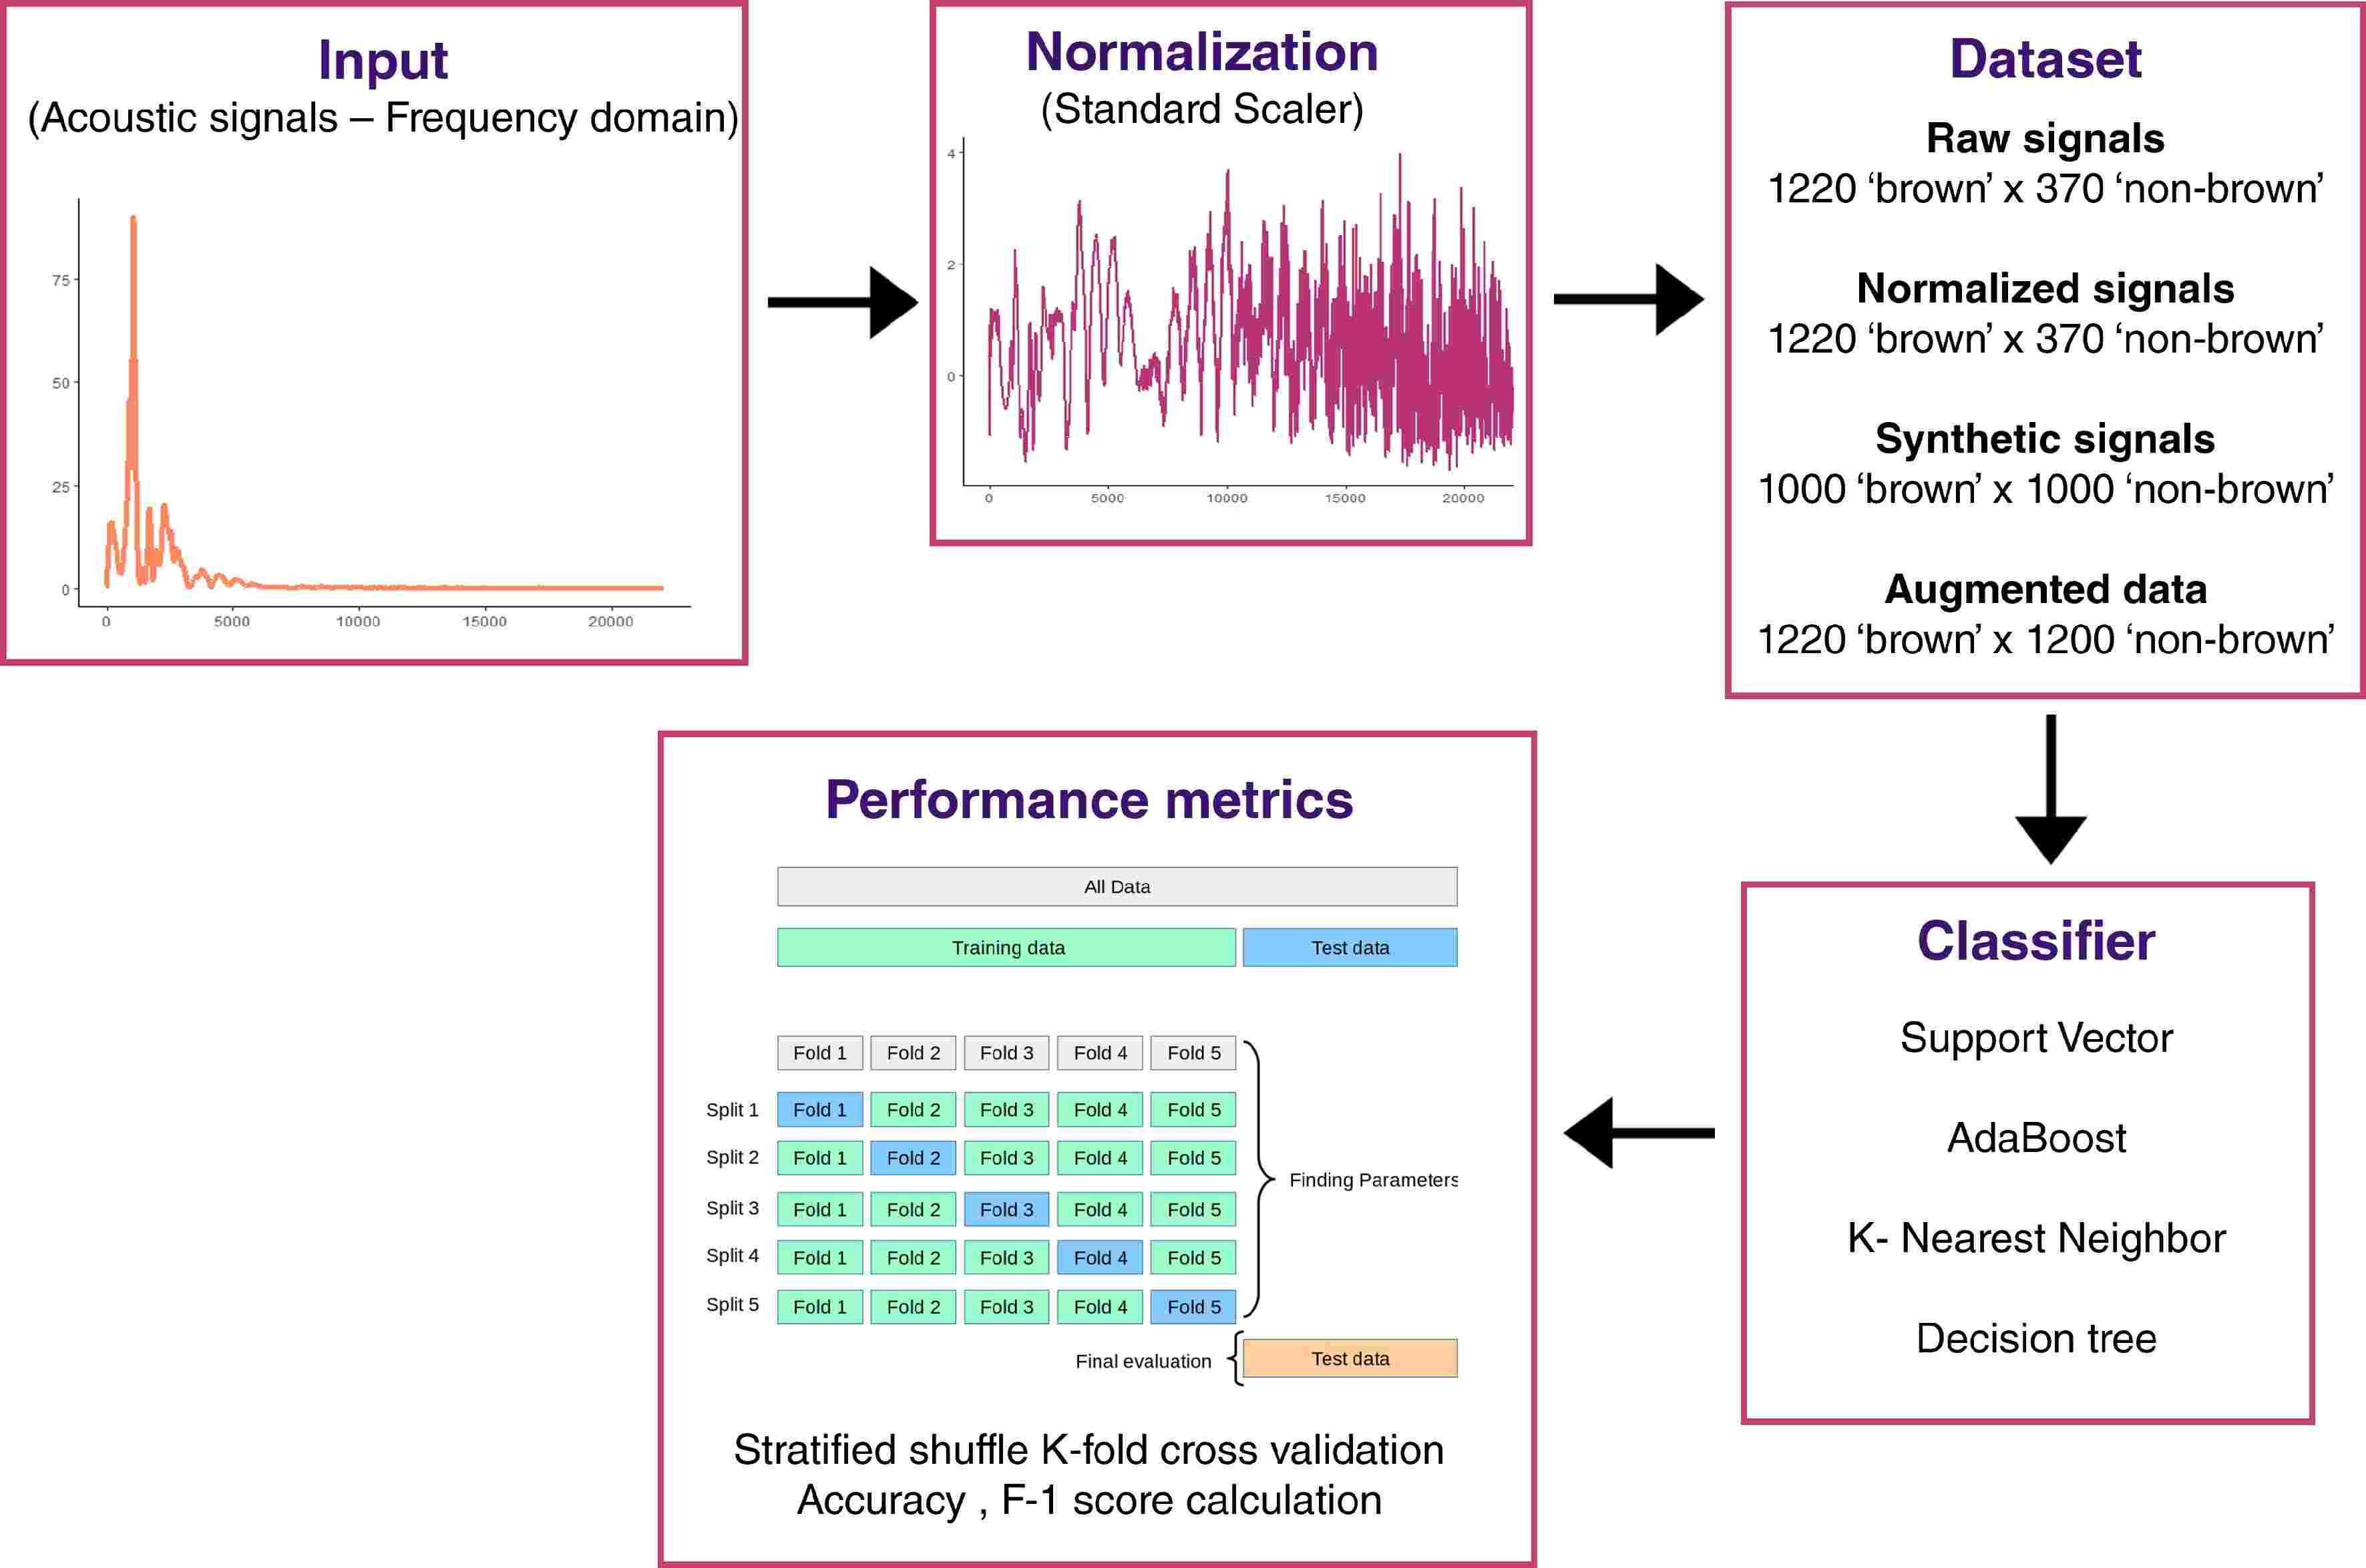
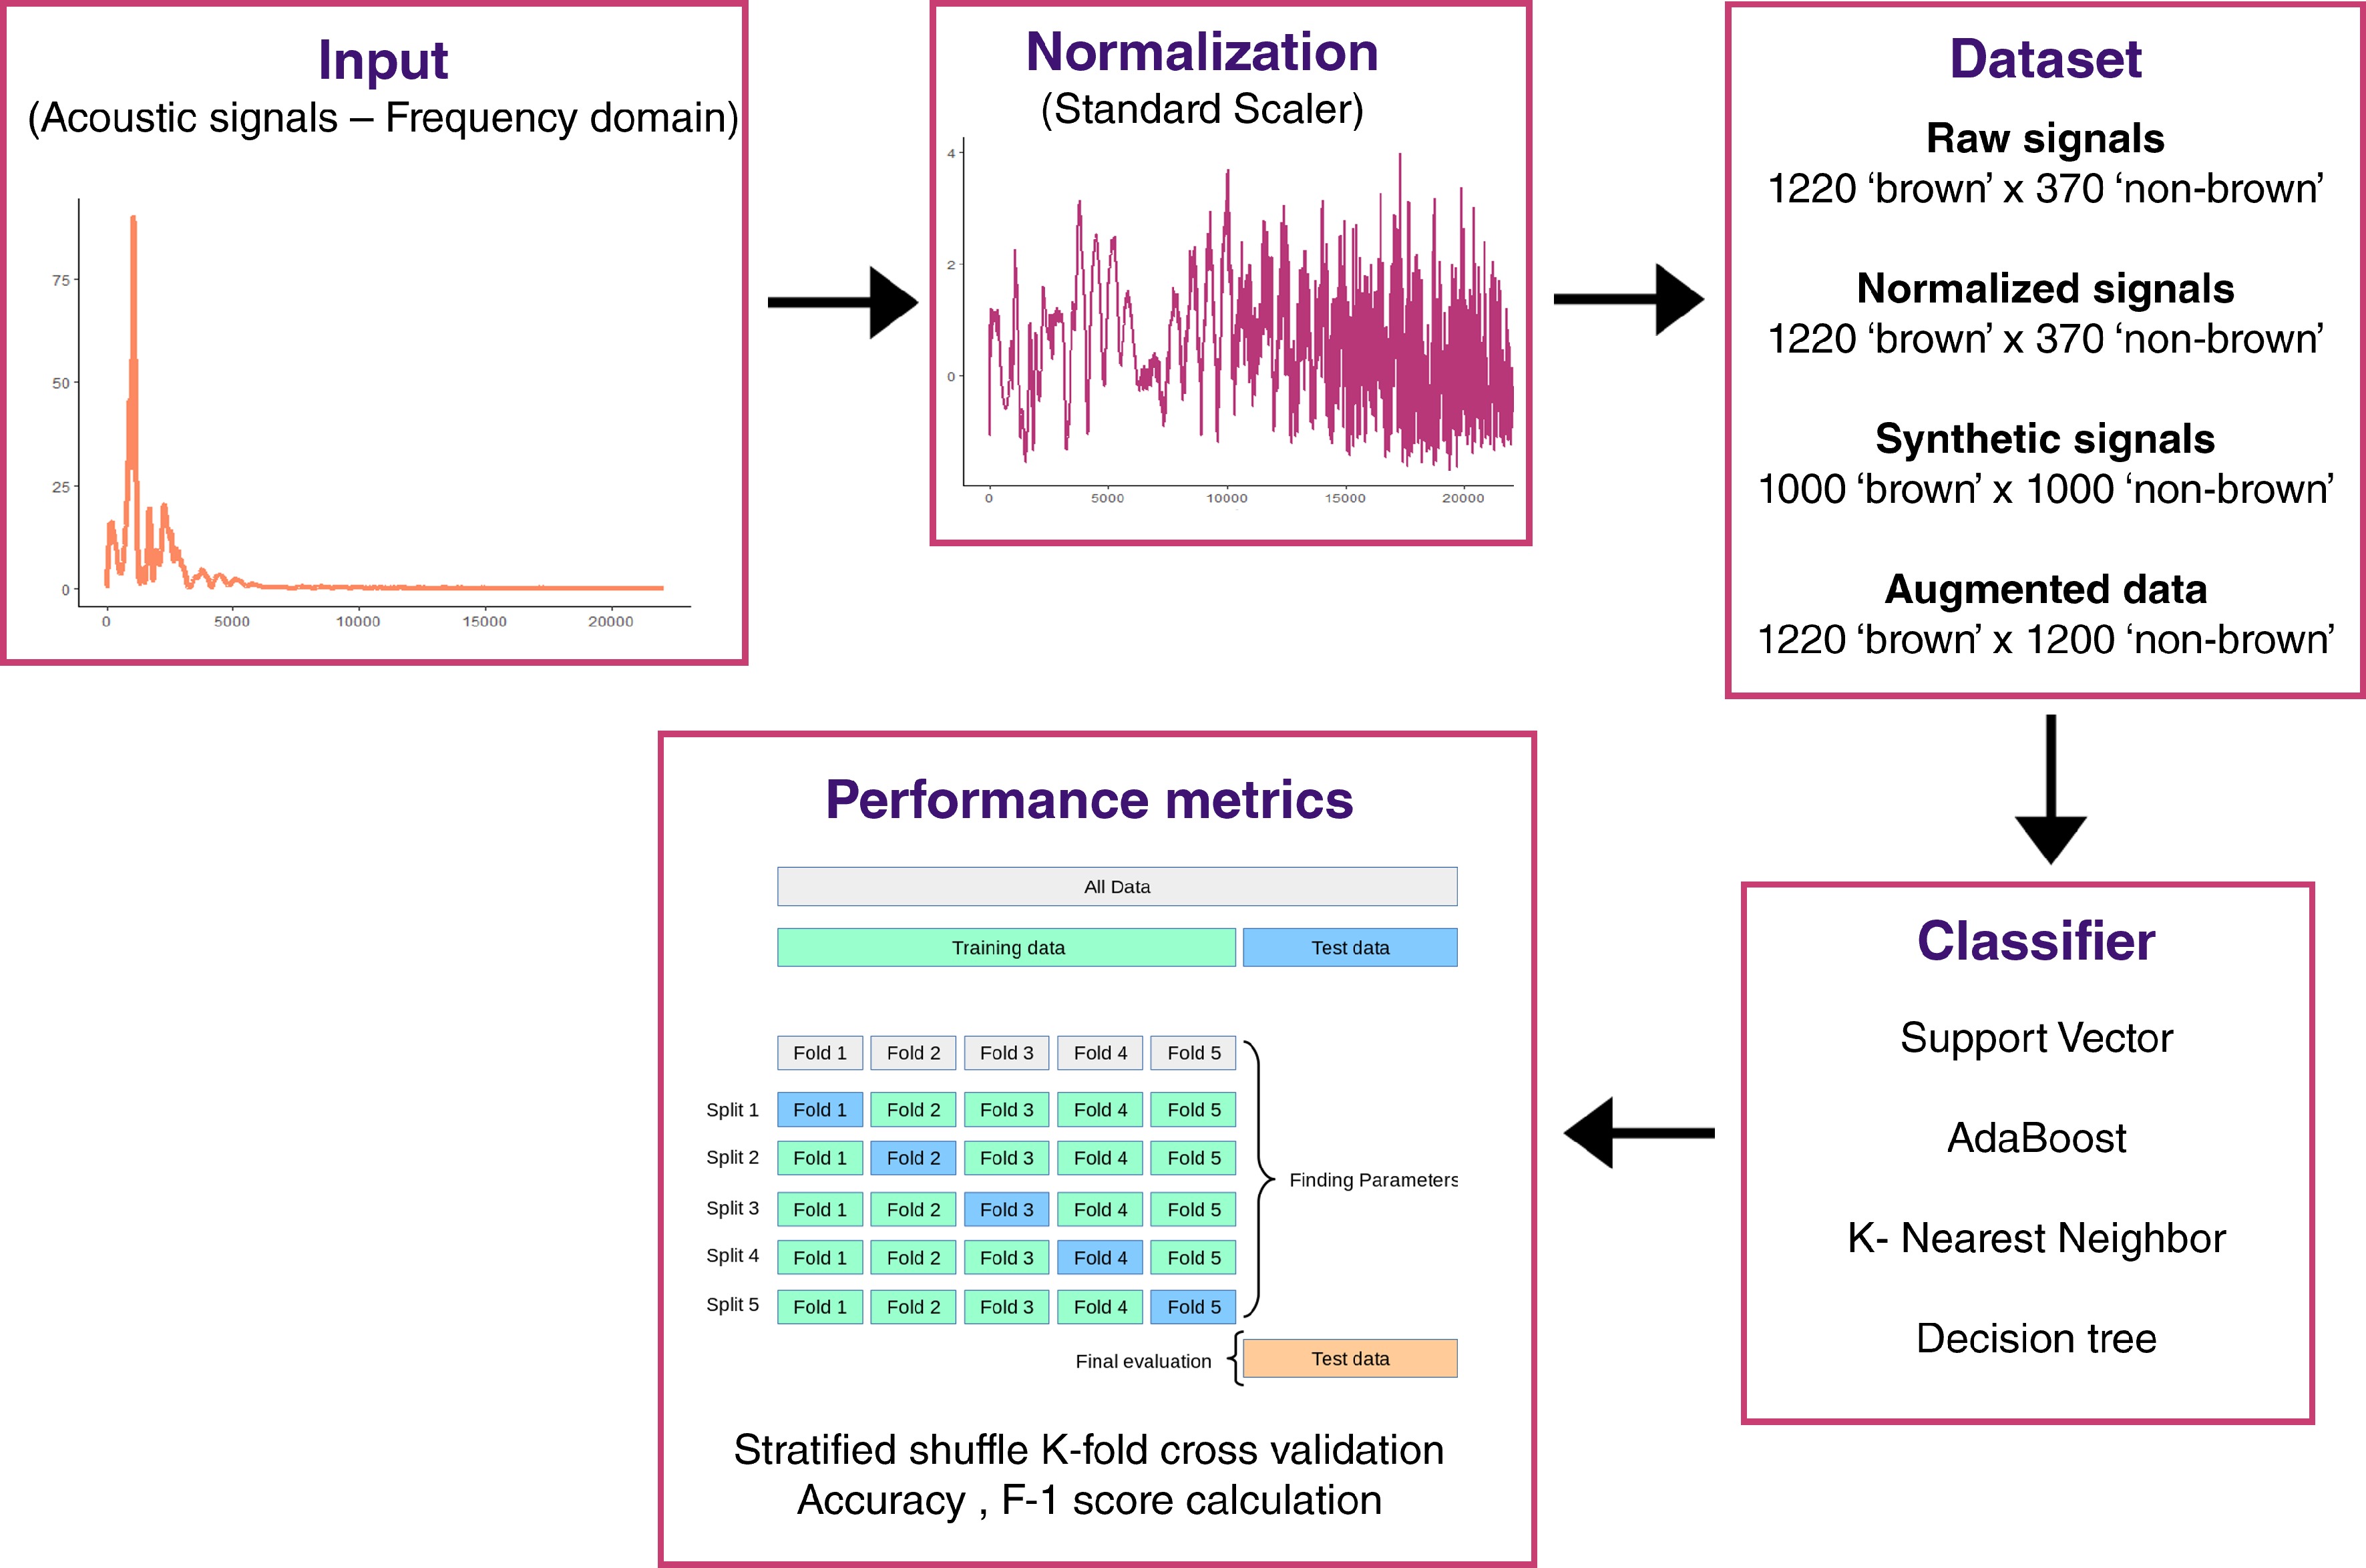
Figure 2.
Overview of acoustic signal analysis workflow.
Acoustic signal acquisition
-
Acoustic signals were acquired with a commercial acoustic sensor (model AFS; AWETA). As visible in Fig. 2, it records the weight and resonant frequencies of the acoustic vibration generated by mechanical solicitation on the fruit. Acoustic measurements were performed with ten repetitions per fruit, considering two faces on the equatorial plane (five repetitions for each face). The left and right parts from the sunny-side of the fruit were chosen to limit maturity biases. Frequency data were then compiled for each signal with a total of 1,590 acoustic signals for 159 apples. 1,220 signals annotated as 'non-brown' and 370 signals annotated as 'brown'.
Data preparation and augmentation
-
To normalize data, StandardScaler with scikit-learn[35] was applied to frequency data (Fig. 2). This scaler standardizes features by removing the mean and scaling to unit variance. Given an unbalanced dataset containing too few browned fruits and to limit overfitting, a data augmentation was implemented from normalized data. To generate synthetic signals, a conditional Generative Adversial Network (cGAN) was trained from annotated normalized data. This cGAN was developed with tf.keras, a Tensorflow[36] specific implementation of the Keras API specification[37]. Such cGAN architecture was made up of a generator, which takes a noise vector of dimension 100 and binary class label and processes combined input through a fully-connected dense layer with 128 units and ReLu activation function that gives as output a tensor of shape 4097; and a discriminator, which takes a tensor of shape 4097 and processes it into a fully-connected dense layer with 128 units and ReLu activation function that provides as output the probability of the data to belong to each of the two class labels (Fig. 2). Our cGAN was trained over 50,000 iterations (Supplementary Fig. S1) and the trained generator was used to generate 2,000 signals: 1,000 signals annotated as 'non-brown' and 1,000 signals annotated as 'brown'. The dataset was then augmented with 850 signals ('Augmented data') annotated as 'brown' randomly selected from the original synthetic dataset. As a consequence, augmented data were composed of 2,440 acoustic signals with 1,220 signals annotated as 'brown' and 1,220 signals annotated as 'non-brown'. Datasets were analyzed for model construction and performance evaluation: raw data, normalized data, synthetic data, and augmented data.
Model performance evaluation
-
Machine Learning (ML) classifiers were implemented with scikit-learn library[35] in Python. Four classifiers were tested: 'support vector machine', 'k-nearest neighbors', 'Adaboost', and 'decision tree'. These classifiers were tested with the following parameters: classweight = 'balanced', nneigbhors = 2, algorithm = 'SAMME', and randomstate = 0, respectively. Quality scores (accuracy and F1-score) were calculated with associated functions. Accuracy score computes the count of the fraction of correct predictions:
Accuracy=TN+TPTN+FP+TP+FN The F1-score was calculated with the following formula:
F1=2×TP2×TP+FP+FN where TP is the number of true positives, FN is the number of false negatives, and FP is the number of false positives, and F1 ϵ [0,1]. To avoid overfitting and improve model evaluation, stratified shuffle K-fold cross validation was performed. Stratified shuffle K-fold creates randomized splits by preserving the same percentage for each target class as in the complete set. Train-test data split ratio was 80/20. Accuracy and F1-score were calculated for each fold (n = 5) and mean and standard deviation were estimated.
-
Ratio and overall brown flesh demonstrated positive broad-sense heritability with h2 values of 0.567, 0.656, 0.477, and 0.592 for ratio 60d, ratio 120d, surface 60d, and surface 120d, respectively (Supplementary Table S1), and allowed BLUP calculation (Supplementary Table S1). BLUP ratio 60d values ranged from −0.101 to 1.640 with an overall mean of 0.271. BLUP ratio 120d values ranged from −0.184 to 1.623 with an overall mean of 0.467. BLUP surface 60d values ranged from −0.047 to 1.007 with an overall mean of 0.136. BLUP ratio 120d values ranged from 0.245 to 1.408 with an overall mean of 0.467. An increase in frequency of brown fruits and brown surfaces were observed from 60d to 120d and confirmed an increase incidence of browning symptoms over time. Red-flesh color intensity varied greatly among genotypes displaying R6-MdMYB10 without the 'F' allele[29], with variations from 10.03 to 64.21 and a mean of 36.15 for BLUP a* values (Supplementary Table S1).
As expected, browning-related traits were positively correlated with red-flesh color intensity with Pearson correlation values of 0.568, 0.669, 0599, and 0.636 for BLUP ratio 60d, BLUP ratio 120d, BLUP surface 60d, and BLUP surface 120d, respectively (Supplementary Fig. S2). Ratio and surface were also strongly correlated for each acquisition time with Pearson correlation values of 0.900 and 0.879 for BLUP ratio 60d and BLUP surface 60d, BLUP ratio 120d, and BLUP surface 120d, respectively. Altogether phenotypic traits were positively correlated with Pearson correlation values comprised between 0.568 (correlation between BLUP ratio 60d and BLUP a*), and 0.900 (correlation between BLUP surface 60d and BLUP ratio 60d).
QTL detection and haplotype analysis
-
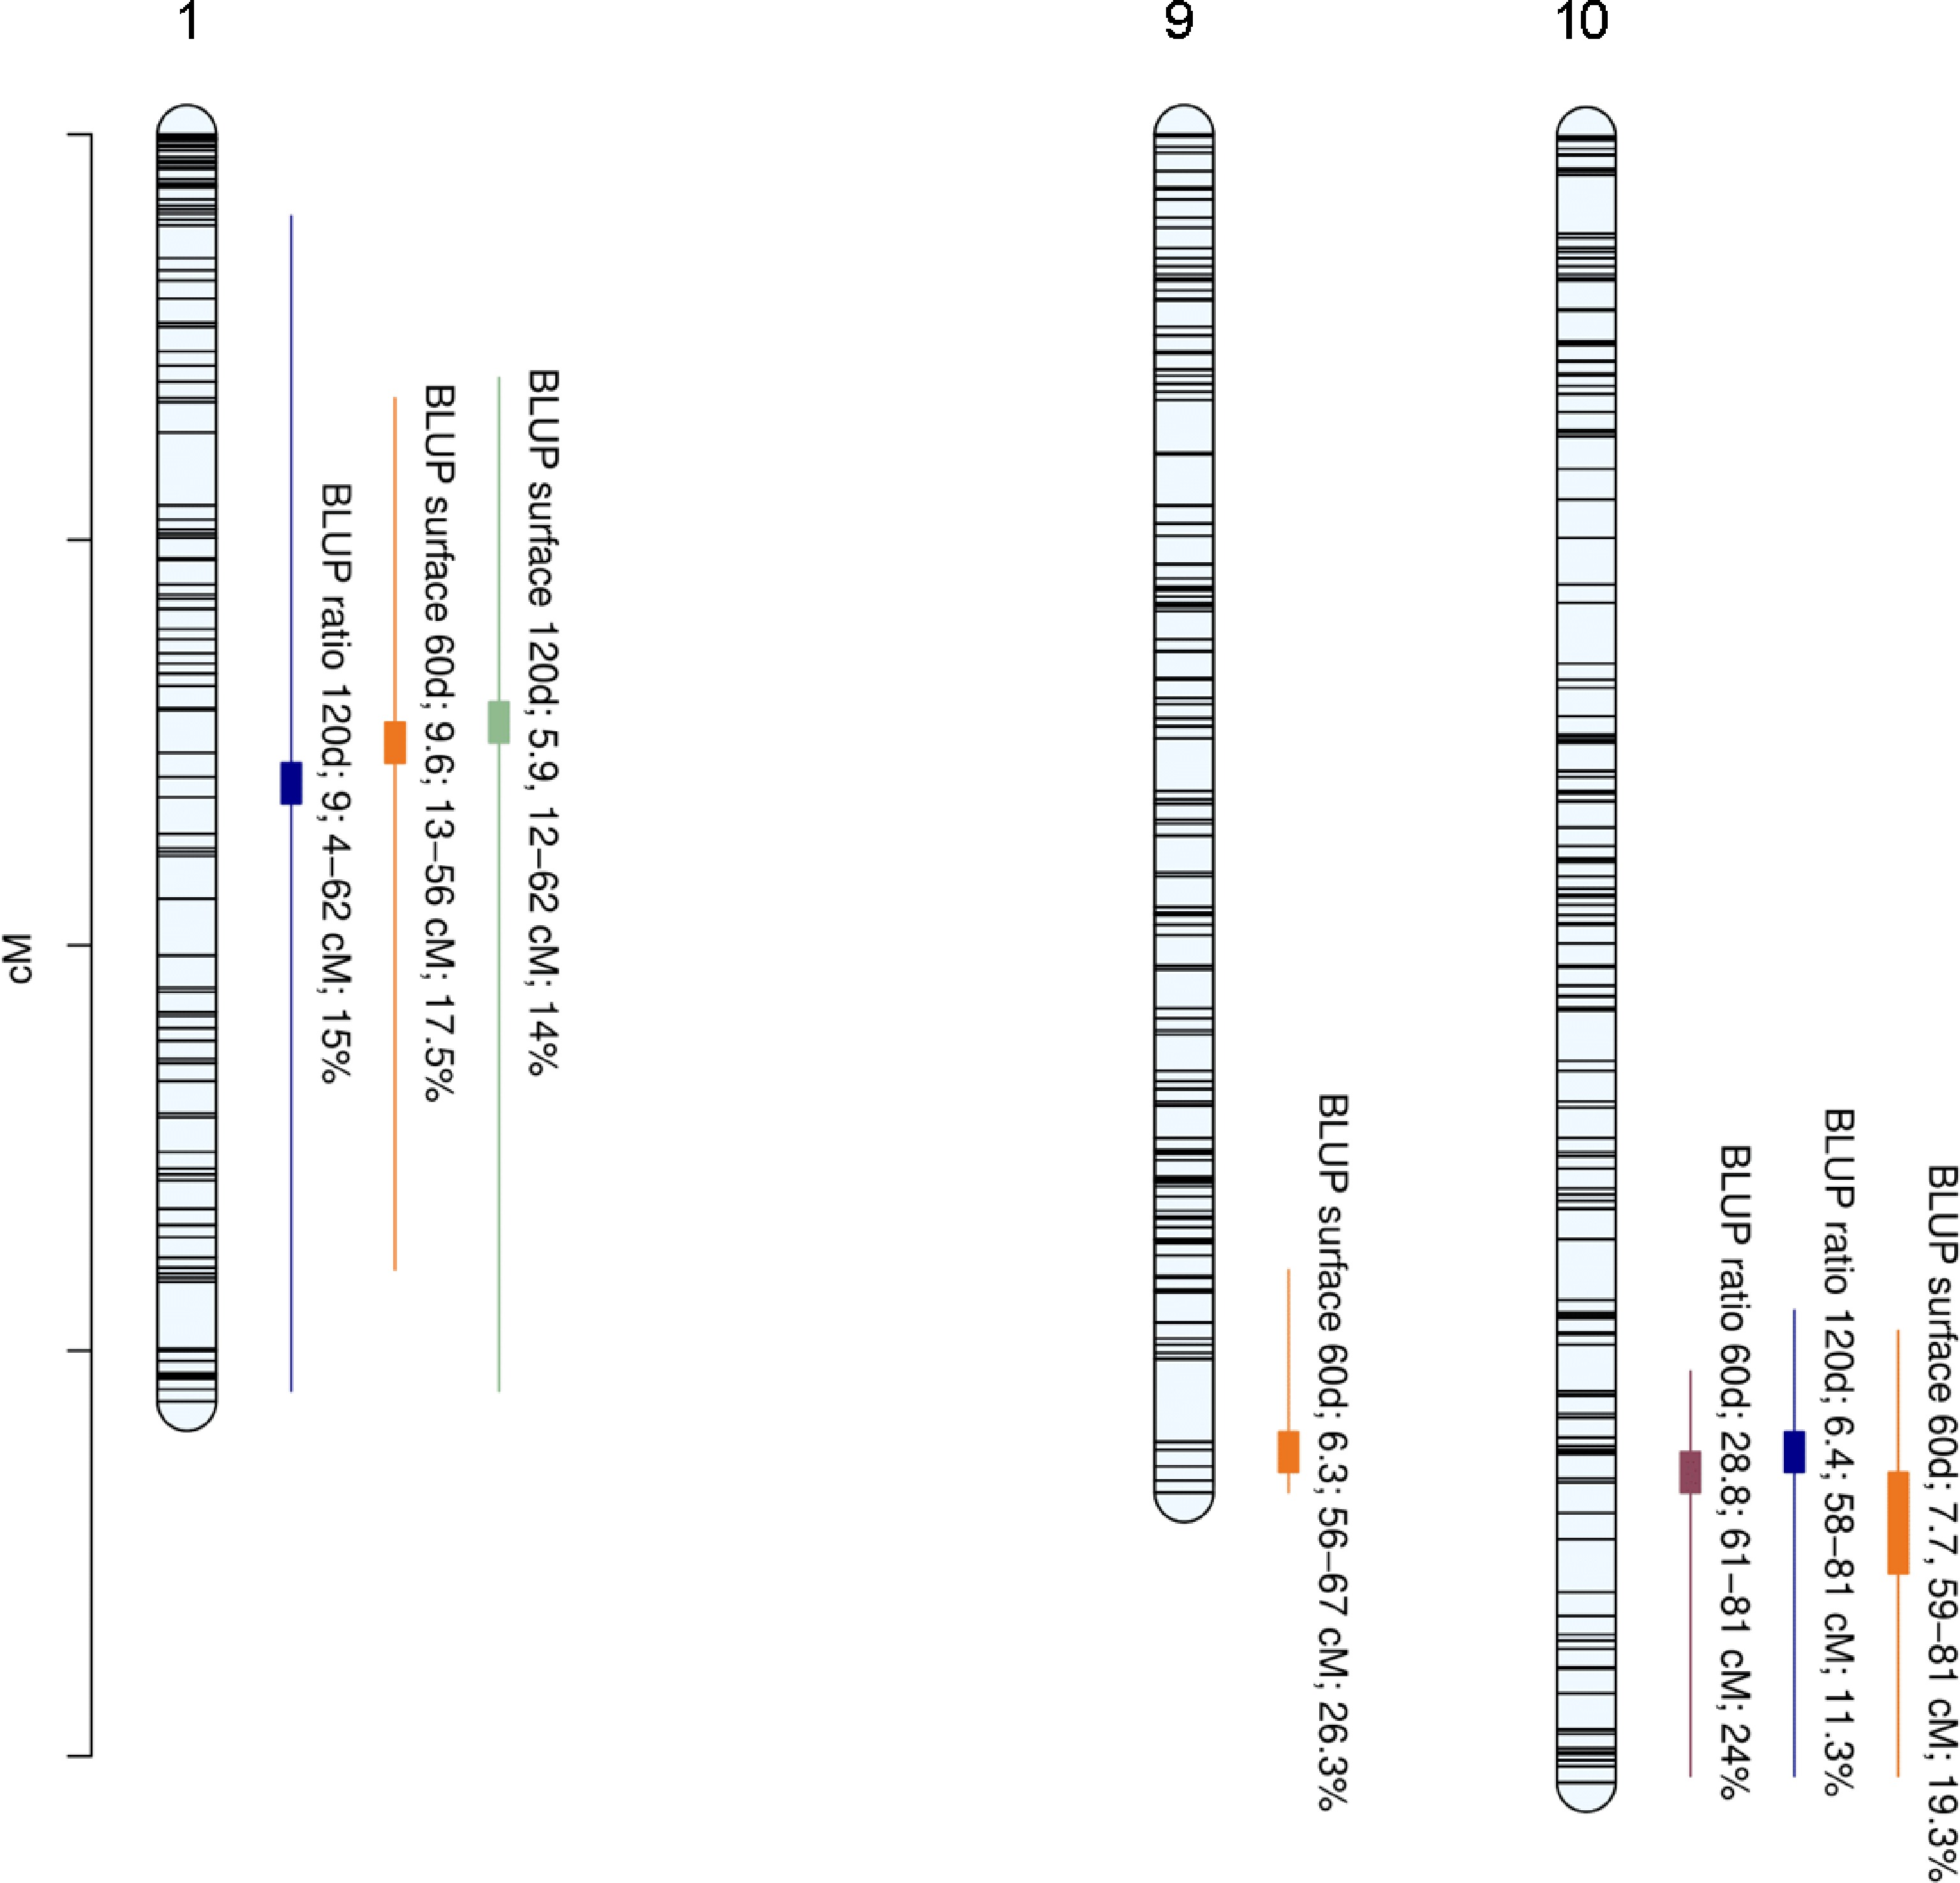
A total of seven QTLs were detected with strong evidence (Supplementary Table S2) for the four phenotypic traits on LG1, LG9, and LG10 (Table 1, Fig. 3). A locus on LG1 was found to be significantly associated with BLUP ratio 120d, BLUP surface 60d, and BLUP surface 120d with PVEs of 15%, 17.5%, and 14% respectively. LG1-QTL modes were detected at 33 cM, 30 cM, and 29 cM for BLUP ratio 120d, BLUP surface 60d, and BLUP surface 120d, respectively. A locus on LG9 was found to be significantly associated with BLUP surface 60d with a PVE of 26.3%. LG9-QTL mode was detected at 65 cM. Finally, a locus on LG10 was found to be significantly associated with BLUP ratio 60d, BLUP ratio 120d, and BLUP surface 60d with PVEs of 24%, 11.3%, and 19.3%, respectively. LG10-QTL modes were detected at 66 cM, 65 cM, and 66 cM for BLUP ratio 60d, BLUP ratio 120d, and BLUP surface 60d, respectively.
Table 1. Summary of BLUP internal browning related QTLs
Trait (Year) broad-sense heritability Chr Replicate Run BF (1 vs. 0) BF (2 vs. 1) QTL interval (cM) Mode (cM) PVE (%) BLUP ratio60 0.567 10 1 28.8 2.7 [61,81] 66 24 10 2 12 3 [57,81] 65 24.9 BLUP ratio120 0.656 1 1 9 2.4 [4,62] 33 15 1 2 8.3 2.1 [2,62] 32 14.4 10 1 6.4 1.4 [58,81] 65 11.3 10 2 6.3 1.6 [57,81] 66 11.9 BLUP surface 60 0.477 1 1 9.6 0.5 [13,56] 30 17.5 1 2 10.8 0.7 [13,46] 29 17.6 9 1 6.3 −0.6 [56,67] 65 26.3 9 2 5.6 −0.1 [57,67] 65 21.1 10 1 7.7 2.2 [59,81] 66 19.3 10 2 7.9 2.6 [56,81] 71 17.5 BLUP surface 120 0.592 1 1 5.9 1.9 [12,62] 29 14 1 2 6.3 2.3 [9,62] 28 14 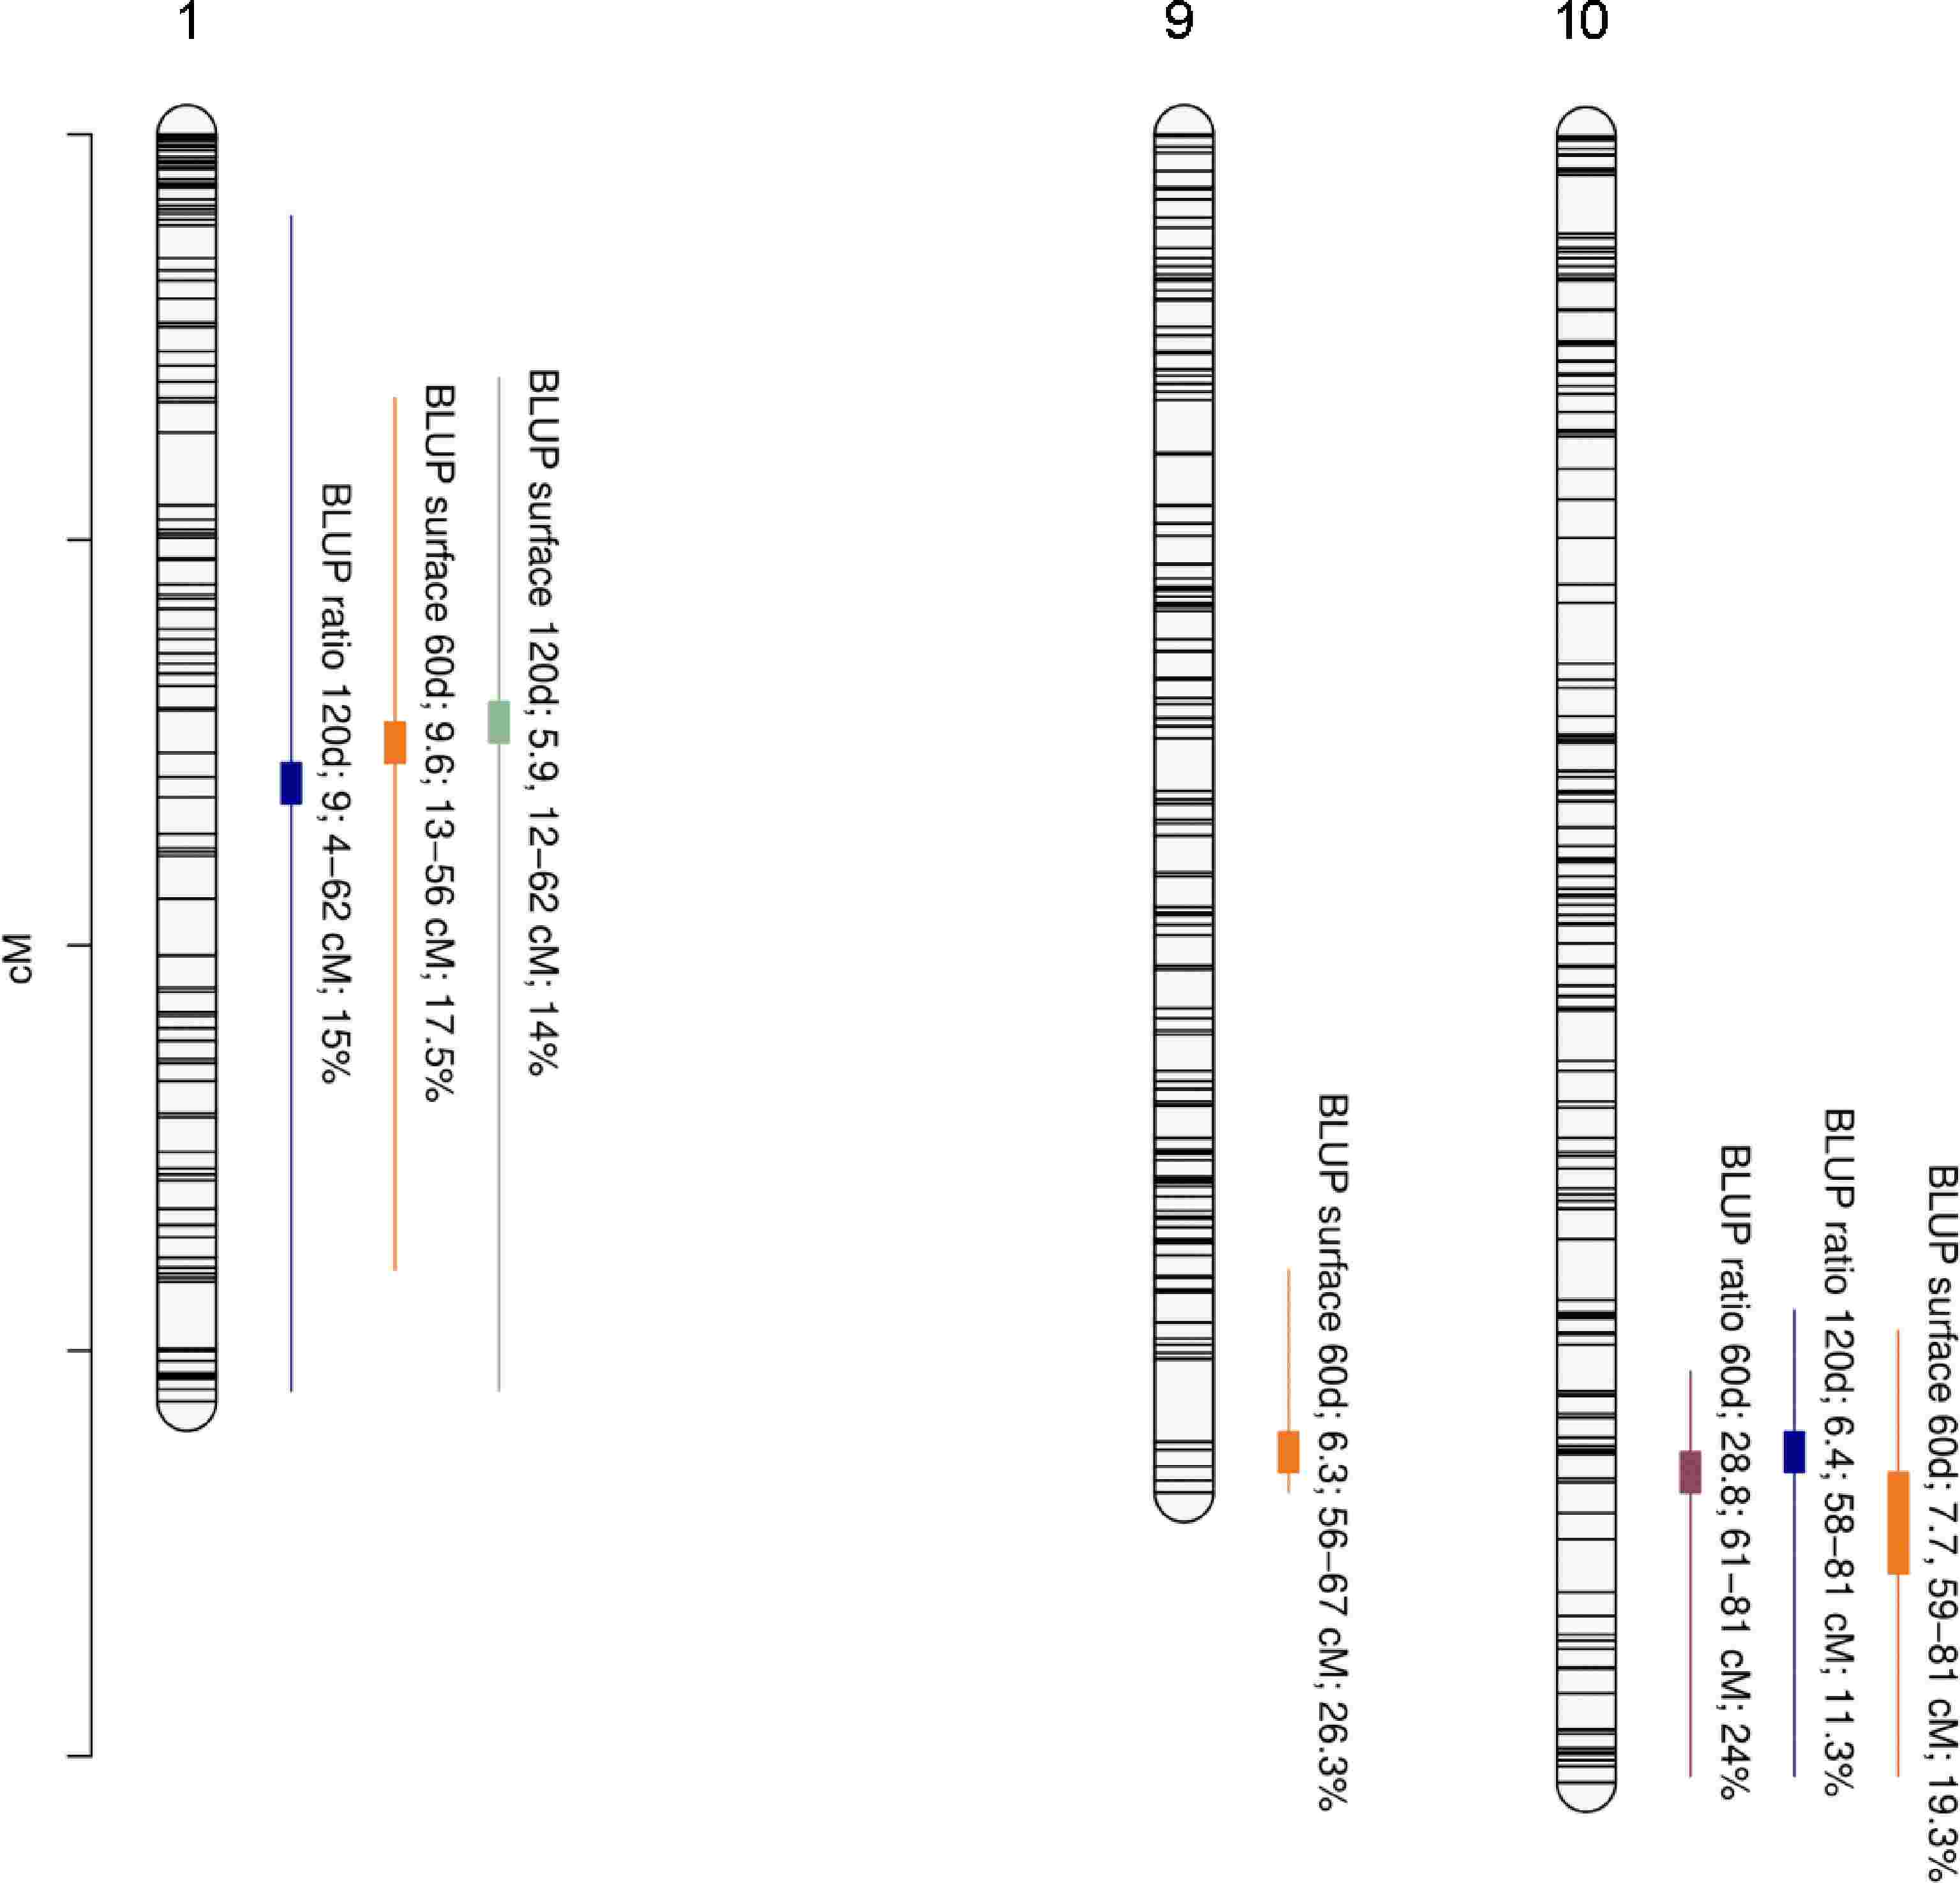
Figure 3.
Positions of QTLs controlling internal browning related traits. Linkage group (LG) numbers are indicated above each group. Positions of SNPs are indicated on the genetic map. Name of the trait is followed by Bayes Factor (BF); QTL region and phenotypic variance explained (PVE).
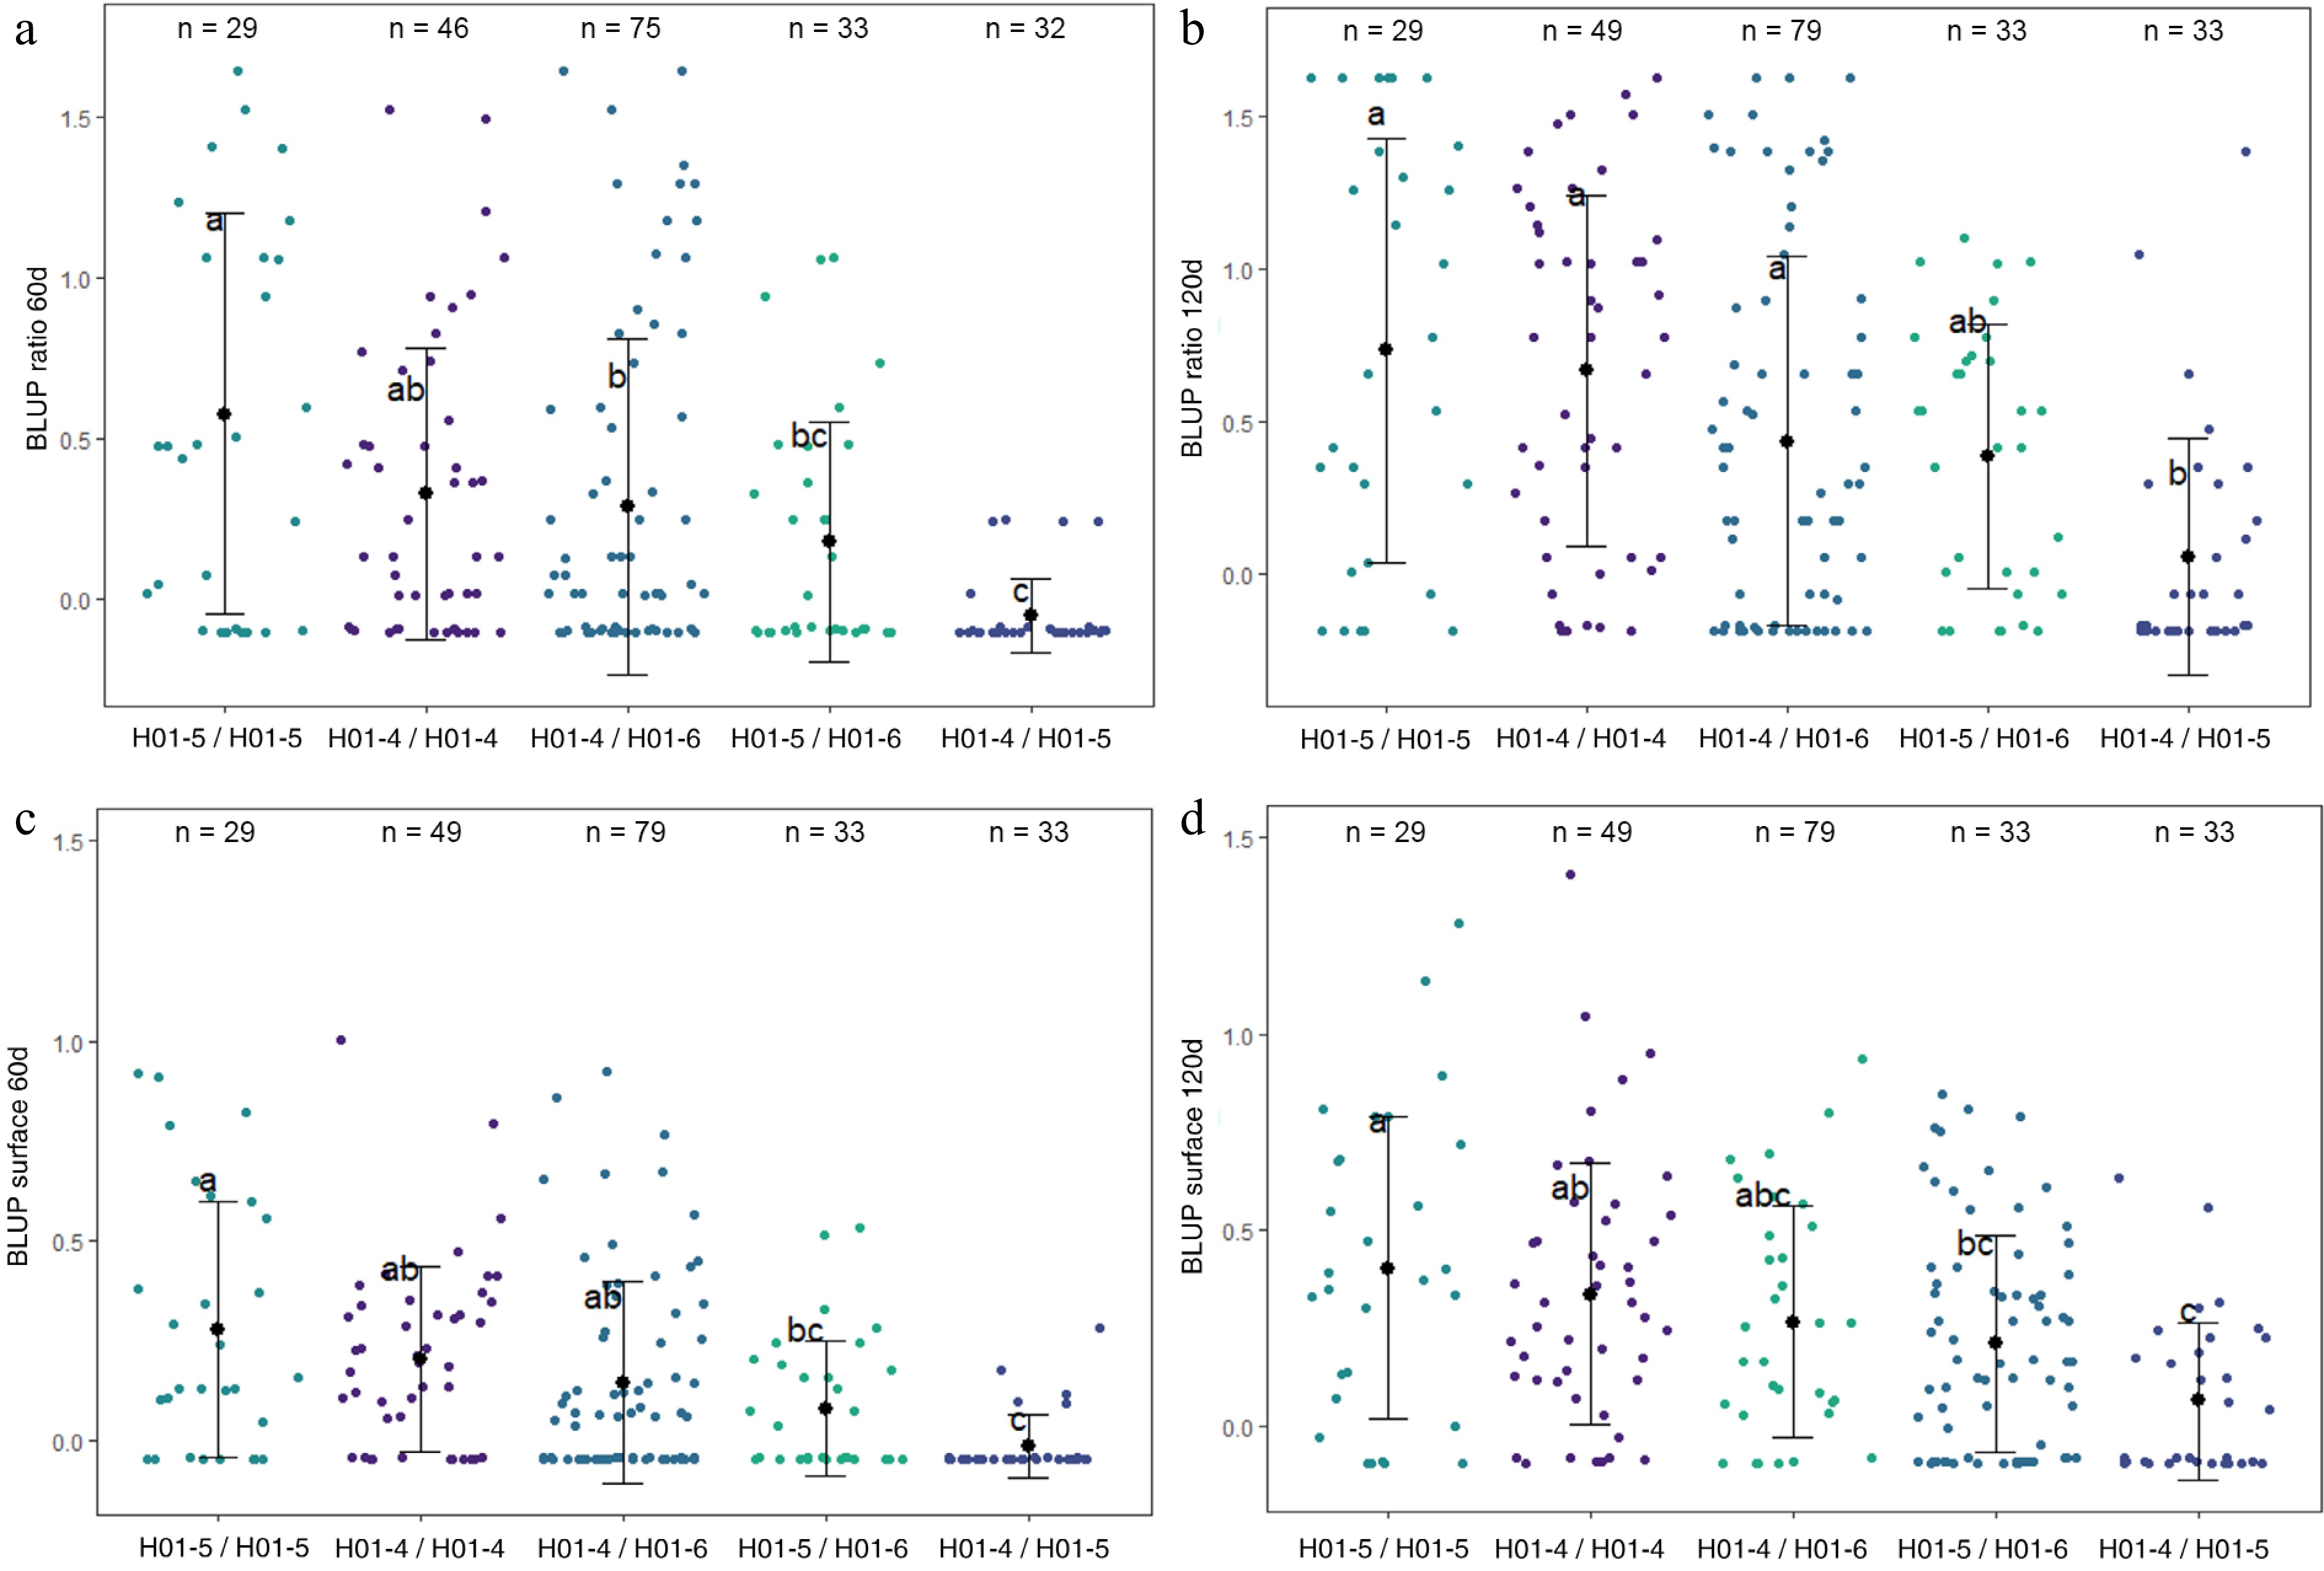
Haplotype analyses were conducted on LG1-QTL (Fig. 4), LG9-QTL (Supplementary Fig. S3), and LG10-QTL (Fig. 5). LG1-QTL haploblock was constructed from 2 SNPs at 34 cM. Three haplotypes were identified at this QTL locus and denoted as H01-4, H01-5, and H01-6. Six diplotypes (diploid combinations of two haplotypes) were observed in the four F1 families. H01-4/H01-5 exhibited significantly lower mean values for BLUP ratio 60d, BLUP ratio 120d, BLUP surface 60d, and BLUP surface 120d.
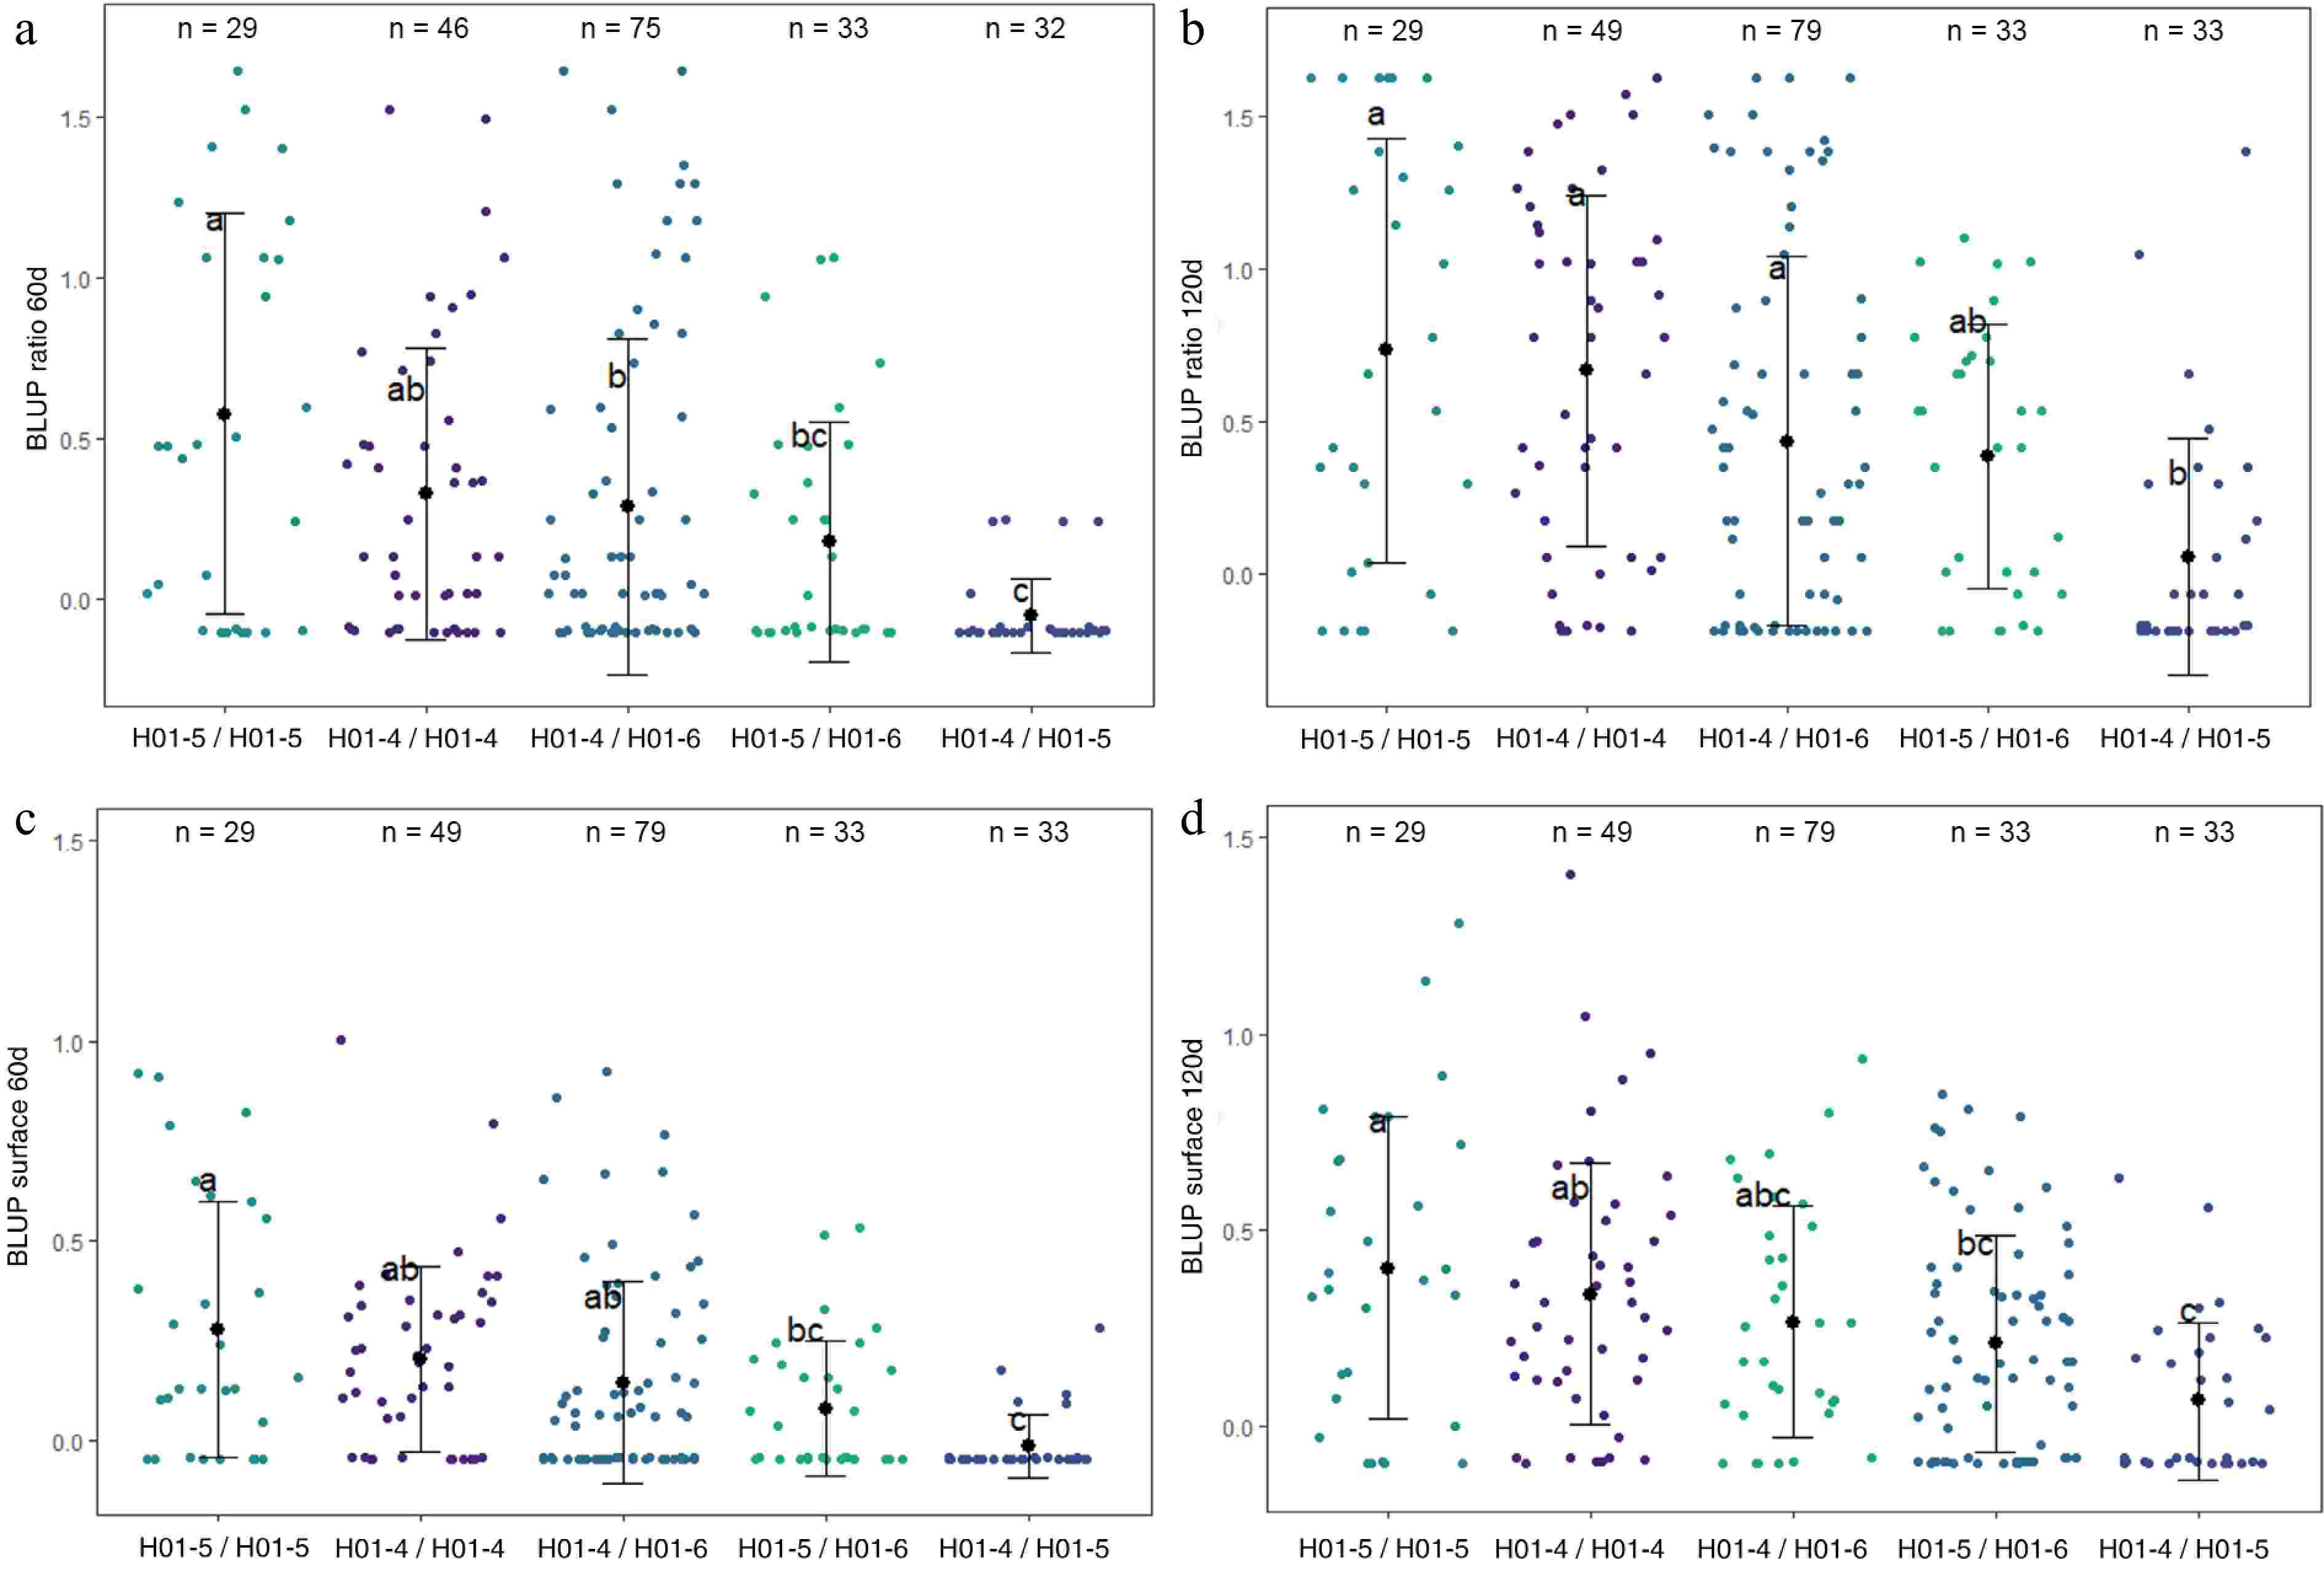
Figure 4.
Distribution of (a) BLUP ratio 60d, (b) BLUP ratio 120d, (c) BLUP surface 60d, and (d) BLUP surface 120d values for the four F1 offspring haplotypes for LG1-QTL. The mean (denoted by colored biggest dot), the standard deviation (vertical line), and single observations (dots) are represented. Number of genotypes (n) are listed above. Significantly different phenotypic means between segregating classes are identified by different letters (Tukey HSD, p < 0.05).
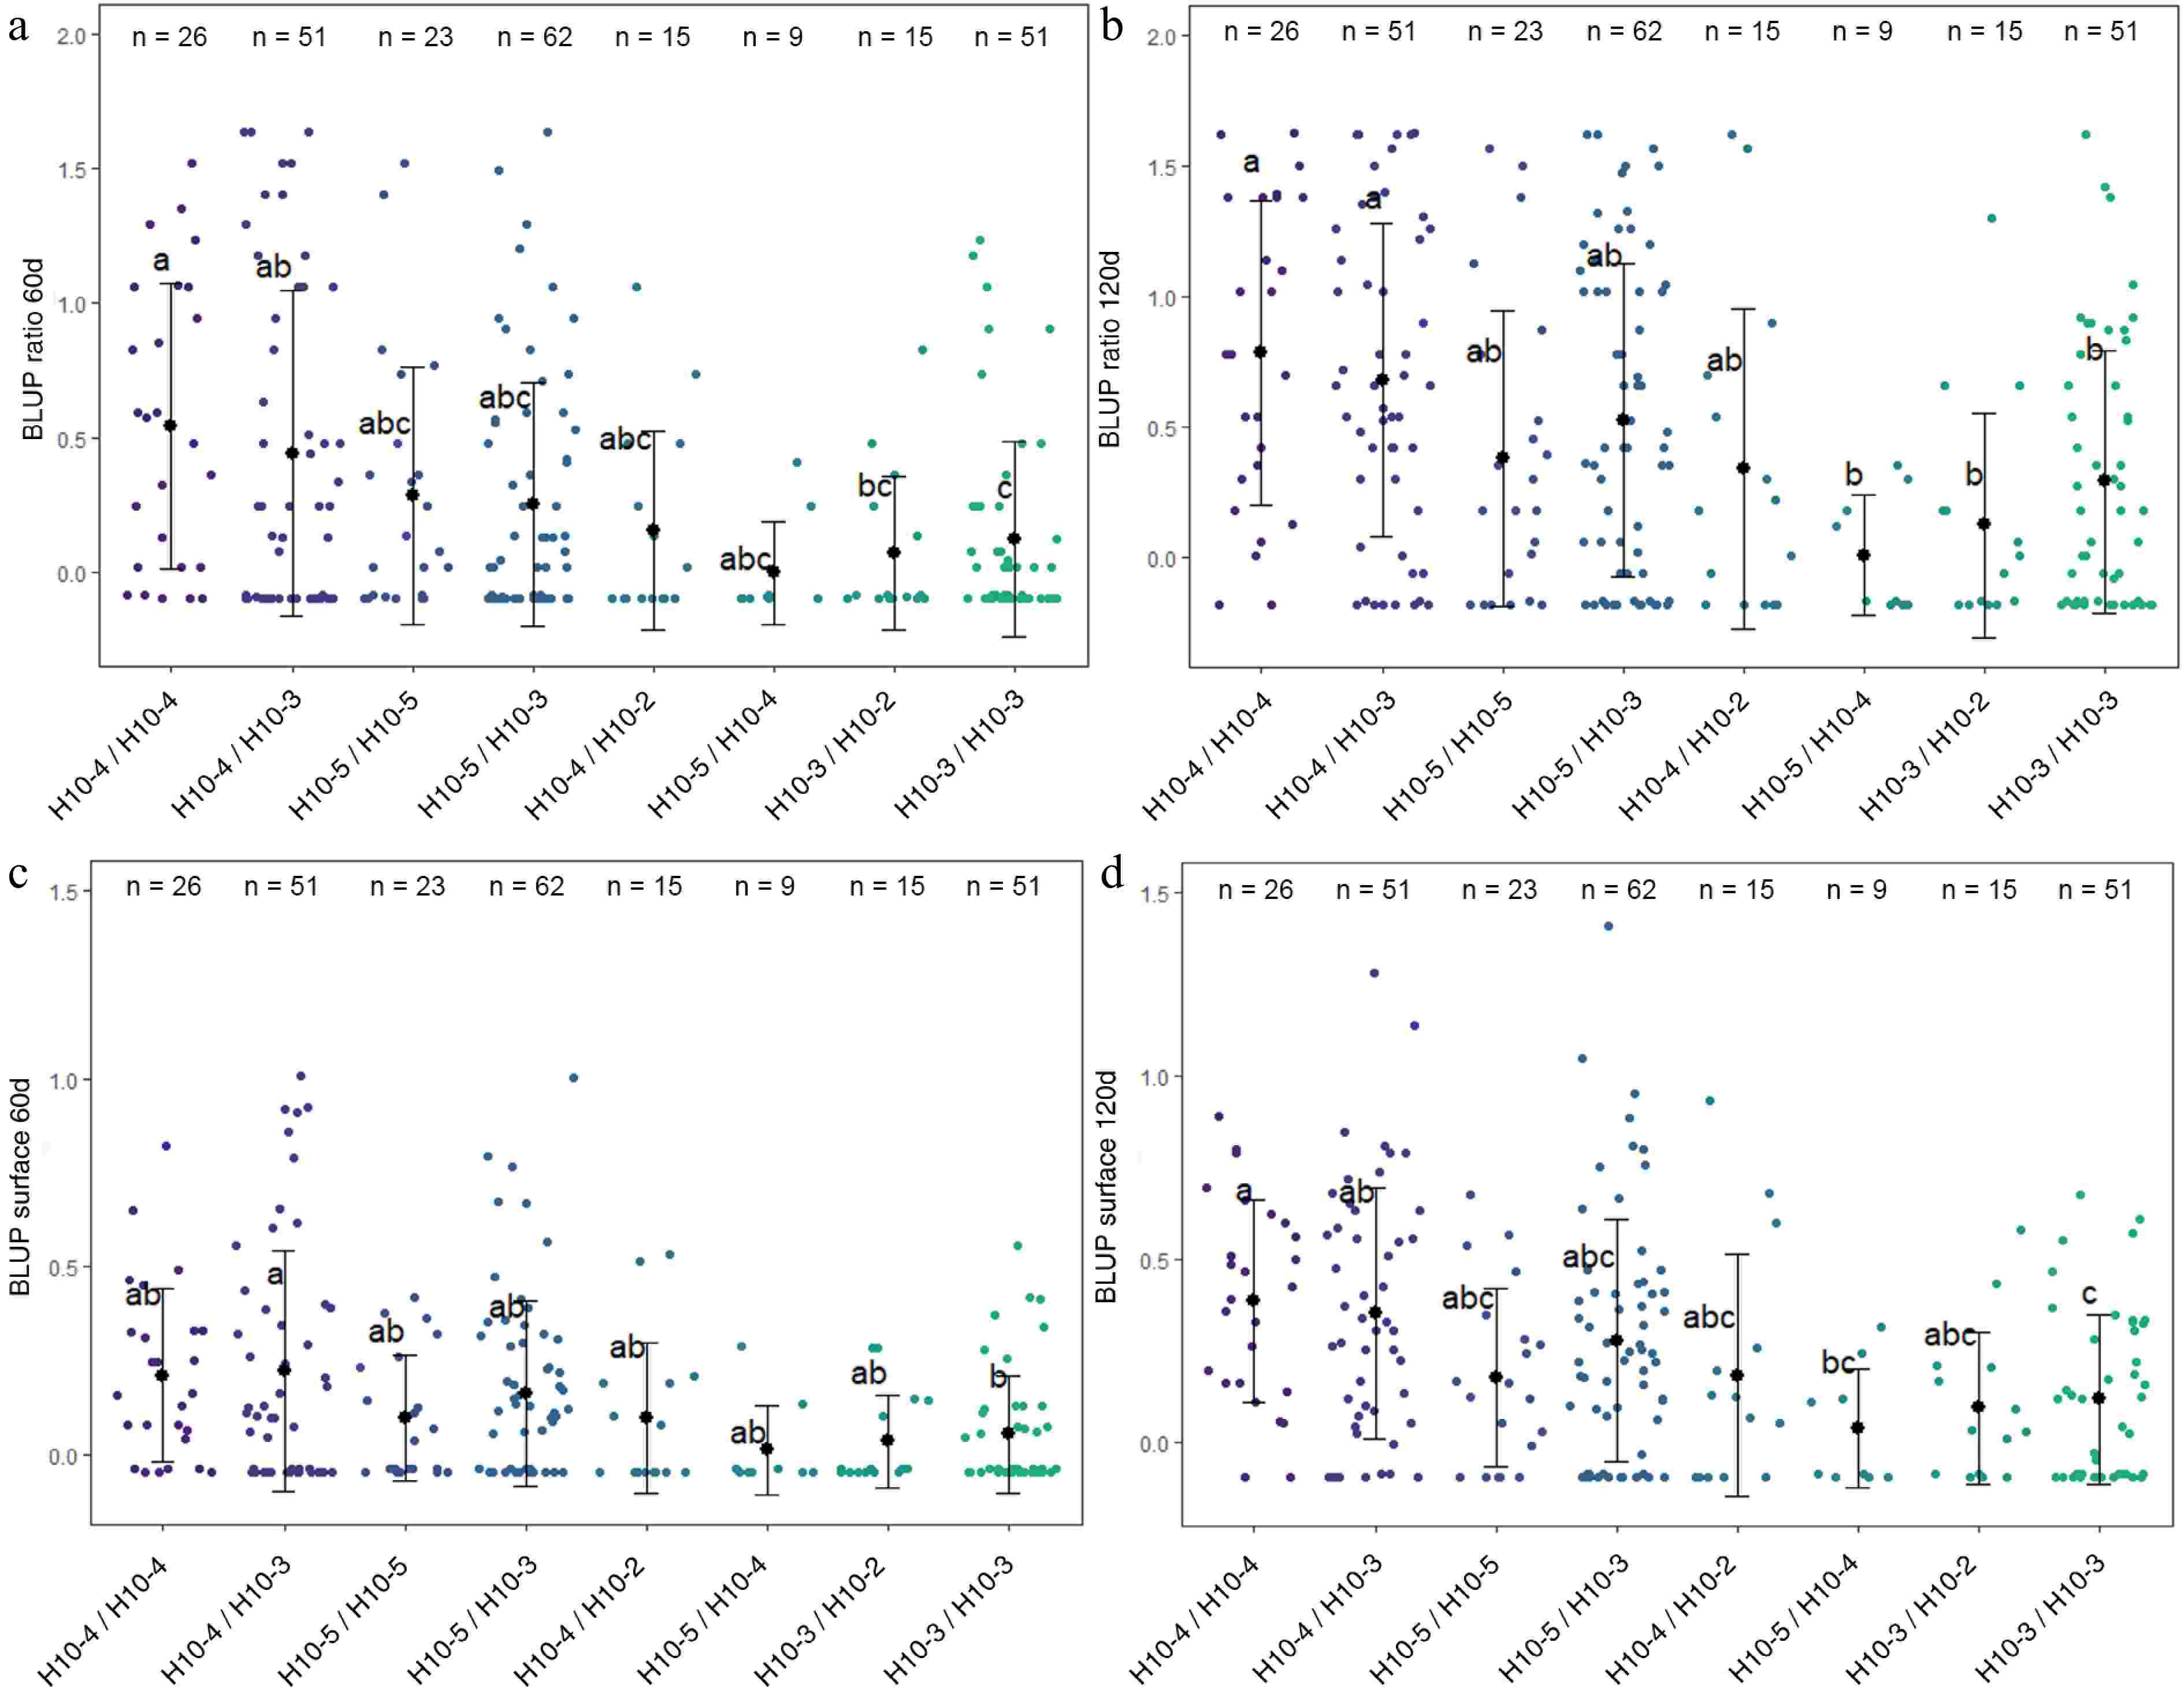
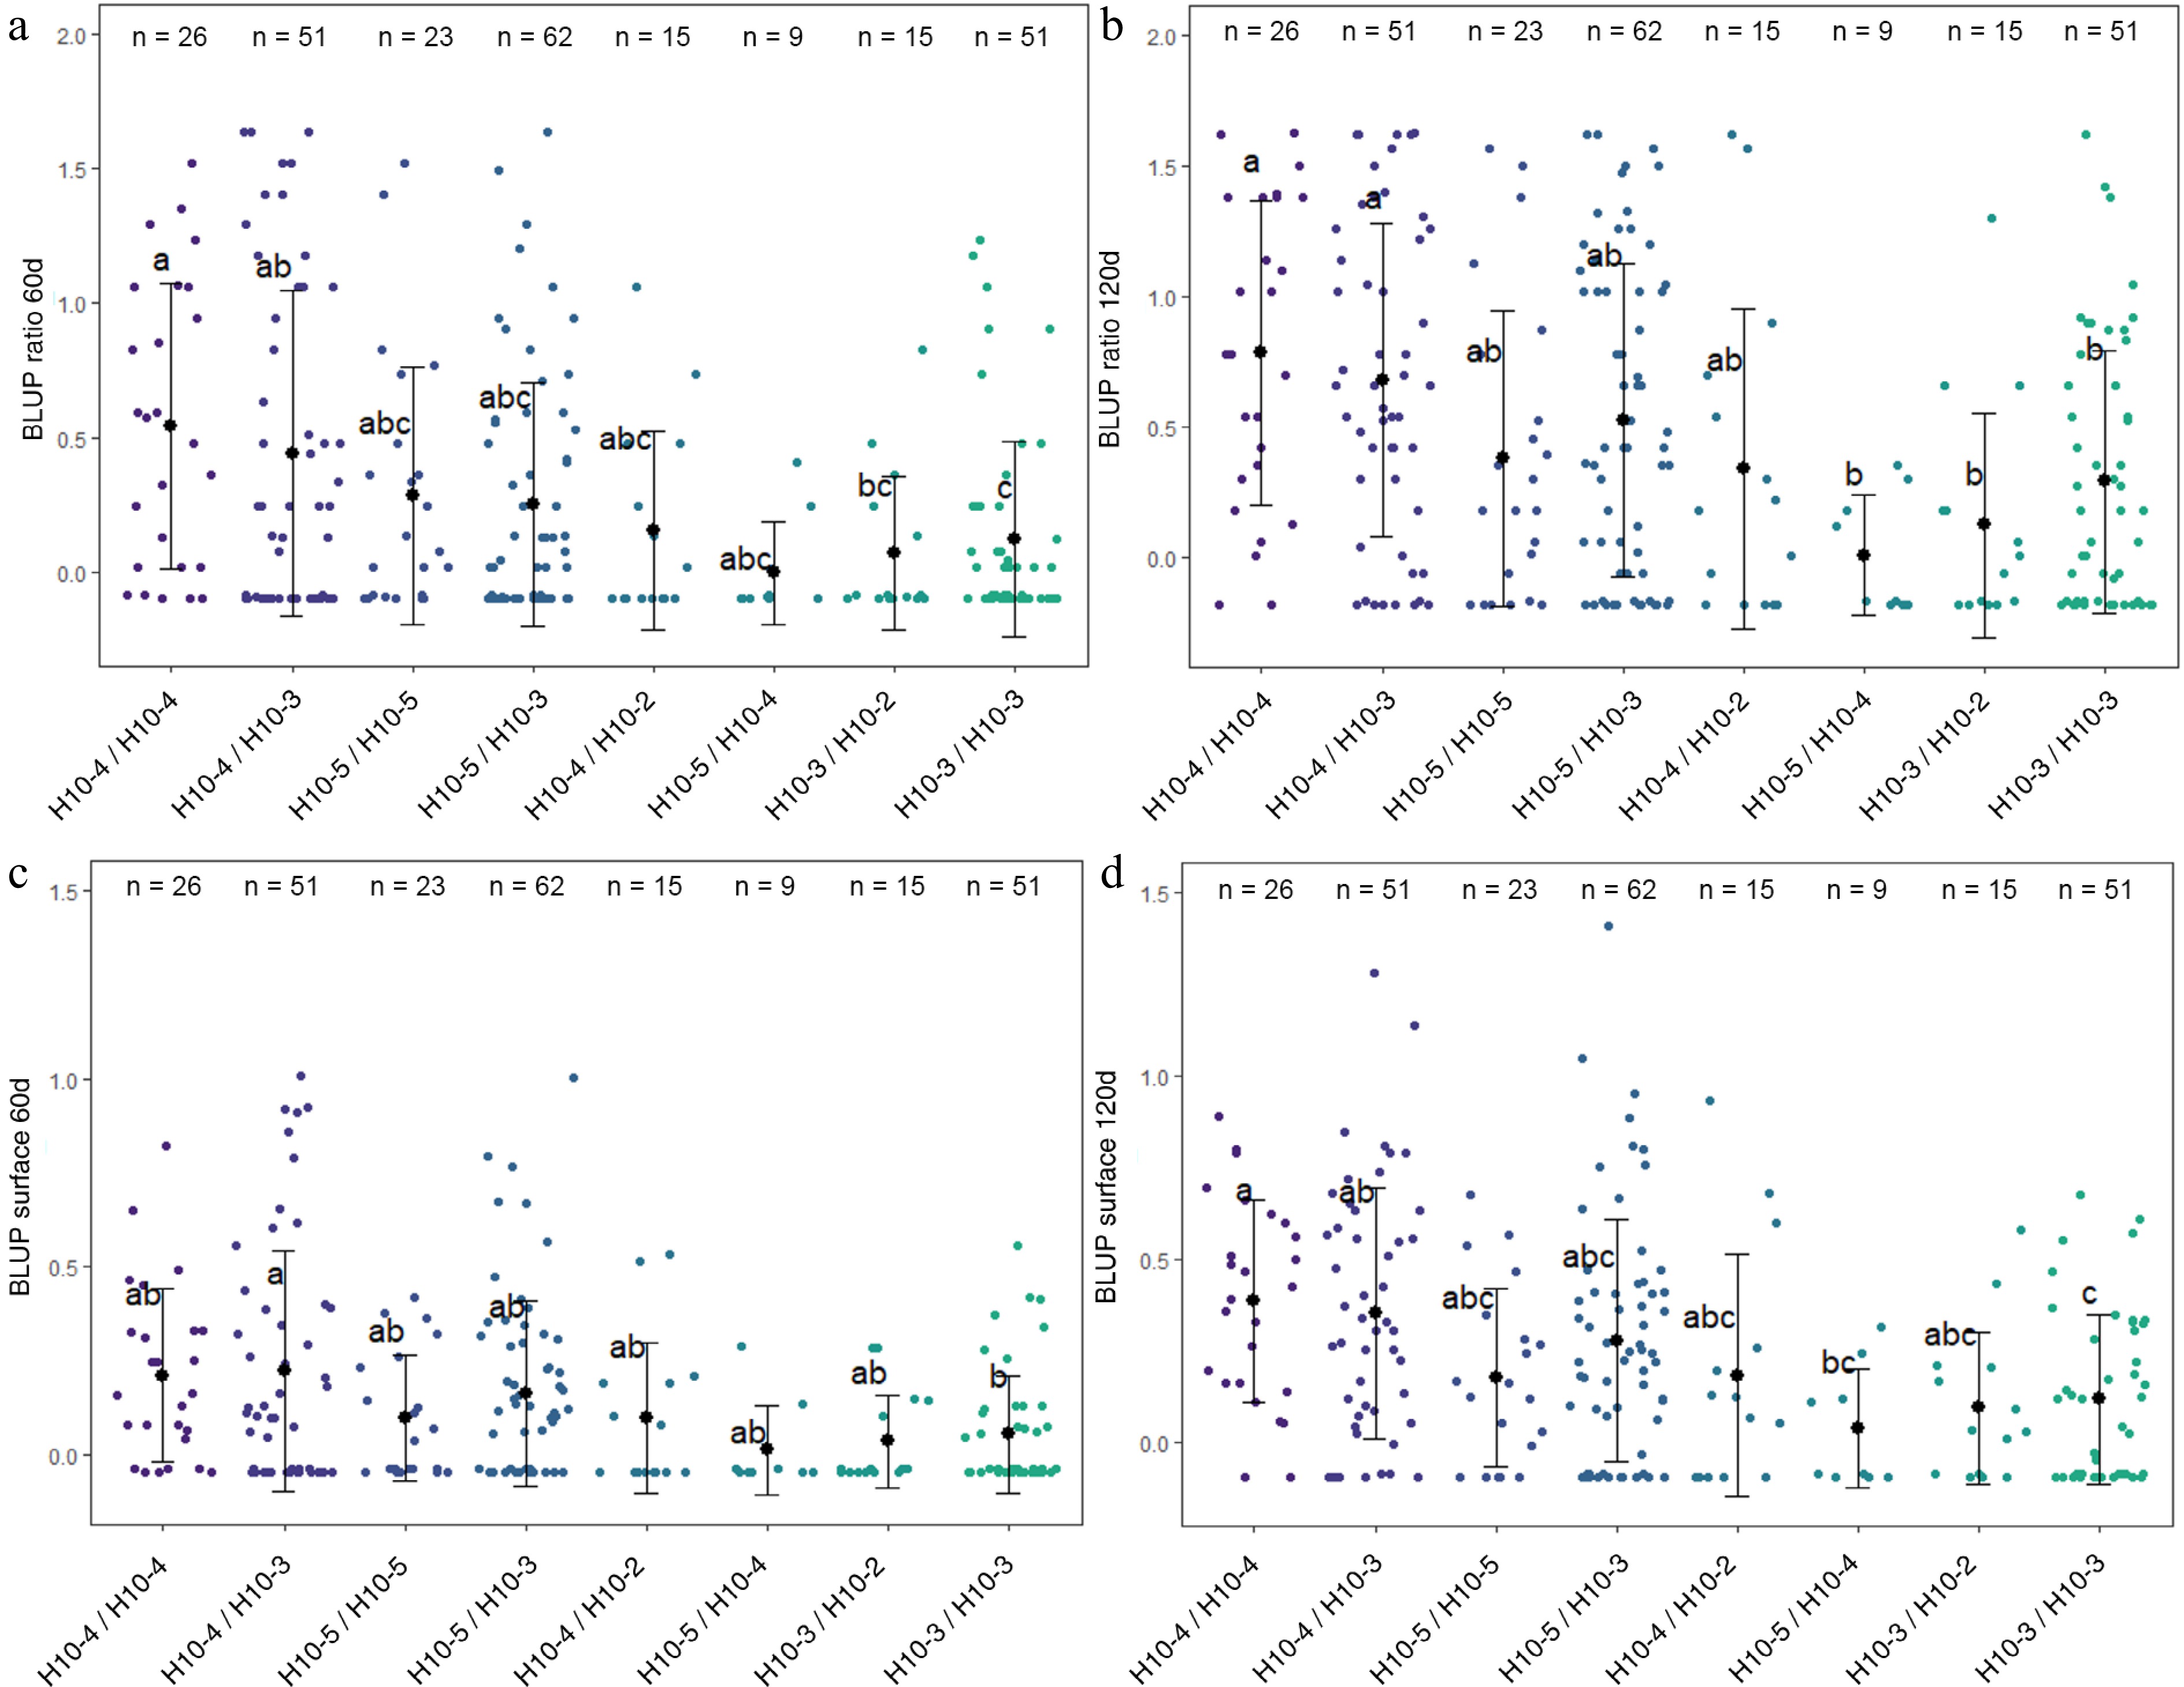
Figure 5.
Distribution of (a) BLUP ratio 60d, (b) BLUP ratio 120d, (c) BLUP surface 60d, and (d) BLUP surface 120d values for the four F1 offspring haplotypes for LG10-QTL. The mean (denoted by colored biggest dot), the standard deviation (vertical line), and single observations (dots) are represented. Number of genotypes (n) are listed above. Significantly different phenotypic means between segregating classes are identified by different letters (Tukey HSD, p < 0.05).
LG1-QTL mode colocalized with a QTL for red-flesh color, flavonol content and anthocyanin content[29]. LG9 QTL haploblock was constructed from 2 SNPs at 65 cM and colocalized with a previously reported QTL for red-flesh color[29]. This QTL colocalized with MdMYB10, which is a major gene for red-flesh color development[6], and was only detected in the RF1-5 family composed of two red-flesh parents (R1R6 × R1R6 segregation). Haplotype characterization confirmed that R6-MdMYB10 homozygotes exhibited higher values for BLUP surface 60d (Supplementary Fig. S3). The LG10-QTL haploblock (H10) was constructed from three SNPs at 66 cM. Four haplotypes were identified at this QTL locus and denoted as H10-2, H10-3, H10-4, and H10-5. Eight diplotypes were observed in the four F1 families. H10-3/H10-3 diplotypes exhibited significantly lower mean values for BLUP ratio 60d, BLUP ratio 120d, BLUP surface 60d, and BLUP surface 120d. Inversely H10-4/H10-4 diplotypes exhibited significantly higher mean values for BLUP ratio 60d, BLUP ratio 120d, and BLUP surface 120d.
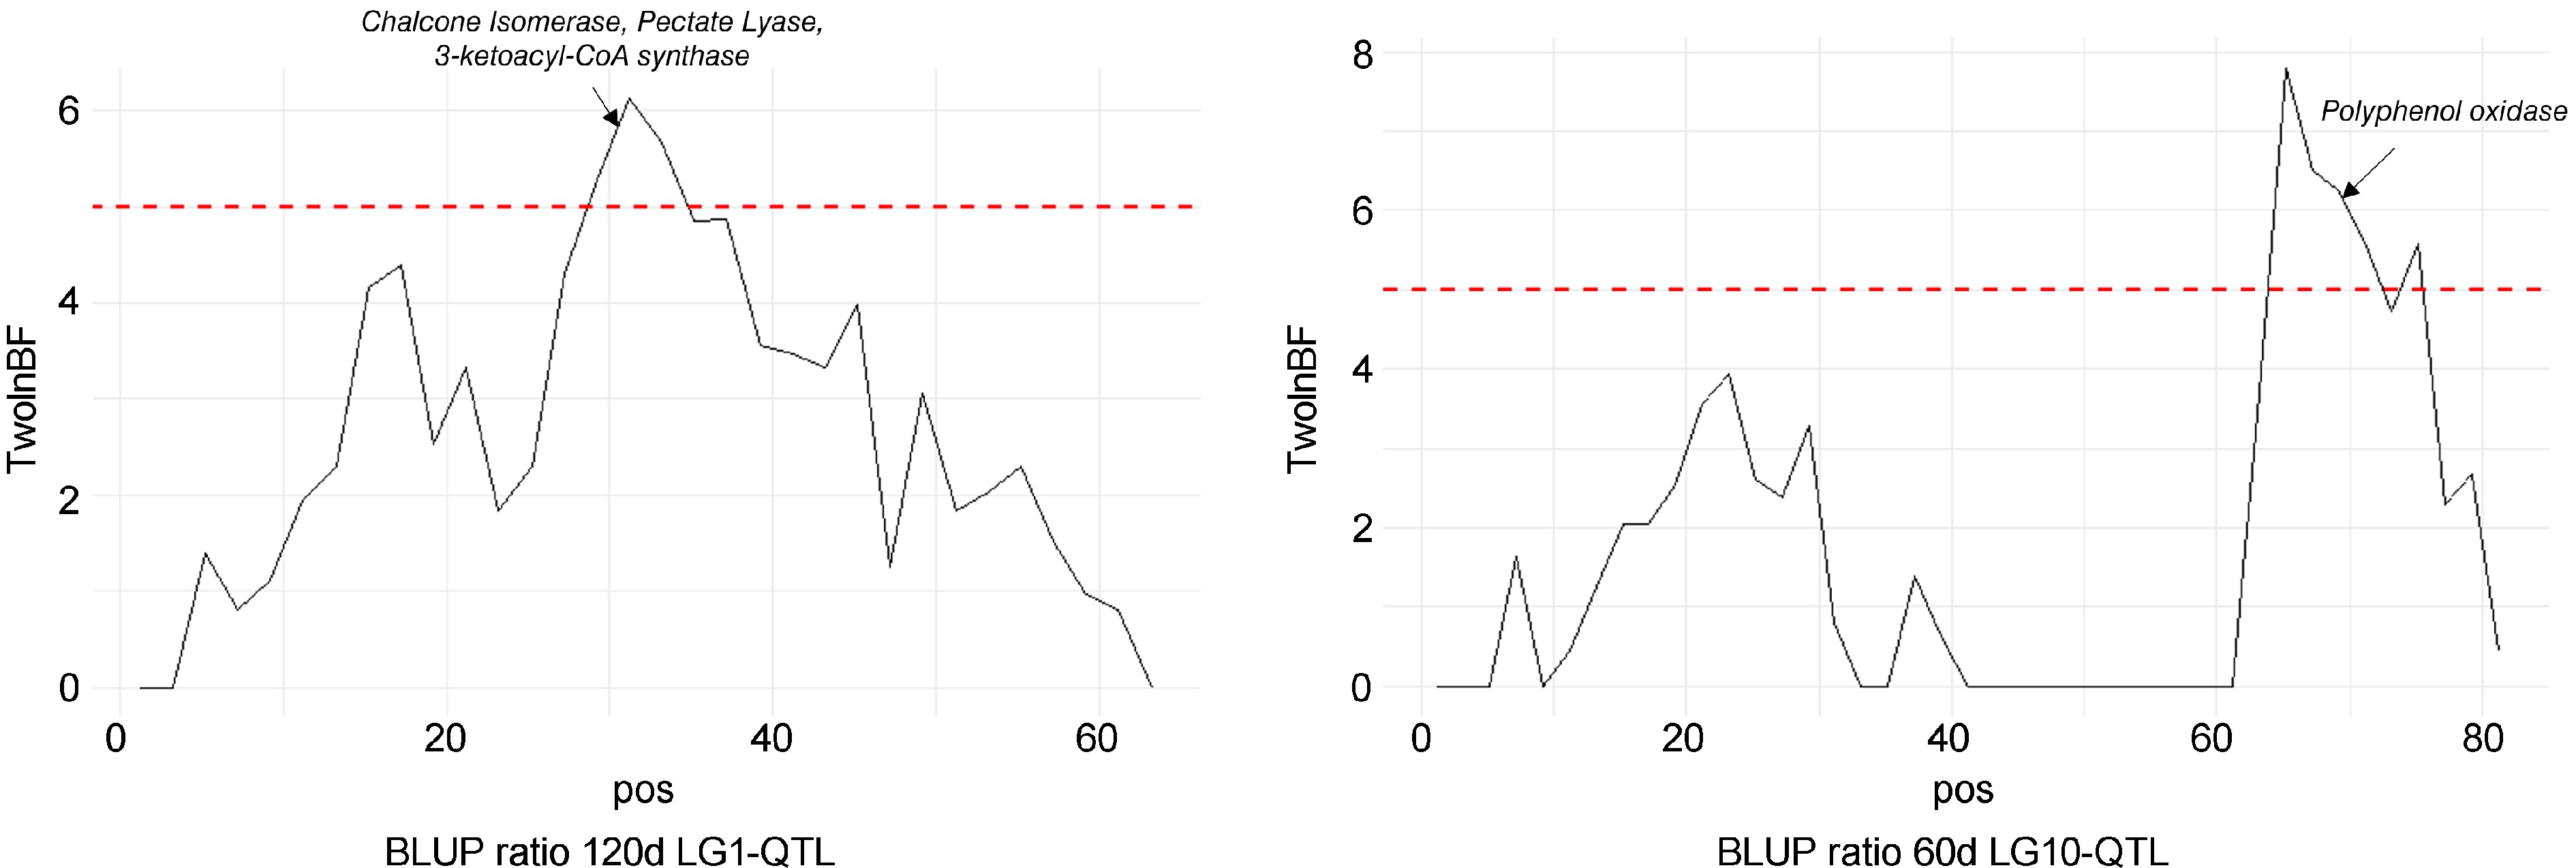
LG1-QTL mode colocalized (Fig. 6) with four Chalcone Isomerase (MdCHI) genes (MD01G1117800, MD01G1118000, MD01G1118100, MD01G1118300), a Pectate lyase (Md01G119400) and 3-ketoacyl- CoA synthase genes (MD01G1118800, MD01G1119200, MD01G1119300). LG10-QTL mode colocalized (Fig. 6) with a genetic region containing five PPO genes (MD10G1298200, MD10G1298300, MD10G1298400, MD10G1298500, MD10G1298700).
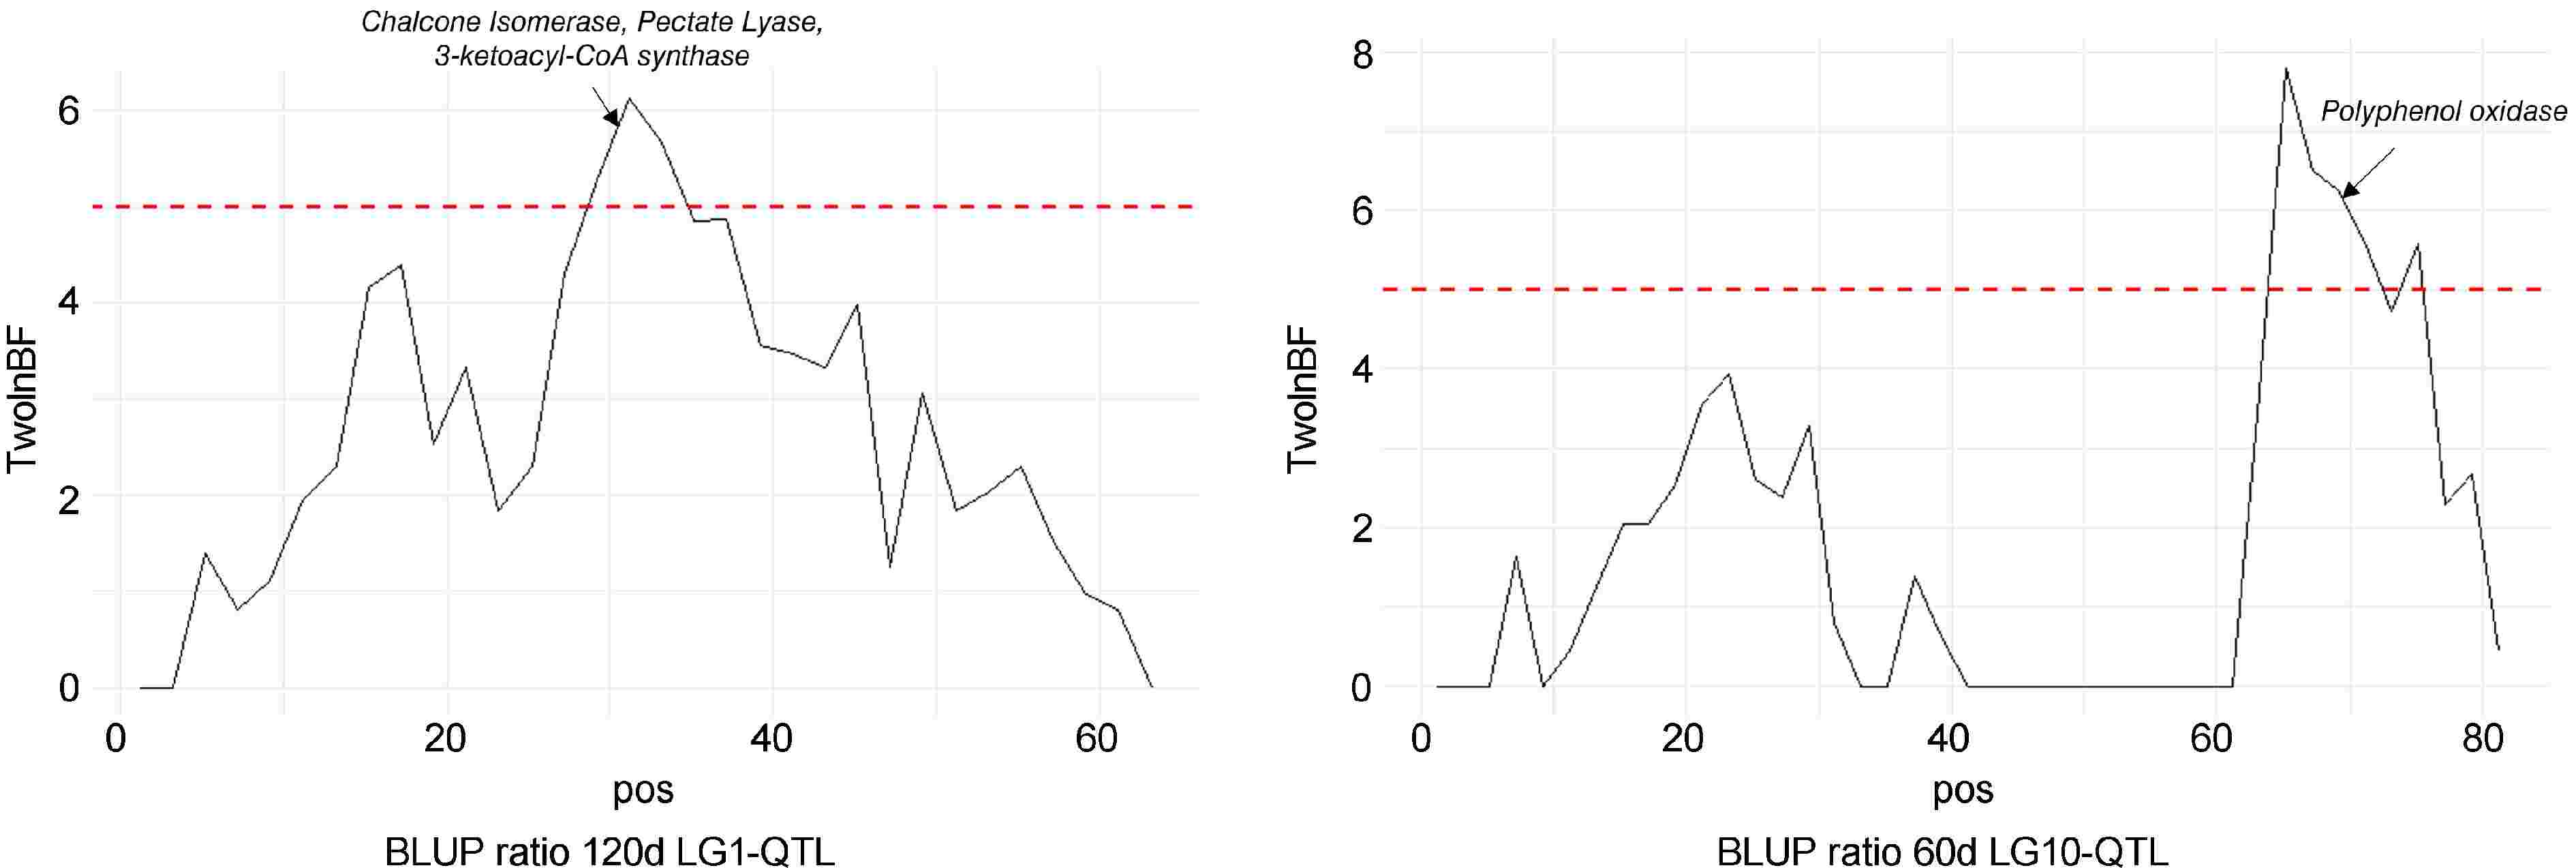
Figure 6.
Bayes factor across linkage groups (LGs) 1 and 10. The horizontal line indicates the significance threshold. Putative candidate genes are also indicated.
Detection of internal browning using acoustic signals
-
Frequency data comprised 1590 sounds for 318 apple sides, 159 apples, and 4097 frequencies with a total of 1,220 signals annotated as 'non-brown' and 370 signals annotated as 'brown' (Supplementary Table S3). Frequency data was normalized and used as input for cGAN to generate synthetic signals (Supplementary Table S4). Generator was trained over 50,000 iterations. Inspection of generator and discriminator loss functions were performed and ensure cGAN learning performance (Supplementary Fig. S1). Data augmentation was performed using 850 synthetic signals annotated as 'brown'. Finally, four datasets were used for classification: raw data, normalized data, synthetic data, and augmented data.
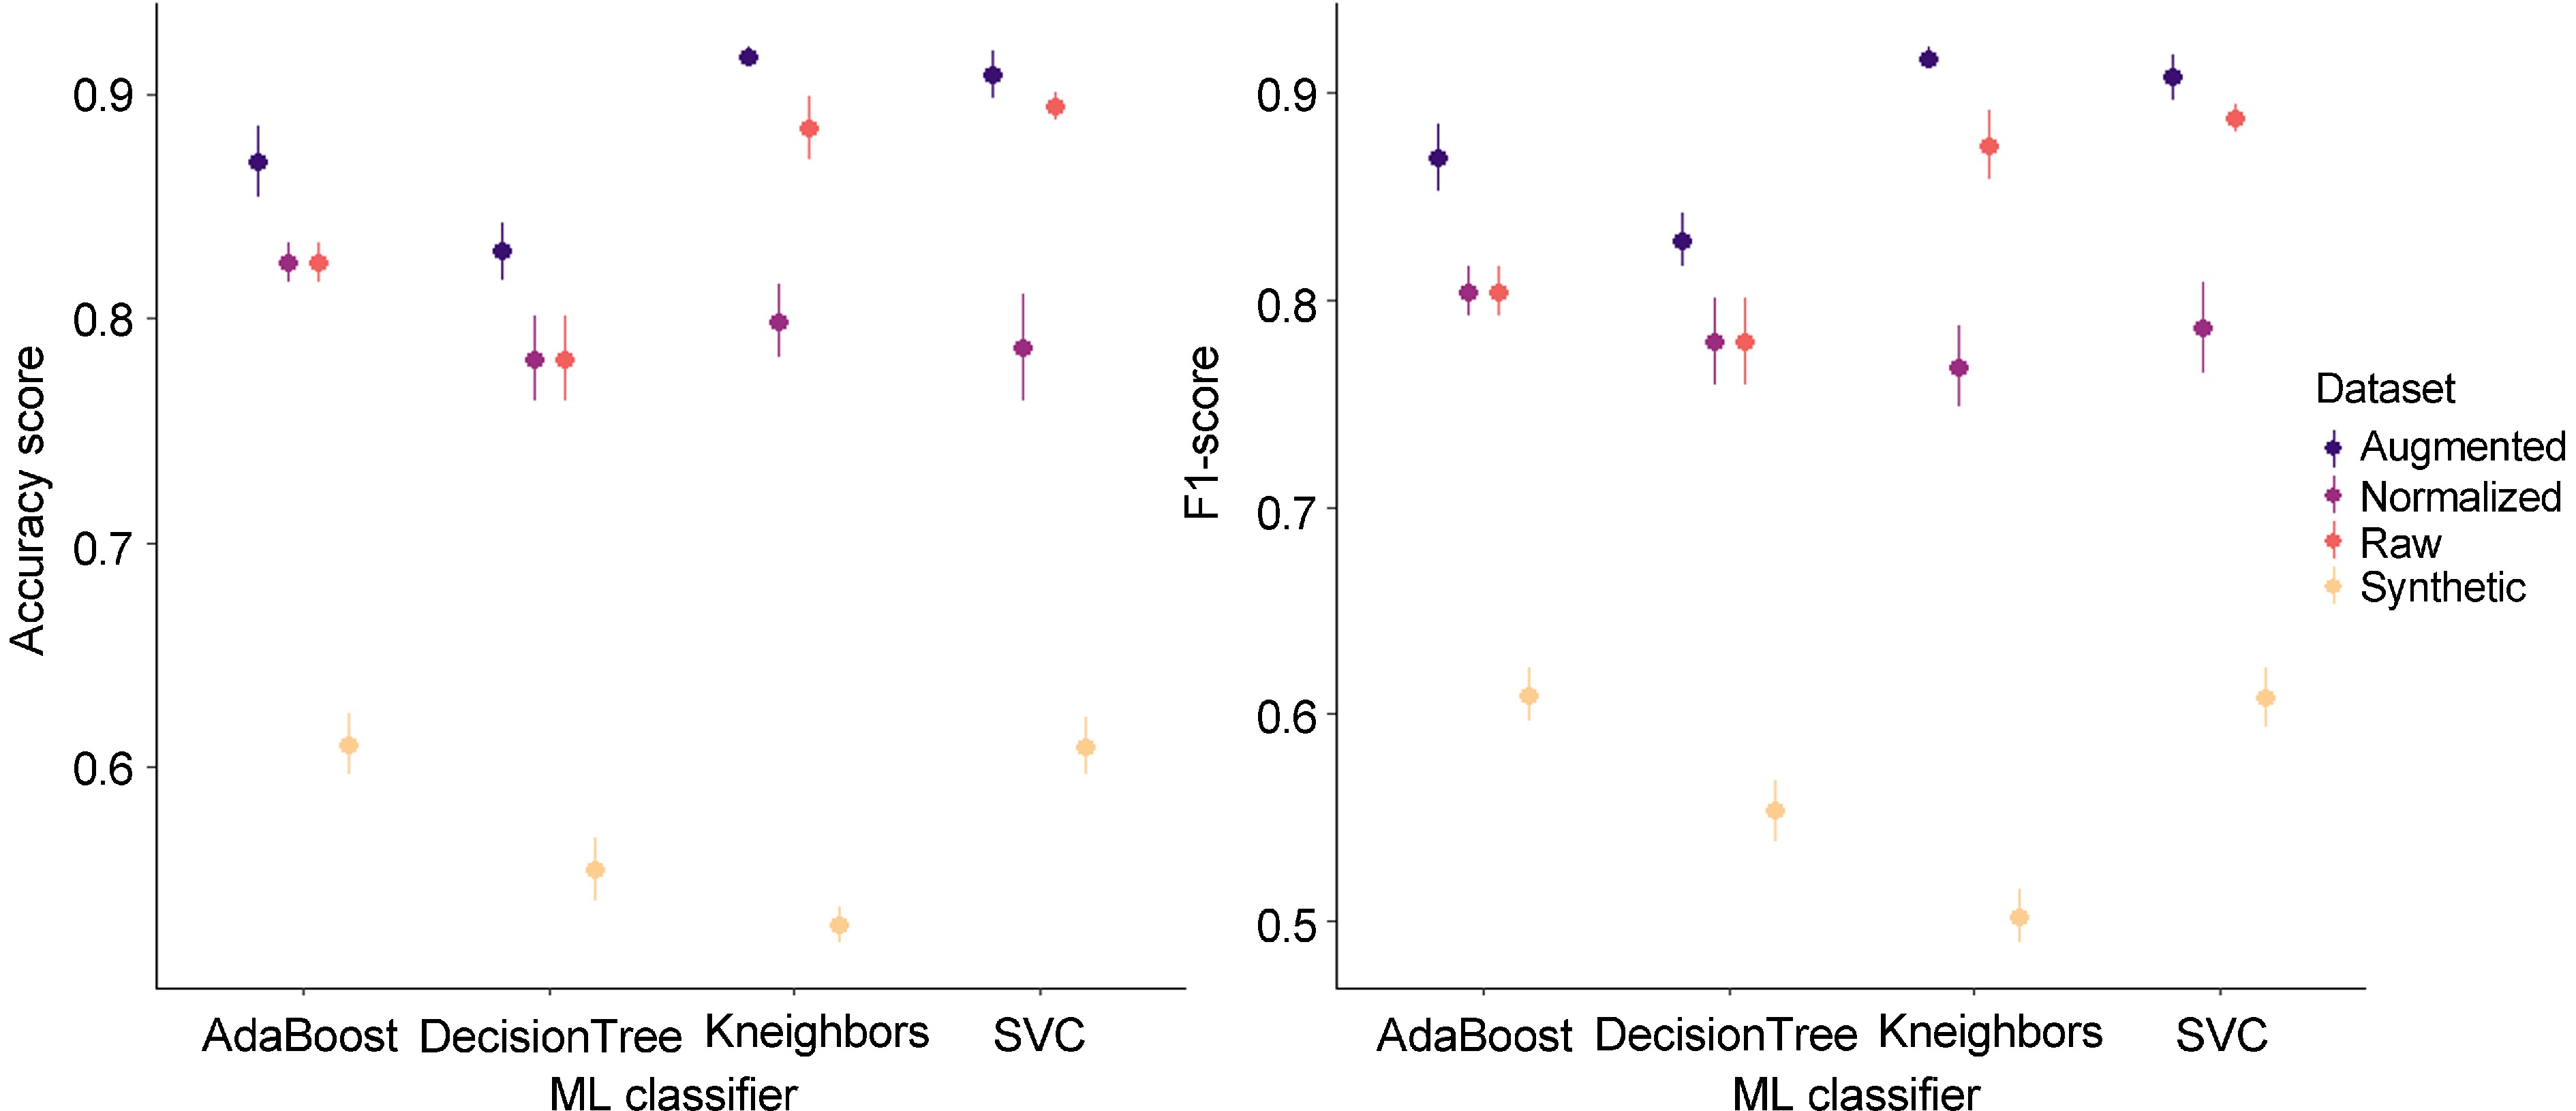
For each dataset, ML classifiers were implemented for signal classification between 'brown' and 'non-brown' signals. To compare each model, quality metrics (accuracy, F1-score) were calculated (Fig. 7; Supplementary Table S1). ML classifiers showed good quality metrics on raw data with accuracy values ranging from 0.782 (Decision Tree) to 0.895 (SVC) and F1-scores ranging from 0.780 (Decision Tree) to 0.888 (SVC). Normalization decreased model performances for SVC (0.787 for F1-score and accuracy) and Kneighbors (0.799 and 0.768, for F1-score and accuracy, respectively) while it did not impact AdaBoost and Decision Tree. These results suggest that amplitudes of each frequency are used in SVC and Kneighbors classification to discriminate 'brown' and 'non-brown' signals.
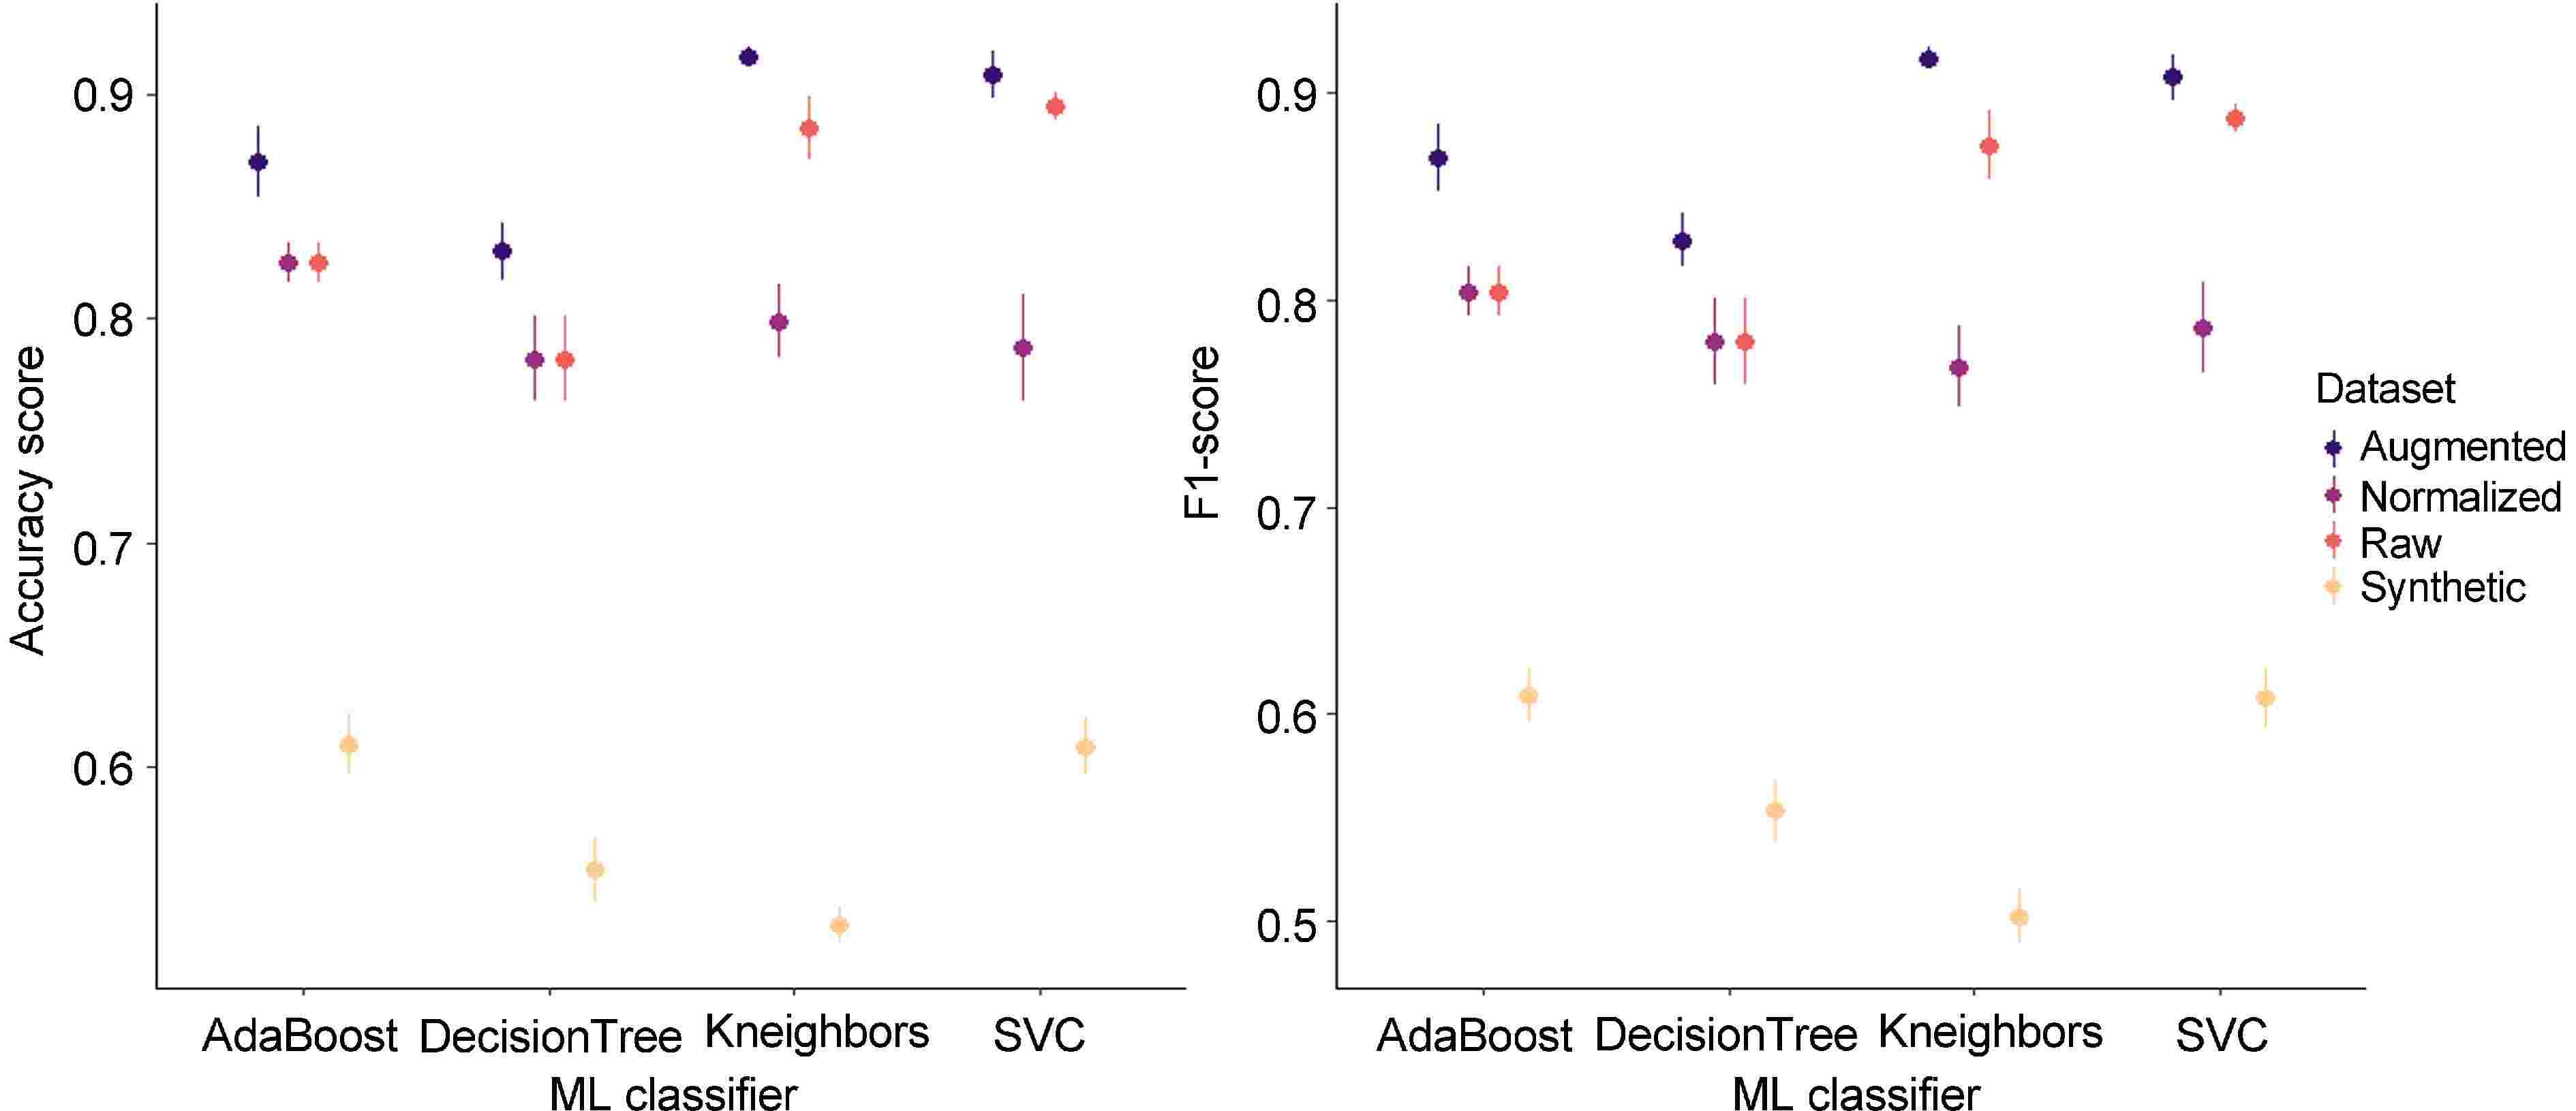
Figure 7.
Model performances on acoustic signal datasets. The mean (dot) and the standard deviation (vertical line) are represented in each range-plot. Four classifiers (AdaBoost, DecisionTree, Kneighbors, SVC) were evaluated to discriminate 'brown' and 'non-brown' acoustic signals from four datasets (raw, normalized, synthetic, and augmentated).
As expected[38], performances were weaker on synthetic data than on normalized data with an accuracy mean for the four ML classifiers of 0.798 against 0.576, respectively, and a F1-score mean of 0.785 against 0.568, respectively (Fig. 7). Nonetheless data augmentation improved score performances with an accuracy mean of 0.882 and a F1-score of 0.880 against 0.847 and 0.8837 for raw data (Fig. 7). Additional acquisitions of 'brown' signals could lead to stronger performance in discrimination between 'brown' and 'non-brown' signals.
SVC performed better than other ML models considering the four datasets (Fig. 7) with an accuracy mean of 0.800 and a F1-score of 0.798 followed by AdaBoost (0.783 and 0.772), Kneighbors (0.783, 0.766), and DecisionTree (0.737 and 736).
-
A combination of image analysis and visual notation confirmed the ability to detect QTL related to internal browning. QTLs on LG1 were detected for BLUP ratio at 120d, BLUP surface at 60d, and 120d. Chacole isomerase (CHI) plays a key role in phenolic biosynthesis by catalyzing the conversion of chalcones into flavanones which are common precursors of flavonoids. Allelic variation in genes regulating flavonoid synthesis in mesocarp could be linked to differential accumulation of flavonoid which is confirmed by colocalization between QTLs for red-flesh, flavonol content, anthocyanin content, and browning-related QTLs[29]. However, we did not identify a significant correlation between flavonoid variations and browning susceptibility, except for anthocyanin. As a consequence, anthocyanin accumulation, red-flesh color, and internal browning were intricated (Supplementary Fig. S4). LG9-QTL for BLUP surface 60d colocalized with MdMYB10, which confirmed correlations between highly colored red-flesh genotypes and internal browning[19]. A study on red-flesh apples identified an interaction between MdMYB10 expression, MdPPO expression, and early ethylene-driven maturity as causes of internal browning[17]. However, it is still unclear how MdMYB10 triggers PPO-mediated oxidation given that anthocyanins are not preferential substrates of PPOs[18]. Further studies are required to estimate the involvement of each phenolic group in PPO-mediated internal browning in red-flesh apple.
PPO is a major enzyme involved in apple enzymatic browning[11]. Di Guardo et al.[11], stated that early enzymatic browning could be related to the initial amount of PPO enzyme, together with phenolic compound contents. Allelic variations in gene sequence or promoter of PPO genes could be related to enzyme accumulation and, as a consequence, oxidation of phenolic compounds. Here, we detected a putative incidence of PPO-mediated phenolic oxidation in internal browning. LG10-QTL-related PVEs were high at 60d with 24% and 19.3% for BLUP ratio 60d, and BLUP surface 60d, respectively, while we observed a decrease at 120d with PVE of 11.3% for BLUP ratio 120d, and no detection for BLUP surface 120d. LG10-QTL is a major QTL linked with early internal browning susceptibility and suggested ability to delay browning incidence in red-flesh genotypes (Supplementary Fig. S5). Selecting for medium red-flesh-colored genotypes and positive alleles at LG10-QTL could be a breeding strategy to improve postharvest conservation of red-flesh cultivars.
Polyphenol contents and PPO activity decrease throughout fruit senescence[39] and late browning susceptibility could be more related to structural than biochemical aspects. Interestingly, LG1-QTL was detected for each late browning-related trait (BLUP ratio 120d and BLUP surface 120d) and also colocalized with a 3-ketoacyl-CoA synthase (Fig. 6), which is involved in the synthesis of very long-chain fatty acids and wax formation[40,41]. Knowing the importance of phenolic oxidation in the emergence of brown pigments, phenotypic variations in fruit wax structure could affect fruit porosity and, consequently, browning susceptibility. Another candidate gene identified at the LG1-QTL mode (Fig. 6) is homologous to a pectate lyase, which plays a key role in cell wall degradation during fruit senescence[42]. Genotypes that maintain cell integrity throughout fruit storage may be less prone to develop internal browning. This was confirmed empirically by breeders who often observed browning in poor-firmness fruits, which motivated sound-based analysis to detect internal browning.
Acoustic signal-based detection of internal browning
-
Acoustic measurements are directly linked to fruit firmness[27]. Nonetheless, the response signal is directly influenced by sensors and locations of signal generation and acquisition[27]. Using a robust acquisition system and multiple signal generation is a precondition for acoustic fruit quality evaluation, which was established by our experimental setup and the use of AFS. Previous studies analyzed response signals in time and frequency domains by considering major features such as propagation velocity and natural frequency to evaluate fruit firmness[27]. However, acoustic signals may contain more information about the physical or chemical properties of fruits than the single firmness[43]. To handle multi-dimensionality found in signal responses, ML classifiers were trained on frequency data comprising 1590 sounds with 4097 frequencies.
Frequency data analysis confirmed our ability to detect internal browning based on sound acquisition. Indeed, ML classifiers showed good accuracy in discriminating 'brown' and 'non-brown' signals. Otherwise, each model showed different performance metrics on datasets. AdaBoost and DecisionTree classifiers were not affected by signal normalization while SVC and Kneighbors exhibited weaker performances on normalized data. This indicates that frequency amplitudes were used in SVC and Kneighbors classification to discriminate 'brown' and 'non-brown'.
Data augmentation offers an effective method for increasing the number of training samples[44]. GANs can generate realistic artificial data[45], that can reduce overfitting and improve model performance[44]. Data augmentation improved score performances of all ML classifiers suggesting that increasing data acquisition (especially for 'brown' signals) should lead to stronger performance in discriminating 'brown' and 'non-brown' fruits. Globally, this study shows that acoustic measurement could be a valuable non-destructive tool to discriminate brown from non-brown apples with potential applications in internal browning phenotyping and automatic apple sorting.
-
QTL analysis confirmed the probable involvement of PPO-mediated phenolic degradation in internal browning of some red-flesh genotypes during postharvest storage, and enabled detection of a major QTL on LG10. Selecting red-flesh genotypes based on LG10-QTL haplotypes would help to delay internal browning development. However, the dual genetic correlation between red-flesh and internal browning appears to arise from interactive roles between several genetic factors with an interplay between biochemical and structural factors[19]. The use of image analysis and two-stage phenotypic acquisition confirmed that internal browning in red-flesh apple is a complex trait that is time-dependent and regulated by several genetic and environmental factors (mean broad-sense heritability of 0.573 considering all brown-related traits).
The use of accurate, high-throughput, and non-destructive phenotypic methods could help in deciphering the genetic architecture of this complex trait. As it stands, the extension of acoustic-based analysis as phenotypic data could be a valuable tool in non-destructive measurement of internal browning during conservation. Moreover, this innovative sensor could help in the phenomic selection and postharvest study of apple quality traits. Increasing signal acquisition is now needed to improve model performances and better characterize weight features in our model. Further studies are needed to estimate the accuracy of internal browning detection/quantification and the predictive ability of these analyses.
The authors would like to thank Maryline Cournol for her help in DNA extraction, and Caroline Denancé for her help with DNA extraction, SNP curation and pedigree reconstruction. Finally, the authors thank the IFO team for their support and contribution to this study. This material is based upon work supported by the ANRT (Association Nationale de la Recherche et de la Technologie) with a CIFRE fellowship granted to Pierre Bouillon (Convention No. 2021/0182), supported by IFO and IRHS.
-
The authors confirm contribution to the paper as follows: analysis and interpretation of results, writing manuscript: Bouillon P; acoustic signal acquisition: Letekoma Y, Belin E, Bouillon P; fruit harvest, sampling, and image acquisition: Hanteville S, Bouillon P; providing feedback on the analysis and manuscript and contributed to reviewing and refining the manuscript: Belin E, Fanciullino AL, Bernard F, Celton JM; project supervision: Bernard F, Celton JM. All authors reviewed the results and approved the final version of the manuscript.
-
All data generated or analyzed during this study are included in this published article and its supplementary information files. The script designed for acoustic signal analysis is public and can be found at: https://github.com/pibouillon/brown_sugar/blob/main/brown_sugar.py
-
The authors declare that they have no conflict of interest.
- Supplementary Table S1 Phenotypic and haplotype data.
- Supplementary Table S2 QTL detection with FlexQTLTM.
- Supplementary Table S3 Annotated signals (raw dataset).
- Supplementary Table S4 Synthetic dataset.
- Supplementary Fig. S1 Loss functions of cGAN generator (blue) and discriminator (green) networks during training.
- Supplementary Fig. S2 Correlations among phenotypic traits. The distribution of each variable is shown on the diagonal. Below the diagonal the bivariate x-y plots with a fitted smooth line (loess) are displayed. Above the diagonal, Pearson correlation coefficient plus the significance level as stars are displayed (*p ≤ 0.05, **p ≤ 0.01, ***p ≤ 0.001).
- Supplementary Fig. S3 Distribution of BLUP ratio 60d values for the four F1 offspring haplotypes for LG9- QTL. The mean (denoted by colored biggest dot), the standard deviation (vertical line) and single observations (dots) are represented. Number of genotypes (n) are listed above. Significantly different phenotypic means between segregating classes are identified by different letters (tukey HSD, p < 0.05).
- Supplementary Fig. S4 Principal components analysis of color descriptors, biochemical factors and internal browning related traits for 256 genotypes from the four F1 hybrid families. The contribution plot (left) showed contribution of variables for each dimension. The biplot (right) shows the first and second PCA components. PCA loadings of the explanatory variables are colored according to their cos2 values (squared cosines represent the correlation of the variables with each principal component), and genotype scores are colored in black (one dot represents one genotype).
- Supplementary Fig. S5 Principal components analysis of color descriptors, biochemical factors and internal browning related traits for 256 genotypes from the four F1 hybrid families. The biplot shows the first and second PCA components. Genotypes that are homozyguous for positive haplotype at LG10- QTL (H10-3 / H10-3) are highlighted.
- Copyright: © 2025 by the author(s). Published by Maximum Academic Press, Fayetteville, GA. This article is an open access article distributed under Creative Commons Attribution License (CC BY 4.0), visit https://creativecommons.org/licenses/by/4.0/.
-
About this article
Cite this article
Bouillon P, Belin E, Fanciullino AL, Hanteville S, Letekoma Y, et al. 2025. Internal browning detection in red-flesh apple (Malus domestica) using image analysis and acoustic signal-based detection. Fruit Research 5: e011 doi: 10.48130/frures-0025-0002 

Figure 1.
Overview of image analysis workflow. (a) Image acquisition is performed with a RGB flatbed scanner. (b) Image segmentation is performed with Ilastik software and extract 'brown', 'red- flesh', 'white-flesh', 'background' pixel classes. (c) Brown flesh is estimated from segmented images (number of pixels annotated as 'brown' divided by sum of number of pixels annotated as 'brown' and number of pixels annotated as 'red-flesh') with an ImageJ macro.