


-
Mitochondria, as semi-autonomous organelles with their unique genetic material and systems, play crucial roles in plant energy metabolism by generating ATP through oxidative phosphorylation[1,2]. In plants, mitochondria not only participate in energy production, but also collaborate with other organelles to maintain cellular homeostasis[3]. In addition, mitochondria also participate in regulating processes such as apoptosis, playing an important regulatory role in plant life activities[4]. However, despite the undisputed significance of mitochondria, previous research on plant mitochondrial genomes (mitogenomes) has been scant. Initially, sequencing and assembly techniques which were primarily developed for nuclear genomes, encountered significant challenges in handling mitogenomes due to their complicated structures, leading to fragmented or incomplete mitogenome assemblies. Moreover, early bioinformatic tools were not optimized for the unique characteristics of mitogenomes. This limitation further hindered the accurate assembly and analysis of plant mitogenomes. Nevertheless, with the continuous advancement of sequencing technology, especially the widespread application of long-read sequencing, research on plant mitogenomes has gradually increased in recent years[5−8].
The mitogenomes of most higher plants exhibit substantial variability in structure and size[9]. Plant mitogenomes contain numerous repetitive sequences (repeats), leading to significant variations in size and structure through frequent recombination events[10]. The size of plant mitogenomes is 100–1,000 times larger than that of animals (15-18 kb)[11]. Plant mitogenomes stand out not just for their exceptional size, but also for the notable variation in size they display across diverse species. For example, Viscum scurruloideum[12] has a mitogenome of only 66 kb, while the mitogenome of Larix sibirica is 11.7 Mb[13]. Additionally, the intricate structure of plant mitogenomes further adds to their complexity, with most of them existing as a single circular molecule, while a minority exist as linear or branched molecules. It has been reported that the mitogenomes of Populus simonii[14] and Fagopyrum esculentum[15] are composed of three and ten circular molecules, respectively. Although plant mitogenomes differ significantly in terms of size and structure, the number of genes remains comparably stable and conserved, with a similar core set of PCGs, rRNAs, and tRNAs which are essential for respiratory function, and translation processes[16]. Intracellular gene transfer (IGT) can further complicate the mitogenome, as sequences from both the plastid and nuclear genomes coexist in plant mitogenomes[17]. For instance, the sequences of the nuclear and plastid genomes account for 46.5% and 1.4% of the Cucumis melo mitogenome, respectively[18]. Therefore, the plant mitogenome, due to its complex characteristics, is an ideal system for exploring genome complexity.
Michelia figo (M. figo) belongs to the genus Michelia of the Magnoliaceae family, which is the second-largest genus and a relatively evolved group in the Magnoliaceae family. There are about 80 Michelia species in the world, predominantly distributed in tropical, subtropical, and temperate regions of Asia, of which approximately 70 species are distributed in China[19,20]. The broad spectrum of physiological activities exhibited by the genus Michelia underscores its potential applications in medicine, food, agriculture, and other domains[21]. The flowers, leaves, branches, and other parts of these species contain abundant aromatic oil that has been traditionally used in China, India, and other regions for treating fever, leprosy, inflammation, and other ailments[22]. Michelia species usually serve as valuable sources of bioactive compounds, exhibiting antibacterial[23], and antioxidant properties[24]. Furthermore, the methanolic extract from the leaves of M. figo has a concentration-dependent vasodilatory effect, having widespread applications in medicine[25].
A previous study has reported the complete plastome of M. figo and analyzed its phylogenetic relationship with other Michelia species based on (plastid genomes) plastomes[26]. However, the mitogenome of M. figo and its phylogenetic status based on mitogenomes remain unexplored. Additionally, many plastomes of Michelia have been released[27−29], but no mitogenomes have been reported for this genus. Consequently, to further explore the evolution and genetics of M. figo, this study has successfully assembled the complete mitogenome of M. figo. Comparative genomic and phylogenetic analyses were undertaken to elucidate the characteristics of the mitogenomes of M. figo and other Magnoliaceae species. These analyses will offer crucial theoretical and data-driven supports for genomic research, biological functions, and mitogenome evolution in M. figo and other Michelia species.
-
In this study, we collected fresh leaves of M. figo at Nanjing Forestry University, Nanjing, Jiangsu Province, China (118.81° E, 32.07° S). Before DNA extraction, fresh leaves were immediately frozen in liquid nitrogen to preserve their integrity and subsequently stored in a laboratory freezer maintained at −80 °C. The total genomic DNA was extracted using the CTAB method[30]. The quality of the DNA sample was evaluated using 1% agarose gel electrophoresis, while its concentration was accurately determined using a NanoDrop ND 2000 (ThermoFisher Scientific, Waltham, MA, USA)[31]. The size of the genomic insert fragments is 15−18 kb. Then the sequencing libraries were constructed using the high-integrity genomic DNA through SMRTbell Express Template Prep Kit 2.0 (PacBio Biosciences, Menlo Park, CA, USA). We ultimately obtained the HiFi sequencing data from the PacBio Revio platform.
Mitogenome assembly and annotation
-
The HiFi sequencing data was fed into PMAT v1.31[32] to assemble the mitogenome of M. figo. The parameters were 'autoMito -st hifi -g 2.2G -CPU 50'. The nuclear genome size of M. figo was estimated using the genome of Magnolia biondii as a reference[33]. After using PMAT, the raw assembly graph of M. figo mitogenome was composed of 12 contigs, containing four pairs of repeats. Using Bandage[34], we obtained the circular mitogenome of M. figo by decoding the raw assembly graph, taking into account the copy number of each contig. The mitogenome of M. figo was annotated using the online program PMGA[35]. The rRNA and tRNA genes were then verified by BLASTN[36] and tRNAscan-SE v2.0[37], respectively. Finally, an online tool PMGmap[38] was used to draw the mitogenome map.
Analysis of repeats and codon usage
-
The online tool MISA[39] was used to detect simple sequence repeats (SSRs) of the M. figo, M. biondii, and M. officinalis mitogenomes. We set the repetition thresholds at 10, 5, 4, 3, 3, and 3 for mononucleotides, dinucleotides, trinucleotides, tetranucleotides, pentanucleotides, and hexanucleotides, respectively. The minimal distance between two SSRs was established as 100 bp. Meanwhile, the online tool TRF[40] was utilized to detect tandem repeats with default parameters. REPuter[41] was used to detect dispersed repeats and the parameters were set as follows: hamming distance of three, maximum computed repeats of 5000, and a minimal repeat size of 30 bp[42]. Codon composition and usage of the M. figo mitogenome were analyzed using CondonW v1.4.4 (
https://codonw.sourceforge.net/ ) with default parameters.Mitochondrial plastid transfer (MTPT) and collinearity analysis
-
We obtained the plastid genome (plastome) of M. figo from the NCBI with the accession number of NC_053861.1. Then, we used BLASTN[36] to identify the homologous fragments between the mitogenome and plastome, and utilized TBtools to visualize the results[43]. We selected three mitogenomes of Magnoliaceae (L. tulipifera, M. biondii, and M. officinalis) for the collinearity analysis with M. figo. The collinear blocks were identified using MUMmer v4.0[44] with default parameters. We chose collinear blocks that exceeded 5,000 bp for subsequent analysis. NGenomeSyn v1.0[45] was finally used to visualize the results.
Phylogenetic analysis
-
To further clarify the phylogenetic location of M. figo, two phylogenetic trees were constructed using 15 plant mitogenomes and plastomes respectively, including two species of Gymnosperm (Cycas taitungensis, and Ginkgo biloba), three species of ANA clade (Amborella trichopoda, Nymphaea colorata, and Schisandra sphenanthera), four species of Magnoliidae (L. tulipifera, M. figo, M. officinalis, and M. biondii), three species of monocots (Apostasia shenzhenica, Cocos nucifera, and Sorghum bicolor), and three species of core eudicots (Ilex pubescens, Sapindis mukorossi, and Ficus carica). Among these plant species, C. taitungensis and G. biloba were selected as outgroups. We used in-house Python scripts to select shared genes and used MAFFT v7.407[46] to compare the shared genes. After trimming the results using trimAl v1.4[47], IQ-TREE v2.0.3[48] was utilized to construct the phylogenetic trees based on the maximum likelihood (ML) method with 1,000 bootstraps.[49]. Both plastid and mitochondrial trees were found to be best fit by the GTR + F + I + G4 model. Finally, the online tool iTOL[50] was used to visualize and optimize the results.
-
Using the Revio sequencing platform, we obtained a total of 410,107 HiFi sequencing reads with 5.83 Gb in length and the N50 value of 14,355 bp. After using PMAT v1.31 to generate the raw assembly graph of the M. figo mitogenome (Fig. 1a), we utilized Bandage to disentangle the mitogenome graph resulting in a circular molecule with 773,377 bp in length (Fig. 1b). The total GC content is 46.83%, with 26.56%, 26.21%, 23.37%, and 23.46% for bases A, T, G, and C, respectively. The M. figo mitogenome was annotated with 66 genes, comprising 41 protein-coding genes (PCGs), 21tRNA, and three rRNA, as detailed in Table 1. Figure 1c provides a visual representation of the functional classification and specific positions of the annotated genes. The majority of genes are present in a single-copy format, with the exception of three genes (rps7, trnM-CAU, and trnP-UGG), possessing multiple copies. Moreover, we found that a total of 10 genes harbor introns (ccmFc, rpl2, rps3, rps10, cox2, nad1, nad2, nad4, nad5, and nad7) (Supplementary Fig. S1). Most of these introns are cis-spliced, with nad1, nad2, and nad5 containing a few trans-spliced introns.
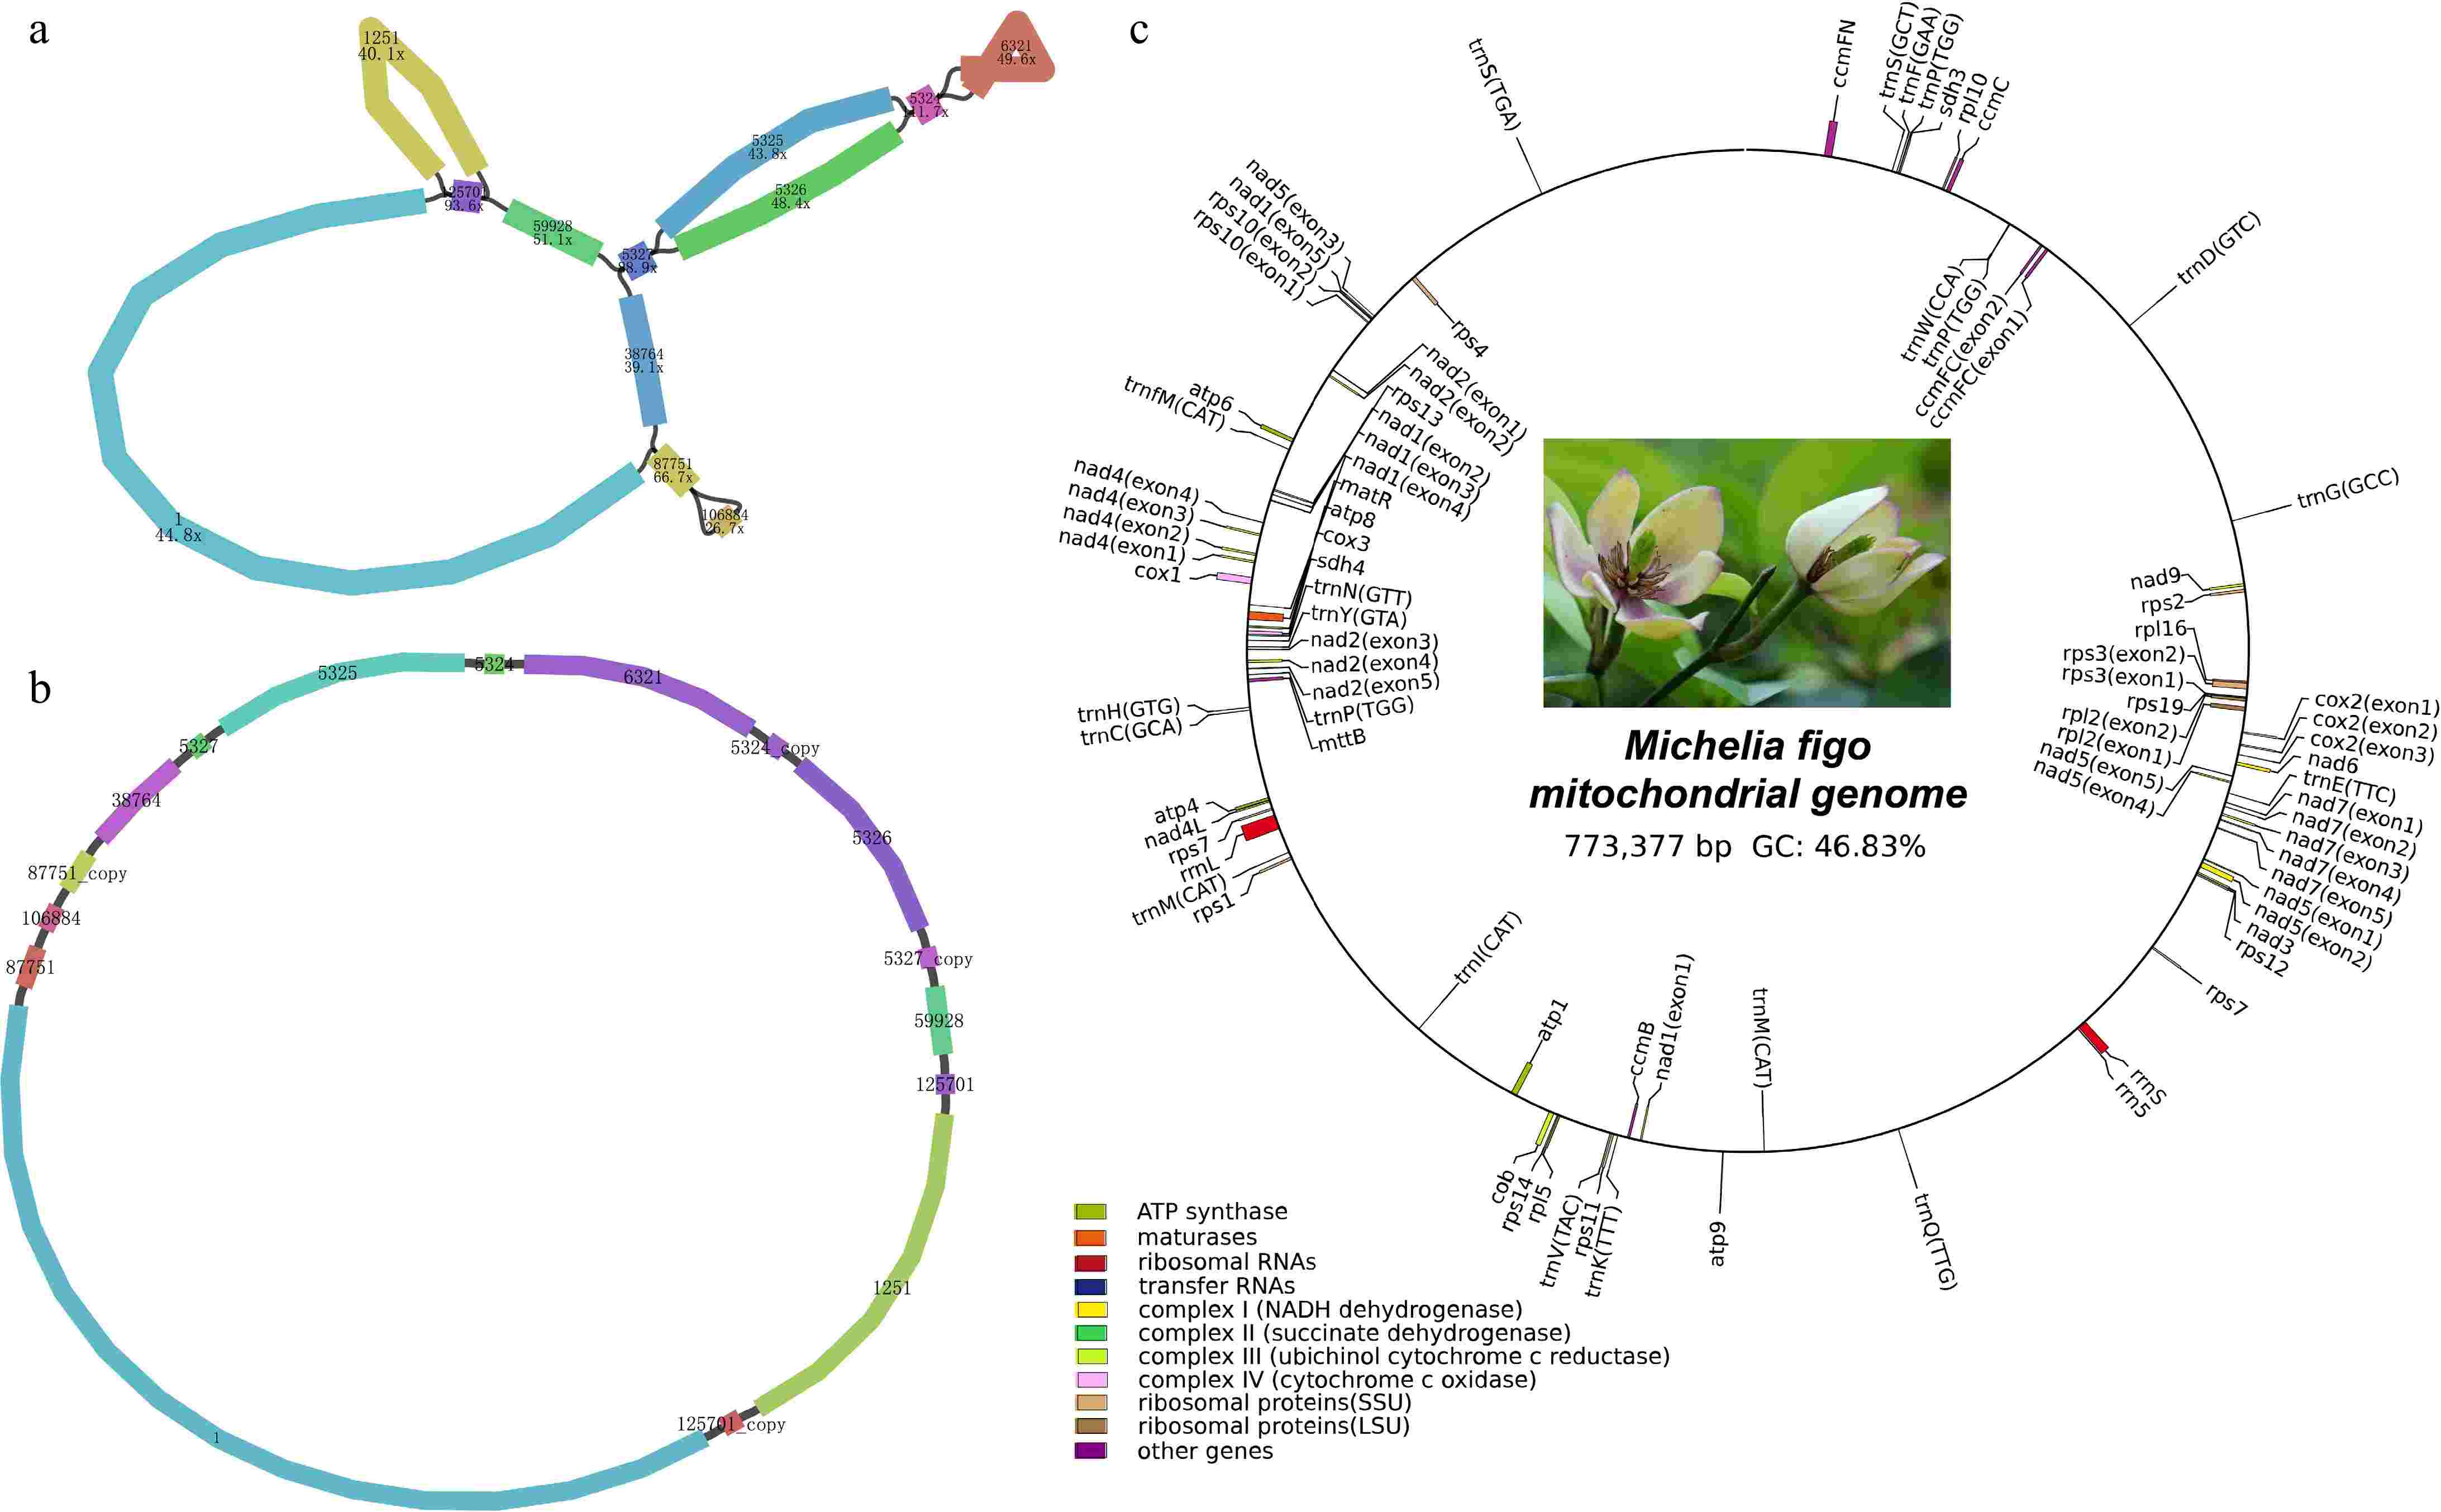
Figure 1.
Structural and functional features of the M. figo mitogenome. (a) The raw assembly graph of the M. figo mitogenome. (b) The disentangled graph of the M. figo mitogenome. (c) Circular mitogenome map of M. figo. Genes depicted outside the outer circle undergo clockwise transcription, while those positioned within the inner circle undergo counter-clockwise transcription. The legends of different colors positioned in the bottom left corner serve to distinguish genes based on their specific functionalities.
Table 1. Gene compositions of the Michelia figo mitogenome.
Group of genes Name Start codon Stop codon Length Amino acids ATP synthase atp1 ATG TGA 1,530 509 atp4 ATG TAA 582 193 atp6 ATG TAG 891 296 atp8 ATG TAA 480 159 atp9 ATG TAA 261 86 Cytochrome c biogenesis ccmB ATG TGA 621 206 ccmC ATG TAA 960 319 ccmFc* ATG TAA 1,359 452 ccmFn ATG TAG 1,806 602 Ubichinol cytochrome c reductase cob ATG TGA 1,182 393 Cytochrome c oxidase cox1 ACG TAA 1,584 527 cox2** ATG TAA 759 252 cox3 ATG TGA 798 265 Maturases matR ATG TAG 1,959 652 Transport membrane protein mttB ACG TGA 768 255 NADH dehydrogenase nad1***+ ACG TAA 978 325 nad2**** ATG TAA 1,467 488 nad3 ATG TAA 357 118 nad4*** ATG TGA 1,488 495 nad4L ACG TAA 303 100 nad5**++ ATG TAA 2,013 670 nad6 ATG TGA 735 244 nad7**** ATG TAG 1,185 394 nad9 ATG TAA 573 190 Large subunit of ribosome (LSU) rpl10 ATG TAA 471 156 rpl16 GTG TAA 435 144 rpl2* ATG TAG 1,665 697 rpl5 ATG TAA 561 186 Small subunit of ribosome (SSU) rps1 ATG TAA 606 201 rps10* ATG TGA 420 139 rps11 ATG TGA 552 183 rps12 ATG TGA 378 125 rps13 ATG TGA 351 116 rps14 ATG TAG 303 100 rps19 ATG TAA 282 93 rps2 ATG TAA 657 218 rps3* ATG TAA 1,572 523 rps4 ACG TAA 1,071 356 rps7 (2) ATG/ATG TAA/TAA 450 149 Succinate dehydrogenase sdh3 ATG TAA 330 109 sdh4 ATG TGA 447 148 Ribosomal RNAs rrn5 − − 117 − rrnL − − 3,560 − rrnS − − 2,087 − Transfer RNAs trnC-GCA − − 71 − trnD-GUC − − 74 − trnE-UUC − − 72 − trnF-GAA − − 74 − trnfM-CAU − − 74 − trnG-GCC − − 73 − trnH-GUG − − 74 − trnI-CAU − − 81 − trnK-UUU − − 73 − trnM-CAU (2) − − 73/73 − trnN-GUU − − 72 − trnP-UGG (3) − − 75/74/75 − trnQ-UUG − − 72 − trnS-GCU − − 88 − trnS-UGA − − 87 − trnV-UAC − − 73 − trnW-CCA − − 74 − trnY-GUA − − 83 − * Indicates the cis-spliced introns, and + indicates the trans-spliced introns. The number of * and + represents the number of introns. The number in parentheses represents the number of genes. Analysis of codon usage
-
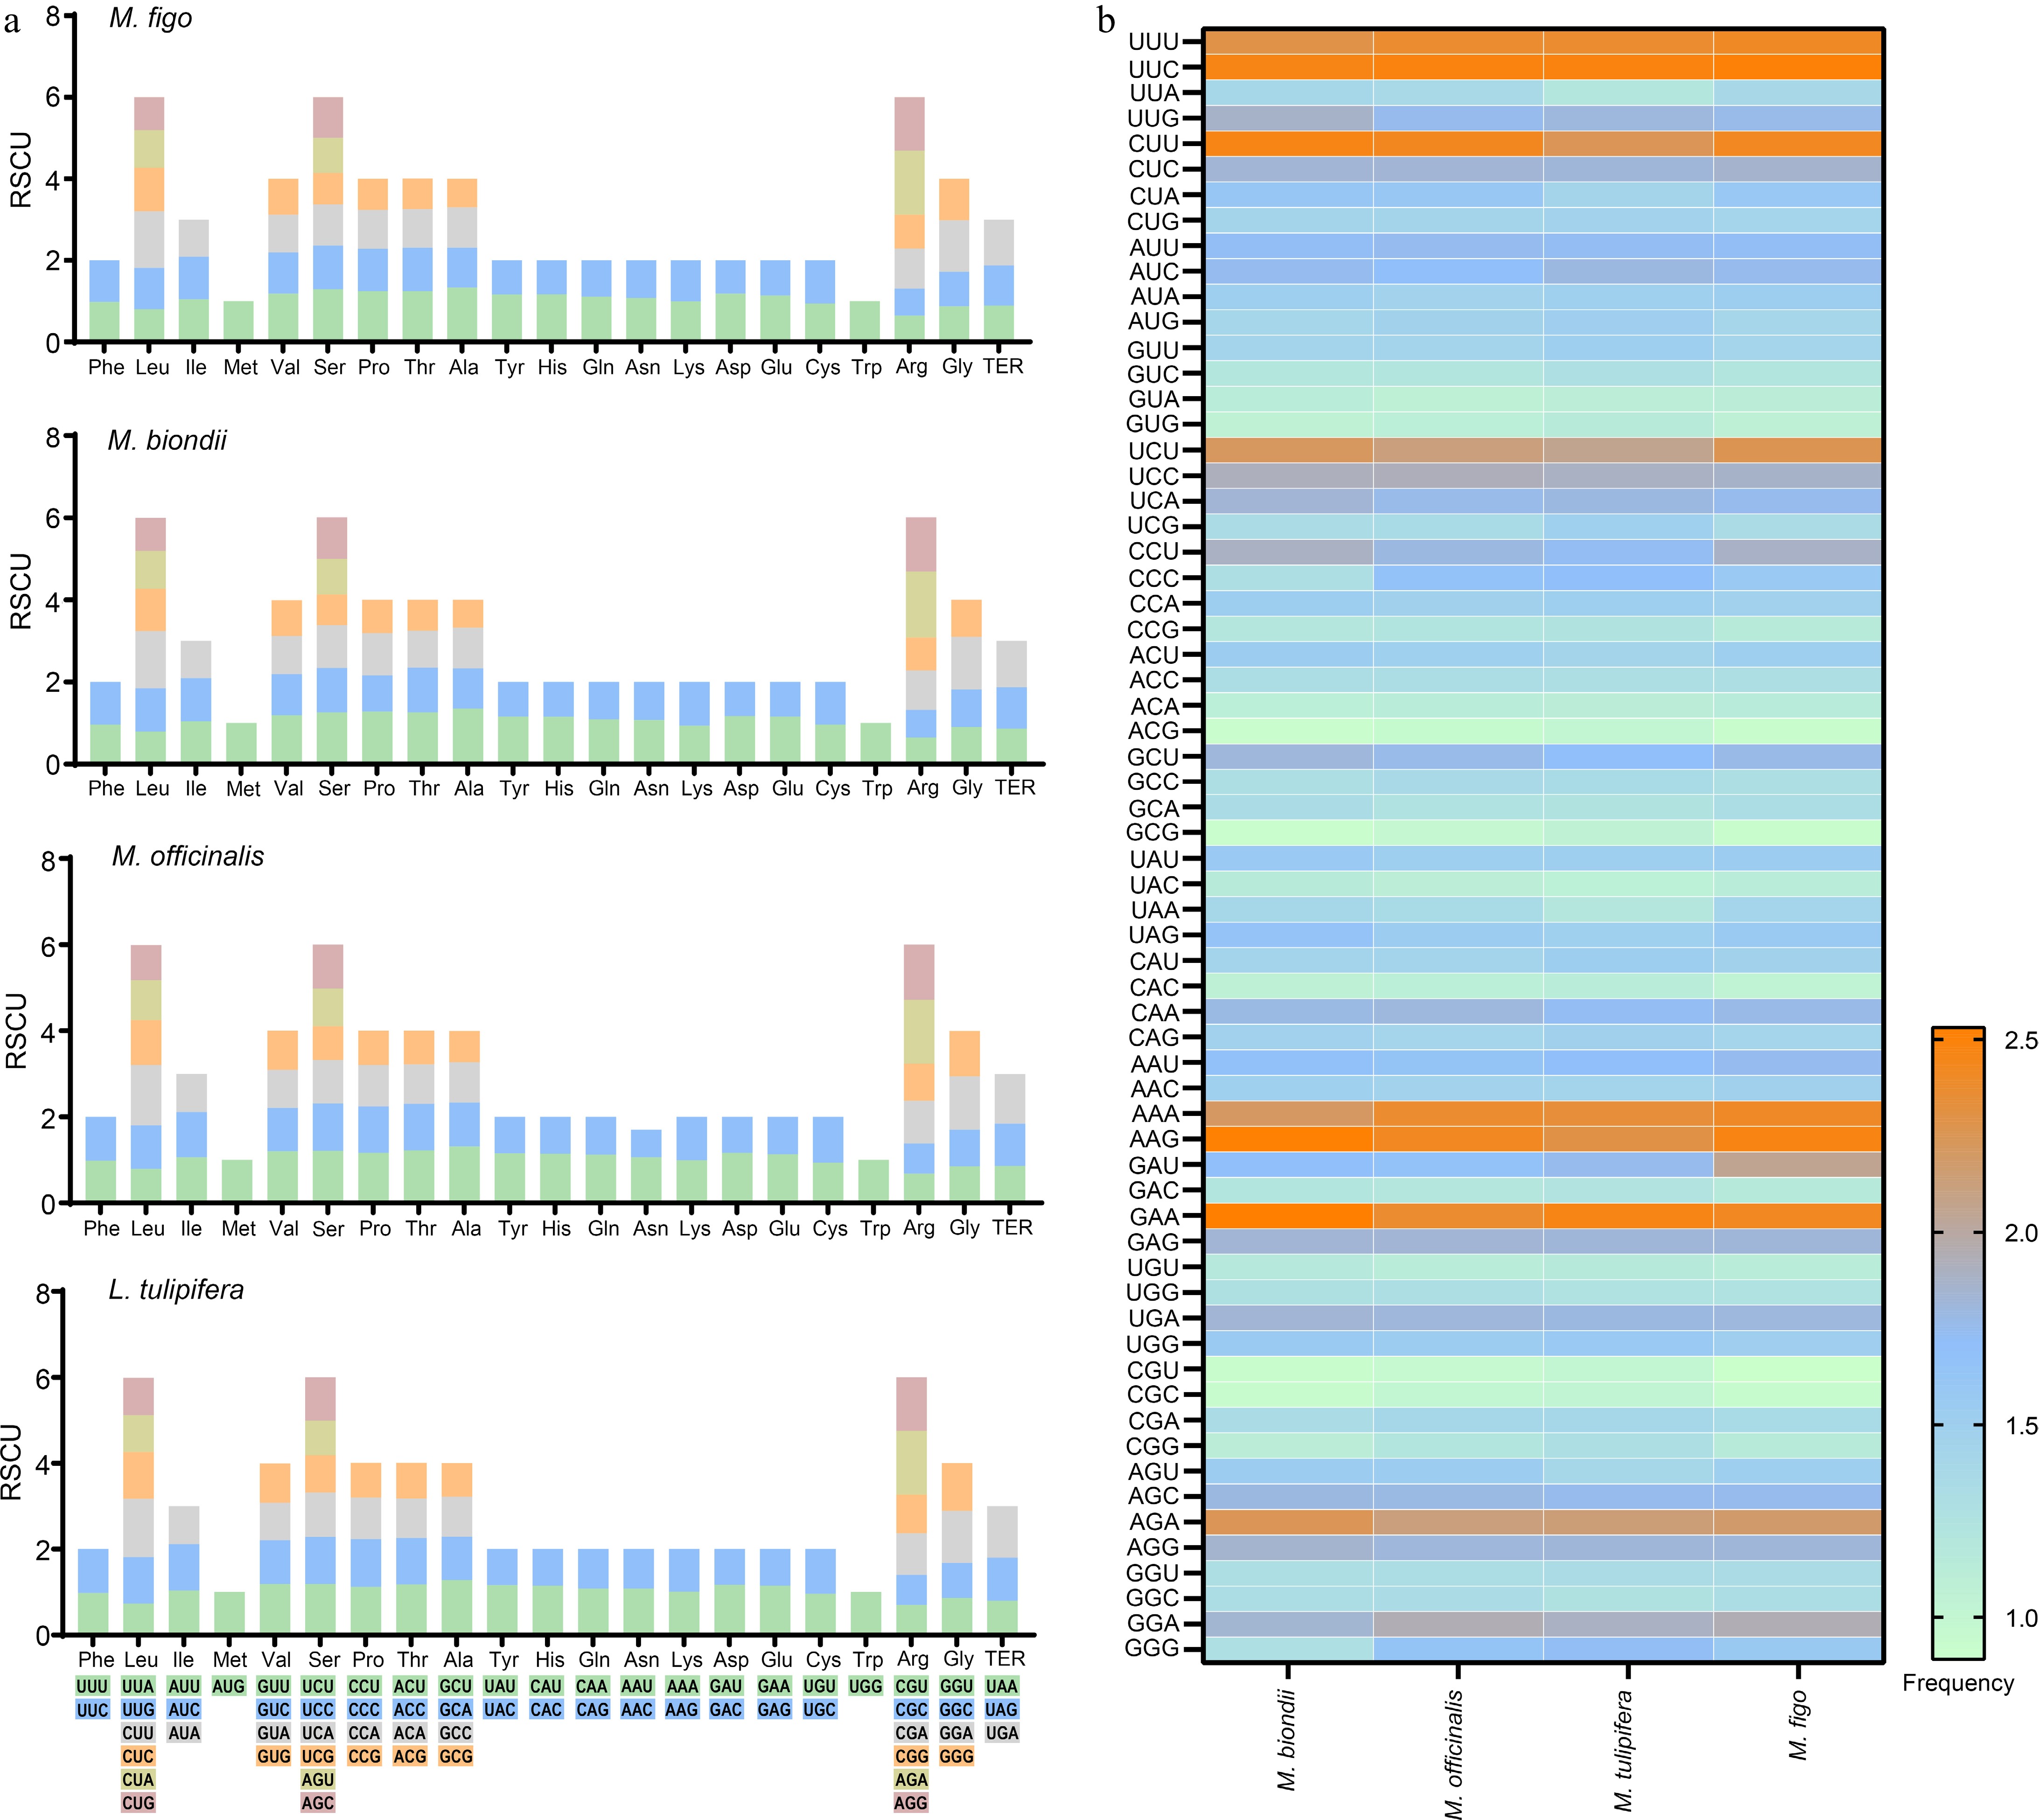
The relative synonymous codon usage (RSCU) value is equal to 1 when there is no synonymous codon usage preference. In the M. figo mitogenome, the RSCU values of AUG (Met), UGG (Trp), and AGC (Ser) are 1 (Supplementary Table S1). Twenty nine codons exhibit RSCU values above 1, among which the codon AGA (Arg) possesses the highest RSCU value, especially 1.57. Additionally, the RSCU values of 32 codons are lower than 1, with CGU(Arg) exhibiting the lowest RSCU value of 0.64. We also compared the RSCU of M. figo mitogenome with the other three Magnoliaceae mitogenomes. The result shows that the relative synonymous codon usage is highly consistent (Fig. 2a), with the codon of AGA (Arg) exhibiting the highest RSCU value in these mitogenomes (Supplementary Table S1). We further calculated the frequency of codon usage, revealing a remarkable similarity across the mitogenomes of Magnoliaceae (Fig. 2b & Supplementary Table S2).

Figure 2.
Codon usage of four Magnoliaceae mitogenomes. (a) Stacked column plots of the relative synonymous codon usage. (b) Heatmap of the codon usage frequencies.
Analysis of repeats
-
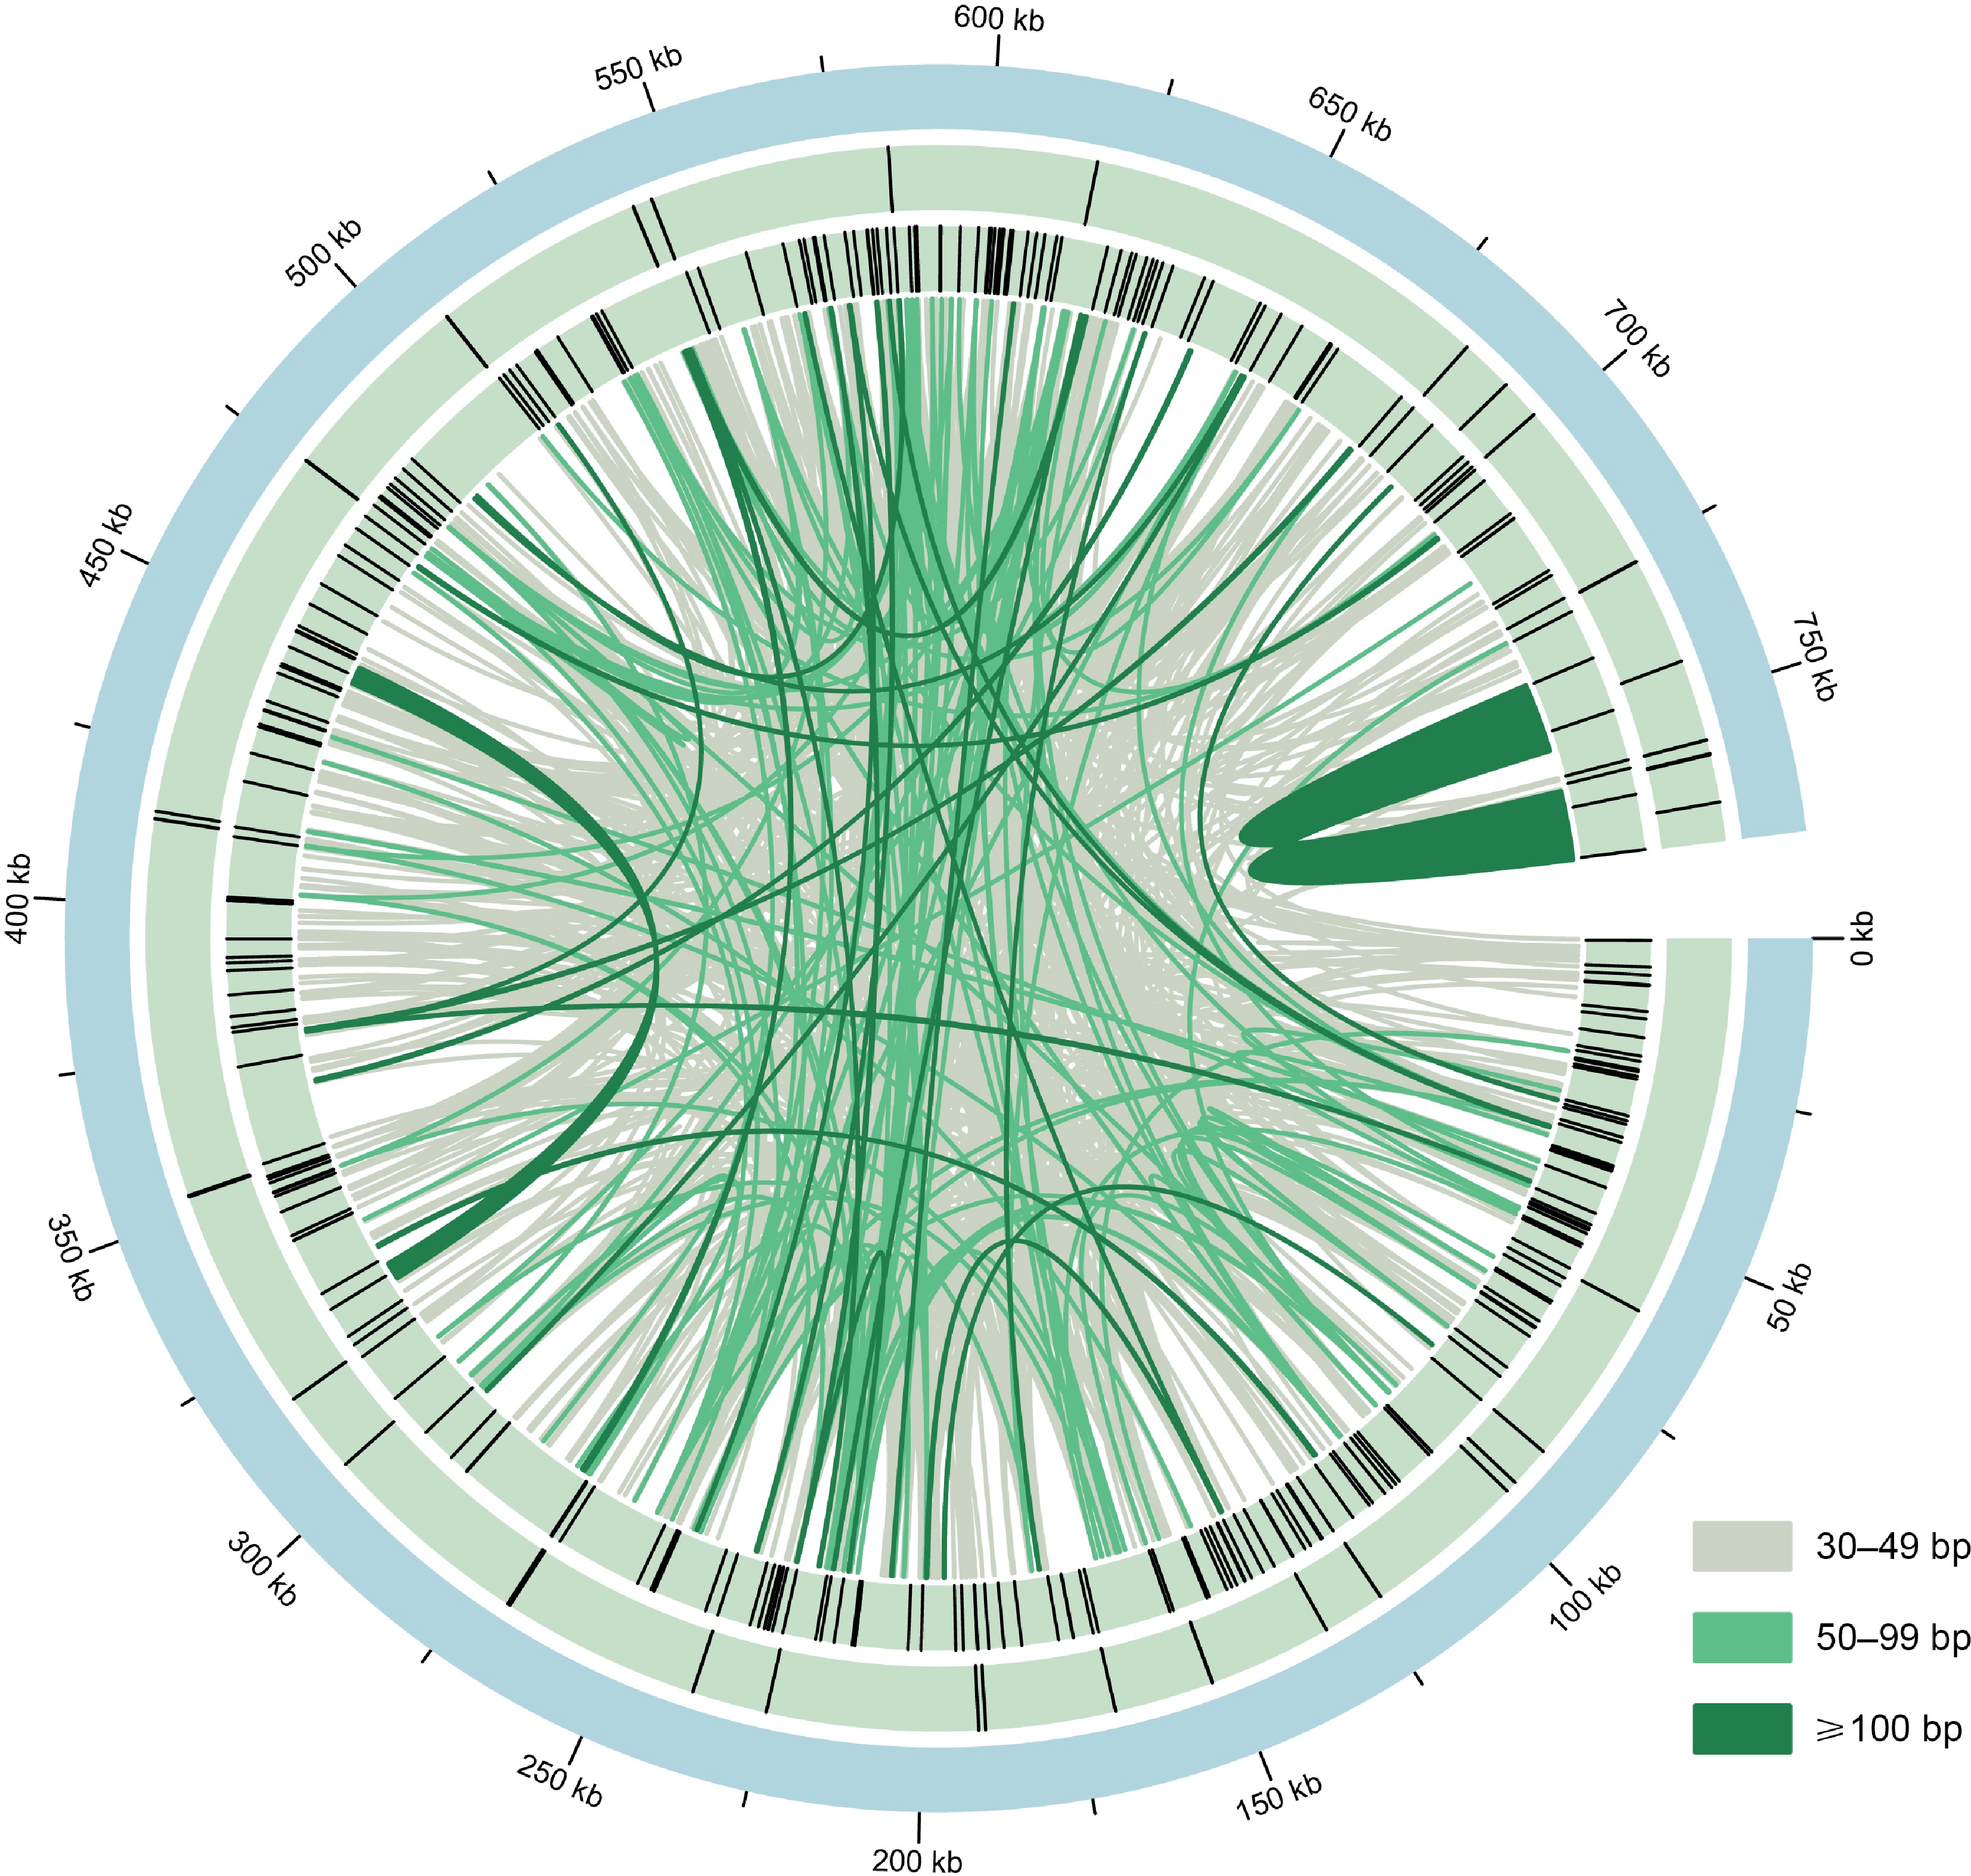
The M. figo mitogenome contains abundant repeats (Fig. 3). Using the online tool REPuter, we detected 1,514 pairs of dispersed repeats (≥ 30 bp), including 758 pairs of forward repeats and 756 pairs of palindromic repeats (Supplementary Table S3). However, there are no complementary and reverse repeats. Additionally, the M. figo mitogenome was found to harbor 39 tandem repeats, with lengths varying from 14 to 52 bp (Supplementary Table S4), with matching identity greater than 64%. Altogether, 262 SSRs were identified in the M. figo mitogenome (Supplementary Table S5), most of which are tetranucleotides (96), followed by mononucleotides (55), and dinucleotides (55).
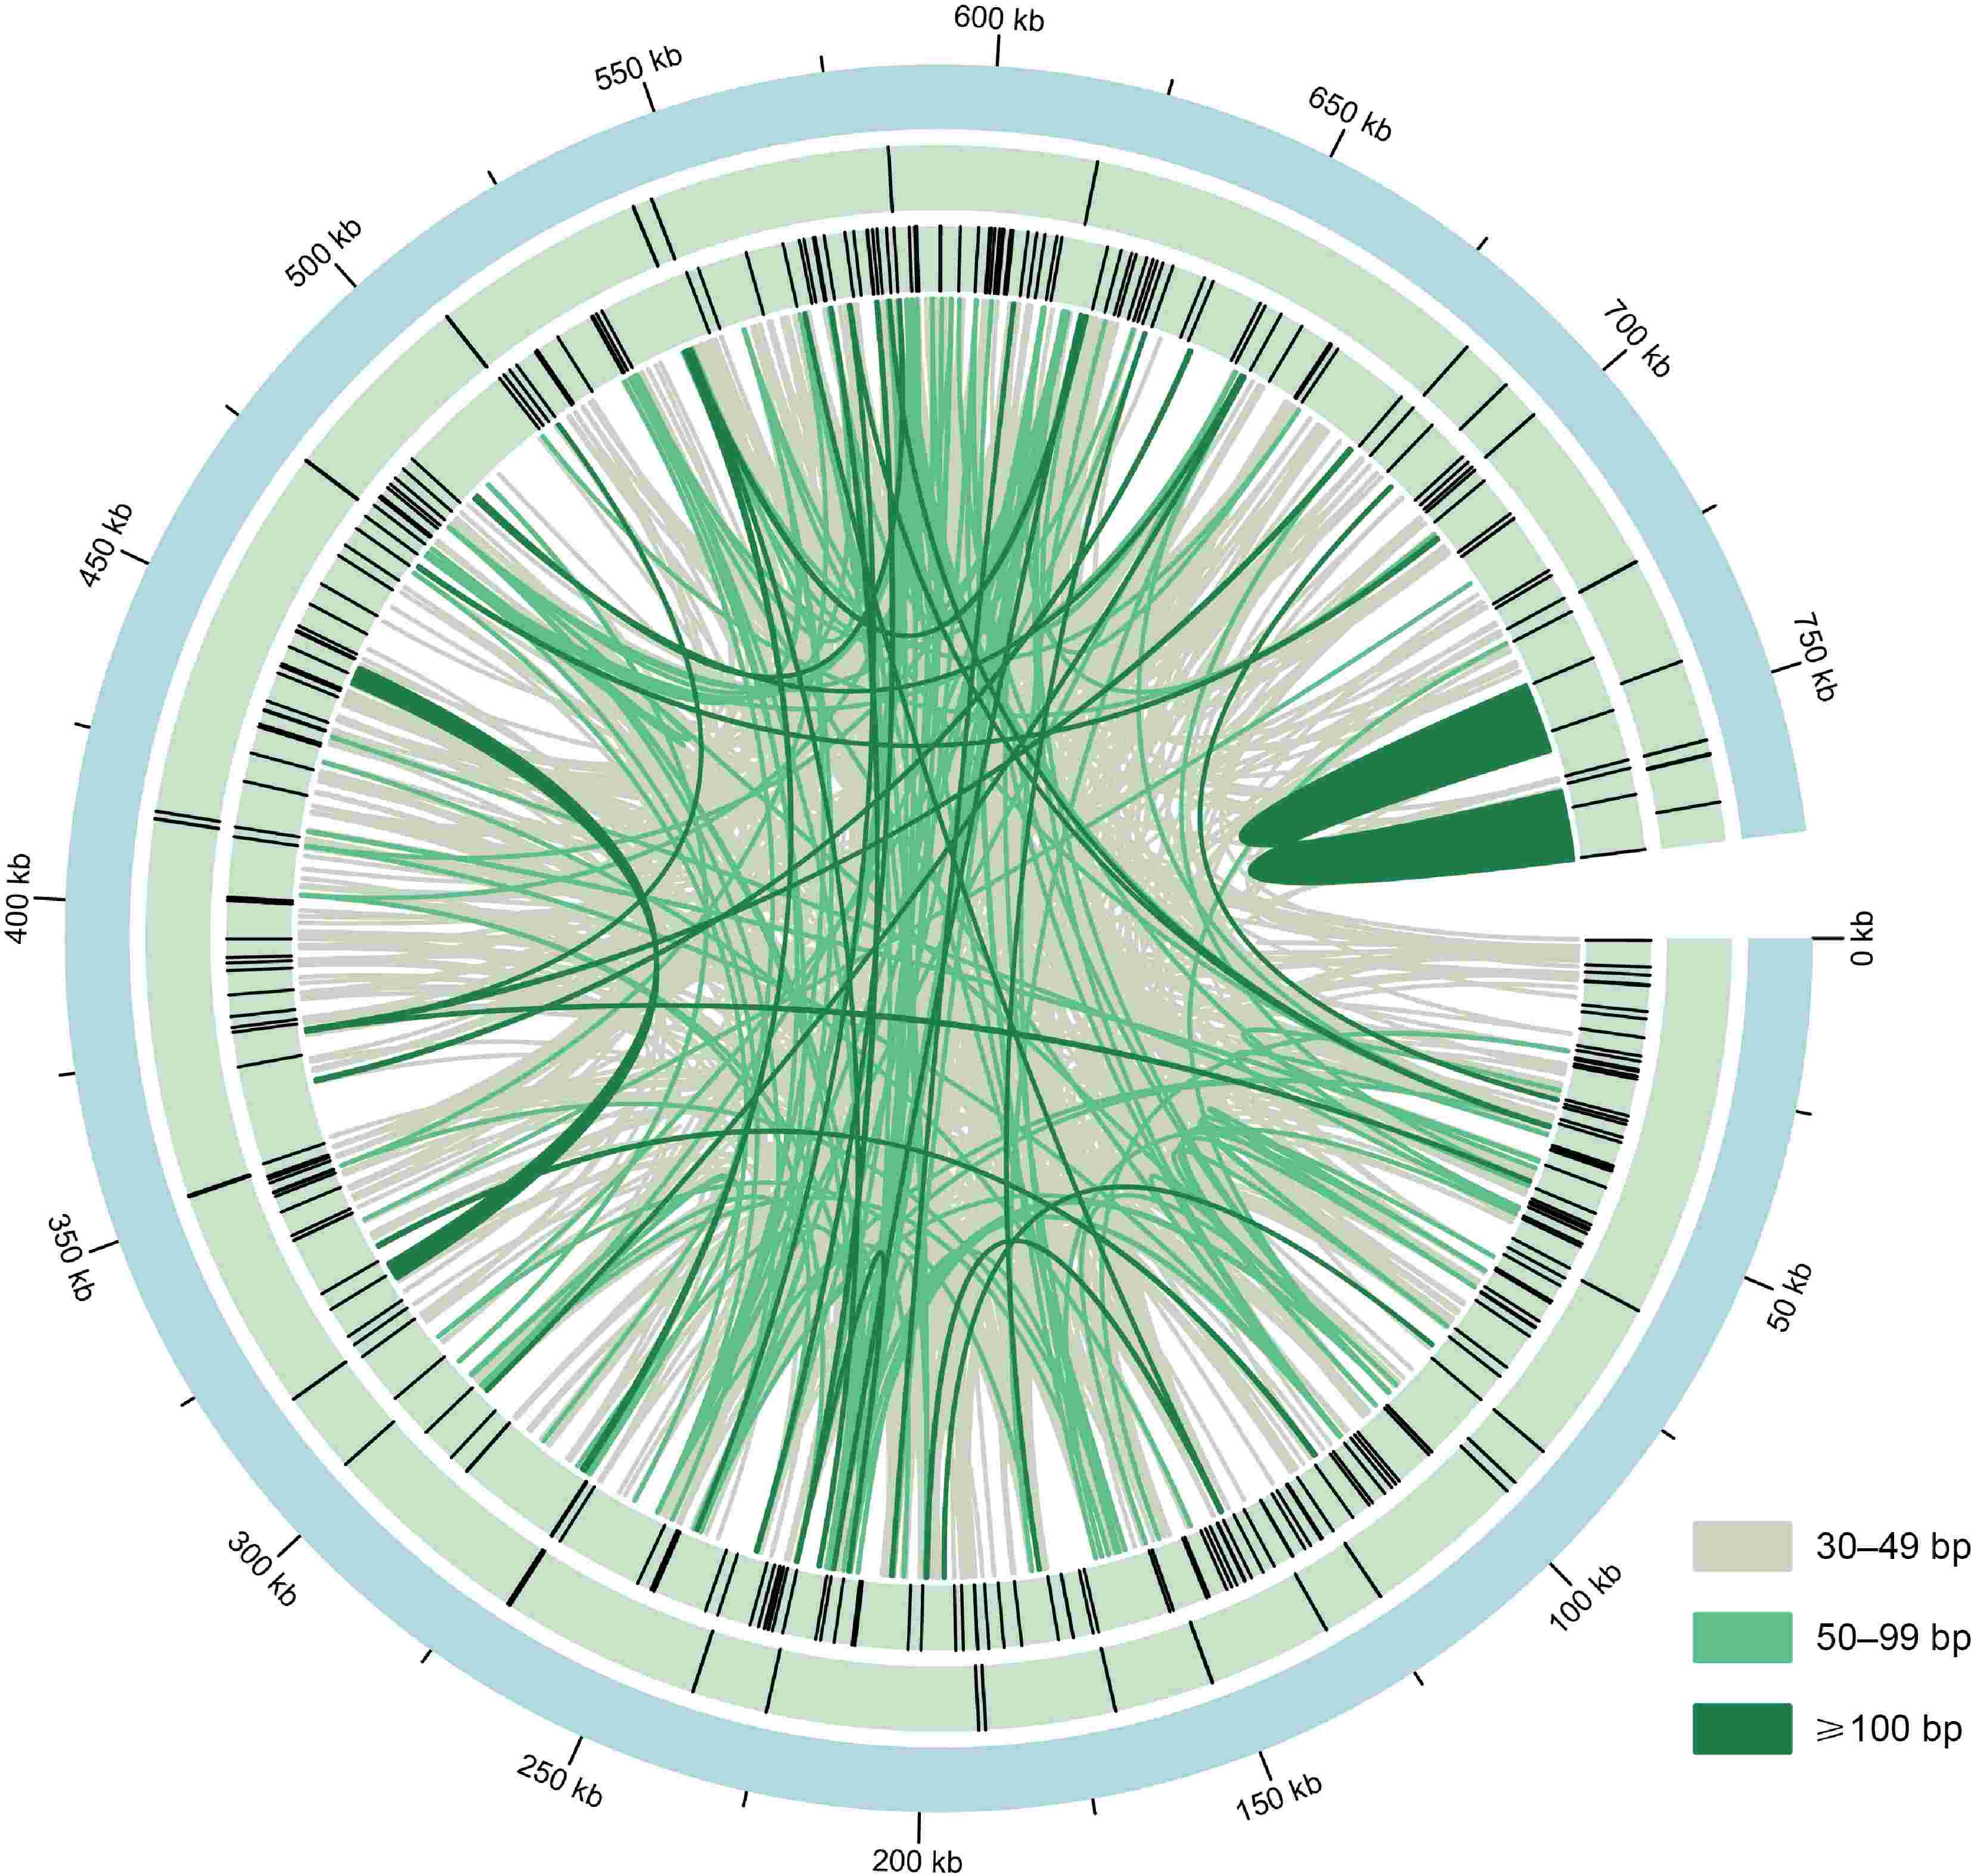
Figure 3.
The distribution of repeats in the M. figo mitogenome. From the center outward, the first circle shows the mitogenome of M. figo, the second and third circle shows tandem repeats and simple sequence repeats, respectively. The inner lines represent the dispersed repeats. The legends of different colors positioned in the bottom left corner represent the dispersed repeats of different lengths.
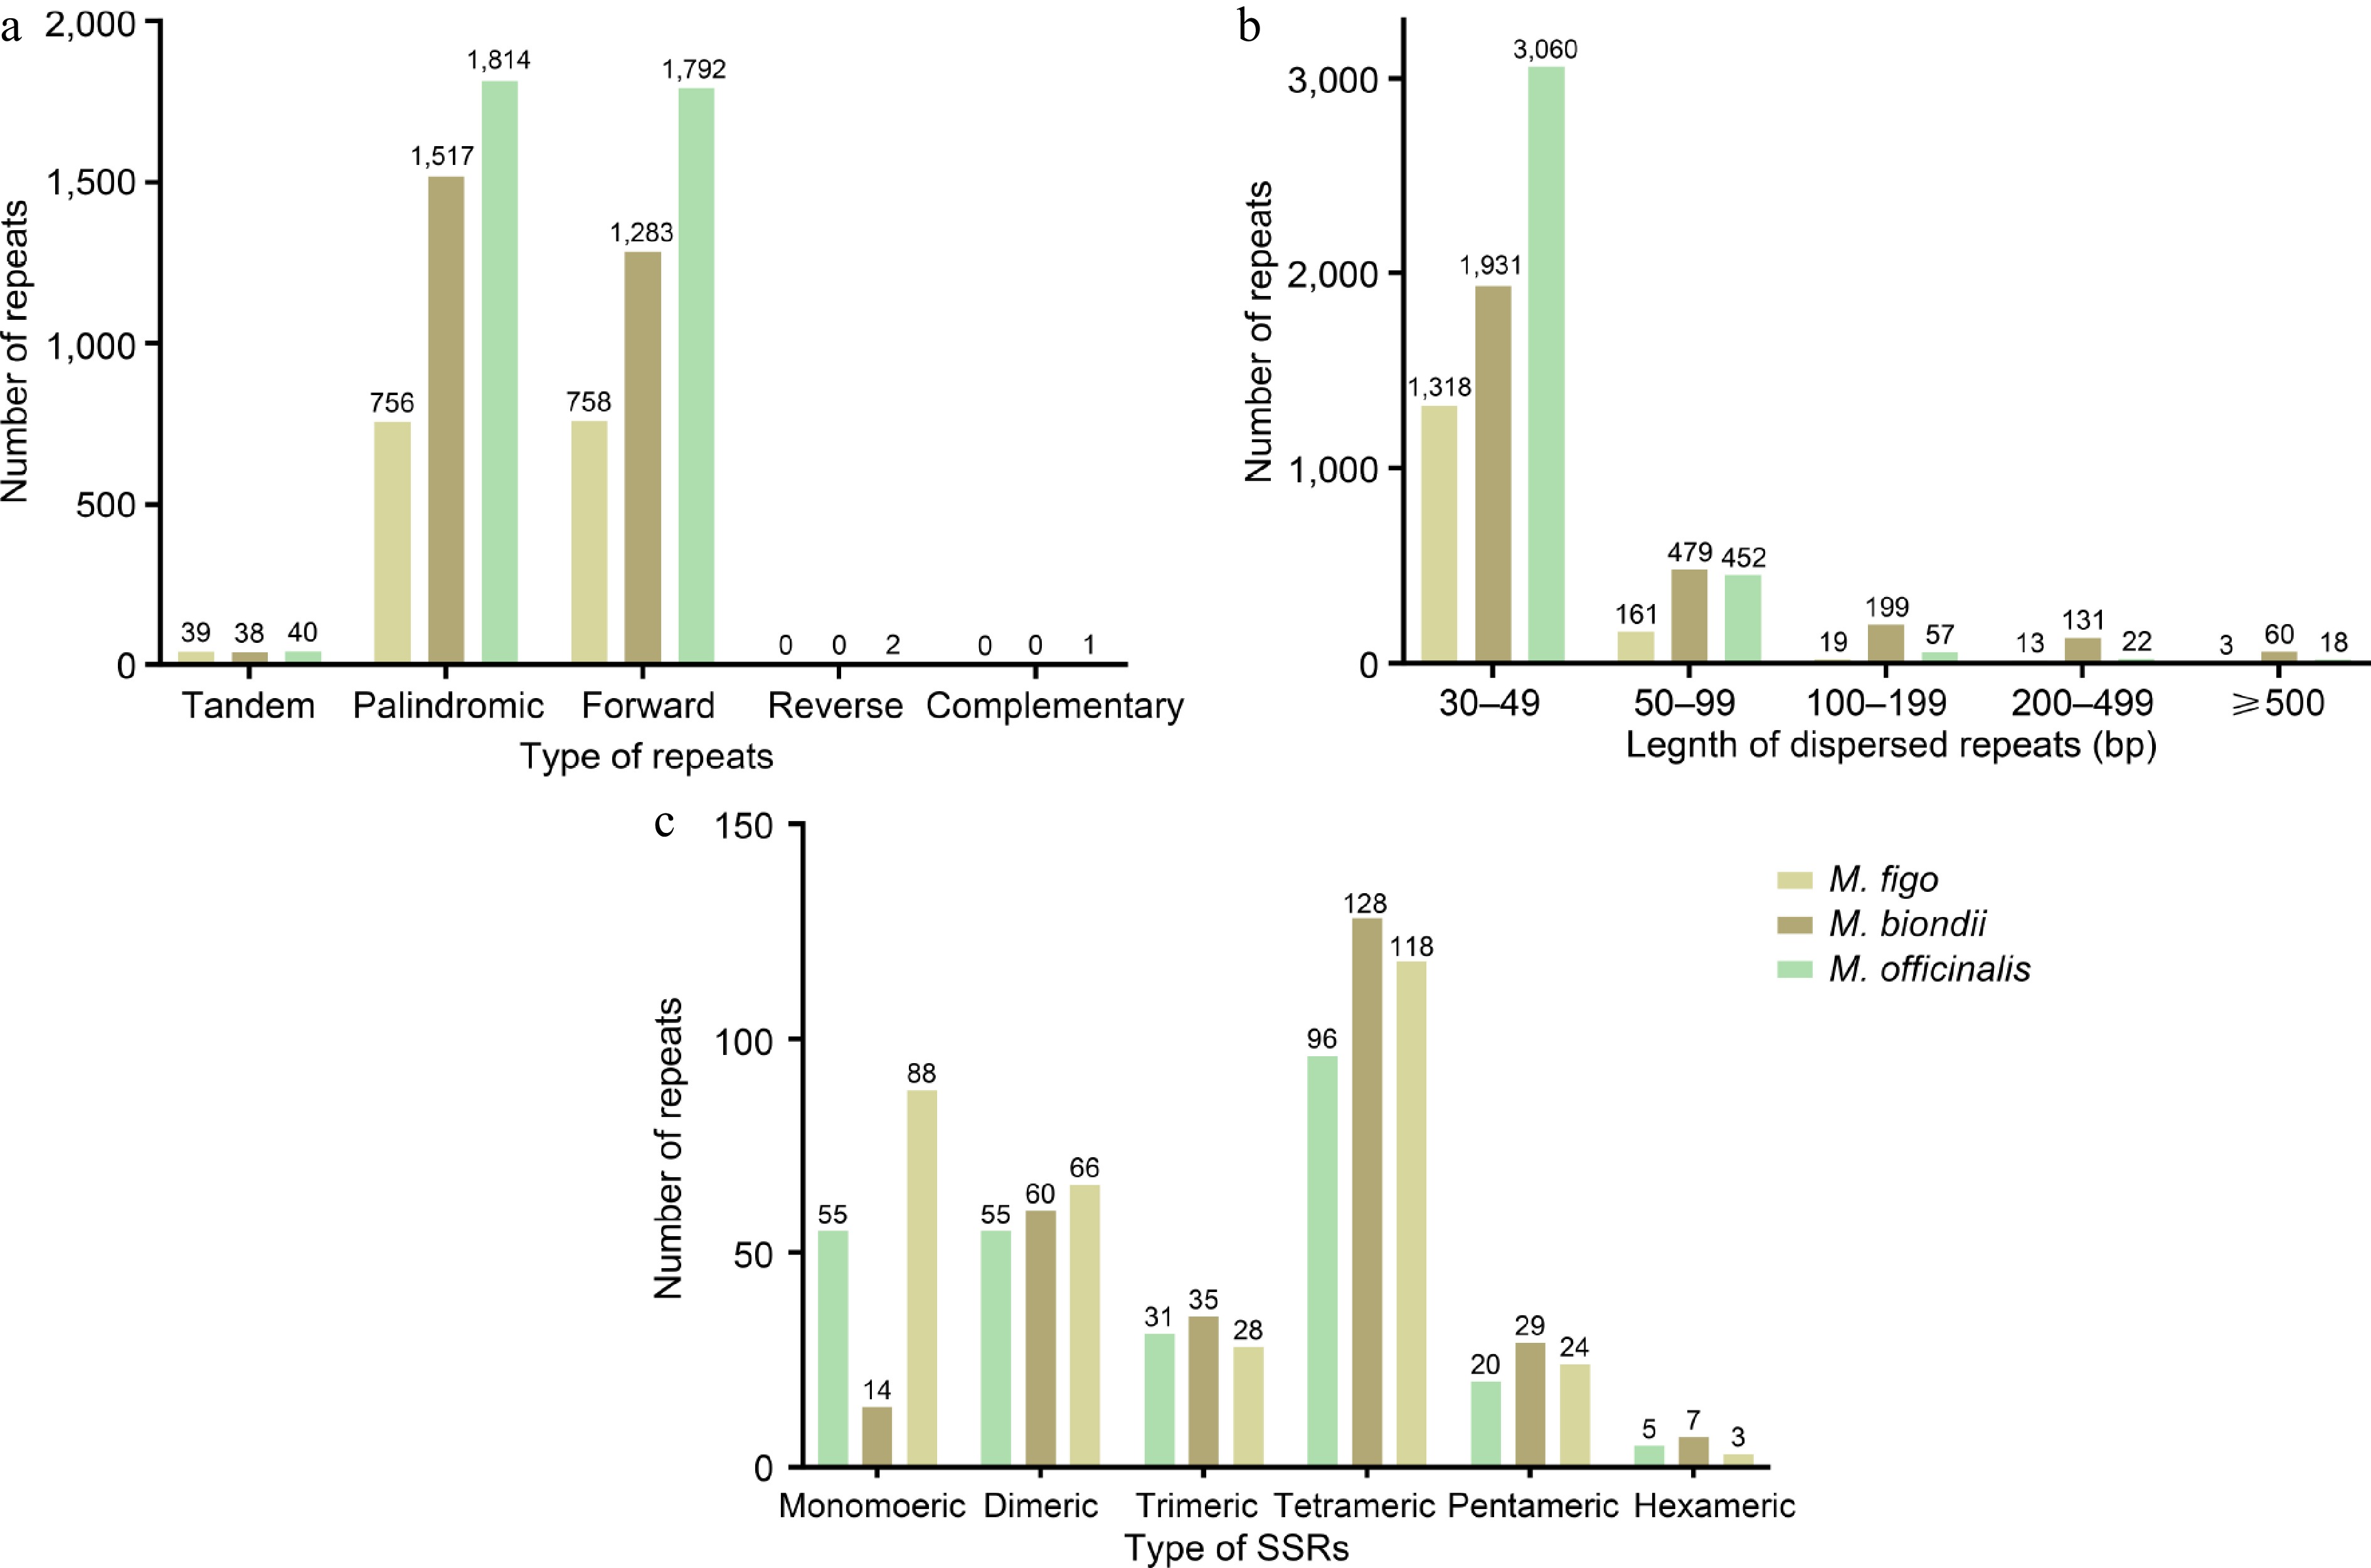
To further investigate the repeats in the mitogenomes of Magnoliaceae, we detected and compared the tandem, SSRs and dispersed repeats in the mitogenomes of three Magnoliaceae species (M. biondii, M. officinalis, and M. figo). The results show that only M. officinalis contains two pairs of reverse repeats and one pair of complementary repeats (Fig. 4a), while the number of tandem repeats does not exhibit significant variation (Supplementary Tables S6 & S7). The M. officinalis mitogenome exhibits the highest number of dispersed repeats (3,609), followed by M. biondii (2,800) and M. figo (1,514) (Fig. 4a, Supplementary Tables S8 & S9). The distribution of dispersed repeat lengths across the three mitogenomes is also similar (Fig. 4b), with most repeats ranging from 30 to 49 bp, and only a few exceeding 500 bp. Additionally, comparative results of SSRs reveal that all three mitogenomes of Magnoliaceae contain six SSR types (Fig. 4c, Supplementary Tables S10 & S11), with M. officinalis exhibiting the highest number of SSRs (327). The diversity of SSR types in Magnoliaceae mitogenomes does not vary significantly, with the exception of a notable difference in the case of mononucleotides.
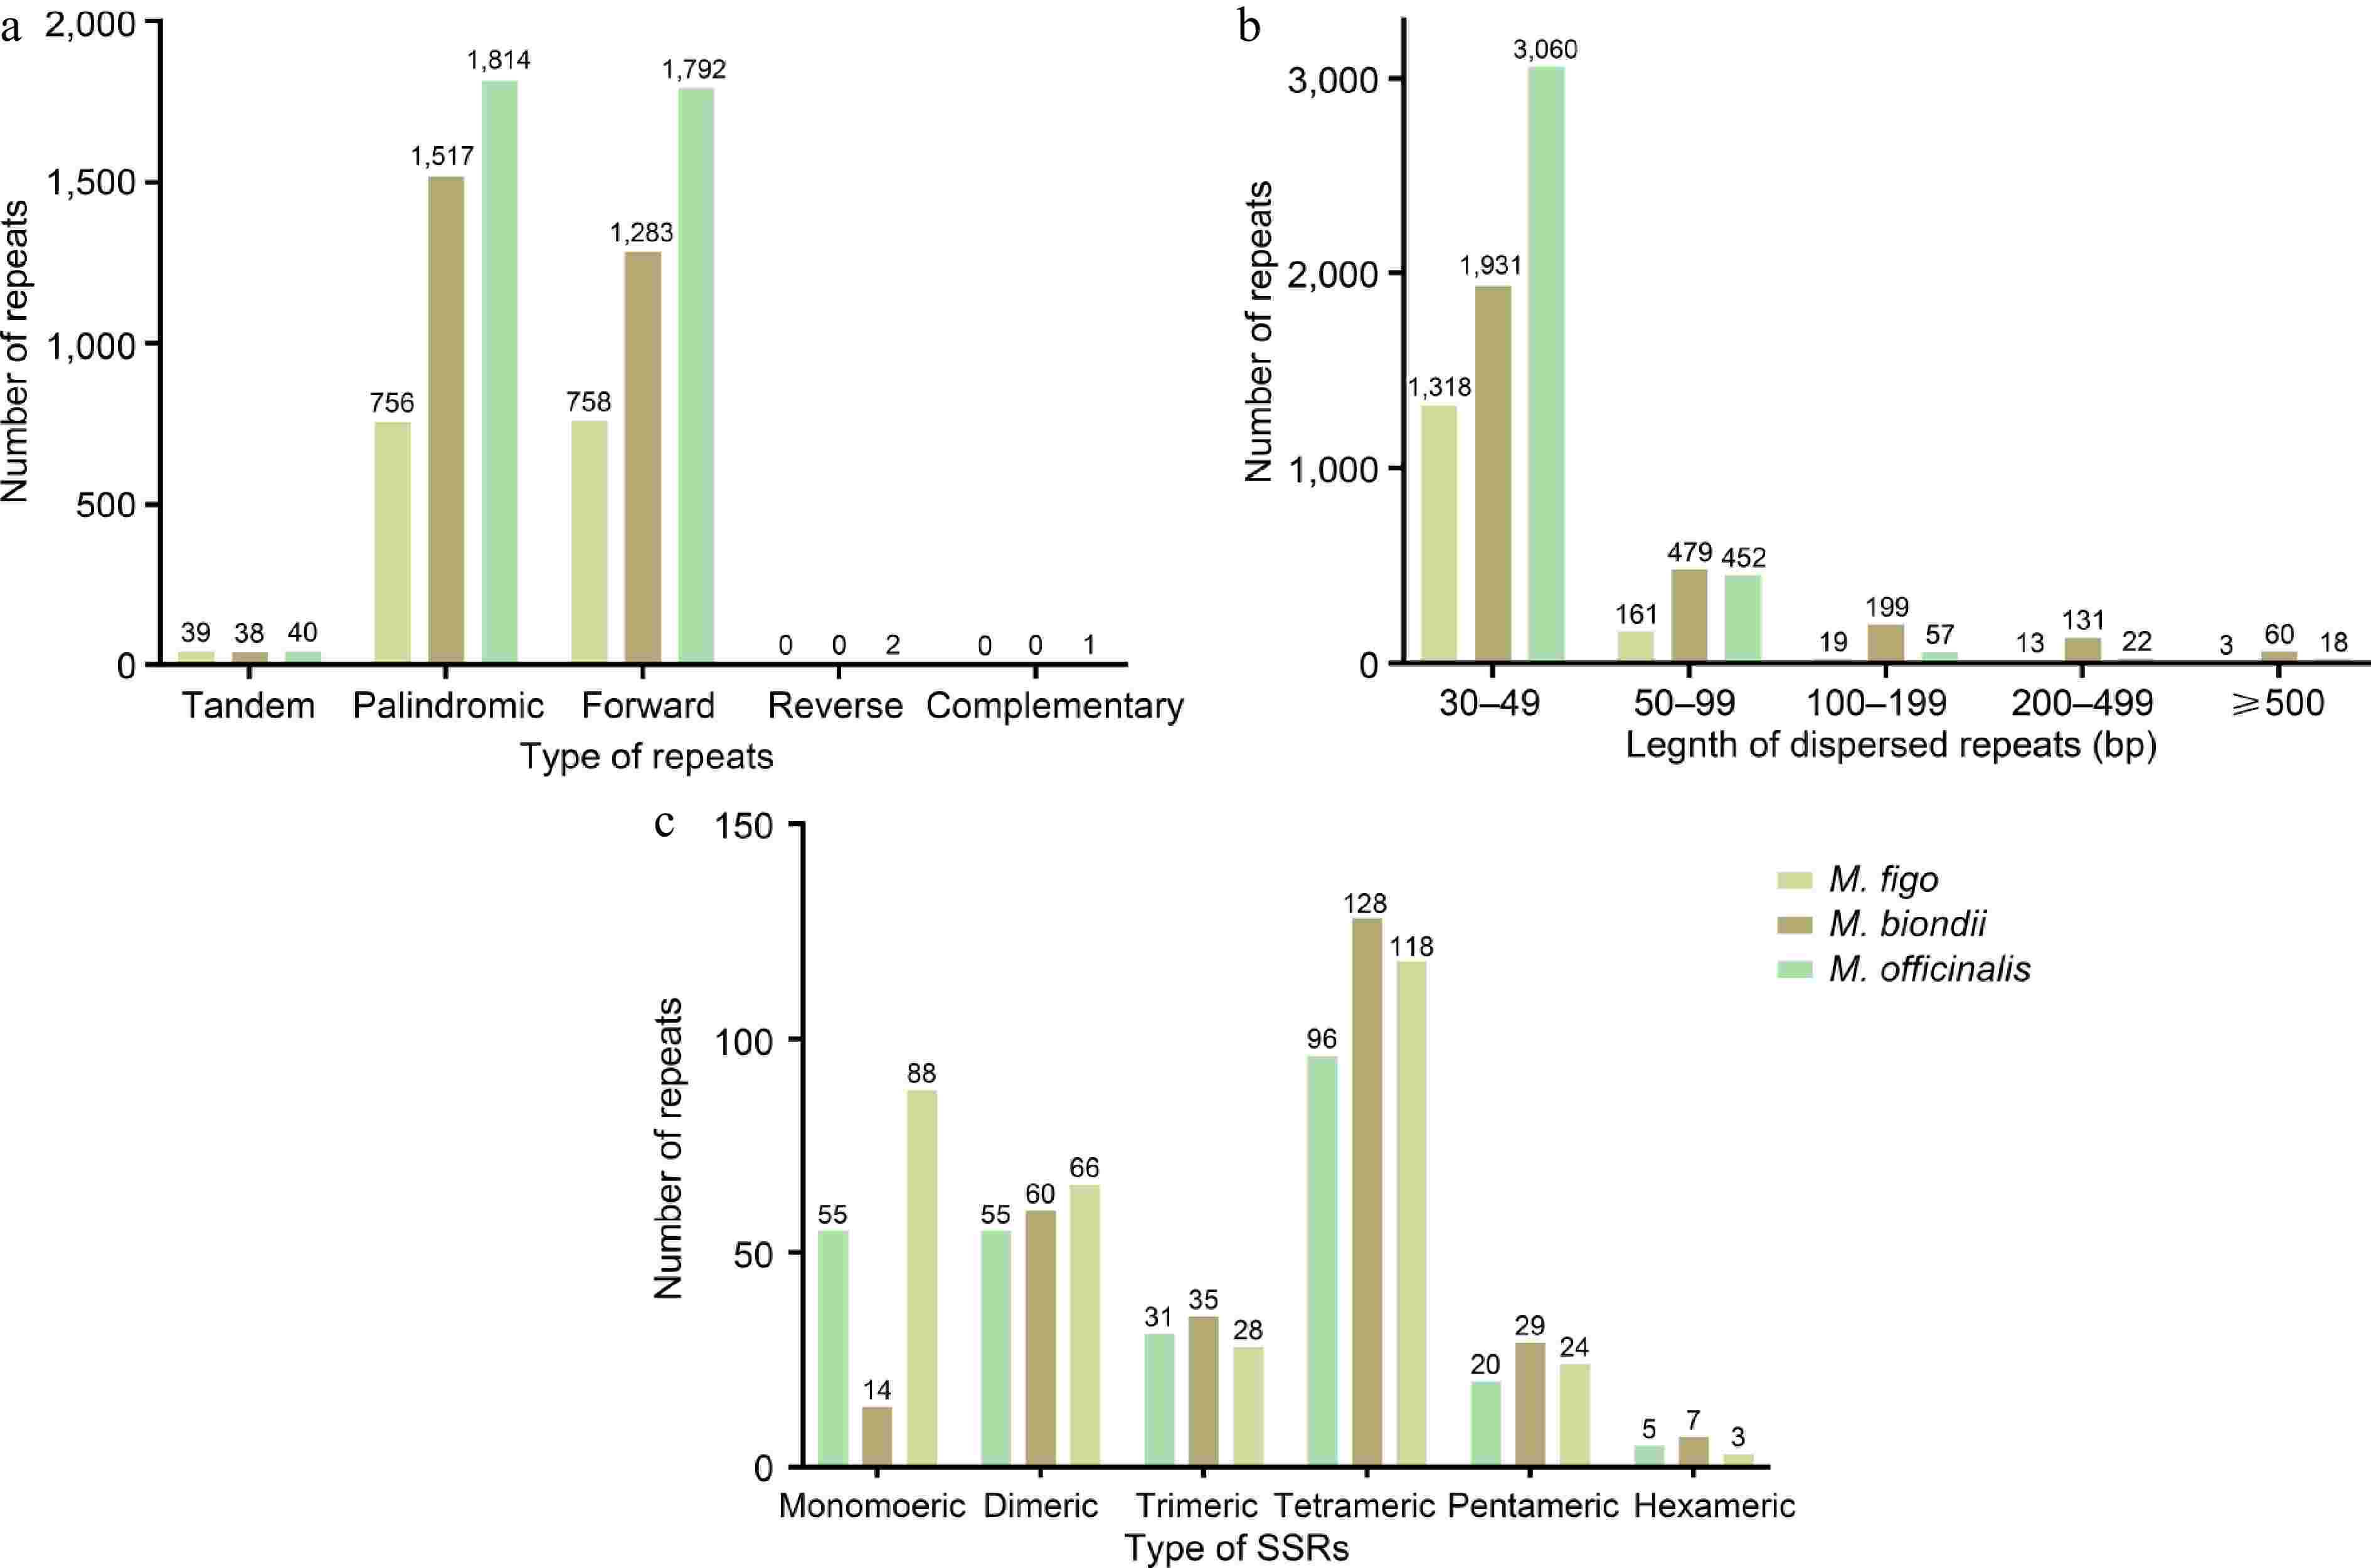
Figure 4.
(a) Type and number of simple sequence repeats in the mitogenomes of two Magnolia species and M. figo. (b) Length and number of dispersed repeats in the mitogenomes of two Magnolia species and M. figo. (c) The different colored legends indicate different species.
Analysis of MTPTs
-
We identified 81 fragments transferred from the plastome to the mitogenome of M. figo (Fig. 5 & Supplementary Table S12), ranging from 50 to 4,665 bp. The entire length of MTPTs measures 42,791 bp, constituting 5.53% of the whole mitogenome. Most of these MTPTs range from 50 to 500 bp in length, and only 11 fragments exceeding 1 kb, with the longest fragment reaching 4,666 bp. A total of 15 plastid genes were found to be located on MTPTs, including nine PCGs (psbL, psbF, psbE, petL, petG, rps8, rpl14, rps7, and ndhB) and six tRNA genes (trnD-GUC, trnY-GUA, trnE-UUC, trnW-CCA, trnP-UGG, and trnV-GAC). Notably, trnD-GUC, trnW-CCA, and trnV-GAC are completely transferred from the plastome to the mitogenome. Additionally, we found that MTPT22, MTPT65, MTPT68, and MTPT69 are located in repeat regions.
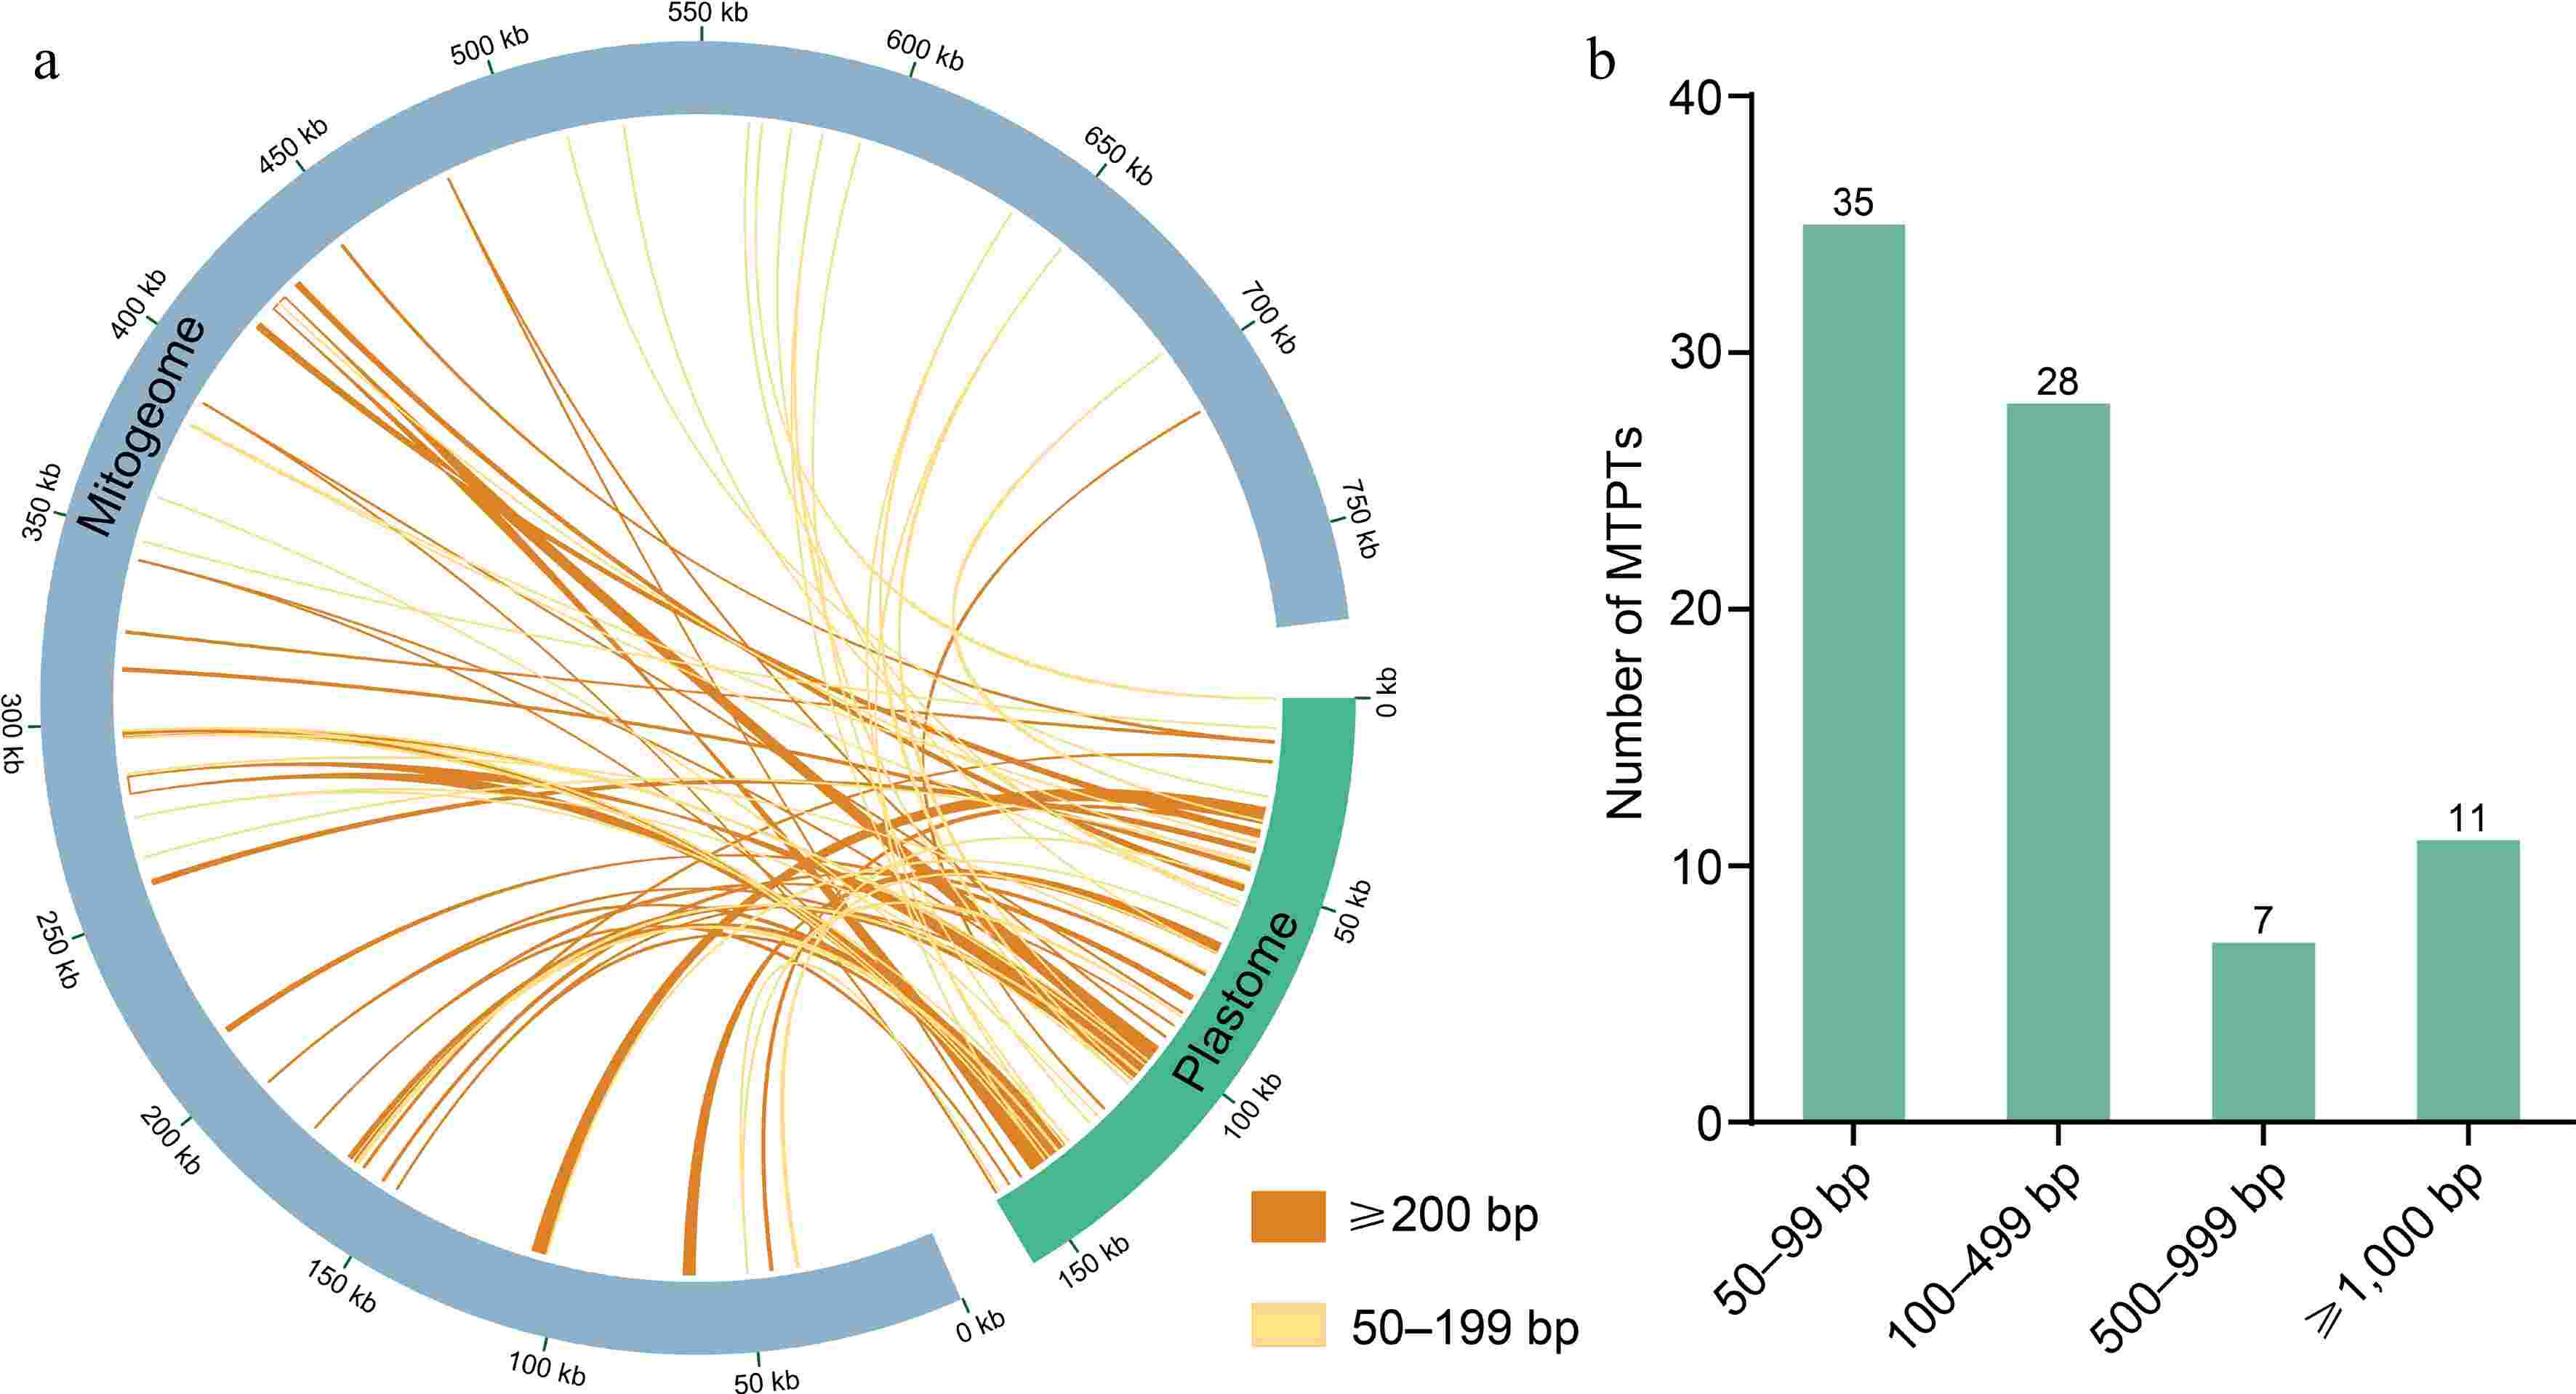
Figure 5.
(a) Homologous sequences between mitogenome and plastome. The plastome is represented by the green circular segment and the mitogenome by the gray circular segment, and two different kinds of yellow lines represent the homologous fragments. The legends of different colors positioned in the bottom right corner represent fragments of different lengths. (b) Lengths and numbers of these homologous fragments in the M. figo mitogenome.
Collinearity analysis of four Magnoliaceae mitogenomes
-
We conducted a collinearity analysis by comparing the mitogenome of M. figo with three other Magnoliaceae mitogenomes (L. tulipifera, M. officinalis, and M. biondii). As illustrated in Fig. 6a, a total of 40 locally collinear blocks (LCBs) were identified between the mitogenomes of M. figo and M. officinalis (Supplementary Table S13). The cumulative length of these colinear blocks amounts to 416,577 bp, comprising approximately 53.86% of the M. figo mitogenome. Among these colinear blocks, the longest is 34,737 bp, and the average length is 10,413 bp. Between the mitogenomes of M. biondii and M. figo, we detected 42 LCBs, accounting for 59.04% (456,622 bp) of the M. figo mitogenome (Supplementary Table S14). The longest colinear block is 44,187 bp, and the average length is 10,871 bp. Between the mitogenomes of M. biondii and L. tulipifera, a total of 27 LCBs were identified (Supplementary Table S15), accounting for 52.14% (287,725 bp) of the L. tulipifera mitogenome. The longest colinear block is 30,420 bp, and the average length is 10,656 bp. The average colinear lengths of the four mitogenomes are highly consistent (Fig. 6b).
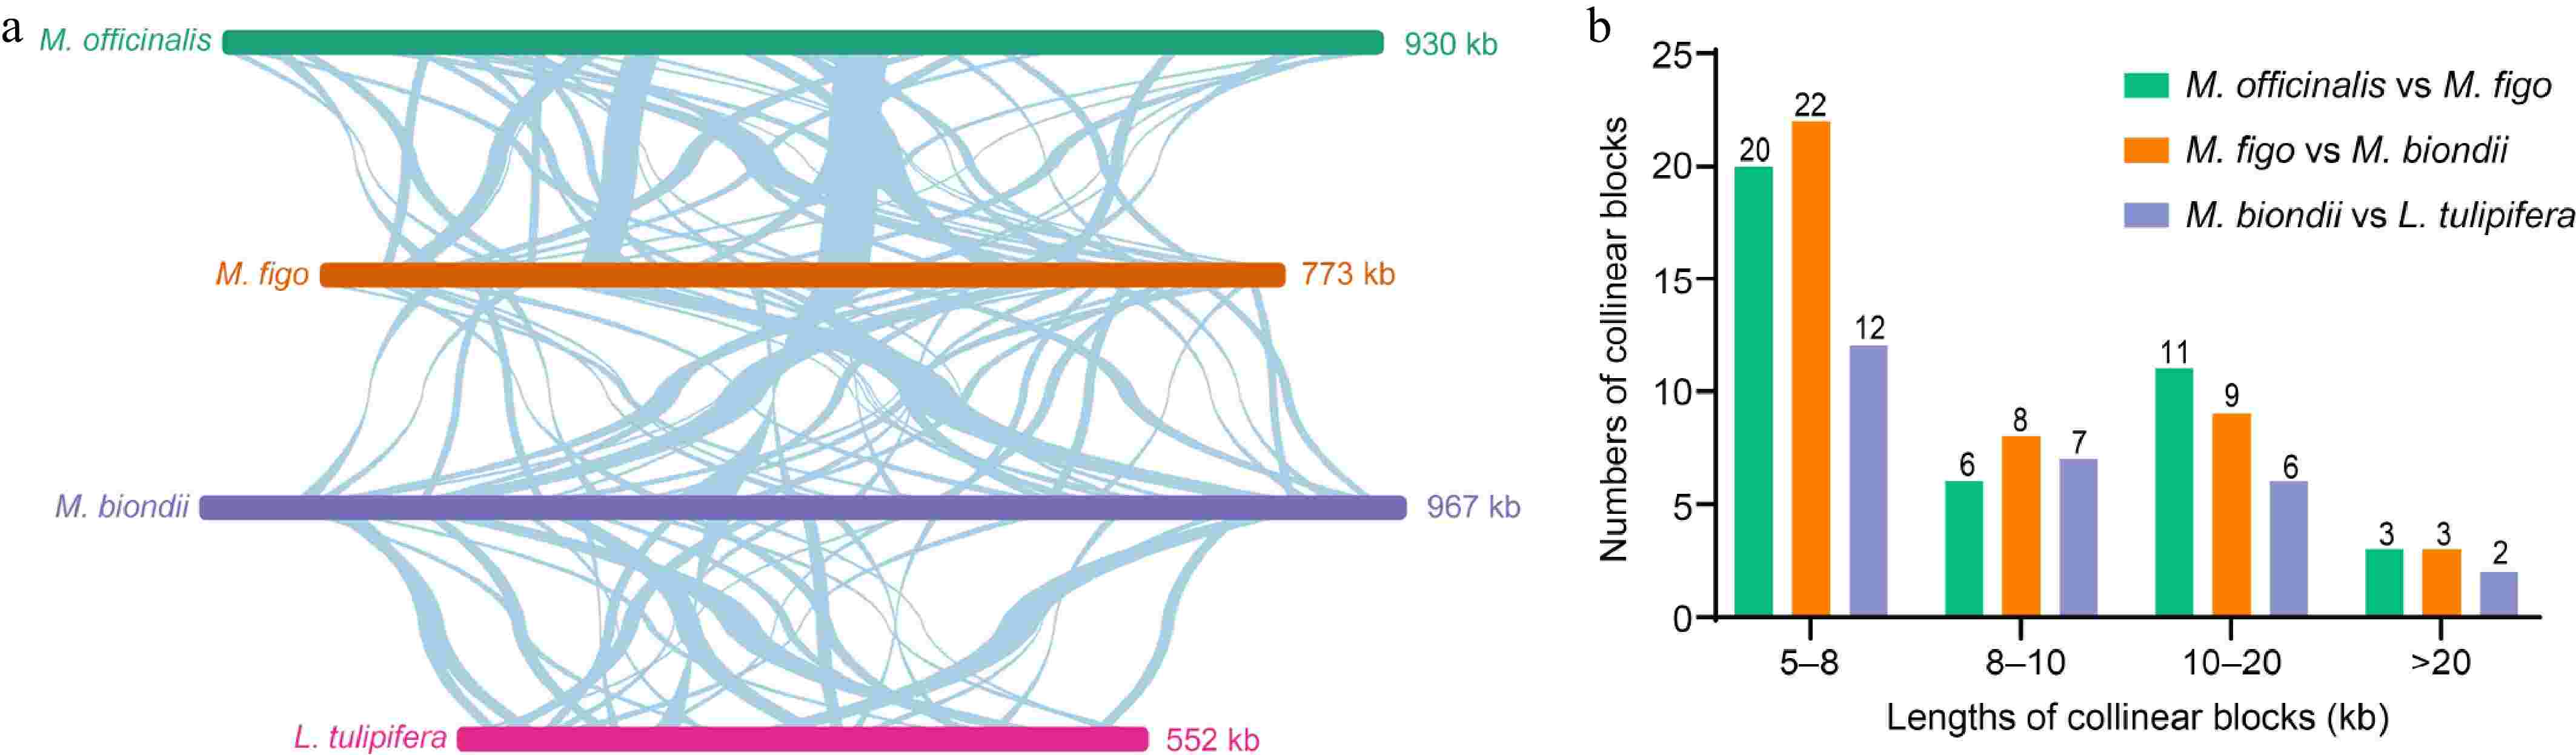
Figure 6.
Schematic representation of the collinearity among four Magnoliaceae mitogenomes. (a) Collinearity plots of the four Magnoliaceae mitogenomes. The mitogenomes are shown by the bars in each row, and collinear regions are indicated by the connecting lines in the center. (b) Lengths and numbers of collinear blocks. The different colored legends indicate homologous fragments between different species.
Phylogenetic analysis
-
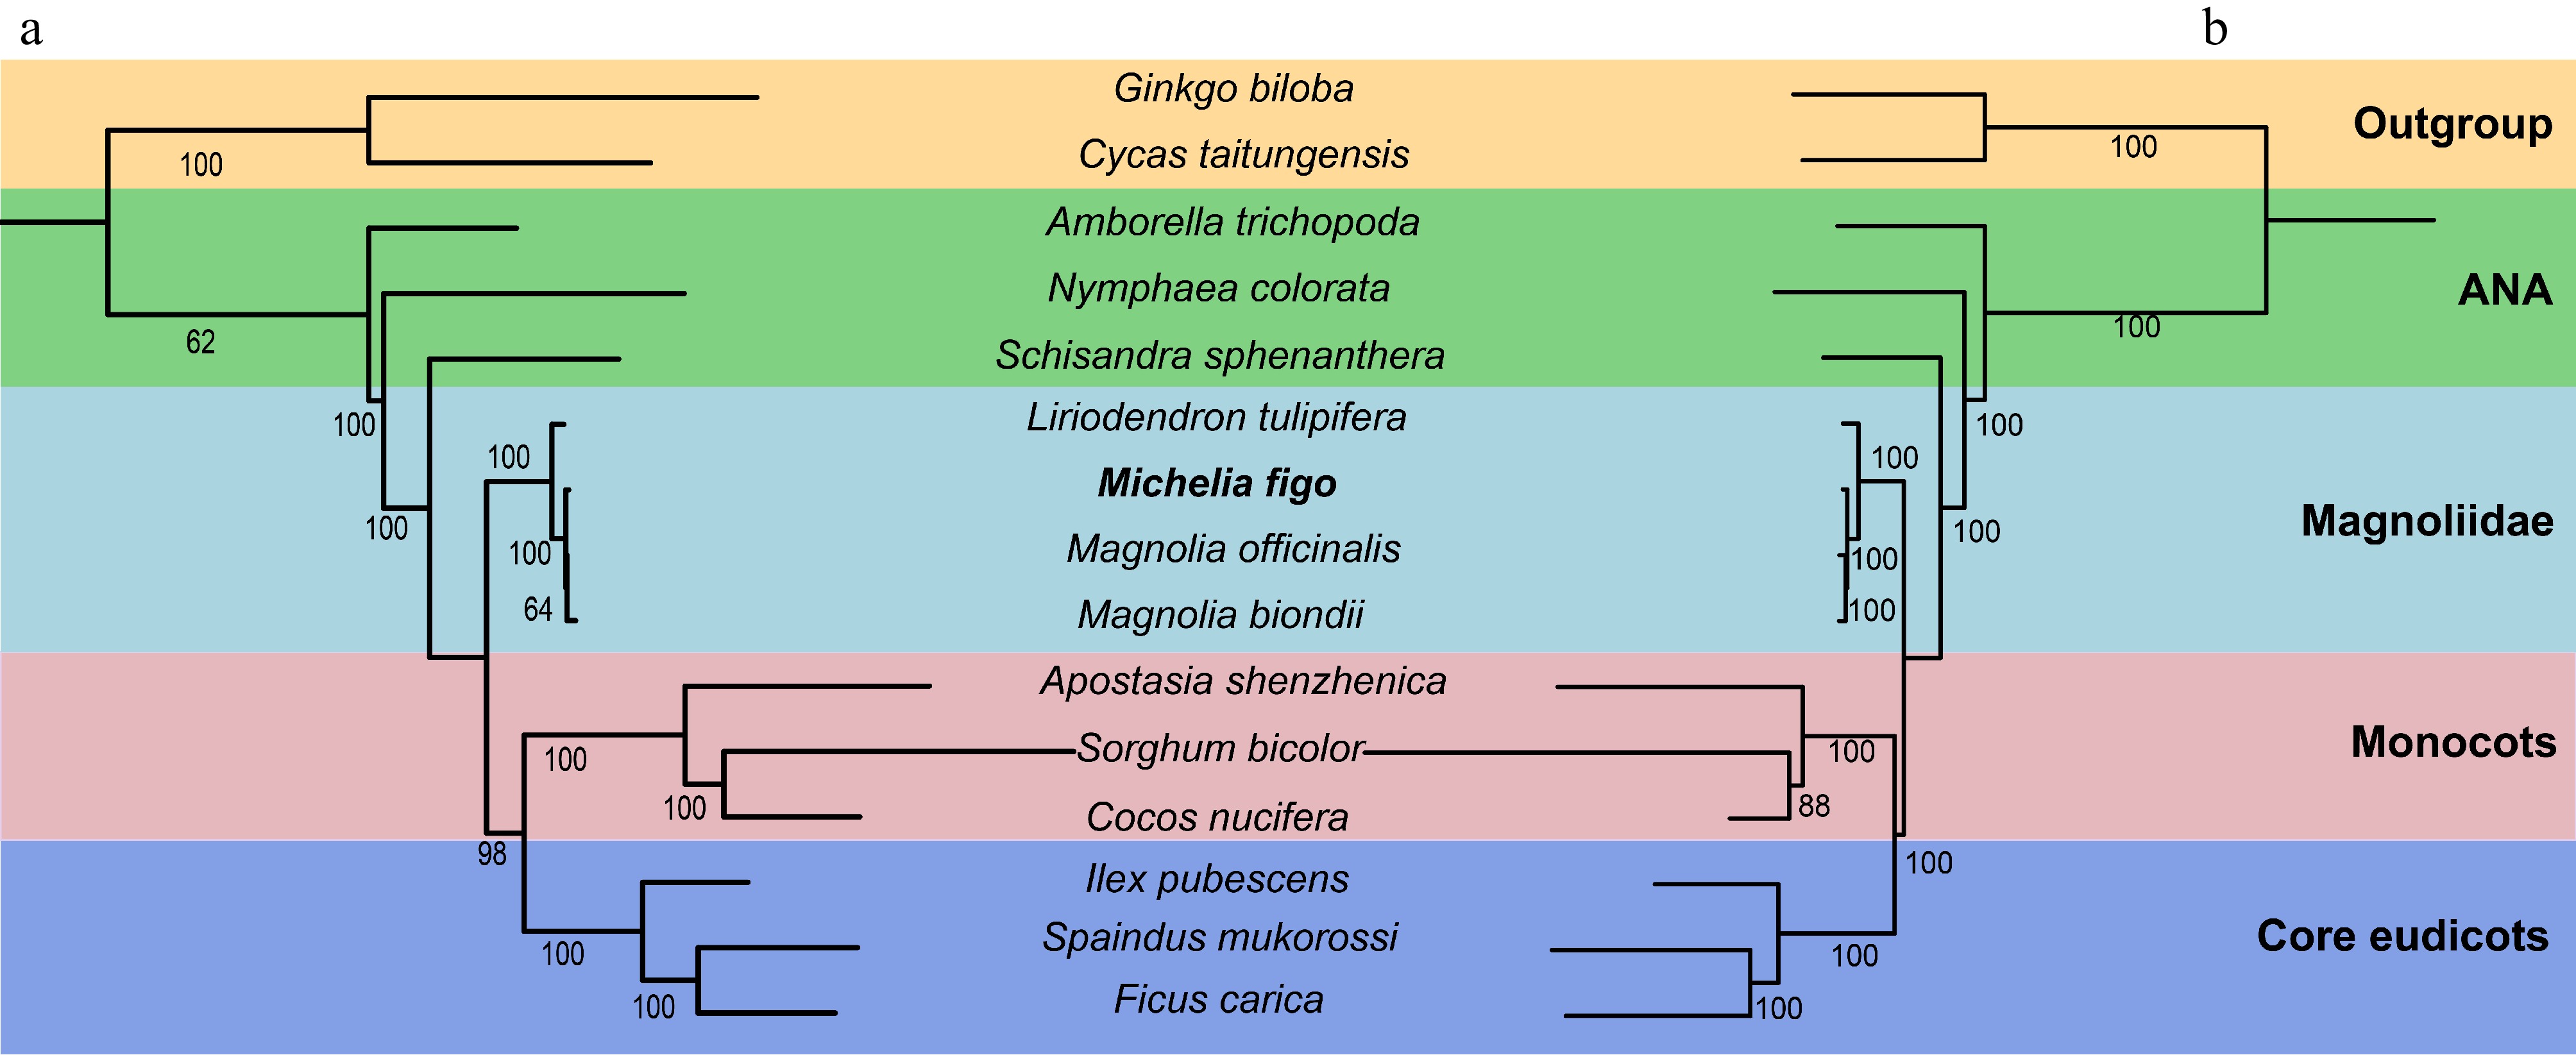
To further elucidate the phylogenetic position of M. figo, we constructed two phylogenetic trees based on 18 mitochondrial and 61 plastid PCGs from 15 species, respectively (Supplementary Tables S16 & S17). As illustrated in Fig. 7, 91.67% of the total nodes possess bootstrap support values exceeding 80%, including 20 nodes that achieve the maximum support of 100%. From the basal group downward, the bootstrap value for the separation of Magnoliidae from the clade consisting of monocots and core eudicots is 100%. In the Magnoliidae, the bootstrap value for the separation of Magnoliales and Laurales is 100%. Furthermore, we found that M. biondii and M. officinalis firstly grouped, this clade subsequently grouped with M. figo with a 100% bootstrap value, indicating that Michelia is closely related to Magnolia. The phylogenetic trees constructed based on mitogenomes and plastomes exhibit remarkable consistency, supporting that Michelia is closely related to Magnolia.
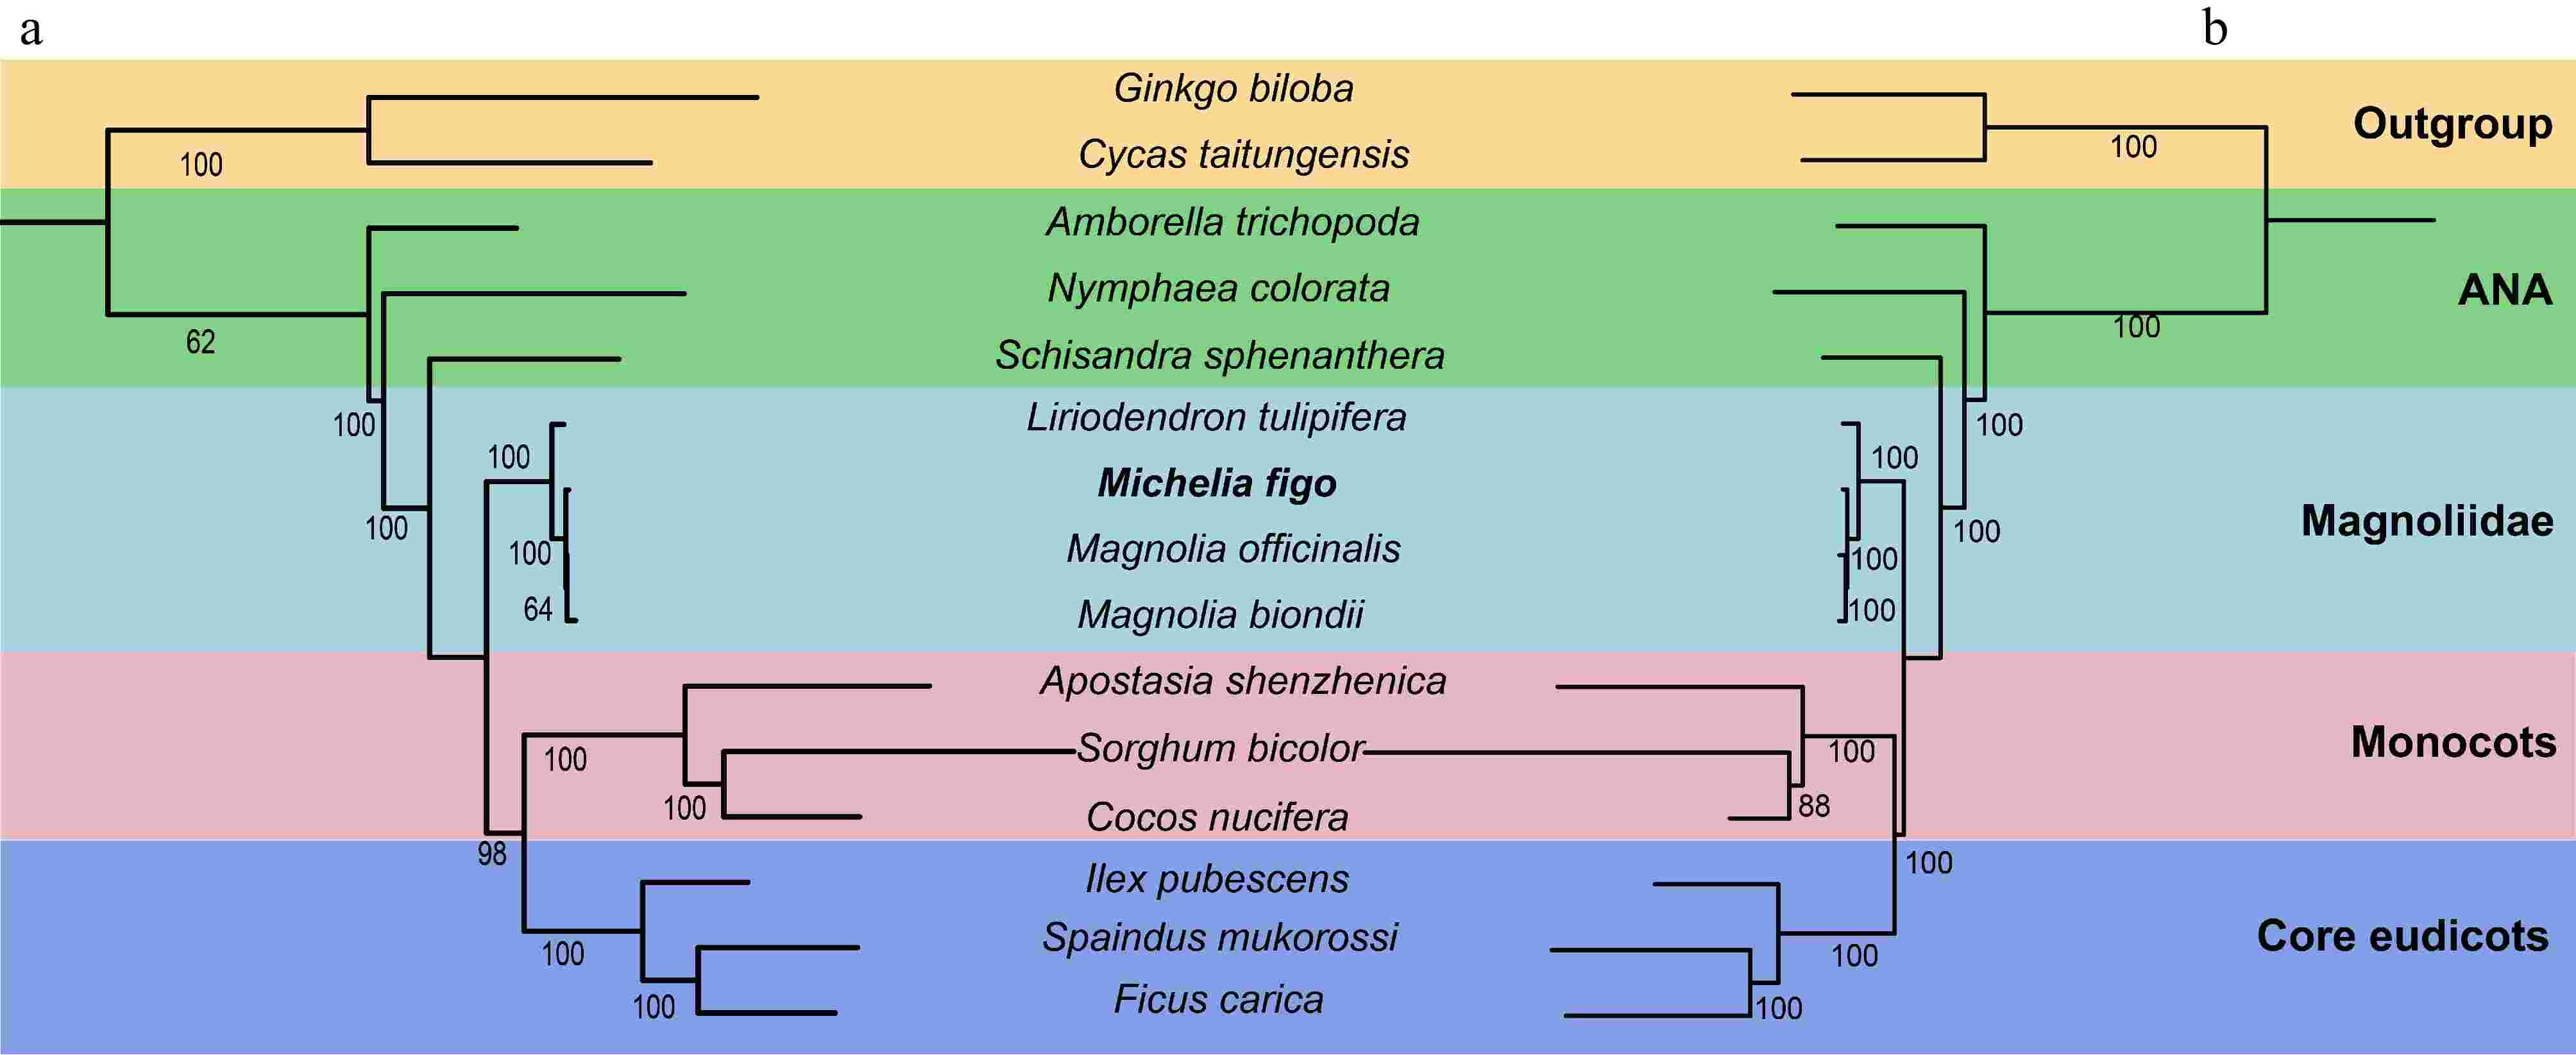
Figure 7.
The phylogenetic trees constructed based on M. figo and other 14 plant mitogenomes and plastomes. The bootstrap values are clearly displayed within each node. The utilization of distinct colors serves to show the various groups to which the specific species belong. (a) The tree was constructed based on 18 shared mitochondrial genes. (b) The tree was constructed based on 61 shared plastid genes.
-
Plant mitogenomes frequently undergo recombination events mediated by repeats, resulting in great differences in their size[51]. Despite the closely related species, notable variations in mitogenome size can still be observed. For example, the size of the Silene latifolia mitogenome (253 kb) differs by 45 times compared to that of S. conica (11.3 Mb)[52]. The mitogenomes of Cucumis melo (2.9 Mb) and Citrullus lanatus (379 kb) differ by more than seven times[53]. The frequent recombination events of plant mitogenomes may integrate a large amount of foreign DNA during evolution, potentially contributing to the great differences in plant mitogenomes size. In this study, the mitogenome length of M. figo (773,377 bp) is relatively short in Magnoliaceae, with the longest in M. biondii (967,100 bp), followed by M. officinalis (930,306 bp) and M. liliiflora (865,191 bp). The shortest mitogenome is L. tulipifera (551,806 bp), accounting for only 60% of the mitogenomes of M. biondii and M. officinalis.
Frequent recombination events not only lead to great differences in mitogenome size, but also contribute to complex and diverse structures of plant mitogenomes[54], ranging from single circular and linear structures to more complex branched linear, branched circular, and other complex structures[55]. It has been reported that the mitogenomes of Amborella trichopoda[56], Rhopalocnemis phalloi[57], and Panax notoginseng[58] are complex dynamic structures resulting from recombination. The mitogenome structures of Magnoliaceae are relatively conserved, with the majority being assembled into a single circular chromosome (M. biondii, M. officinalis, M. figo, and L. tulipifera). However, the mitogenome of M. liliiflora exhibits a linear chromosome. Additionally, the mitogenomes of angiosperms exhibit rapid structural differentiation and loss of collinearity, even those of closely related species[59,60]. In this study, using the nucmer program of MUMmer, numerous colinear regions and genomic rearrangements were identified among four Magnoliaceae mitogenomes. The lengths of these colinear blocks account for more than half of each mitogenome. The results of collinearity analysis reveal there may have been significant genomic rearrangements in the mitogenomes of Magnoliaceae species during their evolutionary history.
The mitogenomes of angiosperms generally encode a core set of 24 PCGs: nad1-7, 9, and 4L; cob; cox1-3; ccmB, C, Fc, and Fn; atp1, 4, 6, 8, and 9; mttB/tatC; and matR. Although these core genes are present in most mitogenomes, there are significant variations in their quantity, position, and arrangement, even within mutants of the same species. In addition to the 24 conserved PCGs, plant mitogenomes also possess 19 standard variable genes, consisting of five large subunits of ribosome proteins (rpl2, 5, 6, 10, and 16), 12 small subunits of ribosome proteins (rps1-4, 7, 8, 10-14, and 19), and two respiratory genes (sdh3-4). Among these variable genes, the large and small subunits of ribosome genes are missing relatively frequently[61]. The mitogenome of M. figo harbors all 24 core PCGs, with only two variable PCGs (rpl6 and rps18) being lost. Similarly, the mitogenomes of M. biondii[33] and L. tulipifera[62] have retained nearly all ancestral PCGs. However, the Silene vulgaris mitogenome has nearly lost all variable PCGs with the exception of rps13. Moreover, the Viscum scurruloideum mitogenome has lost the entirety of 11 of the 24 core PCGs, including ccmB, matR, and all NADH dehydrogenase genes[12]. The gene content in the mitogenomes of Magnoliaceae is relatively abundant[63], suggesting that they may have undergone less gene loss during the mitogenome evolution.
Plant mitogenomes vary significantly in the number of introns. The Silene latifolia mitogenome has only 19 introns[64], while the Selaginella moellendorffii mitogenome contains the largest number of 37 introns[65]. The M. figo mitogenome contains 25 introns in 10 PCGs (ccmFc, rpl2, rps3, rps10, cox2, nad1, nad2, nad4, nad5, and nad7), consisting of 22 cis-splicing and three trans-splicing introns. Cis-splicing is prevalent in most introns of angiosperm mitogenomes, whereas nad1, nad2, and nad5 evolved a split structure that requires trans-splicing[63]. Similar to the majority of angiosperm mitogenomes, the intron rps3i257 in the M. figo mitogenome is completely lost during differentiation[66]. These results indicate that introns are frequently gained or lost during the evolution of plant mitogenomes (Supplementary Fig. S2)[63].
Plant mitogenomes are characterized by the abundance of repeats, contributing to the complexity and diversity of mitogenome sizes and structures through frequent recombination events[10]. The intense recombination events mediated by long repeats (> 500 bp) facilitate reversible recombination, regulate the molecular conformation of the mitogenome, and ultimately contribute to the expansion and complexity of plant mitogenomes[54]. In this study, the M. figo mitogenome exhibits the lowest abundance of SSRs and long repeats (> 500 bp), whereas M. biondii mitogenome displays the highest abundance in Magnoliaceae. It can be inferred that it is likely to undergo less recombination events during the evolution of M. figo mitogenome, while the M. biondii mitogenome may experience more recombination events. Simultaneously, variations in the quantity of repeats may result in significant differences in the size of mitogenomes. For example, the mitogenome sizes of bryophytes remain relatively stable at approximately 110 kb, probably due to the scarcity of repeats within their mitogenomes. This scarcity contributes to the conserved and stable structure of the bryophyte mitogenomes. By contrast, the mitogenomes of ferns exhibit a significant number of repeats, accounting for their relatively large sizes[10]. In this study, the mitogenomes of M. biondii and M. officinalis exhibit a significantly higher numbers of repeats compared to M. figo, potentially explaining the differences in their mitogenome sizes.
DNA fragment transfer events between the plastomes and mitogenome, as well as among different species, are recurrent phenomena that occur during the evolution of the plant mitogenome[67]. The lengths and similarities of these cp-derived fragments vary among different species[68]. The total length of MTPTs in the M. figo mitogenome is 42,791 bp, constituting 5.53% of the whole mitogenome. This proportion is significantly higher than that observed in numerous other mitogenomes, such as Arabidopsis thaliana (0.8%) , Glycine max (0.6%), Silene conica (0.2%), and Vigna angularis (0.1%)[69]. At the other extreme, the length of MTPTs accounts for 10.5% of the Boea hygrometrica mitogenome[70]. The MTPTs in the M. figo mitogenome are notably abundant, with the longest fragment spanning 4,666 bp, and the majority of MTPTs ranging from 50 to 500 bp. These sizable MTPTs are presumed to have significant impacts on plant mitogenome evolution, thereby contributing to genetic diversity[17,71]. Additionally, it is frequently observed that these transferred fragments contain PCGs. The number of PCGs in MTPTs exhibits significant variation in plant mitogenomes, ranging from seven in Brassica to 22 in Nicotiana[72]. In the mitogenome of M. figo, nine PCGs (psbL, psbF, psbE, petL, petG, rps8, rpl14, rps7, and ndhB) are located in MTPTs. However, PCGs in MTPTs turned out to degenerate as a result of sequence alterations and the absence of RNA editing[73,74]. Consequently, PCGs in MTPTs may have limited functional significance in mitogenomes, potentially acting as non-essential sequences[72].
In this study, we reconstructed two phylogenetic trees based on 18 mitochondrial and 61 plastid PCGs from 15 species, respectively. Both trees exhibit remarkable consistency, supporting that Michelia is closely related to Magnolia, which is consistent with previous studies[26,75]. Additionally, the topological structure of the two phylogenetic trees is also highly consistent with the Angiosperm Phylogeny Group IV (APG IV) system[76]. However, due to the scarcity of mitogenomes in Michelia, we are unable to expand our discussion on the phylogenetic relationships in this genus.
-
In this study, we have successfully sequenced and assembled the mitogenome of M. figo for the first time. The circular mitogenome of M. figo is 773,377 bp in length, encoding 41 PCGs, 21 tRNA genes and three rRNA genes. A total of 22 cis- and three trans-splicing introns were identified in the M. figo mitogenome. The M. figo mitogenome contains abundant repeats, with 1,514 pairs of dispersed repeats, 39 tandem repeats, and 262 SSRs. Additionally, we identified 81 fragments (42,791 bp) that were transferred from the plastome to the mitogenome of M. figo, constituting 5.53% of the whole mitogenome. The M. figo mitogenome is characterized by the abundance of repeats and MTPTs, contributing to the complexity and diversity of mitogenome size and structure. Furthermore, comparative analyses of four Magnoliaceae mitogenomes reveal significant genetic diversity of this genus. Two phylogenetic trees, constructed independently based on the mitogenomes and plastomes of 15 species, depicted the phylogenetic relationship of M. figo. This study presents the first comprehensive genomic and phylogenetic analyses of the M. figo mitogenome, providing crucial theoretical insights and data support for the development of genetic markers, classification, and resource utilization within the Michelia genus.
The work is supported by the Natural Science Foundation of Jiangsu Province (BK20220414) and Jiangsu Students' Innovation and Entrepreneurship Training Program (202210298119Y). We thank Assoc. Prof. Kewang Xu from Nanjing Forestry University for collecting the sample of M. figo.
-
This study has rigorously adhered to relevant institutional, national, and international guidelines and regulations. Moreover, the study did not involve the use of any endangered or protected species. The M. figo plant leaves utilized in this experiment were collected at Nanjing Forestry University.
-
The authors confirm contribution to the paper as follows: study conception and design: Bi C, Yang Y; analysis and interpretation of results: Wang S, Sun N, Qiu J, Han F; materials collection and experiments conduct: Bi C, Qiu J; draft manuscript preparation:Wang S; manuscript revision presentation of comments: Bi C, Wang Z, Yang Y. All authors reviewed the results and approved the final version of the manuscript.
-
The mitochondrial genome supporting this study is available at GenBank with accession number: NC_082234.1. The HiFi sequencing data of M. figo is deposited in the SRA repository under SRR28267342.
-
The authors declare that they have no conflict of interest.
-
# Authors contributed equally: Suyan Wang, Jing Qiu
- Supplementary Table S1 The relative synonymous codon usage of amino acids in the mitogenome of Michelia figo, Magnolia biondii, Magnolia officinalis, and Liriodendron tulipifera.
- Supplementary Table S2 The frequency of codon usage in the mitogenome of Michelia figo, Magnolia biondii, Magnolia officinalis, and Liriodendron tulipifera.
- Supplementary Table S3 Dispersed repeat sequences identified in the Michelia figo mitogenome.
- Supplementary Table S4 Tandem repeat sequences identified in the Michelia figo mitogenome.
- Supplementary Table S5 The simple sequence repeats identified in the Michelia figo mitogenome.
- Supplementary Table S6 Dispersed repeat sequences identified in the Magnolia biondii mitogenome.
- Supplementary Table S7 Dispersed repeat sequences identified in the Magnolia officinalis mitogenome.
- Supplementary Table S8 Tandem repeat sequences identified in the Magnolia biondii mitogenome.
- Supplementary Table S9 Tandem repeat sequences identified in the Magnolia officinalis mitogenome.
- Supplementary Table S10 The simple sequence repeats identified in the Magnolia biondii mitogenome.
- Supplementary Table S11 The simple sequence repeats identified in the Liriodendron tulipifera mitogenome.
- Supplementary Table S12 The homologous DNA fragment between mitogenome and cpgenome of Michelia figo.
- Supplementary Table S13 The collinear blocks between mitogenomes of Michelia figo and Magnolia officinalis.
- Supplementary Table S14 The collinear blocks between mitogenomes of Michelia figo and Magnolia biondii.
- Supplementary Table S15 The collinear blocks between mitogenomes of Magnolia biondii and Liriodendron tulipifera.
- Supplementary Table S16 Genes used for phylogenetic analysis.
- Supplementary Table S17 The genomic information of the species used in this study.
- Supplementary Fig. S1 The map of genes containing introns. This diagram illustrates the distribution of cis- and trans-introns.
- Supplementary Fig. S2 Heat maps of PCG and intron contents among 15 mitogenomes (a) Comparison of PCG contents among 15 mitogenomes. The gene numbers are shown on the top right. (b) Comparison of intron contents among 15 mitogenomes. The intron numbers are shown on the top right.
- Copyright: © 2025 by the author(s). Published by Maximum Academic Press, Fayetteville, GA. This article is an open access article distributed under Creative Commons Attribution License (CC BY 4.0), visit https://creativecommons.org/licenses/by/4.0/.
-
About this article
Cite this article
Wang S, Qiu J, Sun N, Han F, Wang Z, et al. 2025. Characterization and comparative analysis of the first mitochondrial genome of Michelia (Magnoliaceae). Genomics Communications 2: e001 doi: 10.48130/gcomm-0025-0001 

Figure 1.
Structural and functional features of the M. figo mitogenome. (a) The raw assembly graph of the M. figo mitogenome. (b) The disentangled graph of the M. figo mitogenome. (c) Circular mitogenome map of M. figo. Genes depicted outside the outer circle undergo clockwise transcription, while those positioned within the inner circle undergo counter-clockwise transcription. The legends of different colors positioned in the bottom left corner serve to distinguish genes based on their specific functionalities.