


-
Drought poses a significant challenge to global agricultural production, exacerbated by adverse climate changes, which greatly disrupt normal crop growth and stable yield increase[1]. As global climate change intensifies, water scarcity becomes increasingly prominent, with agriculture's development inseparable from water resources and facing severe challenges to sustainability. Approximately one-third of the world's arable land has long been affected by drought or semi-drought conditions, turning drought into a global problem and a major agricultural disaster[2]. The production losses caused by drought surpass those of other environmental factors combined, threatening a quarter of the world's population, particularly in developing countries across Africa and Asia[3]. Hence, the exploration, innovation, and collaborative utilization of drought-resistant or -tolerant genes and germplasm hold significant practical importance in breeding and promoting new drought-adaptive crop varieties[4,5].
Plants in dry environments are subjected to random droughts, and it is generally impossible for them to escape from such adverse conditions. Thus, plants in such environments have evolved the ability to endure water stress through physiological or morphological adaptations, and avoidance of cell injury[6]. For instance, drought adaptive plants can maintain high water potential by reducing transpiration and enhancing water uptake[7]. They can also facilitate the rapid development and early flowering to complete life cycles before severe drought[6]. Adaptive strategies also involve reducing leaf area, producing trichomes to lower leaf temperature and water loss, and modifying root systems for better water uptake. Additional mechanisms include osmotic adjustment, antioxidant defenses, and solute accumulation[8,9]. Closely associated with these physiological alterations are the biochemical and molecular genetics underlying plants' resistance or adaptation to drought stress. Phytohormones such as auxin, ethylene, and abscisic acid (ABA) play vital roles in drought tolerance and influence physiological processes, with ABA being a prime mediator[10]. Under drought conditions, ABA-mediated stomatal conductance prevents transpiration water loss[11]. ABA receptors, such as PYRABACTIN RESISTANCE (PYR) and the regulatory component of ABA receptor (RCAR), enhance ABA responses and confer drought tolerance in Arabidopsis[12]. Additionally, several transcription factor families, including NAC, bZIP, and DREB, have been well characterized to regulate drought stress-activated signal transduction pathways including reactive oxygen species (ROS), calcium signaling, and mitogen-activated protein kinase (MAPK) cascades[13]. Other aspects of molecular genetics involve the biosynthesis of osmoprotectant proteins, such as proline and glycine betaine, as well as late embryogenesis abundant (LEA) proteins, which are also reported to be associated with plant drought adaptive abilities[14−20]. Recently, cell wall remodeling, particularly the plasticity involving increased rhamnogalacturonan I branching and cell wall thickening reinforced by hemicellulose and lignin deposition in the secondary wall, has also been identified as playing a central role in plants' responses to drought stress[21].
To enhance drought tolerance of crops under global climate change, wild species serve as valuable genetic resources for discovering novel physiological mechanisms and underlying genetic components, as well as new mutations in known drought-associated gene homologs[22,23]. For instance, Seriphidium transiliense, an Asteraceae plant adapted to the desert steppe, was recently reported to be able to alter its morphology, specifically reducing the plant height to reduce water loss, and have increased antioxidant activities in both roots and leaves[22]. Many receptor protein kinase encoding genes involved in the stress signaling responses such as the ABA signaling pathway, MAPK signaling pathway, and Ca2+ signal transduction, were significantly upregulated in Seriphidium transiliense under drought stresses. Wild lentil genotypes (such as Lens odemensis and Lens tomentosus) and wild chickpeas were also reported to be capable of increasing their capacity to avoid or tolerate drought stress by reducing transpiration rate or deepening root systems[24,25]. Meanwhile, various phenotypic trade-offs have been observed, such as delayed flowering, reduced plant height, and growth rate[24]. Other than deep rooting and increased lateral roots in grain legumes for drought tolerance, wild Arachis duranensis maintains relatively high levels of transpiration and photosynthesis rate under dehydration treatment[26]. Even though physical differences exist among these wild species, the drought tolerance mechanisms remain similar: for example, enhanced water uptake, and reduced water loss by growing smaller leaves to maintain water balance under water deficits[27]. However, in the Vigna genus, a legume family that also includes some well-known cultivated species, there is no wild species that was reported to have consolidated drought tolerant ability that can be further investigated for breeding purposes.
Beach cowpea (Vigna marina) has recently garnered attention due to its notable salt and drought tolerance capabilities[28]. Originating from Africa, beach cowpea is a coastal halophyte widely distributed in sandy coasts, dunes, and beach ridges across tropical regions worldwide[29]. Beach cowpea shares floral structures akin to cultivated legumes such as adzuki bean, cowpea, and mung bean[30]. Its seeds maintain germination capability even after soaking in seawater[31]. Its roots establish symbiotic relationships with rhizobia, even in highly adverse abiotic environments, which can enrich soil fertility through nitrogen fixation and ameliorate saline-alkali soils[32]. Beach cowpea serves as fodder, food and green manure, with intact pods and large seeds suggesting human attempts at domestication. Thus, this wild legume species holds promise as a potential genomic source, aiding in the breeding of other crop species with enhanced resilience to abiotic stresses[33], particularly important in the context of global climate change.
However, there are currently no detailed reports on the drought tolerance mechanisms of beach cowpea. The objectives of this study were to: (1) elucidate the physiological mechanisms that make beach cowpea more drought-tolerant compared to cowpea; and (2) explore the key drought-tolerant genes and potential molecular mechanisms that play crucial roles in beach cowpea's drought tolerance.
-
The plant materials utilized in this study include beach cowpea (Vigna marina, Vm) and cowpea (Vigna unguiculata, Vu) sourced from the Tropical Crops Genetic Resources Institute, Chinese Academy of Tropical Agricultural Sciences (Haikou, China). During preliminary experiments, all the collected Vm accessions exhibited drought tolerance, presenting a challenge in discerning between drought-sensitive and tolerant Vm materials. Therefore, for this experiment, we selected cowpea, which belongs to the same genus as Vm and shares the closest genetic relationship, as the control for the investigations.
Treatment and experimental design
-
Seeds of Vm and Vu underwent sterilization, germination soaking, and were then potted for seedling cultivation. After one month, the seedlings were transferred to a 1/2 Hoagland nutrient solution for hydroponic cultivation. Seedlings showing consistent growth, devoid of diseases and pests, and reaching a height of 15−20 cm were selected for drought treatment. Drought treatment was applied to the seedlings using a randomized complete block design with varying concentrations of PEG6000 (0%, 3%, 6%, 9%). Each treatment comprised three biological replicates, and root and leaf samples were collected on days 3, 6, 9, and 12 post-treatment for subsequent experiments.
Leaf withering rate
-
Wilted leaves were eliminated before the onset of drought treatment. The percentage of leaves displaying signs of withering relative to the total number of leaves was documented on days 3, 6, 9, and 12 during the drought treatment period.
Leaf relative water content
-
The leaf relative water content was assessed using the saturated weighing method outlined by Prasad et al.[34]. For each treatment, three plants were selected as replicates, and from each plant, three leaves were randomly chosen for measurement. The selected leaves should be fully expanded or located at the canopy top, unobstructed, and receiving good lighting conditions, serving as representative leaves for the plant. The same sampling method was applied for measuring other physiological characteristics of the leaves.
Approximately 0.5 g of freshly cut leaves were promptly weighed to determine the fresh weight (W1). These leaves were then submerged in water for 24 h, and after surface water removal, the saturated weight (W2) was measured. Following this, the leaves were dried in an oven at 105 °C for 1 h, and the dry weight (W3) was recorded. The calculation formula is as follows:
$\rm RWC\;{\text{% }} = \dfrac{{W1 - W3}}{{W2 - W3}} \times 100{\text{%}} $ Chlorophyll content
-
Chlorophyll content was determined following the method described by Liu et al.[35]. Freshly cut leaf samples weighing 0.5 g were placed in 15 mL centrifuge tubes. Subsequently, 10 mL of a chlorophyll extraction mixture (acetone : ethanol : water = 4.5:4.5:1) was added, and the tubes were kept in the dark for 24 h. After the leaves turned white, the absorbance of the extracts was measured at two wavelengths, 663 and 645 nm, to calculate the total chlorophyll content (Ctotal) using the following formula:
$ \mathrm{C_{total}\;(mg\cdot g^{-1})=(20.2A_{645}+8.02A_{663})\times V/(W\times 100)} $ Where W represents the sample's fresh weight (g), and V denotes the total volume of the sample extract (mL).
Photosynthetic characteristics
-
A portable photosynthesis system (LI-6400XT, Li-Cor Inc., USA) was employed to assess various photosynthetic gas exchange parameters, including net photosynthetic rate (Pn, μmol CO2 m−2·s−1), stomatal conductance (Gs, mmol H2O m−2·s−1), transpiration rate (E, mmol H2O m−2·s−1), and intercellular CO2 concentration (Ci, μmol CO2 mol−1). The photosynthetic parameters were standardized based on the environmental conditions during measurement, with a CO2 concentration of 400 μmol·mol−1, flow rate of 400 μmol·s−1, and PPFD (photosynthetic photon flux density) of 1,200 μmol (photons) m−2·s−1.
Chlorophyll fluorescence parameters
-
Following a 30-min dark pre-treatment, plant leaves were measured for the maximum quantum efficiency of PS II (Fv/Fm); quantum yield of photosystem II (ϕPSII); is the yield of regulated energy dissipation of PSII (Y(NPQ)); and the yield of non-regulated energy dissipation of PSII (Y(NO)) using a pulse amplitude modulation fluorometer (PAM-2500, Walz, Effeltrich, Germany).
Leaf relative electrical conductivity
-
Leaf cell membrane permeability was assessed using the electrical conductivity method outlined by Li et al.[36]. The experimental materials (0.5 g) were cut into pieces and promptly placed in 50 mL centrifuge tubes. To each tube, 20 mL of distilled water was added. The tubes containing the materials were placed in an oscillator, and after 24 h, the electrical conductivity (EC1) was measured. Subsequently, the tubes were immersed in a 100 °C water bath for 20 min. Following cooling, the electrical conductivity (EC2) was measured. The relative conductivity was calculated using the following formula:
$ {\rm{REC}}\;\left( {\text{%}} \right) = \dfrac{\rm{EC1}}{\rm{EC2}} \times 100{\text{%}} $ Leaf malondialdehyde (MDA)
-
Root MDA content was determined following the method outlined by Davey et al.[37]. The reaction solution was prepared by dissolving 20 g of trichloroacetic acid (TCA) and 0.5 g of thiobarbituric acid (TBA) in 100 mL of distilled water. A volume of 1.2 mL of the extract was added to 2.4 mL of the reaction solution. The mixture was then incubated in a water bath at 100 °C for 30 min and immediately cooled to room temperature on ice. After centrifugation at 8,000× g for 10 min, the supernatant was collected, and absorbance values at wavelengths 450, 532, and 600 nm were measured.
$ \rm{MDA\;concentration\;({{\text{µ}}}mol\cdot L}^{ {-1}} )={6.45\times (A_{532}-A_{600})-0.56\times A_{450}} $ $ \begin{aligned} &\rm{MDA\;content\;({{\text{µ}}}mol\cdot g}^{ \mathrm{-1}} {FW})=\rm MDA\;concentration\;({{\text{µ}}}mol\cdot L^{ {-1}} )\;\times\\&\quad\rm Dilution\;factor\times Total\;volume\;of\;extract/Sample\;fresh\;weight \end{aligned}$ Root morphological indices
-
Root images from each treatment were scanned using an EPSON root scanner (Japan) on days 3, 6, 9, and 12 of drought stress. The WinRHIZO root analysis software (Regent, Canada) was employed to calculate the total root length, total root surface area, and total root volume.
Root viability
-
Root viability was assessed using the TTC method following the protocol outlined by Comas et al.[38]. Approximately 0.5 g of roots from both Vm and Vu were cut into segments. Then, 0.5 mL of 0.4% TTC solution and 0.07 mol·L−1 phosphate buffer solution were sequentially added, ensuring complete immersion of the roots. The root segments with the reaction solution were placed in a dark incubator at a constant temperature of 37 °C for 2 h. After the visible coloration of the root tips, 5 mL of 1 mol·L−1 sulfuric acid solution was added to halt the reaction. The root tip segments were removed, surface-dried with filter paper, and immersed in 10 mL of methanol. The solution was kept in a 37 °C constant temperature incubator until the root tips turned white. Colorimetric determination of the extracted solution was performed using a spectrophotometer at a wavelength of 485 nm, with methanol as the reference (zero point), and the optical density (OD) values were recorded.
Root osmotic substances
-
Soluble sugar content was determined using the phenol method[39], soluble protein content was determined using the Coomassie Brilliant Blue G-250 staining method[40], and free proline content was determined using the ninhydrin method[41].
Root antioxidant enzyme activity
-
The activities of SOD, POD, and CAT were determined following the protocols described by Wang et al.[42]. A 0.2 g root sample was finely ground with liquid nitrogen in a pre-chilled mortar. Subsequently, 4 mL of 50 mM·L−1 phosphate buffer solution (PBS, pH 7.8) was added, and the mixture was transferred to a capped centrifuge tube (10 mL). After centrifugation at 10,000× g at 4 °C for 20 min, the supernatant was collected and partitioned for subsequent analysis. SOD activity was determined by monitoring the inhibition of the photochemical reduction of nitro blue tetrazolium (NBT). The reaction mixture (3.0 mL) contained 50.0 mM·L−1 potassium phosphate buffer (pH 7.8), 6.5 mM·L−1 methionine, 50.0 μM NBT, 10.0 μM·L−1 EDTA, 20.0 μM·L−1 riboflavin, and 100.0 μL of enzyme extract. A reaction mixture lacking enzyme served as the control. All mixtures were stirred in darkness in small glass test tubes and then irradiated for 10 min by fluorescent lamps (13,000 lux). After the reaction mixture turned from yellow to blue-black, its absorbance was measured at 560 nm. The mixture lacking enzyme and not irradiated was used to zero the absorbance at 560 nm. In POD activity assay, 50 μL of the extract was added to 1.85 mL of acetic acid buffer (0.1 mol·L−1, pH 5.0), 1 mL of 0.25% guaiacol solution, and 0.75% H2O2. Mix well and record the absorbance at 460 nm every 10 s for 3 min. In CAT activity assay, 100 μL of the extract was added it sequentially to 1.9 mL of phosphate buffer (50 mM·L−1, pH 7.0) and 1 mL of H2O2 (45 mM·L−1). After blanking, mix well and record the absorbance at 240 nm every 10 s for 90 s.
RNA isolation and transcriptome analysis of root genes in cowpea and beach cowpea
-
In-house RNA sequencing data was generated for beach cowpea and cowpea roots treated with 6% PEG6000 for 0, 1, and 6 d. Total RNA was extracted using TRIzol reagent (Thermo Fisher Scientific) according to the manufacturer's instructions. Residual DNA was eliminated by treating the samples with UltraPure DNase I (Thermo Fisher Scientific). The integrity and quantity of total RNA were determined by electrophoresis in a 1% agarose gel and NanoDrop ND-1000 spectrophotometer (NanoDrop Technologies, Wilmington, DE). The RNA samples were then shipped on dry ice to Novogene Co. Ltd where they underwent additional testing, according to their quality control pipeline for RNA sequencing before being confirmed suitable to be run on Illumina Sequencing platform for PE150 strand-specific Poly-A enriched mRNA sequencing. Quality checks of the raw fastq files were conducted using FastQC v.0.11.8[43] followed by removing adaptor sequences and low-quality reads from raw reads using Trimmomatic v.0.39[44]. The reads were aligned to the Vigna unguiculata ZN016 v1.2 reference genome (
https://phytozome-next.jgi.doe.gov/cowpeapan/info/VunguiculataZN016_v1_2 ) and our de novo assembled beach cowpea genome (unpublished) using STAR v.2.7[45] and the read quantification was performed using StringTie v2.2[46]. Differential expression analysis was further performed using the R package DESeq2 v.1.28.1. The StringTie output was loaded into DESeq2 with DESeqDataSetFromTximport function of the tximport package, creating offset and correcting for changes to the average transcript length across samples[47]. The low-count genes were prefiltered by keeping only those genes that have at least five counts in total samples. Principal component analysis (PCA) was conducted to determine the relatedness of the biological replicates and differences in transcriptome of the samples. Pairwise contrasts were performed between control and drought treated root samples to identify differentially expressed genes (DEGs). To generate more accurate log2 foldchange estimates the lfcShrink (type = 'apeglm') function was used. The thresholds for differential expression were set at fold change 2 and p-adjusted value cut off 0.05[47,48]. Protein Gene Ontology (GO) annotation was conducted using InterProScan[49] and GO enrichment analysis was carried out with the R package clusterProfiler[50].Weighted Gene Coexpression Network Analysis
-
Weighted Gene Coexpression Network Analysis (WGCNA) was performed using the WGCNA-shinyApp tool (
https://github.com/ShawnWx2019/WGCNA-shinyApp ). The TPM expression matrix of all genes from Vm or Vu was utilized, and genes with expression values less than 1 in 90% of the samples were excluded. The 'median absolute deviation' method was applied to select the reserved genes[51]. For the scale-free network construction, the power and R² thresholds were 12 and 0.78 for VM, and 26 and 0.78 for Vu. The module size and cutting height parameters were set to 30 and 0.25 during module division. The correlation between module and trait data was computed, and significant module-trait pairs were selected for further analysis. -
In this study, drought tolerance in beach cowpea (Vigna marina, Vm) was evaluated using its closely related species, cowpea (Vigna unguiculata, Vu), as a control. Seedlings of both species were subjected to varying concentrations of PEG6000 (0%, 3%, 6%, 9%) for up to 12 d in a hydroponic system. As drought stress intensified, Vu seedlings exhibited yellowing by day 3 at 3% PEG6000 and complete wilting by day 12, while Vm seedlings showed only minor yellowing at the edges of lower leaves under similar conditions (Fig. 1a). It suggests that Vm demonstrates greater drought tolerance than Vu, despite Vu being considered moderately drought-tolerant[52].
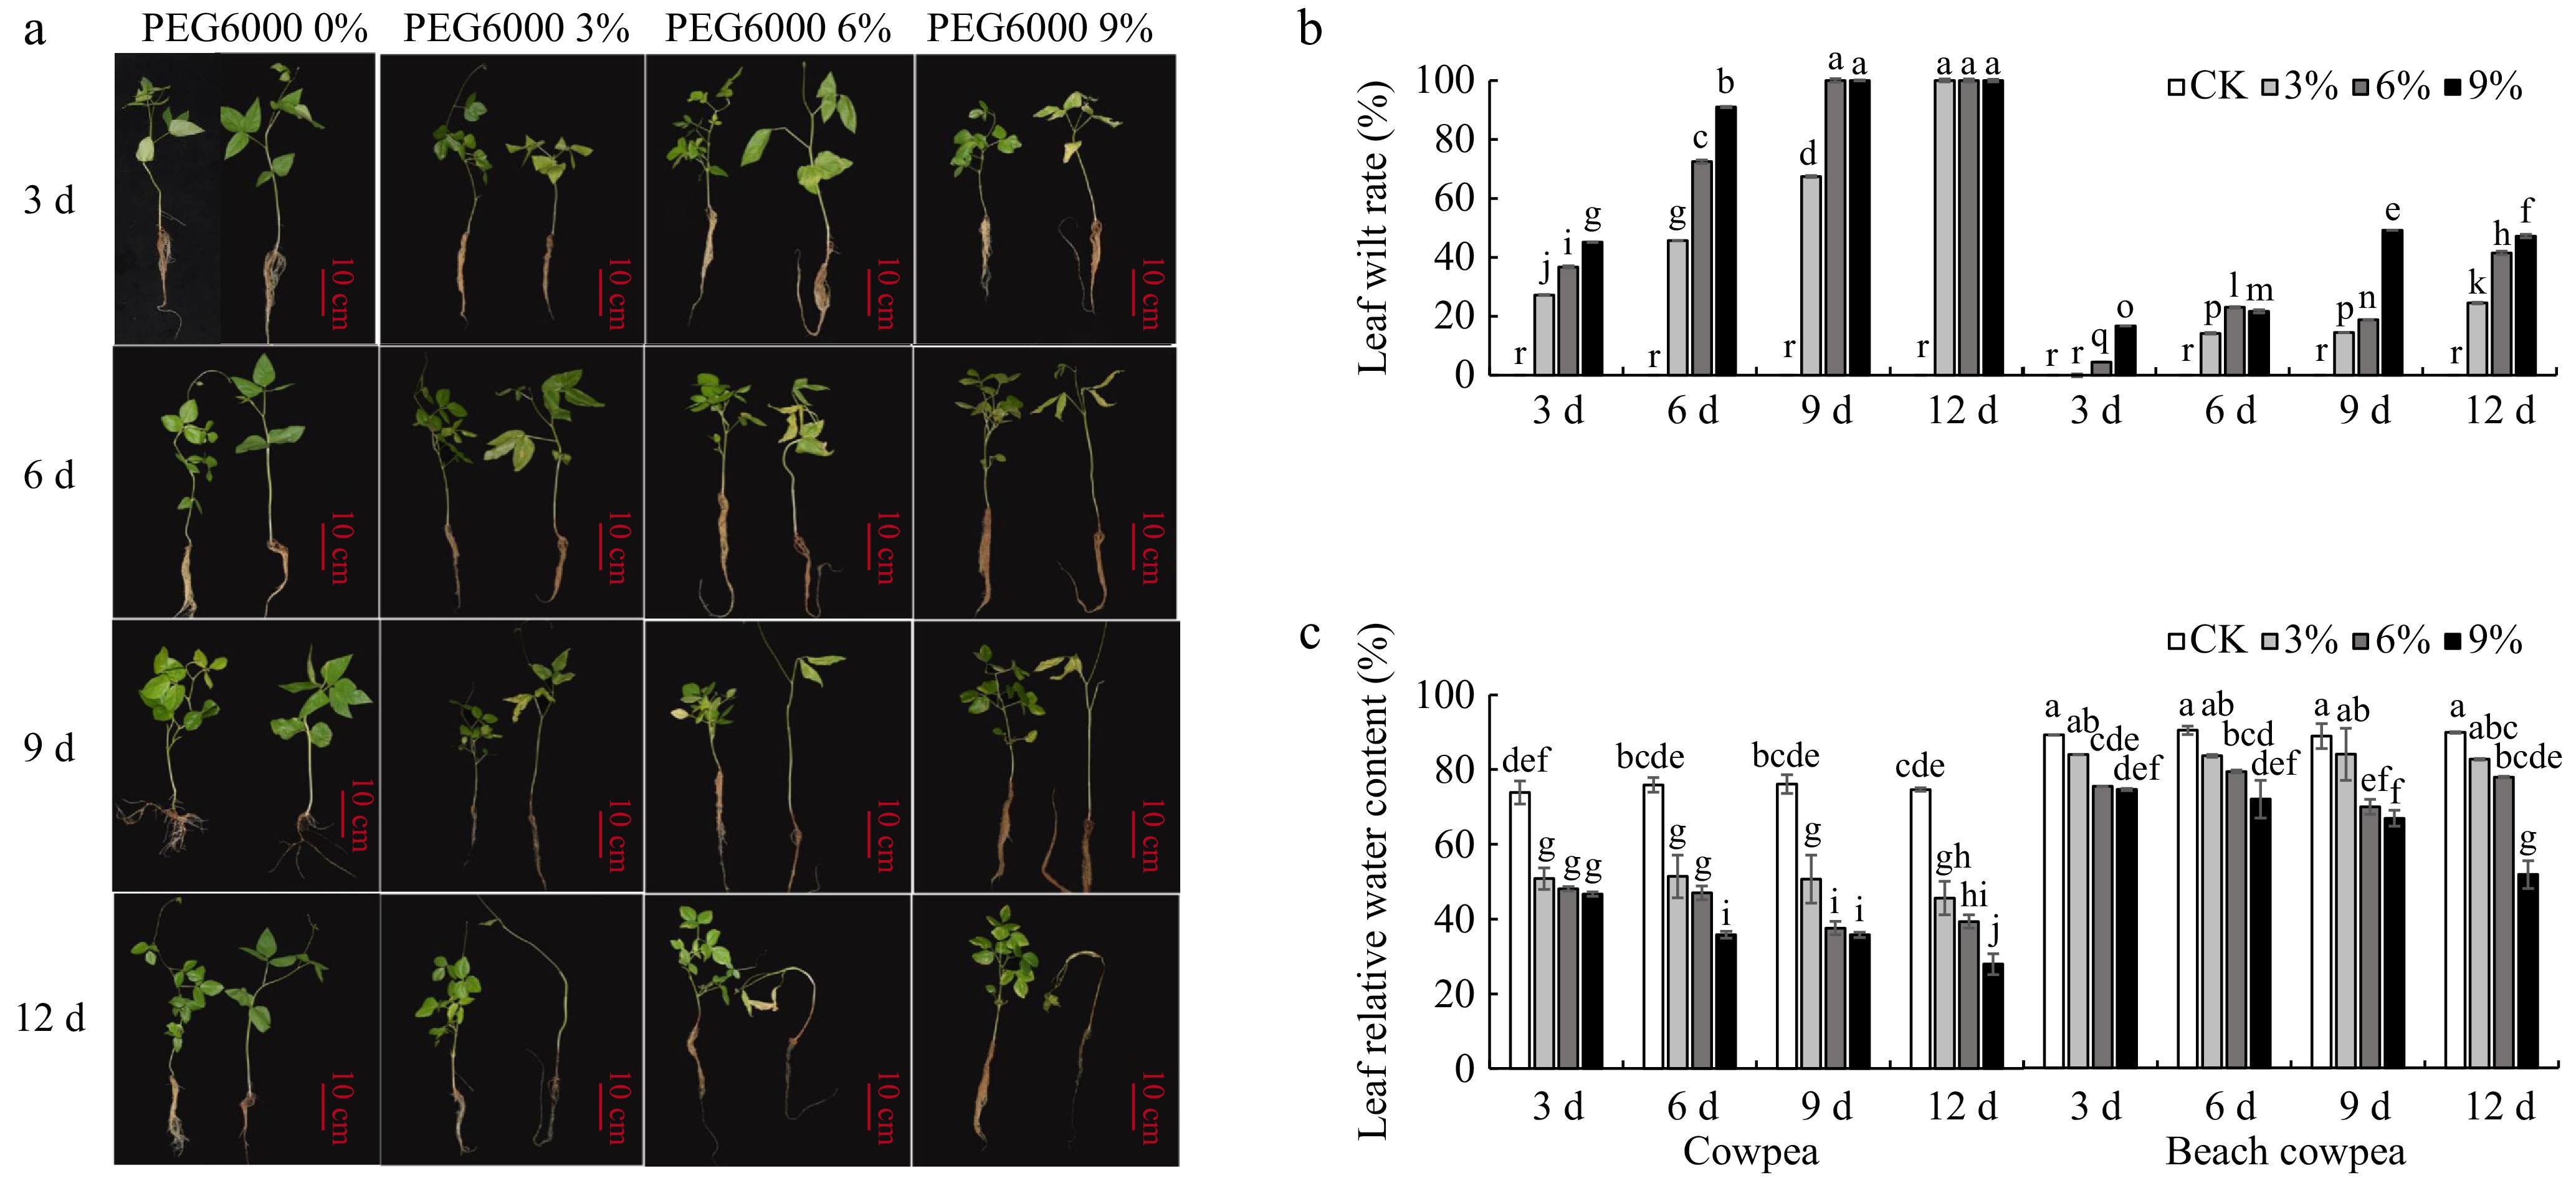
Figure 1.
(a) Effects of PEG6000-simulated drought stress on phenotypic morphology, (b) leaf relative water content, and (c) foliage senescence rate in cowpea and beach cowpea plants. Different concentrations of PEG6000 (0%, 3%, 6%, 9%) were applied for 3, 6, 9, and 12 d to assess the drought adaptation abilities of the two Vigna species. Each experiment included three biological replicates. Different letters indicate statistically significant differences (p ≤ 0.05).
The results of leaf wilting rates and relative water content (RWC) shown in Fig. 1b & c confirm that Vm has greater tolerance to water deficiency compared to Vu. As drought stress intensified, both varieties showed increasing leaf wilting rates (Fig. 1b). By day 9 of drought stress with 6% PEG6000, Vu reached a 100% wilting rate, whereas Vm had only an 18.9% wilting rate. By day 12, all Vu treatment groups had a 100% wilting rate, while Vm had significantly lower rates of 24.51%, 41.48%, and 47.19% under 3%, 6%, and 9% PEG6000 treatments, respectively. Similarly, as drought stress progressed, both Vu and Vm exhibited declining trends in leaf RWC (Fig. 1c). Interestingly, under control conditions, Vm's leaf RWC was 88%−90%, higher than Vu's leaf RWC of 73%−76%, highlighting Vm's superior water retention capacity even without stress. Although decreases in RWC were observed in all treatments compared to the control, these decreases were less pronounced in Vm than in Vu. By day 12 of treatment, significant reductions in Vu's leaf RWC were observed, with decreases of 38.9%, 47.3%, and 62.6% under PEG6000 concentrations of 3%, 6%, and 9%, respectively. In contrast, Vm showed much smaller reductions of 8.0%, 13.3%, and 42.4% under the same conditions. Moreover, Vm's leaf RWC in all treatments remained above 65% after 12 d, significantly higher than Vu's in all treatments.
Root activity other than morphology contributes to the drought tolerance in beach cowpea
-
To understand the physiological mechanisms underlying the drought tolerance in Vm, we investigated the root characteristics and activities of Vu and Vm under drought stress. Root morphology has been reported to be associated with plant adaptation to drought stress[53]. The present investigation revealed that the total root length, surface area, and volume of Vu roots showed no significant changes across all concentrations of PEG6000 treatments, except at day 12 (Fig. 2a−c, left panel). Conversely, Vm displayed a more variable response, but no remarkable differences were observed in all three morphology indicators across different treatment durations or PEG6000 concentrations (Fig. 2a−c, right panel).

Figure 2.
The enhanced drought tolerance observed in beach cowpea is associated with root activity rather than other root morphological disparities. Varying concentrations of PEG6000 (0%, 3%, 6%, 9%) were applied for 3, 6, 9, and 12 d to beach cowpea and cowpea plants to assess the effects of drought stress on their (a) root length, (b) root surface area, (c) root volume, and (d) root activities. Each experiment included three biological replicates. Different letters indicate statistically significant differences (p ≤ 0.05).
Root activity or viability, detected by the reduction of triphenyltetrazolium chloride (TTC) to red-colored insoluble triphenylformazan (TF)[54,55], in two Vigna species under drought stress, revealed intriguing trends. Initially, both Vm and Vu exhibited increased activity, followed by a decline as stress persisted. However, Vm displayed a much slower decline rate compared to Vu (Fig. 2d). Throughout the 12-d drought treatment period, Vm treated with PEG6000 at 3%, 6%, and 9% consistently maintained root activity levels 160.0%, 227.8%, and 192.2% higher than the control, respectively, demonstrating its superior ability to sustain root activity under water-limited conditions. In contrast, Vu's root activity treated with PEG6000 at 3%, 6%, and 9% decreased by 9.7%, 42.8%, and 38.6% compared to the control level at day 12, suggesting a comparatively weaker adaptive response to drought stress.
Extensive studies have demonstrated that increasing soluble sugars and other osmolytes can enhance plant tolerance to abiotic stresses such as drought, salinity, and cold[56]. Consequently, we further investigated the alterations in the content of osmotic regulatory compounds, including soluble sugar, soluble protein, and proline, in the roots of Vu and Vm under drought treatment.
The results showed that during continuous simulated drought stress, soluble sugar content in both Vu and Vm roots increased across all treatments compared to the control (Fig. 3a). In Vu roots, a significant increase in soluble sugar was observed only under 6% PEG6000. In contrast, Vm roots had significantly higher soluble sugar levels than the control under 3% PEG6000 for 6 and 12 d, 6% PEG6000 for 3, 6, and 9 d, and 9% PEG6000 for all periods. Soluble protein content in both Vm and Vu roots initially increased, peaking at 6 d of drought treatment, then declined as stress continued (Fig. 3b). After 12 d, Vu root soluble protein levels returned to control levels, while Vm remained significantly elevated. Root proline content also showed an initial increase followed by a decrease in both Vu and Vm roots (Fig. 3c). In Vu, there were no significant differences in proline content across all PEG treatments compared to the control. In contrast, Vm showed significantly higher proline content than the control in all PEG treatments at 6 d, and even after 12 d in the 9% PEG6000 treatment.
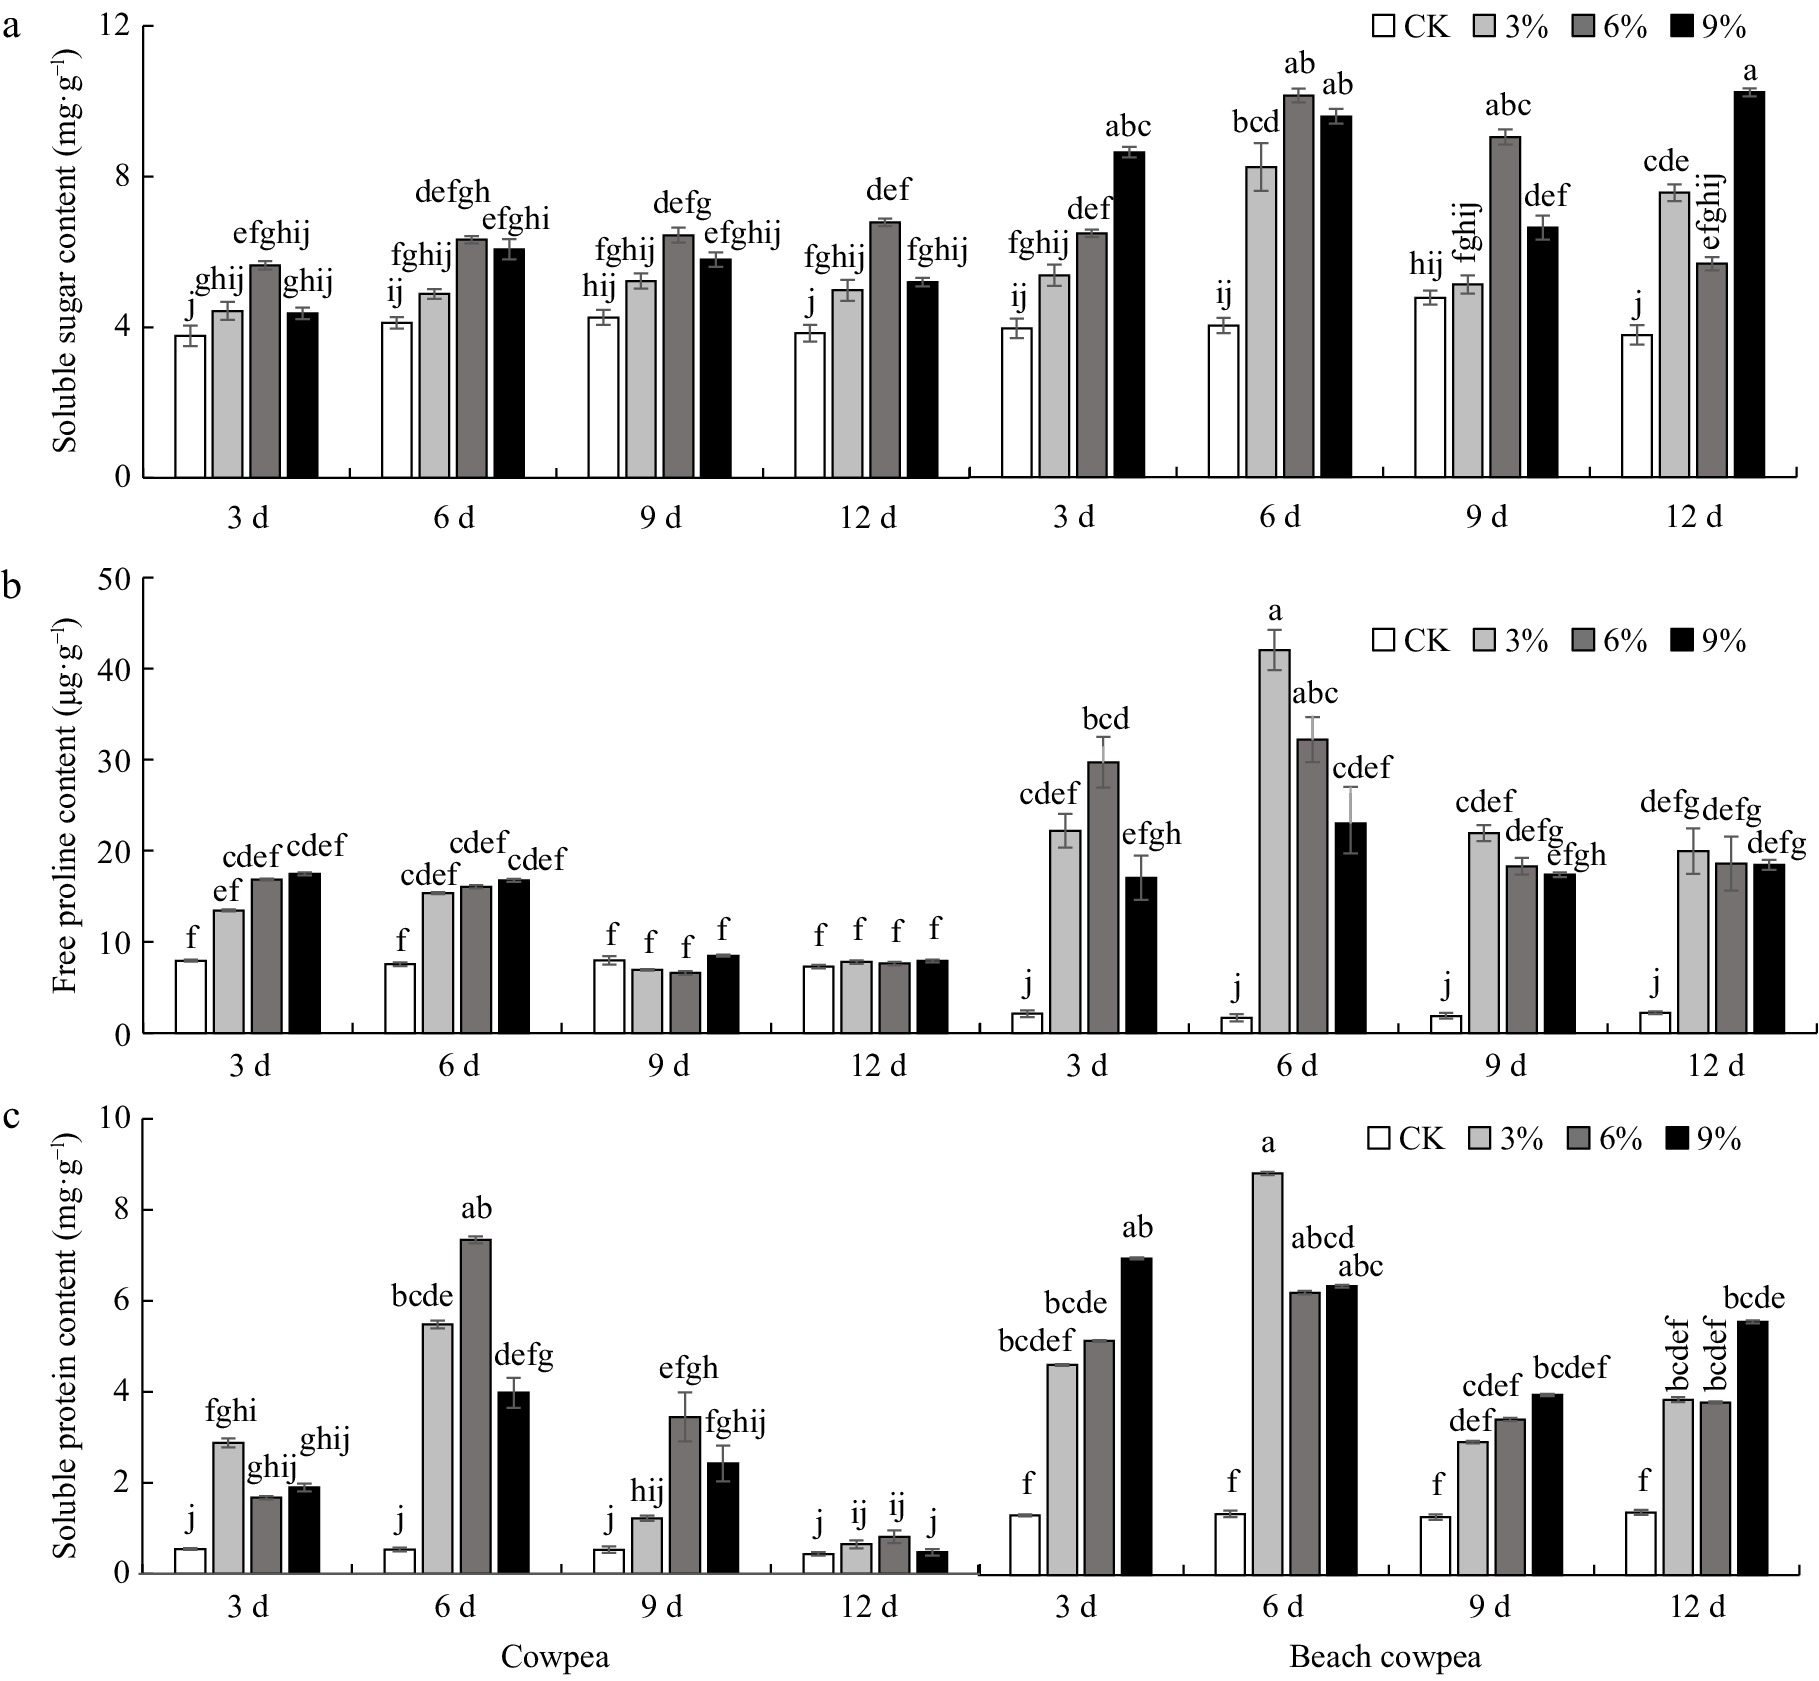
Figure 3.
Beach cowpea roots contain higher concentrations of osmolytes than cowpea roots under PEG6000-simulated drought stress. The concentrations of osmolytes, including (a) soluble sugars, (b) soluble proteins, and (c) proline, were evaluated in the roots of the two Vigna plants treated with 0%, 3%, 6%, and 9% PEG6000 for 3, 6, 9, and 12 d. Each experiment included three biological replicates. Different letters indicate statistically significant differences (p ≤ 0.05).
Drought-induced metabolic deregulation increases the production of reactive oxygen species (ROS), which subsequently impacts the cell's redox regulatory state, highlighting the significant role of the redox regulatory and antioxidant system in drought tolerance[57]. In this study, we assessed the activities of catalase (CAT), peroxidase (POD), and superoxide dismutase (SOD) in the root systems of Vm and Vu under PEG6000-simulated drought stress. Our findings reveal that root CAT activity increased in both Vm and Vu roots, peaking at 6 d of drought treatment, followed by a decline as stress persisted in all PEG6000-treated groups (Fig. 4a). At 12 d post-treatment, CAT activity in Vu roots treated with 3%, 6%, and 9% PEG6000 decreased to 45.7%, 85.7%, and 114.3% of the control group, respectively. In contrast, CAT activity in Vm roots treated with the same concentrations of PEG6000 showed 375.0%, 442.9%, and 285.8% of the control root activity, respectively, with a significant difference observed between the 6% PEG6000 and the control group. SOD activities in Vm and Vu roots generally increased under all drought stress conditions than the control from 3 to 9 d duration (Fig. 4b). At 12 d of drought, SOD activities in Vu roots treated with 3%, 6%, and 9% PEG6000 are 18.6%, 39.7%, and 72.5% lower than the control but without significant difference. By contrast, the SOD activities in Vm roots treated with 3%, 6%, and 9% PEG6000 remain 73.0%, 31.6%, and 13.2% higher than the control. The POD activities increased in Vu roots, peaking at 6 d of drought treatment, followed by a decline as stress persisted in all PEG6000-treated groups (Fig. 4c). In contrast, the POD activity increased in Vm roots treated with 3% PEG6000, reaching its peak at 6 d, and with 6% and 9% PEG6000, the root POD activities peaked at 9 d. The POD activities of Vm roots remained higher than those in the control group until 12 d. Moreover, Vm roots exhibited significantly higher POD activities compared to Vu roots in all concentrated PEG6000 treatments for 9 and 12 d.
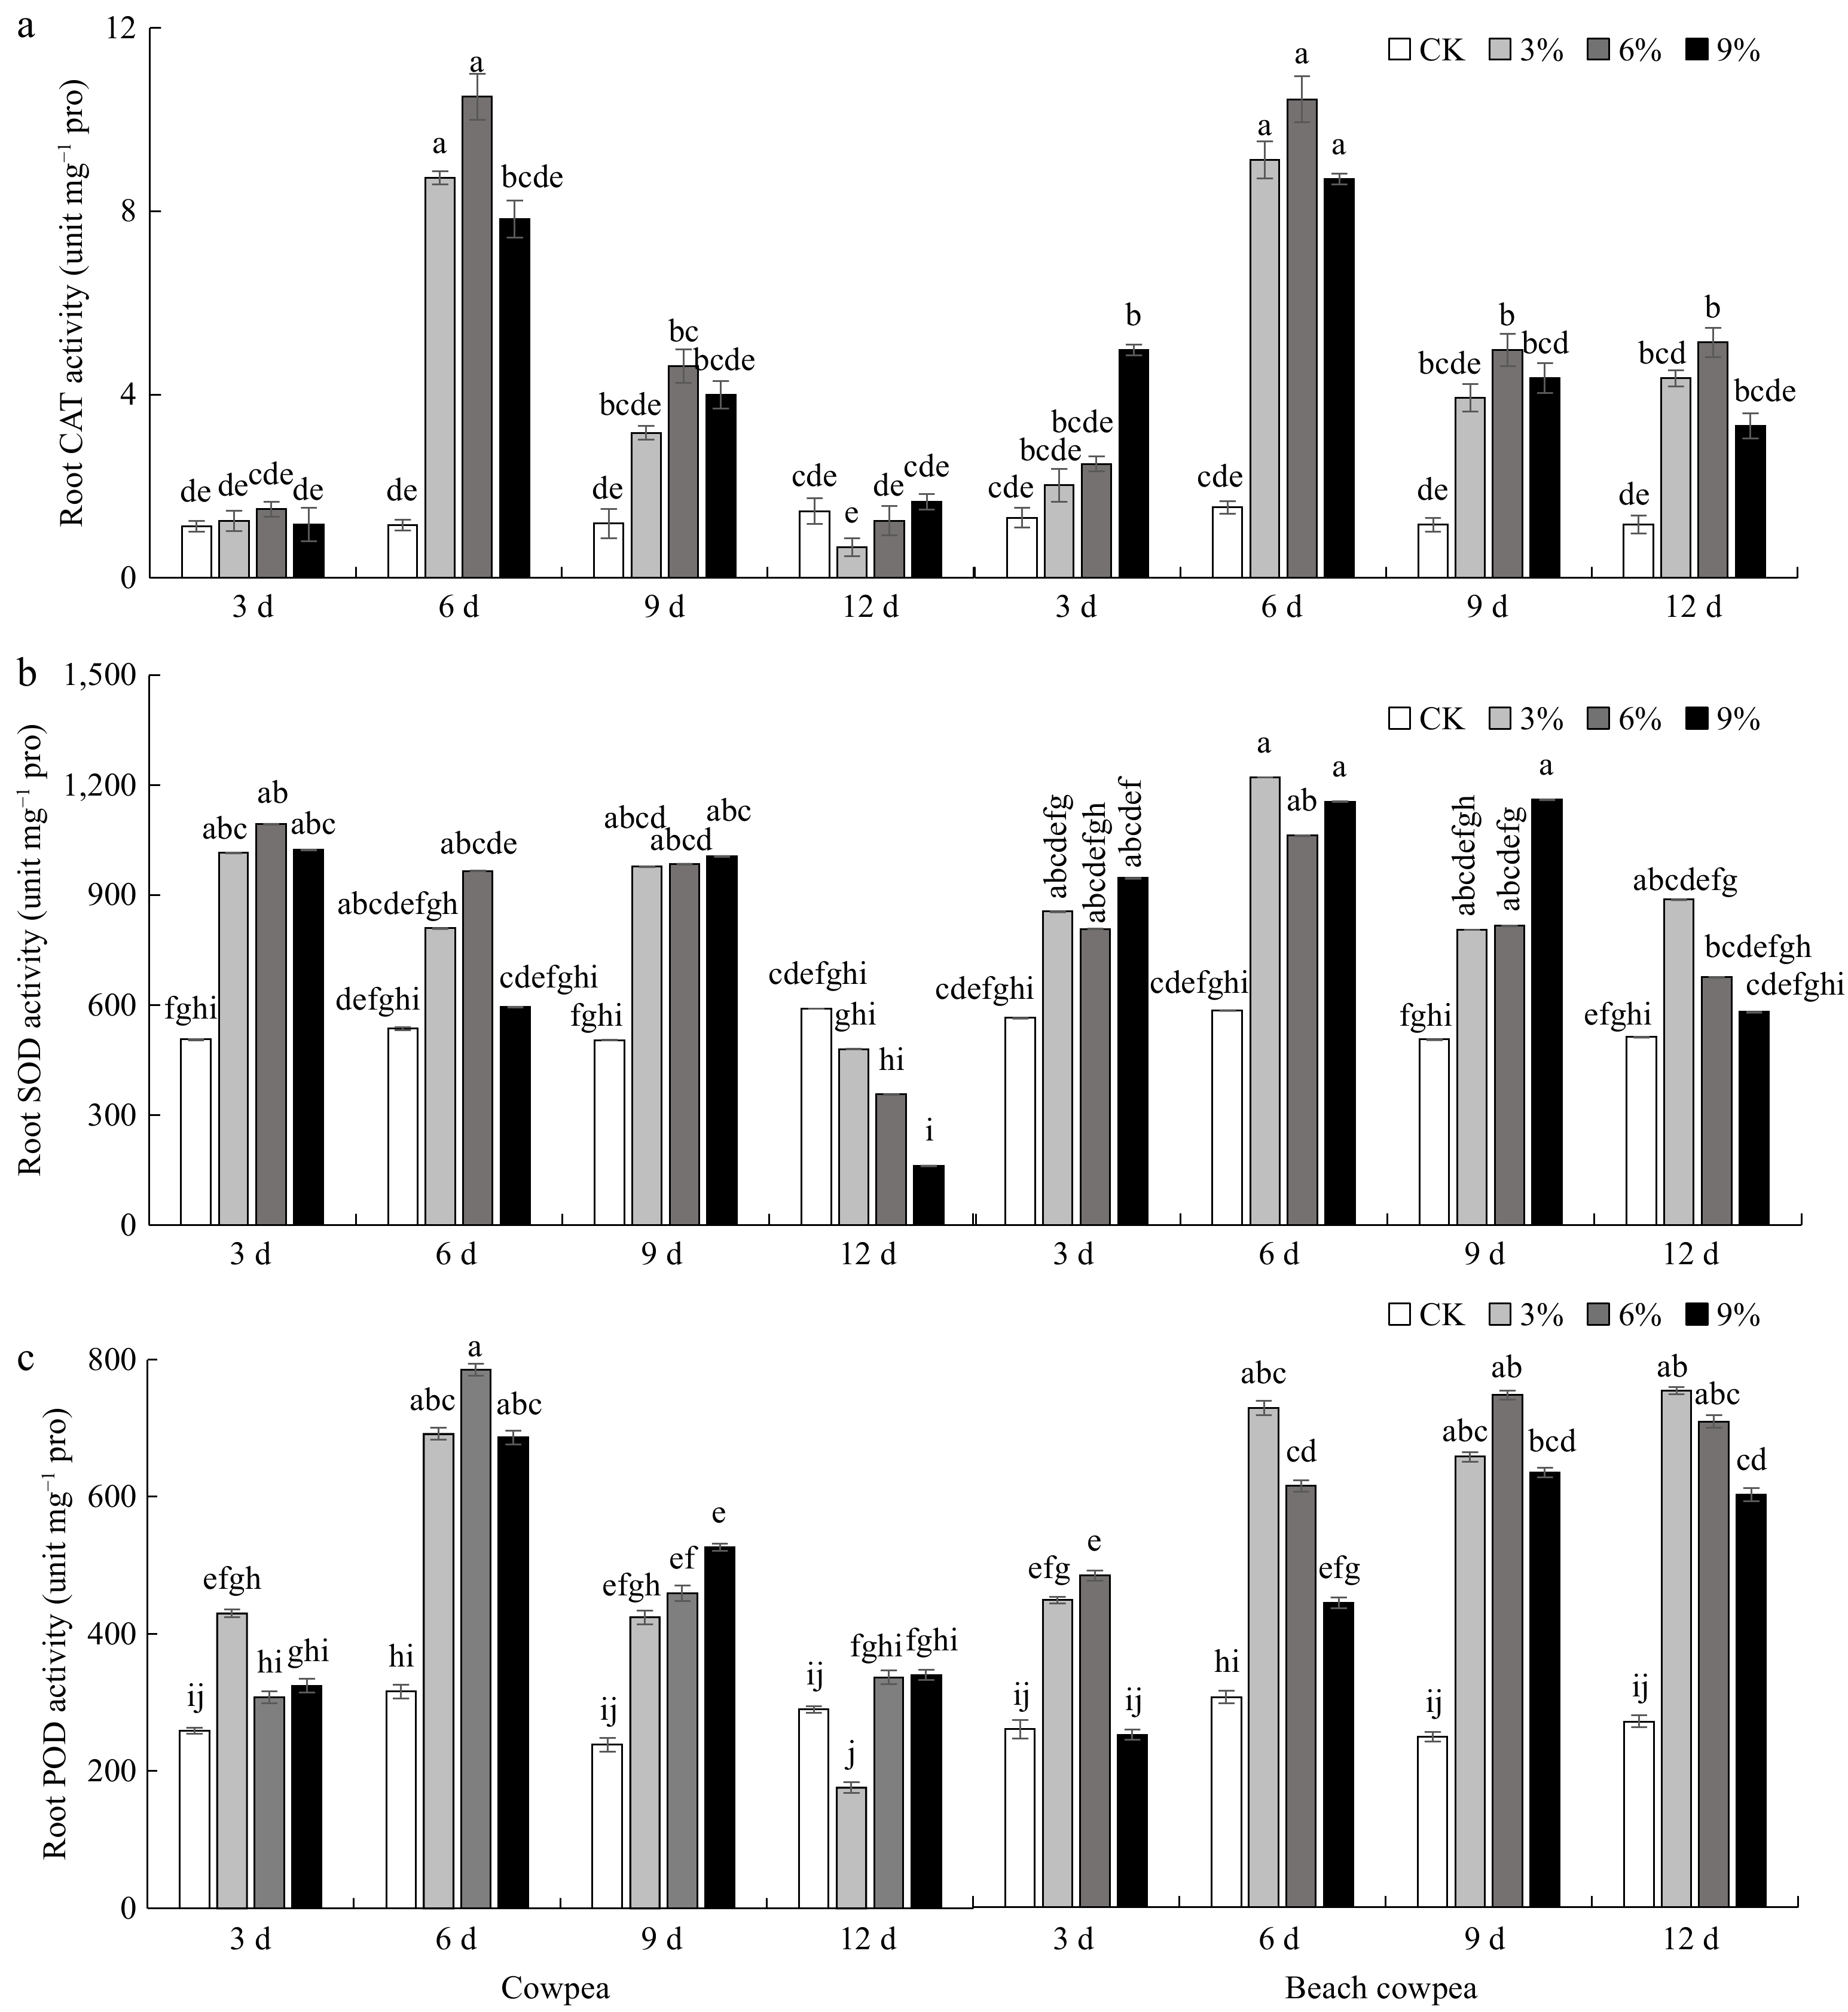
Figure 4.
Beach cowpea roots contain higher activities of antioxidant enzymes than cowpea roots under PEG6000-simulated drought stress. The activities of (a) catalase (CAT), (b) superoxide dismutase (SOD), and (c) peroxidase (POD), were determined in the roots of the two Vigna plants treated with 0%, 3%, 6%, and 9% PEG6000 for 3, 6, 9, and 12 d. Each experiment included three biological replicates. Different letters indicate statistically significant differences (p ≤ 0.05).
Collectively, the assessment of root systems in Vm and Vu, two closely related legume species, suggests that Vm does not demonstrate superior adaptive root morphology, including root length, surface area, and volume, compared to Vu. Despite similar morphology, Vm exhibits significantly higher root activity, greater concentrations of osmolytes, and increased antioxidant enzyme activities compared to Vu under PEG-induced drought stress, particularly with prolonged severe deficiency (PEG6000 9% for 12 d). This strongly suggests that root activity, rather than morphology, plays a primary role in the observed higher drought tolerance in beach cowpea compared to cowpea.
Leaf of beach cowpea has evolved physiological mechanisms to adapt to drought stressed environments
-
Besides investigating the root systems, we also examined whether the leaf system of cowpea possesses physiological adaptation mechanisms contributing to drought tolerance. This was achieved by conducting comparative phenotyping of chlorophyll content, photosynthesis, chlorophyll fluorescence, Malondialdehyde (MDA) levels, and relative electrical conductivity (REC) in Vm and Vu leaves.
The reduction in chlorophyll content was reported to be associated with the duration and intensity of drought stress[58,59]. In this study, the total chlorophyll content in Vu and Vm leaves exhibited a decreasing trend as drought stress persisted and its severity intensified (Fig. 5a). Interestingly, in the presence of a certain concentrations of PEG6000 treatment, varying durations did not significantly alter the total chlorophyll content in Vm leaves, whereas a significant difference was observed in the total chlorophyll content of Vu leaves treated for 3 days compared to those treated for 12 days. By the 12th day, the total chlorophyll content in Vu leaves treated with 3%, 6%, and 9% PEG6000 had decreased by 46.3%, 51.0%, and 60.2% respectively compared to the control, whereas in Vm leaves treated with 3%, 6%, and 9% PEG6000, the reductions were only 19.5%, 19.5%, and 13.0% respectively compared to the control. Further analysis indicated that both Chlorophyll a (Chl a) (Supplementary Fig. S1a) and Chlorophyll b (Chl b) (Supplementary Fig. S1b) exhibited a similar trend. Specifically, Vm leaves maintained significantly higher contents of Chl a and Chl b compared to Vu, and this difference became more pronounced as the drought stress persisted and its severity intensified. This suggests that the reduction in total chlorophyll content resulted from reductions in both chlorophyll components, rather than being primarily contributed by one of them.
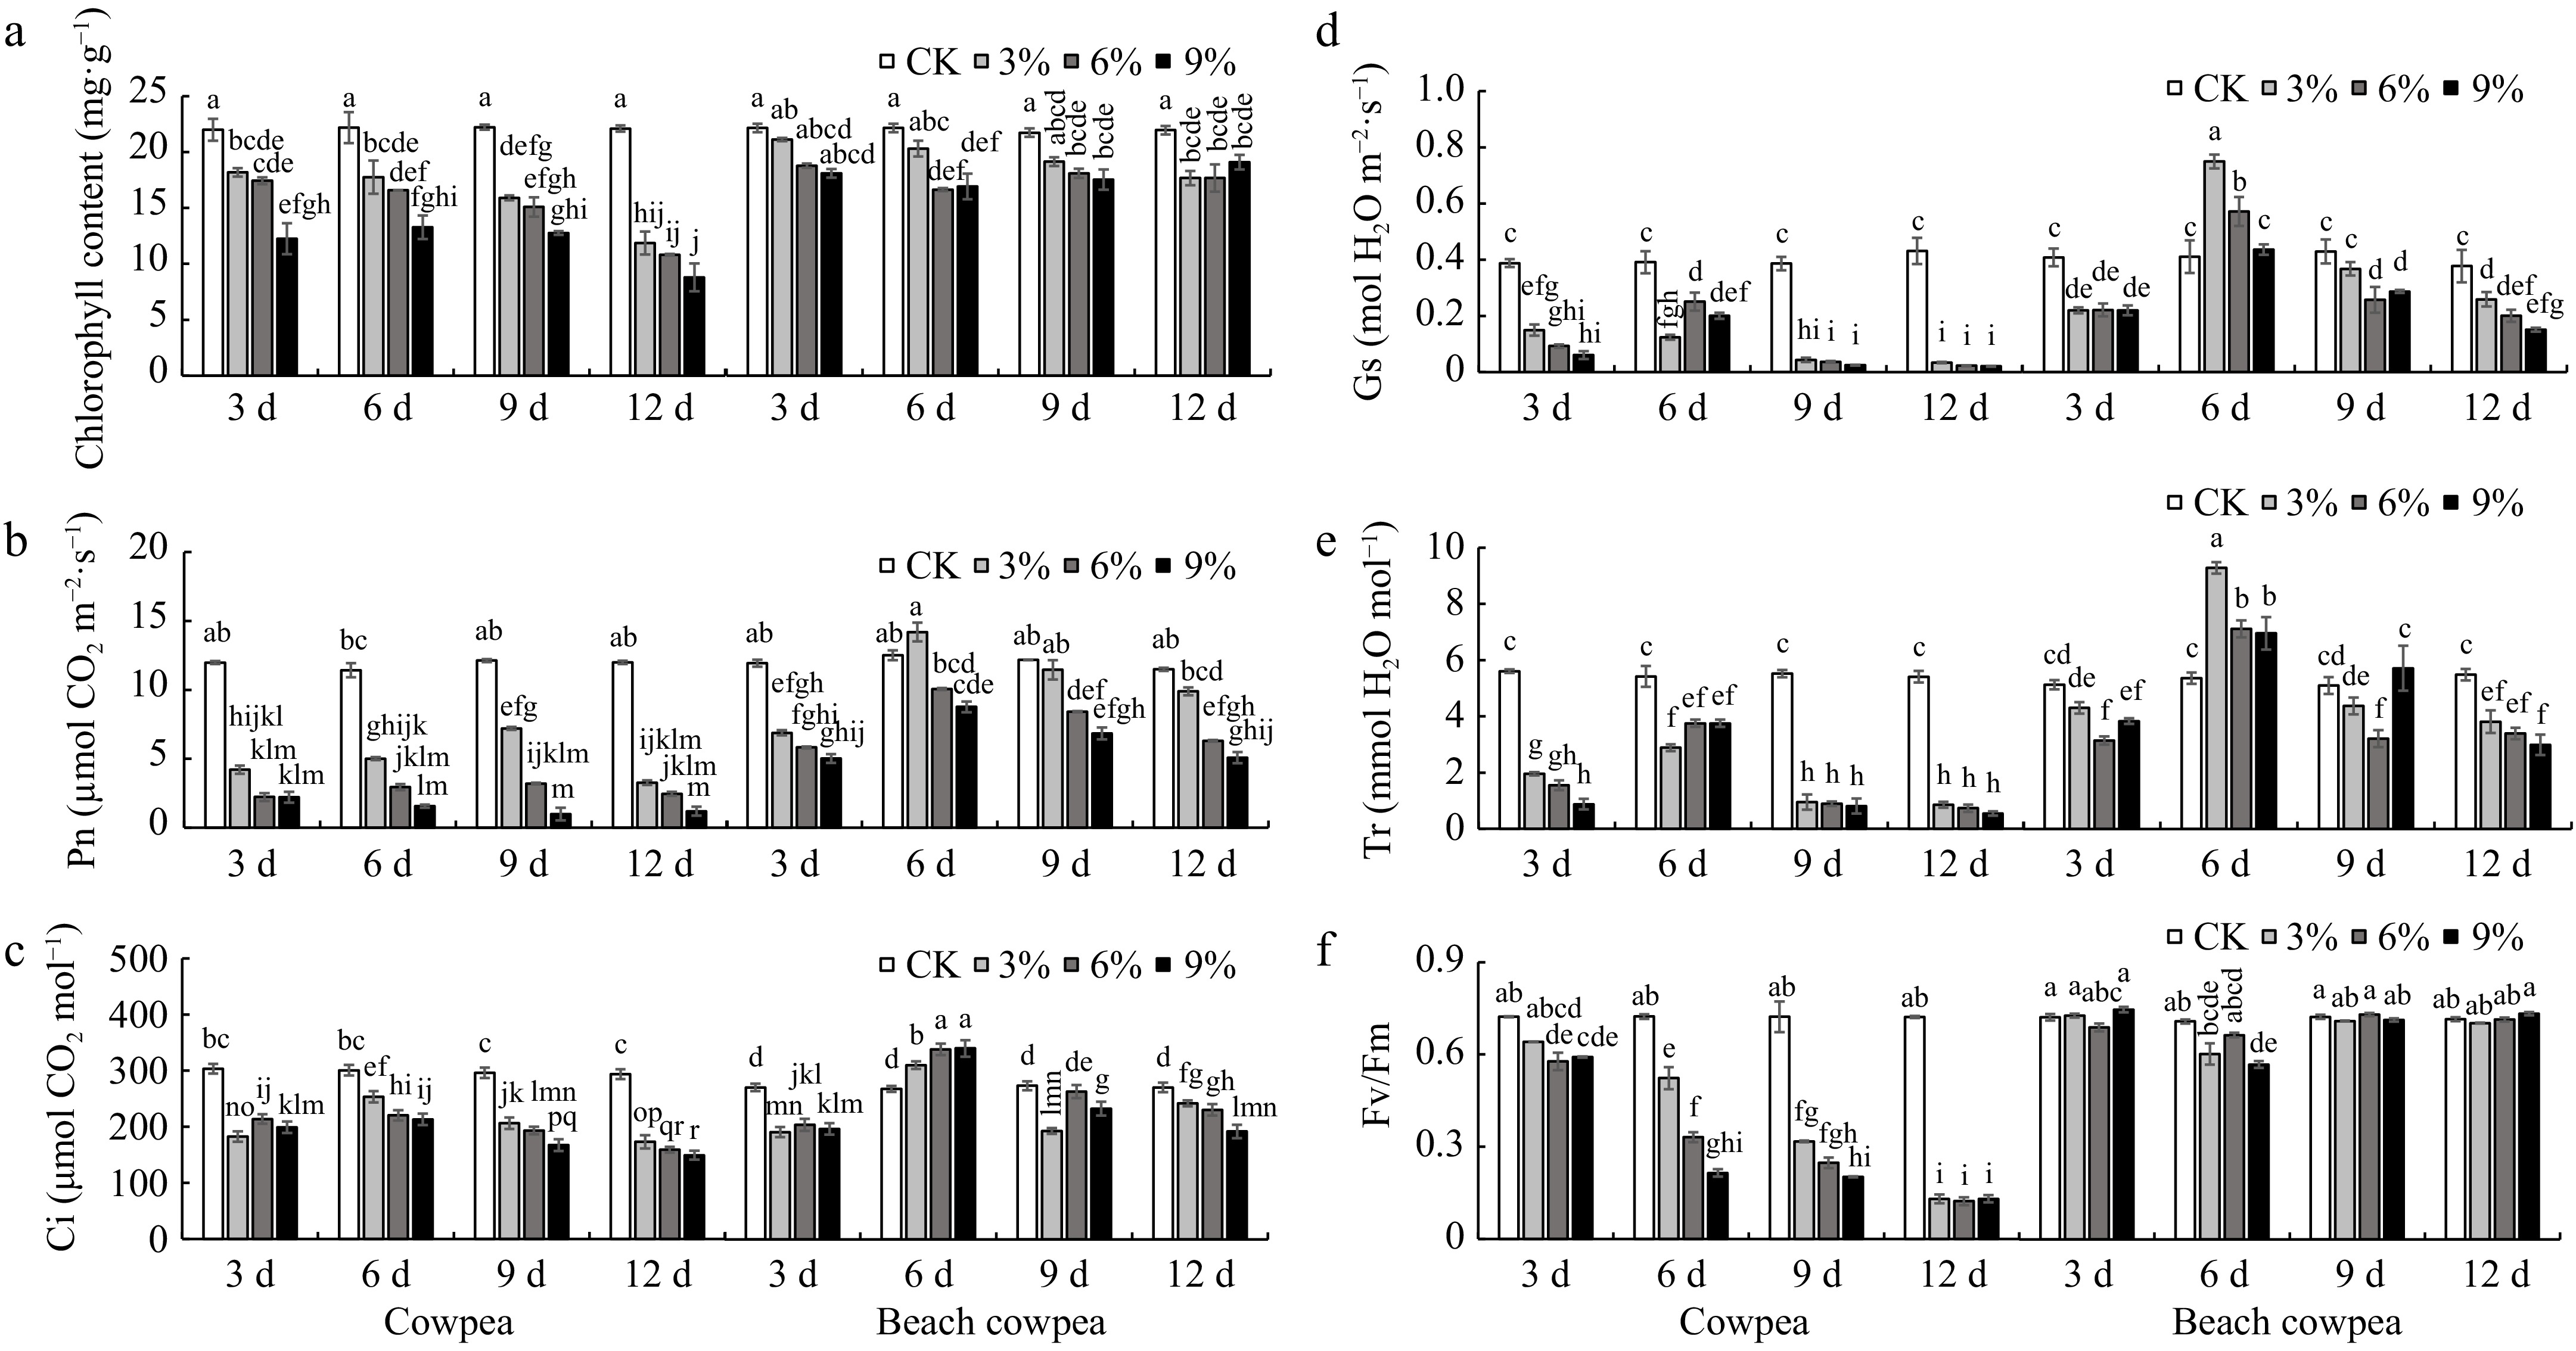
Figure 5.
Beach cowpea maintains higher chlorophyll content and more robust photosynthetic activity than cowpea under PEG6000-simulated drought stress. The effects of PEG6000-simulated drought stress on (a) total chlorophyll content; photosynthetic parameters including (b) photosynthetic rate (Pn), (c) intercellular CO2 concentration (Ci), (d) stomatal conductance (Gs), and (e) transpiration rate (Tr); (f) Fv/Fm ratio (variable to maximum fluorescence), were evaluated in leaves of cowpea and beach cowpea plants treated with 0%, 3%, 6%, and 9% PEG6000 for 3, 6, 9, and 12 d. Each experiment included three biological replicates. Different letters indicate statistically significant differences (p ≤ 0.05).
The analysis of photosynthesis gas exchange parameters uncovered novel physiological mechanisms in Vm leaves that confer tolerance to drought stress. Treatment with 3% PEG6000 resulted in a significantly higher net photosynthesis rate (Pn) in Vm compared to Vu from the 6th to the 12th day, while treatments with 6% and 9% PEG6000 led to notably higher Pn rates in Vm compared to Vu from the 3rd to the 12th day (Fig. 5b). Intercellular CO2 concentration (Ci) exhibited varied trends in Vm and Vu leaves. Initially, on day 3, all PEG6000-treated groups did not show a significant difference in Ci between Vm and Vu (Fig. 5c). From the 6th to the 12th day, only the 3% PEG6000 treatment on day 9 resulted in a higher Ci in Vu than in Vm; while across other concentrations of PEG6000 and treatment periods, Vm consistently exhibited a significantly higher Ci than Vu. This variation in Ci may result from CO2 consumption during carbon fixation in photosynthesis, where a drop in Ci could cause a low Pn. Stomatal conductance (Gs) and transpiration rate (Tr) in Vu leaves drastically decreased as drought stress persisted and intensified (Fig. 5d & e). By day 12 of treatment, Gs and Tr in Vu leaves decreased to no more than 8.0% and 15.9% of those in the control group, respectively. Surprisingly, Vm leaves under drought stress initially showed an increase in Gs and Tr, reaching peaks at day 6, followed by a subsequent decline. Specifically, on day 6, Gs in Vm leaves treated with 3% and 6% PEG6000 (Fig. 5d), and Tr in Vm leaves treated with 3%, 6%, and 9% PEG6000 (Fig. 5e), were significantly higher than those in the control group. By day 12 of treatment, Gs and Tr in Vm leaves maintained no less than 40.0% and 54.5% of those in the control group. This suggests that Vm leaves can enhance transpiration (pull force) to facilitate water transport throughout the plant, thereby maintaining a stable leaf relative water content and avoiding leaf wilting (Fig. 1b & c) - a potential physiological adaptation mechanism for Vm to cope with drought stress.
To shed light on the photobiochemical alterations and energy allocation in Vm and Vu leaves under drought stress, we conducted further analysis on chlorophyll fluorescence parameters, including Fv/Fm, Y(PSII), and Y(NO). Fv/Fm represents the maximum potential quantum efficiency of Photosystem II if all capable reaction centers are open[60,61]. The Fv/Fm ratio in Vu leaves exhibited a consistent decline as drought stress persisted and intensified (Fig. 5f). On day 12 of treatment, the Fv/Fm ratio in Vu leaves treated with 3%, 6%, and 9% PEG6000 decreased by 82.0%, 83.0%, and 82.0% respectively, compared to the control group. In contrast, the Fv/Fm ratio in Vm leaves remained relatively stable, ranging from 0.67 to 0.76, comparable to the control group throughout the entire treatment period.
Y(PSII) represents the effective quantum yield of photosystem II (PS II), indicating the efficiency of PS II in converting absorbed light into chemical energy[61]. Similar to Fv/Fm, the Y(PSII) values in Vu leaves showed a consistent decline as drought stress persisted and intensified (Supplementary Fig. S2a). On day 12 of treatment, the Y(PSII) values in Vu leaves treated with 3%, 6%, and 9% PEG6000 decreased by 67.4%, 74.9%, and 92.9%, respectively, compared to the control group. In contrast, treatments with different concentrations of PEG6000 did not yield significant differences in Y(PSII) values between Vm treated groups and the control group throughout the entire treatment period. The results for Y(NO) revealed a contrasting pattern. While the value of Y(NO) in Vm leaves remained stable under drought stress, maintaining a level similar to the control, it significantly increased in Vu leaves subjected to drought stress compared to the control (Supplementary Fig. S2b). Y(NO) represents the quantum yield of non-regulated energy dissipation in PSII, reflecting the fraction of light absorbed by PSII that is dissipated as heat or fluorescence in a non-regulated manner[61]. This suggests that under drought stress, Vm leaves can still effectively utilize the light energy captured by chlorophyll to assimilate CO2. However, Vu leaves appear to have lost their ability to efficiently utilize solar energy, possibly due to damage to core proteins within their photosynthetic apparatus.
The phenotyping results of Malondialdehyde (MDA) levels and Relative Electrical Conductivity (REC) in Vu and Vm leaves suggest a higher level of stress and damage in Vu compared to Vm. Treatment with 6% and 9% PEG6000 induced significantly higher levels of MDA in Vu leaves compared to Vm from the 3rd to the 12th day, while the 3% PEG6000 treatment resulted in significantly higher MDA levels in Vu leaves compared to Vm from the 6th to the 12th day (Fig. 6a). More significantly, all concentrated PEG6000 treatments led to a notably elevated REC level in Vu leaves compared to Vm throughout the entire drought stress period (Fig. 6b).
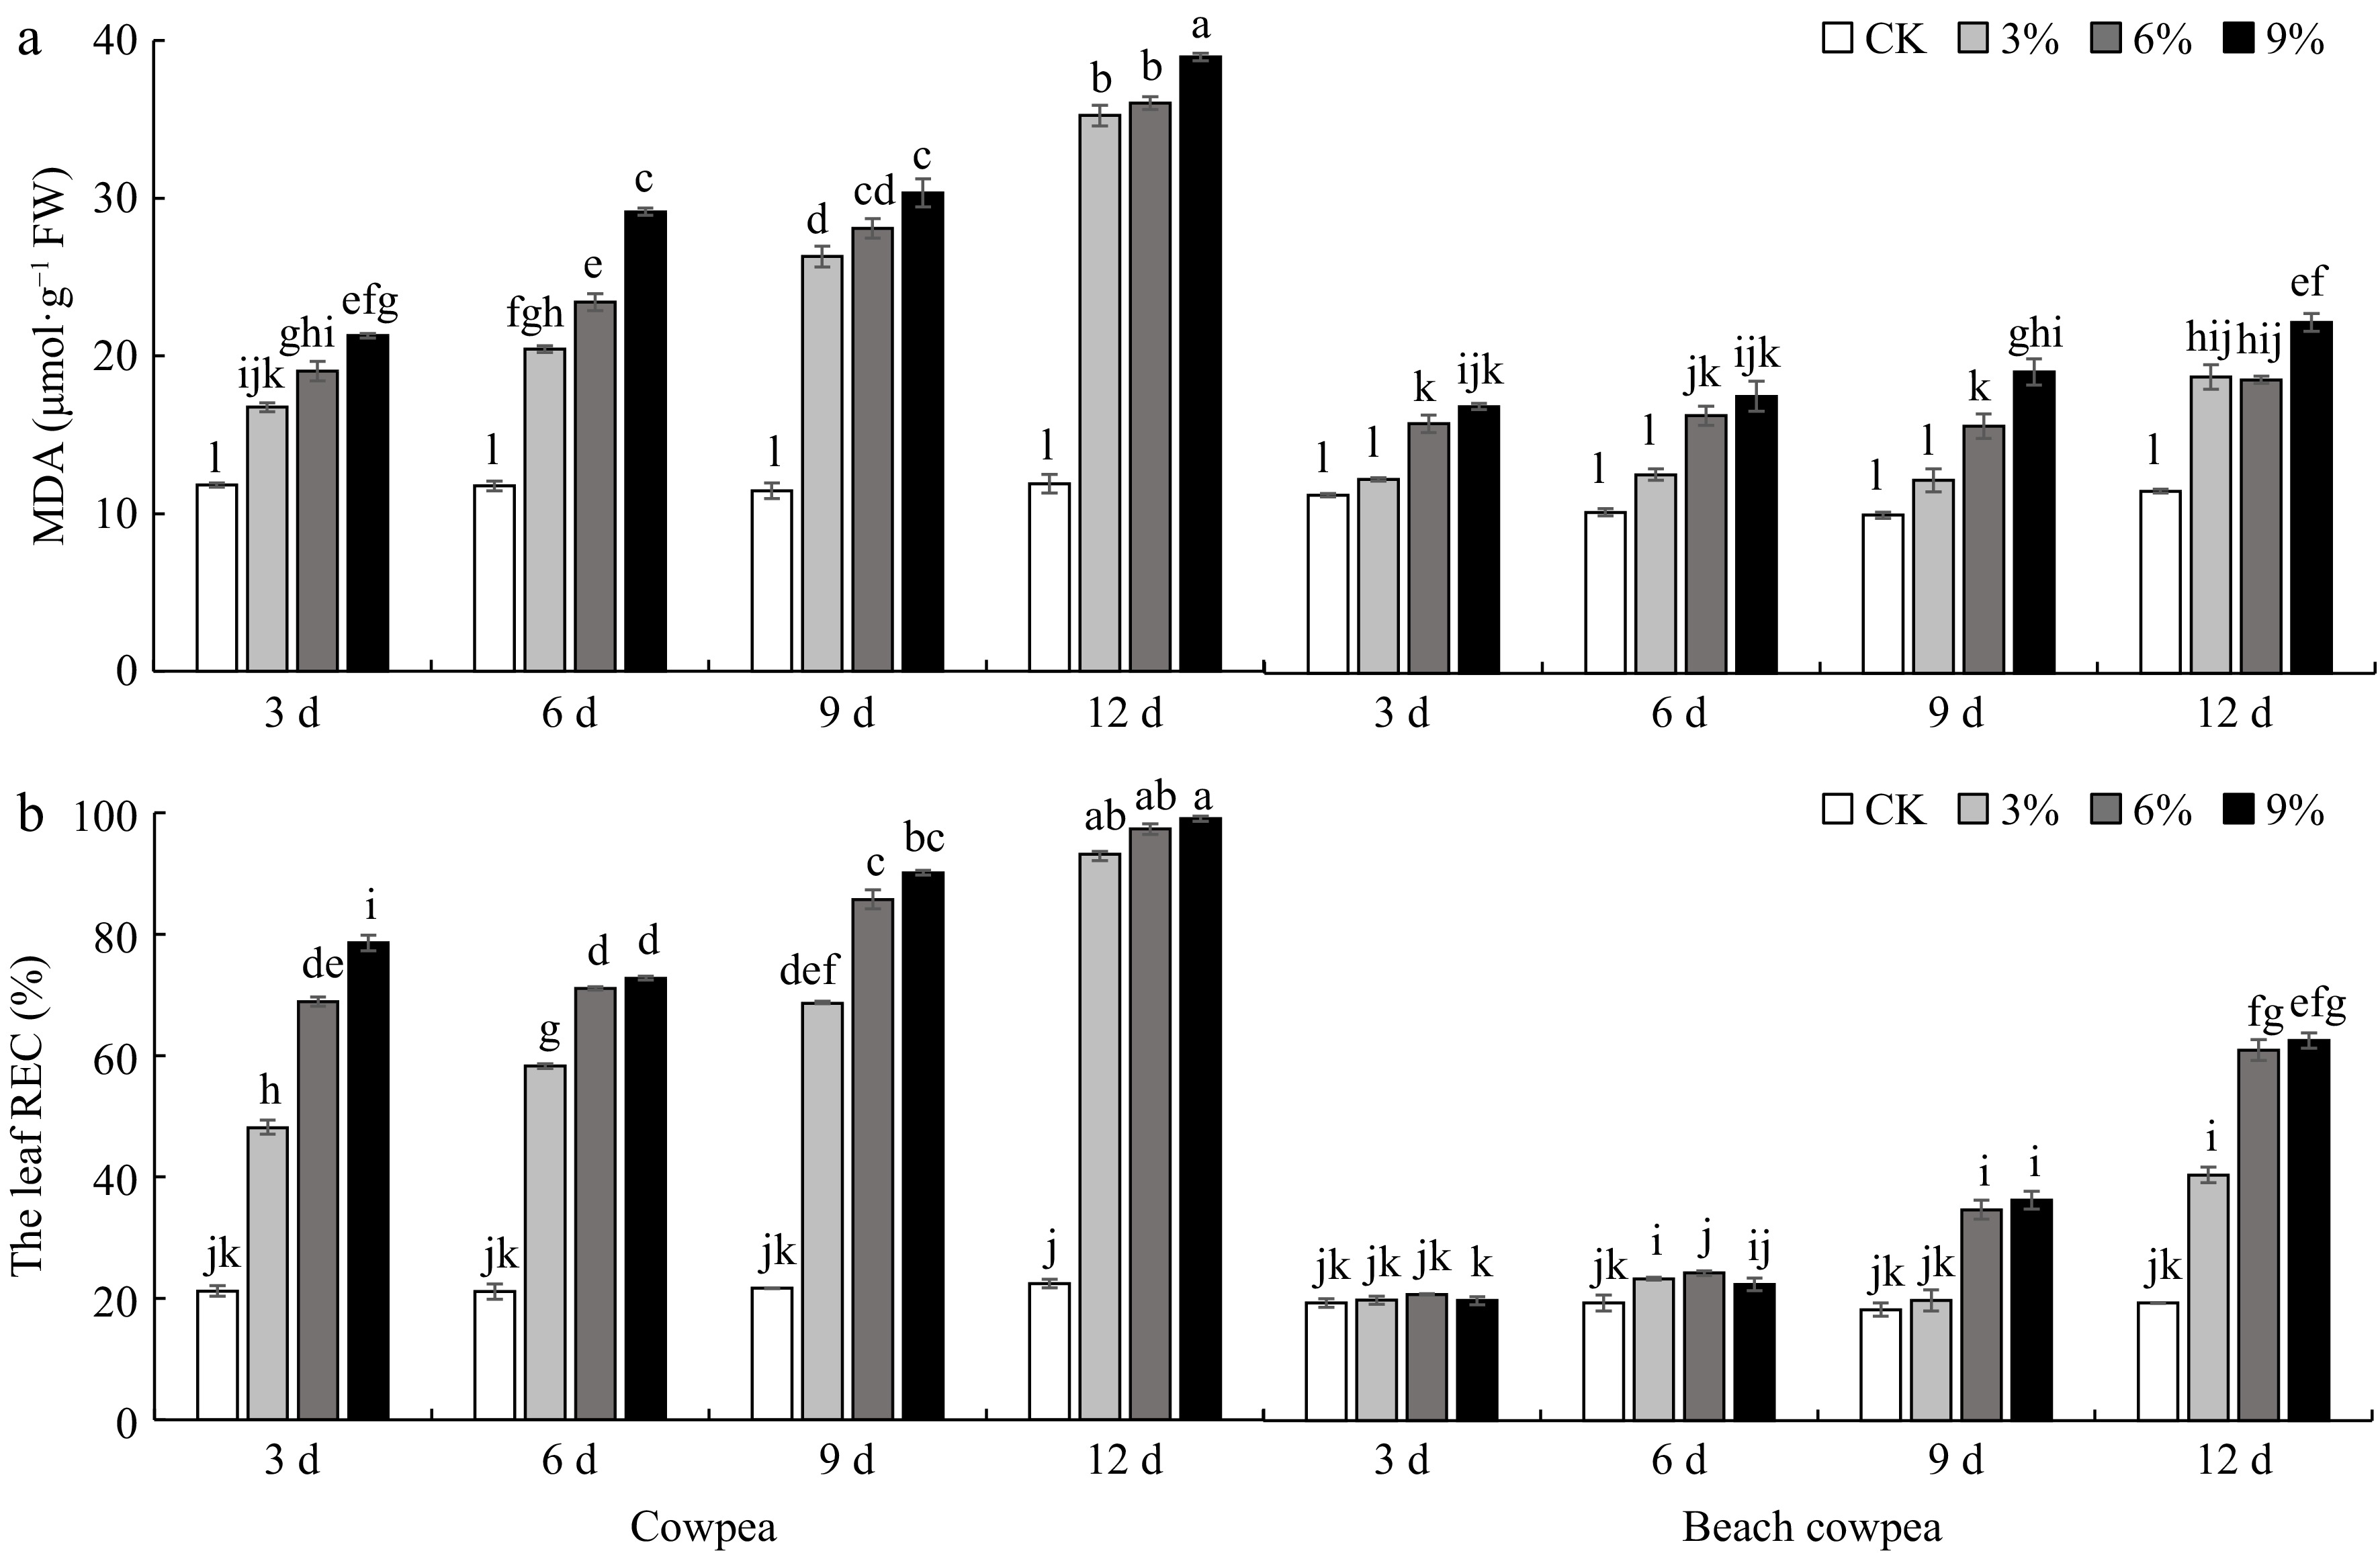
Figure 6.
Beach cowpea leaves contain lower levels of (a) Malondialdehyde (MDA), and (b) Relative electrical conductivity (REC) than cowpea under PEG6000-simulated drought stress. MDA and REC were used to evaluate the stress levels in leaves of cowpea and beach cowpea plants treated with 0%, 3%, 6%, and 9% PEG6000 for 3, 6, 9, and 12 d. Each experiment included three biological replicates. Different letters indicate statistically significant differences (p ≤ 0.05).
Collectively, the assessment of physiological responses in Vm and Vu leaves, including chlorophyll content, gas exchange, chlorophyll fluorescence, MDA, and REC, suggests that Vm has a superior mechanism for adapting to water deficiency. Vm shows lower levels of stress indicators (MDA, REC, and Y(NO)) and higher performance indicators (chlorophyll content, Pn, Fv/Fm, Y(PSII)) compared to Vu, indicating more stable physiological activity under drought stress. This may be due to the significant increase in Gs and Tr in Vm leaves compared to Vu under all PEG6000 concentrations from the 3rd to the 6th day, suggesting that Vm can enhance transpiration to improve water transport under drought conditions. Combined with higher root activity in Vm (Fig. 2d), this increased transpiration may facilitate better water absorption from the soil, potentially enhancing drought tolerance, especially with a strong root system.
Transcriptome changes of the roots of cowpea and beach cowpea under drought conditions
-
To reveal the changes in transcriptional levels of Vm and Vu in response to water stress, we performed transcriptome sequencing on the roots exposed to 6% PEG6000 for 0 d (control), 1 d, and 6 d. After filtering the data and performing quality control, a total of 765.56 million clean reads were obtained from 18 samples. The Q20 and Q30 statistics of the clean reads were greater than 97% and 93%, respectively (Supplementary Table S1). We finally assembled the clean reads to obtain 33,776 genes for beach cowpea and 21,832 genes for cowpea for further downstream analysis.
Subsequently, we analyzed the data to identify significantly differentially expressed genes (DEGs) in the roots of the two Vigna plants under different drought stress conditions compared to the control. We used log2 fold change > 1 or < −1 and adjusted p-value less than 0.05 as the thresholds to identify DEGs. On day 1 (compared to the control), there were 1,767 upregulated and 3,026 downregulated DEGs in Vm, whereas 213 upregulated and 1,518 downregulated DEGs were observed in Vu (Fig. 7a & Supplementary Tables S2−S4). After 6 d of drought stress, there were 1,611 upregulated and 2,677 downregulated DEGs in Vm roots, while a total of 8,173 DEGs were found in Vu roots, including 3,111 upregulated and 5,062 downregulated ones (Fig. 7a & Supplementary Tables S2, S5, S6).
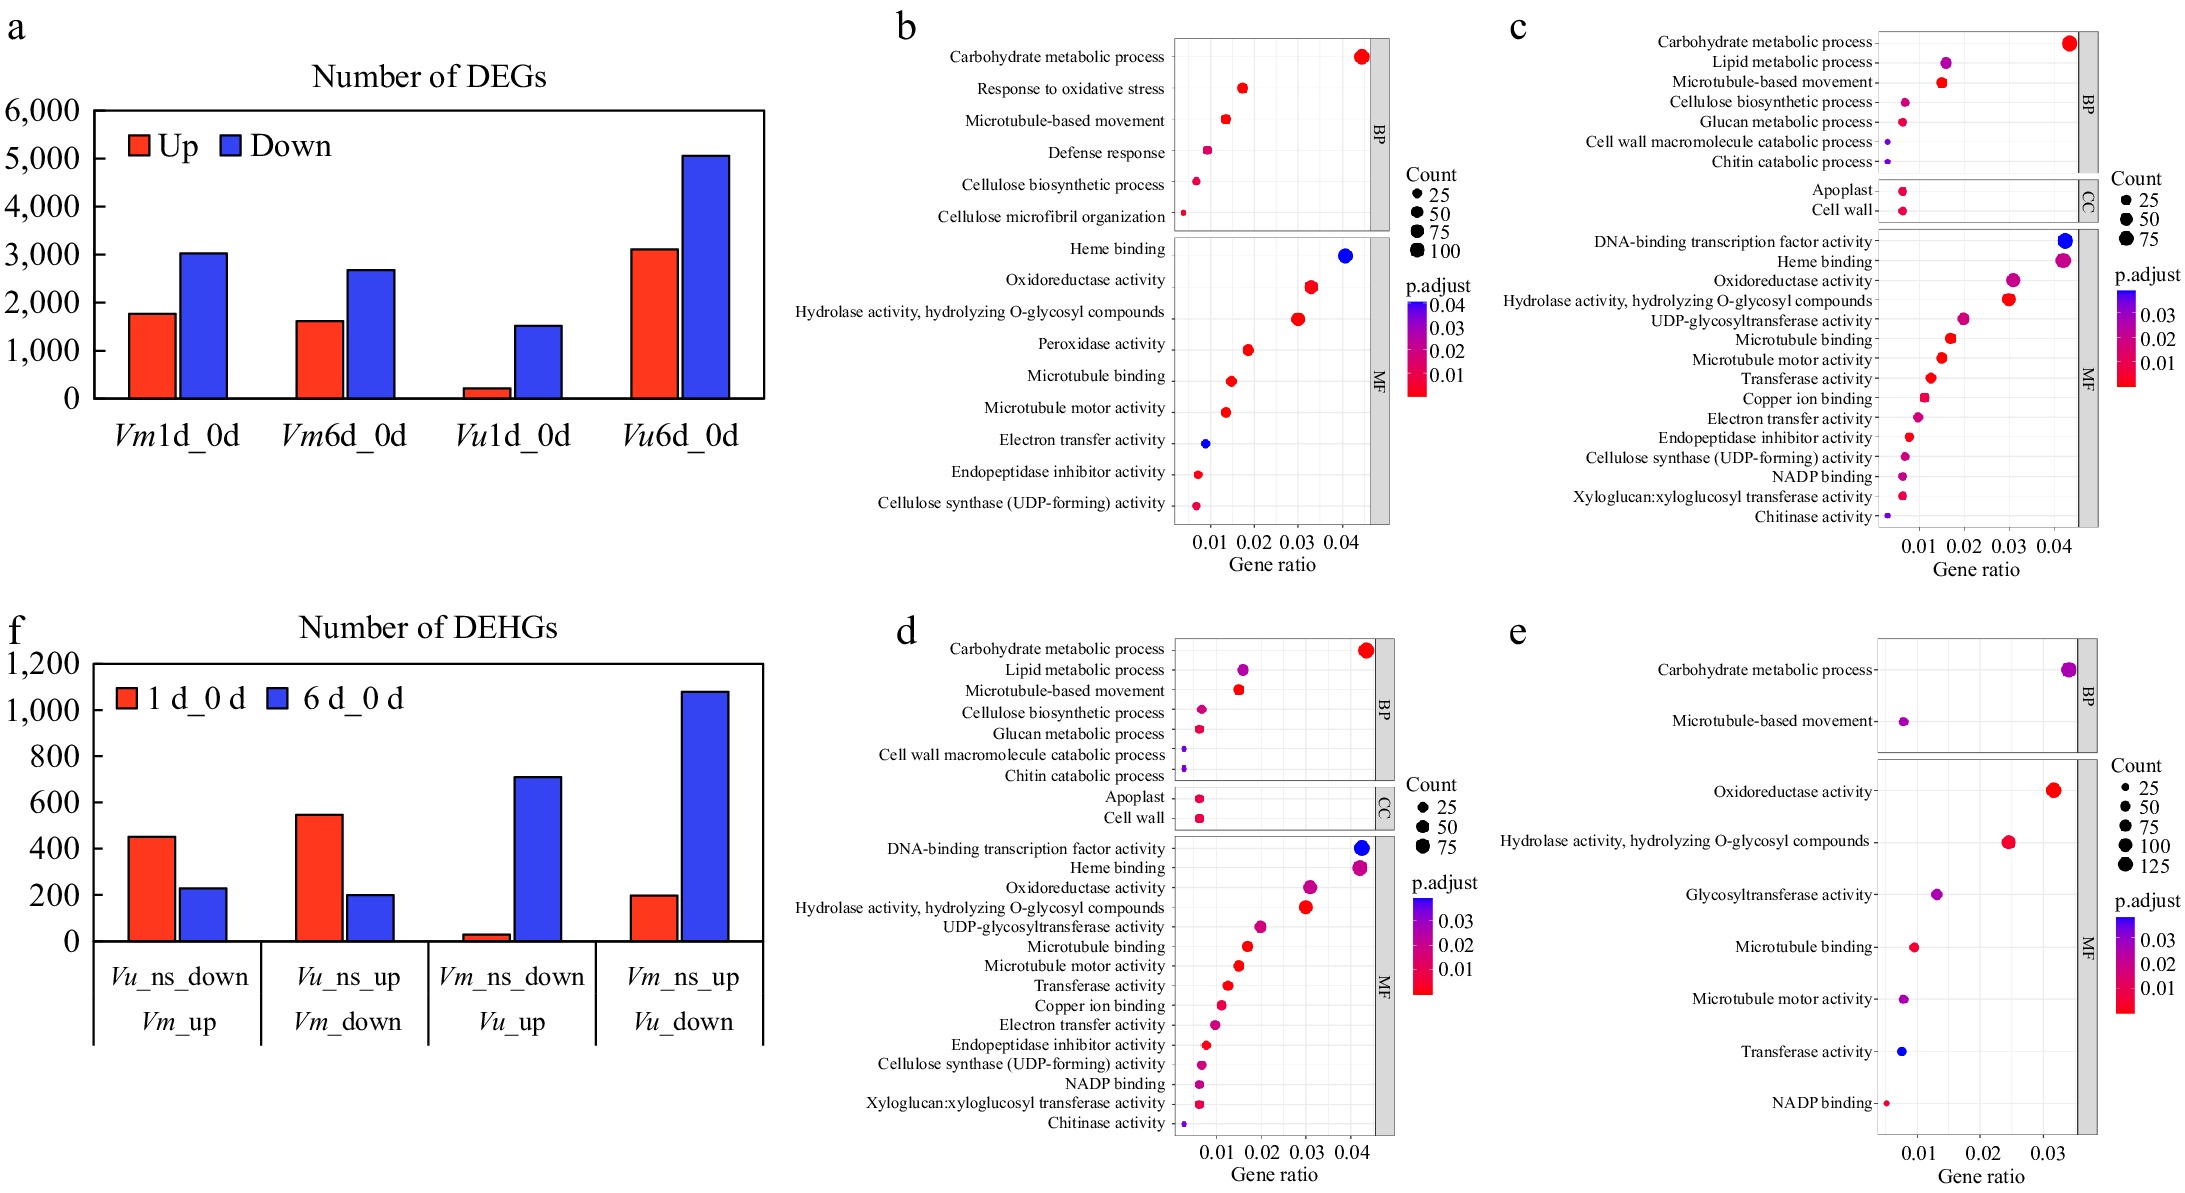
Figure 7.
Transcriptional changes of Vm and Vu genes in roots under drought treatments. (a) The number of DEGs in the comparisons Vm0d_Vm1d, Vm0d_Vm6d, Vu0d_Vu1d, and Vu0d_Vu6d. (b)−(e) Show the GO functional annotation of DEGs in the comparisons Vm0d_Vm1d, Vm0d_Vm6d, Vu0d_Vu1d, and Vu0d_Vu6d, respectively. (f) The number of DEHGs in the comparisons Vm_up/Vu_ns_down, Vm_down/Vu_ns_up, Vu_up/Vm_ns_down, and Vu_down/Vm_ns_up for the 1-d and 6-d treatments.
Functional enrichment analysis of DEGs
-
To investigate the major functions of drought-responsive genes in Vm and Vu, we conducted GO term enrichment analysis of the transcriptomes in the roots of beach cowpea and cowpea, respectively. In the Vm1d_Vm0d and Vm6d_Vm0d comparisons, 635 and 758 DEGs, respectively, were included in significant GO functional clusters, while 406 and 594 DEGs were clustered in the Vu1d_Vu0d and Vu6d_Vu0d comparisons, respectively (Supplementary Tables S7−S10). According to the GO enrichment analysis results for the 1-day drought treatment, the majority of DEGs in Vm and Vu roots were similarly characterized in terms of several molecular function (MF) categories, including 'carbohydrate metabolic process', 'response to oxidative stress', and 'microtubule-based movement', as well as biological process (BP) categories such as 'heme binding', 'peroxidase activity', 'hydrolase activity, hydrolyzing O-glycosyl compounds', and 'NADP binding' (Fig. 7b & c, Supplementary Tables S7, S8).
Although cell wall metabolism is associated with the drought response in both Vm and Vu, the functions derived from the enrichment analysis of DEGs still display slight differences. Vm drought-responsive root genes are enriched in cellulose metabolism, including 'cellulose biosynthetic process', 'cellulose microfibril organization' (MF), and 'cellulose synthase (UDP-forming) activity' (BP) (Fig. 7b). In contrast, Vu drought-responsive root genes are enriched in 'glucan metabolic process' (MF), 'xyloglucan transferase activity' (BP), and 'cell wall' (Cellular Component (CC)), the last category of which does not appear for Vm (Fig. 7c).
When examining the GO enrichment analysis results for the 6-d drought treatment, the differences between Vm and Vu become much more pronounced compared to the 1-d treatment in these two Vigna species. Vm roots have several unique enriched categories, including 'lipid metabolic process', 'cell wall macromolecule catabolic process', 'chitin catabolic process' (BP), 'endopeptidase inhibitor activity', and 'chitinase activity' (MF), which were not found in Vu roots under either 1-d or 6-d drought stress treatments (Fig. 7c−e, Supplementary Tables S9, S10). Interestingly, some functional categories enriched for 1-d treated Vu but not for 1-d treated Vm were found in 6-d treated Vm, such as 'glucan metabolic process' (BP), 'xyloglucan:xyloglucosyl transferase activity' (MF), 'apoplast', and 'cell wall' (CC). Taken together, Vm and Vu share some known molecular mechanisms to counter drought stress, such as cell wall metabolism and antioxidant capacity. However, the transcriptome response in Vm is slower than in Vu, implying that the long-term adaptation of Vm enhances its threshold to adverse environmental conditions.
Analysis of differentially expressed homologue genes (DEHG) in Vm and Vu treated with drought stress
-
The core objective of the present study is to identify the unique genes in Vm that are responsive to drought stress but not in Vu. However, functional analyses of DEGs indicate that Vm and Vu behave similarly in response to drought stress. To further explore the unique gene models and molecular mechanisms in beach cowpea tolerant to drought stress, we analyzed the differentially expressed homologous genes (DHEGs) in these two Vigna plants.
After 1 d of drought treatment, 449 Vm genes were upregulated while their Vu homologs were either downregulated or showed no change; 546 Vm genes were downregulated while their Vu homologs were either upregulated or showed no change (Fig. 7f, Supplementary Tables S11−S13). Conversely, only 28 Vu genes were upregulated while their Vm homologs were either downregulated or showed no change; 196 Vu genes were downregulated while their Vm homologs were either upregulated or showed no change (Fig. 7f, Supplementary Tables S11, S14, S15). Based on the annotation from the Arabidopsis database, several drought-inducible homologous marker genes in Vm and Vu were found to be differentially expressed after 1 d of drought treatment. For example, the expression of Vm01g00793, but not Vu03G347300, homologs of the drought stress-tolerant gene AtDRS19 (AT1G80710), was significantly enhanced (Supplementary Table S12)[62]. Plant hormone-associated genes were also found to contribute to Vm's better drought adaptability compared to Vu. The gene Vm01g00581, but not Vu03G368600, a homolog of AtABIG1 (AT4G37790), a positive drought tolerance regulator in the ABA transduction pathway, was upregulated (Supplementary Table S12)[63]. Similarly, the expression of Vm11g01014, but not Vu05G157300, both homologs of ATGA2OX1 (AT1G78440), a positive regulator of water deficiency in the gibberellin pathway, was significantly enhanced (Supplementary Table S12)[64].
After 6 d of drought treatment, 229 Vm genes were upregulated while their Vu homologs were either downregulated or showed no change (Fig. 7f; Supplementary Tables S11, S16); 199 Vm genes were downregulated while their Vu homologs were either upregulated or showed no change (Fig. 7f; Supplementary Tables S11 & S17). On the other hand, 710 Vu genes were upregulated while their Vm homologs were either downregulated or showed no change (Fig. 7f; Supplementary Tables S11 & S18); 1078 Vu genes were downregulated while their Vm homologs were either upregulated or showed no change (Fig. 7f; Supplementary Tables S11 & S19). Among these genes, two homologous genes, Vm01g04345 and Vu03G057900, caught our attention. They are homologs of an Arabidopsis NAC transcription factor gene, AtNAC32 (AT1G77450), which has been reported to enhance drought tolerance[65]. After 6 d of treatment, the expression of Vm01g04345 was enhanced, while the transcript level of Vu03G057900 did not change significantly (Supplementary Table S16). Additionally, the expression of Vm11g00890, but not Vu10G146700, homologs of the abiotic stress defense gene AtLOX4 (AT1G72520), was significantly increased (Supplementary Table S16)[66].
We further combined the datasets and identified DEHGs in Vm and Vu for both the 1-d and 6-d treatments. A total of 112 DEHGs were highlighted where Vm genes were upregulated while Vu homologs were either downregulated or showed no change (Supplementary Table S20), and 67 DEHGs where Vm genes were downregulated while Vu homologs were either upregulated or showed no change (Supplementary Table S21). Among these DEHGs, the gene Vm11g02261, but not Vu05G277400—a homolog of AtCIPK15 (AT5G01810), a calcium sensor interacting with the ABA transduction pathway—was upregulated (Supplementary Table S20)[67]. Additionally, Vm01g00288 and Vu03G397600, homologs of AtLEA3, a well-studied drought-related gene[16], also showed differential expression. Vm01g00288 was upregulated in both the 1-d and 6-d treatments, while Vu03G397600 was downregulated in both durations (Supplementary Table S20).
In contrast, a total of 49 DEHGs were highlighted where Vu genes were upregulated while Vm homologs were either downregulated or showed no change (Supplementary Table S22), and four DEHGs where Vu genes were downregulated while Vm homologs were either upregulated or showed no change (Supplementary Table S23). Notably, a cluster of three tandem homologous xyloglucan endotransglycosylase genes in Vu (Vu03G359200, Vu03G359300, Vu03G359400), but not in Vm (Vm01g00669, Vm01g00670, Vm01g00671), were all downregulated (Supplementary Table S23). Based on the annotation, these genes are related to the integrity of the plant cell wall, which is associated with drought tolerance[68]. In summary, the DEHGs identified in this study provide a foundation for understanding the molecular mechanisms underlying Vm's tolerance to drought. Cohesive experimental validation will be conducted in the near future.
Co-expression network analysis of DEGs in Vm and Vu roots treated with PEG6000
-
To understand the crosstalk and coordination among root genes in response to drought stress and gain insights into the differential molecular mechanisms between Vm and Vu in dealing with drought stress, we performed WGCNA on genes from Vm (Supplementary Fig. S3) and Vu (Supplementary Fig. S4) roots treated with PEG6000 for three different durations (0 d and 6 d). Vm root genes were divided into 22 distinct modules (Fig. 8a; Supplementary Table S24), while Vu root genes were clustered into 10 different modules (Fig. 9a; Supplementary Table S25).
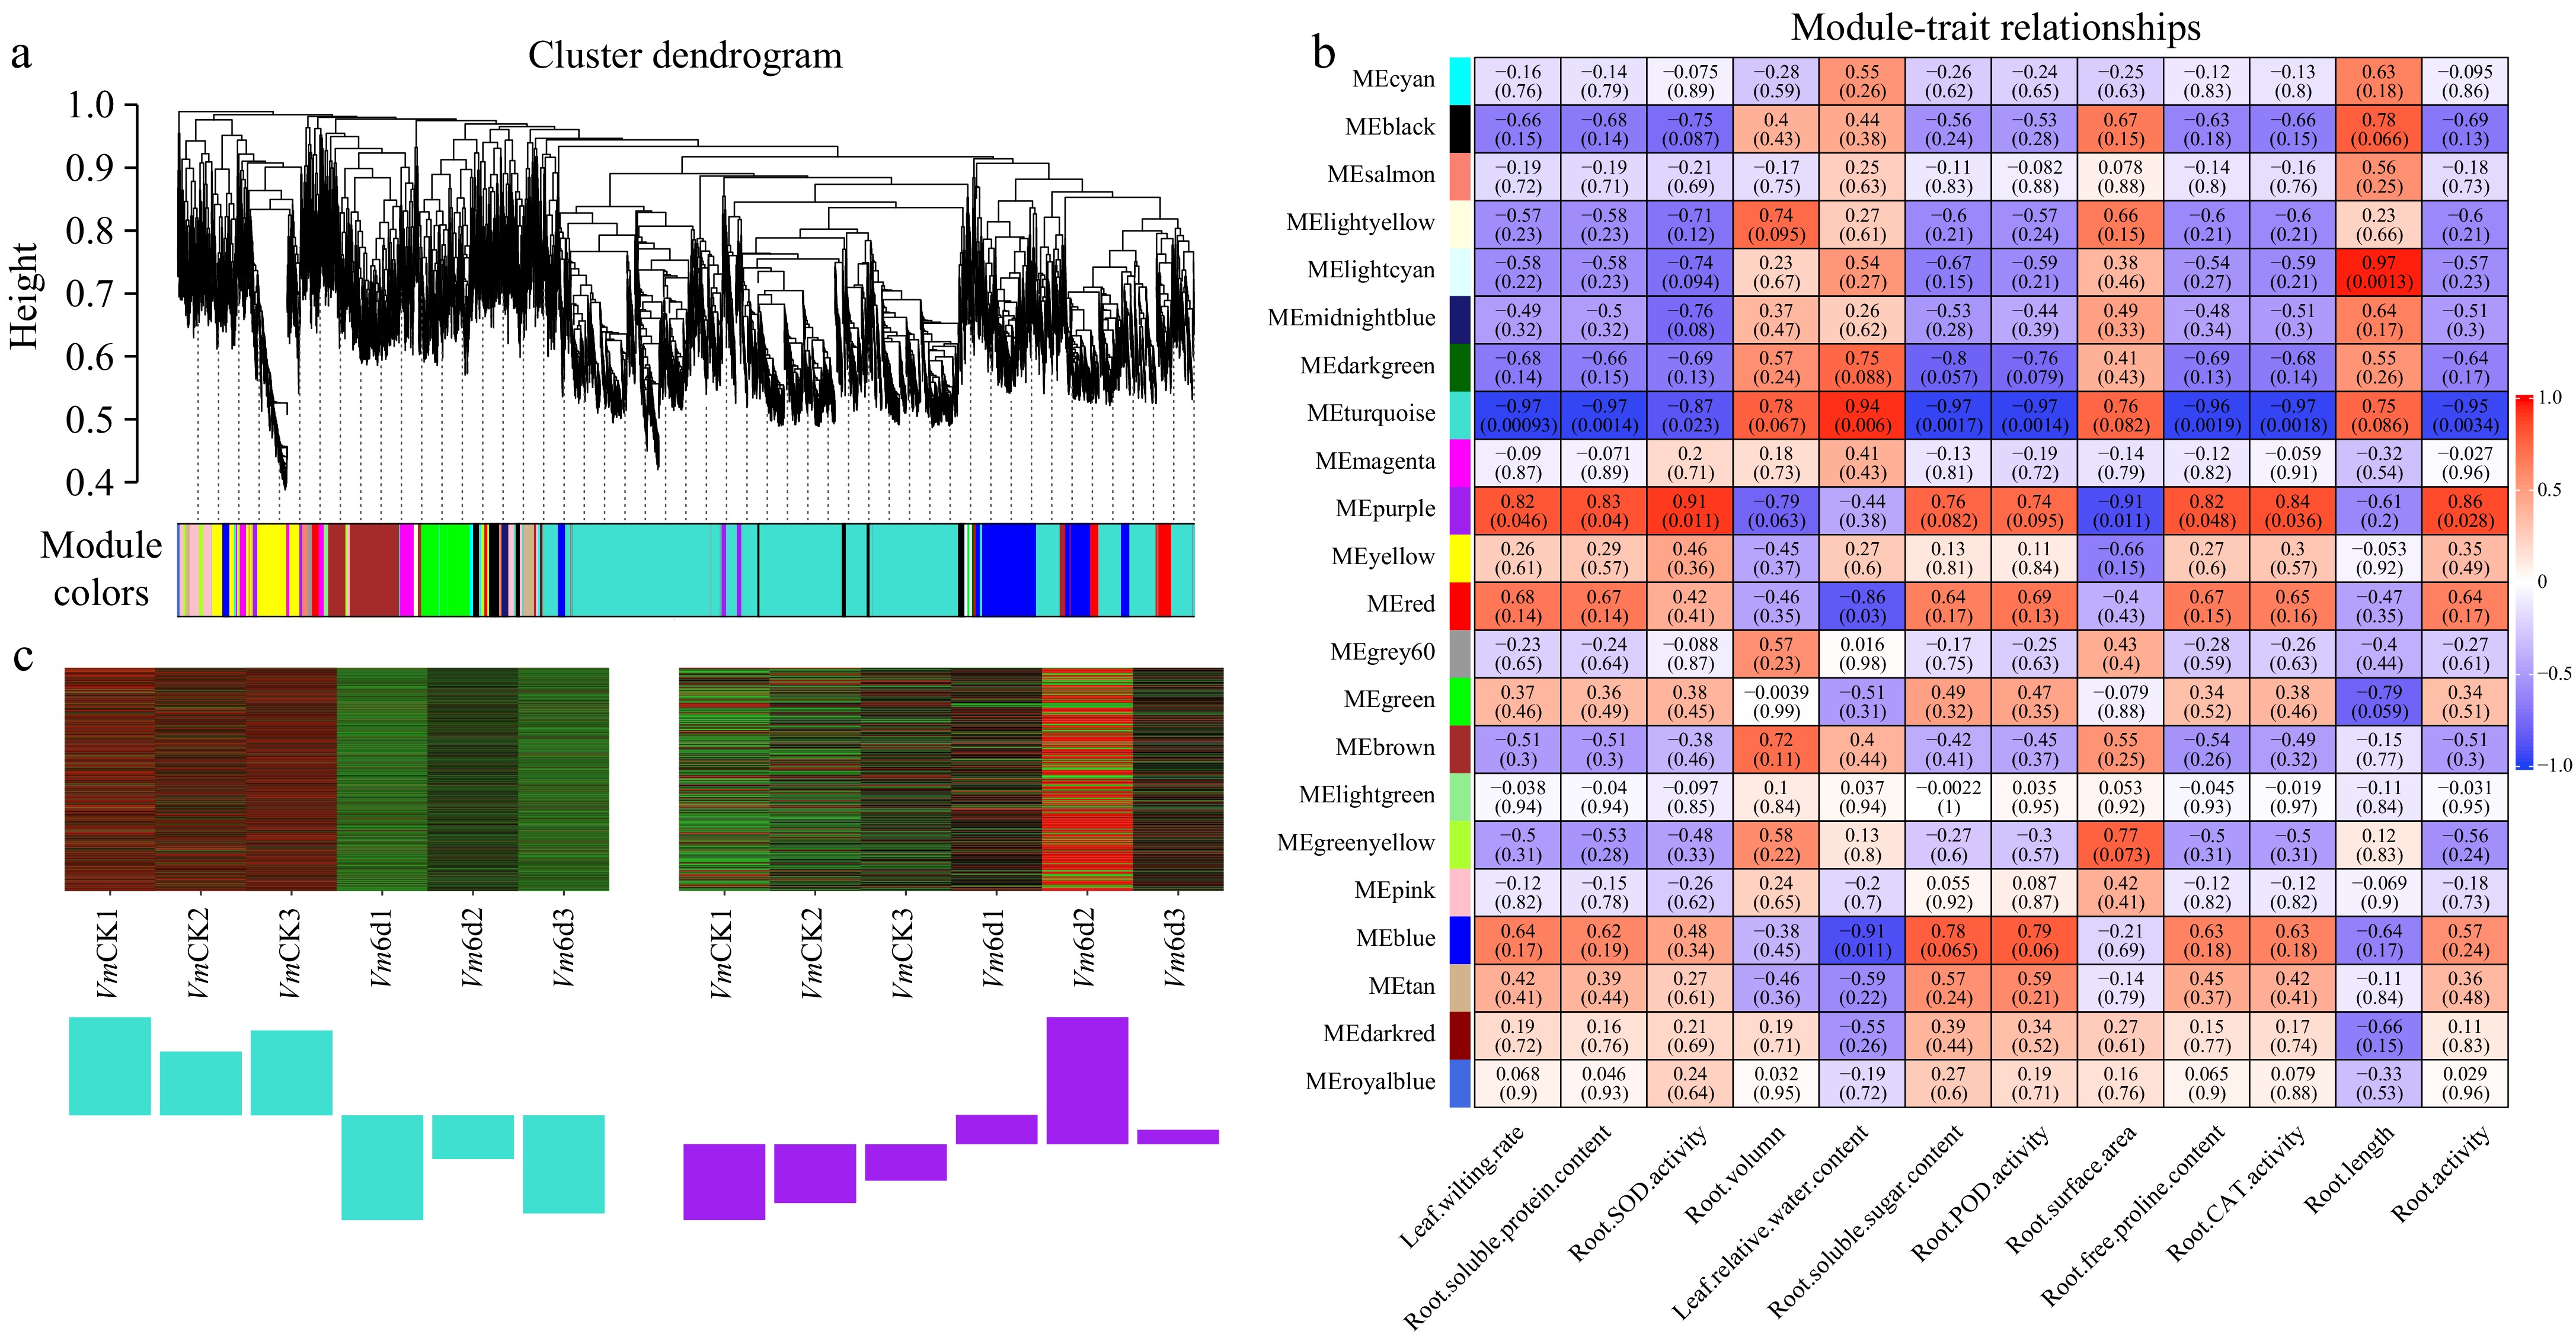
Figure 8.
WGCNA of genes in roots of Vm under 0 d and 6 d drought treatments. (a) Hierarchical cluster tree shows 22 co-expression modules labelled by different colors (except the gray module) based on the gene expression clustering results. Each short vertical line in the tree represents a gene. (b) The correlation analysis between 22 modules and 12 physiological traits. Each row corresponds to a module and each column corresponds to a physiological index. The number in each cell at the row-column intersection indicates the correlation coefficient. The colors varied from blue to red represent the scale of correlation coefficients, ranging from −1 (blue) to 1 (red). (c) Heatmaps indicate the expression patterns of eigengenes in the turquoise and purple modules. Bar graphs (below the heatmap) show the corresponding expression levels of the module eigengenes in different samples. The samples were VmCK1, VmCK2, VmCK3, Vm6d1, Vm6d2, and Vm6d3 with three biological replicates.
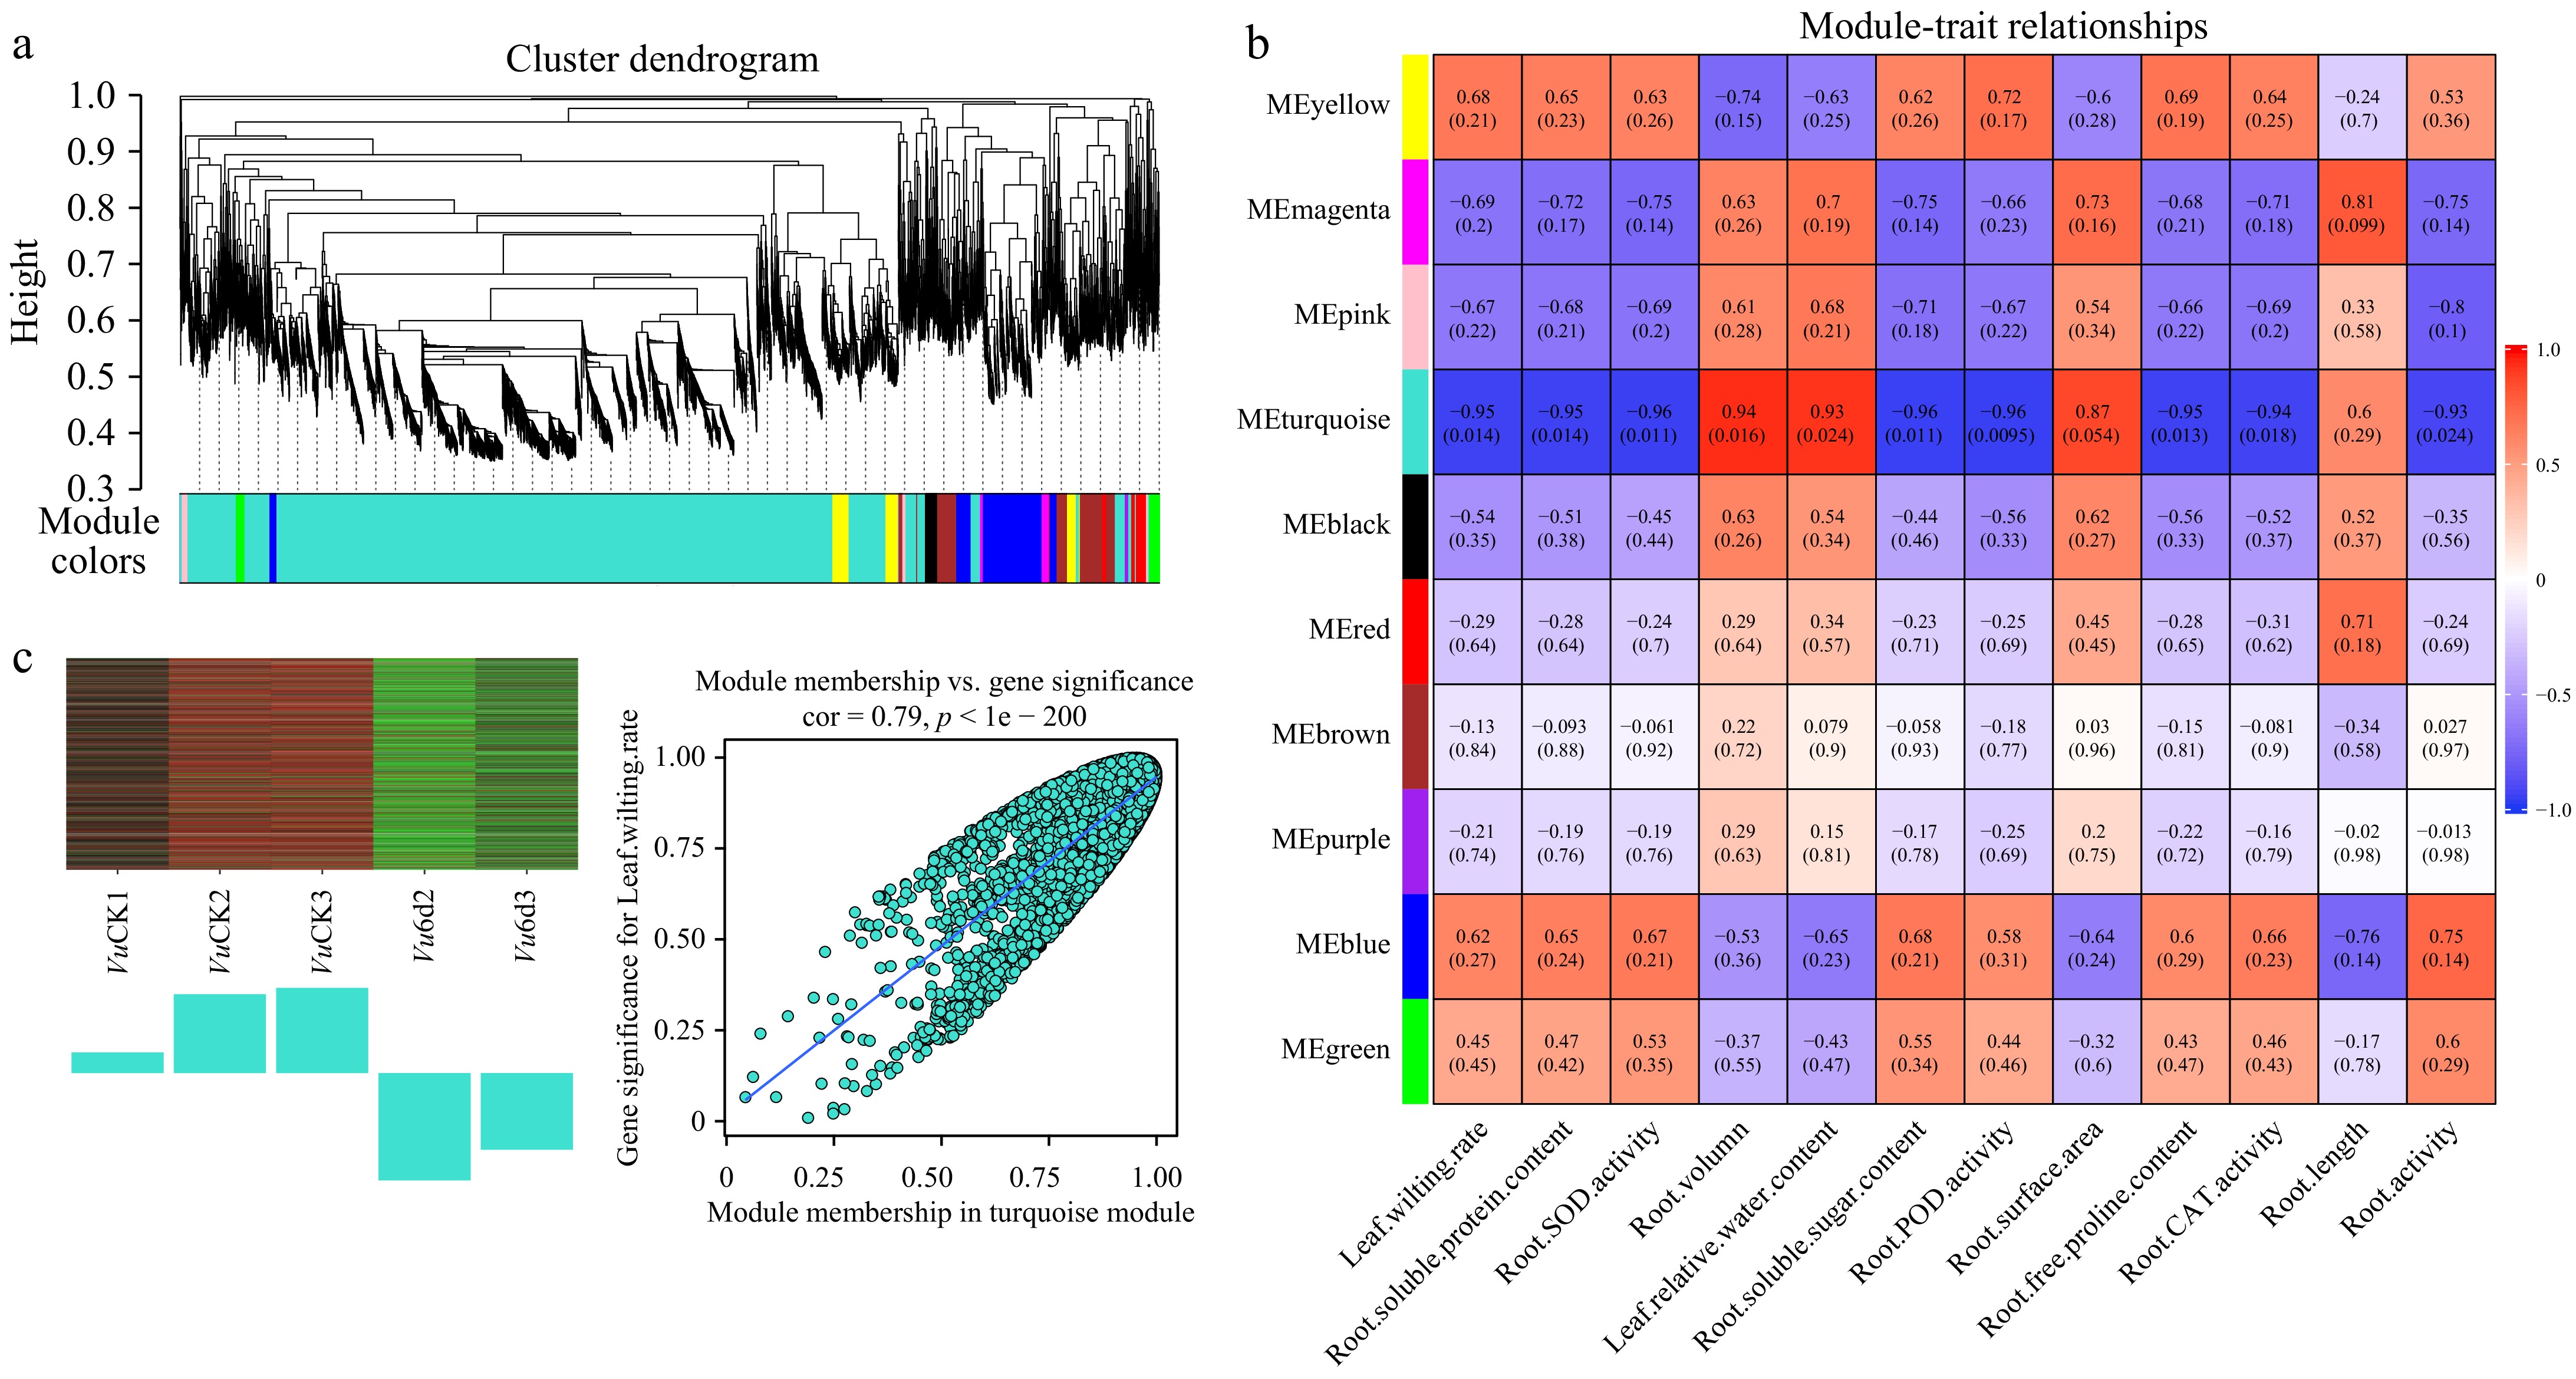
Figure 9.
WGCNA of genes in roots of Vu under 0 d and 6 d drought treatments. (a) Hierarchical cluster tree shows 10 co-expression modules labelled by different colors (except the gray module) based on the gene expression clustering results. Each short vertical line in the tree represents a gene. (b) The correlation analysis between 10 modules and 12 physiological traits. Each row corresponds to a module and each column corresponds to a physiological index. The number in each cell at the row-column intersection indicates the correlation coefficient. The colors varied from blue to red represent the scale of correlation coefficients, ranging from −1 (blue) to 1 (red). (c) Heatmaps indicate the expression patterns of eigengenes in the turquoise and purple modules. Bar graphs (below the heatmap) show the corresponding expression levels of the module eigengenes in different samples. The samples were VuCK1, VuCK2, VuCK3, Vu6d2, Vu6d3, with three and two biological replicates, respectively.
In Vm, the module-trait relationship analysis revealed that the turquoise module was the most significantly negatively correlated with physiological properties such as leaf wilting rate, root activities, and antioxidant enzyme activities including SOD, POD, and CAT, as well as contents of soluble sugar, soluble protein, and free proline in the roots (Fig. 8b). In contrast, this module was remarkably positively associated with relative water content in leaves, indicating that the genes in this module negatively regulate drought tolerance in Vm. The purple module exhibited the most opposite behavior, being positively correlated with physiological indicators such as leaf wilting rate, root activities, and antioxidant enzyme activities, while negatively associated with relative water content in leaves, suggesting that the genes in this module positively regulate drought tolerance in Vm. In Vu, the turquoise module played a similar negative role in drought tolerance, while the blue and yellow modules showed opposite behavior, suggesting that these modules positively regulate drought tolerance in Vu (Fig. 9b).
Further analysis revealed that genes in the Vm turquoise module were significantly downregulated under 6-d drought stress, with 1,899 downregulated genes, while the purple module was upregulated with 200 significantly upregulated genes (Supplementary Table S24; Fig. 8c). In Vu, the turquoise module was similarly downregulated, with 1968 notably downregulated genes, whereas the blue and yellow modules were upregulated, showing 762 and 349 upregulated DEGs, respectively (Supplementary Table S25; Fig. 9c).
In addition, we found that some DHEGs are strongly associated with the behavior patterns of modules derived from WGCNA. For example, Vm01g00288 and Vu03G397600, homologs of AtLEA3, a facilitator of drought stress tolerance, are present in the Vm yellow module and Vu turquoise module, respectively, and exhibit opposite relationships to plant performance under drought stress (Supplementary Table S20). The Vm yellow module is associated with tolerance, while the Vu turquoise module is associated with susceptibility, consistent with the reported function of AtLEA3 and confirming the role of Vm01g00288 in this context[16]. Additionally, all three previously mentioned xyloglucan endotransglycosylase genes in Vu are present in the turquoise module (drought-susceptible), while two out of three homologous genes in Vm are found in tolerant modules (blue and green) (Supplementary Table S23, Figs 8b & 9b). Furthermore, two transcription factors, Vm01g00396/Vu03G387600 (MYB family) and Vm01g04314/Vu03G061300 (NAC family), exhibit identical behavior actions, where the Vm homologs, but not the Vu homologs, have enhanced expression (Supplementary Table S20). The Vm homologs are present in the Vm blue module, while the Vu homologs are in the Vu turquoise module (Supplementary Tables S24 & S25). The Vm blue module is a drought-tolerant gene cluster, whereas the Vu turquoise module is a drought-sensitive gene cluster (Figs 8b & 9b). As many members of these two transcription factor (TF) families have been reported to be involved in drought responses in various plants, the two Vm TF genes identified here warrant further investigation[13]. In brief conclusion, the DHEGs associated with the tolerant and susceptible WGCNA modules in Vm and Vu identified in this study lay a foundation for future research endeavors aimed at investigating the detailed molecular mechanisms of beach cowpea's response to drought stress.
-
Drought is one of the most severe stresses affecting plant productivity. Water makes up approximately 80%–95% of a plant's fresh biomass and is essential for various physiological processes, including growth, development, and metabolism[69,70]. Consequently, it poses a global challenge, threatening future food security and having historically triggered major famines. The impact of drought on agriculture is exacerbated by the depletion of water resources and the rising food demand driven by rapid global population growth[2,71]. Plant yield and quality are adversely affected in water-deficient environments, making the development of drought-tolerant plants and the adoption of cost-effective agricultural practices crucial for meeting future food demands.
In this study, we comprehensively evaluated the responses of both root and shoot systems, clearly elucidating the physiological and morphological strategies by which beach cowpea, a wild legume species, adapts to water-deficient environments. At the whole-plant level, beach cowpea demonstrated significantly greater drought tolerance compared to its genetically close relative, cowpea, which is typically considered a drought-tolerant legume crop[52,72]. Specifically, after 12 d of exposure to varying concentrations of PEG6000, only yellowing leaves were observed in beach cowpea, whereas cowpea exhibited leaf drop and curling as early as 6 d into the 6% PEG6000 treatment (Fig. 1a). Consistently, the leaf wilting rate was 100% and RWC dropped below 30% in cowpea after 9 d of treatment with 6% PEG6000, while in beach cowpea, the wilting rate remained below 50% and RWC stayed around 60% even after 12 d of exposure to 9% PEG6000 (Fig. 1b & c). Given that RWC and leaf wilting rate are direct physiological indicators of plant performance under stress[73], these findings confirm the superior drought tolerance of beach cowpea.
We further investigated the role of the root system in beach cowpea's response to drought stress. Root morphology is closely associated with drought tolerance, as longer and more extensive root systems provide plants with greater opportunities to absorb water and nutrients. Drought-tolerant plants often exhibit greater rooting depth, density, root volume, and weight[74]. For example, in Trifolium repens, genotypes with higher root biomass relative to total plant biomass showed better survival and growth during water stress[75]. However, in this study, we found that root activity, rather than root morphology—such as root length, volume, and surface area—plays a key role in beach cowpea's ability to cope with water deficiency compared to cowpea (Fig. 2). It is possible that the root morphology of cowpea is already superior enough that, when using cowpea as the control, we could not demonstrate that root morphology is the key factor for beach cowpea in dealing with water deficiency. While the role of beach cowpea root morphology requires further investigation, our results confirm that enhanced root activity plays a decisive role in beach cowpea's adaptation to drought stress.
Root activity or root viability was measured by quantifying the reduction of triphenyltetrazolium chloride (TTC) to red-colored insoluble triphenylformazan (TF). Since only living tissues can reduce TTC to TF, higher root activity indicates more viable tissues in Vm compared to Vu under stress, contributing to better water absorption. By our further investigation, we suggest that the higher root activity in beach cowpea might result from more resilient cellular homeostasis due to the presence of more protective osmolytes and enhanced activities of antioxidant enzymes. Specifically, the root of beach cowpea, compared to cowpea, contains higher levels of osmotic protectants, such as soluble sugars, soluble proteins, and free proline (Fig. 3). Osmotic adjustment is an important strategy for plants to cope with drought stress. Plants often accumulate large amounts of solutes in cells to reduce osmotic potential and maintain water uptake in response to drought[54]. It is extensively studied that proline plays a crucial role in osmotic balance and cellular protection from damage triggered by free radicals, thereby conferring tolerance to water deficit[14,15,18]. Similarly, soluble sugars help maintain plant water content and contribute to membrane protection[76]. This has been confirmed in various drought resistant/tolerant species, such as Reaumuria soongorica[77] and H. ammodendron[78]. Similar to osmolytes, beach cowpea roots showed higher activities of antioxidant enzymes such as CAT, SOD, and POD (Fig. 4) compared to cowpea under drought stress. The rapid accumulation of reactive oxygen species (ROS) during drought stress causes oxidative damage to biomolecules such as carbohydrates, proteins, lipids, and nucleic acids, thereby suppressing biochemical and biological processes and overall plant growth[79]. The high activities of antioxidant enzymes like SOD, CAT, and POD in the redox system of beach cowpea help decompose ROS, maintaining a balance between ROS production and scavenging to ensure stable cellular homeostasis[80]. Therefore, we suggest that the more resilient redox system in beach cowpea plays a crucial role in maintaining root activity.
In addition to the root system, the leaf system of beach cowpea also exhibits physiological mechanisms for adapting to drought stress. Beach cowpea maintains higher stomatal conductance (Gs) and transpiration rate (Tr) throughout 12 d of various PEG6000 treatments compared to cowpea (Fig. 5d & f). Notably, both indicators initially increase, peaking at 6 d, before declining over the 12-d experimental period. Since transpiration facilitates water transport within the plant, these results strongly suggest that beach cowpea employs a physiological mechanism that enhances water movement from the roots to the above-ground parts by increasing transpiration rate and stomatal conductance during the early stages of drought stress. This response is uncommon among plants facing water deficiency, as the typical reaction is a decrease in transpiration rate and stomatal conductance, mediated by ABA, to prevent water loss[81,82]. To the best of our knowledge, while transpiration is known to facilitate water transport within plants, its role in enhancing drought tolerance has not been widely reported, further research and investigation are needed to clarify the detailed mechanisms.
Beach cowpea's ability to maintain a relatively higher leaf relative water content (RWC) under drought stress plays a key role in preserving the stability of other physiological functions. This proactive physiological mechanism helps sustain various leaf performance characteristics, such as chlorophyll content (Fig. 5a; Supplementary Fig. S1), net photosynthesis rate (Pn) (Fig. 5b), Fv/Fm (Fig. 5f), and Y(PSII) (Supplementary Fig. S2a). While these parameters decrease under drought conditions in beach cowpea, they remain significantly higher than in cowpea, indicating that beach cowpea exhibits more stable photosynthesis during drought stress. Specifically, the higher photosynthesis rate (Pn) observed in beach cowpea directly reflects its greater photosynthetic capacity, while the chlorophyll fluorescence parameters, including Fv/Fm and Y(PSII), suggest a more efficient functional turnover of the photosynthetic electron transport chain (PETC) under drought stress[35,83].
Photosynthesis, a crucial biochemical process for plant growth, development, and productivity, is highly susceptible to drought stress, primarily due to reduced CO2 availability resulting from stomatal closure to prevent water loss[83]. Under drought conditions, when solar energy captured by chlorophyll cannot be utilized for CO2 assimilation, it is instead converted into reactive oxygen species (ROS). Excessive ROS can impede the rapid turnover of the D1 protein, a core component of the PETC[84]. Consequently, it is widely reported that Fv/Fm and Y(PSII) decrease in plants under water deficit conditions[83]. In contrast, Y(NO) reflecting solar energy not utilized for photosynthesis and is closely associated with ROS production, usually increases with abiotic stress[61].
In this context, the accumulation of ROS can lead to lipid peroxidation, generating malondialdehyde (MDA), a cytotoxic compound that damages cellular and organelle membranes, and impairs protease functions[85]. Additionally, increased cell membrane permeability caused by excess ROS under abiotic stress can result in intracellular ion leakage, which can assessed by REC[86]. In this study, the measurement of stress indicators such as MDA content (Fig. 6a), REC (Fig. 6b), and Y(NO) (Supplementary Fig. S2b) revealed that beach cowpea had significantly lower levels of these stress markers compared to cowpea.
These findings suggest that beach cowpea is better equipped to allocate solar energy captured by chlorophyll towards photosynthesis, thereby reducing energy transfer that leads to ROS generation. This efficient management of photosynthetic energy, along with lower membrane damage and oxidative stress, highlights beach cowpea's enhanced drought tolerance compared to cowpea. The lower stress levels and more efficient photosynthetic apparatus in beach cowpea can be attributed to its robust root activity and sustained transpiration rate, which work in coordination to ensure efficient water flow from both root and shoot systems.
Molecular mechanism by transcriptome analysis
-
Building on the foundational physiological mechanisms that contribute to beach cowpea's tolerance to drought stress, we further explored the underlying molecular mechanisms by analyzing the root transcriptomes of cowpea and beach cowpea, supplemented with GO enrichment and WGCNA analyses.
Gene expression in cowpea and beach cowpea significantly changed under drought stress induced by 6% PEG for 1 and 6 d compared to the 0-d control. GO term analysis was employed to identify root gene sets functioning within the same or related pathways, particularly those responding to drought stress. These genes were enriched in categories related to plant stress response, carbohydrate, and cell wall metabolism, and DNA-protein binding (Supplementary Tables S7 & S8), which are commonly identified in GO analyses of drought-induced transcriptomes. After 1 d of drought treatment, the majority of DEGs in both cowpea (Vm) and beach cowpea (Vu) roots were similarly categorized within several molecular function (MF) groups, (Fig. 7b & c). This similarity might be attributed to the genetic likeness between the two Vigna species and cowpea's moderate drought tolerance[30,52,72]. However, significant differences emerged with the 6-d drought treatment, where gene sets exhibited much more pronounced differences between Vm and Vu compared to their 1-d counterparts (Supplementary Tables S9, S10; Fig. 7d & e). Unique categories enriched in Vm roots included 'lipid metabolic process,' 'cell wall macromolecule catabolic process,' 'chitin catabolic process' (BP), 'endopeptidase inhibitor activity,' and 'chitinase activity' (MF). These processes are associated with cell wall composition and integrity, which are known to be involved in plant responses to drought stress[21]. Among these categories, the metabolism of chitin, a crucial cell wall component known for its role in plant immunity, has also been implicated in responses to abiotic stress and has caught our attention[87,88]. For instance, chitinase gene expression is induced by drought stress in Chinese cabbage and soybean, suggesting a conserved role for chitinase in drought response across plant species[87,88]. Analysis of cis-regulatory elements in soybean chitinase genes revealed the presence of elements responsive to JA, ABA, SA, GA, and MYB/MYC binding sites, further confirming that chitinase gene expression can be induced by drought stress[88]. Furthermore, treatment with chitosan, a natural biopolymer derived from chitin, has been shown to alleviate water stress by enhancing the production of antioxidant enzymes, promoting root growth for improved water absorption, and enhancing photosynthetic activity[89]. These studies suggest that chitin metabolism may be uniquely associated with the drought tolerance of beach cowpea, distinguishing it from cowpea. Additionally, functional categories enriched in 1-d-treated Vu but not in 1-d-treated Vm were found in 6-d-treated Vm, such as 'glucan metabolic process' (BP), 'xyloglucan transferase activity' (MF), 'apoplast,' and 'cell wall' (CC) (Fig. 7b−e), implying that Vm's long-term adaptation to adverse environments has enhanced its threshold for coping with such conditions.
To characterize the molecular differences underlying drought-responsive performance between cowpea and beach cowpea, we analyzed DEHGs in Vm and Vu under drought stress. Several homologous drought-inducible marker genes in Vm and Vu were found to be differentially expressed, involving transcription factors, kinases, antioxidant enzymes, and genes associated with plant hormones such as ABA and GA. For example, Vm01g00581 and Vu03G368600, homologs of AtABIG1 (AT4G37790), exhibited differential expression (Supplementary Table S12). AtABIG1 encodes a HOMEODOMAIN-LEUCINE ZIPPER (HD-ZIP) transcription factor, whose induced expression mimics ABA treatment and regulates a set of genes implicated in stress responses[63,90]. However, it does not promote ABA-induced stomatal closure[63], consistent with our physiological findings of relatively higher stomatal conductance and transpiration rates in beach cowpea leaves (Fig. 5d & f). The expression pattern and function of Vm1G00581 in the leaf and other tissues of beach cowpea warrant further investigation. Another pair of homologs, Vm01g00793 but not Vu03G347300, associated with the drought tolerance gene AtDRS1 (AT1G80710), upregulated under 1-d treatment of drought stress (Supplementary Table S12). Drs1, a WD-40 repeat family protein containing a DWD (DDB1 binding WD40) motif, has been shown to promote drought tolerance in Arabidopsis, potentially mediated by ABA[62].
In addition, gibberellin also contributes to beach cowpea's adaptation to drought stress. The expression of Vm11g01014, but not Vu05G157300—both homologs of ATGA2OX1 (AT1G78440)—was significantly enhanced after 1 d of PEG6000 treatment (Supplementary Table S12)[64]. In transgenic maize, overexpression of AtGA2OX1 decreased GA1 and malondialdehyde (MDA) levels, while increasing proline, soluble sugars, and antioxidant enzyme activities, closely mirroring the physiological responses observed in beach cowpea in this study[91]. Moreover, overexpression of AtGA2OX1 altered the expression of multiple genes related to the internal antioxidant system and maintenance of cell osmotic potential in transgenic maize.
The plant-specific NAC (NAM, ATAF1/2, and CUC2) TFs play a vital role in drought stress response[92]. Several NAC homologous genes, such as AtNAC11, AtNAC32, AtNAC73, and AtNAC78, were differentially expressed in cowpea and beach cowpea under drought stress (Supplementary Table S20). Among these, Vm01g04345 and Vu03G057900, homologs of AtNAC32 (AT1G77450), were particularly noteworthy. The expression of Vm01g04345 was upregulated, while Vu03G057900 showed no significant change after 6 d of treatment (Supplementary Table S16). AtNAC32 has been reported as a negative regulator of drought tolerance in Arabidopsis, and its expression is induced by ROS production in roots and regulates downstream genes such as MYB30[93]. However, in transgenic Arabidopsis ectopically expressing Haloxylon ammodendron NAC1, AtNAC32, in conjunction with HaNAC1, promoted growth and drought tolerance, suggesting a potential positive regulatory function in drought tolerance[65]. In beach cowpea, where Vm01g04345 expression is higher, we did not observe early senescence compared to cowpea, indicating that the complex function and mechanism of this gene homolog deserve further investigation.
WGCNA was utilized to understand the crosstalk and coordination among root genes in response to drought stress. Gene expression in Vm and Vu roots treated with 6% PEG6000 for 6 d was correlated with physiological traits, identifying 22 distinct modules in Vm (Fig. 8a; Supplemental Table S24) and 10 different modules in Vu (Fig. 9a; Supplemental Table S25). The higher levels of physiological traits such as leaf wilting rate, root activities, and antioxidant enzyme activities—including SOD, POD, and CAT—as well as soluble sugar, soluble protein, and free proline in the roots, indicated higher stress levels, while higher RWC content in leaves suggested lower stress levels. This allowed us to identify WGCNA modules negatively and positively associated with drought tolerance. The gene models in these modules hold potential as candidates for conferring drought adaptability or susceptibility in beach cowpea and cowpea.
By combining WGCNA-marked modules with DHEGs between the two Vigna species, we further explored the molecular mechanisms underlying beach cowpea root responses to drought stress. Notably, Vm01g00288 and Vu03G397600, homologs of AtLEA3, were upregulated and downregulated in drought treatments. Vm01g00288 and Vu03G397600 were present in the drought-tolerant yellow module in Vm and the drought-sensitive turquoise module in Vu, respectively, showing opposite relationships to plant performance under drought stress (Supplementary Table S20). This is consistent with the reported positive regulatory role of AtLEA3 in drought tolerance, where its overexpression has been shown to enhance the expression of SOD1 and LOX2, two genes related to ROS metabolism[16]. In this study, we found that the expression of Vm11g00890, but not Vu10G146700—homologs of another LOX gene, AtLOX4 (AT1G72520)—was significantly increased (Supplementary Table S16)[66]. Additionally, Vm01g01386, but not Vu03G289900, the homologs of Arabidopsis Cu/Zn superoxide dismutase (SOD), was upregulated after 6 d of drought treatment (Supplementary Table S16). This gene is a chaperone required for the activity of Cu/Zn SOD[94]. Whether the two genes are key players in ROS metabolism and are regulated by Vm01g00288 (beach cowpea LEA3) in beach cowpea under drought stress is an interesting question for future investigation.
Notably, a cluster of three tandem XTH homolog genes in Vu (Vu03G359200, Vu03G359300, Vu03G359400), but not in Vm (Vm01g00669, Vm01g00670, Vm01g00671), were all downregulated after both 1 d and 6 d of treatment (Supplementary Table S23). All three XTH genes in Vu are present in the turquoise module (drought-susceptible), while two out of three homologous genes in Vm are found in the tolerant blue and green modules (Supplementary Table S23, Figs 8b & 9b). It has been reported that an increased level of XTH activity can maintain cell wall plasticity, which is a well-recognized drought stress adaptative mechanism in plants[21]. Therefore, we suggest that plant cell wall physiology, involving XTH and chitin, also plays a significant role in the drought tolerance of beach cowpea roots.
Conclusions
-
This study sheds light on the unique adaptive responses of Vigna marina (beach cowpea) to drought stress, highlighting critical physiological and molecular mechanisms underlying its superior drought tolerance compared to its close relative, Vigna unguiculata (cowpea). Physiologically, the root system of V. marina exhibits enhanced activity, improved cellular homeostasis, increased osmolyte accumulation, and heightened antioxidant enzyme activity. Its leaf system exhibits an unusual drought response, with higher stomatal conductance and transpiration rates, facilitating sustained water transport and leaf performance under water-deficient conditions.
At the molecular level, V. marina exhibits a distinct transcriptomic profile, with enrichment of genes related to cell wall composition and integrity, suggesting an adaptive mechanism for maintaining root structure under drought. Several key drought-inducible genes, such as ABIG1, ANAC32, GA2OX1, CIPK15, PP2C49, and DRS1, were identified, implicating their roles in transcription regulation, signaling pathways (notably ABA and GA), and oxidative stress management. WGCNA revealed gene modules specifically associated with drought tolerance in V. marina, with genes like LEA3, LOX4, SODC, and a cluster of XTH genes standing out as crucial contributors to its drought resilience.
These findings provide valuable genetic resources for breeding drought-tolerant crops, offering a foundation for incorporating the adaptive traits of V. marina into V. unguiculata or other leguminous crops. By understanding the physiological and molecular frameworks of drought tolerance in V. marina, this study paves the way for the development of resilient crop varieties in the face of increasing global water scarcity.
This work was supported by the Central Public-interest Scientific Institution Basal Research Fund (1630032024032,1630032024005), the earmarked fund for CARS (CARS-Z22), and the Hainan Province Natural Science Foundation of China (322QN394). We extend our warm thanks to Ms. Wei Yang for her invaluable assistance with data collection, and we are deeply grateful to Dr. Danyu Kong and Dr. Yan Xie for their insightful feedback on the manuscript.
-
The authors confirm contribution to the paper as follows: study design, experiment conducting, manuscript writing: Liu Y, Wang Z; study conception, investigation, supervision: Liu Y, Huan H; data analysis offering critical insight: Shen W, Lohano N, Wang P, Ye X; manuscript review, editing: Liu G, Atieno M, Thi HD, Nghia NK, Yan L, Huan H. All authors reviewed the results and approved the final version of the manuscript.
-
The datasets generated during and/or analyzed during the current study are available from the corresponding author on reasonable request.
-
The authors declare that they have no conflict of interest.
-
# Authors contributed equally: Yiming Liu, Zhibo Wang
- Supplementary Table S1 The transcriptome sequencing statistics of 18 libraries.
- Supplementary Table S2 Summary of the number of DEGs.
- Supplementary Table S3 Detailed information of significant DEGs in the comparison between Vm1d and Vm0d.
- Supplementary Table S4 Detailed information of significant DEGs in the comparison between 1d and 0d.
- Supplementary Table S5 Detailed information of significant DEGs in the comparison between Vm6d and Vm0d.
- Supplementary Table S6 Detailed information of significant DEGs in the comparison between Vu6d and Vu0d.
- Supplementary Table S7 Significant GO term functional enrichment in transcriptomes comparing Vm1d to Vm0d.
- Supplementary Table S8 Significant GO term functional enrichment in transcriptomes comparing Vu1d and Vu0d.
- Supplementary Table S9 Significant GO term functional enrichment in transcriptomes comparing Vm6d and Vm0d.
- Supplementary Table S10 Significant GO term functional enrichment in transcriptomes comparing Vu6d and Vu0d.
- Supplementary Table S11 Summary of the number of DEHGs.
- Supplementary Table S12 Detailed information on Vm up-regulated and Vu down-regulated or non-significantly changed DEHGs after 1 day of treatment.
- Supplementary Table S13 Detailed information on Vm down-regulated and Vu up-regulated or non-significantly changed DEHGs after 1 day of treatment.
- Supplementary Table S14 Detailed information on Vu up-regulated and Vm down-regulated or non-significantly changed DEHGs after 1 day of treatment.
- Supplementary Table S15 Detailed information on Vu down-regulated and Vm up-regulated or non-significantly changed DEHGs after 1 day of treatment.
- Supplementary Table S16 Detailed information on Vm up-regulated and Vu down-regulated or non-significantly changed DEHGs after 6 days of treatment.
- Supplementary Table S17 Detailed information on Vm down-regulated and Vu up-regulated or non-significantly changed DEHGs after 6 days of treatment.
- Supplementary Table S18 Detailed information on Vu up-regulated and Vm down-regulated or non-significantly changed DEHGs after 6 days of treatment.
- Supplementary Table S19 Detailed information on Vu down-regulated and Vm up-regulated or non-significantly changed DEHGs after 6 days of treatment.
- Supplementary Table S20 Detailed information on Vm up-regulated and Vu down-regulated or non-significantly changed DEHGs overlapping between 1-day and 6-day treatments.
- Supplementary Table S21 Detailed information on Vm down-regulated and Vu up-regulated or non-significantly changed DEHGs overlapping between 1-day and 6-day treatments.
- Supplementary Table S22 Detailed information on Vu up-regulated and Vm down-regulated or non-significantly changed DEHGs overlapping between 1-day and 6-day treatments.
- Supplementary Table S23 Detailed information on Vu down-regulated and Vm up-regulated or non-significantly changed DEHGs overlapping between 1-day and 6-day treatments.
- Supplementary Table S24 Vm gene modules in WGCNA.
- Supplementary Table S25 Vu gene modules in WGCNA.
- Supplementary Fig. S1 Beach cowpea leaves retain higher levels of (A) chlorophyll a and (B) chlorophyll b than cowpea under PEG6000-induced drought stress. The content of chlorophyll a and b were determined to in leaves of cowpea and beach cowpea plants treated with 0%, 3%, 6%, and 9% PEG6000 for 3, 6, 9, and 12 days. Each experiment included three biological replicates. Different letters indicate statistically significant differences (p ≤ 0.05).
- Supplementary Fig. S2 The effects of PEG6000-induced drought stress on (A) ΦPSII, (B) Y(NO) were evaluated in leaves of cowpea and beach cowpea plants treated with 0%, 3%, 6%, and 9% PEG6000 for 3, 6, 9, and 12 days. ΦPSII is the quantum yield of electron transfer at PSII, indicating the overall efficiency of PSII reaction centers in the light. Y(NO) is the unregulated, non‐radiative dissipation of excitation energy. Each experiment included three biological replicates. Different letters indicate statistically significant differences (p ≤ 0.05).
- Supplementary Fig. S3 Detailed information on PCA and WGCNA analyses of 9 Vm RNA-seq samples. (A) Principal Component Analysis (PCA) results of all 9 RNA-seq samples from Vm. (B) Sample clustering to detect outliers. Eight samples are within the clusters and meet the cutoff thresholds. (C) Soft-thresholding power analysis to obtain the scale-free fit index of network topology. (D) Scale-free topology when the soft-thresholding power β = 12.
- Supplementary Fig. S4 Detailed information on PCA and WGCNA analyses of 9 Vu RNA-seq samples. (A) Principal Component Analysis (PCA) results of all 9 RNA-seq samples from Vu. (B) Sample clustering to detect outliers. Seven samples are within the clusters and meet the cutoff thresholds. (C) Soft-thresholding power analysis to obtain the scale-free fit index of network topology. (D) Scale-free topology when the soft-thresholding power β = 26.
- Copyright: © 2025 by the author(s). Published by Maximum Academic Press, Fayetteville, GA. This article is an open access article distributed under Creative Commons Attribution License (CC BY 4.0), visit https://creativecommons.org/licenses/by/4.0/.
-
About this article
Cite this article
Liu Y, Wang Z, Liu G, Shen W, Lohani N, et al. 2025. Physiological and molecular insights into adaptive responses of Vigna marina to drought stress. Grass Research 5: e006 doi: 10.48130/grares-0025-0003 

Physiological and molecular insights into adaptive responses of Vigna marina to drought stress
- Received: 02 December 2024
- Revised: 06 January 2025
- Accepted: 09 January 2025
- Published online: 24 February 2025
Abstract: Drought is one of the most challenging environmental stress factors for grassland ecosystems. We evaluated drought responses of beach cowpea (Vigna marina, Vm) using PEG6000 and found that Vm exhibits significantly greater drought tolerance than its close relative, cowpea (Vigna unguiculata, Vu). Vm's superior drought tolerance is linked to increased root activity, enhanced cellular homeostasis, higher osmolyte accumulation, and antioxidant enzyme activity. Additionally, the leaf system of Vm shows an unusual physiological response to drought, maintaining higher stomatal conductance and transpiration rates than Vu, which facilitates water transport and sustains leaf performance under stress. Root transcriptomes that underwent GO enrichment analysis showed significant enrichment genes related to cell wall composition and integrity in Vm, but not in Vu, suggesting a key difference in their drought response. By analyzing differentially expressed homolog genes (DEHGs) under drought conditions, we identified several drought-inducible marker genes including ABIG1, ANAC32, GA2OX1, CIPK15, PP2C49, and DRS1. These genes encode transcription factors, kinases, and antioxidant enzymes, with some involved in the ABA and GA signaling pathways, highlighting the complex mechanisms by which Vm adapts to drought stress. WGCNA identified 22 gene modules in Vm and 10 in Vu, each showing positive or negative associations with drought tolerance based on their correlation with physiological traits. Key DEHGs like LEA3, LOX4, SODC, and a cluster of XTH genes were found in these modules, highlighting distinct molecular responses to drought between the two species. This study uncovers key physiological and molecular mechanisms behind Vm's drought tolerance and provides valuable genetic resources for breeding drought-tolerant crops.
-
Key words:
- Vigna marina /
- Vigna unguiculate /
- Drought stress /
- Root activity /
- Transpiration /
- Transcriptomics /
- WGCNA