Processing math: 100%
REVIEW   Open Access    

Secondary metabolites of medicinal use in Hypericum spp.: a rich history and a promising future

More Information
  • The genus Hypericum, which comprises over 450 species worldwide, has a long history of use in traditional medicine. It is now known for its antidepressant, antiviral, antibacterial, and anticancer properties. This review summarizes the current knowledge on the biosynthesis of the main bioactive secondary metabolites responsible for the pharmaceutical applications of plants, particularly hypericin and hyperforin. In addition, this review highlights the importance of other chemical constituents in Hypericum, such as xanthones and flavonoids, which contribute to the pharmacological potential of the genus. Hypericin, a naphthodianthrone, has been shown to have remarkable pharmacological effects, particularly as a potential anticancer agent. On the other hand, hyperforin, a polyprenylated acylphloroglucinol, has been identified as a potent antidepressant. Recent advances in transcriptomics, metabolomics, and genomics have identified novel genes and enzymatic pathways that facilitate the biosynthesis of these compounds, providing valuable insights into their formation. Despite these advances, further research is essential to fully characterize the biosynthetic pathways and optimize the production of bioactive compounds in Hypericum species.
  • Agricultural management practices impact soil physicochemical properties to a remarkable extent. Degradation of soil health has led to a contraction in agricultural production and soil biodiversity particularly due to conventional farming practices, indiscriminate use of inorganic fertilizers (INF) and inadequate input of residues[1]. Organic or inorganic fertilizers have been regarded as a critical component of agriculture to accomplish global food security goals[2]. The exogenous supply of fertilizers could easily alter soil properties by restoring the nutrients that have been absorbed by the plants[2]. Thus, implementing adequate nutrient management strategies could boost plant yield and sustain plant health. Tillage affects the soil, especially for crop production and consequently affects the agro-ecosystem functions. This involves the mechanical manipulation of the soil to modify soil attributes like soil water retention, evapotranspiration, and infiltration processes for better crop production. Thus, tillage practices coupled with fertilizer inputs may prove a viable strategy to improve soil health components such as nutrient status, biodiversity, and organic carbon.

    Soil serves as a major reservoir of nutrients for sustainable crop production. Intensive cultivation due to growing population burden has led to the decline of soil nutrient status that has adversely affected agricultural production. Various researchers have assessed the soil nutrient budget and the reasons behind decline of nutrient content in soil[3]. Soil management strategies have assisted in overcoming this problem to a greater extent. Tillage practices redistribute soil fertility and improve plant available nutrient content due to soil perturbations[4]. Different tillage and fertilization practices alter soil nutrient cycling over time[5]. Fertilization is an important agricultural practice which is known to increase nutrient availability in soil as well as plants[6]. A report has been compiled by Srivastava et al.[7], which assessed the effectiveness of different fertilizers on soil nutrient status in Indian soils.

    Soil biota has a vital role in the self-regulating functions of the soil to maintain soil quality which might reduce the reliance on anthropogenic activities. Soil microbial activities are sensitive to slight modifications in soil properties and could be used as an index of soil health[8]. Maintenance of microbial activity is essential for soil resilience as they influence a diverse range of parameters and activities including soil structure formation, soil SOM degradation, bio-geochemical cycling of nutrients etc.[9]. Various researchers have identified microbial parameters like microbial biomass carbon (MBC), potentially mineralizable nitrogen (PMN), soil respiration, microbial biomass nitrogen (MBN), and earthworm population as potential predictors of soil quality. Geisseler & Scow[10] have compiled a review on the affirmative influence of long-term mineral fertilization on the soil microbial community.

    Being the largest terrestrial carbon (C) reservoir, soil organic carbon (SOC) plays a significant role in agricultural productivity, soil quality, and climate change mitigation[11]. Manure addition, either solely or along with INF augments SOC content which helps in the maintenance and restoration of SOM more effectively as compared to the addition of INF alone[12]. Enhancement of recalcitrant and labile pools of SOC could be obtained through long-term manure application accentuating the necessity of continuous organic amendments for building up C and maintaining its stability[13]. Generally, compared with manure addition, INF application is relatively less capable of raising SOC and its labile fractions[14]. Alteration in SOC content because of management strategies and/or degradation or restoring processes is more prominent in the labile fraction of soil C[15]. Several fractions of soil C play vital roles in food web and nutrient cycles in soils besides influencing many biological properties of soil[16]. Thus, monitoring the response of SOC and its fractions to various management practices is of utmost importance.

    A positive impact on SOC under manure application coupled with INF in rice-wheat systems has been reported, as compared to sole applications of INFs[17]. Although ploughing and other mechanical disturbances in intensive farming cause rapid OM breakdown and SOC loss[18], additional carbon input into the soil through manure addition and rational fertilization increases carbon content[13]. Wei et al.[19] in light sandy loam soil of China found that the inclusion of crop straw together with inorganic N, P and K fertilizers showed better results for improving soil fertility over sole use of inorganic fertilizers. Zhu et al.[20] studied the influence of soil C through wheat straw, farmyard manure (FYM), green manure, and rice straw on plant growth, yield, and various soil properties and found that the recycling of SOM under intensive cultivation is completely reliant on net OM input and biomass inclusion. However, most of the studies on residue management and organically managed systems could not provide clear views regarding the relations between the quality of OM inputs and biological responses towards it. The disintegration of soil aggregates due to ploughing, use of heavy machinery, and residue removal has been reported widely under conventional tillage (CT) practices[21]. On the contrary, improvement in SOC stabilization has also been observed by some scientists[22]. Under CT, the disintegration of macro-aggregates into micro-aggregates is a prominent phenomenon, while conservation tillage has been identified as a useful practice for increasing macro-aggregates as well as carbon sequestration in agricultural soils[23]. By and large, the ploughing depth (0–20 cm) is taken into consideration for evaluating the impact of tillage and straw retention on soil aggregation[24], while degradation in deeper layers of soil is becoming a major constraint towards soil quality together with crop yield[25].

    Hence, the present review would be useful in determining how tillage practices and inorganic and organic fertilization impact nutrient availability in the soil, microbial composition and SOC fractions besides stocks under different land uses.

    Agricultural production is greatly influenced by nutrient availability and thus nutrient management is required for sustaining higher yields of crop. The term 'nutrient availability' refers to the quantity of nutrients in chemical forms accessible to plant roots or compounds likely to be converted to such forms throughout the growing season in lieu of the total amount of nutrients in the soil. For optimum growth, different crops require specifically designed nutrient ratios. Plants need macronutrients [nitrogen (N), phosphorus (P), potassium (K) in higher concentrations], secondary nutrients [calcium (Ca), magnesium (Mg), sulphur (S) in moderate amounts as compared to macronutrients] and Micronutrients [Zn (zinc), Fe (iron), Cu (copper), B (boron), Mn (manganese), Mo (molybdenum) in smaller amounts] for sustainable growth and production[26]. Fertilizers assist the monitoring of soil nutrient levels by direct addition of required nutrients into the soil through different sources and tillage practices may alter the concentration of available plant nutrients through soil perturbations. Various studies on the influence of fertilization and tillage practices on available plant nutrients have been discussed below.

    Yue et al.[27] reported that long-term fertilization through manure/INF improved the macronutrient content of Ultisol soil in China. Two doses of NPK (2NPK) considerably improved soil properties over a single dose (NPK). Combined application (NPK + OM) resulted in higher hydrolysable N and available P over the sole OM application. The total K content was higher under the treatments NPK, 2NPK and NPK + OM than sole OM treatment, whereas available K was higher in treatments NPK + OM and 2NPK over the sole OM and NPK. Likewise, OM, INF, and OM + INF were evaluated for their potential to regulate the soil macronutrient dynamics. Organic manure significantly improved the soil N content, whereas INF showed comparable results to that of the control treatment. Besides, all the treatments improved available P and exchangeable K concentration[28].

    Hasnain et al.[29] performed comparative studies of different ratios of INF + compost and different application times for the chemical N fertilizer on silty loamy soils of China. The available nitrogen and phosphorous content were greater in conjoint OM + INF application over the bare INF and control application irrespective of N application time. Soil quality substantially improved with increasing ratio of compost and 70:30 (INF to compost ratio) was found to be most suitable to maintain soil fertility and nutrient status. Another study by Liu et al.[30] reported the superior effects of NPK + pig manure and NPK + straw to improve soil available P and K over the control and sole NPK treatments. However, total N concentration did not exhibit any significant variation under any treatment.

    Shang et al.[31] accounted the positive impact of vermicompost and mushroom residue application on grassland soil fertility in China. The addition of organic manures improved available P and K content to a considerable extent. Under moisture-deficit winter wheat-fallow rotation, another study quantified the influence of residue management approaches and fertilizer rate on nutrient accrual. Residue burning resulted in no decline in soil macronutrient content, whereas the perpetual addition of FYM for 84 years significantly improved total N and extractable K and P concentration. Thus, residue incorporation along with FYM application may prove beneficial in reducing the temporal macronutrient decline[32].

    Ge et al.[33] examined the effects of NPK and NPK along with manure (NPKM) addition on the macronutrient status of Hapli-Udic Cambisol soil. The NPKM application resulted in the highest increase in total N, available-P and K concentration as compared to NPK and control. Likewise, mineral fertilization reduction and partial substitution with organic amendments have posed a significant influence on soil macronutrient status. Soil available P and K decreased after INF reduction[34]. Chen et al.[35] evinced that integrated application of manure and mineral fertilizers to red clay soil (typical Ultisols) improved hydrolyzed nitrogen and available P due to an increase in the decomposition of organic matter (OM) and N bio-fixation than sole mineral fertilizers and control.

    A long-term experiment was carried out out by Shiwakoti et al.[36] to ascertain the influence of N fertilization and tillage on macronutrient dynamics in soil. Nitrogen fertilization produced higher crop biomass which might have improved total N and P concentration in soil. Moreover, the reduced interaction between soil colloids and residue or greater cation exchange sites due to tillage practices could have augmented K concentration in 0−10 cm soil depth. Likewise, among tillage systems combined organic (poultry manure) and inorganic (lime and fertilizers) fertilization, no-tillage, and reduced tillage with organic fertilization resulted in higher availability of P owing to minimal disturbance of soil which decreases contact surface between phosphate ions and adsorption sites. Greater losses of K in runoff water under NT resulted in lower K availability under NT than CT[37].

    The influence of tillage systems on soil nutrient dynamics showed that minimal soil disturbances under zero tillage prohibited redistribution of soil nutrients and resulted in the highest available N, P, and K in the surface soil[38]. The influence of tillage timing on soil macronutrient status has also been assessed under tillage treatments that are fall tillage (FT), spring tillage (ST), no tillage (NT), and disk/chisel tillage (DT/CT) on mixed mesic Typic Haploxerolls soil. All the tillage systems differed in the quantity of residues generated. Thus, variation in the decomposition of crop residue and mineralization of SOM resulted in variable rates of nutrient release. The FT and ST had the highest N content over DT/CT and NT systems at corresponding depth. The N content also decreased with soil depth irrespective of tillage treatment. The available P and extractable K were highest under NT at the top 10 cm soil depth and increased over time[39]. Residue management in combination with tillage treatments (ST and CT) has been reported to affect the soil macronutrient status in Bangladesh. Tillage treatments enhanced the total N content to a considerable extent. Moreover, 3 years of residue retention led to a higher concentration of total N, available P and K in the soil.

    The combinations of N, P, and K in different ratios together with two rates of organic fertilizer (OF) applied on the aquic Inceptisol having sandy loam texture influenced the micronutrient status of the soil[40]. Soil Zn content decreased with time when no fertilizer was applied as compared to organic fertilizer (OF) application. The mineral fertilizer treatments led to a substantial increase in DTPA-extractable micronutrients in the soil. The higher micronutrient concentration due to higher OM highlights the importance of maintaining OM for soil fertility and higher crop production. Further studies revealed that long-term application of sole N fertilizers led to a significant decline in total Zn and Cu, whereas Mn and Fe status improved through atmospheric deposition. Phosphorus and OF addition along with straw incorporation markedly increased total Zn, Cu, Fe, and Mn. The DTPA-extractable Mn, Zn, Fe, and Cu were also higher in OF treatment, thus demonstrating the beneficial effects of constant OM application for maintaining the nutrient status of soil[41].

    López-Fando & Pardo[42] quantified the impact of various tillage practices including NT, CT, minimum tillage (MT), and zone-tillage (ZT) on soil micronutrient stocks. Tillage systems did exhibit a significant influence on plant available Fe stocks in the topsoil; however, diminished with depth under ZT, NT and MT. Manganese was higher in NT and ZT at all depths and increased with soil depth. Zinc was highest under NT and other results did not vary significantly as in the case of Cu. The SOC levels were also found to be responsible to affect micronutrients due to tillage practices. Likewise, in Calciortidic Haploxeralf soil the distribution of soil micronutrients (Zn, Mn, Fe, Cu) was ascertained under different tillage practices (CT, MT, and NT). The micronutrient status was highest under NT in the upper layers due to the higher SOC level[43].

    Sharma & Dhaliwal[44] determined that the combined application of nitrogen and rice residues facilitated the transformation of micronutrients (Zn, Mn, Fe, Cu). Among different fractions, the predominant fractions were crystalline Fe bound in Zn, Mn, and Cu and amorphous Fe oxide in Fe with 120 kg N ha˗1 and 7.5-ton rice residue incorporation. The higher content of occluded fractions adduced the increment in cationic micronutrient availability in soil with residue incorporation together with N fertilization due to increased biomass. Rice straw compost along with sewage sludge (SS) and INF also affected the micronutrient availability under the RW cropping system. Nitrogen fertilization through inorganic fertilizers and rice straw compost and sewage sludge (50% + 50%) improved soil micronutrient status due to an increase in SOM over sole NPK fertilizers[45]. Earlier, Dhaliwal et al.[46] in a long-term experiment determined that different combinations of NPK along with biogas slurry as an organic source modified the extractable micronutrient status of the soil.

    A comparative study was carried out by Dhaliwal et al.[47] to ascertain the long-term impact of agro-forestry and rice–wheat systems on the distribution of soil micronutrients. The DTPA-extractable and total Cu, Zn, Fe, and Mn were greater in the RW system due to the reduced conditions because of rice cultivation. Under the RW system Zn removal was higher which was balanced by continuous Zn application. The higher availability of Fe under the RW system was due to reduced conditions. Contrarily, Mn was greater under the agro-forestry system owing to nutrient recycling from leaf litter.

    The long-term impact of integrated application of FYM, GM, WCS (wheat-cut straw) and INF on the soil micronutrients (Zn, Mn, Cu, and Fe) have been studied by Dhaliwal et al.[48]. The FYM application substantially improved DTPA-extractable Zn status followed by GM and WCS, whereas Cu content was maximum in the plots with OM application. The highest Fe concentration was recorded in treatment in which 50% recommended N supplied through FYM. This could be ascribed to the release of micronutrients from OM at low soil pH.

    Shiwakoti et al.[49] studied the dual effects of tillage methods (MP, DP, SW) and variable rates of N (0, 45, 90, 135 and 180 kg ha−1) on the distribution of micronutrients under a moisture-deficit winter wheat-fallow system. The soil Mn content was highest under the DP regime. Inorganic N application reduced Cu content in the soil. Comparative studies with adjacent undisturbed grass pasture indicated the loss of Zn and Cu to a significant extent. Thus, DP along with nitrogen added through inorganic fertilizers could improve micronutrient concentration in the soil. Moreover, the results implied that long-term cultivation with nitrogen fertilization and tillage results in the decline of essential plant nutrients in the soil. Thus, organic amendments along with INF may prove an effective approach to increase soil micronutrient content. In another study conducted by Lozano-García & Parras-Alcántara[50] tillage practices such as NT under apple orchard, CT with the wheat-soybean system and puddling (PD) in the rice-rice cropping system were found to affect nutrient status. Under CT, Cu content was lowest and Zn content was highest. On the contrary, puddling caused an increase in Fe and Mn concentration owing to the dispersion of soil aggregates which reduced the percolation of water and created an anaerobic environment thereby enhancing the availability of Fe and Mn.

    Tillage practices along with gypsum fertilization have been known to affect secondary nutrient concentrations in soil. In a long-term experiment, FYM application showed maximum response to increased S concentration due to the maximum addition of OM through FYM over other treatments as S is an essential component of OM and FYM[32]. Higher Mg content was recorded in FYM and pea vine treatments because the application of organic matter through organic manure or pea vines outright led to Mg accrual. The lower Mg concentration in topsoil than the lower layers was due to the competition between Mg and K for adsorbing sites and thus displacement of Mg by K. Han et al.[28] while ascertaining the impact of organic manures and mineral fertilizers (NPK) on soil chemical attributes determined that INF application reduced exchangeable calcium, whereas no significant changes were exhibited in the magnesium concentrations. The OM application significantly increased both the calcium and magnesium concentrations in the soil.

    While ascertaining the effect of different tillage treatments such as CT, NT, and MT on exchangeable and water-soluble cations, Lozano-García & Parras-Alcántara[50] recorded that NT had greater content of exchangeable Ca2+ and Mg2+ than MT and CT. The exchangeable Ca2+ decreased with depth, however, opposite results were observed for Mg2+ which might be due to the higher uptake of Mg2+ by the crop. On another note, there might be the existence of Mg2+-deficient minerals on the surface horizon. Alam et al.[51] studied the temporal effect of tillage systems on S distribution in the soil and observed that available S was 19%, 31%, and 34% higher in zero tillage than in minimum tillage, conventional tillage, and deep tillage, respectively.

    Kumar et al.[38] appraised the impact of tillage systems on surface soil nutrient dynamics under the following conditions: conventional tillage, zero till seeding with bullock drawn, conventional tillage with bullock drawn seeding, utera cropping and conservation tillage seeding with country plough and observed that tillage had a significant impact on the available S content. Compared with conventional tillage, zero and minimum tillage had higher S content as there was none or limited tillage operations which led to the accumulation of root stubble in the soil that decomposed over time and increased S concentration.

    Soil is considered a hotspot for microbial biodiversity which plays an important role in building a complex link between plants and soil. The microbial components exhibit dynamic nature and, therefore, are characterized as good indicators of soil quality[52]. These components include MBC, MBN, PMN and microbial respiration which not only assist in biological transformations like OM conversion, and biological nitrogen fixation but also increase nutrient availability for crop uptake. Management strategies such as fertilizer inputs and tillage practices may exert beneficial effects on soil biota as discussed below.

    Soil is an abode to a considerable portion of global biodiversity. This biodiversity not only plays a pivotal role in regulating soil functions but also provides a fertile ground for advancing global sustainability, especially agricultural ventures. Thus, the maintenance of soil biodiversity is of paramount importance for sustaining ecosystem services. Soil biodiversity is the diverse community of living creatures in the soil that interact not only with one another but also with plants and small animals to regulate various biological activities[53]. Additionally, it increases the fertility of soil by converting organic litter to SOM thereby enhancing SOC content. Thus, the SOM measures the number and activity of soil biota. Furthermore, the quality and amount of SOC, as well as plant diversity have a considerable impact on the soil microbial community structure[54].

    Dangi et al.[55] ascertained the impact of integrated nutrient management and biochar on soil microbial characteristics and observed that soil amended with biochar or the addition of organic manures influenced microbial community composition and biomass and crop yield. After two years, the higher rates of biochar significantly enhanced the levels of gram-positive and gram-negative bacterial phospholipid fatty acid (PLFA), total arbuscular mycorrhizal fungal (AMF) than lower rates, unfertilized and non-amended soil. Luan et al.[56] conducted a comparison study in a greenhouse to assess the effects of various rates of N fertilizer and kinds (inorganic and organic) on enzyme activities and soil microbial characteristics. Microbial growth (greater total PLFAs and microbial biomass carbon) and activity were promoted by manure substitution of mineral fertilizer, particularly at a higher replacement rate. On account of lower response in bacterial over fungal growth, manure addition led to a greater fungi/bacteria ratio. Furthermore, manure application significantly enhanced microbial communities, bacterial stress indicators and functional diversity. Lazcano et al.[57] determined the influence of different fertilization strategies on microbial community structure and function, soil biochemical properties and crop yield three months after addition of fertilizer. The integrated fertilizer regimes augmented microbial growth with improved enzyme activity as compared to sole inorganic amendments. Bacterial growth showed variable response with variation in fertilizer regime used whereas fungal growth varied with the amount of fertilizer added. Compared to mineral fertilizers, manure application led to a rapid increase in PLFA biomarkers for gram-negative bacteria. The organic amendments exhibited significant effects even at small concentration of the total quantity of nutrients applied through them; thus, confirming the viability of integrated fertilizer strategies in the short term.

    Kamaa et al.[58] assessed the long-term effect of crop manure and INF on the composition of microbial communities. The organic treatments comprised of maize (Zea mays) stover (MS) at 10 t ha−1 and FYM @ 10 t ha−1, INF treatments (120 kg N, 52.8 kg P-N2P2), integrated treatments (N2P2 + MS, N2P2 + FYM), fallow plot and control. The treatment N2P2 exhibited unfavourable effects on bacterial community structure and diversity that were more closely connected to the bacterial structure in control soils than integrated treatments or sole INF. In N2P2, fungal diversity varied differently than bacterial diversity but fungal diversity was similar in the N2P2 + FYM and N2P2 + MS-treated plots. Thus, the total diversity of fungal and bacterial communities was linked to agroecosystem management approaches which could explain some of the yield variations observed between the treatments. Furthermore, a long-term experiment was performed by Liu et al.[59] to study the efficiency of pig manure and compost as a source for N fertilization and found unique prokaryotic communities with variable abundance of Proteobacteria under compost and pig manure treatments.

    Recently, Li et al.[60] assessed the influence of different tillage practices (no-tillage, shallow tillage, deep tillage, no-tillage with straw retention, shallow tillage with straw retention and deep tillage with straw retention) on microbial communities and observed that tillage practices improved the bacterial Shannon index to a greater extent over the no-tillage plots in which the least value was recorded. Another research study by He et al.[61] reported the effect of tillage practices on enzyme activities at various growth stages. Across all the growth stages, enzyme activities of cellobiohydrolase (CBH), β-xylosidase (BXYL), alkaline phosphatase (AP), β-glucosidase (BG), β-N-acetylglucosamines (NAG) were 17%−169%, 7%−97%, 0.12%−29%, 3%−66%, 23%−137% greater after NT/ST, NT, ST, ST/PT, and PT/NT treatments as compared to plow tillage. The NT/ST treatment resulted in highest soil enzyme activities and yield, and thus was an effective and sustainable method to enhance soil quality and crop production.

    Microbes play a crucial role in controlling different soil functions and soil ecology and microbial community show significant variation across as well as within the landscape. On average, the total biomass of microbes exceeds 500 mg C kg soil−1[62]. Microbial biomass carbon is an active constituent of SOM which constitutes a fundamental soil quality parameter because SOM serves as a source of energy for microbial processes and is a measure of potential microbial activity[48,63]. Soil systems that have higher amounts of OM indicate higher levels of MBC. Microbial biomass carbon is influenced by many parameters like OM content in the soil, land use, and management strategies[64]. The MBC and soil aggregate stability are strongly related because MBC integrates soil physical and chemical properties responds to anthropogenic activities.

    Microbial biomass is regarded as a determinative criterion to assess the functional state of soil. Soils having high functional diversity of microbes which, by and large, occurs under organic agricultural practices, acquire disease and insect-suppressive characteristics that could assist in inducing resistance in plants[65]. Dou et al.[66] determined that soil microbial biomass C (SMBC) was 5% to 8% under wheat-based cropping systems and zero tillage significantly enhanced SMBC in the 0−30 cm depth, particularly in the upper 0 to 5 cm. According to Liang et al.[67], SMBC and soil microbial biomass N (SMBN) in the 0−10 cm surface layer were greater in the fertilized plots in comparison to the unfertilized plots on all sampling dates whereas microbial biomass C and N were highest at the grain filling stage. Mandal et al.[68] demonstrated that MBC also varied significantly with soil depth. Surface soil possessed a maximum MBC value than lower soil layers due to addition of crop residues and root biomass on the surface soil. The MBC content was highest with combined application of INF along with farmyard manure and GM, whereas untreated plots showed minimum MBC values. The incorporation of CR slows down the rate of mineralization processes; therefore, microbes require more time to decompose the residues and utilize the nutrients released[69]. On the other hand, incorporation of GR having a narrow C:N ratio enhances microbial activity and consequently accelerates mineralization in the soil. Malviya[70] also recorded that the SMBC contents were significantly greater under RT than CT, regardless of soil depth which was also assigned to residue incorporation which increases microbial biomass on account of higher carbon substrate in RT.

    Naresh et al.[71] studied the vertical distribution of MBC under no-tillage (NT), shallow (reduced) tillage and normal cultivated fields. A shallow tillage system significantly altered the tillage induced distribution of MBC. In a field experiment, Nakhro & Dkhar[72] examined the microbial populations and MBC in paddy fields under organic and inorganic farming approaches. The organic source used was a combination of rock phosphate, FYM and neem cake, whereas a mixture of urea, muriate of potash and single super phosphate was used as an inorganic source. The organically treated plots exhibited the highest MBC compared to inorganically treated plots and control. Organic carbon exhibited a direct and significant correlation with bacterial and fungal populations. The addition of organic fertilizers enhanced the content of SOC and consequently resulted in higher microbial count and MBC. Ramdas et al.[73] investigated the influence of inorganic and organic sources of nutrients (as minerals or INF) applied over a five-year period on SOC, MBC and other variables. It was observed that the addition of FYM and conjoint application of paddy straw (dry) and water hyacinth (PsWh) (fresh) significantly increased the SOC content than vermicompost, Chromolaena adenophorum (fresh) and Glyricidia aculeate (fresh), and Sesbania rostrata (fresh).

    Xu et al.[74] evaluated the influence of long-term fertilization strategies on the SOC content, soil MBN, soil MBC, and soil microbial quotient (SMQ) in a continuous rice system and observed that MBC at the main growth stages of early and late rice under 30% organic matter and 70% mineral fertilizer and 60% organic matter and 40% mineral fertilizer treatments was greater as compared to mineral fertilizer alone (MF), rice straw residues and mineral fertilizer (RF), and no fertilizer (CK) treatments. However, SMBC levels at late growth stages were greater in comparison to early growth stages. A recent study by Xiao et al.[75] demonstrated that increasing tillage frequency (no-tillage, semi-annual tillage, and tillage after every four months, two months, and one month) decreased soil MBC. Microbial biomass carbon content was significantly greater in no-till treatment (597 g kg−1) than in tillage every four months (421 g kg−1), two months (342 g kg−1) and one month (222 g kg−1). The decrease in the content of MBC in association with tillage practices is due to soil perturbations which enhanced soil temperature, diminished soil moisture content, and resulted in the destruction of microbial habitat and fungal hyphae. Therefore, the MBC content eventually affected the N cycle.

    Li et al.[76] reported that in comparison to CT, NT and RT resulted in increased MBC content and NT significantly increased MBC by 33.1% over CT. Furthermore, MBC concentration was 34.1% greater in NT than RT. The increase in MBC concentration was correlated with the results of increase in SOC concentration. Site-specific factors including soil depth and mean annual temperature significantly affected the response ratio of MBC under NT as compared to the duration of NT.

    Microbial biomass nitrogen (MBN) is a prominent indicator of soil fertility as it quantifies the biological status of soil. Soil MBN is strongly associated with organic matter of the soil. The nitrogen in MBN has a rapid turnover rate thereby reflecting the changes in management strategies way before the transformations in total N are discernable[77].

    In an experiment on continuous silage maize cultivation with crop rotation, Cerny et al.[78] observed that organic fertilizers exerted an affirmative influence on the soil MBN. During the application of organic manure MBN decreased, but there was higher MBN content as compared to control. However, addition of mineral nitrogenous fertilizers exerted an adverse effect on MBN content in experiments with maize. El-Sharkawi[79] recorded that organic matter-treated pots resulted in maximum MBN content than urea-treated pots. The sludge application enhanced total MBN and, therefore, could implicitly benefit crop production particularly in poor soils[18]. Sugihara et al.[80] observed that during the grain-filling stage in maize, residue and/or fertilizer addition exerted a pronounced influence on soil microbial dynamics; however, a clear effect of residue and ⁄or fertilizer addition was not observed. Microbial biomass nitrogen reduced dramatically from 63–71 to 18–33 kg N ha˗1 and C:N ratio at the same time increased more than ten-fold in all plots.

    Malik et al.[81] apprised that the organic amendments significantly enhanced MBN concentrations up to 50% more than the unamended soil. Wang et al.[82] evaluated the influence of organic materials on MBN content in an incubation and pot experiment with acidic and calcareous soils. The results revealed that MBN content which was affected by the different forms of organic amendments, increased by 23.37%−150.08% and 35.02%−160.02% in acidic and calcareous soils, respectively. The MBN content of both soils decreased with the increase in the C/N ratio of the organic materials, though a higher C/N ratio was effective for sustaining a greater MBN content for a very long time.

    Dhaliwal & Bijay-Singh[52] observed higher MBN levels in NT soils (116 kg ha−1) than in cultivated soils (80 kg ha−1). Kumar et al.[83] ascertained that in surface layer, MBN content was 11.8 mg kg−1 in CT which increased to 14.1 and 14.4 mg kg−1 in ZT and RT without residue retention and 20.2, 19.1 and 18.2 mg kg−1 in ZT, RT and CT with residue incorporation, respectively (Table 1). In the subsurface layer, the increased tendency on account of tillage and crop residue retention was identical to those of 0−15 cm layer but the magnitude was comparatively meagre (Table 1). In comparison to control, the persistent retention of crop residues led to significant accrual of MBN in the surface layer.

    Table 1.  Effect of different treatments on contents of various fractions of soil organic carbon[38].
    TreatmentsPMN (mg kg−1)MBC (mg kg−1)MBN (mg kg−1)DOC (mg kg−1)
    Depths (cm)
    0−1515−300−1515−300−1515−300−1515−30
    Tillage practices
    ZTR12.411.2562.5471.120.218.9198.6183.6
    ZTWR8.57.6350.4302.114.112.6167.1159.2
    RTR10.69.9490.2399.319.117.2186.4171.6
    RTWR7.66.6318.1299.814.413.7159.5148.7
    CTR9.38.5402.9354.418.216.6175.9168.9
    CT6.75.6307.9289.511.89.7142.5134.6
    Nitrogen management
    Control3.62.8218.3202.910.810.4103.792.3
    80 kg N ha−15.34.4241.1199.414.912.2128.3116.9
    120 kg N ha−18.97.6282.7220.916.516.1136.8123.6
    160 kg N ha−19.88.4343.9262.919.418.1164.8148.9
    200 kg N ha−110.49.7346.3269.622.721.7155.7136.4
    ZTR = Zero tillage with residue retention, ZTWR = Zero tillage without residue retention; RTR = Reduced tillage with residue retention, RTWR = Reduced tillage without residue retention, CTR = Conventional tillage with residue incorporation; CT = Conventional tillage without residue incorporation.
     | Show Table
    DownLoad: CSV

    Xiao et al.[75] determined that the MBN content decreased with tillage treatment having highest value in no tillage treatment, however, the difference among the treatments was negligible. Soil perturbations decreased the aggregate size and thus lower the soil aeration and exposure of fresh organic matter which restricted the growth of microorganisms. The results also concluded that MBN content is highly sensitive to tillage. Ginakes et al.[84] assessed the impact of zone tillage intensity on MBN in a corn-kura clover cropping sequence. Microbial biomass nitrogen was influenced by time and type of tillage treatment. Temporal studies revealed that MBN was higher after tillage treatment than the values possessed before tillage. Under different tillage treatments, higher values were recorded in ST (shank-till) and DT (double-till) over NT and RZT (zone-till) treatments.

    Another biological parameter, PMN, is a crucial parameter of soil fertility due to its association with soil N supply for crop growth. Also, PMN indicates the status of soil microbial community associated with PMN, whether it is improving or degrading. Forest soils are characterized by greater levels of PMN than CT receiving conventional chemical fertilizers which could be assignable to improved microbial activity in the former soils than the latter[48,77]. Aulakh et al.[85] assessed the effect of various combinations of fertilizer N, P, FYM and wheat residue (WR) applied to soybean and soybean residues added to wheat under CT and CA. The added fertilizers of N and P, FYM, and crop residue enhanced the mean weight diameter and water-stable aggregates thus favoured the development of macro-aggregates. The treatment INF + FYM + crop residue performed better among all the treatments. The net flux of mineral nitrogen from the mineralizable fraction is used to measure potentially mineralizable N which indicates the balance between mineralization and immobilization by soil microbes[77]. Nitrogen mineralization is widely used to assess the ability of SOM to supply inorganic nitrogen in the form of nitrate which is the most common form of plant-available nitrogen. Kumar et al.[83] observed an increase in PMN which was higher in surface soil than sub-surface soil thereby implying that high OC accumulation on account of crop residue retention was the most probable cause.

    Verma & Goyal[86] assessed the effect of INM and organic manuring on PMN and observed that PMN was substantially affected by different organic amendments. Potentially mineralizable nitrogen varied between 19.6−41.5 mg kg−1 soil with greater quantity (2.5%) in vermicompost applied plots than FYM treated plots. The INF treatments resulted in lower PMN content which could be due to nutrient immobilization by microbes. Mahal et al.[87] reported that no-till resulted in higher PMN content than conventional tillage treatments. This trend was due to the maintenance of SOM due to the residue cover and reduction of soil erosion under no-tillage system[88]. On the contrary, tillage practices led to the loss of SOC owing to loosened surface soil and higher mineralization of SOM.

    Soil respiration is referred as the sum of CO2 evolution from intact soils because of the respiration by soil organisms, mycorrhizae and roots[89]. Various researchers have proposed soil respiration as a potential indicator of soil microbial activity[52,77]. Gilani & Bahmanyar[90] observed that addition of organic amendments enhanced soil respiration more than the control and synthetic fertilizer treatments. Moreover, among organic amendment treatments, highest soil respiration was observed in sewage-sludge treated soils. Under controlled conditions in saline-sodic soil, Celis et al.[91] reported that sewage sludge resulted in a higher soil respiration rate than mined gypsum and synthetic gypsum. The application of gypsum because of minimal organic matter intake had little effect on soil respiration. The addition of organic matter especially during early spring led to higher microbial biomass and soil respiration albeit diminished levels of nitrate-N. Moreover, SOM hinders the leaching of nitrate ions thereby resulting in a better soil chemical environment[71].

    Faust et al.[92] observed that microbial respiration was associated with volumetric water content. The respiration declined with less availability of water, thus the lesser the tillage intensity, the more the volumetric water content which consequently resulted in higher microbial respiration. Another study by Bongiorno et al.[93] reflected the influence of soil management intensity on soil respiration. Reduced tillage practices resulted in 51% higher basal respiration than CT. Furthermore, this investigation suggested that microbial catabolic profile could be used as a useful biological soil quality indicator. Recently, Kalkhajeh et al.[94] ascertained the impact of simultaneous addition of N fertilizer and straw-decomposing microbial inoculant (SDMI) on soil respiration. The SDMI application boosted the soil microbial respiration which accelerated the decomposition of straw due to N fertilization. The C/N ratio did not affect the microbial respiration at elongation and heading stages, whereas N fertilization enhanced the microbial respiration to a greater extent than the unfertilized control. Additionally, the interaction between sampling time and basal N application significantly affected microbial respiration.

    Gong et al.[95] apprised the effect of conventional rotary tillage and deep ploughing on soil respiration in winter wheat and observed that deep ploughing resulted in a higher soil respiration rate than conventional rotary tillage. Soil moisture content and temperature are the dominating agents influencing soil respiration which is restricted by the soil porosity.

    Soil organic carbon plays a vital role in regulating various soil functions and ecosystem services. It is influenced by numerous factors like tillage practices and fertilization. Moreover, modified management practices may prove beneficial to avoid SOC loss by increasing its content. An exogenous supply of fertilizers may alter the chemical conditions of soil and thus result in transformation of SOC. Tillage practices lead to frequent soil disturbances which reduce the size of soil aggregates and accelerate the oxidation of SOC thereby reducing its content. The literature on the influence of fertilization and tillage practices on the transformation of SOC is discussed below.

    Soil organic carbon is a major part of the global carbon cycle which is associated not only with the soil but also takes part in the C cycling through vegetation, oceans and the atmosphere (Figs 1 & 2). Soil acts as a sink of approximately 1,500 Pg of C up to 1 m depth, which is greater than its storage in the atmosphere (approximately 800 Pg C) and terrestrial vegetation (500 Pg C) combined[96]. This dynamic carbon reservoir is continuously cycling in diverse molecular forms between the different carbon pools[97]. Fertilization (both organic and mineral) is one of the crucial factors that impart a notable influence on OC accretion in the soil. Many researchers have studied the soil C dynamics under different fertilizer treatments. Though inorganic fertilizers possess the advantage of easy handling, application and storage, they do not contribute to soil organic carbon. On the contrary, regardless of management method, plant residues are known to increase organic carbon content.

    Figure 1.  Impact of different fertilization regimes on abundance of the microbial biomarker groups . Error bars represent the standard error of the means and different letters indicate significant differences at p < 0.05 among treatments. Source: Li et al.[60].
    Figure 2.  Soil organic carbon (SOC) dynamics in the global carbon cycle.

    Katkar et al.[98] reported a higher soil quality index under conjunctive nutrient management strategies comprising addition of compost and green leaves along with mineral nutrients. Mazumdar et al.[99] investigated the impact of crop residue (CR), FYM, and leguminous green manure (GM) on SOC in continuous rice-wheat cropping sequence over a 25-year period. At the surface layer, the maximum SOC content was recorded under NPK + FYM than NPK + CR and NPK + GM treatments. SOC was significantly lower under sole application of INFs (NPK) than the mixed application of organic and inorganic treatments. A higher range of SOC content was recorded at a depth of 0.6 m in the rice-wheat system (1.8–6.2 g kg−1) in farmyard manure (FYM)-treated plots than 1.7–5.3 g kg−1 under NPK, and 0.9–3.0 g kg−1 in case of unfertilized plots[100]. In a research study Dutta et al.[101] reported that rice residue had a higher decomposition rate (k¼ 0.121 and 0.076 day−1) followed by wheat (0.073 and 0.042 day−1) and maize residues (0.041 day−1) when their respective residues placed on soil surface than incorporated in the soils. Naresh et al.[102] found FYM and dhaincha as GM/ sulphitation press mud (SPM) treatments are potent enough to enhance the SOC. Maximum SOC content was noted in 0–5 cm depth that reduced gradually along the profile. In surface soil, the total organic content (TOC) under different treatments varied with source used to supply a recommended dose of nitrogen (RDN) along with conventional fertilizer (CF).

    Cai et al.[103] ascertained that long-term manure application significantly improved SOC content in different size fractions which followed the sequence: 2,000–250 μm > 250–53 μm > 53 μm fraction. Naresh et al.[22] determined that mean SOC content increased from 0.54% in control to 0.65% in RDF and 0.82% in RDF + FYM treatment and improved enzyme activity; thus, ultimately influenced nutrient dynamics under field conditions. The treatments RDF + FYM and NPK resulted in 0.28 Mg C ha−1 yr−1 and 0.13 Mg C ha−1 yr−1, respectively and thus higher sequestration than control. Zhao et al.[104] determined that in the surface layer, significant increase in SOC content in each soil aggregate was noticed under straw incorporation treatments over no straw incorporated treatments (Fig. 3). Moreover, the aggregate associated OC was significantly higher in the surface layer than the sub-surface layer. The highest increment in aggregate-associated OC was noted in both maize and wheat straw (MR-WR) added plots followed by MR and least in WR. Besides, all of the three straw-incorporated treatments exhibited notable increase in SOC stock in each aggregate fraction in the surface layer of the soil. In the subsurface (20−40 cm) layer under MR-WR, significant rise in SOC stock of small macro-aggregates was observed, whereas there was a reduction in SOC stock in the silt + clay fraction than other treatments. The straw-incorporated treatments increased the quantity of mineral-associated organic matter (mSOM) and intra-aggregate particulate organic matter, (iPOM) within small macro-aggregates and micro-aggregates especially in the topmost layer of the soil.

    Figure 3.  Distribution of OC in coarse iPOM (intra-aggregate particulate organic matter) fine iPOM, mSOM (mineral-associated matter), and free LF (free light fraction) of small macro-aggregates and micro-aggregates in the 0–20 cm and 20–40 cm soil layers under MR-WR (return of both maize and wheat straw), MR (maize straw return), WR (wheat straw return). Different lowercase and uppercase letters indicate significant differences at p < 0.05 among treatments and depths respectively[104].

    Srinivasarao et al.[105] reported that SOC content was reduced with the addition of INFs (100% RDN) alone as compared to the conjunctive application of inorganic and organic or sole FYM treatments. Earlier, Srinivasarao et al.[106] reported that FYM treated plots exhibited greater per cent increase in SOC stock than mineral fertilized plots and control. Tong et al.[107] ascertained that the application of NP and NPK significantly improved SOC stocks. On the contrary, fertilized soils could also exhibit decrease in carbon content than control. Naresh et al.[108] determined that higher biomass C input significantly resulted in greater particulate organic carbon (POC) content. Zhang et al.[109] ascertained that long-term addition of NPK and animal manures significantly improved SOC stocks by a magnitude of 32%−87% whereas NPK and wheat/ and or maize straw incorporation enhanced the C stocks by 26%−38% than control. Kamp et al.[110] determined that continuous cultivation without fertilization decreased SOC content by 14% than uncultivated soil. However, super optimum dose of NPK, balanced NPK fertilization and integration of NPK with FYM not only improved SOC content but also SOC stocks over the first year. In conventionally tilled cotton-growing soils of southern USA, Franzluebbers et al.[111] estimated that carbon sequestration averaged 0.31 ± 0.19 Mg C ha−1 yr−1. Mandal et al.[112] reported maximum SOC stock in the surface layer of the soil (0–15 cm) which progressively diminished with depth in each land use system. A significant decrease in SOC stock along the profile depth was also observed by Dhaliwal et al.[47] in both croplands and agroforestry. In the topmost soil layer, highest SOC stock was recorded in rice–fallow system while the lowest was in the guava orchard[112].

    Nath et al.[113] determined that there was accrual of higher TOC in surface layers as compared to lower layers of soil under paddy cultivation. This accrual could be adduced to left-over crop residues and remnant root biomass which exhibited a decreasing trend with soil depth. Das et al.[114] determined that integrated use of fertilizers and organic sources resulted in greater TOC as compared to control or sole fertilizer application. Fang et al.[115] observed that the cumulative carbon mineralization differed with aggregate size in top soils of broad-leaved forests (BF) and coniferous forests (CF). However, in deep soil it was greater in macro-aggregates as compared to micro-aggregates in BF but not in CF (Fig. 4). By and large, the percent SOC mineralized was greater in macro-aggregates as compared to micro-aggregates. Dhaliwal et al.[100] ascertained that SOC accrual was considerably influenced by residue levels and tillage in surface soil (0−20 cm); albeit no variation was observed at lower depth (20−40 cm). The SOC content was greater in zero-tilled and permanently raised beds incorporated with residues as compared to puddled transplanted rice and conventionally planted wheat. Pandey et al.[116] reported that no-tillage prior to sowing of rice and wheat increased soil organic carbon by 0.6 Mg C ha–1 yr–1. The carbon sequestration rate on account of no-tillage or reduced tillage ranged between 0−2,114 kg ha–1 yr–1 in the predominant cropping system of South Asia, Xue et al.[117] observed that the long-term conventional tillage, by and large, exhibited a significant decline in SOC owing to degradation of soil structure, exposing protected soil organic matter (intra-soil aggregates) to microbes. Therefore, the adoption of no-tillage could hamper the loss of SOC thereby resulting in a greater or equivalent quantity of carbon in comparison to CT (Fig. 5).

    Figure 4.  (a) Soil aggregate fractions of two depths in two restored plantations of subtropical China, (b) organic carbon and (c) its mineralization from various soil aggregates within 71 d at various soil depths in two restored plantations of subtropical China. Error bars show the standard error of the mean. The different letters represent significant differences among the different soil aggregate fractions within a depth at p < 0.05[115].
    Figure 5.  The concentrations of (a) SOC, (b) total nitrogen (TN), and (c) soil C:N ratio for 0–50 cm profile under different tillage treatments in 2012 and 2013. NT = no-till with residue retention; RT = rotary tillage with residue incorporation; PT = plow tillage with residue incorporation; and PT0 = plow tillage with residue removed. The lowercase letters indicate statistical difference among treatments at p < 0.05[117].

    Singh et al.[118] determined that carbon stock in the 0-40 cm layer increased by 39, 35 and 19% in zero-tilled clay loam, loam, and sandy loam soils, respectively as compared to conventional tilled soils over a period of 15 years. Kuhn et al.[119] also apprised about the advantages of NT over CT vis-a-vis SOC stocks across soil depths. In the surface layer (0−20 cm) NT, by and large, resulted in higher SOC stocks as compared to CT; however, SOC stocks exhibited a declining trend with soil depth, in fact, became negative at depths lower than 20 cm. Sapkota et al.[120] observed that over a period of seven years, direct dry-seeded rice proceeded by wheat cultivation with residue retention enhanced SOC at 0-60 cm depth by a magnitude of 4.7 and 3.0 t C ha−1 in zero-tillage (ZTDSR-ZTW + R) and without tillage (PBDSR-PBW + R), respectively. On the contrary, the conventional tillage rice-wheat cropping system (CTR-CTW) decreased the SOC up to 0.9 t C ha−1 (Table 2).

    Table 2.  Influence of tillage and crop establishment methods on SOC stock and its temporal variation under rice–wheat system[120].
    Tillage and crop establishment methodsDepths (m)
    0–0.050.05–0.150.15–0.30.3–0.60–0.6
    Total SOC (t/ha)
    CTR-CTW3.5e7.1c8.77.026.2c
    CTR-ZTW3.9d7.6bc8.86.526.7c
    ZTDSR-CTW4.2d7.5bc9.26.327.3c
    ZTDSR-ZTW4.9c8.9ab8.26.228.2bc
    ZTDSR-ZTW+R6.1a9.0ab9.86.831.8a
    PBDSR-PBW+R5.5b9.3a9.36.030.1ab
    MSD0.41.72.01.42.49
    Treatment effect
    (p value)
    < 0.0010.040.1580.267< 0.001
    Initial SOC content3.6 ±
    0.15
    8.1 ±
    1.39
    8.78 ±
    1.07
    6.7 ±
    0.73
    27.1 ±
    1.21
    Change in SOC over seven years (t/ha)
    CTR-CTW−0.16−0.99−0.040.28−0.90
    CTR-ZTW0.28−0.500.01−0.20−0.41
    ZTDSR-CTW0.62−0.570.45−0.340.16
    ZTDSR-ZTW1.340.84−0.62−0.461.09
    ZTDSR-ZTW+R2.490.961.040.164.66
    PBDSR-PBW+R1.891.220.51−0.642.98
    CTR-CTW = Conventionally tilled puddled transplanted rice followed by conventionally tilled wheat, CTR-ZTW = Conventionally tilled puddled transplanted rice followed by zero-tilled wheat, ZTDSR-CTW = Zero-tilled direct dry-seeded rice followed by conventionally tilled wheat, ZTDSR-ZTW = Zero-tilled direct dry-seeded rice followed by zero-tilled wheat, ZTDSR-ZTW+R = Zero-tilled direct dry-seeded rice followed by zero-tilled wheat with residue retention, PBDSR-PBW+R = Direct dry-seeded rice followed by direct drilling of wheat both on permanent beds with residue retention, MSD, minimum significant difference. Significant different letters indicate significant differences at p < 0.05.
     | Show Table
    DownLoad: CSV

    Labile organic carbon (LC) is that fraction of SOC that is rapidly degraded by soil microbes, therefore, having the highest turnover rate. This fraction can turn over quickly on account of the change in land use and management strategies. From the crop production perspective, this fraction is crucial as it sustains the soil food cycle and, hence, considerably impacts nutrient cycling thereby altering soil quality and productivity. Short-term management could influence the labile fraction of carbon[121]. However, some site-specific problems and regional factors may influence their distribution in soil layers[102].

    Banger et al.[122] observed significant alteration in labile pools of C, for instance, particulate organic matter (POM), water-soluble C (WSC) and light fraction of C (LFC) because of the addition of fertilizers and/or FYM over a 16-year period. Particulate organic matter, LFC and WSC contributed 24%–35%, 12%–14% and 0.6%–0.8%, respectively, towards SOC. The increase in concentration of SOC including its pools like POC and the sequestration rate due to integrated nutrient management was also reported by Nayak et al.[123]. Gu et al.[124] observed that mulch-treated soils (straw and grass mulch) had significantly greater levels of LOC, POC, DOC and EOC as compared to no mulch-treated soils which could be adduced to the addition of straw, root and its sections into the soil. The content of labile C fractions across all treatments exhibited a decreasing trend with soil depth[23, 102, 125].

    In a long-term experiment, Anantha et al.[126] observed that the total organic carbon apportioned into labile carbon, non-labile, less labile, and very labile carbon constituted around 18.7%, 19.3%, 20.6% and 41.4% of the TOC, respectively (Table 3). Zhu et al.[20] determined that straw incorporation had a substantial impact on TOC and labile C fractions of the soil which were greater in straw incorporated treatments as compared to non-straw treatments across all the depths. Wang et al.[127] reported that the light fraction organic carbon (LFOC) and DOC were significantly greater in the straw-applied treatments than the control by a magnitude of 7%–129% for both the early and late season rice. The treatments NPK + FYM or NPK + GR + FYM resulted in greater content of very labile and labile C fractions whereas non-labile and less labile fractions were greater in control and NPK + CR treatment. There was 40.5% and 16.2% higher C build-up in sole FYM treated plots and 100% NPK + FYM, respectively over control. On the other hand, a net depletion of 1.2 and 1.8 Mg ha−1 in carbon stock was recorded under 50% NPK and control treatments, respectively. Out of the total C added through FYM, only 28.9% was stabilized as SOC, though an external supply of OM is a significant source of soil organic carbon[69]. Hence, to sustain the optimum SOC level at least an input of 2.3 Mg C ha−1 y−1 is required. A comparatively greater quantity of soil C in passive pools was observed in 100% NPK + FYM treatment. The increase in allocation of C into the passive pool was about 33%, 35%, 41% and 39% of TOC in control, suboptimal dose, optimal dose and super optimal dose of NPK which indicates that the concentration of passive pools increased with an increase in fertilization doses. Water-soluble carbon (WSC) was 5.48% greater in the upper soil layer as compared to lower layer of soil. In surface soil (0−15 cm), the values of light fraction carbon (LFC) were 81.3, 107.8, 155.2, 95.7, 128.8, 177.8 and 52.7 mg kg−1 in ZT without residue retention, ZT with 4 t ha−1 residue retention, ZT with 6 t ha−1 residue retention, FIRB without residue addition and FIRB with 4 and 6 t ha−1 residue addition and CT, respectively (Table 4). Tiwari et al.[128] determined that the decrease in POC was due to reduction in fine particulate organic matter in topsoil whereas decrement in dissolved organic carbon was observed largely in subsoil. Therefore, in surface soils fine POC and LFOC might be regarded as preliminary evidence of organic C alteration more precisely, while DOC could be considered as a useful indicator for subsoil. Reduction in allocations of fine POC, LFOC and DOC to SOC caused by tillage and straw management strategies indicated the decline in quality of SOC. A higher SOC concentration was recorded in the conjoint application of INF + FYM (0.82%) and sole application of INF (0.65%) than control (0.54%). Kumar et al.[83] reported that the CT without residue retention had significantly lower labile carbon fractions (27%–48%) than zero-tillage with 6-ton residue retention. Moreover, residue-retained fertilized treatments had significantly greater labile fractions of C than sole fertilized treatments[125]. Kumar et al.[83] reported highest change in DOC in zero-till with residue retention (28.2%) in comparison to conventional tillage practices. In ZT, absence of soil perturbations resulted in sustained supply of organic substrata for soil microbes which increases their activity. On the contrary, CT practices resulted in higher losses of C as CO2 due to frequent disturbances.

    Table 3.  Oxidisable organic carbon fractions in soils (g kg−1) at different layers[126].
    TreatmentDepths (cm)
    0−1515−3030−45Total
    Very Labile C
    Control3.6 ± 0.5c1.4 ± 0.3b1.3 ± 0.2a6.3 ± 0.4b
    50% NPK4.6 ± 0.3bc2.1 ± 0.7ab1.5 ± 0.1a8.1 ± 0.9a
    100% NPK4.4 ± 0.3bc2.3 ± 0.2a1.4 ± 0.5a8.0 ± 0.7a
    150% NPK5.0 ± 0.2ab2.6 ± 0.2a1.5 ± 0.1a9.0 ± 0.3a
    100% NPK + FYM4.8 ± 0.2ab2.0 ± 0.2ab1.3 ± 0.3a8.1 ± 0.2a
    FYM5.9 ± 1.3a2.2 ± 0.2a1.4 ± 0.3a9.5 ± 1.6a
    Fallow4.2 ± 0.7bc1.5 ± 0.5b0.7 ± 0.3b6.3 ± 0.8b
    Lbile C
    Control2.4 ± 0.3a1.0 ± 0.2a0.8 ± 0.4a4.2 ± 0.6a
    50% NPK1.7 ± 0.4ab0.9 ± 0.5a0.7 ± 0.2a3.3 ± 0.7a
    100% NPK1.8 ± 0.4ab0.8 ± 0.5a0.6 ± 0.3a3.2 ± 0.8a
    150% NPK1.2 ± 0.3b0.7 ± 0.2a0.9 ± 0.2a2.8 ± 0.4a
    100% NPK + FYM1.9 ± 0.3ab0.7 ± 0.2a0.7 ± 0.3a3.4 ± 0.2a
    FYM2.5 ± 0.9a0.7 ± 0.3a0.7 ± 0.2a3.9 ± 0.9a
    Fallow2.2 ± 1.0ab1.0 ± 0.3a1.0 ± 0.4a4.1 ± 1.1a
    Less labile C
    Control1.5 ± 0.3c0.6 ± 0.4c0.4 ± 0.0c2.6 ± 0.7d
    50% NPK1.8 ± 0.1c0.4 ± 0.1c0.5 ± 0.2c2.7 ± 0.1cd
    100% NPK2.5 ± 0.3ab0.8 ± 0.1bc1.1 ± 0.2ab4.4 ± 0.1b
    150% NPK2.6 ± 0.2a0.9 ± 0.1bc0.4 ± 0.2c3.9 ± 0.1b
    100% NPK + FYM2.7 ± 0.6a1.5 ± 0.2a1.4 ± 0.1a5.6 ± 0.7a
    FYM1.9 ± 0.7bc1.7 ± 0.2a1.0 ± 0.2b4.5 ± 0.7ab
    Fallow1.5 ± 0.3c1.3 ± 0.7ab0.9 ± 0.4b3.8 ± 1.2bc
    Non labile C
    Control1.2 ± 0.5b1.2 ± 0.3a0.2 ± 0.2b2.6 ± 0.5b
    50% NPK1.2 ± 0.9b1.7 ± 0.8a0.7 ± 0.4ab3.5 ± 1.8ab
    100% NPK1.3 ± 0.6b1.5 ± 0.6a0.5 ± 0.2ab3.3 ± 1.0ab
    150% NPK1.4 ± 0.3b1.5 ± 0.2a0.8 ± 0.1a3.7 ± 0.3ab
    100% NPK + FYM2.0 ± 0.8b1.3 ± 0.1a0.3 ± 0.3ab3.5 ± 0.7ab
    FYM3.7 ± 1.3a1.0 ± 0.2a0.5 ± 0.5ab5.1 ± 1.9a
    Fallow2.1 ± 0.2b1.4 ± 0.7a0.4 ± 0.2ab3.9 ± 0.9ab
    Values in the same column followed by different letters are significantly different at p < 0.001, ± indicates the standard deviation values of the means.
     | Show Table
    DownLoad: CSV
    Table 4.  Influence of tillage and nitrogen management on distribution of carbon fractions in soil[83].
    TreatmentsWSOC
    (g kg−1)
    SOC
    (g kg−1)
    OC
    (g kg−1)
    BC
    (g kg−1)
    POC
    (mg kg)
    PON
    (mg kg−1)
    LFOC
    (mg kg−1)
    LFON
    (mg kg−1)
    Depths (cm)
    0−1515−300−1515−300−1515−300−1515−300−1515−300−1515−300−1515−300−1515−30
    Tillage practices
    ZTR28.826.223.119.39.619.134.694.281342.8967.9119.5108.1194.7154.814.812.3
    ZTWR25.324.618.414.87.877.213.763.19981.1667.494.686.5120.5104.711.810.3
    RTR27.025.922.418.28.688.174.133.871230.2836.9109.797.8170.9144.913.711.6
    RTWR23.721.818.114.27.667.073.122.96869.4604.482.676.6107.197.39.78.6
    CTR26.124.421.817.48.497.963.823.481099.1779.498.489.3143.8115.912.810.9
    CT21.820.916.113.16.215.642.892.63617.5481.869.257.690.873.69.67.9
    Nitrogen management
    Control21.114.916.113.16.135.481.581.07709.7658.631.726.3123.9104.36.45.8
    80 kg N ha−128.321.217.814.76.466.162.461.75860.7785.668.456.2132.8116.17.66.9
    120 kg N ha−129.522.119.116.17.256.713.262.18952.2808.989.578.5150.6127.69.78.6
    160 kg N ha−130.223.120.818.27.757.283.822.661099.5823.896.883.4168.5145.710.29.8
    200 kg N ha−131.125.421.318.77.937.484.153.421153.1898.4103.997.3176.2152.911.710.6
    WSOC = Water soluble organic carbon, SOC = Total soil organic carbon, OC = Oxidizable organic carbon, BC =Black carbon, POC = particulate organic carbon, PON = particulate organic nitrogen, LFOC = labile fraction organic carbon, and LFON = labile fraction organic nitrogen. ZTR = Zero tillage with residue retention, ZTWR = Zero tillage without residue retention; RTR = Reduced tillage with residue retention, RTWR = Reduced tillage without residue retention, CTR = Conventional tillage with residue incorporation; CT = Conventional tillage without residue incorporation.
     | Show Table
    DownLoad: CSV

    The soil characteristics such as plant available nutrients, microbial diversity and soil organic carbon transformation are dwindling on account of intensive cultivation under conventional tillage practices, therefore, demand relevant management approaches for soil and crop sustainability. Long-term application of organic amendments significantly increases soil properties by increasing plant available macro, micro, secondary nutrients and soil organic C, whereas the increase in organic C by INF application is, by and large, due to increment in organic C content within macro-aggregates and in the silt + clay compartments. The soil organic carbon and other plant available nutrients were significantly greater in conservation tillage systems as compared to conventional tillage (CT) that conservation approaches could be an exemplary promoter of soil productivity by modifying soil structure thereby protecting SOM and maintaining higher nutrient content. The mean concentration of different fractions of carbon MBN, PMN and soil respiration under integrated nutrient management treatments was higher as compared with to control. Therefore, the conjoint use of organic manures or retention of crop residues with inorganic fertilizers is imperative to reduce the depletion of SOC while sustaining crop production as a realistic alternative. Future research should focus mainly on the usage of organic and mineral fertilizers in conjunction with conservation tillage approaches to sustain the soil environment.

    The authors confirm contribution to the paper as follows: study conception and design: Dhaliwal SS, Shukla AK, Randhawa MK, Behera SK; data collection: Sanddep S, Dhaliwal SS, Behera SK; analysis and interpretation of results: Dhaliwal SS, Gagandeep Kaur, Behera SK; draft manuscript preparation: Dhaliwal SS, walia, Shukla AK, Toor AS, Behera SK, Randhawa MK. All authors reviewed the results and approved the final version of the manuscript.

    Data sharing not applicable to this article as no datasets were generated or analyzed during the current study.

    The support rendered by the Departemnt of Soil Science, PAU, Ludhiana, RVSKVV, Gwailor, CSSRI, Karnal, IISS, Bhopal, School of Organic Farming, PAU Ludhiana and Washington State University, USA is fully acknowledged .

  • The authors declare that they have no conflict of interest.

  • [1]

    Crockett SL, Robson NK. 2011. Taxonomy and chemotaxonomy of the genus Hypericum. Medicinal and Aromatic Plant Science and Biotechnology 5:1−13

    Google Scholar

    [2]

    Robson NKB. 2003. Hypericum botany. In Hypericum: the genus Hypericum, ed. Ernst E. London: Taylor & Francis. pp. 1–22. (Medicinal and aromatic plants - industrial profiles). www.crcpress.com/product/isbn/9780415369541

    [3]

    Menković N, Šavikin K, Tasić S, Zdunić G, Stešević D, et al. 2011. Ethnobotanical study on traditional uses of wild medicinal plants in Prokletije Mountains (Montenegro). Journal of Ethnopharmacology 133(1):97−107

    doi: 10.1016/j.jep.2010.09.008

    CrossRef   Google Scholar

    [4]

    Mustafa B, Hajdari A, Krasniqi F, Hoxha E, Ademi H, et al. 2012. Medical ethnobotany of the Albanian Alps in Kosovo. Journal of Ethnobiology Ethnomedicine 8:6

    doi: 10.1186/1746-4269-8-6

    CrossRef   Google Scholar

    [5]

    Agostinis P, Vantieghem A, Merlevede W, De Witte PAM. 2002. Hypericin in cancer treatment: more light on the way. The International Journal of Biochemistry & Cell Biology 34(3):221−41

    doi: 10.1016/s1357-2725(01)00126-1

    CrossRef   Google Scholar

    [6]

    Dong X, Zeng Y, Zhang Z, Fu J, You L, et al. 2021. Hypericin-mediated photodynamic therapy for the treatment of cancer: a review. Journal of Pharmacy and Pharmacology 73(4):425−36

    doi: 10.1093/jpp/rgaa018

    CrossRef   Google Scholar

    [7]

    Karioti A, Bilia AR. 2010. Hypericins as Potential Leads for New Therapeutics. International Journal of Molecular Sciences 11(2):562−94

    doi: 10.3390/ijms11020562

    CrossRef   Google Scholar

    [8]

    Kasper S, Caraci F, Forti B, Drago F, Aguglia E. 2010. Efficacy and tolerability of Hypericum extract for the treatment of mild to moderate depression. European Neuropsychopharmacology 20(11):747−65

    doi: 10.1016/j.euroneuro.2010.07.005

    CrossRef   Google Scholar

    [9]

    Whiskey E, Werneke U, Taylor D. 2001. A systematic review and meta-analysis of Hypericum perforatum in depression: a comprehensive clinical review. International Clinical Psychopharmacology 16(5):239−52

    doi: 10.1097/00004850-200109000-00001

    CrossRef   Google Scholar

    [10]

    Hanlidou E, Karousou R, Kleftoyanni V, Kokkini S. 2004. The herbal market of Thessaloniki (N Greece) and its relation to the ethnobotanical tradition. Journal of Ethnopharmacology 91(2):281−99

    doi: 10.1016/j.jep.2004.01.007

    CrossRef   Google Scholar

    [11]

    Jarić S, Popović Z, Mačukanović-Jocić M, Djurdjević L, Mijatović M, et al. 2007. An ethnobotanical study on the usage of wild medicinal herbs from Kopaonik Mountain (Central Serbia). Journal of Ethnopharmacology 111(1):160−75

    doi: 10.1016/j.jep.2006.11.007

    CrossRef   Google Scholar

    [12]

    Pieroni A, Quave CL, Santoro RF. 2004. Folk pharmaceutical knowledge in the territory of the Dolomiti Lucane, inland southern Italy. Journal of Ethnopharmacology 95(2):373−84

    doi: 10.1016/j.jep.2004.08.012

    CrossRef   Google Scholar

    [13]

    Smith T, Resetar H, Morton C. 2022. US Sales of Herbal Supplements Increase by 9.7% in 2021. HerbalGram 136

    [14]

    Hölzl J, Petersen M. 2003. Chemical constituents of Hypericum ssp. In Hypericum: the genus Hypericum. Ed. Ernst E. London: Taylor & Francis. pp. 77–90. (Medicinal and aromatic plants - industrial profiles). www.crcpress.com/product/isbn/9780415369541

    [15]

    Kitanov GM. 2001. Hypericin and pseudohypericin in some Hypericum species. Biochemical Systematics and Ecology 29(2):171−78

    doi: 10.1016/S0305-1978(00)00032-6

    CrossRef   Google Scholar

    [16]

    Kimáková K, Kimáková A, Idkowiak J, Stobiecki M, Rodziewicz P, et al. 2018. Phenotyping the genus Hypericum by secondary metabolite profiling: emodin vs. skyrin, two possible key intermediates in hypericin biosynthesis. Analytical and Bioanalytical Chemistry 410(29):7689−99

    doi: 10.1007/s00216-018-1384-0

    CrossRef   Google Scholar

    [17]

    Rizzo P, Altschmied L, Stark P, Rutten T, Gündel A, et al. 2019. Discovery of key regulators of dark gland development and hypericin biosynthesis in St. John's Wort (Hypericum perforatum). Plant Biotechnology Journal 17(12):2299−312

    doi: 10.1111/pbi.13141

    CrossRef   Google Scholar

    [18]

    Crockett SL, Poller B, Tabanca N, Pferschy-Wenzig EM, Kunert O, et al. 2011. Bioactive xanthones from the roots of Hypericum perforatum (common St John's wort). Journal of the Science of Food and Agriculture 91(3):428−34

    doi: 10.1002/jsfa.4202

    CrossRef   Google Scholar

    [19]

    Butterweck V. 2003. Mechanism of action of St John's wort in depression: what is known? CNS Drugs 17:539−62

    doi: 10.2165/00023210-200317080-00001

    CrossRef   Google Scholar

    [20]

    Müller WE, Singer A, Wonnemann M. 2001. Hyperforin - antidepressant activity by a novel mechanism of action. Pharmacopsychiatry 34:S98−S102

    doi: 10.1055/s-2001-15512

    CrossRef   Google Scholar

    [21]

    Li Y N, Zeng Y R, Yang J, He W, Chen J, et al. 2022. Chemical constituents from the flowers of Hypericum monogynum L. with COX-2 inhibitory activity. Phytochemistry 193:112970

    doi: 10.1016/j.phytochem.2021.112970

    CrossRef   Google Scholar

    [22]

    Mohamed FF, Anhlan D, Schöfbänker M, Schreiber A, Classen N, et al. 2022. Hypericum perforatum and its ingredients hypericin and pseudohypericin demonstrate an antiviral activity against SARS-CoV-2. Pharmaceuticals 15(5):530

    doi: 10.3390/ph15050530

    CrossRef   Google Scholar

    [23]

    Cao K, Zhang Y, Yao Q, Peng Y, Pan Q, et al. 2022. Hypericin blocks the function of HSV-1 alkaline nuclease and suppresses viral replication. Journal of Ethnopharmacology 296:115524

    doi: 10.1016/j.jep.2022.115524

    CrossRef   Google Scholar

    [24]

    Schempp CM, Pelz K, Wittmer A, Schöpf E, Simon JC, et al. 1999. Antibacterial activity of hyperforin from St John's wort, against multiresistant Staphylococcus aureus and gram-positive bacteria. The Lancet 353(9170):2129

    doi: 10.1016/S0140-6736(99)00214-7

    CrossRef   Google Scholar

    [25]

    Oliveira AI, Pinho C, Sarmento B, Dias ACP. 2016. Neuroprotective activity of Hypericum perforatum and its major components. Frontiers in Plant Science 7:1004

    doi: 10.3389/fpls.2016.01004

    CrossRef   Google Scholar

    [26]

    Süntar IP, Akkol EK, Yilmazer D, Baykal T, Kirmizibekmez H, et al. 2010. Investigations on the in vivo wound healing potential of Hypericum perforatum L. Journal of ethnopharmacology 127(2):468−77

    doi: 10.1016/j.jep.2009.10.011

    CrossRef   Google Scholar

    [27]

    Russo E, Scicchitano F, Whalley B J, Mazzitello C, Ciriaco M et al. 2014. Hypericum perforatum: pharmacokinetic, mechanism of action, tolerability, and clinical drug–drug interactions. Phytotherapy research 28(5):643−55

    doi: 10.1002/ptr.5050

    CrossRef   Google Scholar

    [28]

    Curtis JD, Lersten NR. 1990. Internal secretory structures in Hypericum (Clusiaceae): H. perforatum L. and H. balearicum L. New Phytologist 114(4):571−80

    doi: 10.1111/j.1469-8137.1990.tb00427.x

    CrossRef   Google Scholar

    [29]

    Zobayed SMA, Afreen F, Goto E, Kozai T. 2006. Plant–environment interactions: accumulation of hypericin in dark glands of Hypericum perforatum. Annals of Botany 98(4):793−804

    doi: 10.1093/aob/mcl169

    CrossRef   Google Scholar

    [30]

    Peng Z, Lu J, Liu K, Xie L, Wang Y, et al. 2023. Hypericin as a promising natural bioactive naphthodianthrone: A review of its pharmacology, pharmacokinetics, toxicity, and safety. Phytotherapy Research 37(12):5639−56

    doi: 10.1002/ptr.8011

    CrossRef   Google Scholar

    [31]

    Choudhary N, Collignon TE, Tewari D, Bishayee A. 2022. Hypericin and its anticancer effects: From mechanism of action to potential therapeutic application. Phytomedicine 105:154356

    doi: 10.1016/j.phymed.2022.154356

    CrossRef   Google Scholar

    [32]

    Zhang M, Wang Y, Qian F, Li P, Xu X. 2016. Hypericin inhibits oligomeric amyloid β42-induced inflammation response in microglia and ameliorates cognitive deficits in an amyloid β injection mouse model of Alzheimer's disease by suppressing MKL1. Biochemical and Biophysical Research Communications 481(1−2):71−76

    doi: 10.1016/j.bbrc.2016.11.016

    CrossRef   Google Scholar

    [33]

    Mazur Y, Bock H. 1992. U.S. Preparation of Hypericin. Patent No. 5, 120, 412

    [34]

    Karppinen K, Hokkanen J, Mattila S, Neubauer P, Hohtola A. 2008. Octaketide-producing type III polyketide synthase from Hypericum perforatum is expressed in dark glands accumulating hypericins. The FEBS Journal 275(17):4329−42

    doi: 10.1111/j.1742-4658.2008.06576.x

    CrossRef   Google Scholar

    [35]

    Soták M, Czeranková O, Klein D, Jurčacková Z, Li L et al. 2016. Comparative transcriptome reconstruction of four Hypericum species focused on hypericin biosynthesis. Frontiers in Plant Science 7:1039

    doi: 10.3389/fpls.2016.01039

    CrossRef   Google Scholar

    [36]

    Bais HP, Vepachedu R, Lawrence CB, Stermitz FR, Vivanco JM. 2003. Molecular and biochemical characterization of an enzyme responsible for the formation of hypericin in St. John's Wort (Hypericum perforatum L.). Journal of Biological Chemistry 278(34):32413−22

    doi: 10.1074/jbc.M301681200

    CrossRef   Google Scholar

    [37]

    Wu S, Malaco Morotti AL, Wang S, Wang Y, Xu X, et al. 2022. Convergent gene clusters underpin hyperforin biosynthesis in St John's wort. New Phytologist 235(2):646−61

    doi: 10.1111/nph.18138

    CrossRef   Google Scholar

    [38]

    Wu S, Morotti ALM, Yang J, Wang E, Tatsis EC. 2024. Single-cell RNA sequencing facilitates the elucidation of the complete biosynthesis of the antidepressant hyperforin in St. John's wort. Molecular Plant 17(9):1439−57

    doi: 10.1016/j.molp.2024.08.003

    CrossRef   Google Scholar

    [39]

    Karppinen K, Hohtola A. 2008. Molecular cloning and tissue-specific expression of two cDNAs encoding polyketide synthases from Hypericum perforatum. Journal of Plant Physiology 165(10):1079−86

    doi: 10.1016/j.jplph.2007.04.008

    CrossRef   Google Scholar

    [40]

    Košuth J, Katkovčinová Z, Olexová P, Čellárová E. 2007. Expression of the hyp-1 gene in early stages of development of Hypericum perforatum L. Plant Cell Reports 26(2):211−17

    doi: 10.1007/s00299-006-0240-4

    CrossRef   Google Scholar

    [41]

    Košuth J, Smelcerovic A, Borsch T, Zuehlke S, Karppinen K, et al. 2010. The hyp-1 gene is not a limiting factor for hypericin biosynthesis in the genus Hypericum. Functional Plant Biology 38(1):35

    doi: 10.1071/FP10144

    CrossRef   Google Scholar

    [42]

    Košuth J., Hrehorová D., Jaskolski M., & Čellárová E. 2013. Stress-induced expression and structure of the putative gene hyp-1 for hypericin biosynthesis. Plant Cell, Tissue and Organ Culture 114:207−16

    doi: 10.1007/s11240-013-0316-0

    CrossRef   Google Scholar

    [43]

    Zhou W, Wang Y, Li B, Petijová L, Hu S, et al. 2021. Whole-genome sequence data of Hypericum perforatum and functional characterization of melatonin biosynthesis by N-acetylserotonin O-methyltransferase. Journal of Pineal Research 70(2):e12709

    doi: 10.1111/jpi.12709

    CrossRef   Google Scholar

    [44]

    Yao Y, Kang T, Jin L, Liu Z, Zhang Z, et al. 2019. Temperature-dependent growth and hypericin biosynthesis in Hypericum perforatum. Plant Physiology and Biochemistry 139:613−19

    doi: 10.1016/j.plaphy.2019.04.012

    CrossRef   Google Scholar

    [45]

    Su H, Jin L, Li M, Paré PW. 2022. Low temperature modifies seedling leaf anatomy and gene expression in Hypericum perforatum. Frontiers in Plant Science 13:1020857

    doi: 10.3389/fpls.2022.1020857

    CrossRef   Google Scholar

    [46]

    Tavakoli F, Rafieiolhossaini M, Ravash R, Ebrahimi M. 2020. UV-B radiation and low temperature promoted hypericin biosynthesis in adventitious root culture of Hypericum perforatum. Plant Signaling & Behavior 15(7):1764184

    doi: 10.1080/15592324.2020.1764184

    CrossRef   Google Scholar

    [47]

    Liu XN, Zhang XQ, Sun JS. 2007. Effects of cytokinins and elicitors on the production of hypericins and hyperforin metabolites in Hypericum sampsonii and Hypericum perforatum. Plant Growth Regulation 53:207−14

    doi: 10.1007/s10725-007-9220-0

    CrossRef   Google Scholar

    [48]

    Walker T S, Bais H P, Vivanco J M. 2002. Jasmonic acid-induced hypericin production in cell suspension cultures of Hypericum perforatum L. (St. John's wort). Phytochemistry 60(3):289−93

    doi: 10.1016/S0031-9422(02)00074-2

    CrossRef   Google Scholar

    [49]

    Noormohammadi N, Ismaili A, Sobhani Najafabadi A, Nazarian-Firouzabadi F. 2023. Transcriptional responses of hypericin and hyperforin to methyl jasmonate elicitation in Hypericum perforatum. Plant Biotechnology Reports 17(2):229−41

    doi: 10.1007/s11816-022-00794-6

    CrossRef   Google Scholar

    [50]

    Ohmori S, Kimizu M, Sugita M, Miyao A, Hirochika H, et al. 2009. MOSAIC FLORAL ORGANS1, an AGL6-like MADS box gene, regulates floral organ identity and meristem fate in rice. The Plant Cell 21(10):3008−25

    doi: 10.1105/tpc.109.068742

    CrossRef   Google Scholar

    [51]

    Stracke R, Werber M, Weisshaar B. 2001. The R2R3-MYB gene family in Arabidopsis thaliana. Current Opinion in Plant Biology 4(5):447−56

    doi: 10.1016/S1369-5266(00)00199-0

    CrossRef   Google Scholar

    [52]

    Beerhues L. 2006. Hyperforin. Phytochemistry 67(20):2201−7

    doi: 10.1016/j.phytochem.2006.08.017

    CrossRef   Google Scholar

    [53]

    Smelcerovic A, Verma V, Spiteller M, Ahmad SM, Puri SC, et al. 2006. Phytochemical analysis and genetic characterization of six Hypericum species from Serbia. Phytochemistry 67(2):171−77

    doi: 10.1016/j.phytochem.2005.10.021

    CrossRef   Google Scholar

    [54]

    Gronquist M, Bezzerides A, Attygalle A, Meinwald J, Eisner M, et al. 2001. Attractive and defensive functions of the ultraviolet pigments of a flower (Hypericum calycinum). Proceedings of the National Academy of Sciences of the United States of America 98(24):13745−50

    doi: 10.1073/pnas.231471698

    CrossRef   Google Scholar

    [55]

    Adam P, Arigoni D, Bacher A, Eisenreich W. 2002. Biosynthesis of Hyperforin in Hypericum perforatum. Journal of Medicinal Chemistry 45(21):4786−93

    doi: 10.1021/jm0209782

    CrossRef   Google Scholar

    [56]

    Ciccarelli D, Andreucci AC, Pagni AM. 2001. Translucent glands and secretory canals in Hypericum perforatum L. (Hypericaceae): morphological, anatomical and histochemical studies during the course of ontogenesis. Annals of Botany 88(4):637−44

    doi: 10.1006/anbo.2001.1514

    CrossRef   Google Scholar

    [57]

    Singer A, Wonnemann M, Müller WE. 1999. Hyperforin, a Major Antidepressant Constituent of St. John's Wort, Inhibits Serotonin Uptake by Elevating Free Intracellular Na+1 1. Journal of Pharmacology and Experimental Therapeutics 290(3):1363−68

    Google Scholar

    [58]

    Treiber K, Singer A, Henke B, Müller WE. 2005. Hyperforin activates nonselective cation channels (NSCCs). British Journal of Pharmacology 145(1):75−83

    doi: 10.1038/sj.bjp.0706155

    CrossRef   Google Scholar

    [59]

    Schempp CM, Kirkin V, Simon-Haarhaus B, Kersten A, Kiss J, et al. 2002. Inhibition of tumour cell growth by hyperforin, a novel anticancer drug from St. John's wort that acts by induction of apoptosis. Oncogene 21(8):1242−50

    doi: 10.1038/sj.onc.1205190

    CrossRef   Google Scholar

    [60]

    Klingauf P, Beuerle T, Mellenthin A, El-Moghazy SAM, Boubakir Z, et al. 2005. Biosynthesis of the hyperforin skeleton in Hypericum calycinum cell cultures. Phytochemistry 66(2):139−45

    doi: 10.1016/j.phytochem.2004.11.003

    CrossRef   Google Scholar

    [61]

    Jepson C, Karppinen K, Daku RM, Sterenberg BT, Suh D. 2014. Hypericum perforatum hydroxyalkylpyrone synthase involved in sporopollenin biosynthesis – phylogeny, site-directed mutagenesis, and expression in nonanther tissues. The FEBS Journal 281(17):3855−68

    doi: 10.1111/febs.12920

    CrossRef   Google Scholar

    [62]

    Boubakir Z, Beuerle T, Liu B, Beerhues L. 2005. The first prenylation step in hyperforin biosynthesis. Phytochemistry 66(1):51−57

    doi: 10.1016/j.phytochem.2004.10.020

    CrossRef   Google Scholar

    [63]

    Sayed HMB, Nassar S, Kaufholdt D, Beerhues L, Liu B, et al. 2023. Biosynthesis of polyprenylated xanthones in Hypericum perforatum roots involves 4-prenyltransferase. Plant Physiology 192(4):2971−88

    doi: 10.1093/plphys/kiad219

    CrossRef   Google Scholar

    [64]

    Ruan J, Zheng C, Liu Y, Qu L, Yu H, et al. 2017. Chemical and Biological Research on Herbal Medicines Rich in Xanthones. Molecules 22(10):1698

    doi: 10.3390/molecules22101698

    CrossRef   Google Scholar

    [65]

    Liu B, Falkenstein-Paul H, Schmidt W, Beerhues L. 2003. Benzophenone synthase and chalcone synthase from Hypericum androsaemum cell cultures: cDNA cloning, functional expression, and site-directed mutagenesis of two polyketide synthases. The Plant Journal 34(6):847−55

    doi: 10.1046/j.1365-313X.2003.01771.x

    CrossRef   Google Scholar

    [66]

    El-awaad I, Bocola M, Beuerle T, Liu B, Beerhues L. 2016. Bifunctional CYP81AA proteins catalyse identical hydroxylations but alternative regioselective phenol couplings in plant xanthone biosynthesis. Nature Communications 7:11472

    doi: 10.1038/ncomms11472

    CrossRef   Google Scholar

    [67]

    Schmidt W, Peters S, Beerhues L. 2000. Xanthone 6-hydroxylase from cell cultures of Centaurium erythraea RAFN and Hypericum androsaemum L. Phytochemistry 53(4):427−31

    doi: 10.1016/S0031-9422(99)00566-X

    CrossRef   Google Scholar

    [68]

    Winkel-Shirley B. 2001. Flavonoid biosynthesis. a colorful model for genetics, biochemistry, cell biology, and biotechnology. Plant Physiology 126(2):485−93

    doi: 10.1104/pp.126.2.485

    CrossRef   Google Scholar

    [69]

    Butterweck V, Jürgenliemk G, Nahrstedt A, Winterhoff H. 2000. Flavonoids from Hypericum perforatum show antidepressant activity in the forced swimming test. Planta Medica 66(1):3−6

    doi: 10.1055/s-2000-11119

    CrossRef   Google Scholar

    [70]

    Butterweck V, Hegger M, Winterhoff H. 2004. Flavonoids of St. John's Wort reduce HPA axis function in the rat. Planta Medica 70:1008−11

    doi: 10.1055/s-2004-832631

    CrossRef   Google Scholar

    [71]

    Liu W, Feng Y, Yu S, Fan Z, Li X, et al. 2021. The Flavonoid biosynthesis network in plants. International Journal of Molecular Sciences 22(23):12824

    doi: 10.3390/ijms222312824

    CrossRef   Google Scholar

    [72]

    Wang Y, Cui Z, Li Q, Zhang S, Li Y, et al. 2023. The parallel biosynthesis routes of hyperoside from naringenin in Hypericum monogynum. Horticulture Research 10(9):uhad166

    doi: 10.1093/hr/uhad166

    CrossRef   Google Scholar

    [73]

    Crockett SL. 2010. Essential oil and volatile components of the genus Hypericum (Hypericaceae). Natural Product Communications 5(9):1493−506

    Google Scholar

    [74]

    Grafakou ME, Barda C, Karikas GA, Skaltsa H. 2022. Hypericum essential oils—composition and bioactivities: an update (2012–2022). Molecules 27(16):5246

    doi: 10.3390/molecules27165246

    CrossRef   Google Scholar

    [75]

    Grafakou ME, Diamanti A, Simirioti E, Terezaki A, Barda C, et al. 2021. Wound healing effects from 3 Hypericum spp. essential oils. Planta Medica International Open 8:e69−77

    doi: 10.1055/a-1492-3634

    CrossRef   Google Scholar

  • Cite this article

    Poulaki S, Vlachonasios K. 2024. Secondary metabolites of medicinal use in Hypericum spp.: a rich history and a promising future. Medicinal Plant Biology 3: e025 doi: 10.48130/mpb-0024-0027
    Poulaki S, Vlachonasios K. 2024. Secondary metabolites of medicinal use in Hypericum spp.: a rich history and a promising future. Medicinal Plant Biology 3: e025 doi: 10.48130/mpb-0024-0027

Figures(7)  /  Tables(2)

Article Metrics

Article views(1770) PDF downloads(391)

Other Articles By Authors

REVIEW   Open Access    

Secondary metabolites of medicinal use in Hypericum spp.: a rich history and a promising future

Medicinal Plant Biology  3 Article number: e025  (2024)  |  Cite this article

Abstract: The genus Hypericum, which comprises over 450 species worldwide, has a long history of use in traditional medicine. It is now known for its antidepressant, antiviral, antibacterial, and anticancer properties. This review summarizes the current knowledge on the biosynthesis of the main bioactive secondary metabolites responsible for the pharmaceutical applications of plants, particularly hypericin and hyperforin. In addition, this review highlights the importance of other chemical constituents in Hypericum, such as xanthones and flavonoids, which contribute to the pharmacological potential of the genus. Hypericin, a naphthodianthrone, has been shown to have remarkable pharmacological effects, particularly as a potential anticancer agent. On the other hand, hyperforin, a polyprenylated acylphloroglucinol, has been identified as a potent antidepressant. Recent advances in transcriptomics, metabolomics, and genomics have identified novel genes and enzymatic pathways that facilitate the biosynthesis of these compounds, providing valuable insights into their formation. Despite these advances, further research is essential to fully characterize the biosynthetic pathways and optimize the production of bioactive compounds in Hypericum species.

    • Hypericum L. is one of the largest angiosperm genera, comprising more than 450 species distributed almost worldwide[1]. Members of the genus have been used in traditional remedies across diverse cultures and civilizations for centuries and have even been considered symbols of religion[2]. Traditionally, Hypericum plants have been prepared in olive oil or alcohol extracts or used as herbal teas to treat wounds, gastrointestinal problems, and mood disorders[3,4]. More recently, plants of the genus have been recognized for their antidepressant, antiviral, antibacterial, and anticancer properties[59]. Dr. Norman Robson, who conducted the extensive monograph on the genus's taxonomy, noted: "Hypericum has thus been associated with pharmacy and folklore for many centuries; so, its recent 'discovery' by Western medicine is not surprising, though it may be regarded as rather belated"[2]. This highlights the long-standing tradition associated with the genus Hypericum, confirmed by numerous ethnobotanical studies conducted worldwide over the past decades[3,4,1012]. Today, dietary supplements and medicines made from Hypericum perforatum, also known as St. John's wort, are traded globally. St. John's wort is the most well-known species in the Hypericum genus. These products primarily treat mood disorders. In 2021, annual sales in the USA alone reached USD $32,769,413[13], highlighting the significant economic and medicinal importance of these herbs.

      Hypericum plants produce diverse natural product classes (Table 1, Fig. 1), with variations observed among species. Among them, naphthodianthrones (hypericin, pseudohypericin, protohypericin, and protopseudohypericin) and prenylated phloroglucinols (hyperforin, adhyperforin, and their oxygenated derivatives) are of particular interest due to their unique activities and rarity in other organisms. The most common natural compounds include xanthones (e.g., 1,3,6,7-tetrahydroxyxanthone), flavonoids (e.g., hyperoside, rutin, quercitrin), biflavonoids (I3, II8-biapigenin, Amentoflavone), tannins, proanthocyanidins, and phenolic acids. The essential oil contains both hydrocarbons and terpenoids[14]. In recent years, there has been a notable increase in research focused on the Hypericum genus's secondary metabolites. The potential of Hypericum plants as a source of natural products for developing new medicines is currently being investigated, although this is still an ongoing process. Similarly, the study on the biosynthesis of secondary metabolites represents a significant area of continuing research. While new tools have emerged in transcriptomic and metabolomic research, facilitating research on plant secondary metabolism, further expansion of the current knowledge is necessary concerning biosynthetic pathways and genetic and environmental factors that influence the biosynthesis of the key chemical constituents present in Hypericum plants. The above insights can potentially improve medicinal plant cultivation and encourage bioactive compounds' production via more efficient and productive biotechnological applications. This review paper aims to synthesize the current understanding of secondary metabolism in Hypericum plants, integrating the latest research developments with a particular focus on the biosynthesis of hypericin and hyperforin.

      Table 1.  Key chemical constituents of Hypericum perforatum[1,1418].

      Class Substance
      Naphodianthrones (precussors and derivatives) Hypericin
      Pseudohypericin
      Protohypericin
      Protopseudohypericin
      Skyrin
      Skyrin-6-O-ß-glucopyranoside
      Emodin
      Emodin dianthrone
      Phloroglucinol derivatives Hyperforin
      Adhyperforin
      Hyperfirin
      Adhyperfirin
      Furohyperforin
      Xanthones 1,6-dihydroxy-5-methoxy-4′,5′-dihydro-4′,4′,5′-trimethylfurano-(2′,3′:3,4)-xanthone
      4,6-dihydroxy-2,3-dimethoxyxanthone
      cis-kielcorin
      Magniferin
      1,3,6,7-tetrahydroxyxanthone
      Phenylpropanoids Caffeic acid
      Chlorogenic acid
      Flavonoids Quercetin
      Quercitrin
      Hyperoside
      Rutin
      Biflavonoids I3,II8-Biapigenin
      Amentoflavone
      Proanthocyanidins Procyanidin B2
      Catechins Catechin
      Epicatechin

      Figure 1. 

      Key chemical constituents of Hypericum perforatum. Different colors represent chemical classes: Naphthodianthrones, Phloroglucinol Derivatives, Xanthones, Phenylpropanoids, Proanthocyanidins, Catechins, Biflavonoids, Flavonoids.

    • Hypericum plants have a long history of traditional use and have been known for their medicinal applications since antiquity. In the modern era, they are acknowledged for their antidepressant, anti-inflammatory, neuroprotective, anti-cancer, and wound-healing properties. The antidepressant effects of Hypericum are primarily attributed to its active compound, hyperforin. Hyperforin inhibits the reuptake of neurotransmitters such as serotonin, dopamine, and norepinephrine, increasing their availability in the brain and consequently enhancing mood regulation[19,20]. In addition to its antidepressant properties, Hypericum species have been demonstrated to possess notable anti-inflammatory and antioxidant effects. The plant's flavonoids, including quercetin and rutin, have been demonstrated to inhibit Cyclooxygenase-2 (COX-2), a key enzyme in inflammatory processes[21]. Such anti-inflammatory effects are beneficial in conditions such as arthritis and dermatological inflammation. Furthermore, Hypericum demonstrates considerable antiviral and antibacterial properties. Extracts of H. perforatum plants have demonstrated efficacy against various SARS-CoV-2 variants, with the main active constituents being hypericin and pseudohypericin[22]. Additionally, these substances have demonstrated efficacy against herpes simplex virus (HSV) and other viruses by inhibiting viral replication[23]. Moreover, it is effective against Gram-positive bacteria, such as Staphylococcus aureus, making it a valuable therapeutic option for treating infections[24]. Moreover, Hypericum extracts have neuroprotective properties, protecting neurons from oxidative stress and potentially delaying neurodegeneration[25]. These effects make it a promising candidate for further investigation in conditions such as Alzheimer's disease. Additionally, Hypericum is historically used to promote wound healing due to its anti-inflammatory, antibacterial, and collagen-stimulating properties. Topical application of extracts has been demonstrated to accelerate tissue regeneration[26]. Furthermore, Hypericum has been identified as a promising agent for cancer treatment. The potential of hypericin as a photodynamic therapy (PDT) agent has been investigated. PDT is a treatment modality that employs light-sensitive compounds to eradicate malignant cells[5]. However, the use of Hypericum requires caution, particularly given its interaction with the cytochrome P450 enzyme system, notably CYP3A4, which can accelerate the metabolism of various drugs and decrease their efficacy[27].

    • Hypericin (1), (Fig. 2), its derivatives, and protoforms (pseudohypericin, protohypericin, and protopseudohypericin) are naturally occurring naphthodianthrones with a dark red coloration, which are found in the aerial parts of plants[14]. They are predominantly found in plants of the Hypericum genus. Although anthrone derivatives have been reported in other subfamilies, Hypericum is the only plant genus known to contain concentrated anthrones such as hypericins[15]. Hypericins accumulate in multicellular nodules with a black to reddish tint, typically called Dark Glands (DGs)[28] (Fig. 2ac). These structures do not resemble any internal secretory structure described in other plants. They comprise a central core of large cells surrounded by an irregular sheath of flattened cells. In leaves, they do not span the entire height of the mesophyll, as they are separated from the adaxial epidermis by a layer of flattened palisade parenchyma cells[28]. DGs have been observed in approximately two-thirds of the taxonomic sections of the genus[2], and their size and number are positively correlated with naphthodianthrone content[1,29]. The arrangement and distribution of the DGs is also worthy of note, particularly in the leaves, sepals, and petals of the plants, as they serve as a key character for the taxonomic identification of different species[1].
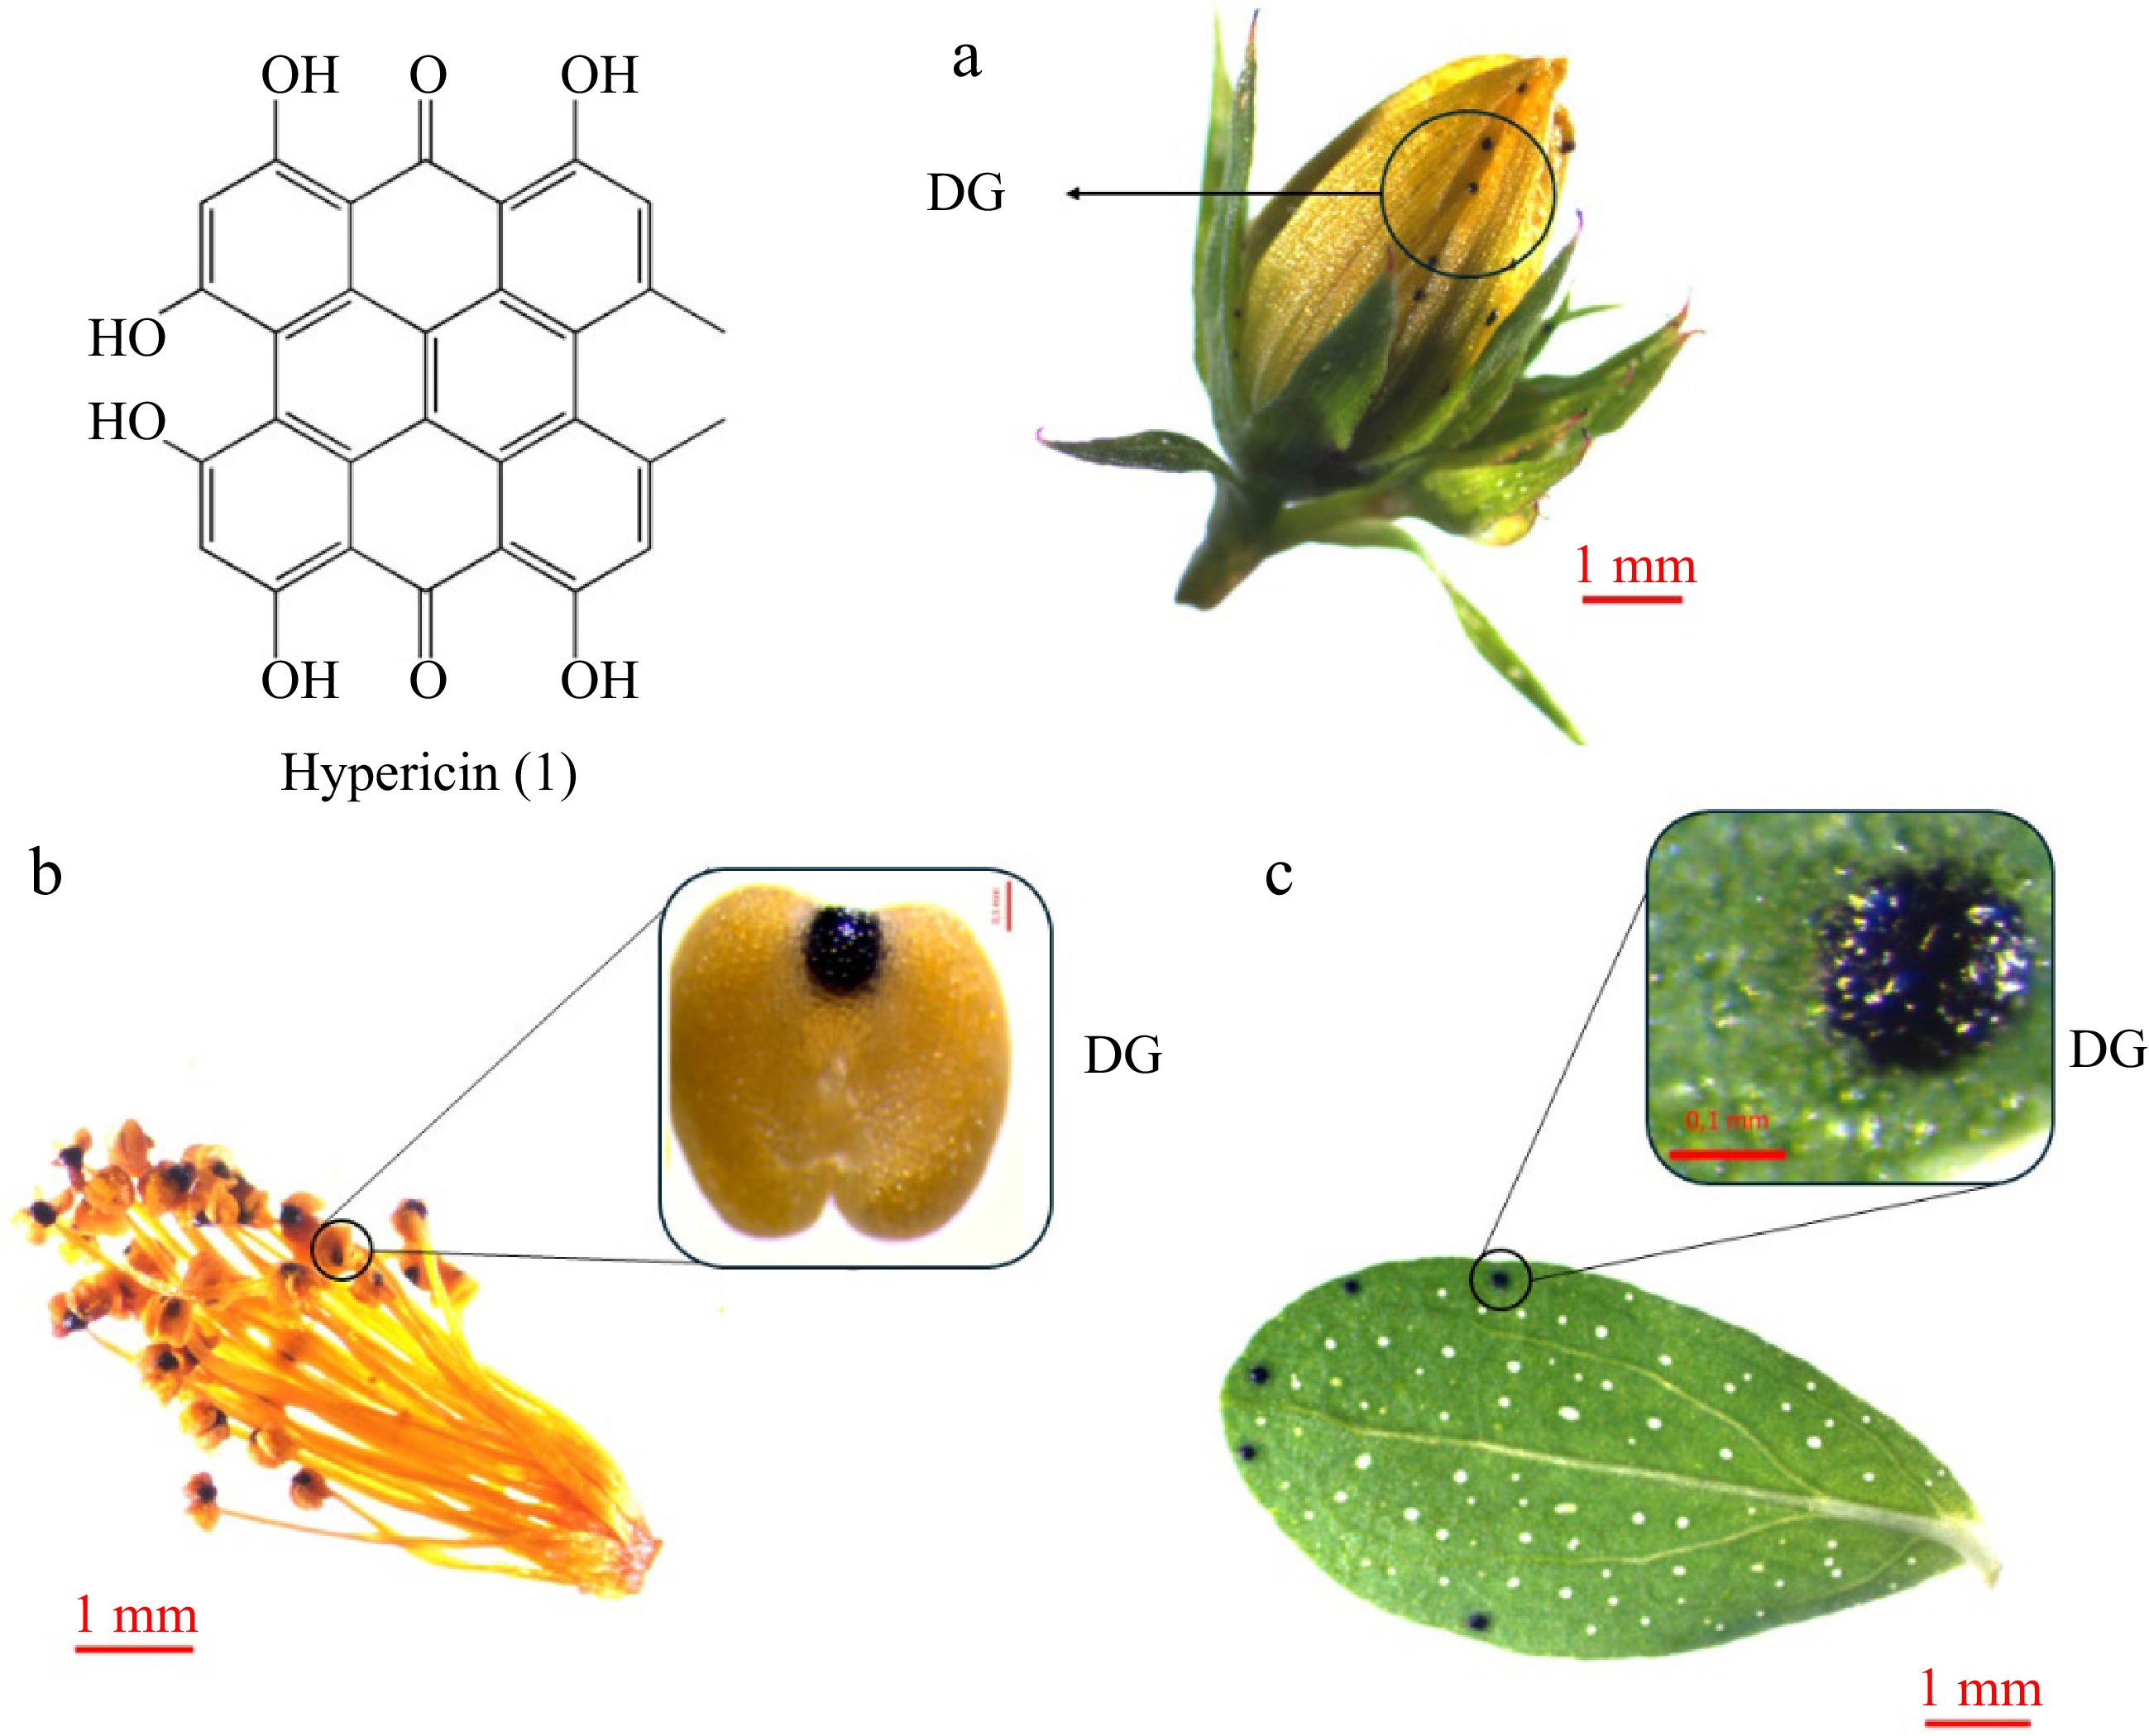
      Figure 2. 

      Hypericin accumulation in Hypericum perforatum organs: (a) bud, (b) stamens, (c) leaf. Hypericin (1) is accumulated in Dark Glands (DGs) of the aerial parts of the plants like (a) sepals and petals, (b) stamens, and (c) leaves.

    • A substantial body of evidence has accumulated over the past few decades indicating that hypericin can elicit a range of pharmacological effects[30]. Given its status as one of the most potent photosensitizers in nature, hypericin has been the subject of considerable investigation for its potential use in photodynamic therapy (PDT) for cancer treatment, mainly due to its ability to exhibit cytotoxic activity upon light activation[5,7]. The results thus far appear promising concerning the induction of cancer cell death. However, further high-quality clinical studies are required to establish hypericin's safety and clinical utility in cancer patients[30,31]. In addition to its potential anticancer properties, hypericin demonstrated robust antiviral activity[30] and has proven to ameliorate cognitive deficits in mouse models of Alzheimer's[32].

    • As the medicinal applications of hypericin are being supported by increasing data over recent years, there has been a growing need for a deeper understanding of its formation. Despite introducing new potential genes over the past decades, the biosynthetic pathway leading to hypericin formation in Hypericum plants remains unclear (Fig. 3, Table 2). Until 2003, there had been no suggestions about the genes or enzymes involved in the biosynthesis of hypericin; it was only known that its production was via the polyketide pathway, most likely via the anthrone emodin[33]. The first step in this pathway was considered to be the polymerization of acetyl-coenzyme A (acetyl-CoA) with malonyl-coenzyme A (malonyl-CoA) via a polyketide synthase (PKS) followed by a subsequent cyclization step to produce an anthrone derivative[33].

      Figure 3. 

      Key points to hypericin biosynthesis research.

      Table 2.  Genes suggested to participate in hypericin and hyperforin biosynthesis.

      Genes involved in hypericin biosynthesis Genes involved in hyperforin biosynthesis
      Confirmed by the functional characterization of the respective protein HpPKS2[34] BCKDH[37]
      CLL[37]
      PKS[37]
      PT1-4[38]
      Hypothetical based on transcriptional data POCP1-4[35]
      TER[17]
      BBE[17]
      Rejected by experiments HYP1[36] HpPKS1[39]

      In 2003, a gene and its encoded protein, potentially involved in hypericin biosynthesis, were reported and described for the first time[36]. The HYP1 gene encodes a phenolic oxidative coupling protein with high homology to Bet.v.1 class allergens[36]. The enzymatic activity attributed to this protein involved the catalysis of four reactions to produce hypericin: (i) a condensation reaction of a molecule of emodin and its anthrone, (ii) a dehydration reaction to produce the dianthrone of emodin, and (iii), (iv) two oxidative coupling reactions to produce first protohypericin and then hypericin. The involvement of the HYP1 protein in the biosynthesis of hypericin was questioned by several publications later on[4042].

      In 2008, an octaketide synthase (OKS) was described[34,39]. This synthase was named HpPKS2, and the corresponding gene was found to be explicitly expressed in the black glands of the plant[34]. HpPKS catalyzed the condensation of one acetyl-coenzyme A with seven molecules of malonyl-coenzyme A, yielding octaketide products but not in the expected cyclic forms. Based on this result, it was suggested that this OKS catalyzed the first reaction towards hypericin formation, possibly followed by the action of a Polyketide Cyclase[34]. Their analysis was based on mRNA expression data from leaf parts with and without DGs, Soták et al.[35] suggested the involvement of phenolic oxidative coupling proteins (POCPs) in some reactions previously associated with HYP1 and introduced four potential genes (POCP1-4) without providing sufficient functional data for the encoded proteins.

      Two relatively recent publications have laid new foundations in the debate on hypericin biosynthesis. In a study published in 2018 by Kimáková et al.[16] demonstrated that the presence of emodin and its anthrone, on the one hand, and the presence of hypericin in Hypericum species, on the other hand, are not correlated. This finding prompted a re-evaluation of the hypothesis that emodin functions as an intermediate in hypericin production. Instead, the researchers put forth an alternative hypothesis involving skyrin. In 2019, Rizzo et al.[17] presented an integrated metabolomic and transcriptomic profile for Hypericum perforatum, utilizing tissue from two different phenotypes of the carpel placenta (with and without DGs). By integrating the chemical profiles of key species compounds (hypericins, endocrine glycosides, flavonoids) with gene expression and black gland development, the authors proposed a revised model for hypericin biosynthesis (Fig. 4). The suggested pathway incorporates previously identified genes/proteins (OKS, POCP) and introduces new candidate genes. This model retained the initial condensation step facilitated by the identified octaketide synthase HpPKS2[34]. The second step is cyclization, which is proposed to be catalyzed by a polyketide cyclase (PKC). This step may address the cyclization error exhibited by HpPKS2 in catalyzing the same reaction. The third step involves two genes designated as dihydrofolate reductases that may encode thioesterases (TERs), which release octaketides and tetraketides from coenzyme A. These octaketides and tetraketides were suggested to act as mediators in the biosynthesis of hypericin and flavonoids[17]. Phenolic oxidative coupling proteins (POCPs), which were previously reported by Soták et al.[35] to play a role in the biosynthesis of hypericin were proposed to facilitate the C-C bond formation of the naphthodiachronic halves of hypericin and its derivatives. An alternative or complementary function to that of POCPs in forming one of the three C-C bonds between the naphthodiachronic halves that make up hypericin is attributed to a Berberine Bridge Enzyme (BBE). This likely involves the formation of the last of the three bonds, for which enzymatic catalysis is required[17]. The initial bond proposed by the authors to be formed is C5-C5', which is catalyzed by POCPs. The second bond is the C10-C10' double bond, which is formed after catalysis by BBE. Finally, the C4-C4' bond is formed in the last step non-enzymatically. The intermediates for hypericin formation are proposed to be atrochrysone carboxylic acid, atrochrysone, atrovirin B, and peniciliopsin. This suggestion completely bypasses emodin while retaining the possibility of forming skyrin, in accordance with the findings of Kimáková et al.[16]. In addition to the hypericin biosynthesis model, Rizzo et al.[17] presented, for the first time, two transcriptional factors potentially involved in DG differentiation by relating gene expression to their development in the carpel placenta.
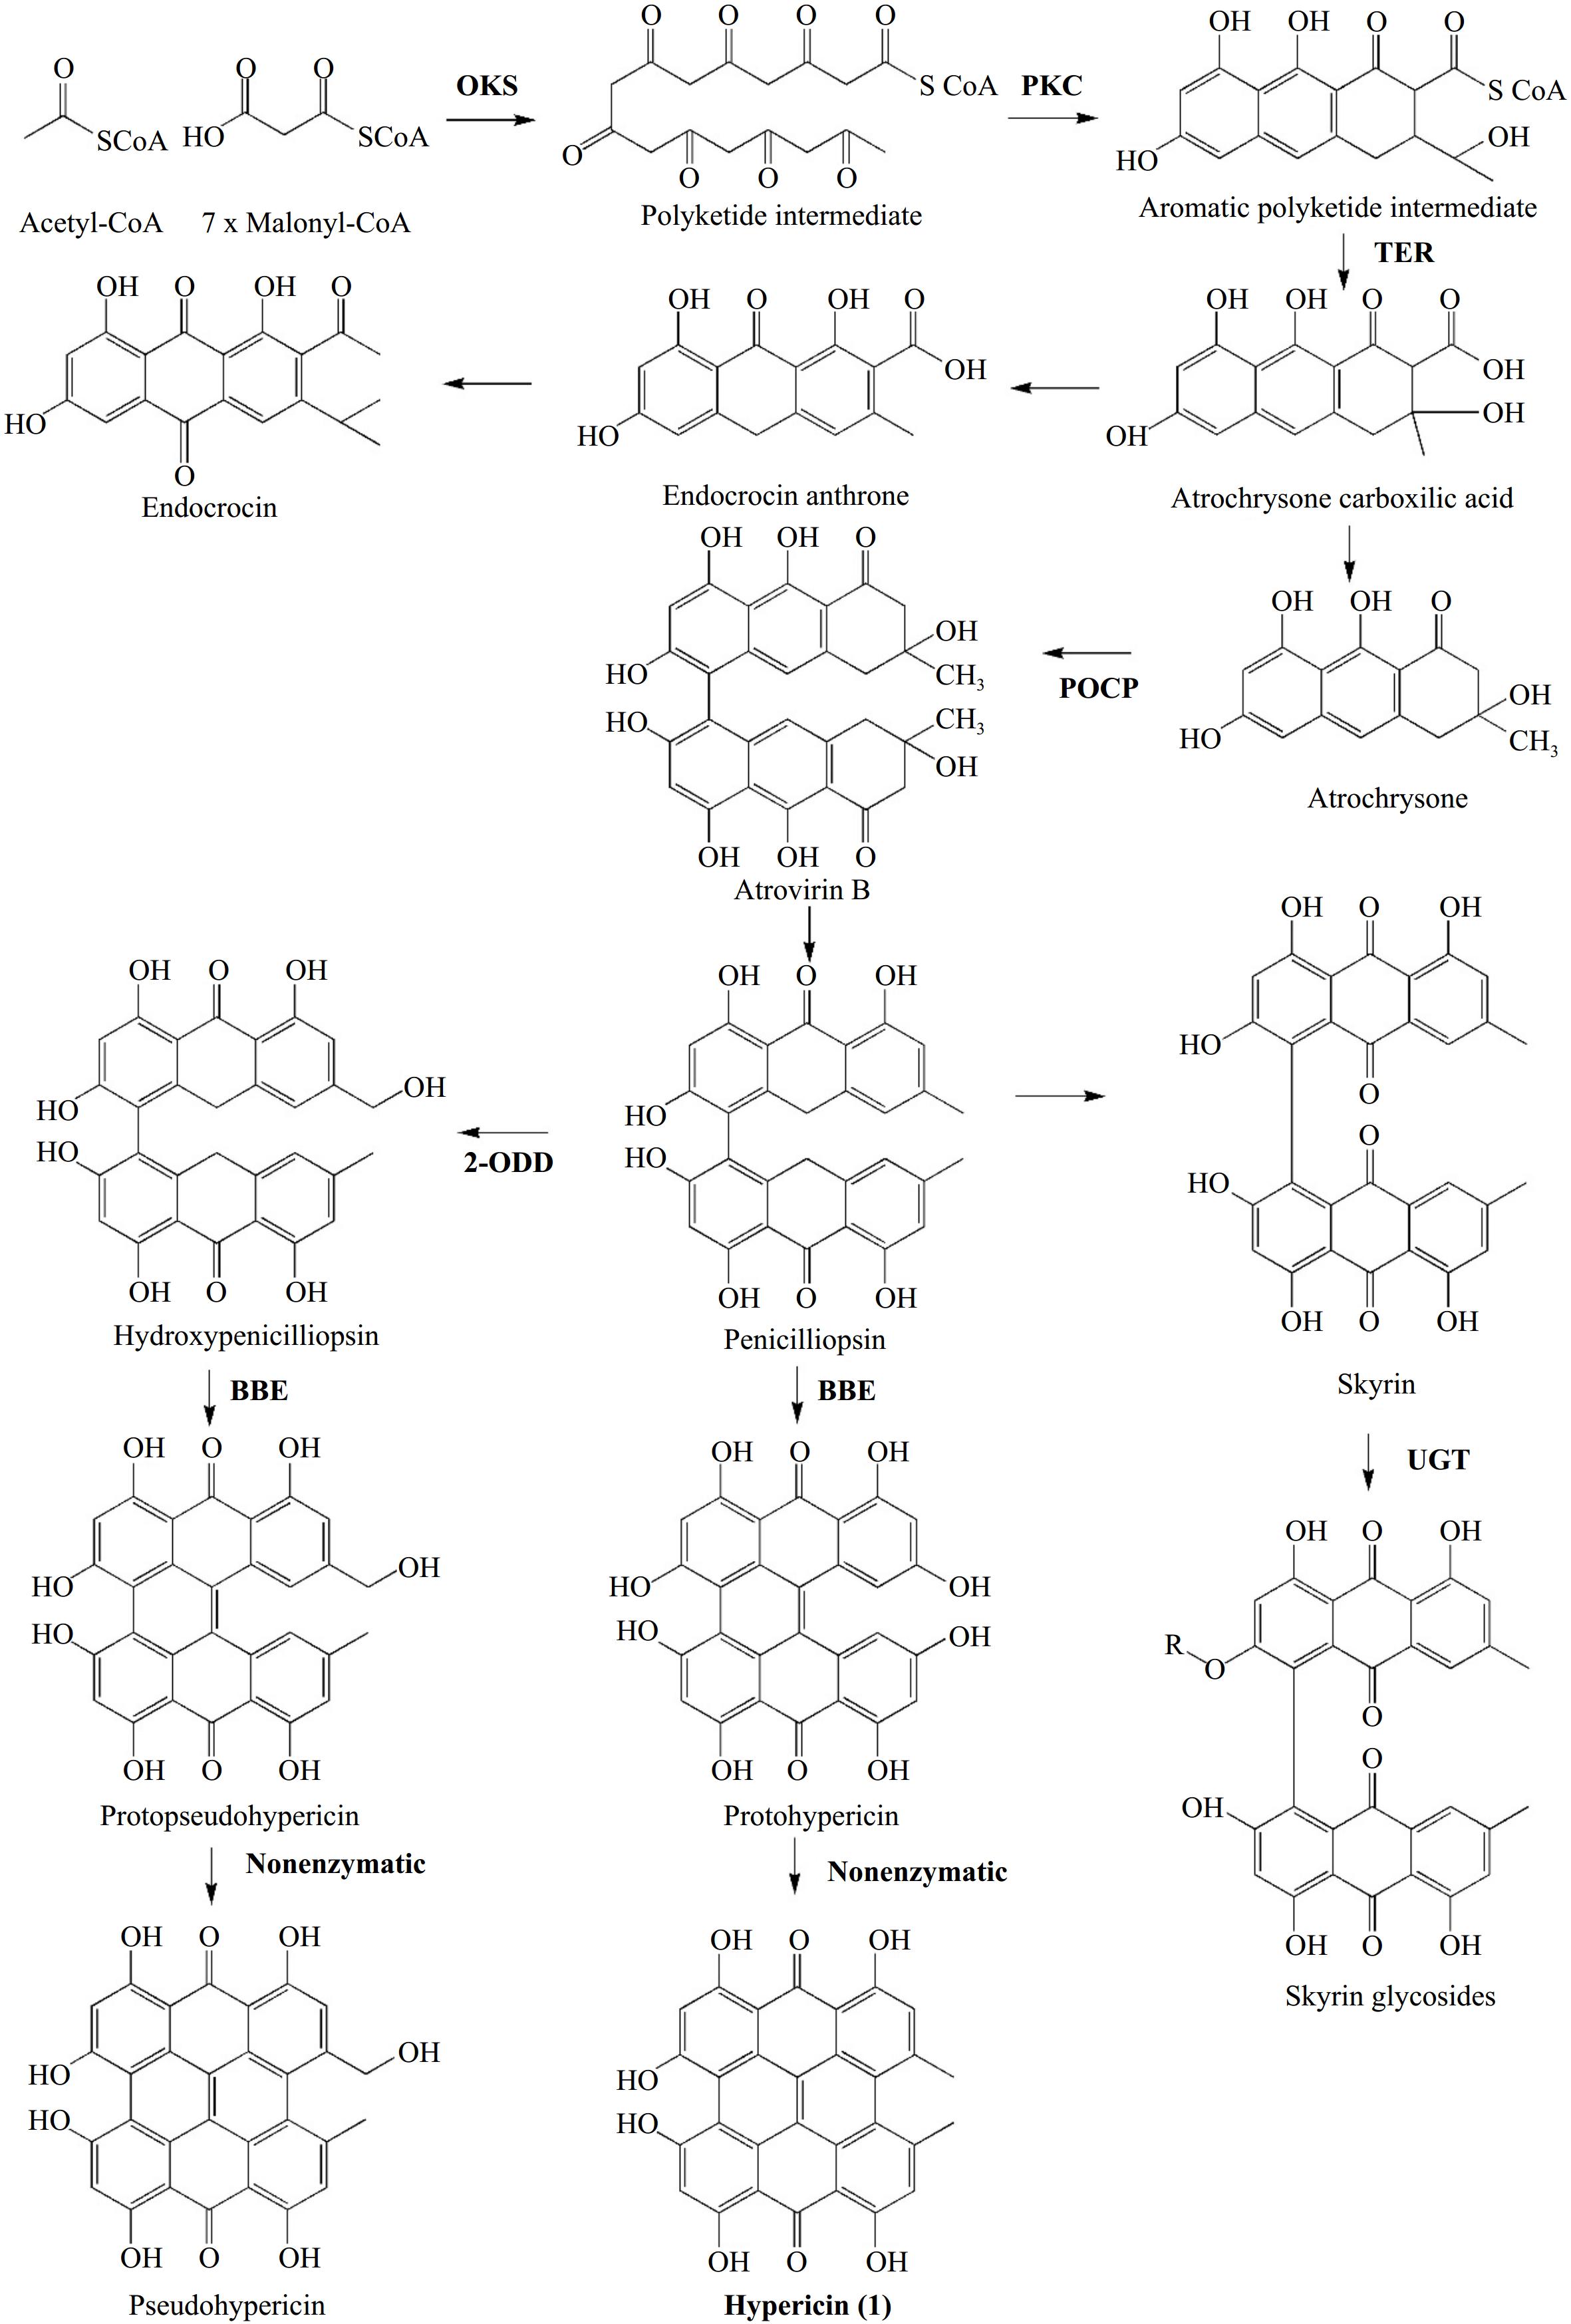
      Figure 4. 

      Hypericin biosynthesis as presented by Rizzo et al.[17]. In bold: enzymes involved in reactions' catalysis. Abbreviations: OKS: Oktaketide Synthase, PKC: Polyketide Cyclase, TER: Thioesterase, POCP: Phenolic Oxidative Coupling Protein, BBE: Berberine Bridge Enzyme, 2-ODD: 2-oxoglutarate and Fe(II)-dependent oxygenase, UGT: UDP-glucosyltransferase.

      In 2020, Zhou et al.[43] provided for the first-time whole genome sequence data of Hypericum perforatum. Following the annotation of the genome, the authors put forth two additional potential pathways for the formation of hypericin. The initial pathway was analogous to those previously proposed, commencing with the condensation of seven malonyl-CoA molecules and one acetyl-CoA, facilitated by a PKS that produces emodin anthrone. An aldolase is proposed to merge emodin and emodin anthrone, which subsequently undergoes phenolic oxidation to form protopseudohypericin and protohypericin. In the final step of the model, light catalyzes the transformation of hypericin and pseudohypericin precursors to the final form of the substances. The second probable pathway proposed by Zhou et al.[43] is consistent with a suggestion previously made by Kimáková et al.[16]. One molecule of 1,2,4,5-tetrahydroxy-7-(hydrymethyl)-9,10-anthraquinone and one molecule of 1,2,4,5-tetrahydroxy-7-methyl-9,10-anthraquinone-2-O-β-glycopyranoside merge through the enzymatic catalysis of a hydrogenase and a tyrosinase and produce Skyrin-6-O-glucopyranocide. Skyrin emerges from the activity of a glycosidase and, through some additional reactions not provided in the model, forms hypericin. While Zhou et al.[43] provided a valuable tool for research on novel biosynthetic genes, their proposed pathways for hypericin formation lacked sufficient evidence. This is particularly evident due to the lack of support from their tests on gene expression levels of the proposed genes in tissues with varying hypericin content.

      To date, the work of Rizzo et al.[17] represents the most comprehensive and well-supported hypothesis regarding hypericin formation, including the well-characterized enzymatic activity of HpPKS2 and the POCP genes, which were previously found to be related to hypericin formation. Nevertheless, research on hypericin biosynthesis is ongoing. The novel genes introduced by Rizzo et al.[17] have yet to be confirmed by new gene expression experiments, and the functional characterization of the proteins translated by these genes remains to be done.

    • The research on the mechanisms controlling hypericin production and DG (dark gland) development is quite limited, with only a few studies published. Most of these studies focus on how H. perforatum responds to different conditions. For example, it has been shown that low temperatures help increase hypericin levels by activating related genes, though the exact mechanism behind this observation is still unclear[44,45]. UV-B light exposure has also been demonstrated to enhance hypericin production[46]. Plant growth regulators, including jasmonic acid, its derivatives, and select cytokinins, have also been shown to stimulate hypericin production[4749]. To date, no transcription factors involved in hypericin production have been identified. However, Rizzo et al.[17] identified two transcription factors closely linked to the initial stages of dark gland formation and proposed their involvement in the differentiation process. One such factor is Agamous-like 6 (AGL6), a MADS-box transcription factor that regulates flower organ identity and meristem fate in Arabidopsis thaliana[50]. The other one is an R2R3-Myb transcription factor, which primarily regulates processes associated with secondary metabolism, cell fate, and organ identity[51].

    • Hyperforin (2) is a bicyclic polyprenylated acylphloroglucinol derivative[52] (Fig. 5). In contrast to hypericin, present in numerous genus taxa, hyperforin is primarily concentrated in H. perforatum[52,53]. The substance is concentrated mainly in the pistils and fruits of plants, where it may function as a defensive factor to safeguard the fruit from herbivores and microbes[52,54]. The pistil and capsule exhibit glandular streaks or patches on their walls. These are classified as vittae when flat or slightly swollen and vesicles when visibly swollen[1] (Fig. 5a). Additionally, hyperforin is accumulated in schizogenic extracellular spaces, along with essential oils[55,56]. This is the second type of gland observed in Hypericum plants, also called Pale Glands (PGs) (Fig. 5b). These structures are spherical or oblong glands comprising a sub-epidermal cavity surrounded by two layers of cells. The internal layer is composed of highly attenuated, thin-walled secretory cells. The external layer comprises parenchymatous cells with thicker walls[28,56]. PGs exhibit a color range from transparent to amber, and they are responsible for the perforated image of the leaves when observed against light[1].
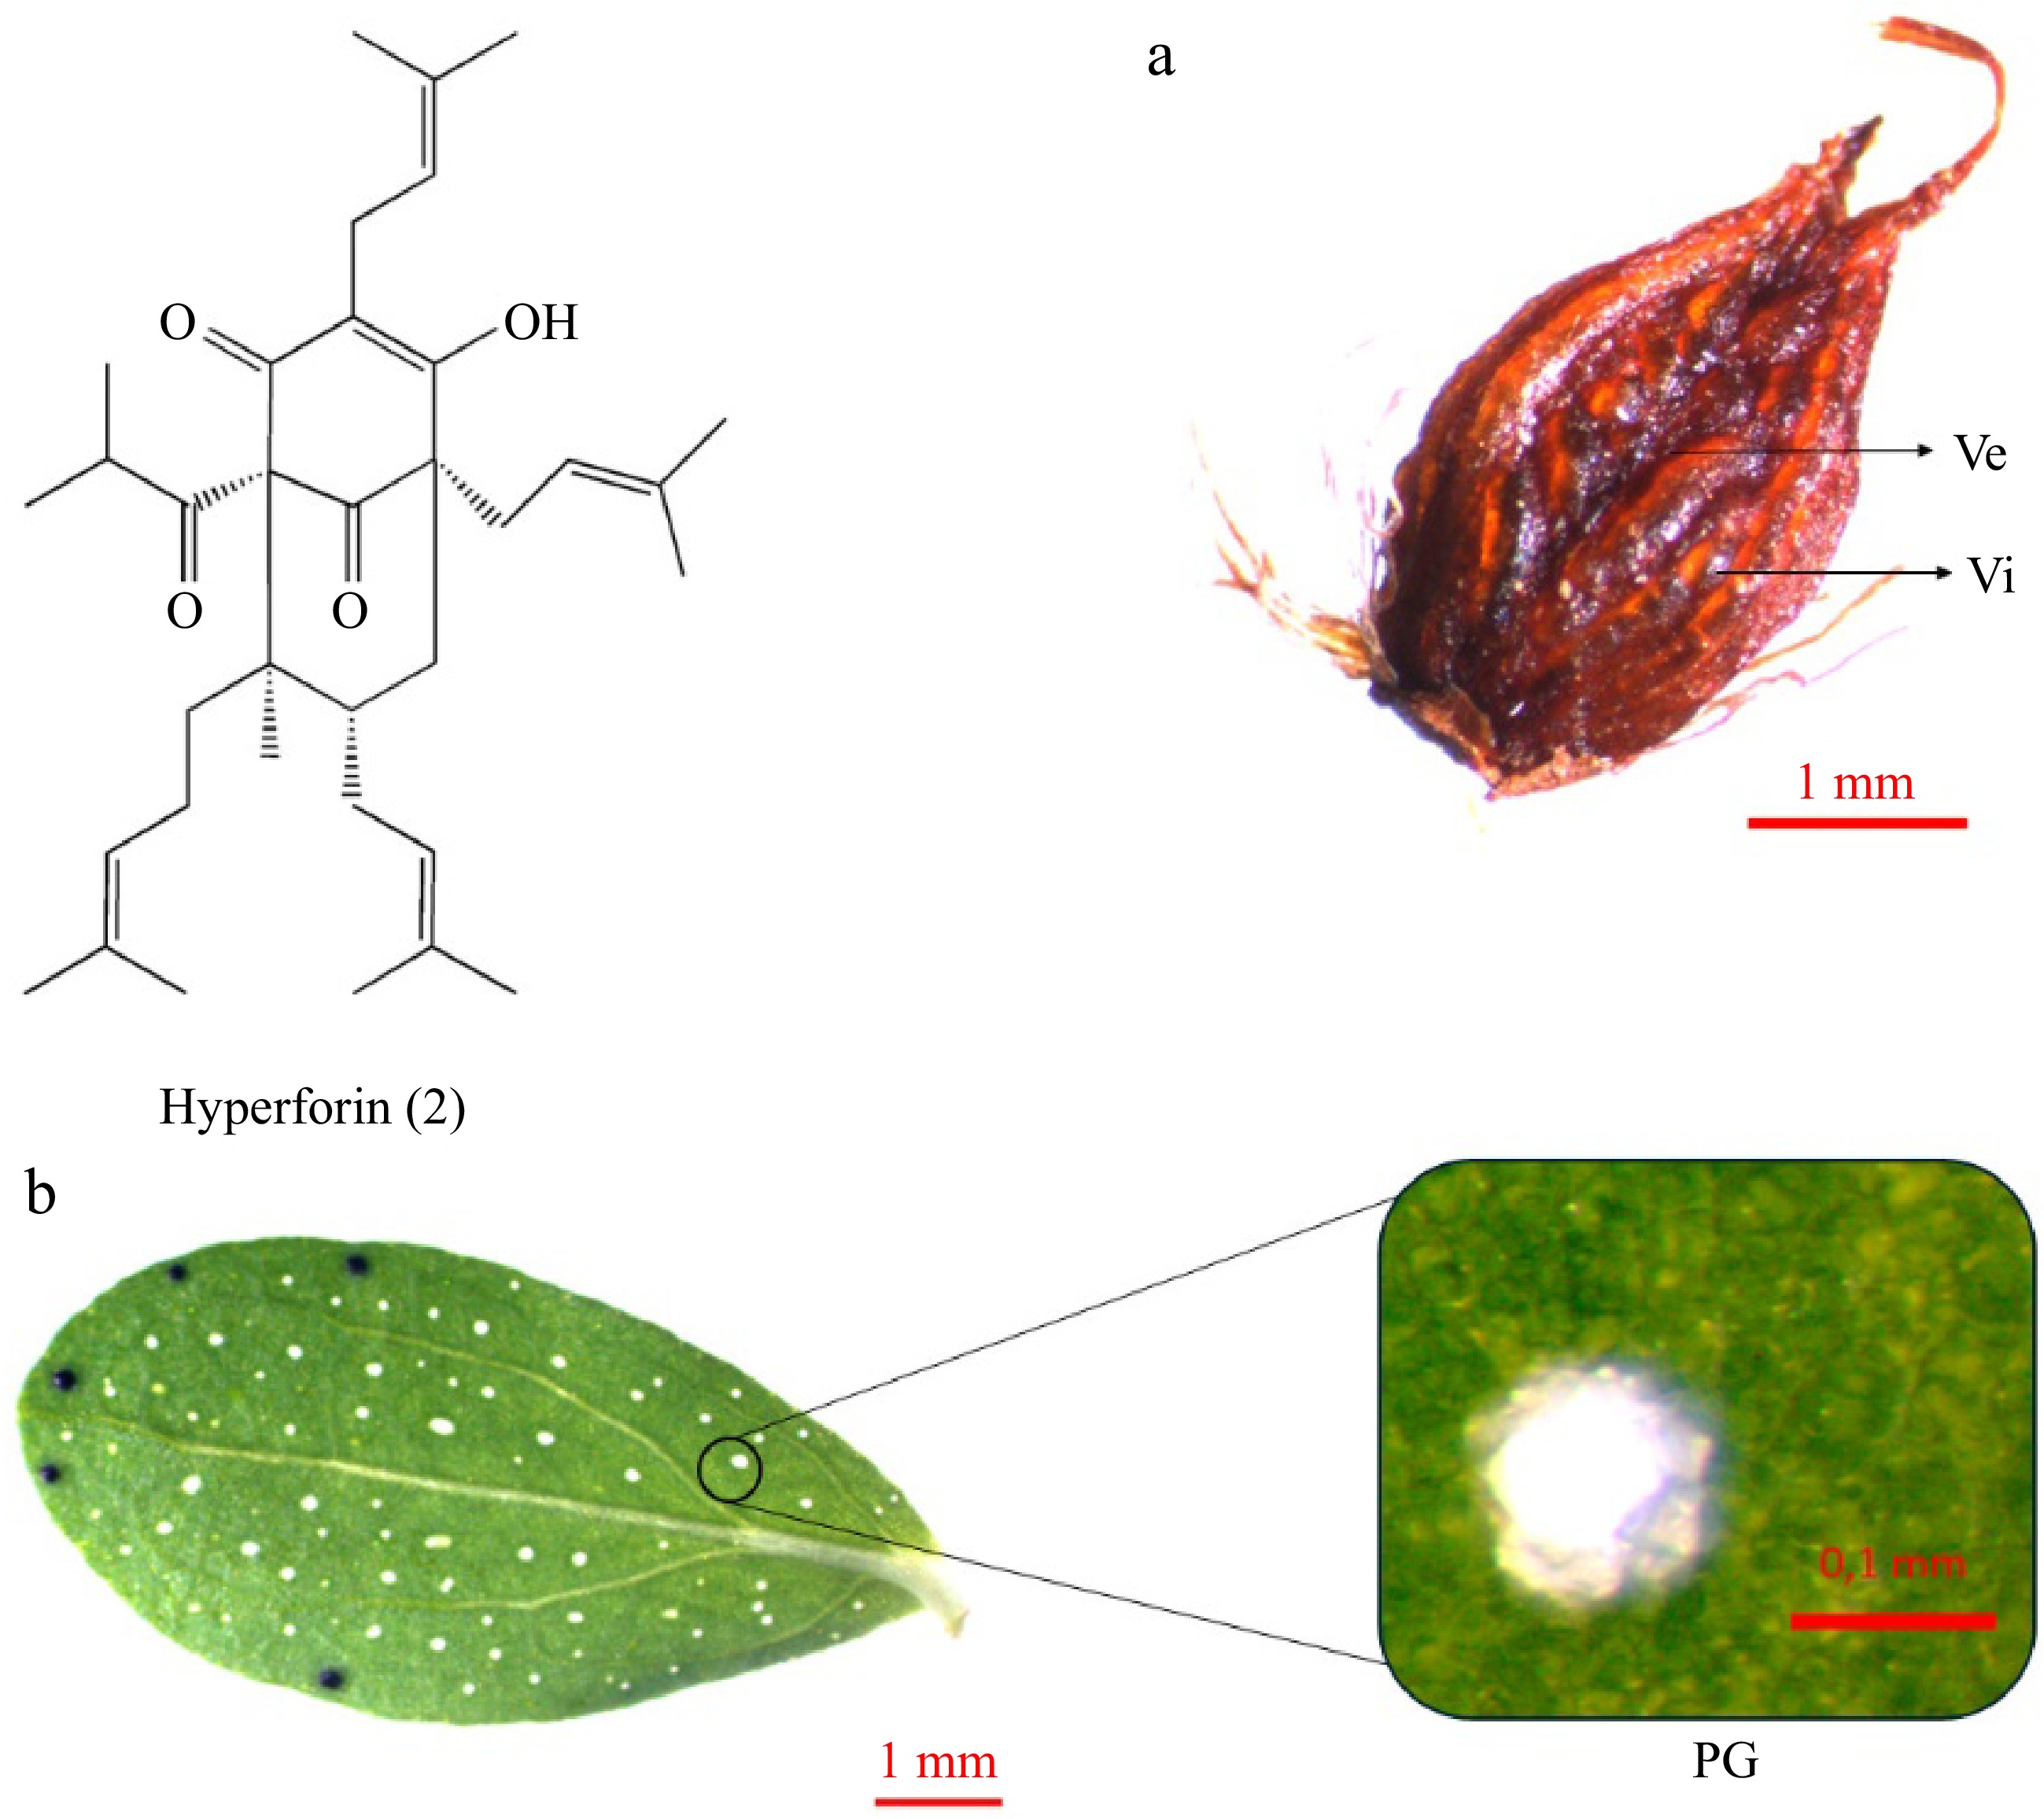
      Figure 5. 

      Hyperforin accumulation in Hypericum perforatum organs: (a) fruit, (b) leaf. Hyperforin (2) is accumulated in formations like vittae (Vi) and vesicles (Ve) on the (a) fruit capsule, and in the (b) Pale Glands (PGs) of the leaves.

    • For an extended period, it was assumed that the antidepressant impact of H. perforatum was primarily attributable to the naphthodianthronic compounds, particularly hypericin. Nevertheless, after experimental and clinical studies, it is now accepted that hyperforin is the primary component responsible for the antidepressant effect[20,58]. Hyperforin acts as a broad-spectrum neurotransmitter reuptake inhibitor that affects the synaptosomal uptake of serotonin, dopamine, norepinephrine, glutamate, and gamma-aminobutyric acid (GABA) with similar efficiency[20]. Subsequently, adaptive alterations in the receptor system occur. The model of action of hyperforin is distinctive from other antidepressants in that it does not directly interact with transmitter transporters. Alternatively, it increases the intracellular sodium concentration, inhibiting gradient-driven neurotransmitter reuptake[57]. This effect on intracellular sodium concentration has been attributed to the activation of non-selective cation channels[58]. In contrast, synthetic antidepressants are competitive inhibitors of either one or, at most, two transporters at the transmitter binding sites. Therefore, hyperforin is not only structurally but also functionally a novel antidepressant[20,52,57]. Additionally, it has been demonstrated to possess antibiotic properties against gram-positive bacteria[24] and anti-cancer activity in vivo[59].

    • In contrast to hypericin, until recently, there was a lack of evidence regarding the biosynthesis of hyperforin, particularly at the level of the genes and enzymes involved, even though Adam et al.[55] described the chemical reactions leading to its formation two decades ago. The chemical structure of hyperforin, consisting of an acylphloroglucinol nucleus and five isoprenoid units, has led Adam et al.[55] to suggest that hyperforin formation is divided into two distinct phases. The initial stage of the process involves the formation of the hyperforin skeleton via a polyketide mechanism. This mechanism entails the condensation of one molecule of isobutyryl-coenzyme A with three molecules of malonyl-coenzyme A, producing phlorisobutyrophenone (hyperforin skeleton). The isobutyryl-CoA molecule acts as the starter molecule, and it is derived from valine[55]. Klingauf et al.[60] proposed later that the condensation is catalysed by an isobutyrophenone synthase (BUS). The second phase involves a series of prenylations of phlorisobutyrophenone (PIBP). A triple electrophilic substitution of the aromatic nucleus is necessary for the formation of hyperforin involving two dimethylallyl pyrophosphatase (DMAPP) units and one geranyl pyrophosphate (GPP) unit. In contrast, another DMAPP unit is involved in the closure of the second ring[55]. It is established that the five isoprenoid moieties are derived predominantly via the non-mevalonate (MEP) pathway[55].

      Until recently, research on enzymes involved in these processes was quite limited. Karppinen & Hohotla[39] took an approach, presenting a cDNA encoding a polyketide synthase (HpPKS1) whose expression was found to be correlated with hyperforin content. Nevertheless, the HpPKS1 protein was observed to yield compounds that are beneficial for the biosynthesis of other secondary metabolites rather than hyperforin[61]. Boubakir et al.[62] described a dimethyl transferase as a participant in prenylation reactions. Subsequently, this enzyme was proposed to catalyze the initial prenylation reaction of the hyperforin skeleton.

      However, two recent studies conducted by the same research team have yielded new insights regarding the enzymatic reactions involved in hyperforin formation (Fig. 6). The first study addressed the reactions mediating the hyperforin skeleton formation[37], while the second examined the prenylation reactions that lead to the final formation of hyperforin[38]. To investigate the enzymes involved in phlorisobutyrophenone formation, Wu et al.[37] employed genome mining on the genome data of H. perforatum, as published by Zhou et al.[43], to identify candidate Biosynthetic Gene Clusters (BGCs). Along with transcriptomic, phylogenetic, and metabolomic data, they were able to characterize two BGCs with branched-chain keto acid dehydrogenase E1 subunit alpha (BCKDHA), CoA ligase (CCL) and PKS genes, of which the translated enzymes catalyze the formation of hyperforin precursor, phlorisobutyrophenone. BCKDHA and CCL translated enzymes were attributed to facilitating the transformation of valine to isobutyryl-CoA, while PKS enzymes were proposed to act as catalysts in the condensation of isobutyryl-CoA with malonyl-coenzyme A, ultimately leading to the formation of phlorisobutyrophenone. The authors provided comprehensive data on the expression levels of the genes and the functional characterization of the respective proteins, thus establishing a well-defined model for phlorisobutyrophenone biosynthesis[37]. In their most recent research, the authors investigated the subsequent steps leading to hyperforin formation through a series of prenylation reactions of the phlorisobutyrophenone core[38]. The tetraploid genome of H. perforatum was sequenced, and single-cell atlases were generated for leaves and flowers. By mapping upregulated genes, previously characterized to be involved in phlorisobutyrophenone core formation (BCKDHA, CCL, PKS), the researchers identified a new type of cell, designated 'Hyper cells', in which de novo biosynthesis of hyperforin occurs. They identified and characterized four new prenyltransferases (PTs) belonging to the UbiA family, which are involved in the hyperforin biosynthesis pathway. Furthermore, by employing two synthetic biology platforms for heterologous expression, they were able to produce the protein molecules in yeast and tobacco and produce hyperforin by employing the necessary substrates[38]. The four prenyltransferases (PTs) introduced in this study addressed the knowledge gap regarding the enzymes involved in hyperforin biosynthesis. It is noteworthy that the final step in hyperforin biosynthesis involves an unconventional prenyltransferase that catalyzes the 1′-2 coupling (branching) between two isoprenyl units and facilitates the formation of a bond between C1 and C8, resulting in cyclization and biosynthesis[38]. Such cyclizations, which generate complex polycyclic structures, are a defining characteristic of natural product biosynthesis.
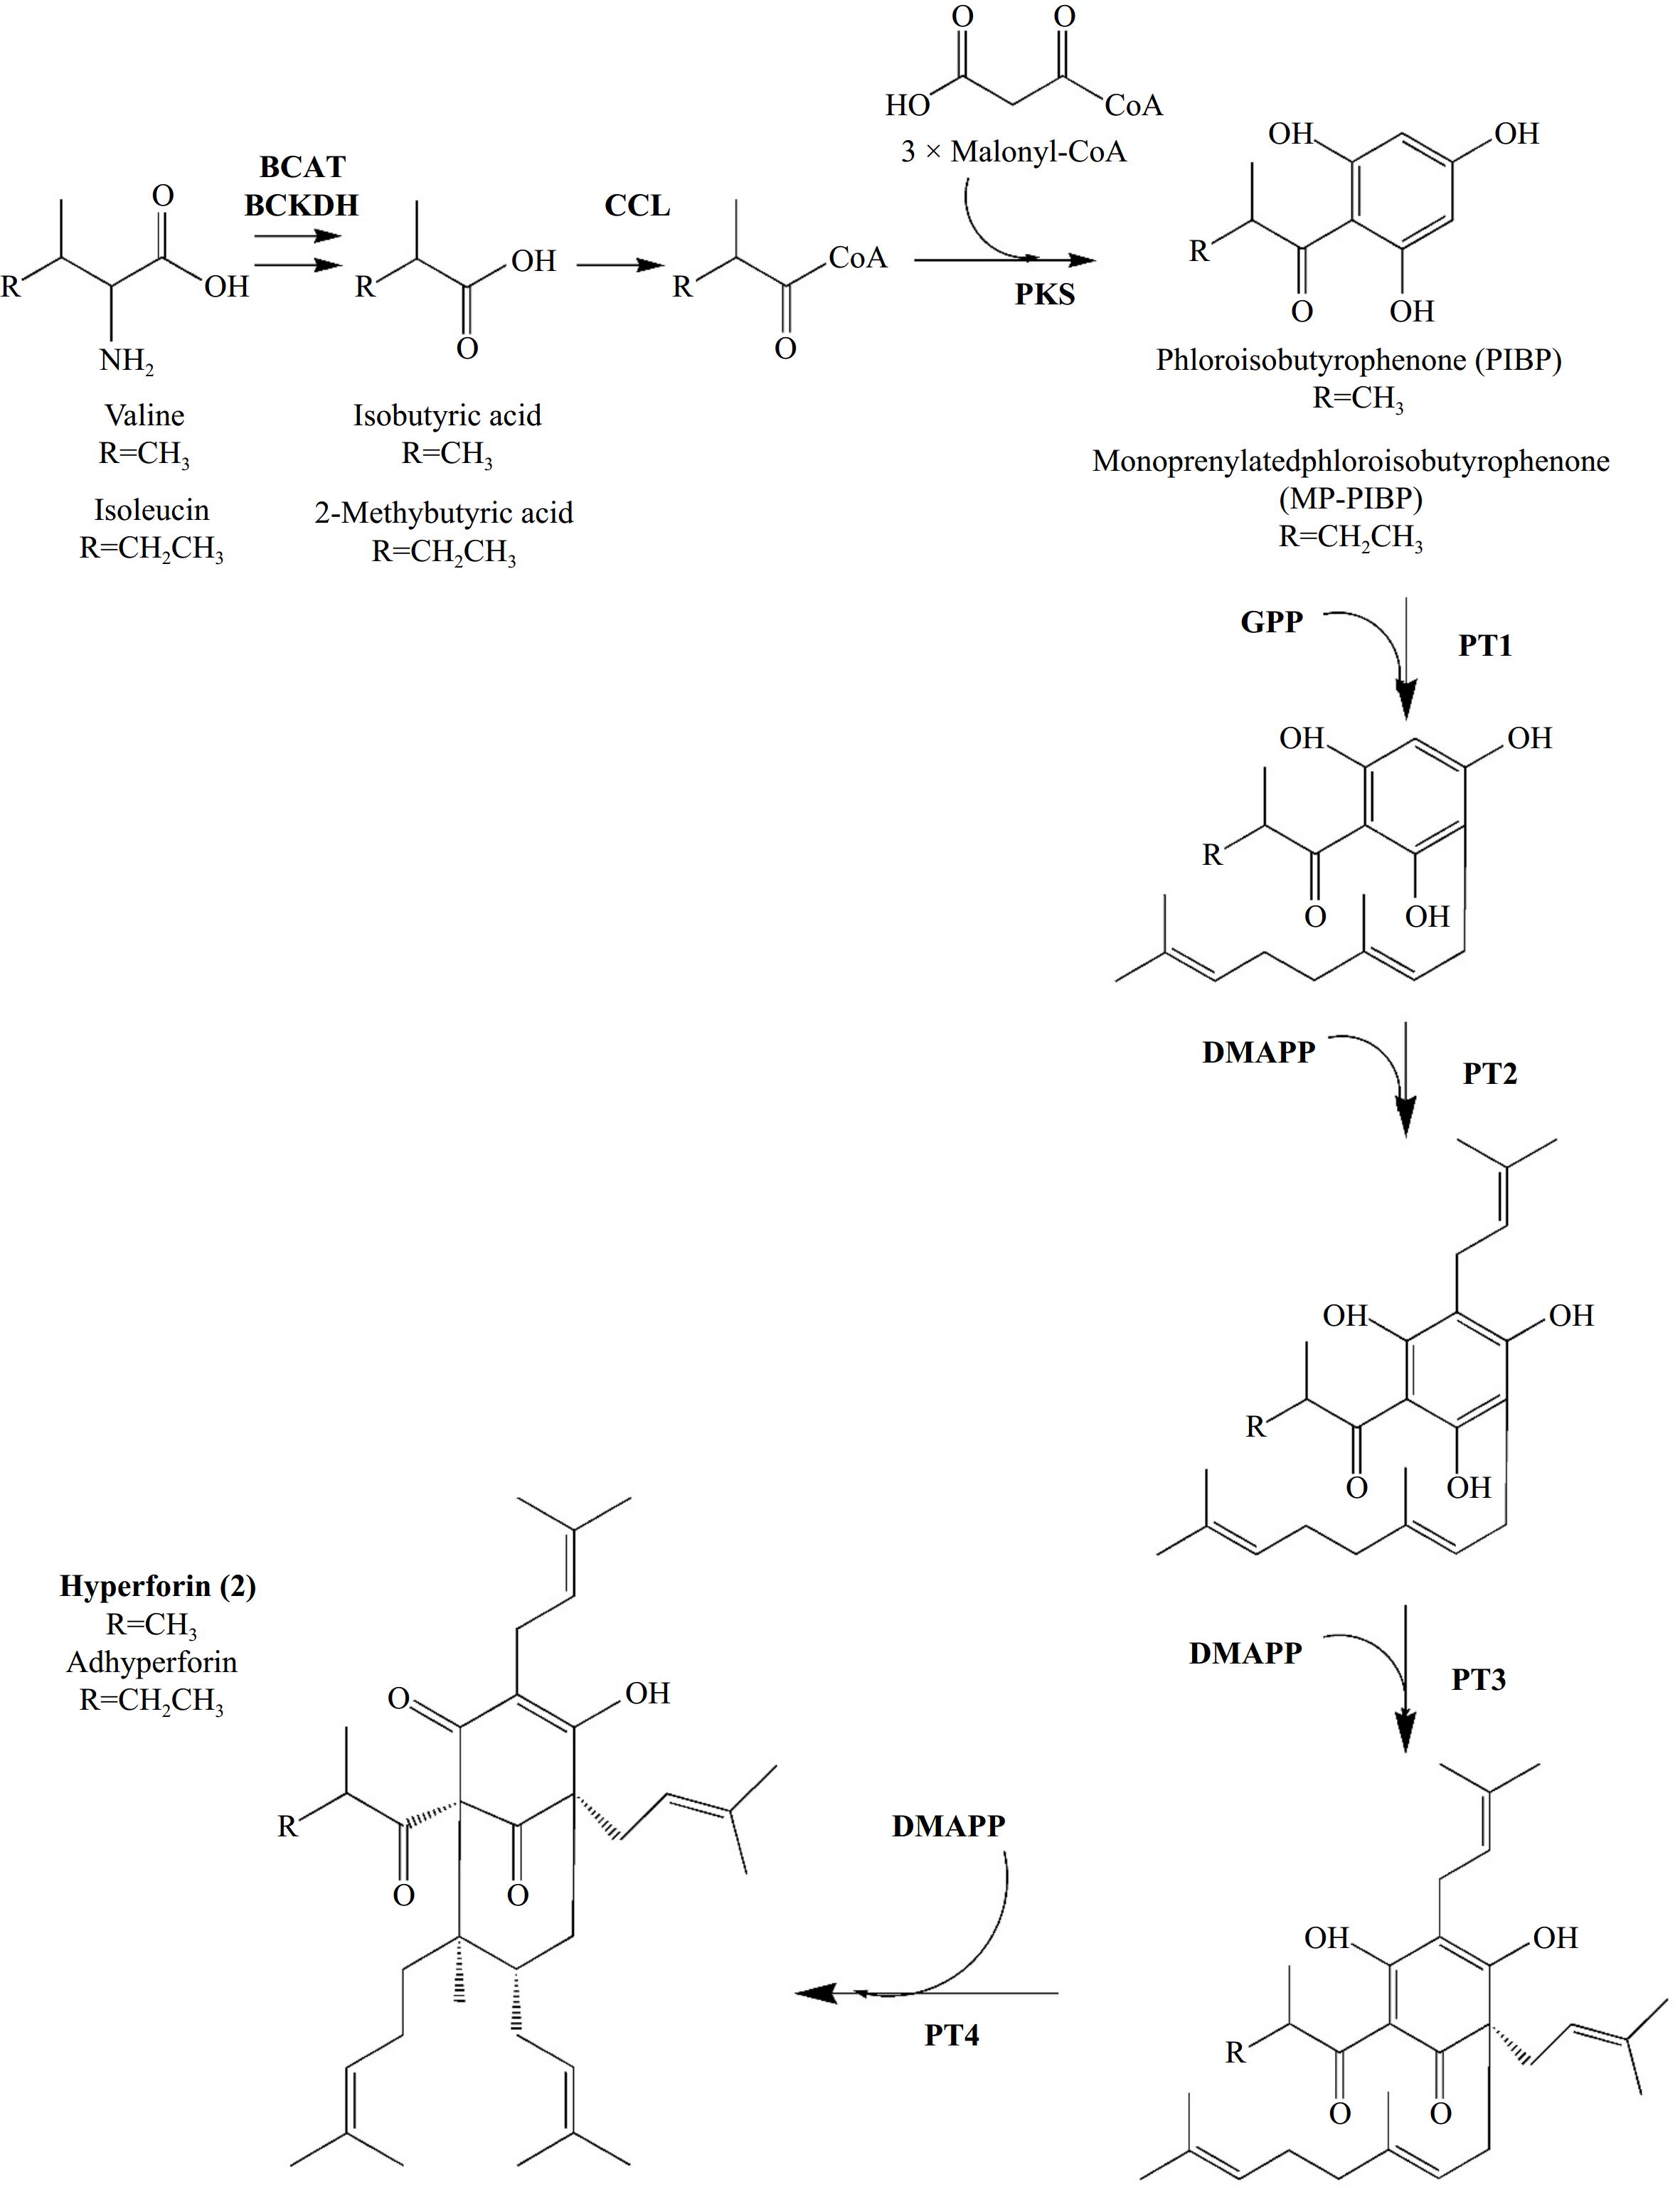
      Figure 6. 

      Biosynthesis of Hyperforin (2) and its homologue Adhyperforin according to Wu et al.[37,38]. In bold: enzymes involved in reactions' catalysis and prenyl-groups. Abbreviations: BCAT: branched-chain amino acid aminotransferase, BCKDH: branched-chain alpha-keto acid dehydrogenase, CCL: CoA ligase, PKS: Polyketide synthase, PT: Prenyltransferase, DMAPP: dimethylallyl-diphosphate, GPP: geranyl-diphosphate.

      These two studies fully elucidate hyperforin biosynthesis with an approach that can be regarded as complete and well-supported. However, they are still very recent and supporting those results from other experiments is necessary to confirm that hyperforin biosynthesis has now been established as a well-understood process at a chemical and molecular level.

    • Xanthones represent a diverse group of naturally occurring polyphenolic compounds extensively distributed among bacteria, fungi, lichens, and plants[63]. Simple oxygenated xanthones and prenylated xanthones are predominantly found in the roots of Hypericum species[18]. Over 100 xanthones have been isolated and identified from Hypericum species. These xanthones exhibit structural diversity, with variations in the patterns of hydroxyl, methoxy, prenyl, butenyl, and glycoside substitutions on the base structure. Notable xanthones present in H. perforatum include 1,3,6,7-tetrahydroxyxanthone (norathyriol), mangiferin, isomangiferin, and the xanthonolignoid kielcorin[18].

      In recent decades, xanthones have emerged as a significant resource for developing new pharmaceutical agents. The pharmacological effects of plant xanthones are diverse, encompassing anticancer, antidiabetic, and antimicrobial activities[64].

      The biosynthesis of xanthones in Hypericum species has been thoroughly investigated. Analogous to hyperforin biosynthesis, the creation of the xanthone skeleton is followed by a series of reactions, such as hydroxylations and prenylations. Formation of the xanthone skeleton (Fig. 7) involves condensing one benzoyl-CoA molecule with three malonyl-CoA molecules to form 2,4,6-trihydroxybenzophenone (246THB). The reaction is catalyzed by a type III PKS known as benzophenone synthase (BPS)[65]. Subsequently, 246THB undergoes hydroxylation to give 2,3′,4,6-tetrahydroxybenzophenone (23′46THB), followed by regioselective oxidative phenol couplings to yield either 135THX or 137THX. The latter hydroxylation and coupling reactions are catalyzed by the bifunctional cytochrome P450 enzymes CYP81AA1 and CYP81AA2[66]. Finally, xanthone 6-hydroxylase (X6H) catalyzes the hydroxylation of 1,3,5- and 1,3,7-trihydroxylated xanthones to their corresponding tetrahydroxy derivatives, namely 1,3,5,6-tetrahydroxyxanthone (1356THX) and 1,3,6,7-tetrahydroxyxanthone (1367THX), respectively[67]. Recent advancements have led to characterizing genes encoding aromatic prenyltransferases that specifically prenylate xanthones from Hypericum perforatum at the C-4 position[63]. This discovery enhances our understanding of the formation of polyprenylated xanthone derivatives. Notably, the prenylation of xanthones at the C-4 position has been reported to improve the biological activities of the resulting prenylated derivatives.

      Figure 7. 

      Formation of the xanthone skeleton[6567]. In bold: enzymes involved in reactions catalysis. Abbreviations: BPS: benzophenone synthase, CYP81AA1 (TXS1) and CYP81AA2 (TXS2): bifunctional cytochrome P450 enzymes, X6H: xanthone 6-hydroxylase.

    • Flavonoids represent a relatively diverse family of aromatic molecules derived from the amino acid phenylalanine and malonyl-coenzyme A[68]. Flavonoids are commonly involved in ultraviolet protection, flower pigmentation, and pathogen and herbivore resistance, and they also affect various developmental processes in plants[68]. Flavonoids derived from Hypericum plants have been demonstrated to possess antidepressant effects[69] by playing an important role in the modulation of the hypothalamic-pituitary-adrenal (HPA) axis[70]. The flavonoid biosynthetic pathway has been one of the most intensively studied metabolic systems in plants. Flavonoids are derived from the phenylpropanoid metabolic pathway and have a basic structure that comprises a C15 benzene ring structure of C6-C3-C6. Studies have highlighted the complexity of the biosynthesis of flavonoids in the plant kingdom, forming a wide network of reactions[71]. Enzymes identified to take part in flavonoid formation, specifically in Hypericum plants, include Chalcone Synthase[71] and, from more recent work, flavanone 3-hydroxylase, flavonol synthase, flavonoid 3-hydroxylase, and flavonoid 3-O-galactosyltransferase[72].

      Essential oils (EOs) are complex blends of volatile compounds, well-known for their strong antimicrobial, antioxidant, and antiangiogenic effects. In species of the Hypericum, essential oils are stored in PGs and hyperforin (Fig. 5b). However, Hypericum species are often noted for their low essential oil content[73]. Key constituents of Hypericum essential oils include monoterpene hydrocarbons, sesquiterpene hydrocarbons, and oxygenated sesquiterpenes[74]. The essential oil and volatile constituents most frequently reported in Hypericum species include the aliphatic hydrocarbons n-nonane and n-undecane; the monoterpenes α-pinene and β-pinene; and the sesquiterpenes β-caryophyllene and caryophyllene oxide[73]. A recent review of the chemical composition and bioactivities of Hypericum essential oils has highlighted their medicinal potential[74]. Notably, essential oils from Hypericum species have demonstrated the ability to facilitate wound healing[75]. Given their likely presence in infused oils, these essential oils likely play a crucial role in enhancing the wound-healing effectiveness of traditional Hypericum preparations[75].

    • Research on the secondary metabolism of Hypericum species presents significant opportunities, driven by advances in biotechnology, pharmacology, cultivation techniques, and interdisciplinary collaboration. Using genomic and metabolomic tools is expected to enhance our understanding of the biosynthetic pathways leading to the formation of secondary metabolites in Hypericum. Techniques such as CRISPR may facilitate the targeted production of important compounds like hypericin and hyperforin, while synthetic biology offers the potential to replicate these pathways in microorganisms, supporting more sustainable large-scale production. In pharmacological research, well-designed clinical trials evaluating the efficacy and safety of Hypericum extracts and individual metabolites will be critical for establishing evidence-based practices and novel medicinal products. Moreover, exploring the potential synergistic effects of Hypericum compounds in combination therapies could provide new insights into treatment approaches. Collaboration among botanists, pharmacologists, chemists, and biotechnologists will be vital in advancing research and understanding the therapeutic potential of Hypericum. Continued work in these areas could lead to developing new therapeutic agents that address contemporary medical needs.

    • Hypericum is a highly diverse genus that has attracted the attention of researchers across various academic fields. Its complex taxonomy, ethnobotanical uses of different species worldwide, chemical diversity, and applications in modern medicine have made it a subject of extensive study for many years. This review aims to highlight the considerable pharmacological potential of Hypericum species, attributed to their diverse secondary metabolites while focusing on novel insights into their formation. Studying plant secondary metabolite biosynthesis can be challenging, requiring the integration of various pieces of knowledge to construct a comprehensive picture of a biosynthetic pathway. In Hypericum plants, the biosynthesis of two essential substances—hypericin and hyperforin—known for their significant medicinal value, has puzzled scientists for several years. However, recent advances in transcriptomics, metabolomics, and genomics, along with their increasing accessibility to researchers, have facilitated the identification of new enzymes and genes involved in their formation. As a result, elucidating the biosynthetic pathways of hypericin and hyperforin now seems closer than ever. Other substances present in Hypericum plants are more commonly found in other plant genera, and their biosynthesis is better understood due to studies conducted on those organisms. Despite these advancements, the field faces significant challenges, particularly in functional characterizing newly identified biosynthetic genes and enzymes. Further research is needed to confirm the roles of these genes and elucidate their regulatory mechanisms.

      It is also important to note that most studies on hypericin biosynthesis primarily focus on H. perforatum. Investigating whether the genes expressed in H. perforatum are identical or similar to those in other Hypericum species would be valuable, as would understanding the extent to which gene expression is associated with hypericin content in these plants. Another intriguing question is whether these genes are present and expressed in taxa that do not produce hypericin, suggesting that these genes may serve additional functions or be unique to hypericin-synthesizing taxa. Furthermore, understanding the influence of genetic and environmental factors on metabolite synthesis will be essential for optimizing the production of these bioactive compounds in cultivation. Integrating biotechnological applications holds promise for enhancing the yield and efficiency of metabolite production, which could lead to the development of novel therapeutic agents derived from Hypericum species.

      In conclusion, the ongoing investigation of Hypericum secondary metabolites not only reaffirm their historical significance in traditional medicine but also pave the way for new avenues of pharmaceutical innovation. By addressing current knowledge gaps and employing advanced research methodologies, future studies can fully elucidate the medicinal potential of Hypericum species, contributing to developing effective and sustainable therapeutic solutions.

      • We acknowledge the support of this work by the project 'Upgrading the plant capital' (MIS 5002803), which is implemented under the Action 'Reinforcement of the Research and Innovation Infrastructure', funded by the Operational Programme 'Competitiveness, Entrepreneurship and Innovation' (NSRF 2014-2020) and co-financed by Greece and the European Union (European Regional Development Fund); the National Strategic Reference Framework (NSRF), Research Funding Programme of the Action RESEARCH – CREATE – INNOVATE (AROMADISTIL – 95783).

      • The authors confirm contribution to the paper as follows: study conception and design: Poulaki S, Vlachonasios K; draft manuscript preparation: Poulaki S; manuscript review & editing: Vlachonasios K, Poulaki S; figures design, original photos in Figs 2 & 5: Poulaki S. Both authors reviewed and approved the final version of the manuscript.

      • Data sharing not applicable to this article as no datasets were generated or analyzed during the current study.

      • The authors declare that they have no conflict of interest.

      • Copyright: © 2024 by the author(s). Published by Maximum Academic Press, Fayetteville, GA. This article is an open access article distributed under Creative Commons Attribution License (CC BY 4.0), visit https://creativecommons.org/licenses/by/4.0/.
    Figure (7)  Table (2) References (75)
  • About this article
    Cite this article
    Poulaki S, Vlachonasios K. 2024. Secondary metabolites of medicinal use in Hypericum spp.: a rich history and a promising future. Medicinal Plant Biology 3: e025 doi: 10.48130/mpb-0024-0027
    Poulaki S, Vlachonasios K. 2024. Secondary metabolites of medicinal use in Hypericum spp.: a rich history and a promising future. Medicinal Plant Biology 3: e025 doi: 10.48130/mpb-0024-0027

Catalog

  • About this article

/

DownLoad:  Full-Size Img  PowerPoint
Return
Return