


-
Gene expression analysis plays a vital role in enhancing our understanding of the molecular mechanisms underlying diverse biological processes[1]. Real-time quantitative PCR (qRT-PCR) is the most widely employed tool for relative gene quantification due to its high throughput, sensitivity, repeatability, simplicity, and low cost[2−4]. However, the accuracy of qRT-PCR can be influenced by various factors, including RNA integrity and purity, cDNA synthesis efficiency, primer specificity, PCR amplification efficiency, and the selection of reference genes (RGs) for standardization[5]. Normalization is essential to address variations in template quantity. RGs are utilized for gene expression normalization because of their consistent expression levels across different tissues, developmental stages, and treatment conditions[6].
In general, constitutively expressed housekeeping genes are typically selected as RGs, such as actin (ACT), glyceraldehyde-3-phosphate dehydrogenase (GAPDH), elongation factor 1 alpha (EF1α), tubulin (TUB), and ubiquitin (UBC)[1,7,8]. However, numerous studies have also reported that there no universal reference gene applicable to all experimental conditions, which may include different species[9], varying environmental conditions[10,11], and even across different developmental stages or different tissues within a single species[12,13]. Research has demonstrated that the expression levels of RGs can vary significantly, potentially leading to inadequate gene normalization[1]. Therefore, it is essential to identify appropriate RGs for specific experimental conditions prior to normalizing gene expression.
Dendrobium nobile L. (D. nobile) is a perennial epiphytic herb belonging to the genus Dendrobium in the Orchidaceae family. D. nobile is primarily utilized as a source for the Traditional Chinese Medicine (TCM) known as 'Shi Hu'[14]. This species is characterized by the presence of abundant picrotoxane-type sesquiterpene alkaloids (PSAs), which have demonstrated unique pharmacological and therapeutic properties, including antiviral and anticancer activities, as well as the ability to alleviate symptoms of diabetes[15,16]. This broad spectrum of utility has attracted increasing attention on the biosynthesis of these alkaloids. However, the lack of a consistently expressed reference gene has hindered the accurate normalization of RT-qPCR data in D. nobile, posing a significant challenge for gene expression studies in this species.
In this study, a set of genes was employed as candidate RGs based on the transcriptome datasets of D. nobile, including elongation factor 2 (EF2-1), elongation factor 1 (EF1γ), 60S ribosomal protein L7 (60SRPL7), actin (Actin), ubiquitin-conjugating enzymes E2 (UBCE1 and UBCE2), actin-depolymerizing factor 7 (ADF7), and 60S ribosomal protein L26 (60SRPL26). The full-length coding sequences (CDSs) of these genes were cloned and verified. The expression of selected candidate RGs under various experimental conditions was determined using qRT-PCR. The expression stability of these genes was assessed using four algorithms (GeNorm, NormFinder, BestKeeper, and ΔCt) and subsequently ranked by RefFinder based on the results from the four programs.
FPPS, the key enzyme gene involved in sesquiterpene biosynthesis plays a vital role in the biosynthesis of PSAs in D. nobile[17]. In this study, relative expression patterns of DnFPPS were analyzed across various tissues, developmental stages of seedlings, and under different stress conditions to validate the application of RGs. This research is the first to systematically identify and validate suitable RGs for gene expression quantification in D. nobile across different experimental conditions. The findings will enhance future gene expression analyses and contribute to further research on gene functions related to the biosynthesis of PSAs in D. nobile.
-
D. nobile seedlings were transplanted into a controlled greenhouse environment at Guizhou University in Guiyang, China. The growth medium consisted of a mixture of pycnogenol and vermiculite in a 3:1 ratio. Tissue samples, including roots, stems, and leaves, were harvested from one-year-old seedlings. Additionally, floral tissues, comprising the labellum, petals, and buds were collected from two-year-old seedlings. Tender sprouts emerging from the base of the one-year-old seedlings were systematically sampled at various stages of development (S1−S4; the time interval between each stage was one month). One-year-old seedlings were treated with MeJA, and the samples were collected 24 h after the application. One-year-old seedlings were subjected to direct drought conditions, and the stems and leaves were collected after 30 d. The seedlings were also placed under temperatures of 4 and 42 °C, respectively, with the leaves collected after 0, 6, 12, and 24 h. The details of the collection of samples are presented in Table 1. All samples were collected separately in liquid nitrogen and were immediately frozen at −80 °C for RNA extraction.
Table 1. Detailed information of experimental samples.
Biological process Experimental conditions Sampling tissue Different tissues Normal development Root, stem, leaves, bud, petal, labellum Different developmental stages Normal development Leaves Cold stress 4 °C for 0, 6, 12, 24 h Leaves High temperature stress 42 °C for 0, 6, 12, 24 h Leaves Drought stress Drought of 30 d Leaves MeJA spraying MeJA oncentration: 100 μmol /L Leaves Total RNA extraction and cDNA synthesis
-
Total RNA was isolated using the Plant RNA Extraction Kit (Omega). The concentration and purity of the RNA were assessed with the NanoDrop 2000 spectrophotometer (Thermo Scientific, USA). The RNA integrity was evaluated using 1% agarose gel electrophoresis. The cDNA was synthesized using HiScript III 1st Strand cDNA Synthesis Kit (Vazyme, China). The cDNA was stored at −20 °C until required as a template for all PCR reactions.
Selection and primer design of candidate RGs
-
The gene families which are commonly used as RGs in other species were selected[1,9,11]. Eight candidate RGs (EF2-1, EF1γ, 60SRPL7, Actin, UBCE1, UBCE2, ADF7, and 60SRPL26) were further chosen based on their expression stability from transcriptome datasets (GSE254169). Specifically, transcripts per million (TPM) values were utilized to quantify gene expression levels and were averaged across biological replicates for subsequent analysis. Initially, genes with log2 (TPM) values less than or equal to 5 were excluded to prevent potential interference with qRT-PCR results, as low-expression genes can complicate the detection and quantification of their expression. The coefficient of variation (CV) values were calculated using the formula CV = Standard deviation (SD) of log2 (TPM) / Average log2 (TPM) (mean). The calculations for mean, SD, and CV were performed using Microsoft Excel. Candidate RGs with minimal variability were sought, requiring SD values below 1. Consequently, a CV cut-off of 0.2 was applied to identify stable genes, representing the threshold for stable expression among diverse genes. Specific primers for qRT-PCR were designed using Primer Premier 5.0 software, with an annealing temperature ranging from 58 to 62 °C, amplicon lengths of 80−200 bp, and GC content between 40% and 60%. The details of the primers can be found in Table 2.
Table 2. Detail of primer sequences and related information.
Gene ID Gene symbol Gene description Primer sequence (5'−3') Tm of primer GC (%) Amplicon length (bp) Amplification efficiency (%) R2 evm.model.Chr04.142 EF2-1 Elongation factor 2 F: GGAAAACATGCGTGGGATATG 57.65 47.62 127 97.1 0.927 R: GGCTGTCAACTGAGATGCGTAG 61.3 54.55 evm.model.Chr15.1445 EF1γ Elongation factor 1 F: GCACGCTATGTTACCCGATTG 59.74 52.38 171 102.7 0.943 R: CTCCACCTGGGCATTGTATTG 58.97 52.38 evm.model.Chr09.1351 60SRPL7 60S ribosomal protein L7-4 F: TCATTGAGCAGGGTCTTGGG 59.67 55 117 105.3 0.909 R: GCTTGAACGGCCACAAGAAG 60.04 55 evm.model.Chr15.1732 Actin Actin-7 F: AGAGATAACTGCACTTGCTCCTAG 59.9 45.83 130 98.1 0.998 R: GGAAATCCACATCTGCTGGAAAG 59.87 47.83 evm.model.Chr09.2262 UBCE1 Ubiquitin-conjugating enzyme E2 7 F: TATGAGCTTGCAAGTGAACGTTG 60.06 43.48 121 99.1 0.998 R: CTTTTGCAGCTTCCACATTTGC 59.78 45.45 evm.model.Chr04.115 UBCE2 Ubiquitin-conjugating enzyme E2 2 F: AATCCCAATTCACCTGCAAACTC 59.7 43.48 100 93 0.991 R: TCCAGCTTTGTTCAACAATCTCC 59.43 43.48 evm.model.Chr01.1237 ADF7 Actin-depolymerizing factor 7 F: CATAGCCTGGTCTCCTGACAC 59.86 57.14 111 99.1 0.976 R: GTTGCTTGCAACTCCACCTG 59.97 55 evm.model.Chr04.978 60SRPL26 60S ribosomal protein L26-2 F: AATGGATCAACAGTCAACGTTGG 59.75 43.48 135 91 0.951 R: AAACTTTCCTTTGGCCTTGTCAG 59.87 43.48 evm.model.Chr08.388 FPPS Farnesyl pyrophosphate synthase F: GATTATACTTCGTAACCACATCCCC 59.07 44 253 − − R: CATTAACAAGGCACATGCAACAG 59.32 43.5 RT-PCR and qRT-PCR conditions and the detection of primer specificity
-
The full-length CDSs of the eight candidate RGs were amplified using PCR with specific primers. The PCR conditions included an initial denaturation at 94 °C for 3 min, followed by 36 cycles consisting of denaturation at 94 °C for 30 s, annealing at 59 °C for 60 s, extension at 72 °C for 30 s, and a final extension at 72 °C for 15 min. The PCR products were visualized using 1.5% agarose gel electrophoresis. The same cDNA samples and primers were utilized for qRT-PCR analyses. The qRT-PCR analysis was conducted in 96-well plates using the CFX 96 Real-Time PCR System (Bio-Rad). Each 20 μl reaction mixture contained 10 μl of KAPA SYBR Fast qPCR Master Mix (2X), 1 μl of cDNA template, 0.4 μl (10 μM) of each primer, and 8.2 μl of double-distilled water (ddH2O). The PCR cycling program for product amplification consisted of an initial step at 95 °C for 30 s, followed by 40 cycles of 5 s at 95 °C, 30 s at 60 °C, and concluding with one cycle of 15 s at 95 °C, 60 s at 60 °C, and 15s at 95 °C. The specificity of the amplification was confirmed by analyzing the result of agarose gel electrophoresis and the melting curve obtained from the qRT-PCR.
Data analysis and assessment of the candidate reference gene
-
The amplification efficiency (E) and correlation coefficient value (R2) were evaluated using established methodologies[13,18]. The cycle threshold (Ct) value directly reflects gene expression levels, with a lower Ct value indicating higher transcript abundance. To compare the expression stability of each candidate reference gene, geNorm[19], NormFinder[20], BestKeeper[21], and ΔCt[22] were utilized, each employing different algorithms for ranking. geNorm identifies the optimal pair of reference genes by calculating the value M, where a smaller M value indicates a greater stability in gene expression. Additionally, geNorm determines the optimal number of reference genes required by assessing pairwise variation (Vn/Vn+1). NormFinder evaluates gene expression stability through grouped analysis, providing the best individual gene. The expression stability value derived from NormFinder is lower, indicating that a single reference gene exhibits greater stability. Before conducting geNorm and NormFinder analyses, raw Cq values must be converted using the formula 2−ΔCq (where ΔCq is defined as each corresponding Cq value minus the minimum Cq value). BestKeeper utilizes pairwise correlation analysis, evaluating the original CT values alongside internal reference genes by calculating the standard deviation (SD) of CT values across samples and the coefficient of variation (CV) of candidate genes. Finally, RefFinder consolidates the stability measurements from the four algorithms and ranks the assessed candidates based on their expression stability.
Normalization of DnFPPS
-
To verify the reliability of the optimal RGs for qRT-PCR, an analysis of transcriptome datasets and qRT-PCR were conducted focusing on the DnFPPS genes in D. nobile. The raw transcriptome data, obtained from various tissues, developmental stages, and stress conditions — including MeJA spraying, drought stress, and temperature stress — were analyzed (data unpublished except for datasets related to different tissues and developmental stages). The TPM values were calculated using the Kallisto plugins of TBtools-II[23] against the latest D. nobile genome[17]. The extracted TPM values for DnFPPS were visualized using the heatmap plugins of TBtools-II[23]. Additionally, the expression levels of DnFPPS were assessed through qRT-PCR across various tissues, developmental stages, and stress conditions. The gene expression of DnFPPS was normalized using the most stable and least stable RGs as internal controls, respectively. The primer sequences used for the qRT-PCR analysis of DnFPPS are provided in Table 1. The relative expression levels were calculated using the 2−ΔΔCᴛ method[24].
-
The previous transcriptome datasets from various tissues (GSE254169; including roots, stems, leaves, labellums, petals, and buds) and in D. nobile were analyzed. Eight genes commonly used as RGs with minimal variability in expression were selected as the candidate RGs. Primers for these eight genes were designed for qRT-PCR. To assess the specificity of all primers for the candidate RGs, both RT-PCR and qRT-PCR were performed, followed by 1.5% agarose gel electrophoresis and melting curve analysis. The PCR amplification efficiency (E) for each primer ranged from 91% to 106%, and the correlation coefficient value (R2) varied between 0.927 and 0.998, as detailed in Table 1. The melting curve analysis exhibited a single peak for each amplicon (Fig. 1a), confirming the high specificity of the primers for gene expression analysis using qRT-PCR. Furthermore, the results from agarose gel electrophoresis indicated that all eight candidate RGs were specifically amplified, yielding a single amplicon of the expected sizes (Fig. 1b).
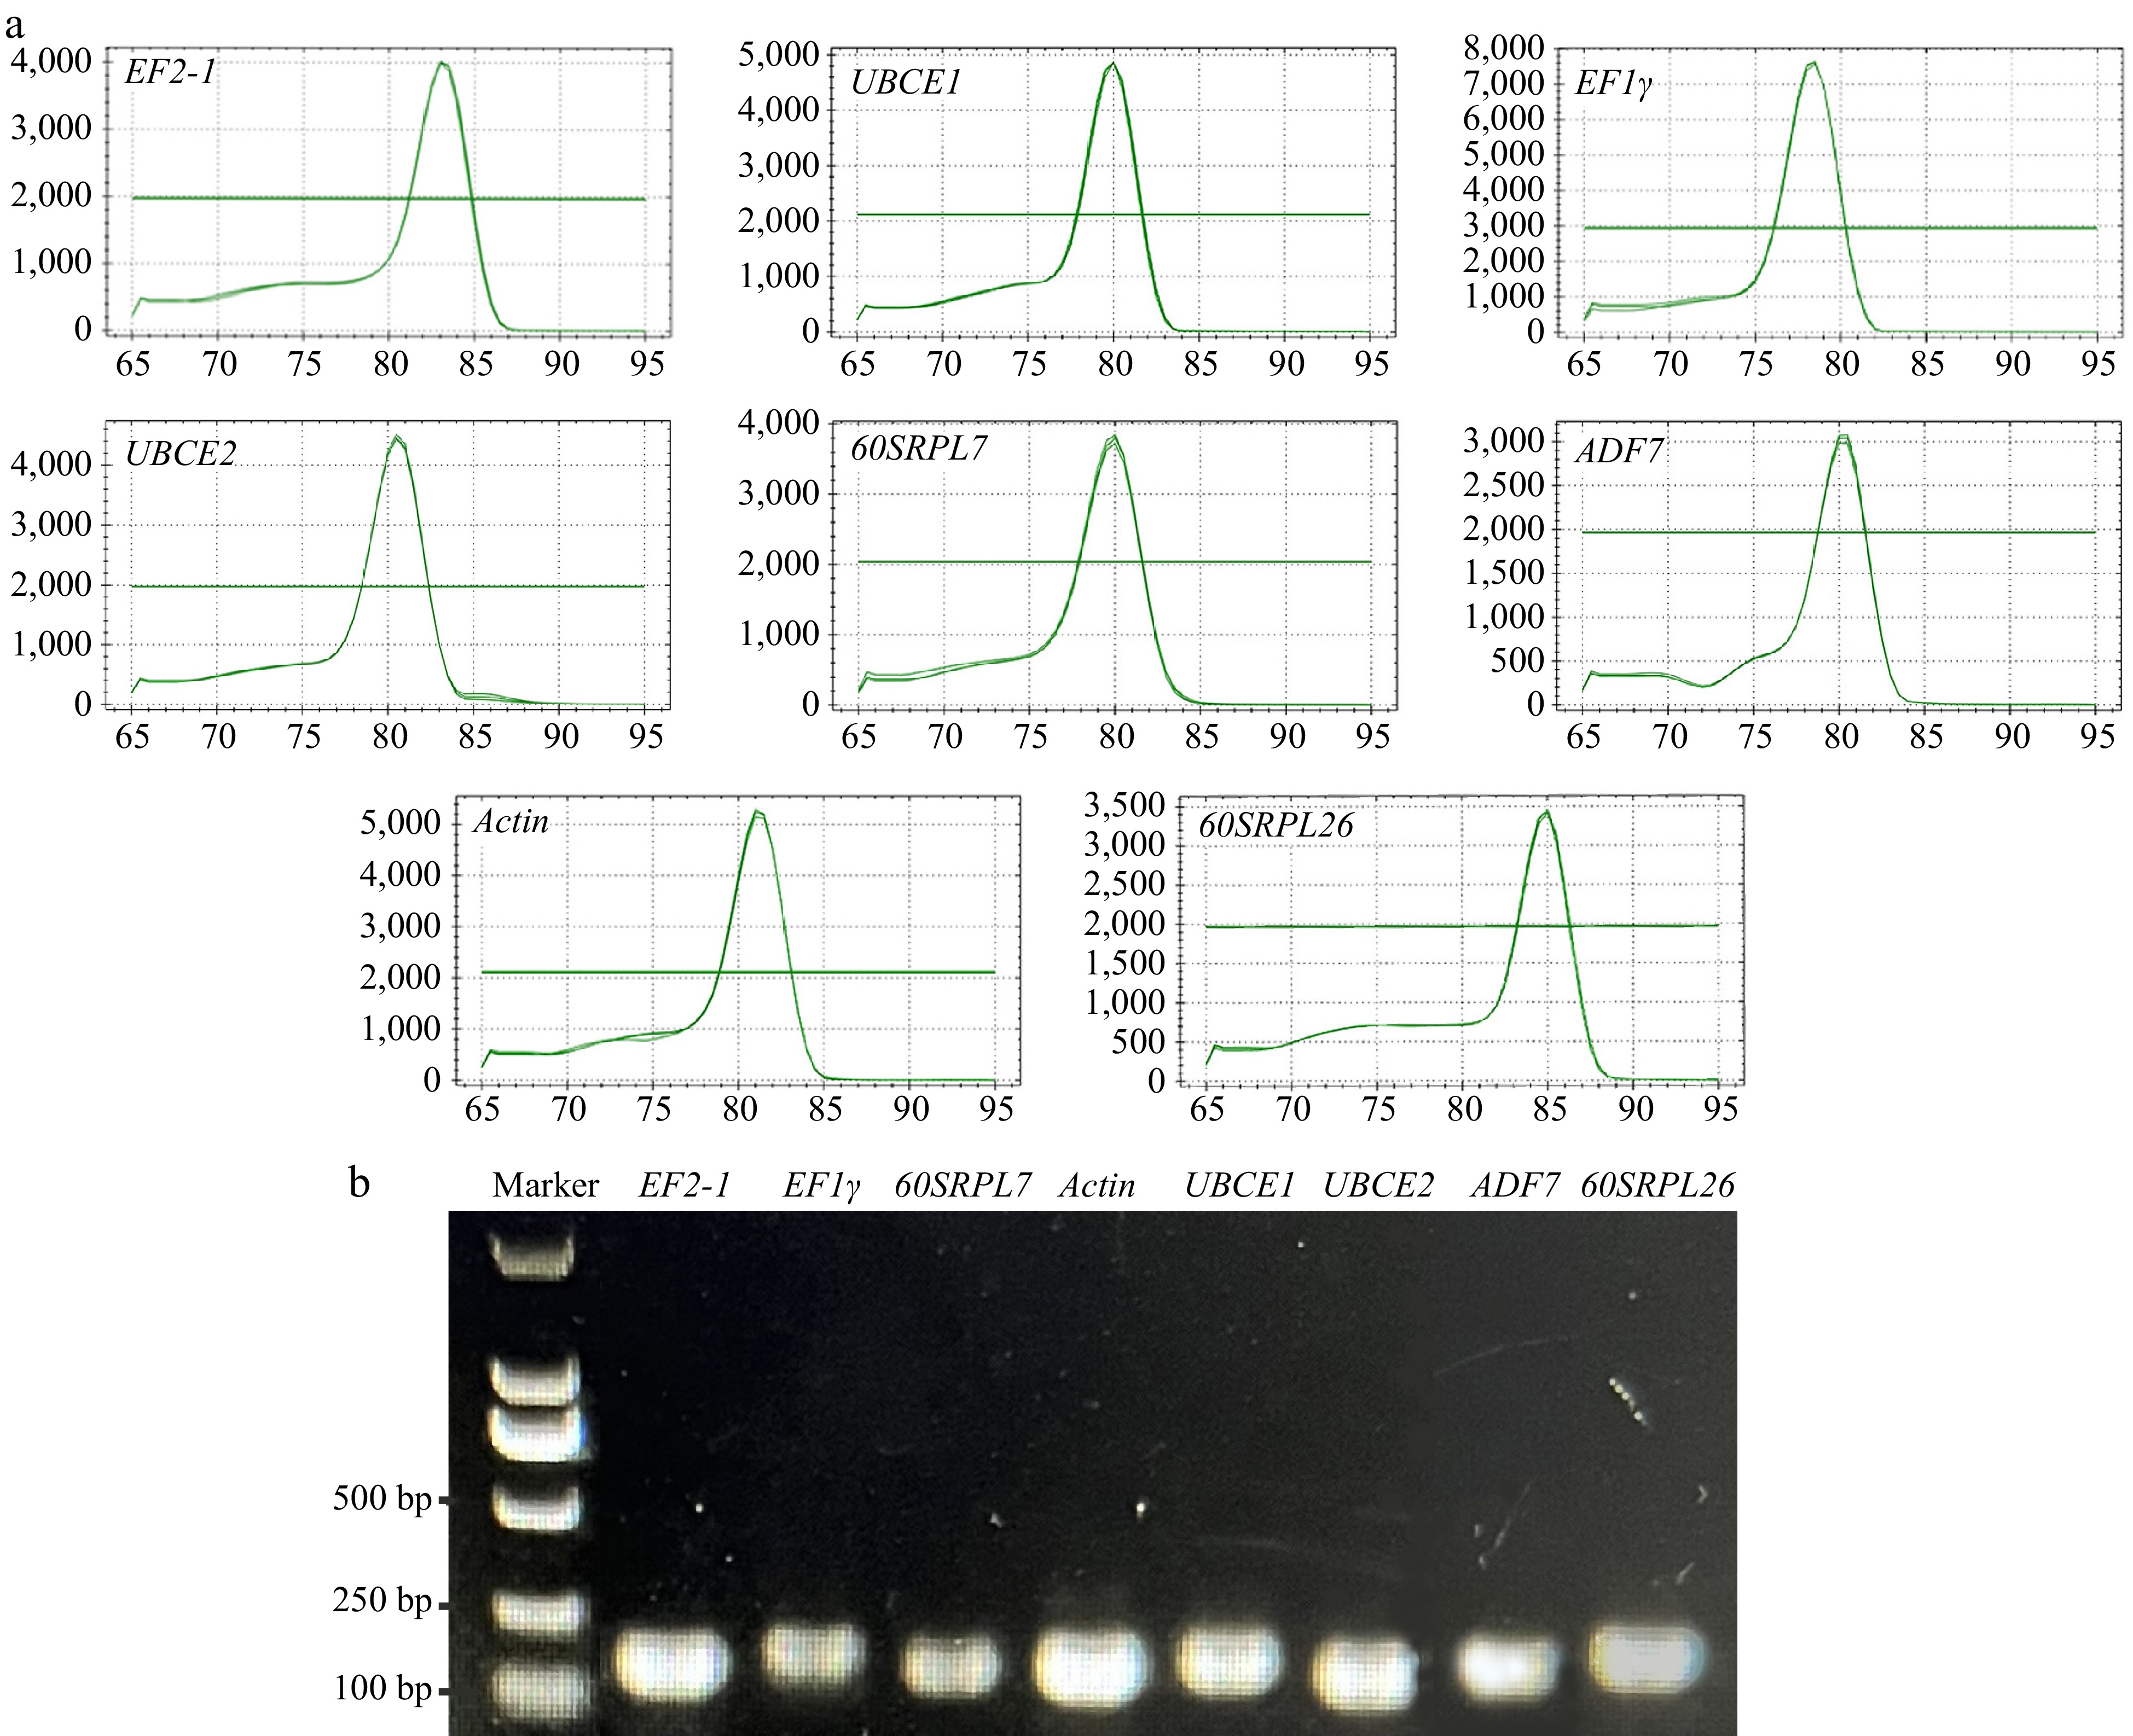
Figure 1.
Specificity of primer pairs for qRT-PCR amplification. (a) Melting curve analysis displayed a single peak for each amplicon. (b) Agarose gel electrophoresis revealed that all eight candidate RGs were specifically amplified with a single amplicon of the expected sizes.
Expression profiles of RGs
-
In a qRT-PCR experiment, the threshold cycle (Ct) value was determined as the cycle at which the fluorescent signal significantly deviated from the background. The expression profiles of eight selected RGs across all samples were represented by Cq values. The Cq values of the candidate RGs are illustrated in Fig. 2. Across all six sample sets, the expression profiles of the candidate RGs exhibited variability. The average Cq values of the eight candidate RGs ranged from 21.86 (Actin) to 32.82 (EF1γ), indicating that Actin had the highest expression level while EF1γ had the lowest. Furthermore, the data for ADF7 demonstrated the most consistency, with Cq values ranging from 23.40 to 27.90, whereas the Cq values for EF1γ and EF2-1 were more dispersed. This outcome underscores that none of the selected RGs maintained a consistent expression level across the various samples examined. Therefore, it is essential to identify the optimal RGs for normalizing target gene expression.
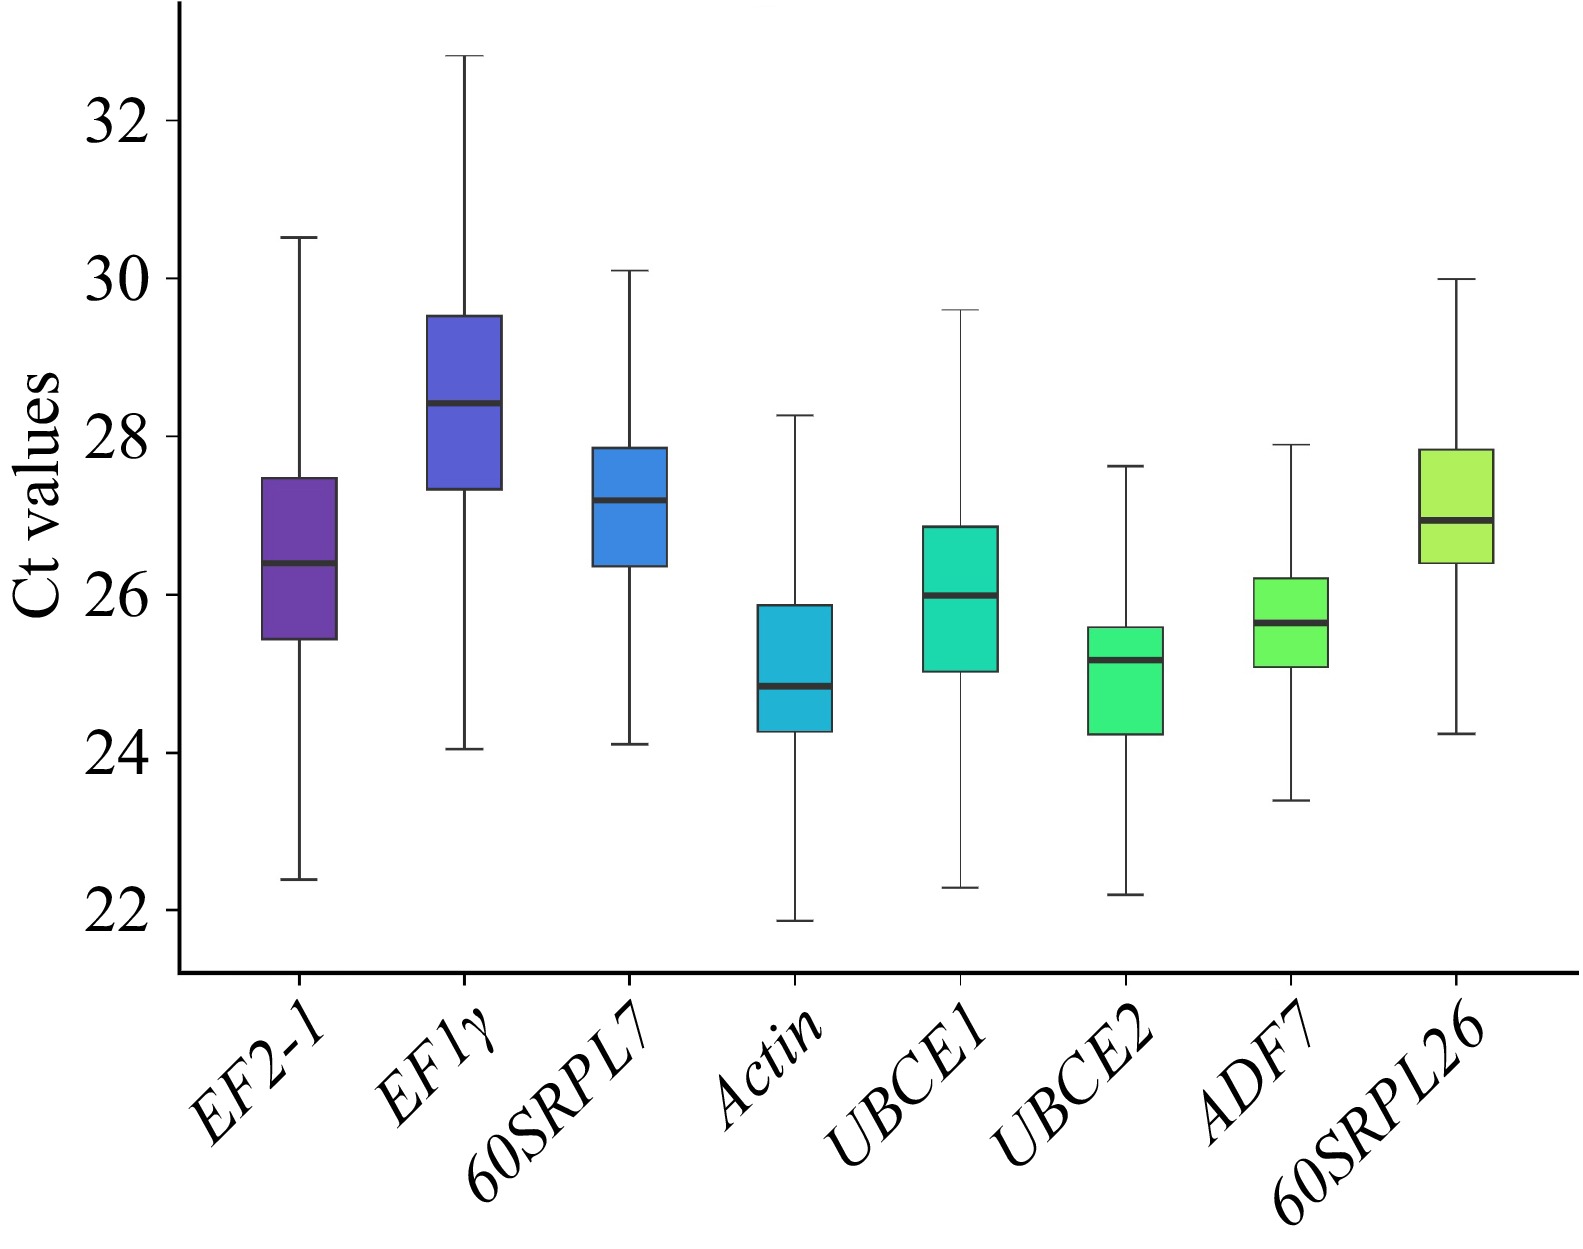
Figure 2.
The Cq values of the candidate reference genes across all samples. Lines across the box indicated the median. Lower and upper boxes showed 25th percentile to the 75th percentile. Whiskers represented the maximum and minimum values.
Expression stability of candidate RGs
-
To obtain a reliable dataset of reference genes for six groups of samples, four programs—geNorm, NormFinder, BestKeeper, and delta Ct—were utilized to evaluate gene stability. RefFinder was then employed to acquire the comprehensive results that integrated the data from these four programs. Data from each group were analyzed separately and subsequently combined. The expression stability of eight selected RGs was assessed across different tissue (DT), various developmental stages (DDS), and under conditions of drought stress, low temperature (LT), high temperature (HT), and MeJA stress (MeJA) for D. nobile.
GeNorm analysis
-
GeNorm analysis was utilized to calculate the average expression stability (M values) of reference genes (RGs), where a lower M value indicates higher expression stability. Figure 3 illustrates the ranking of eight candidate RGs across six groups of samples under varying experimental conditions. Overall, the M values of the eight candidate RGs in all six groups were below 1.5, which is considered relatively stable[19]. Notably, Actin and ADF7 emerged as the most stable RGs in the DT sample set. For the DDS, LT, and drought sample sets, the optimal combinations of RGs for normalization were 60SRPL7 and Actin, 60SRPL7 and EF2-1, and 60SRPL7 and ADF7, respectively. In HT samples, GeNorm identified UBCE2 and 60SRPL26 as the top two RGs, while UBCE2 and Actin were deemed optimal for MeJA samples. The GeNorm algorithm determined the optimal number of RGs required for accurate normalization of qRT-PCR data through pairwise variation (Vn/n+1), with a threshold value of 0.15[19]. The analysis indicated that two RGs were sufficient for reliable normalization in most sample sets, as the V2/3 values for experimental conditions, including LT, HT, MeJA, and drought samples, were well below 0.15 (Fig. 4), demonstrating that two RGs were adequate for normalization in the aforementioned samples.

Figure 3.
Average expression stability values (M) and the ranking of eight candidate reference genes as calculated by geNorm. The horizontal axis represents the different genes, while the vertical axis indicates the average expression stability. A lower value signifies greater stability in gene expression level.
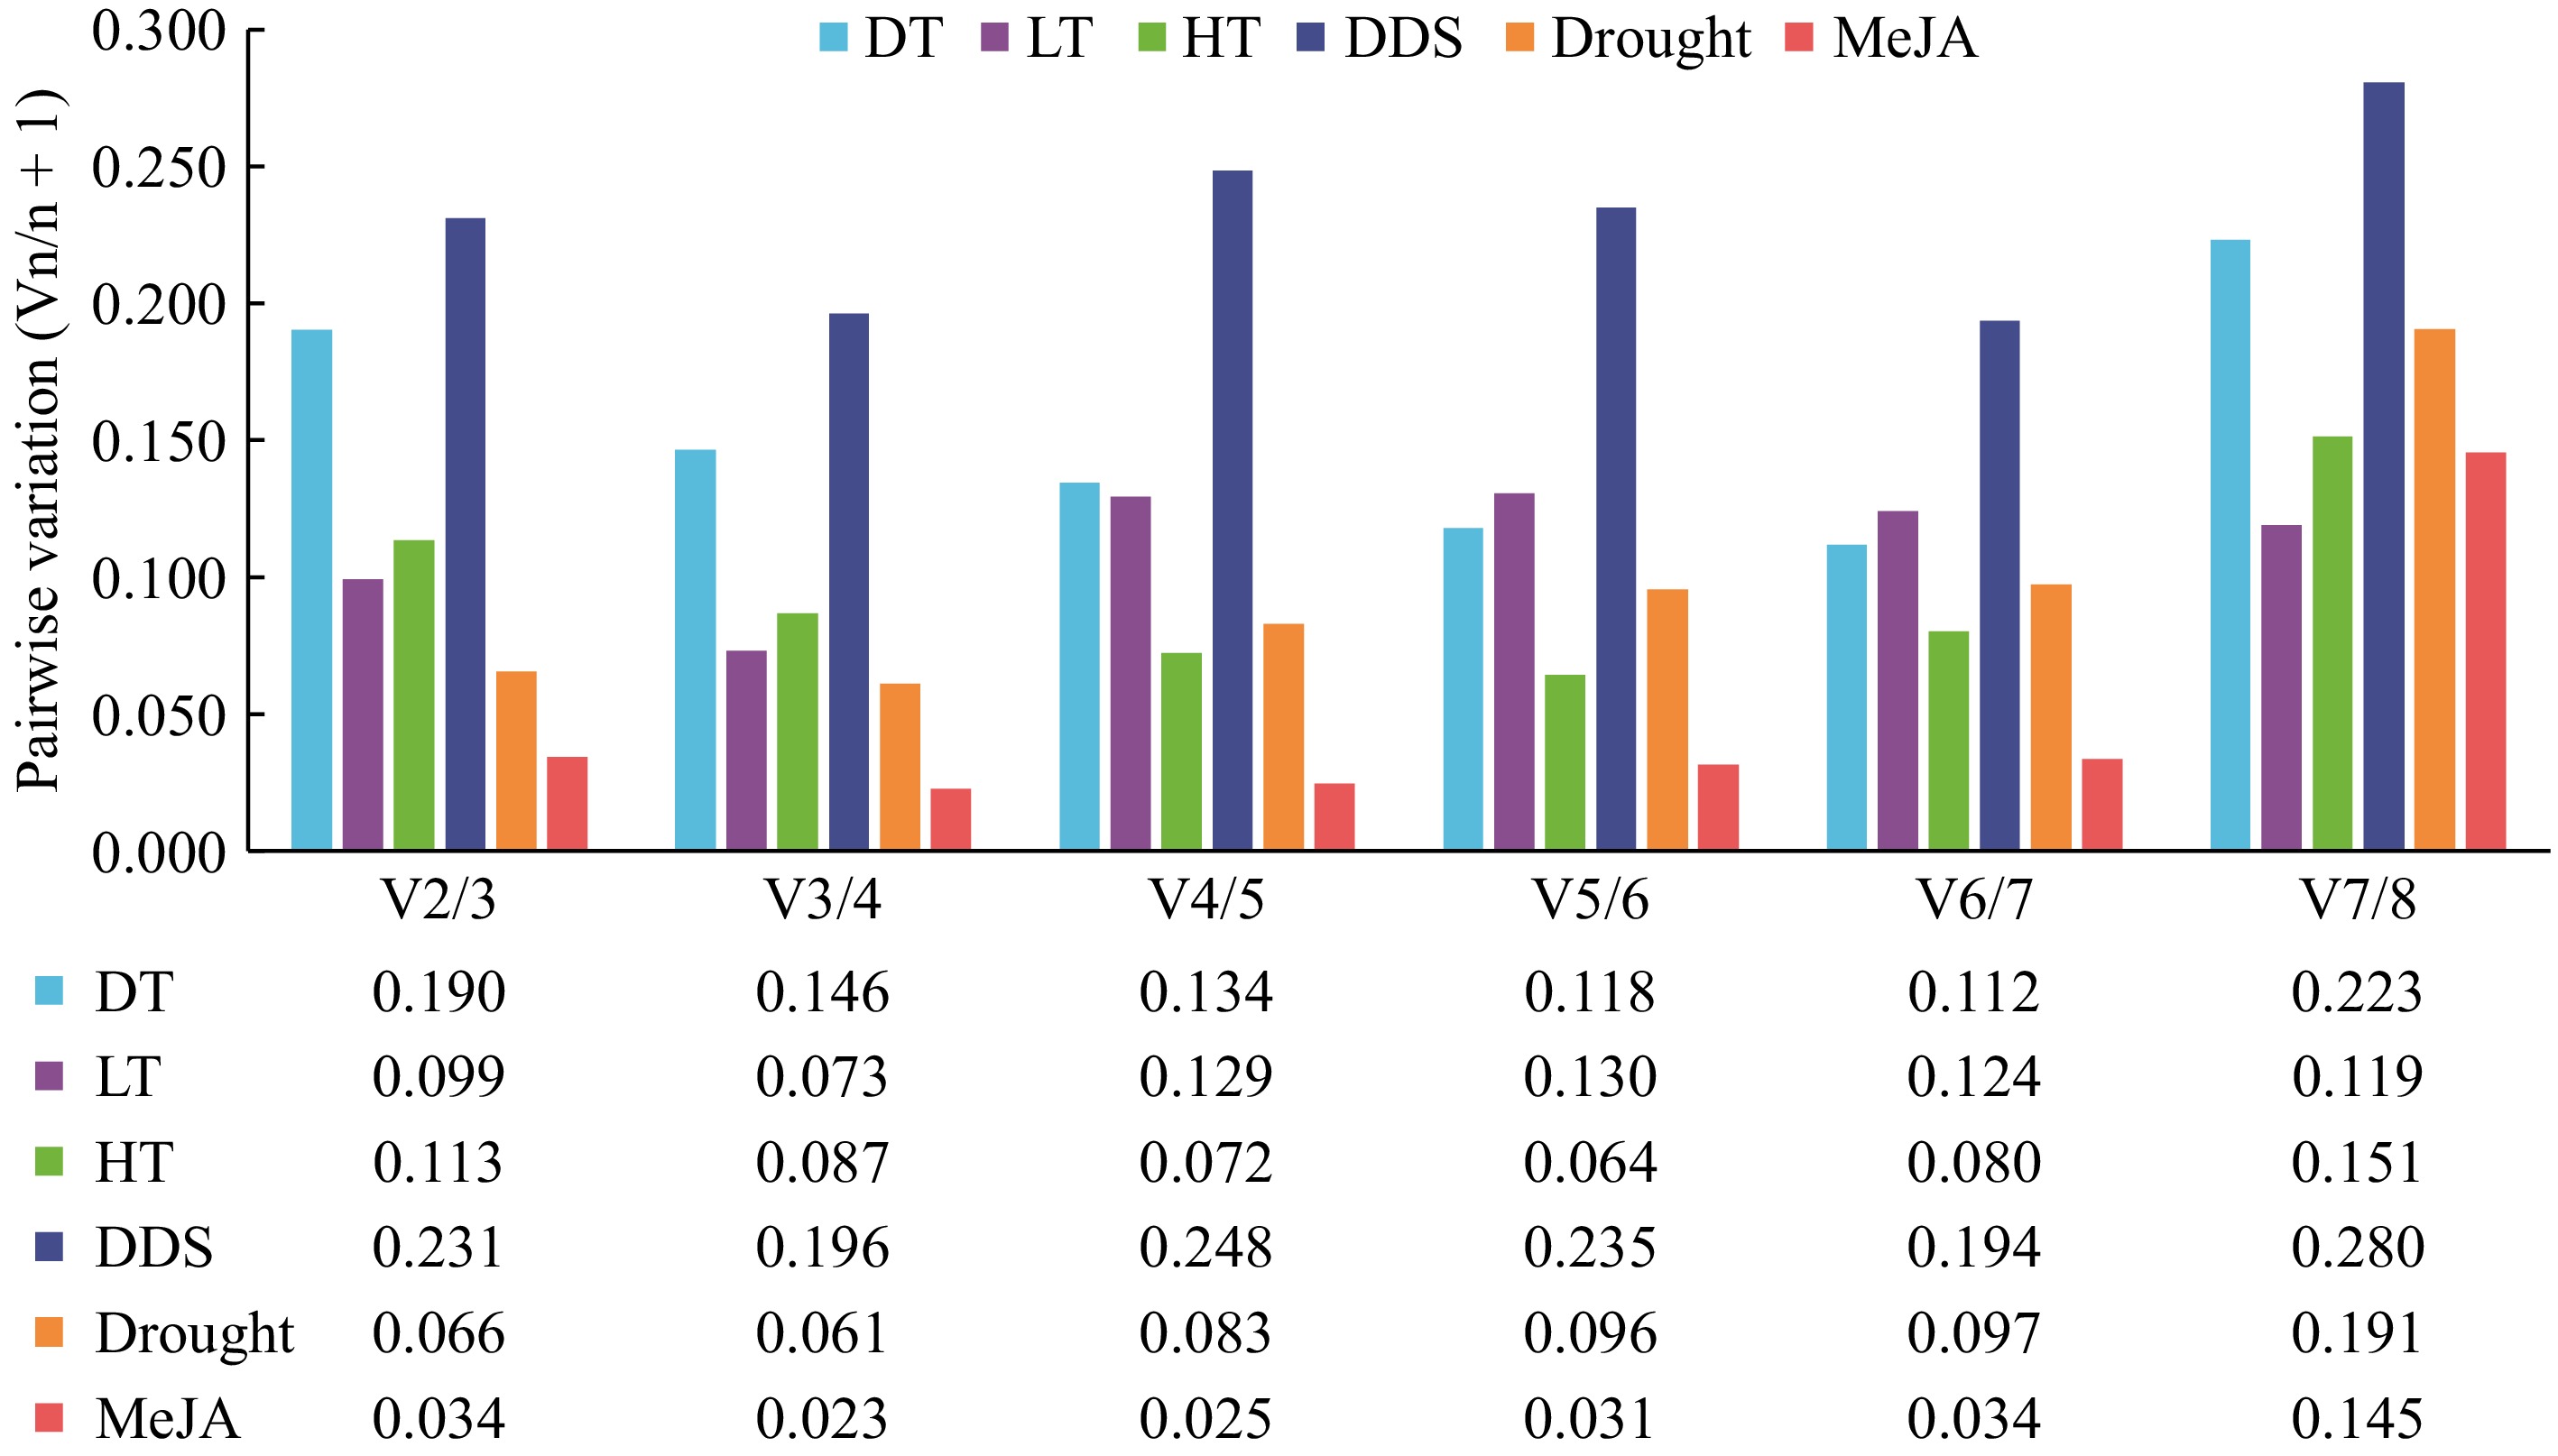
Figure 4.
Pairwise variation analysis of candidate reference genes. The geNorm software was utilized to analyze the pairwise variation (Vn/Vn+1) between the normalization factors (NF) NFn and NFn+1 in order to determine the optimal number of candidate reference genes necessary for RT-qPCR data normalization. If Vn/Vn+1 is less than 0.15, the minimum value of n represents the optimal number of genes required.
NormFinder analysis
-
NormFinder software ranks potential genes based on their expression stability in each sample set, assigning a stability value to each candidate gene. The expression stability of the candidate RGs in the DT group was Actin > UBCE2 > EF2-1 > ADF7 > EF1γ > 60SRPL7 > 60SRPL26 > UBCE1. In the DDS group, the expression stability of the candidate RGs was ADF7 > 60SRPL26 > 60SRPL7 > Actin > UBCE1 > UBCE2 > EF1γ > EF2-1. The M value of ADF7 was 0.1643, while that of EF2-1 was the highest with an M value of 1.535. In the LT group, the stability ranking is ADF7 > 60SRPL7 > EF2-1 > UBCE2 > UBCE1 > Actin > EF1γ > 60SRPL26. In the HT group, the stability ranking is UBCE1 > 60SRPL26 > Actin > ADF7 > UBCE2 > 60SRPL7 > EF1γ > EF2-1. In the drought and MeJA groups the whole rank of gene stability was EF2-1 > 60SRPL7 > ADF7 > UBCE1 > UBCE2 > Actin > 60SRPL26 > EF1γ and Actin > UBCE2 > ADF7 > UBCE1 > 60SRPL26 > EF2-1 > 60SRPL7 > EF1γ (Table 3).
Table 3. The expression stability of eight candidate RGs was analyzed by NormFinder.
Rank DT DDS LT HT Drought MeJA 1 Actin ADF7 ADF7 UBCE1 EF2-1 Actin Stability value 0.2604 0.1643 0.085 0.076 0.0809 0.0182 2 UBCE2 60SRPL26 60SRPL7 60SRPL26 60SRPL7 UBCE2 Stability value 0.2821 0.2458 0.135 0.105 0.0938 0.0182 3 EF2-1 60SRPL7 EF2-1 Actin ADF7 ADF7 Stability value 0.2962 0.4770 0.247 0.187 0.1332 0.0291 4 ADF7 Actin UBCE2 ADF7 UBCE1 UBCE1 Stability value 0.4106 0.5031 0.252 0.203 0.2109 0.0493 5 EF1γ UBCE1 UBCE1 UBCE2 UBCE2 60SRPL26 Stability value 0.4378 0.6330 0.416 0.255 0.2843 0.1276 6 60SRPL7 UBCE2 Actin 60SRPL7 Actin EF2-1 Stability value 0.4601 0.9507 0.514 0.288 0.3676 0.1295 7 60SRPL26 EF1γ EF1γ EF1γ 60SRPL26 60SRPL7 Stability value 0.5077 1.0981 0.582 0.394 0.4677 0.2367 8 UBCE1 EF2-1 60SRPL26 EF2-1 EF1γ EF1γ Stability value 1.227 1.535 0.646 0.835 1.052 0.806 BestKeeper analysis
-
BestKeeper analysis was conducted to assess the stability of RGs based on the coefficient of variation (CV) and standard deviation (SD). Reference genes with an SD greater than 1 are considered unstable and should be avoided[21]. RGs were deemed most stable when they exhibited the lowest CV and SD values. The ranking of RGs according to the BestKeeper algorithm is presented in Table 4. Among the DT and LT sample sets, Actin demonstrated the most stable expression level, with SD ± CV values as low as 0.49 ± 1.92 and 0.31 ± 1.29, respectively. In the drought and MeJA sample sets, 60SRPL26 demonstrated the highest expression stability, with SD ± CV values of 0.42 ± 1.56 and 0.02 ± 0.07, respectively. For the DDS sample set, UBCE2 showed the highest expression stability, with SD ± CV values of 0.33 ± 1.42. In the HT sample set, ADF7 exhibited the highest expression stability, with SD ± CV values of 0.22 ± 0.86. However, for the DT sample set, UBCE1 (SD = 1.16) is not suitable as a RG; 60SRPL26, 60SRPL7, Actin, and EF2-1 are not suitable as RGs in the DDS group; EF1γ is not suitable for the LT and drought sample sets; and EF2-1 is not suitable as an RG in the HT sample set.
Table 4. The expression stability of eight candidate reference genes was analyzed by Bestkeeper.
Rank DT DDS LT HT Drought MeJA 1 Actin UBCE2 Actin ADF7 60SRPL26 60SRPL26 SD ± CV 0.49 ± 1.92 0.33 ± 1.42 0.31 ± 1.29 0.22 ± 0.86 0.42 ± 1.56 0.02 ± 0.07 2 EF2-1 EF1γ ADF7 60SRPL26 UBCE1 EF2-1 SD ± CV 0.50 ± 1.88 0.34 ± 1.26 0.64 ± 2.51 0.25 ± 0.94 0.46 ± 1.71 0.05 ± 0.17 3 UBCE2 UBCE1 60SRPL7 UBCE1 ADF7 60SRPL7 SD ± CV 0.60 ± 2.39 0.49 ± 2.04 0.74 ± 2.73 0.25 ± 0.96 0.46 ± 1.76 0.09 ± 0.33 4 ADF7 60SRPL26 60SRPL26 UBCE2 60SRPL7 UBCE2 SD ± CV 0.68 ± 2.63 1.13 ± 4.26 0.74 ± 2.82 0.28 ± 1.10 0.53 ± 1.95 0.10 ± 0.38 5 EF1γ ADF7 EF2-1 60SRPL7 EF2-1 Actin SD ± CV 0.72 ± 2.49 1.25 ± 4.96 0.74 ± 2.98 0.34 ± 1.25 0.58 ± 2.14 0.10 ± 0.38 6 60SRPL26 60SRPL7 UBCE2 Actin UBCE2 EF1γ SD ± CV 0.76 ± 2.77 1.58 ± 6.19 0.78 ± 3.18 0.35 ± 1.44 0.63 ± 2.44 0.14 ± 3.95 7 60SRPL7 Actin UBCE1 EF1γ Actin ADF7 SD ± CV 0.82 ± 3.04 1.61 ± 6.61 0.91 ± 3.49 0.50 ± 1.77 0.70 ± 2.75 0.15 ± 0.55 8 UBCE1 EF2-1 EF1γ EF2-1 EF1γ UBCE1 SD ± CV 1.16 ± 4.55 2.68 ± 10.42 1.24 ± 4.42 1.09 ± 4.09 1.47 ± 4.87 0.26 ± 0.95 ΔCt analysis
-
ΔCt analysis evaluates the stability of candidate RGs by examining the average standard deviation of Ct values. A lower average standard deviation indicates a more stable reference gene[22]. The results of the ΔCt analysis, as presented in Table 5, reveal that in the DT sample set, Actin, EF2-1, and UBCE2 ranked among the top three candidate RGs, followed by ADF7, 60SRPL7, EF1γ, 60SRPL26, and UBCE1. In the DDS sample set, ADF7, 60SRPL26, and 60SRPL7 were the top three candidate RGs, followed by Actin, UBCE1, UBCE2, EF1γ, and EF2-1. In the LT and drought sample sets, ADF7, 60SRPL7, and EF2-1 ranked among the top three candidate RGs, followed by UBCE2, UBCE1, Actin, EF1γ, 60SRPL26 and UBCE1, UBCE2, Actin, 60SRPL26, and EF1γ, respectively. In the HT sample set, 60SRPL26, UBCE1, and ADF7 were the top three candidate RGs, followed by Actin, UBCE2, 60SRPL7, EF1γ, and EF2-1. Finally, in the MeJA sample set, Actin, UBCE2 and ADF7 ranked as the top three candidate RGs, followed by 60SRPL26, EF2-1, UBCE1, 60SRPL7, and EF1γ.
Table 5. The expression stability of eight candidate reference genes when analyzed by ΔCt.
Rank DT DDS LT HT Drought MeJA 1 Actin ADF7 ADF7 60SRPL26 ADF7 Actin 0.84 1.16 0.59 0.51 0.54 0.27 2 EF2-1 60SRPL26 60SRPL7 UBCE1 60SRPL7 UBCE2 0.88 1.23 0.6 0.53 0.55 0.28 3 UBCE2 60SRPL7 EF2-1 ADF7 EF2-1 ADF7 0.91 1.31 0.64 0.55 0.57 0.29 4 ADF7 Actin UBCE2 Actin UBCE1 60SRPL26 0.92 1.33 0.65 0.57 0.58 0.3 5 60SRPL7 UBCE1 UBCE1 UBCE2 UBCE2 EF2-1 0.95 1.39 0.82 0.58 0.77 0.3 6 EF1γ UBCE2 Actin 60SRPL7 Actin UBCE1 1.01 1.59 0.9 0.6 0.77 0.34 7 60SRPL26 EF1γ EF1γ EF1γ 60SRPL26 60SRPL7 1.03 1.73 0.99 0.73 0.77 0.39 8 UBCE1 EF2-1 60SRPL26 EF2-1 EF1γ EF1γ 1.85 2.29 1.06 1.25 1.55 1.16 RefFinder analysis
-
RefFinder is a web-based tool that provides comprehensive results by integrating analyses from three algorithms along with the delta Ct method to rank candidate RGs. As shown in Table 6, in the DT sample set, Actin and EF2-1 were ranked as the top two RGs, which aligns with the results from both BestKeeper and ΔCt analysis. ADF7 and 60SRPL7 were identified as stable RGs in the DDS, LT, and drought samples. In the HT samples, 60SRPL26 and UBCE1 received the highest rankings, consistent with the NormFinder analysis. Additionally, UBCE2 and Actin were determined to be stable RGs in the MeJA sample set, also in agreement with the NormFinder analysis.
Table 6. The expression stability of eight candidate RGs analyzed by RefFinder.
DT DDS LT HT Drought MeJA RGs Rank values RGs Rank values RGs Rank values RGs Rank values RGs Rank values RGs Rank values Actin 1.00 ADF7 1.97 ADF7 1.57 60SRPL26 1.57 ADF7 1.57 UBCE2 1.68 EF2-1 2.45 60SRPL7 2.71 60SRPL7 2.11 UBCE1 2.11 60SRPL7 2.00 Actin 1.78 ADF7 2.83 60SRPL26 2.83 EF2-1 2.45 ADF7 2.45 EF2-1 2.78 60SRPL26 2.91 UBCE2 3.08 Actin 3.25 Actin 3.83 UBCE2 3.16 UBCE1 3.46 EF2-1 3.76 60SRPL7 5.38 UBCE2 3.83 UBCE2 4.43 Actin 4.56 60SRPL26 3.96 ADF7 4.05 EF1γ 5.69 UBCE1 4.40 UBCE1 5.44 60SRPL7 5.18 UBCE2 5.69 60SRPL7 5.45 60SRPL26 6.48 EF1γ 5.12 60SRPL26 6.26 EF1γ 7.00 Actin 6.24 UBCE1 5.86 UBCE1 8.00 EF2-1 8.00 EF1γ 7.24 EF2-1 8.00 EF1γ 8.00 EF1γ 8.00 Reference gene validation for the expression of a target gene
-
Farnesyl diphosphate synthase (FPPS) plays a crucial role in the biosynthesis of sesquiterpenoids and sesquiterpene alkaloids. In this study, the expression patterns of DnFPPS in D. nobile were examined using two sample sets: DT and DDS. The aim was to validate selected RGs for normalization (see Fig. 5). The most stable, second most stable, and least stable candidate RGs were identified through a comprehensive analysis using RefFinder. The results indicated that when Actin or EF2-1 were used as RGs for the DT samples, the expression level of DnFPPS was highest in the stem and lowest in the root. However, when UBCE1 (the least stable RG) was employed for normalization, the expression levels were underestimated, and the ranking of expression levels varied across different tissues. Similar findings were observed in the DDS sample set, where the use of ADF7 or 60SRPL7 as stable RGs resulted in consistent expression patterns of DnFPPS. In contrast, using EF2-1 (the least stable RG) led to significant discrepancies in expression levels. These results underscore the importance of selecting appropriate internal controls is crucial for accurate qRT-PCR analyses, as improper normalization can yield misleading data.
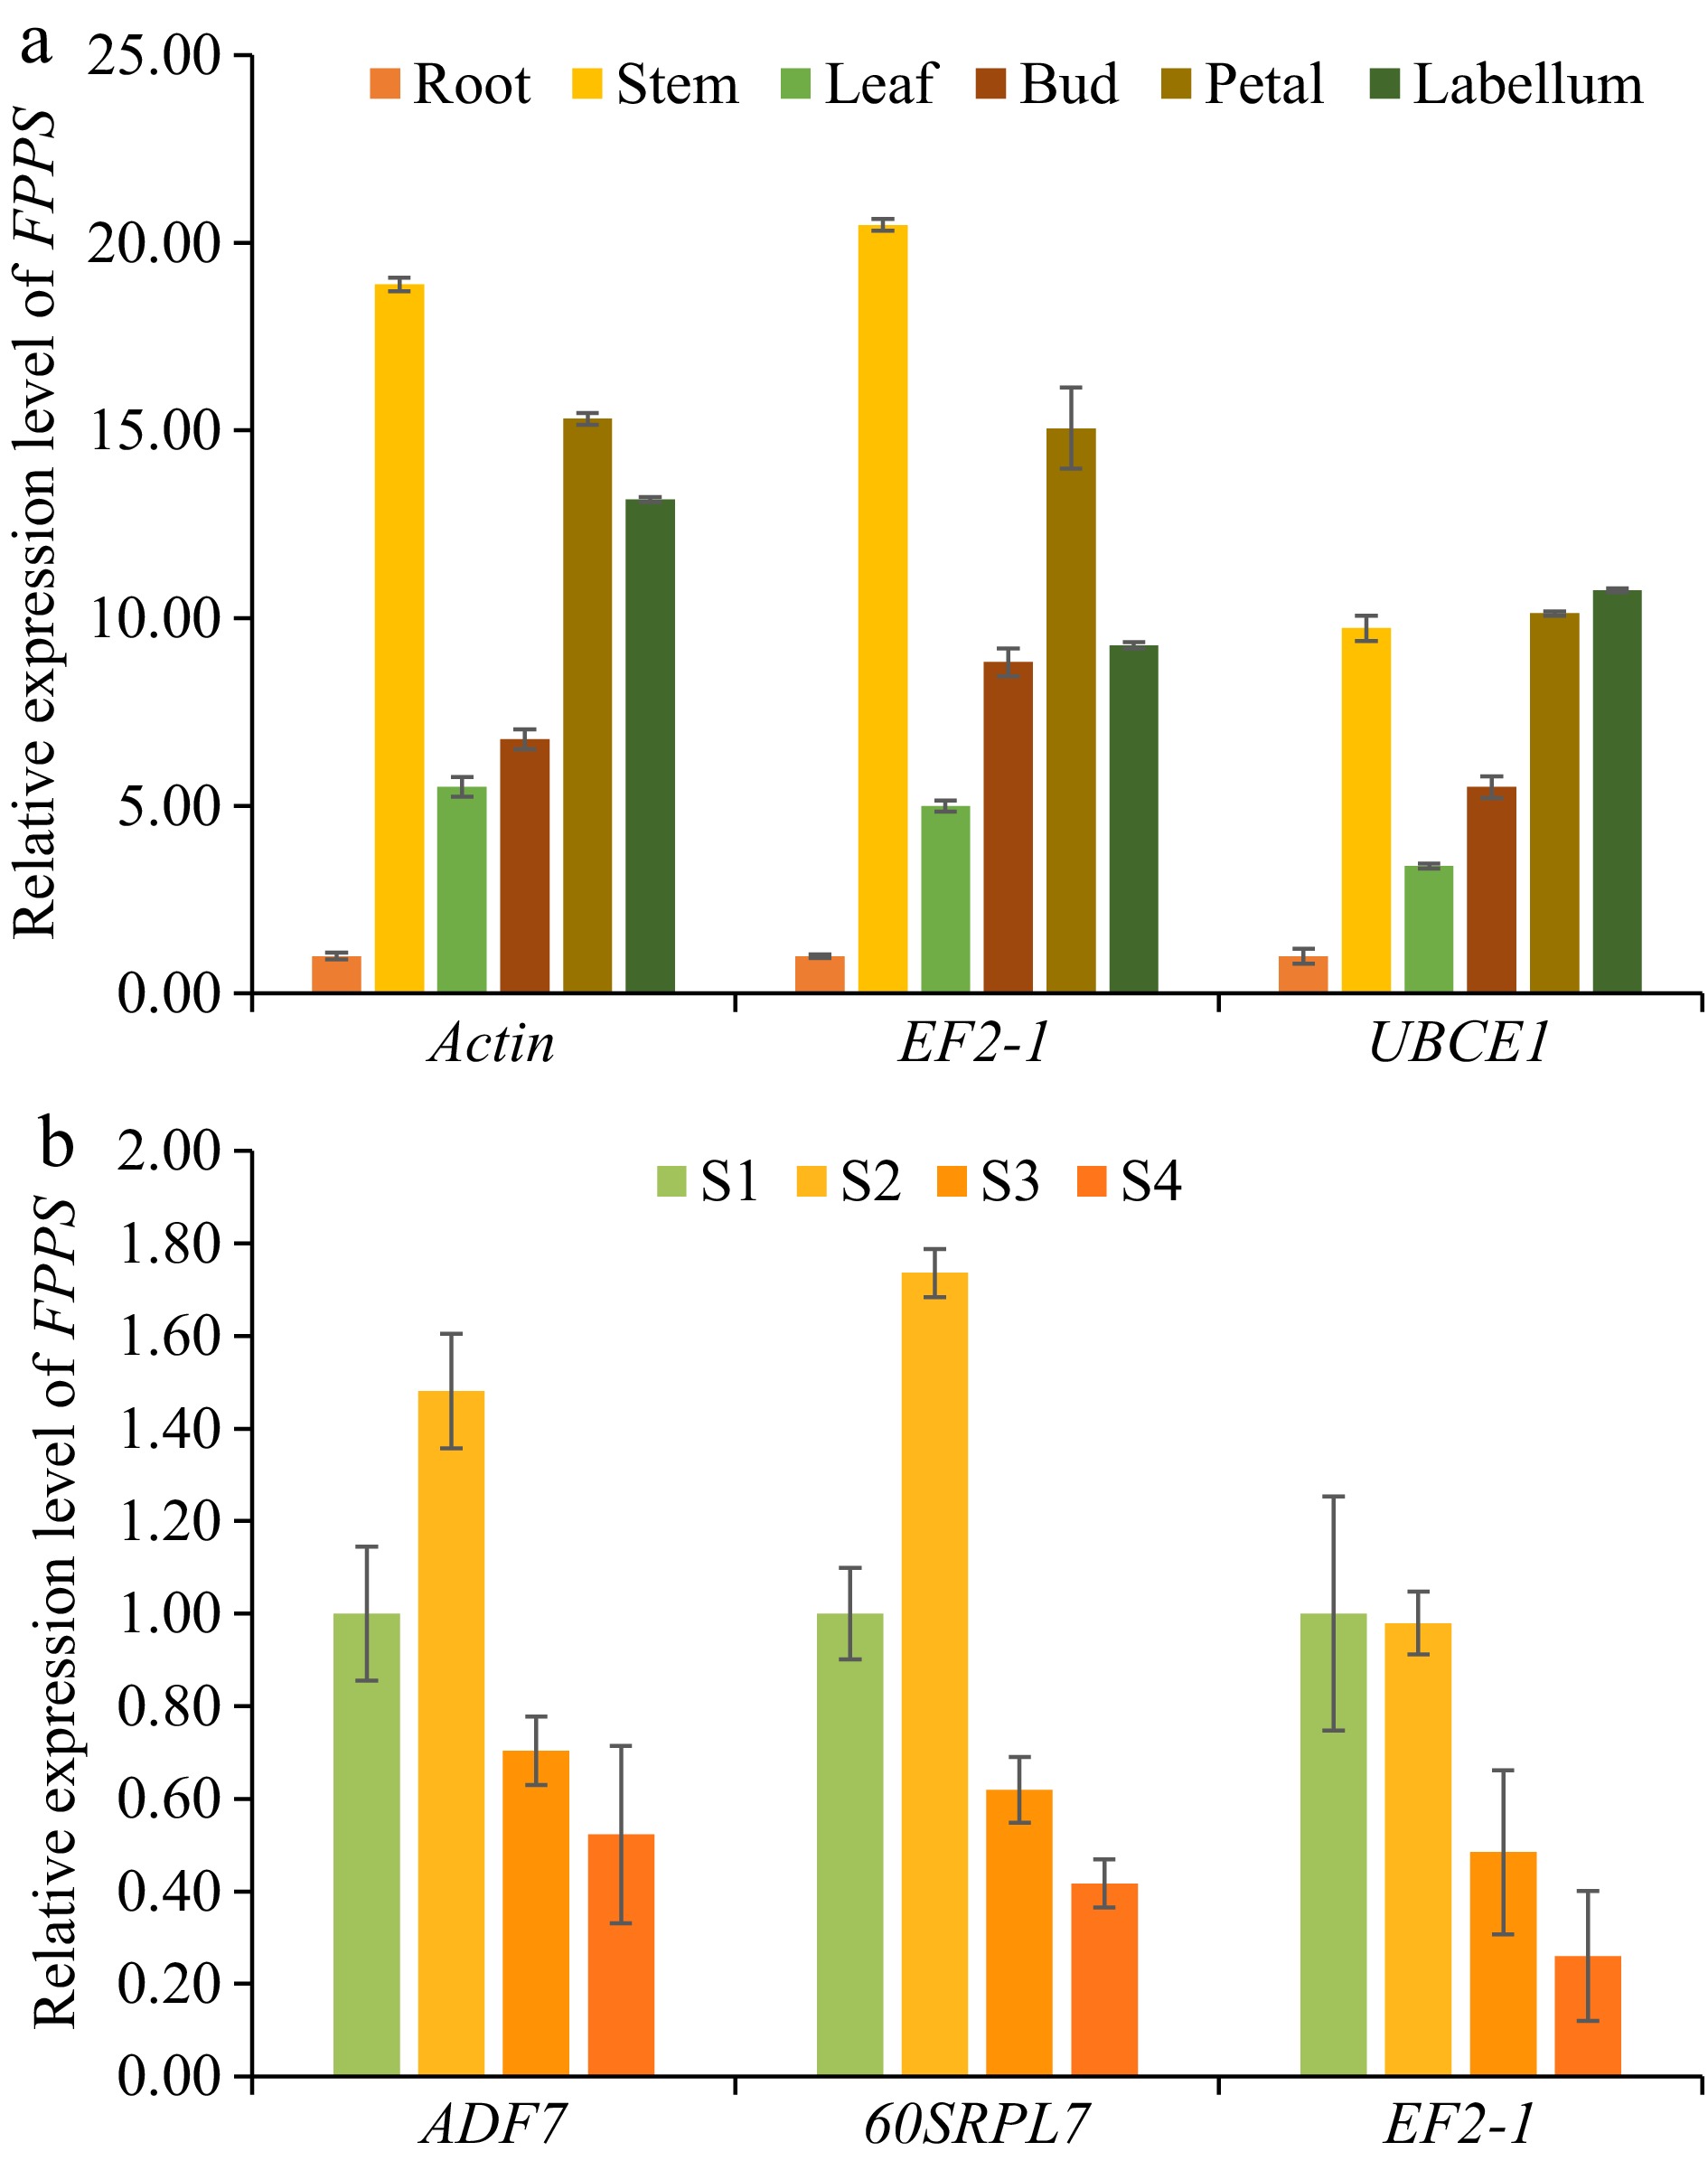
Figure 5.
The expression patterns of DnFPPS in D. nobile were examined in DT and DDS samples to validate selected reference genes (RGs) for normalization. (a) The expression levels of DnFPPS were evaluated among different tissues using various reference genes: the most stable RG, Actin; the second stable RG, EF2-1; the least stable RG, UBCE1. (b) The expression levels of DnFPPS were assessed across different developmental stages using the different reference genes: the most stable RG, ADF7; the second stable RG, 60SRPL7; the least stable RG, EF2-1. The expression levels of root and S1 in D. nobile were set to a value of 1. The bars represent standard errors. Three biological replicates were taken for each treatment in the qRT-PCR experiment and RNA-seq. Data are presented as average ± SD.
The expression analysis of DnFPPS under different abiotic stress
-
The expression levels of DnFPPS were analyzed using previous transcriptome data (data unpublished) under various abiotic stress conditions. To verify the accuracy of the transcriptome, qRT-PCR was conducted using both the most stable RG and the least stable RG, respectively. Figure 6 illustrates that the expression pattern of DnFPPS was consistent between the qRT-PCR results and transcriptome analysis when the most stable RGs were applied in the experiment. In contrast, the expression pattern of DnFPPS was inconsistent with the transcriptome results in the LT and drought conditions when the least stable RG was used in the experiment. Specifically, the gene expression levels of DnFPPS were found to be sensitive to temperature changes, gradually decreasing over time after exposure to both low and high temperatures. Furthermore, DnFPPS gene expression levels were down-regulated in the stem and leaf under drought conditions. Conversely, the expression levels of DnFPPS were up-regulated in the leaf 24 h after MeJA spraying.
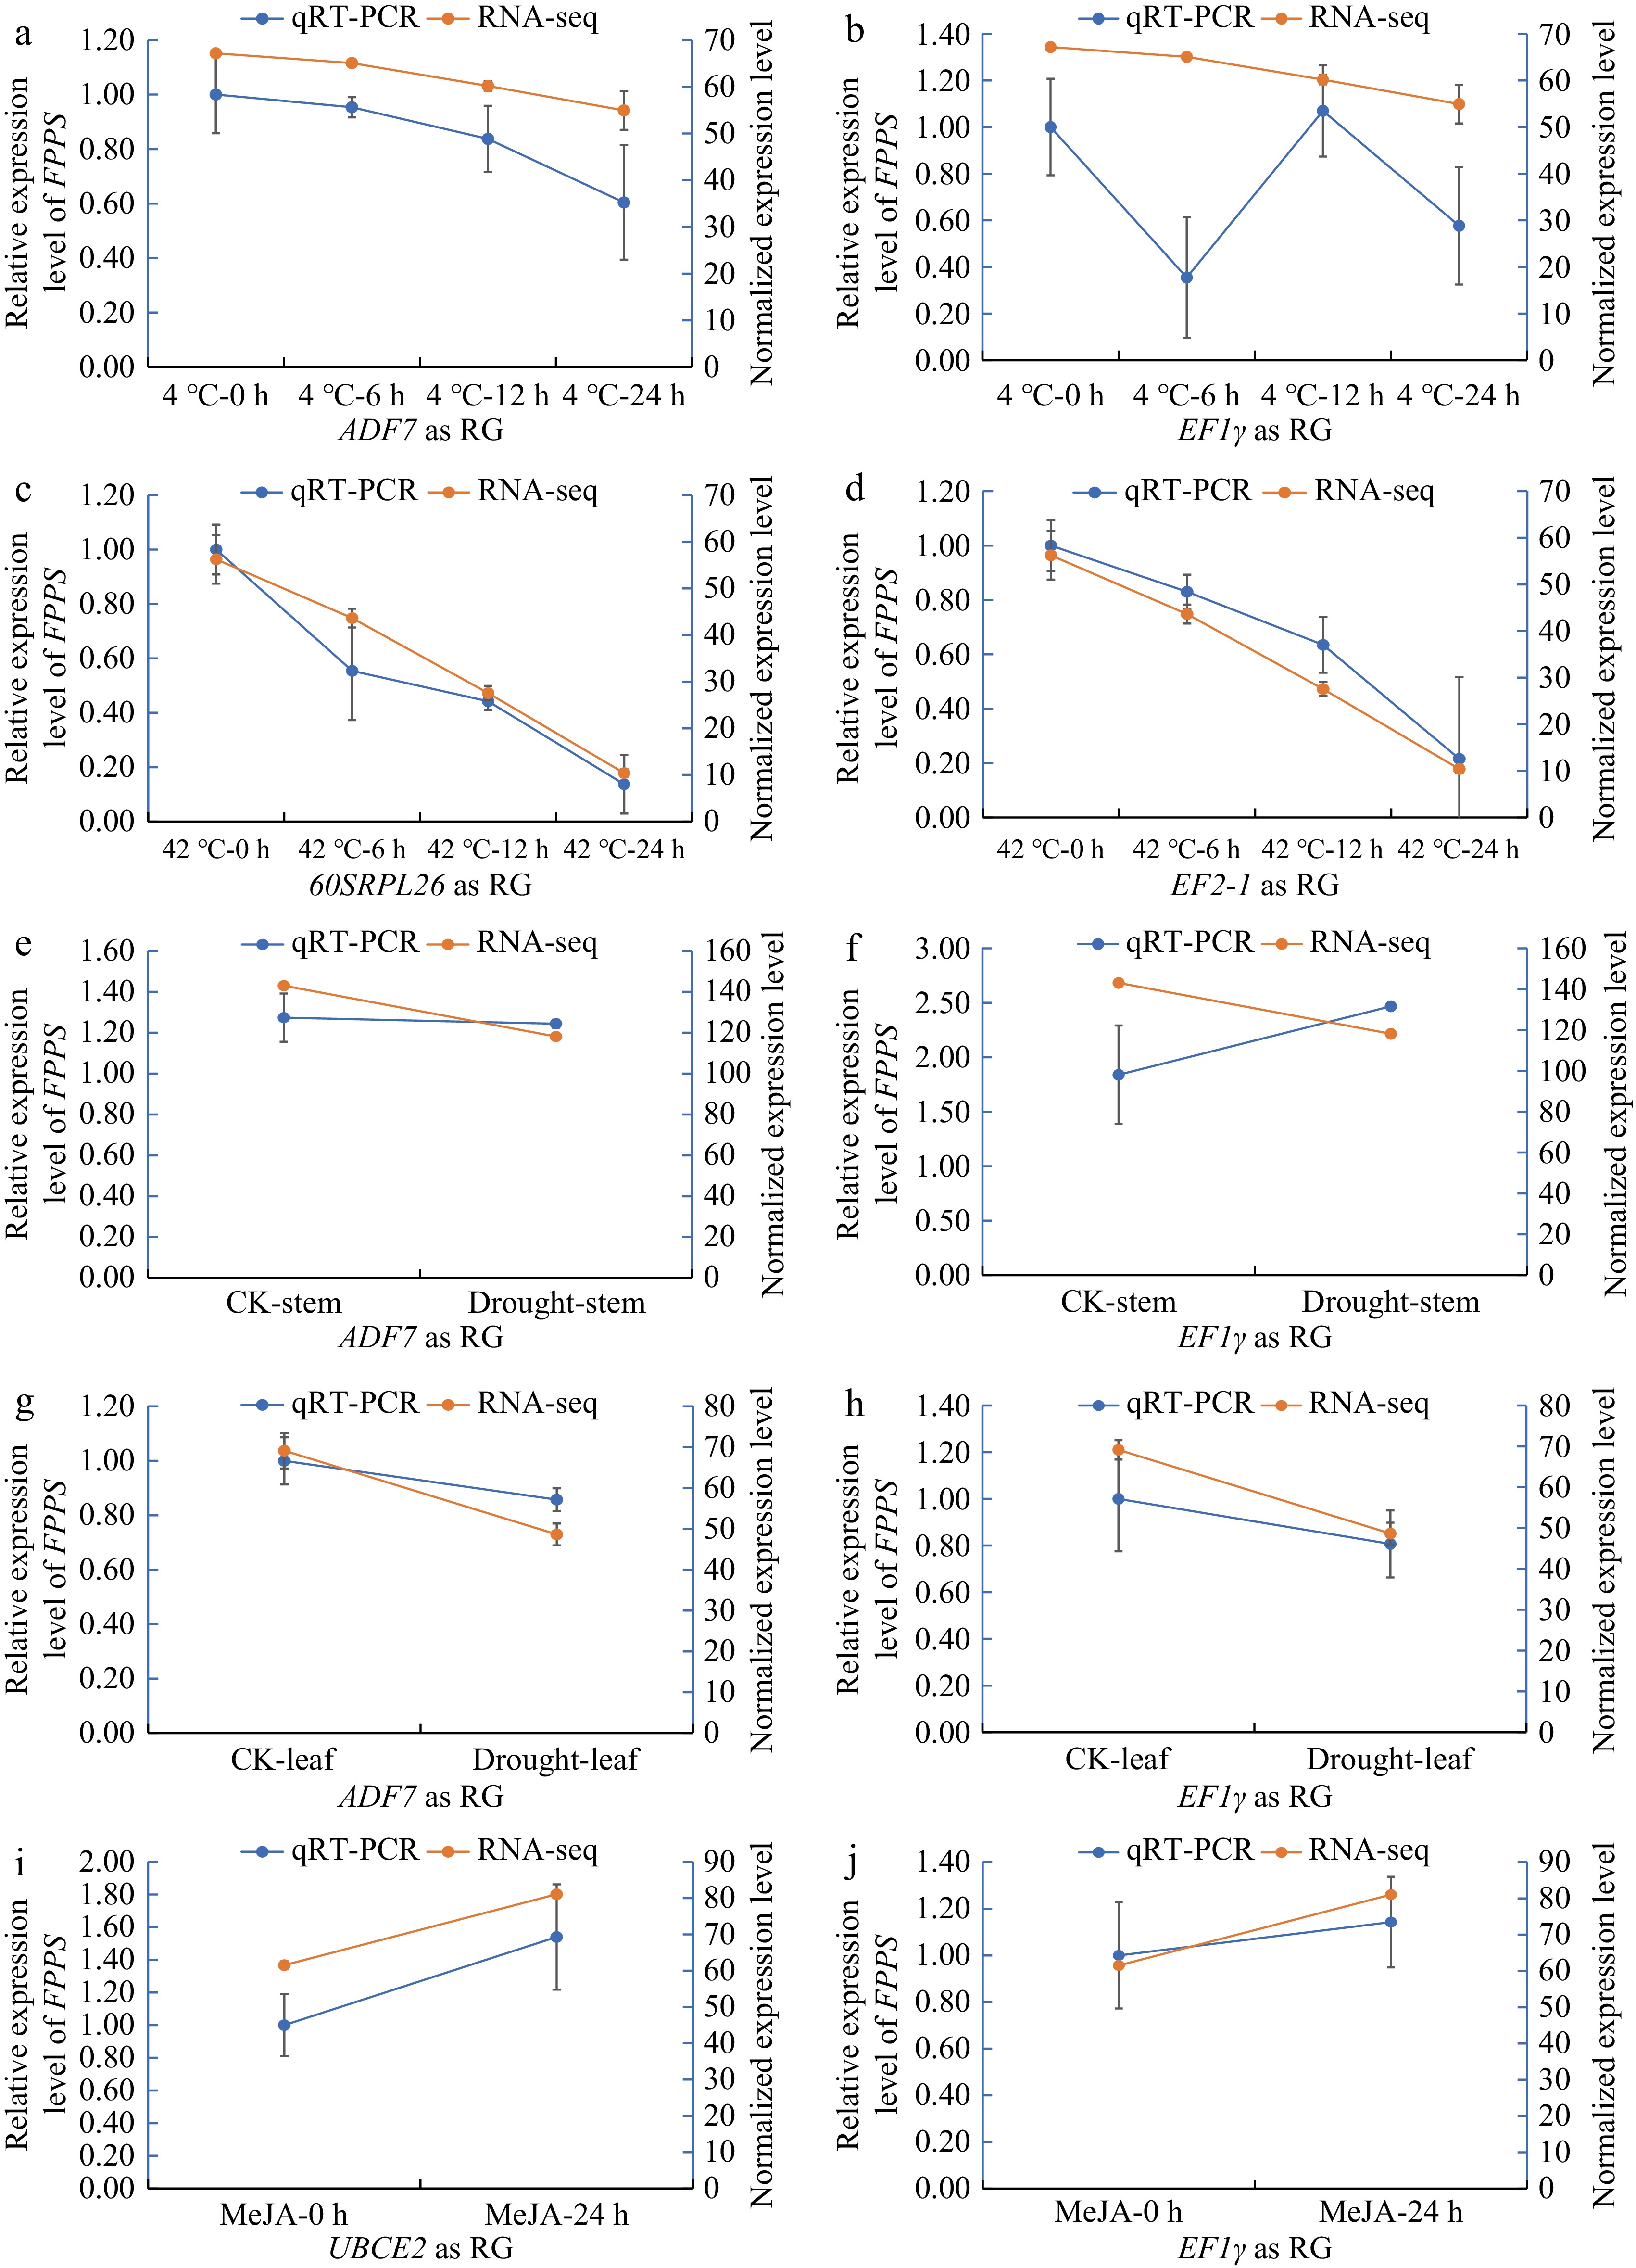
Figure 6.
qRT-PCR was conducted using the most stable RGs and the least stable RGs to validate the expression levels of DnFPPS based on previous transcriptome data under various abiotic stress conditions. (a), (b) The expression level of DnFPPS under low temperature (4 °C). The X-axis labels represent different time points after cold stress, with the most stable gene (ADF7) used as the RG and the least stable gene (EF1γ) alos used as RG, respectively. (c), (d) The expression level of DnFPPS under high temperature (42 °C). The X-axis labels represent different time points after high temperature stress, with the most stable gene (60SRPL26) as reference gene and the least stable gene (EF2-1) as reference gene. The expression level of DnFPPS under drought in the (e), (f) stem, and (g), (h) leaf. The most stable gene (ADF7) served as the reference gene, while the least stable gene (EF1γ) was also used as a reference gene. (i), (j) The expression level of DnFPPS under MeJA stress, with the most stable gene (UBCE2) as the reference gene and the least stable gene (EF1γ) as the reference gene. Three biological replicates were collected for each treatment in the qRT-PCR experiment, and two biological replicates were used for RNA-seq. Data are presented as the average ± SD.
-
Dendrobium nobile is a significant medicinal plant in traditional Chinese medicine[25]. Picrotoxane-type sesquiterpenoid alkaloids (PSAs), a crucial component of this plant, exhibit notable antiviral and anticancer properties[15,26]. However, our understanding of the molecular mechanisms underlying PSA formation in D. nobile remains limited. Quantifying the expression profiles of key genes using qRT-PCR is a fundamental and widely employed method for elucidating the formation mechanisms of essential secondary metabolites in plants. While the selection and validation of reference genes have been conducted in numerous plant species, there is scant information available regarding stable reference genes for D. nobile. In recent years, RNA-seq data and transcriptome assembly have greatly facilitated the identification of novel and stable reference genes for various non-model plants[27,28]. In this study, utilizing the ten transcript datasets (GSE254169) and genomic sequences provided by Li et al.[17], eight commonly used reference genes were identified and validated for normalizing gene expression analyses across various abiotic stress experimental conditions in D. nobile. Special emphasis was placed on the relevance of these reference genes in research related to the biosynthesis of PSAs.
The primer specificity and efficiency of the eight candidate genes were assessed, and the expression stability of these candidates were systematically evaluated across various tissues, developmental stages, and under different abiotic stress conditions. This comparison utilized four commonly used software tools. While the results from all four methods were generally reasonable, some inconsistencies were observed, likely due to the application of different statistical algorithms[11,28]. To address these discrepancies, RefFinder software was employed to conduct a comprehensive analysis and rank the results from the four algorithms, to enhance the reliability of the findings.
Actin is a widely used stable reference gene across various species. Zhao et al.[29] identified Actin as the most suitable reference gene for leaves at different developmental stages and in the glyphosate treatment group of Solanum rostratum Dunal. Similarly, Li et al.[30] recognized Actin as the optimal choice for all samples of birch. In this study, Actin was determined to be the best reference gene for the DT samples, but it ranked as the second most unstable reference gene for the drought treatment group. Interestingly, compared to Actin, ADF7 (Actin-depolymerizing factor 7) emerged as the most stable gene across multiple sets, including DDS, LT, and drought sets. Plant actins are typically encoded by a multigene family, exhibiting unique and specific expression patterns across various tissues and developmental stages[31]. Consequently, different actin family genes demonstrate varying stability in different species, tissues, and under various treatment conditions. Additionally, both 60SRPL26 and 60SRPL7 belong to the 60S ribosomal protein family. 60SRPL26 was identified as the most stable reference gene for HT in D. nobile, while it was ranked as the second most unstable reference gene for the DT and LT sets. Conversely, 60SRPL7 was found to be the second most stable reference gene for DDS, LT, and drought conditions. In the research conducted by Li et al., 60SRPL10 was identified as the most stable RG for seeds at different developmental stages in safflower[32]. In contrast, RPL17 was identified as one of the comparatively unstable RGs in drought stress samples in Gelsemium elegans[27]. These results further confirm that genes from the same family can exhibit divergent stability across different species. Overall, it is essential to recognize that each species may possess its own set of stably expressed genes that can be utilized for qRT-PCR normalization.
To verify the reliability of the selected RGs, qRT-PCR experiments were conducted to detect the expression levels of DnFPPS in DT and DDS samples, using the most stable, the second most stable, and the least stable genes as RGs, respectively. The results indicate a similarity in the expression levels of DnFPPS when the most stable and second most stable genes were used as reference genes, while a divergence was observed when the least stable gene was employed. These results reveal that the selected RGs are reliable for qRT-PCR experiments. Additionally, the expression levels of DnFPPS were further analyzed under various abiotic stress conditions using the most stable RG. The present findings demonstrate that the expression pattern closely aligns with the results obtained from transcriptome sequencing. These results underscore the importance of identifying suitable reference genes to ensure accurate qRT-PCR outcomes.
-
In this study, single RG such as Actin or double RGs like Actin + ADF7 were identified as the most suitable RGs for the DT set in D. nobile. The single RG (ADF7) was selected as the RG for the DDS, LT, and drought sets. The combinations of 60SRPL7 + Actin, 60SRPL7 + EF2-1, and 60SRPL7 + ADF7 were determined to be the optimal combinations for the DDS, LT, and drought sets, respectively. Single RGs such as 60SRPL26 and UBCE2 have been identified as the most suitable RGs for HT and MeJA, respectively. The combinations of 60SRPL26 + UBCE2 and Actin + UBCE2 are recommended as the optimal RG combinations for HT and MeJA, respectively. In total, ADF7, Actin, 60SRPL26, 60SRPL7, and UBCE2 were recommended as RGs in the qRT-PCR experiment. Furthermore, the expression level of the DnFPPS gene was characterized under various abiotic stresses using the selected stable RGs. The present study offers a comprehensive and in-depth analysis for identifying stable reference genes as internal controls in qRT-PCR experiments aimed at studying target gene expression in the Dendrobium genus, specifically D. nobile. These findings not only establish a valuable platform for future gene expression profiling in D. nobile, but also contribute to a better understanding of the molecular mechanisms underlying the genes involved in PSA biosynthesis in this plant species.
This work were supported by Guizhou University Projects ([2023] #35), National Key R&D Plan Project (2021YFD1601001); Modern Agricultural Technology System of Traditional Chinese Medicine in Guizhou Province (GZYCCYJSTX-01); Key core technology research and development of mountainous agriculture in Guizhou Province (GZNYGJHX-2023011); the Key Laboratory of Functional Agriculture of Guizhou Provincial Higher Education Institutions (Qianjiaoji [2023] 007).
-
The authors confirm contribution to the paper as follows: study conception and design: Li D, Liu H; Figures and Tables prducing: Wu Y; sample collection: Deng X; draft manuscript preparation: Li D; manuscript revision: Li D, Li J, Luo C, Huang M, Wang H; research performing: Li K. All authors reviewed the results and approved the final version of the manuscript.
-
The datasets generated during the current study are available from the corresponding author on reasonable request.
-
The authors declare that they have no conflict of interest.
- Copyright: © 2025 by the author(s). Published by Maximum Academic Press, Fayetteville, GA. This article is an open access article distributed under Creative Commons Attribution License (CC BY 4.0), visit https://creativecommons.org/licenses/by/4.0/.
-
About this article
Cite this article
Li K, Deng X, Wu Y, Li J, Huang M, et al. 2025. Identification and validation of reference genes for qRT-PCR analyses under different experimental conditions in Dendrobium nobile. Medicinal Plant Biology 4: e001 doi: 10.48130/mpb-0024-0031 

Identification and validation of reference genes for qRT-PCR analyses under different experimental conditions in Dendrobium nobile
- Received: 28 August 2024
- Revised: 19 November 2024
- Accepted: 22 November 2024
- Published online: 06 January 2025
Abstract: Dendrobium nobile L. (D. nobile), a perennial epiphytic herb belonging to the Orchidaceae family, is widely utilized in traditional Chinese medicine. Identifying stable reference genes (RGs) in D. nobile under various experimental conditions is essential for accurate quantitative real-time polymerase chain reaction (qRT-PCR) analysis. In this study, eight genes were selected as the candidate RGs based on the transcriptome data from different tissues of D. nobile. The qRT-PCR experiments were conducted under diverse experimental conditions, including various tissues and developmental stages, temperature stress, drought stress, and methyl jasmonate (MeJA) stress. The software programs GeNorm, NormFinder, BestKeeper, ΔCt, and RefFinder were employed to evaluate the stability of the candidate RGs. The results indicated that Actin was the most stable reference gene (RG) across different tissues, UBCE2 was the most stable RG under MeJA stress, while ADF7 exhibited the highest stability in various developmental stages, low-temperature stress, and drought stress. The reference gene that demonstrated the most stable expression under high-temperature stress was 60SRPL26. The experiment also validated the selection of optimal reference genes by assessing the expression levels of the farnesyl pyrophosphate synthase gene (FPPS) in different tissues and developmental stages of D. nobile. Furthermore, the expression levels of DnFPPS were analyzed under various stress conditions using qRT-PCR with the most stable reference genes, and the results were consistent with RNA-seq data. These findings provide valuable guidance for future gene expression studies involving qRT-PCR in D. nobile.
-
Key words:
- Reference genes /
- qRT-PCR /
- Transcriptome data /
- Dendrobium nobile