


-
The mushroom Ganoderma, commonly called lingzhi in China, has been used for medicinal purposes for over 2000 years in China, Japan, South Korea, and other Asian countries[1,2]. In Chinese culture and characters, 'lingzhi' symbolizes auspiciousness and is regarded as a representation of spiritual potency and the essence of immortality[3]. Ganoderma was first documented in Shennong's Classic of Materia Medica and classified as an upper-grade medicine in traditional medical texts. Approximately 80 species of Ganoderma have been recorded in Chinese Fungi[4,5]. Ganoderma primarily grows on decaying roots in tropical and subtropical regions and consists of two parts: kidney-shaped semicircular or nearly circular cap and stipe[6,7]. Traditional Chinese medicine[8] Ganoderma (lingzhi) recorded in the Chinese Pharmacopoeia include Ganoderma lucidum[9] and Ganoderma sinense[10], which are edible materials used simultaneously in both medicine and food. While there are debates about the classification and name of Ganoderma lucidum, here, we follow the designation of G. lucidum as G. lingzhi according to the reported literature[11−13].
Ganoderma contains numerous active compounds, including polysaccharides, triterpenoids, steroids, and nucleotides, as well as small amounts of amino acids and proteins, with polysaccharides and triterpenes being the primary bioactive components[14]. Recent scientific and clinical studies have continued to provide evidence of the novel pharmacological value of this fungus[15], including anticancer[16], antioxidant[17,18], anti-inflammatory, and anti-glycemic activities[19]. The market demand for Ganoderma is substantial due to the therapeutic and nutritional value imparted by the plethora of chemical constituents[20]. To satisfy the market demands, the latest trend in Ganoderma production has involved liquid cultivation[21]. Various commercial products worldwide in different formulations, either as medicines or dietary supplements, are produced from different parts of the Ganoderma, mainly including mycelia, the fruiting body, and the spores[22]. These products have an estimated annual global trade value of approximately four billion US dollars. From 2017 to 2022, the market size for Ganoderma spore powder increased from USD 25.262 million to USD 32.811 million[23]. China is the largest producer and exporter of fruiting bodies and spores, with a capacity of over 110,000 MT/year[24].
Quality evaluation of herbal drugs requires the assessment of identity and possible adulterations, as well as the determination of the content of active compounds or markers[25−28]. A crucial aspect of quality control for commercial Ganoderma is verifying their authenticity against unknown adulterants and fraudulent materials[29]. Due to the high economic value of Ganoderma, an increasing number containing fraudulently added cheap materials, such as edible mushrooms, have emerged in the market[30,31]. A study revealed that only 26.3% of the tested samples contained ingredients that matched their labels, indicating significant inconsistencies in the quality of Ganoderma dietary supplements available on the market. Currently, species identification of Ganoderma involves incomplete sample types and insufficient systematic identification methods[32,33]. Moreover, the quantification of multiple chemical components in herbal extracts is a common quality control method for herbal medicines[34−36]. However, the quality consistency of commercial Ganoderma in relation to labeled ingredients has seldom been evaluated systematically and comprehensively[37−39], especially since there are no standards for spore chemical compounds and the fruiting body contains much smaller chemical components than the spore samples[30]. Hence, determining the chemical composition systematically and comprehensively for the efficacy and safety of commercial Ganoderma and establishing quality control methods for spores are of great significance.
Here, the authenticity and adulterants of commercial Ganoderma were assessed using DNA barcoding technology. Additionally, the total polysaccharides and triterpenoids in fruiting bodies and spores of Ganoderma were determined using standard assays in the Chinese Pharmacopoeia. Furthermore, the absolute contents of 15 targeted ganoderic acids were quantified for fruiting bodies and spores of Ganoderma using ultra-high-performance liquid chromatography coupled with mass spectrometry (UPLC-MS/MS). Finally, the integration of molecular identification and mass spectrometry quantification is suggested for the species identification and quality control of commercial Ganoderma, thereby aiding in the regulation of the Chinese herbal medicine market.
-
Purchase of National Pharmaceutical Reference Materials: Ganoderma lingzhi (G1-2) and Ganoderma lingzhi spore (G1-1) from China National Institute of Food and Drug Certification, which are used as the standard products for the identification and quality evaluation. The remaining 84 batches of Ganoderma were randomly purchased from the market and numbered (Table 1), including Ganoderma fruiting bodies and Ganoderma spore powder. The commercial Ganoderma fruiting bodies are cut into pieces, ground into powder, and the dried materials are powdered and sieved through a No. 60 mesh. All material samples were stored at 25 °C.
Table 1. Detailed information on commercial Ganoderma.
ID Origin Sample type ID Origin Sample type G1-1 / Spores G2-1 Yunnan Fruiting body G1-2 / Spores G2-2 Anhui Fruiting body G1-3 Anhui Spores G2-3 Jilin Fruiting body G1-4 Jilin Spores G2-4 / Fruiting body G1-5 Jilin Spores G2-5 Fujian Fruiting body G1-6 Jilin Spores G2-6 Fujian Fruiting body G1-7 Jilin Spores G2-7 Jilin Fruiting body G1-8 / Spores G2-8 / Fruiting body G1-9 Zhejiang Spores G2-9 / Fruiting body G1-10 Jiangsu Spores G2-10 / Fruiting body G1-11 Anhui Spores G2-11 Sichuan Fruiting body G1-12 Shandong Spores G2-12 Jilin Fruiting body G1-13 Shandong Spores G2-13 Zhejiang Fruiting body G1-14 Fujian Spores G2-14 Zhejiang Fruiting body G1-15 Jiangsu Spores G2-15 Jilin Fruiting body G1-16 / Spores G2-16 Heilongjiang Fruiting body G1-17 Zhejiang Spores G2-17 / Fruiting body G1-18 / Spores G2-18 / Fruiting body G1-19 Anhui Spores G2-19 Jilin Fruiting body G1-20 Zhejiang Spores G2-20 Sichuan Fruiting body G1-21 / Spores G2-21 Fujian Fruiting body G1-22 Shanghai Spores G2-22 Jilin Fruiting body G1-23 Shandong Spores G2-23 Jilin Fruiting body G1-24 Zhejiang Spores G2-24 Jiangsu Fruiting body G1-25 / Spores G2-25 Shandong Fruiting body G1-26 Shandong Spores G2-26 Zhejiang Fruiting body G1-27 Fujian Spores G2-27 / Fruiting body G1-28 Yunnan Spores G2-28 / Fruiting body G1-29 Jilin Spores G2-29 / Fruiting body G1-30 Guizhou Spores G2-30 / Fruiting body G1-31 / Spores G2-31 Fujian Fruiting body G1-32 Shandong Spores G2-32 Anhui Fruiting body G1-33 Zhejiang Spores G2-33 Anhui Fruiting body G1-34 Anhui Spores G2-34 / Fruiting body G1-35 Zhejiang Spores G2-35 / Fruiting body G1-36 Anhui Spores G2-36 Fujian Fruiting body G1-37 Anhui Spores G2-37 Guangxi Fruiting body G1-38 Shandong Spores G2-38 / Fruiting body G1-39 / Spores G2-39 Shandong Fruiting body G1-40 Anhui Spores G2-40 Shandong Fruiting body G1-41 Guangdong Spores G2-41 Fujian Fruiting body G1-42 Jilin Spores G2-42 Anhui Fruiting body G1-43 Shandong Spores G2-43 Jiangxi Fruiting body Genetic diversity analysis and species delimitation
-
Sequences of ITS, ITS2, RPB2, and β-microtubulin from Ganoderma species (Ganoderma lingzhi, Ganoderma sinense, Ganoderma resinaceum, Ganoderma applanatum, and Ganoderma tsugae) were downloaded from GenBank. Comparing the sequence matrices using MEGA 11 to obtain a K2P genetic distance matrix[40,41]. Additionally, the minimum interspecific and maximum intraspecific divergence for each sequence was calculated and plotted.
PCR amplification of DNA barcoding sequences
-
The total genomic DNA of 86 commercial Ganoderma samples was extracted using the protocol established in a previous study[42,43]. The fungal nuclear internal transcribed spacer region (ITS) and internal transcribed spacer region 2 (ITS2) were amplified with the primers ITSF (5′-ATGCGATACTTGGTGTGAAT-3′ and ITSR (5′-GACGCTTCTCCAGACTACAAT-3′), and ITS2F (5′-ATGCGATACTTGGTGTGAAT-3′) and ITS2R (5′-GACGCTTCTCCAGACTACAAT-3′), respectively. PCR amplification reaction refers to the standard procedures of DNA barcoding technology for herbal materials developed by Shilin Chen's group[44]. The PCR products were purified and sequenced (Supplementary Fig. S1).
Species identification
-
All obtained ITS2 and ITS sequences underwent trimming to remove primer and low-quality regions, followed by manual correction and stitching using Chromas (v2.6.5) software. Additionally, the 5.8S and 28S fragments of the ITS2 sequence were deleted by HMMer based on the hidden Markov model[45]. To facilitate species identification, the obtained sequences were analyzed to search for the sequences with the highest identities using the BLAST tool available on the National Center for Biotechnology Information (NCBI) website (
http://blast.ncbi.nlm.nih.gov ). All ITS and ITS2 sequences were respectively aligned using ClustalW (v2.0.11), and then the phylogenetic trees were constructed using the neighbor-joining method with 1000 repeated bootstraps[46,47].Detection of total polysaccharide
-
The extraction of polysaccharides from Ganoderma was carried out according to the method described in a previous study with some modifications[8]. Each sample (1 g) was ultrasonically extracted with 40 mL of distilled water for 40 min, three times. The aqueous extract was centrifuged and then 5 mL of the supernatant was mixed with 35 mL 99.5% ethanol (the ethanol final concentration > 85%) to precipitate the polysaccharides. The precipitate was cooled at 4 °C for 12 h before being collected by centrifugation (4000 rpm, 5 min). The residue was then dissolved in 50 mL of distilled water. The total polysaccharide content was determined using the anthrone-sulfuric acid colorimetric method using D-glucose as standard reference material. A 2 mL aliquot of the polysaccharide solution was mixed with 6 mL of anthrone-sulfuric acid reagent (prepared by accurately weighing 0.1 g of anthrone, dissolving it in 100 mL of 98% sulfuric acid, and shaking well) and standing for 15 min, followed by cooling in an ice bath for an additional 15 min. The absorbance was measured at 625 nm. A standard curve was established using the D-glucose standard with a linear equation: Y = 3.8816X + 0.0039 (R2 = 0.9986).
Detection of total triterpenoids
-
Total triterpenoid content was determined following the procedure described by a previous study[8], with slight modifications. Briefly, each sample (60 mg) was ultrasonically extracted with 1.6 mL of 99.5% ethanol for 40 min, repeated twice. After centrifugation at 10000 rpm for 5 min, 750 μL of supernatant was taken and added to the same volume of 99.5% ethanol mixed to obtain the triterpenoid solution. 0.2 mL of the triterpene solution was taken and transferred into a 15 mL stoppered glass tube. The solvent was evaporated to dryness, then the residue was allowed to cool. Next, 0.2 mL of freshly prepared vanillin-acetic acid solution was added (prepared by accurately weighing 0.5 g of vanillin, dissolving it in 10 mL of 99.5% acetic acid, and shaking well) and 0.8 mL of 70% perchloric acid. After incubation at 70 °C for 15 min, the mixed solution was cooled on ice for 5 min, and then 4 mL of 99% ethyl acetate was added. Subsequently, 200 μL of the mixed solution was transferred to 96-well plates, and absorbance was measured at 546 nm using a microplate reader (Biotek-EL×800; BioTek Instruments, Inc., Winooski, VT, USA). The content of total triterpenoid was calculated by the standard oleanolic acid curve and expressed as oleanolic acid equivalents (OAE, mg/g DW) through the standard calibration curve (Y = 1.0656X + 0.01181, R2 = 0.9979).
Determination of targeted ganoderic acids using LC-MS/MS
-
Fifty mg of powder sample was precisely weighed and transferred to 1 mL of 80% aqueous methanol. The powder was extracted twice in a supersonic cleaner for 45 min each time. Subsequently, the extract underwent centrifugation at 12,000 rpm for 5 min. The resulting supernatant was filtered through a 0.22 μm nylon filter before being injected into the HPLC–MS/MS system. The content of triterpenoid saponins in Ganoderma was determined by calculating the mean peak area from three replicate injections.
The 15 reference standards were dissolved in methanol to prepare standard solutions with final concentrations of 100 μg/ml, including ganoderic acid A, B, C1, C2, C6, D, F, H, G, J; ganoderenic acid A, B, C, D; and Lucideric acid A, which were stored in the dark at −40 °C.
After optimizing the experimental conditions, a method was developed using ultrahigh-performance liquid chromatography (UPLC) coupled with quadrupole time-of-flight mass spectrometry (MS) for the nontarget metabolomic profiling of ganoderic acid. All samples were analyzed using an Agilent HPLC system equipped with a C18 column (2.6-mm particle size, 4.6 mm × 150 mm; Phenomenex, USA) at 40 °C. Separation of standards and samples was achieved using a gradient mobile phase composed of water containing 0.1% formic acid (A) and acetonitrile. The gradient conditions were programmed as follows: 0–6 min, 20% B; 6–12 min, 30% B; 12–22 min, isocratic at 40% B; 22–28 min, 60% B; 28–35 min, 95% B; 35–35.1 min, 20% B; and 35.1–38 min, 20% B. The flow rate was maintained at 0.3 mL/min, and the injection volume was 3 μL.
Mass spectrometry analysis was conducted using the Triple TOFTM 6600 system. The MS was equipped with an electrospray ionization (ESI) ion source and operated in the negative ion mode, in the full scan range from mass-to-charge ratio (m/z) of 100 to 2,000 with fragmentation of the five most intensive signals. The following MS conditions were used: ion spray voltage, 5,500 V; curtain gas, 25 psi; ion source gas 140 psi; ion source gas 260 psi; and temperature, 550 °C. The mass spectrum data were analyzed by Analyst TF1.8 Software. Using the metabolome software LibraryView (AB Sciex, Shanghai, China), the samples' metabolites were analyzed qualitatively and quantitatively. The chemical structure of the compounds was characterized based on the calculated accurate masses of the molecular ions, protonated molecules, fragment ions, and retention behavior. The mass error for molecular ions in all identified compounds was within ± 5 ppm. The relative contents (after taking log values) of compounds in different samples were displayed by Origin 2022.
-
A total of 200 sequences from five Ganoderma species were analyzed to compare the identification ability of four candidate barcodes within the Ganoderma: ITS, ITS2, RPB2, and β-tubulin. For the sequences in the RPS2 dataset, the intraspecific genetic distance (intra-GD) ranged from 0 to 0.0131 (mean = 0.0032), while the interspecific genetic distance (inter-GD) ranged from 0.0104 to 0.1181 (mean = 0.0801) (Fig. 1a, Supplementary Table S1). Although the mean inter-GD was 25-fold greater than the mean intra-GD, the overlap between inter- and intra-GD (0.0104–0.0131) indicated the absence of the barcoding gap. In the β-tubulin dataset, the intraspecific genetic distance (intra-GD) ranged from 0 to 0.0198 (mean = 0.0038), while the Interspecific genetic distance (inter-GD) ranged from 0.0234 to 0.0904 (mean = 0.0659) (Fig. 1d, Supplementary Table S1). Although the mean inter-GD was 17-fold higher than the mean intra-GD, the small difference between the maximum intra-GD and minimum inter-GD underscores the challenge of using β-tubulin as a barcode. In contrast, for the ITS and ITS2 datasets, the intra-GD ranged from 0 to 0.0135 (mean = 0.0033), 0 to 0.0209 (mean = 0.0060); and the inter-GD ranged from 0.0442 to 0.1006 (mean = 0.0717),0.0368 to 0.1502 (mean = 0.0867), respectively (Fig. 1b & c, Supplementary Table S1). The substantial difference between the maximum intra-GD and the minimum inter-GD in these datasets suggests the presence of a barcoding gap, highlighting ITS and ITS2 as suitable markers for species-level identification in Ganoderma. The aligned sequences of ITS and ITS2 were 626 bp and 199 bp in length, with 71 and 12 variable sites, respectively. These regions are easily amplified and exhibit sufficient variability for reliable species identification, making them appropriate barcodes for Ganoderma-based products.
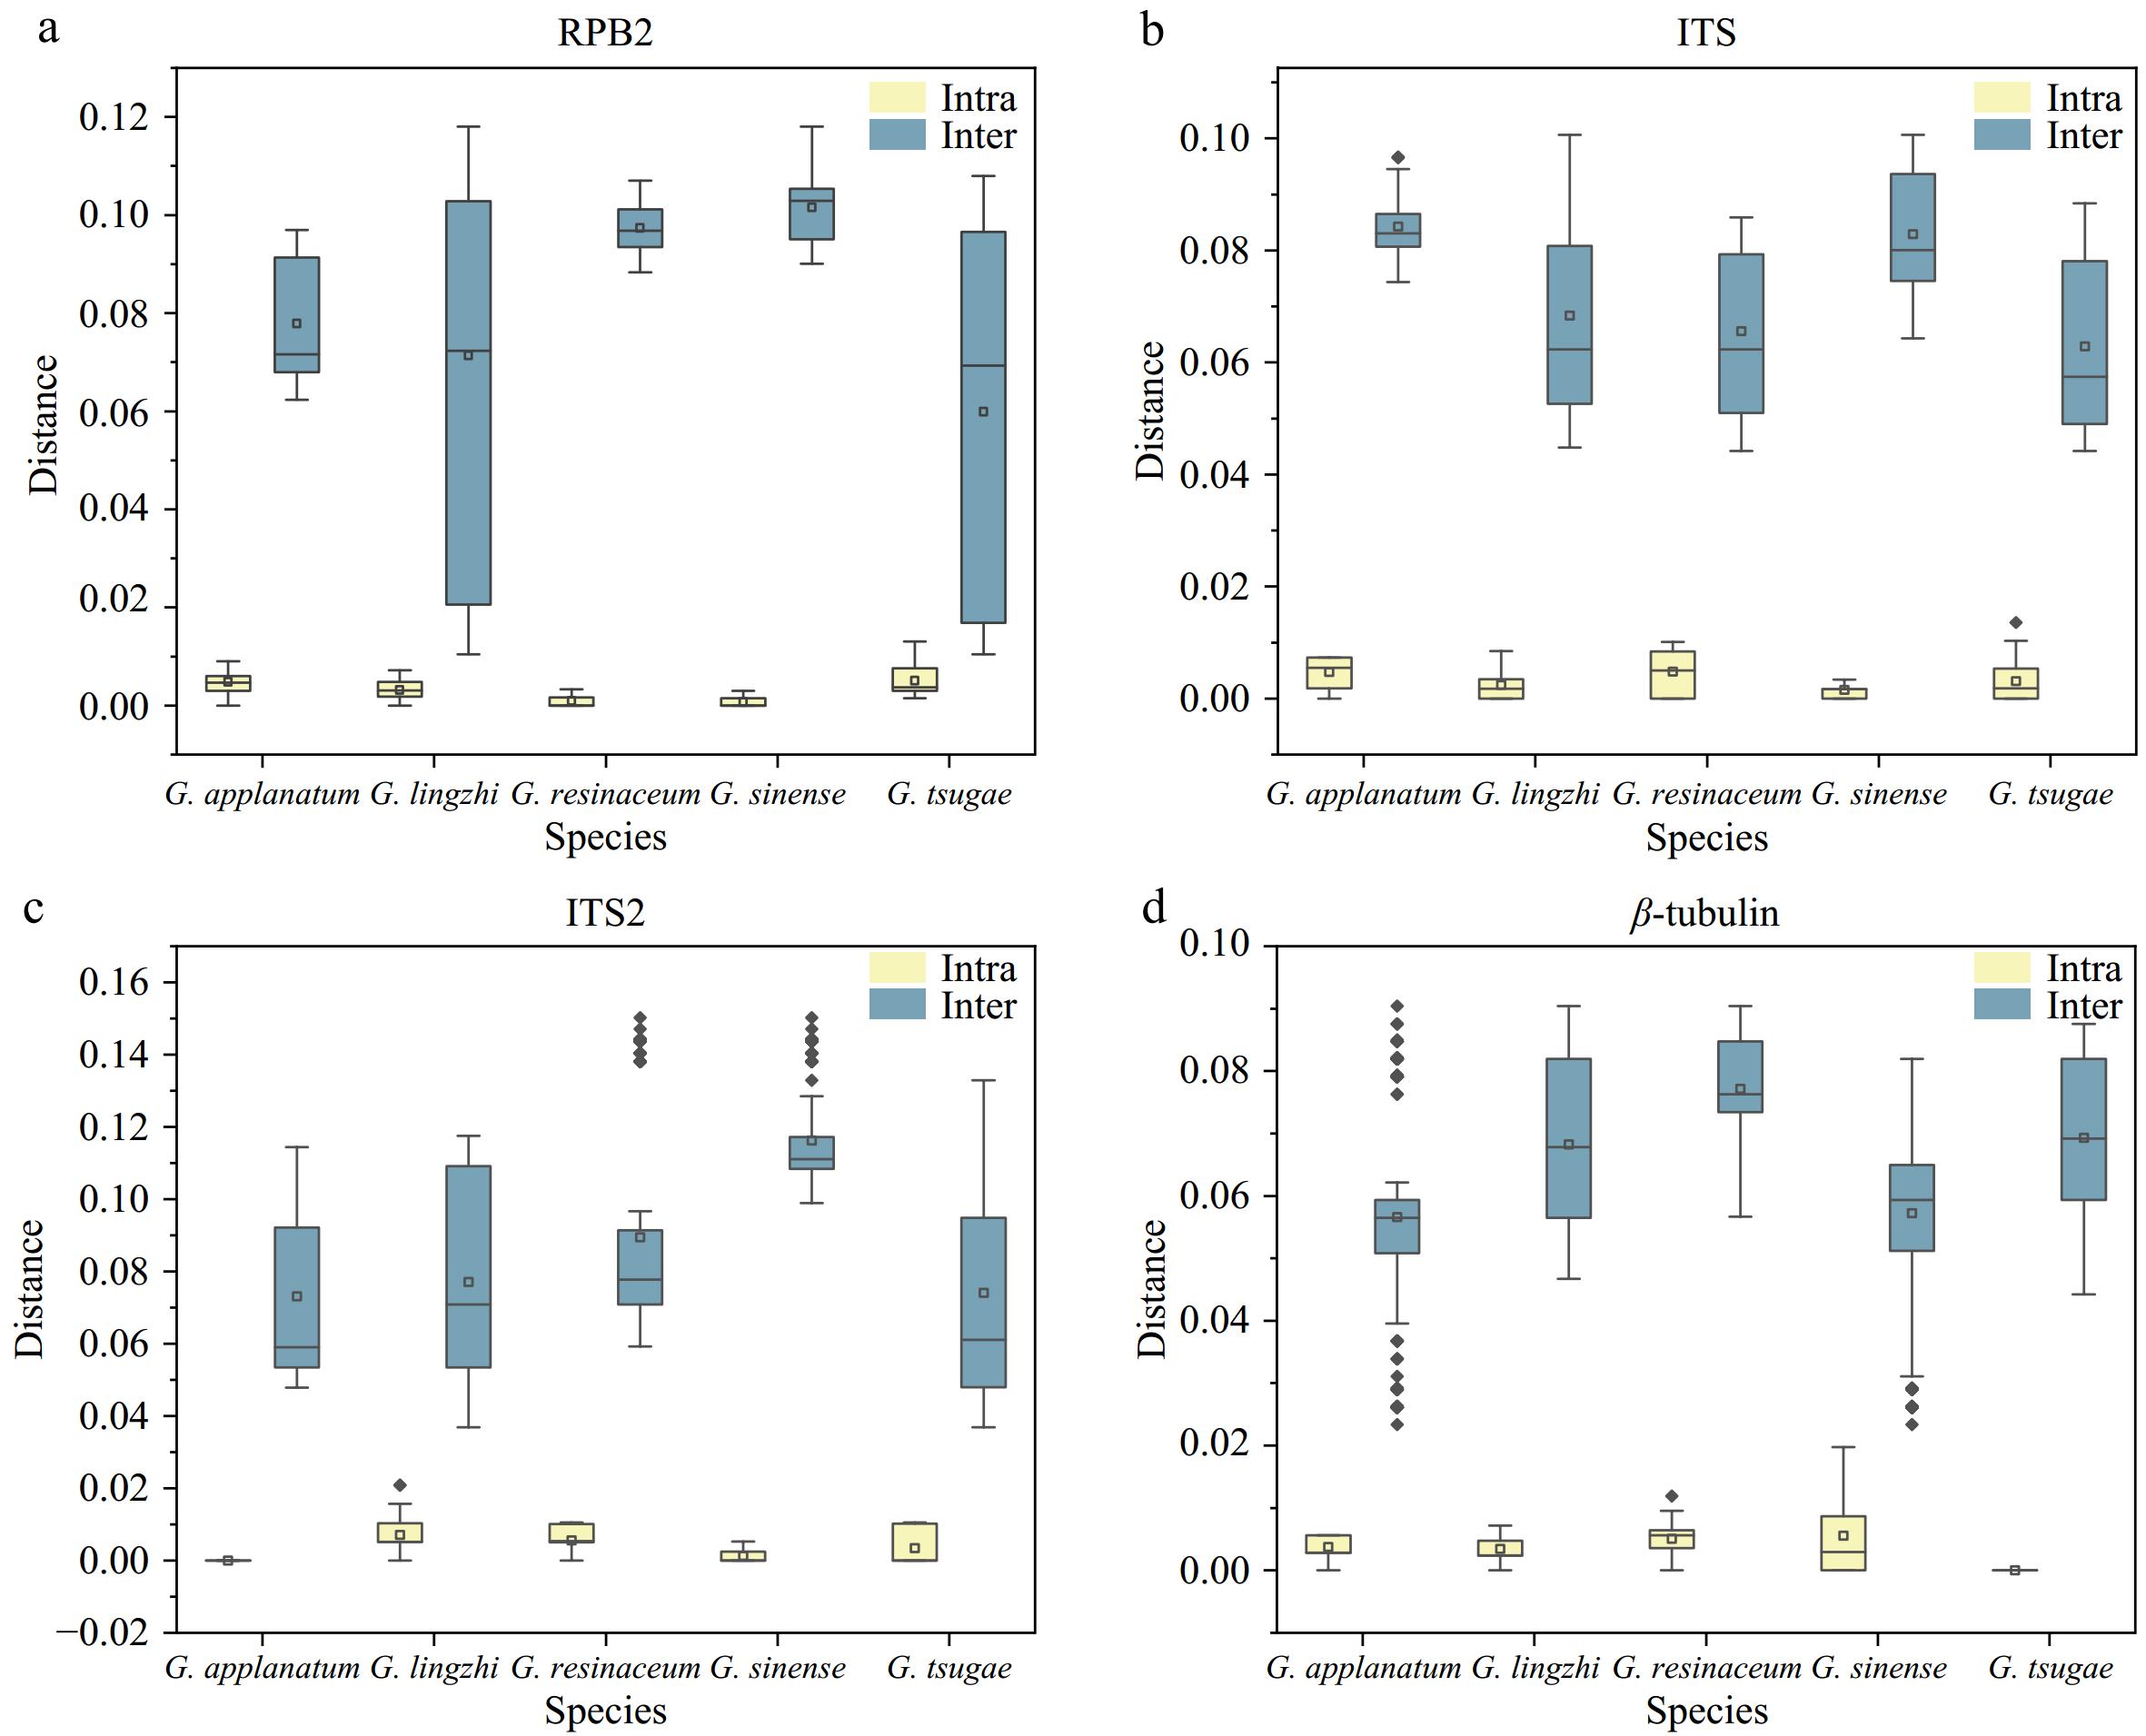
Figure 1.
The intra-GD and inter-GD of the (a) RPB2, (b) ITS, (c) ITS2, and (d) β-tubulin sequences of the Ganoderma species based on the K2P model.
Molecular identification of commercial Ganoderma
-
The amplification success rate for ITS and ITS2 was 98.84% (85/86) (Supplementary Fig. S1), with a sequencing success rate was 95.29% (81/85). Of these, 81 samples were identified at the species level, while five remained unidentifiable (G1-22, G2-3, G2-20, G2-24 due to either amplification or sequencing failures, and G2-29 due to low maximum similarity). The maximum similarity range for ITS was 93%–100%, and that for ITS2 was 96%–100%.
The phylogenetic tree based on the ITS (Fig. 2a) and ITS2 (Fig. 2b) sequences showed similar topologies despite differences in sequence lengths and variant sites. All samples formed four distinct clusters, with G. lingzhi forming a monophyletic group with 90% support. G. sinense, G. resinaceum, and G. applanatum were each clustered separately from G. lingzhi. Our study also studied the DNA barcoding of the main adulterants of G. lingzhi, such as G. resinaceum and G. applanatum, and compared their ITS2 secondary structures with G. lingzhi. It clearly showed the differences between G. lingzhi and related species in the ITS2 secondary spiral structures (Supplementary Fig. S2).
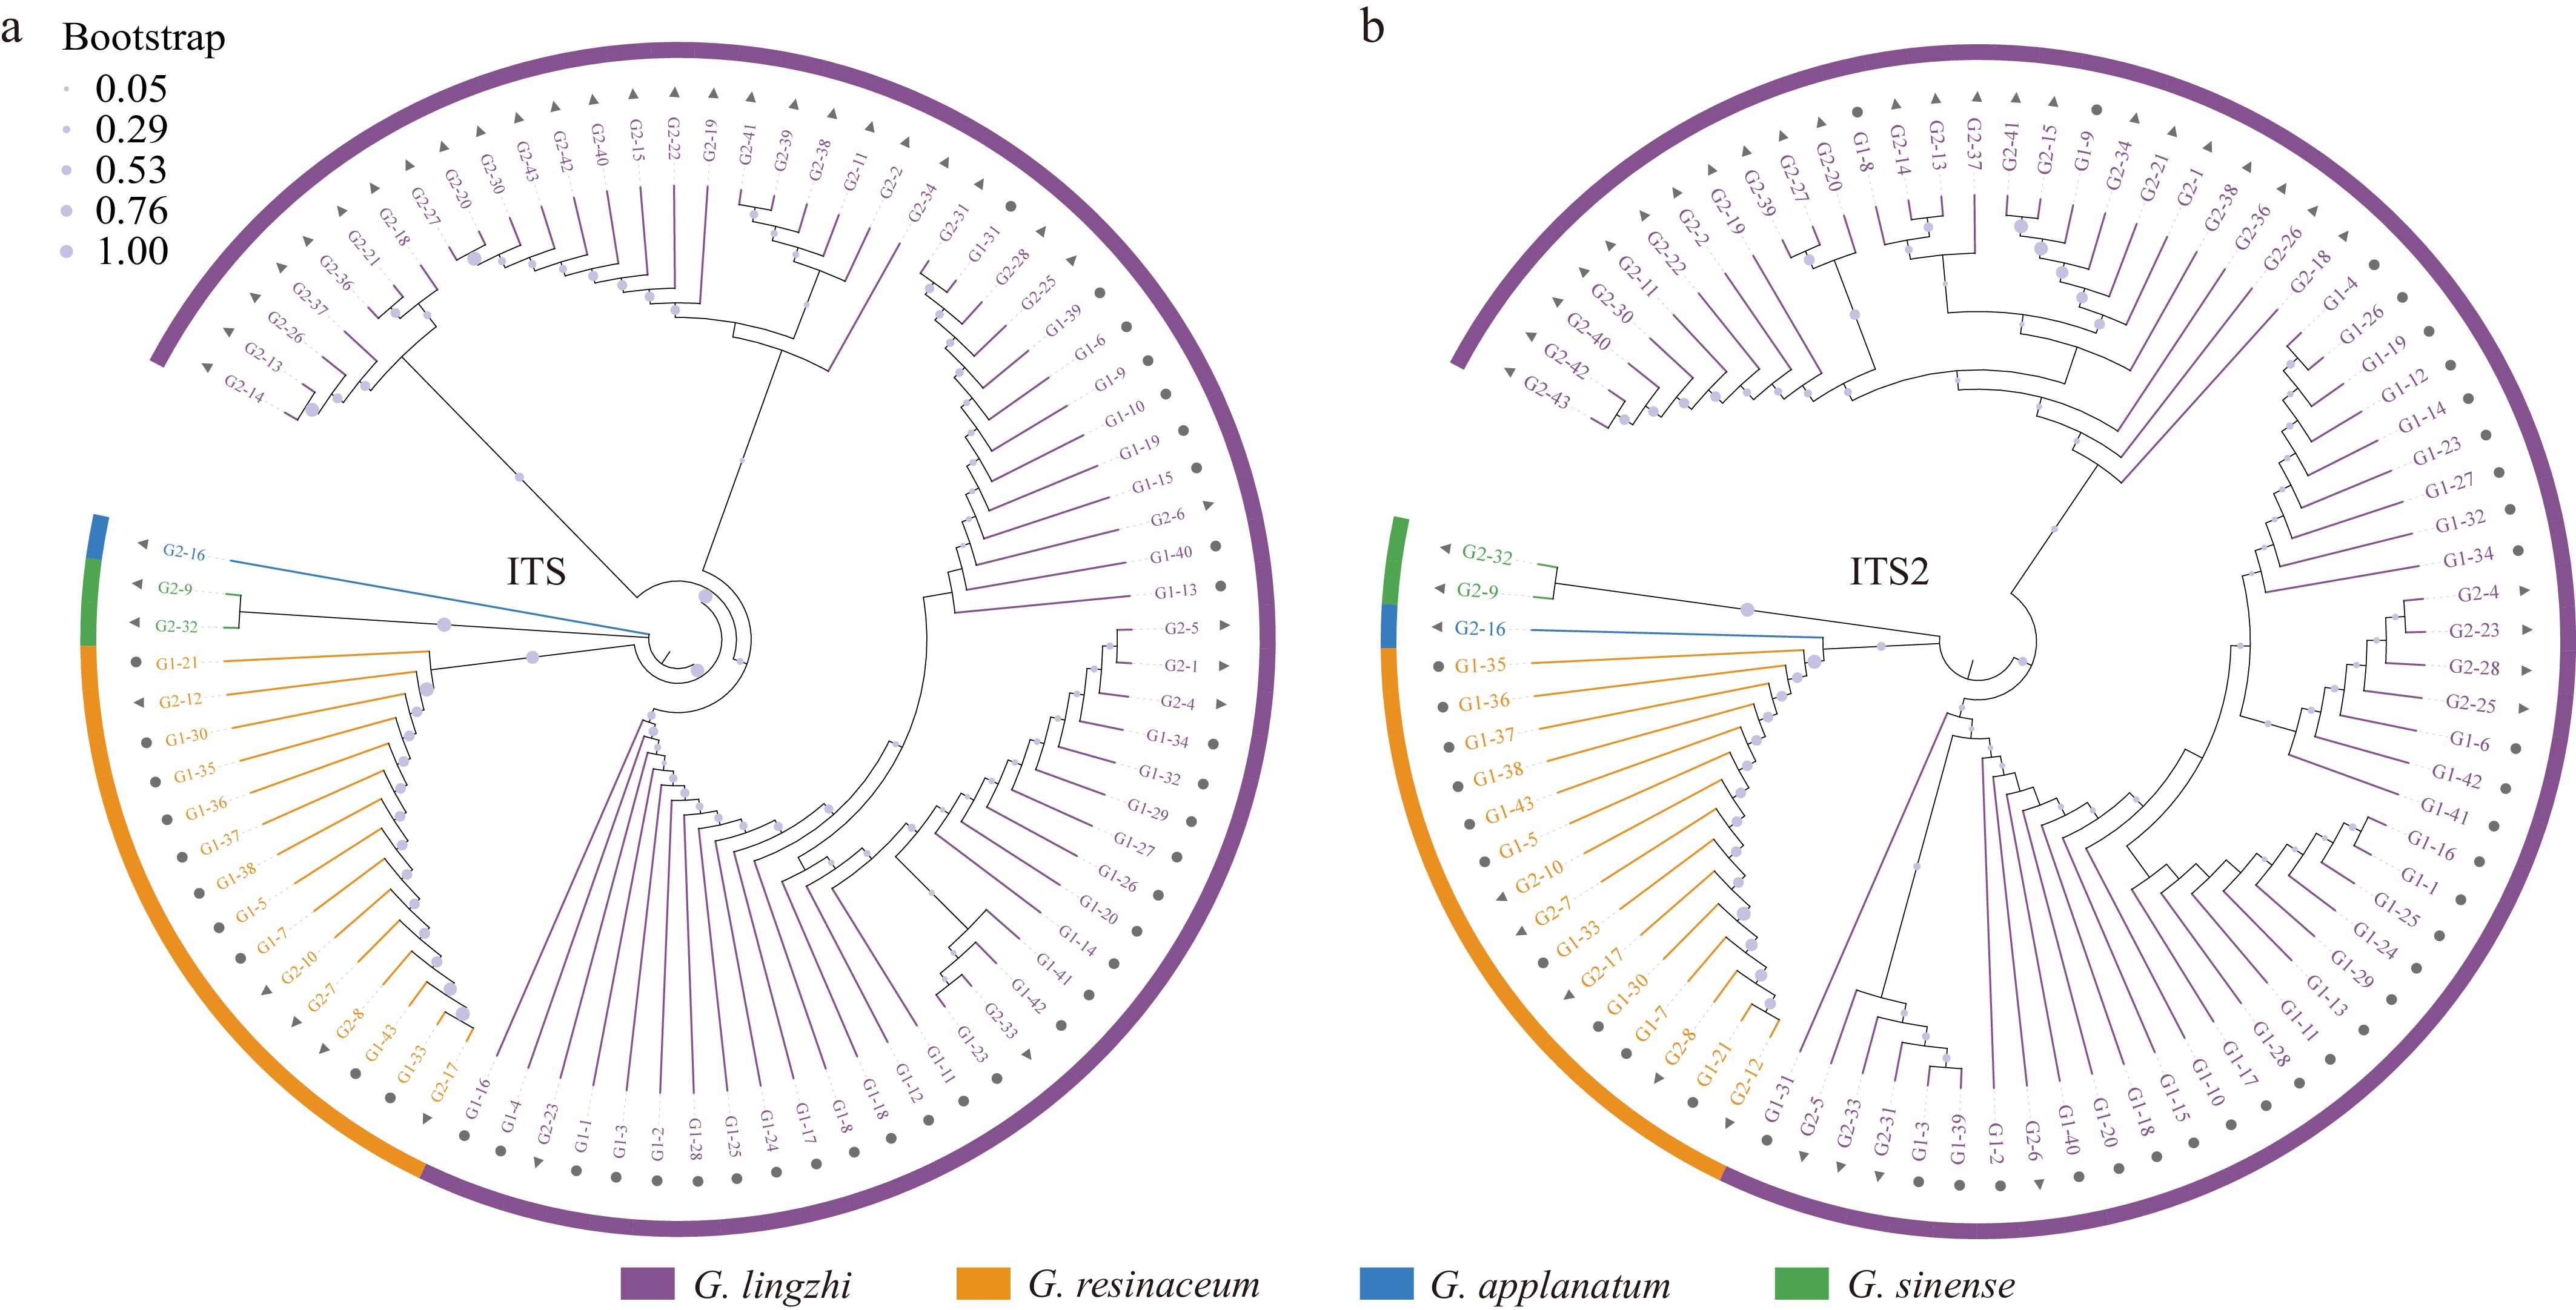
Figure 2.
Molecular identification of commercial Ganoderma based on DNA barcoding. The neighbor-joining tree is based on (a) ITS, and (b) ITS2 sequences of the commercial Ganoderma.
Analysis revealed that six out of the 43 Ganoderma fruiting bodies did not match the sales label: G2-7, G2-8, G2-10, G2-12, and G2-17 were identified as Ganoderma resinaceum, and G2-16 was identified as Ganoderma applanatum instead of Ganoderma lingzhi according to the DNA barcoding identification. Similarly, ten out of 43 Ganoderma spores did not match the sales labels: G1-5, G1-7, G1-21, G1-30, G1-33, G1-35, G1-36, G1-37, G1-38, and G1-43 were identified as Ganoderma resinaceum instead of Ganoderma lingzhi.
Molecular phylogenetic and DNA barcoding analyses were consistent, successfully identifying commercial Ganoderma. ITS2, due to its short sequence length and high amplification capacity, was deemed the most suitable barcode for identifying these products. Regulatory concerns arise due to common adulteration in the herbal market of Ganoderma, with 13.95% of Ganoderma fruiting bodies and 24.39% of Ganoderma spores not complying with labeling requirements, labeled as Ganoderma lingzhi while they were actually Ganoderma resinaceum. The adulteration of commercial Ganoderma spores seems more severe, possibly due to the unique form of the spores, which makes identification more challenging.
Total polysaccharide and triterpene of Ganoderma fruiting bodies
-
The total polysaccharide and triterpene contents of the commercial Ganoderma fruiting bodies exhibited significant variation (Fig 3, Supplementary Table S2). According to the Chinese Pharmacopoeia (2020 edition), G. lingzhi should contain not less than 0.90% total polysaccharides and not less than 0.50% total triterpenes[8]. However, our results showed that 24 out of 43 Ganoderma fruiting bodies failed to meet the total polysaccharide content requirement, with a non-compliance rate of 55.81%. In addition, combined with the results of molecular identification, the range of total polysaccharide content of G. lingzhi, G. sinense, G. resinaceum, and G. applanatum in the order of 0.47%−2.51%, 0.76%−1.17%, 0.59%−1.55%, and 0.26%. Notably, the highest total polysaccharide contents, reaching 2.51%, 2.10%, and 2.19% were observed in G2-4, G2-22, and G2-23, respectively, all identified as G. lingzhi through DNA barcoding.
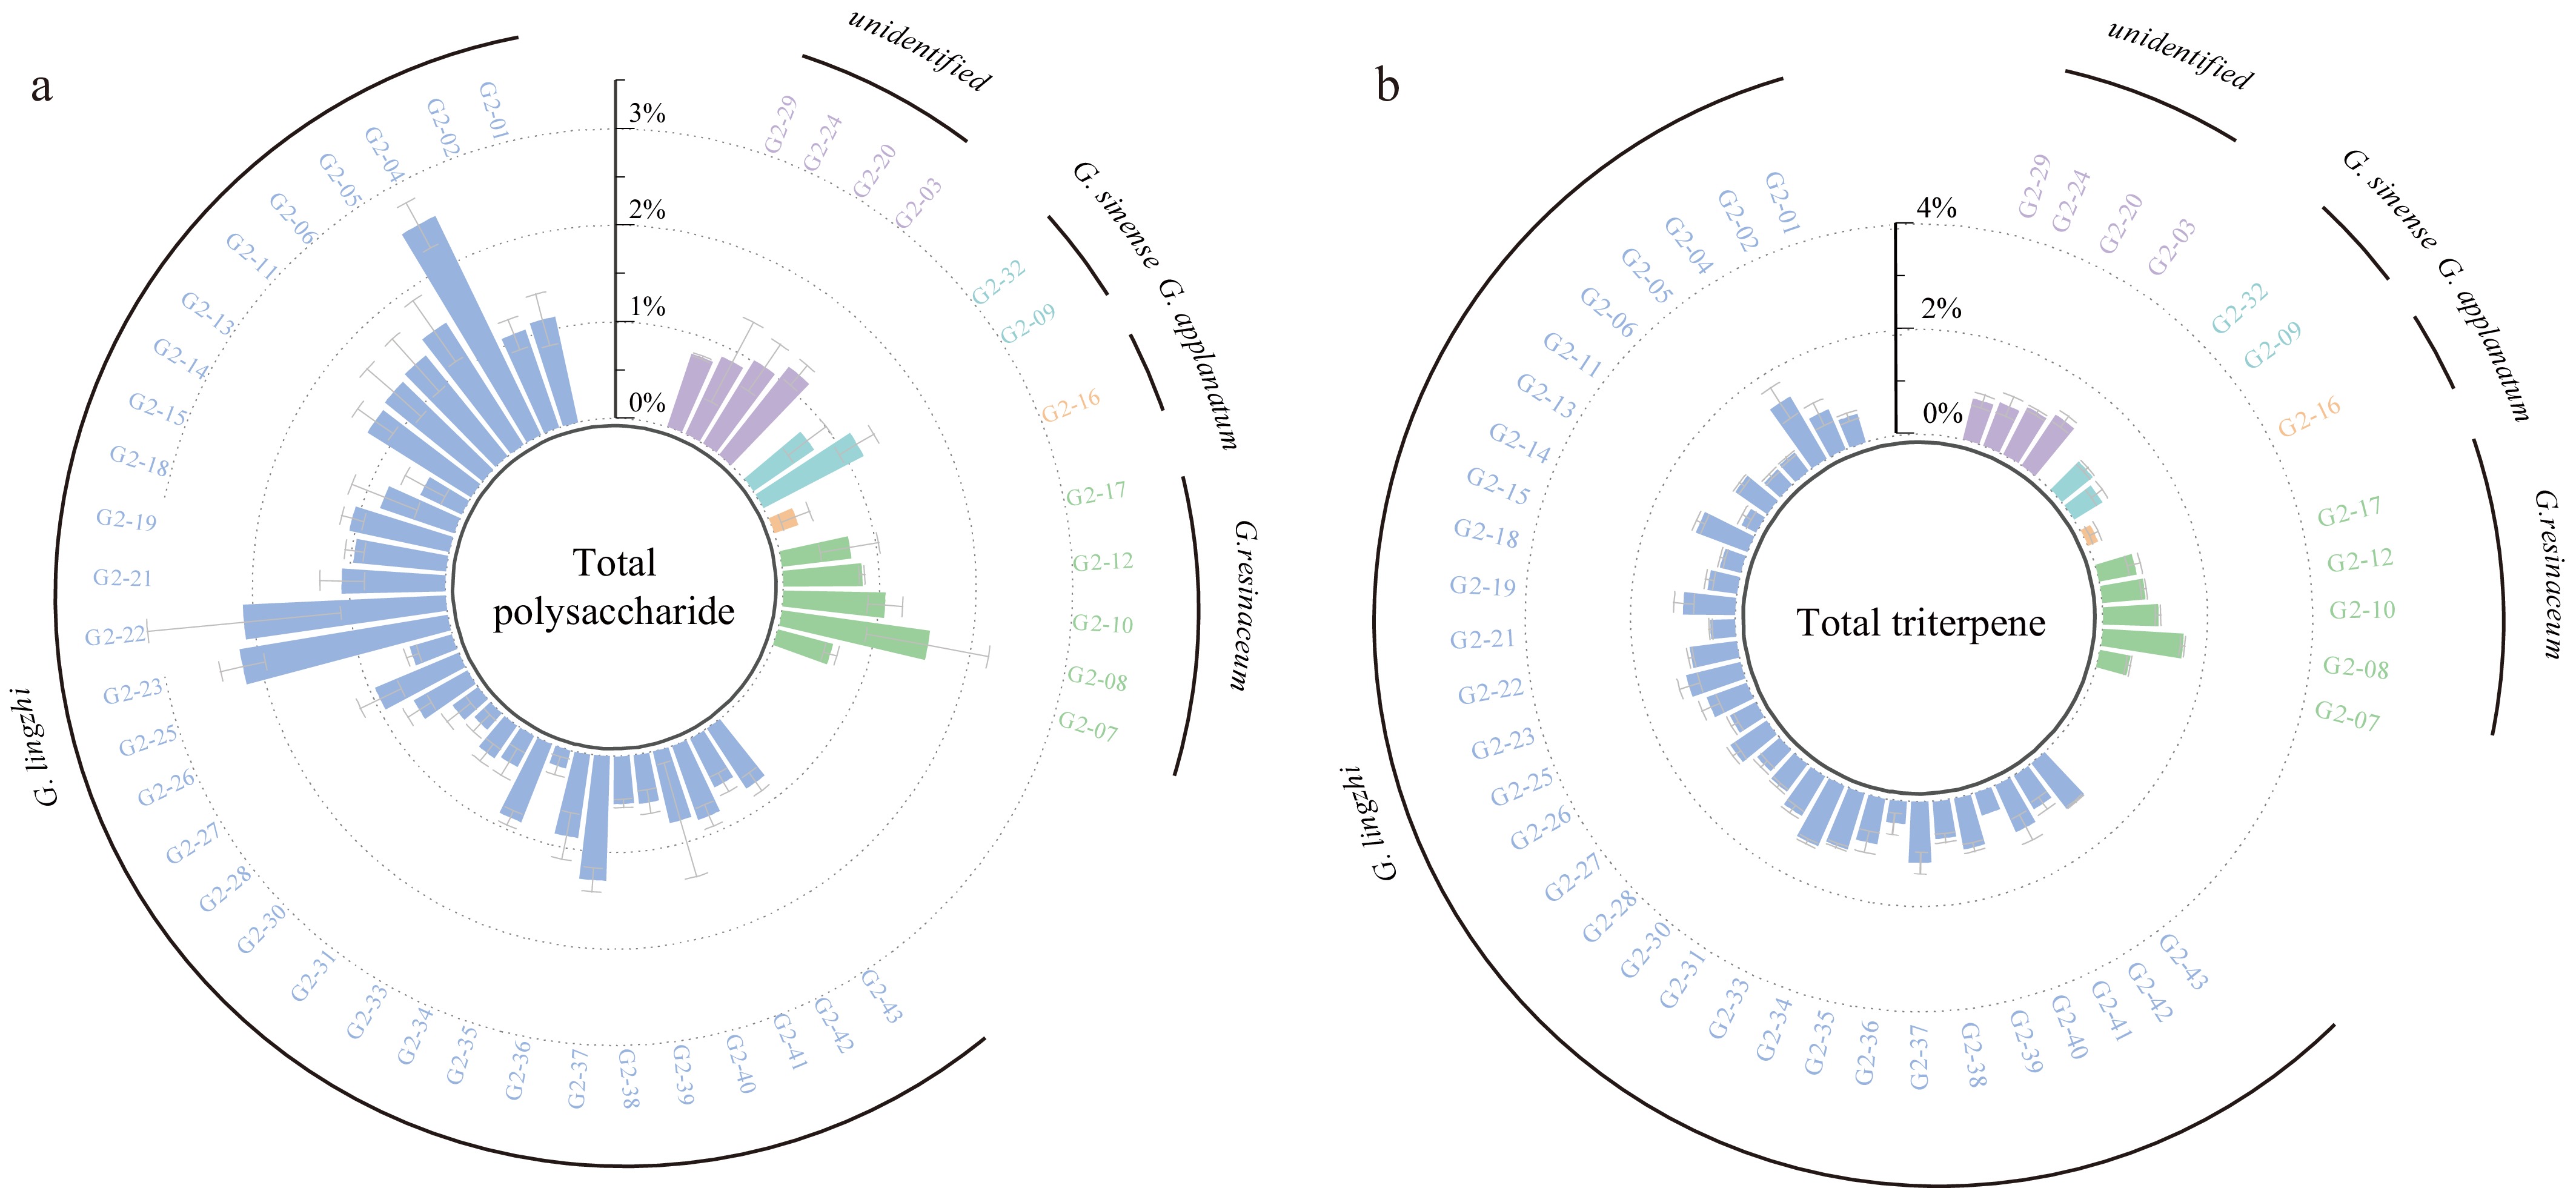
Figure 3.
Histogram of (a) total polysaccharide and, (b) total triterpene content of Ganoderma fruiting bodies.
Similarly, among the 43 commercial Ganoderma fruiting bodies, eight failed to meet the total triterpene content requirements specified by the Chinese Pharmacopoeia (2020 edition), with a non-compliance rate of 18.60%. In addition, combined with the results of molecular identification, the total triterpene contents of G. lingzhi, G. sinense, G. resinaceum, and G. applanatum ranged from 0.31%−1.37%, 0.65%−0.71%, 0.54%−0.76%, and 0.21%, respectively. Furthermore, the samples G2-4, G2-33, and G2-34, identified as G. lingzhi by DNA barcoding, exhibited the highest total triterpene content of Ganoderma fruiting bodies, with 1.37%, 1.25%, and 1.11%, respectively. In summary, only 15 out of the 43 Ganoderma fruiting bodies met the evaluation criteria for total polysaccharide and total triterpene outlined in the Chinese Pharmacopoeia. These findings underscore concerns regarding the quality of commercial Ganoderma fruiting bodies or determination methods.
Quantification of representative ganoderic acid in Ganoderma fruiting bodies based on LC-MS/MS
-
To ensure accurate and unambiguous identification of the analyzed compounds, the developed LC-MS/MS method was applied to determine the content of 15 targeted ganoderic acids in the collected Ganoderma samples. These 15 targeted ganoderic acids were identified by comparing the retention times, and accurate masses with authentic standards (Table 2). Tentative identification of other peaks was conducted by comparing their exact mass data with literature-reported data (Supplementary Table S3). The total ion current chromatogram of representative samples is shown in Fig. 4a and the quantitative analysis results are summarized in Supplementary Table S4.
Table 2. Mass spectral information on representative ganoderic acid compounds.
Peak Compound Molecular formula Molecular weight (g/mol) Time (min) Oberserved mass (m/z) Adduction Fragment ion 1 Ganoderenic acid C C30H44O7 516.3087 12.123 515.2 [M-H]− 441.1907; 249.1095; 73.0196 2 Ganoderic acid C2 C30H46O7 518.3244 12.733 517.3 [M-H]− 499.2824; 287.1859; 302.1629 3 Ganoderic acid C6 C30H42O8 530.2880 13.378 529.2 [M-H]− 467.2006; 437.1587; 481.1406 4 Ganoderic acid G C30H44O8 532.3036 13.997 531.2 [M-H]− 265.1016; 513.1977; 301.1314 5 Ganoderenic acid B C30H42O7 514.2931 14.035 513.2 [M-H]− 495.1907; 249.1094; 451.2085 6 Ganoderic acid B C30H44O7 516.3087 14.419 515.2 [M-H]− 497.2048; 249.1093; 303.1465 7 Ganoderenic acid A C30H42O7 514.2931 14.879 513.2 [M-H]− 79.0585; 193.0563; 301.1320 8 Ganoderic acid A C30H44O7 516.3087 15.333 515.2 [M-H]− 285.1044; 497.2075; 300.1244 9 Ganoderic acid H C32H44O9 572.2985 15.428 571.1 [M-H]− 467.1480; 437.1086; 511.1257 10 Lucidenic acid A C27H38O6 458.2668 16.314 457.2 [M-H]− 149.0372; 209.0844; 457.1824 11 Ganoderenic acid D C30H40O7 512.2774 16.663 511.2 [M-H]− 493.1752; 149.0374; 285.1388 12 Ganoderic acid D C30H42O7 514.2931 17.005 513.2 [M-H]− 149.0378; 301.1316; 495.1914 13 Ganoderic acid C1 C30H42O7 514.2931 17.310 513.2 [M-H]− 149.0377; 301.2091; 495.3171 14 Ganoderic acid F C32H42O9 570.2829 18.172 569.2 [M-H]− 465.1849; 435.1430; 509.1673 15 Ganoderic acid J C30H42O7 514.2931 18.48 513.3 [M-H]− 421.2132; 301.1556; 451.2606 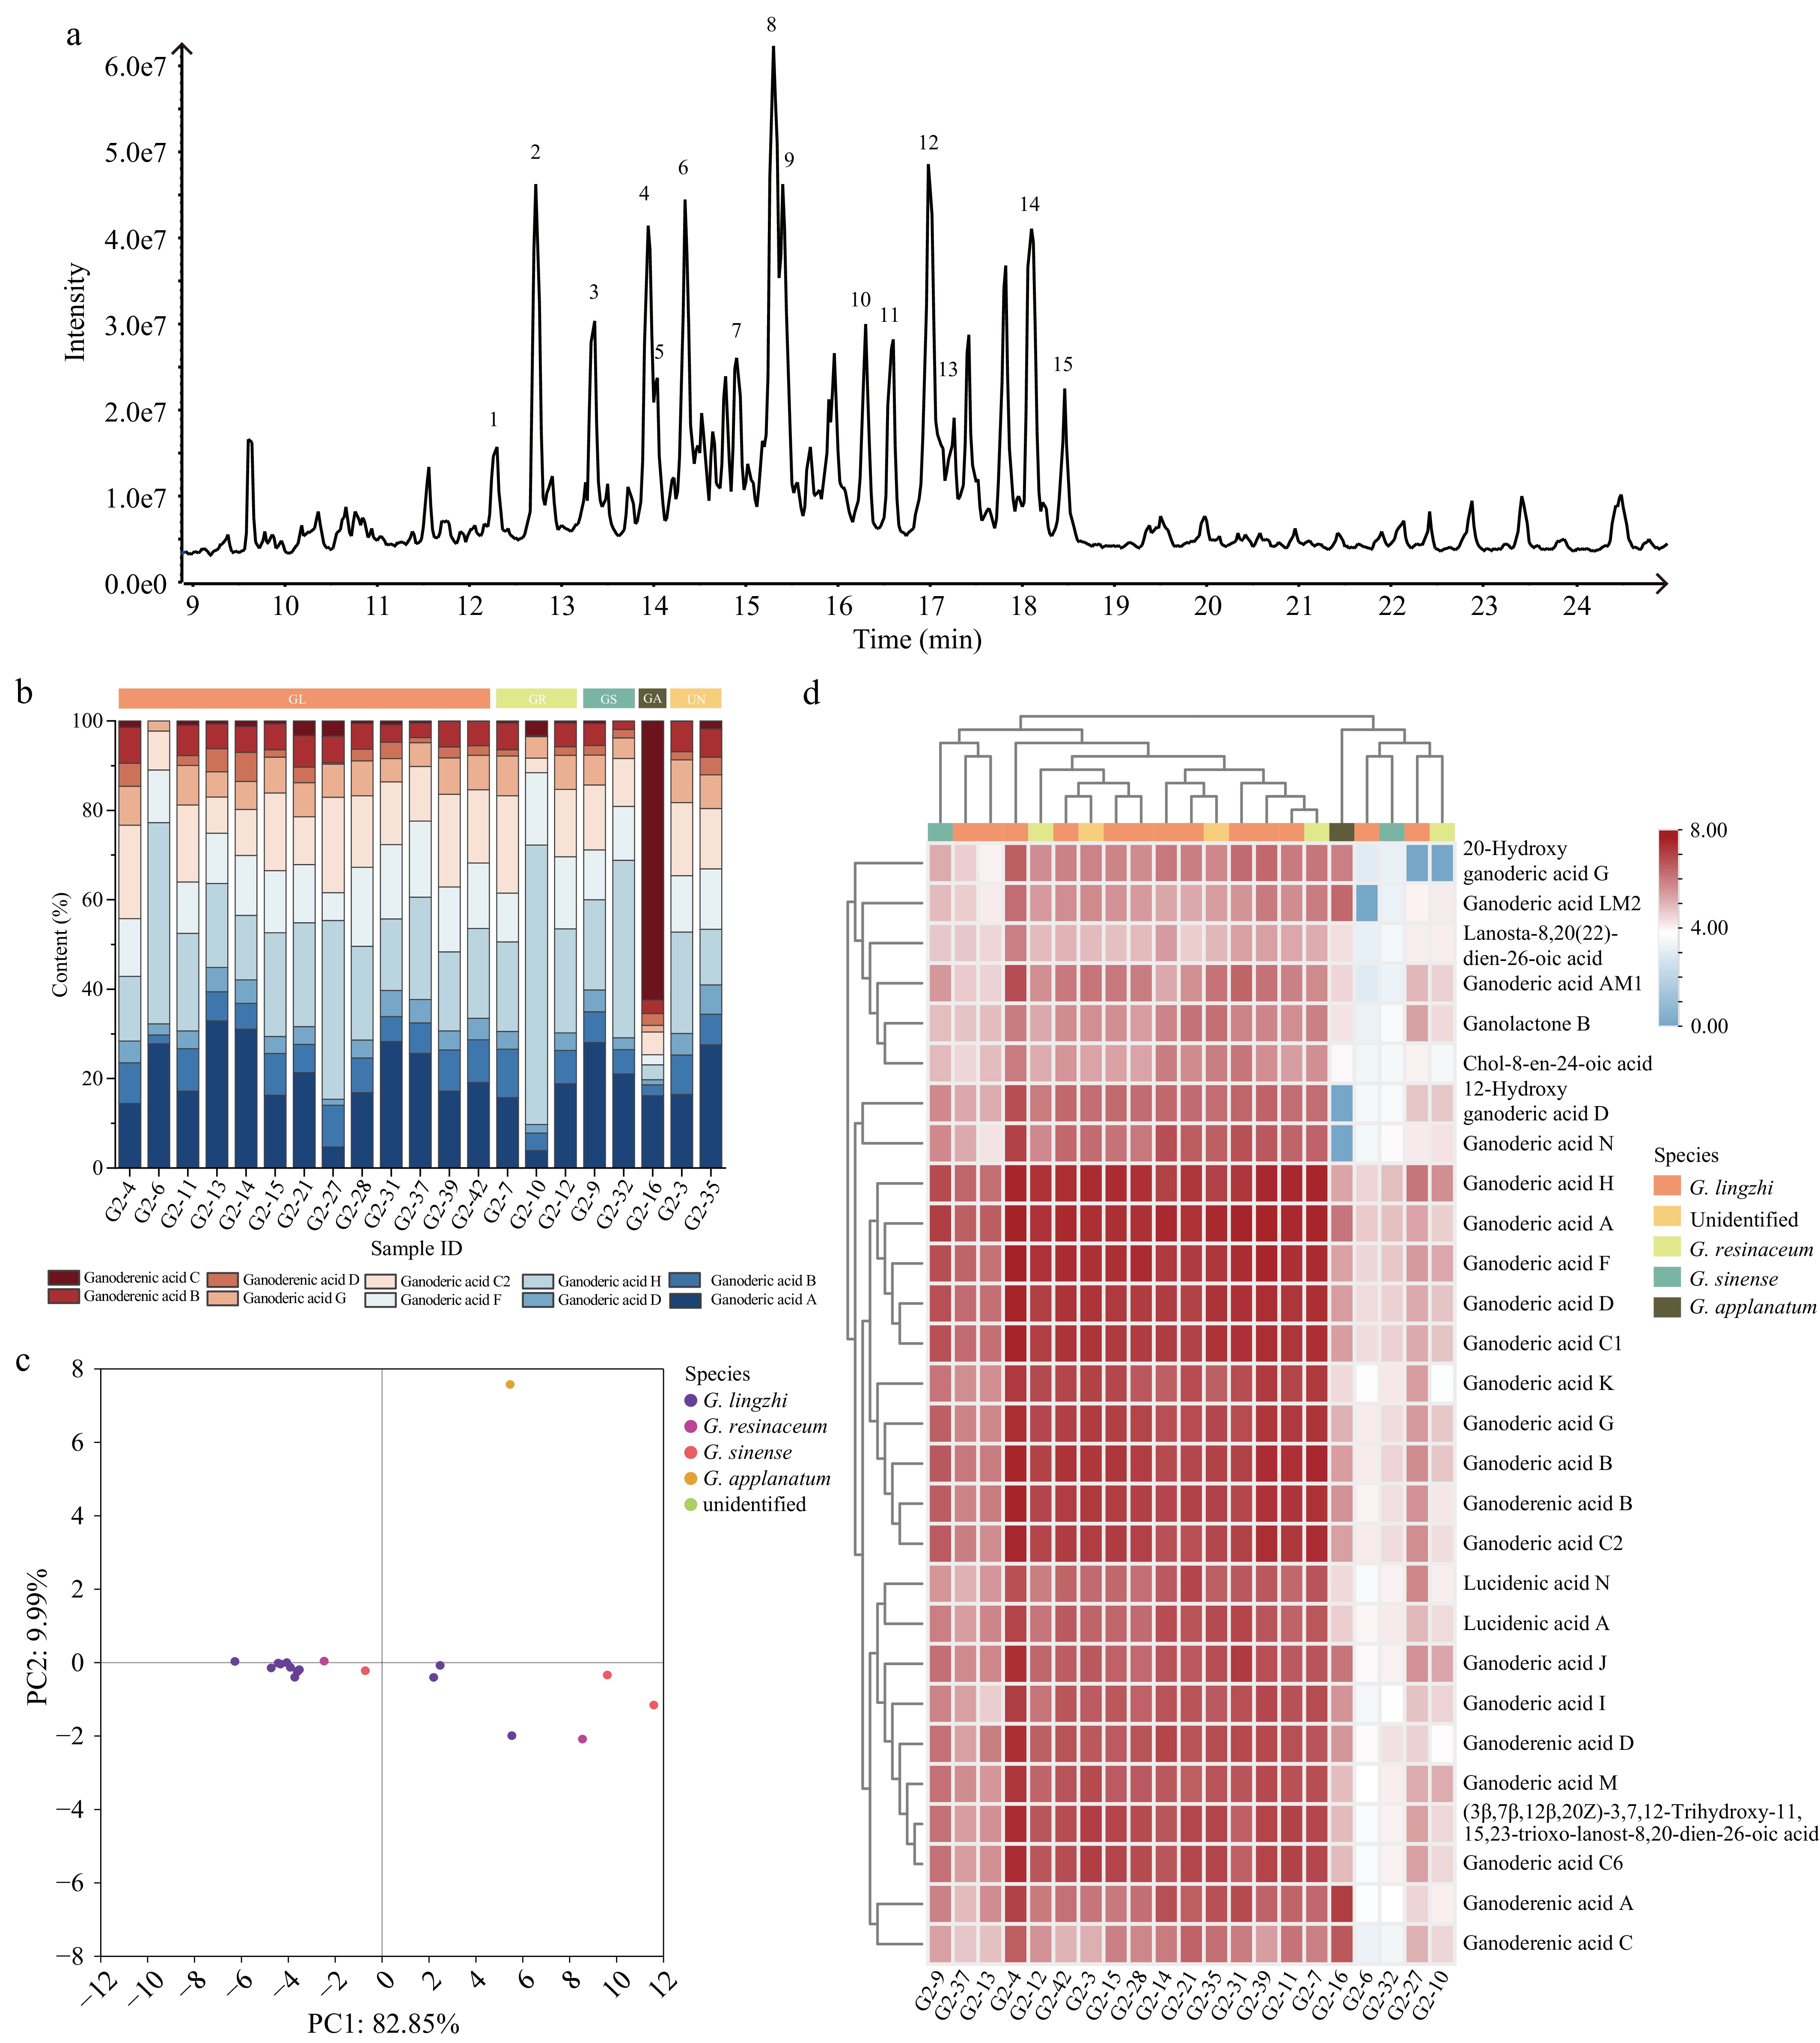
Figure 4.
Chemical profiling analysis of Ganoderma fruiting bodies. (a) ESI-MS total ion chromatogram profiles of the Ganoderma fruiting bodies. Peaks 1-15 correspond to the following compounds: Ganoderenic acid C; Ganoderic acid C2, C6, and G; Ganoderenic acid B; Ganoderic acid B; Ganoderenic acid A; Ganoderic acid A and H; Lucidenic acid A; Ganoderenic acid D; Ganoderic acid D, C1, F, and J. (b) Stacking diagram of ten ganoderic acid contents in Ganoderma fruiting bodies. (c) HCA of Ganoderma fruiting bodies samples. (d) PCA of Ganoderma fruiting bodies samples.
Obvious differences in the total contents, as well as each ganoderic acid, were observed at the different commercial Ganoderma fruiting bodies. The total contents of targeted ganoderic acids in Ganoderma fruiting bodies ranged from 0.00% to 0.98%. Among them, the total content of ten representative ganoderic acids in G2-4, G2-7, and G2-39 was higher than 0.64%. In contrast, ganoderic acids were scarcely detectable in G2-6, G2-10, and G2-32.
The content evaluation of targeted ganoderic acids for fruiting bodies based on the standard sets has been recorded by the United States Pharmacopoeia (USP43-NF38), and the content of ten triterpenoids in G. lingzhi (ganoderic acid A, B, D, H, F, C2, G; and Ganoderenic acid B, C, D) must not be less than 0.3% of the dry weight of the products. Our UHPLC-MS/MS results showed that only ten samples met USP standards (Fig. 4b, Supplementary Table S4): G2-4, G2-11, G2-14, G2-15, G2-39, G2-42, G2-7, G2-31, G2-3, and G2-28. Among these, seven were identified as G. lingzhi by DNA barcoding, while G2-7 and G2-31 were identified as G. resinaceum, and G2-3 failed to get the barcoding sequence. The ganoderic acid content of different Ganoderma fruiting bodies varies significantly, leading to confusion in the markets. Therefore, enhancing the identification and quantification of active components is crucial for the quality control and regulation of commercial Ganoderma.
Although LC-MS/MS can be used to quantify targeted ganoderic acids as a quality marker, it cannot be used to identify the species of Ganoderma fruiting bodies. Principal Component Analysis (PCA) is used to identify components that exhibit significant differences across samples with complex components. According to the PCA model, samples that meet USP standards for ganoderic acid content were clustered together (Fig. 4c). Hierarchical clustering (HCA) was performed by using the content of 15 targeted ganoderic acids (Fig. 4d, Supplementary Table S5). At a general level, fruiting bodies identified as G. lingzhi exhibited relatively higher target ganoderic acid content compared to adulterants. However, the cluster of targeted ganoderic acids could not accurately separate the species of G. lingzhi and its adulterants. To enhance the accuracy of detecting adulteration and assessing the quality of commercial Ganoderma fruiting bodies, integrating DNA barcoding techniques that utilize the ITS2 sequence is essential.
Total polysaccharide and triterpene of Ganoderma spores
-
This study revealed the significant variation in total polysaccharide and triterpene contents across various commercial Ganoderma spores of different brands and origins using the methods recorded in the Chinese Pharmacopoeia (2020 edition) (Fig. 5, Supplementary Table S6). The total polysaccharide contents of G. lingzhi and G. resinaceum ranged from 0.35%−3.31% and 0.17%−1.57%, respectively. Among them, G1-4, G1-16, and G1-24, identified as G. lingzhi, exhibited the highest total polysaccharide contents of 3.31%, 2.38%, and 2.19%. Conversely, G1-37 and G1-36 identified as adulterants, displayed the lowest total polysaccharide content of 0.17% and 0.23%, respectively.
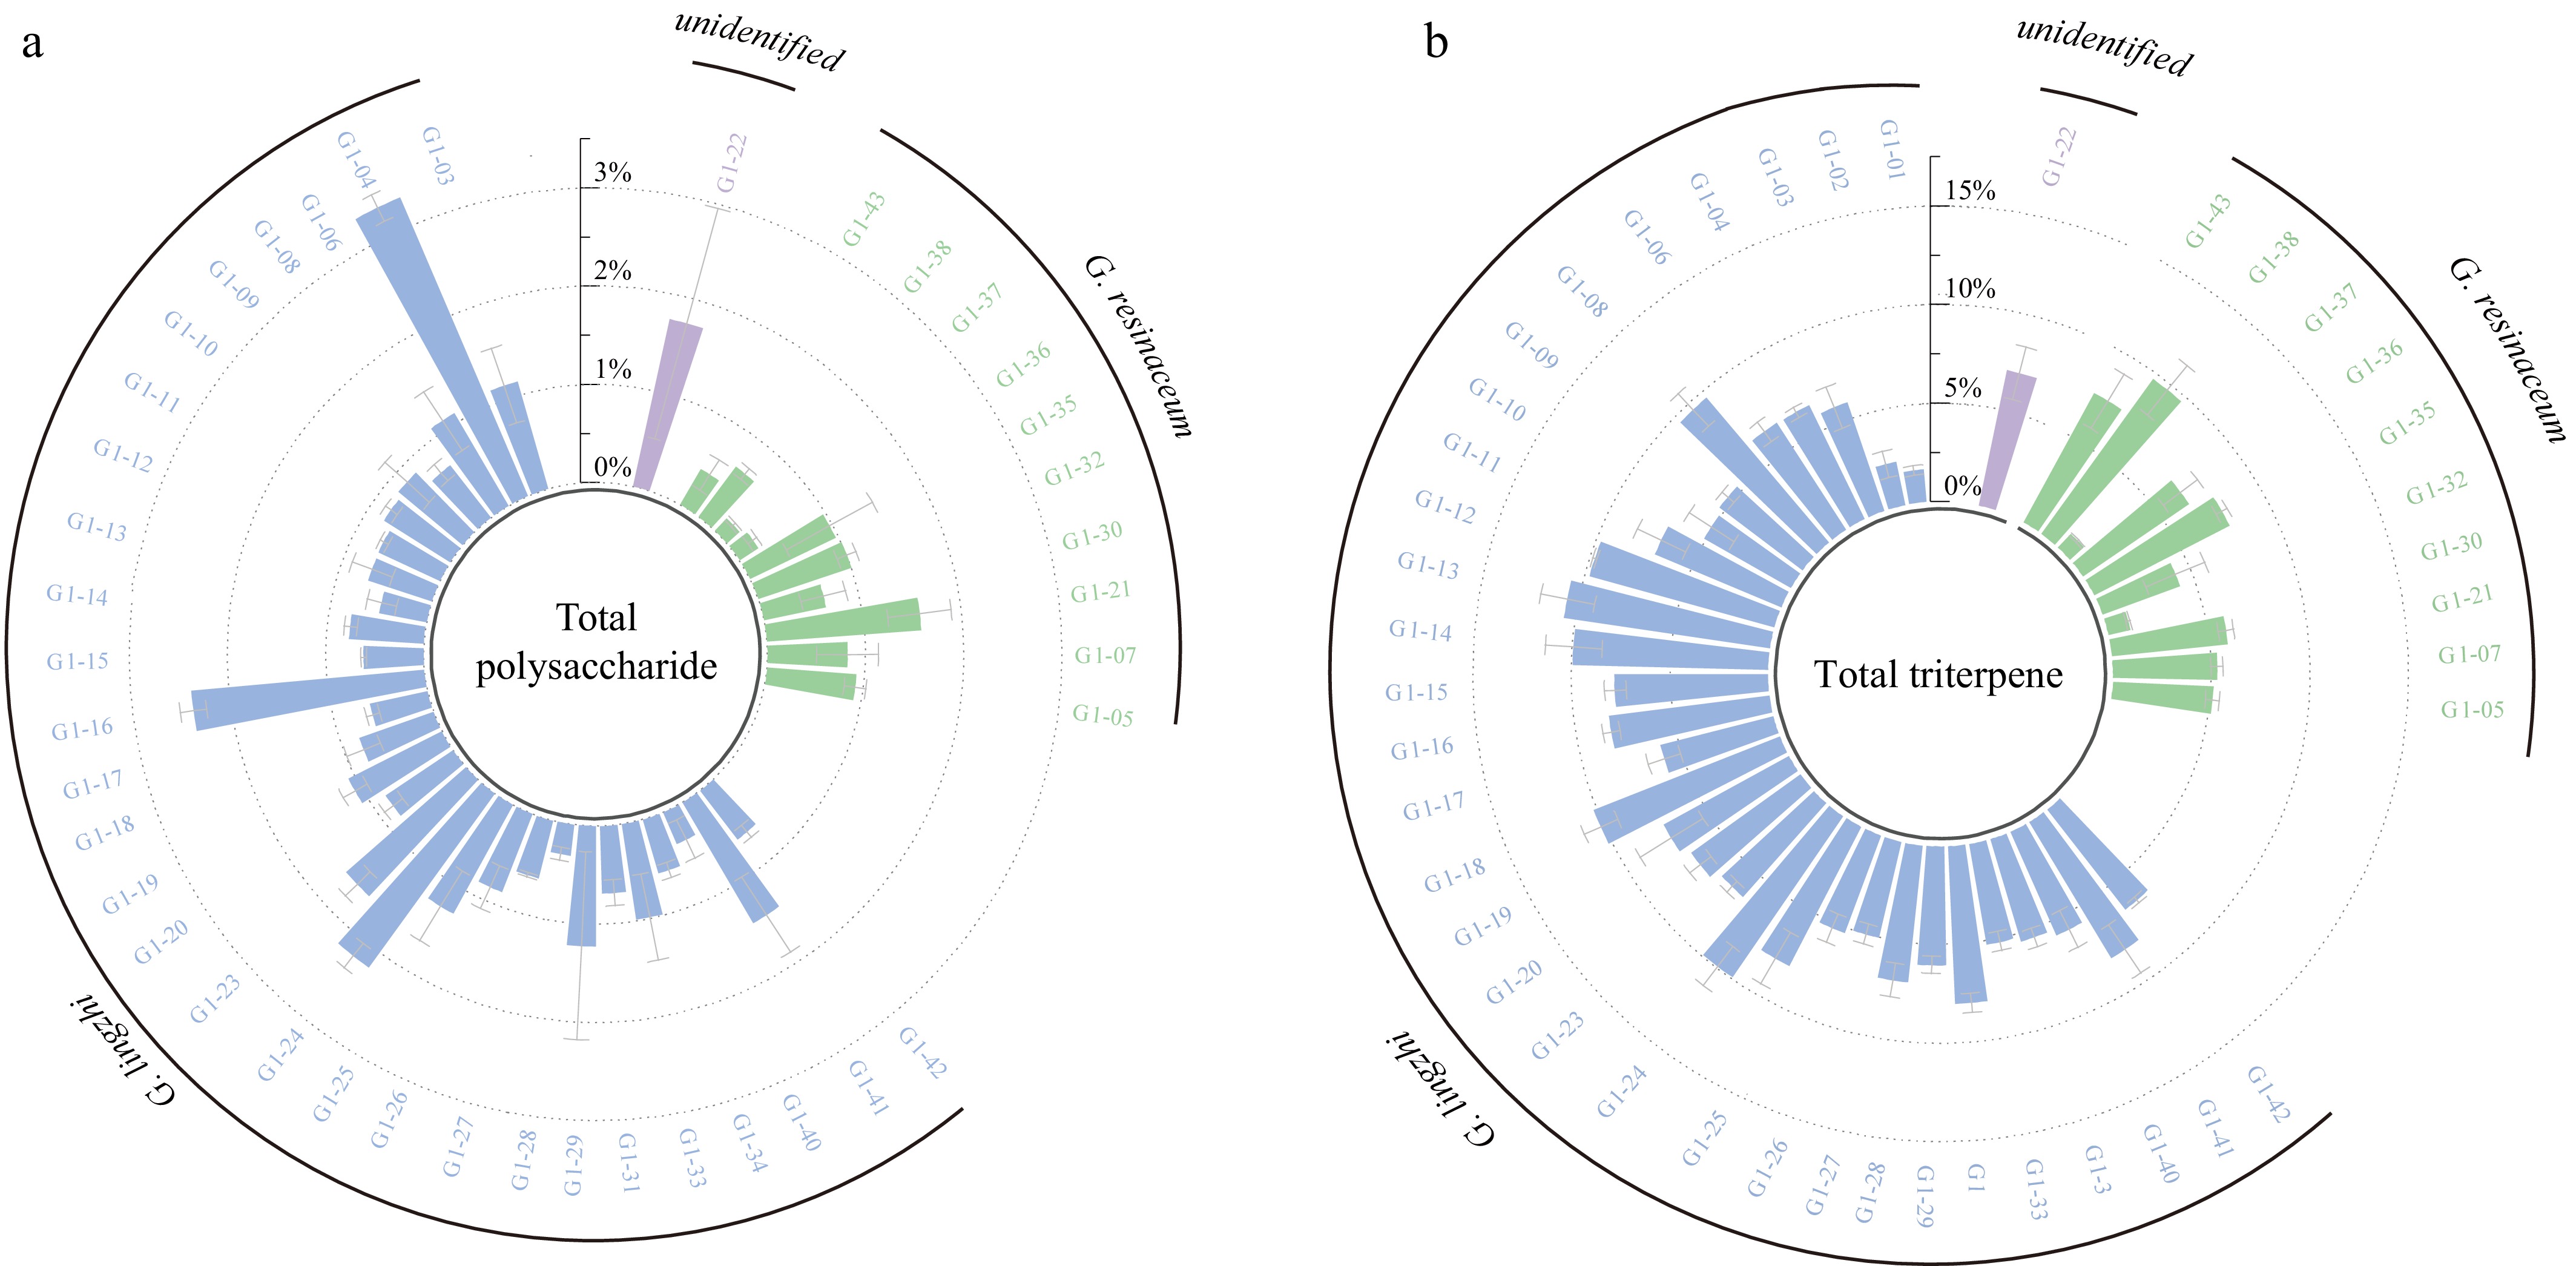
Figure 5.
Histogram of (a) total polysaccharide, and (b) total triterpene content of Ganoderma spores.
Similarly, the total triterpene contents of G. lingzhi and G. resinaceum ranged from 1.66% to 10.56% and 0.94%−9.68%, respectively. G1-13, G1-18, and G1-24 showed the highest total triterpene content of 10.56%, 10.16%, and 9.92%. All these spore samples with significant triterpene content were identified as G. lucidum by DNA barcoding. While G1-37 and G1-30, identified as G. resinaceum, exhibited the lowest total triterpene content of 0.94% and 1.13%, respectively. However, the fatty acids in the spores reacted with perchloric acid, leading to colorimetric detection of higher total triterpene contents than the actual values. Consequently, the colorimetric assay for the total triterpenoids was unsuitable as a quality control method for Ganoderma spores.
Quantification of representative ganoderic acids in Ganoderma spores based on LC-MS/MS
-
Here, the ganoderic acid contents were determined for 36 commercial Ganoderma spore samples using LC-MS/MS (Fig. 6a). The total contents of targeted ganoderic acids ranged from 0.00% to 0.15% across the 36 Ganoderma spore samples, showcasing a more than tenfold variation among Ganoderma spores (Fig. 6b). Compared to Ganoderma fruiting bodies, ganoderic acid A emerged as the most abundant compound in spores, followed by ganoderic acid H and ganoderic acid C2 (Supplementary Table S7). Notably, the total content of ten representative ganoderic acids in G1-16, G1-24, and G1-41 was 0.15%, 0.04%, and 0.05%, which were identified as G. lingzhi using DNA barcoding. In contrast, ganoderic acids were scarcely detectable in G1-5, G1-7, G1-37, and G1-43, which were identified as G. resinaceum using DNA barcoding. Compared to the colorimetric method for detecting triterpenoids in Ganoderma spores, LC-MS proved advantageous as it simultaneously tested multiple compounds and avoided interference from fatty acids in Ganoderma spores.
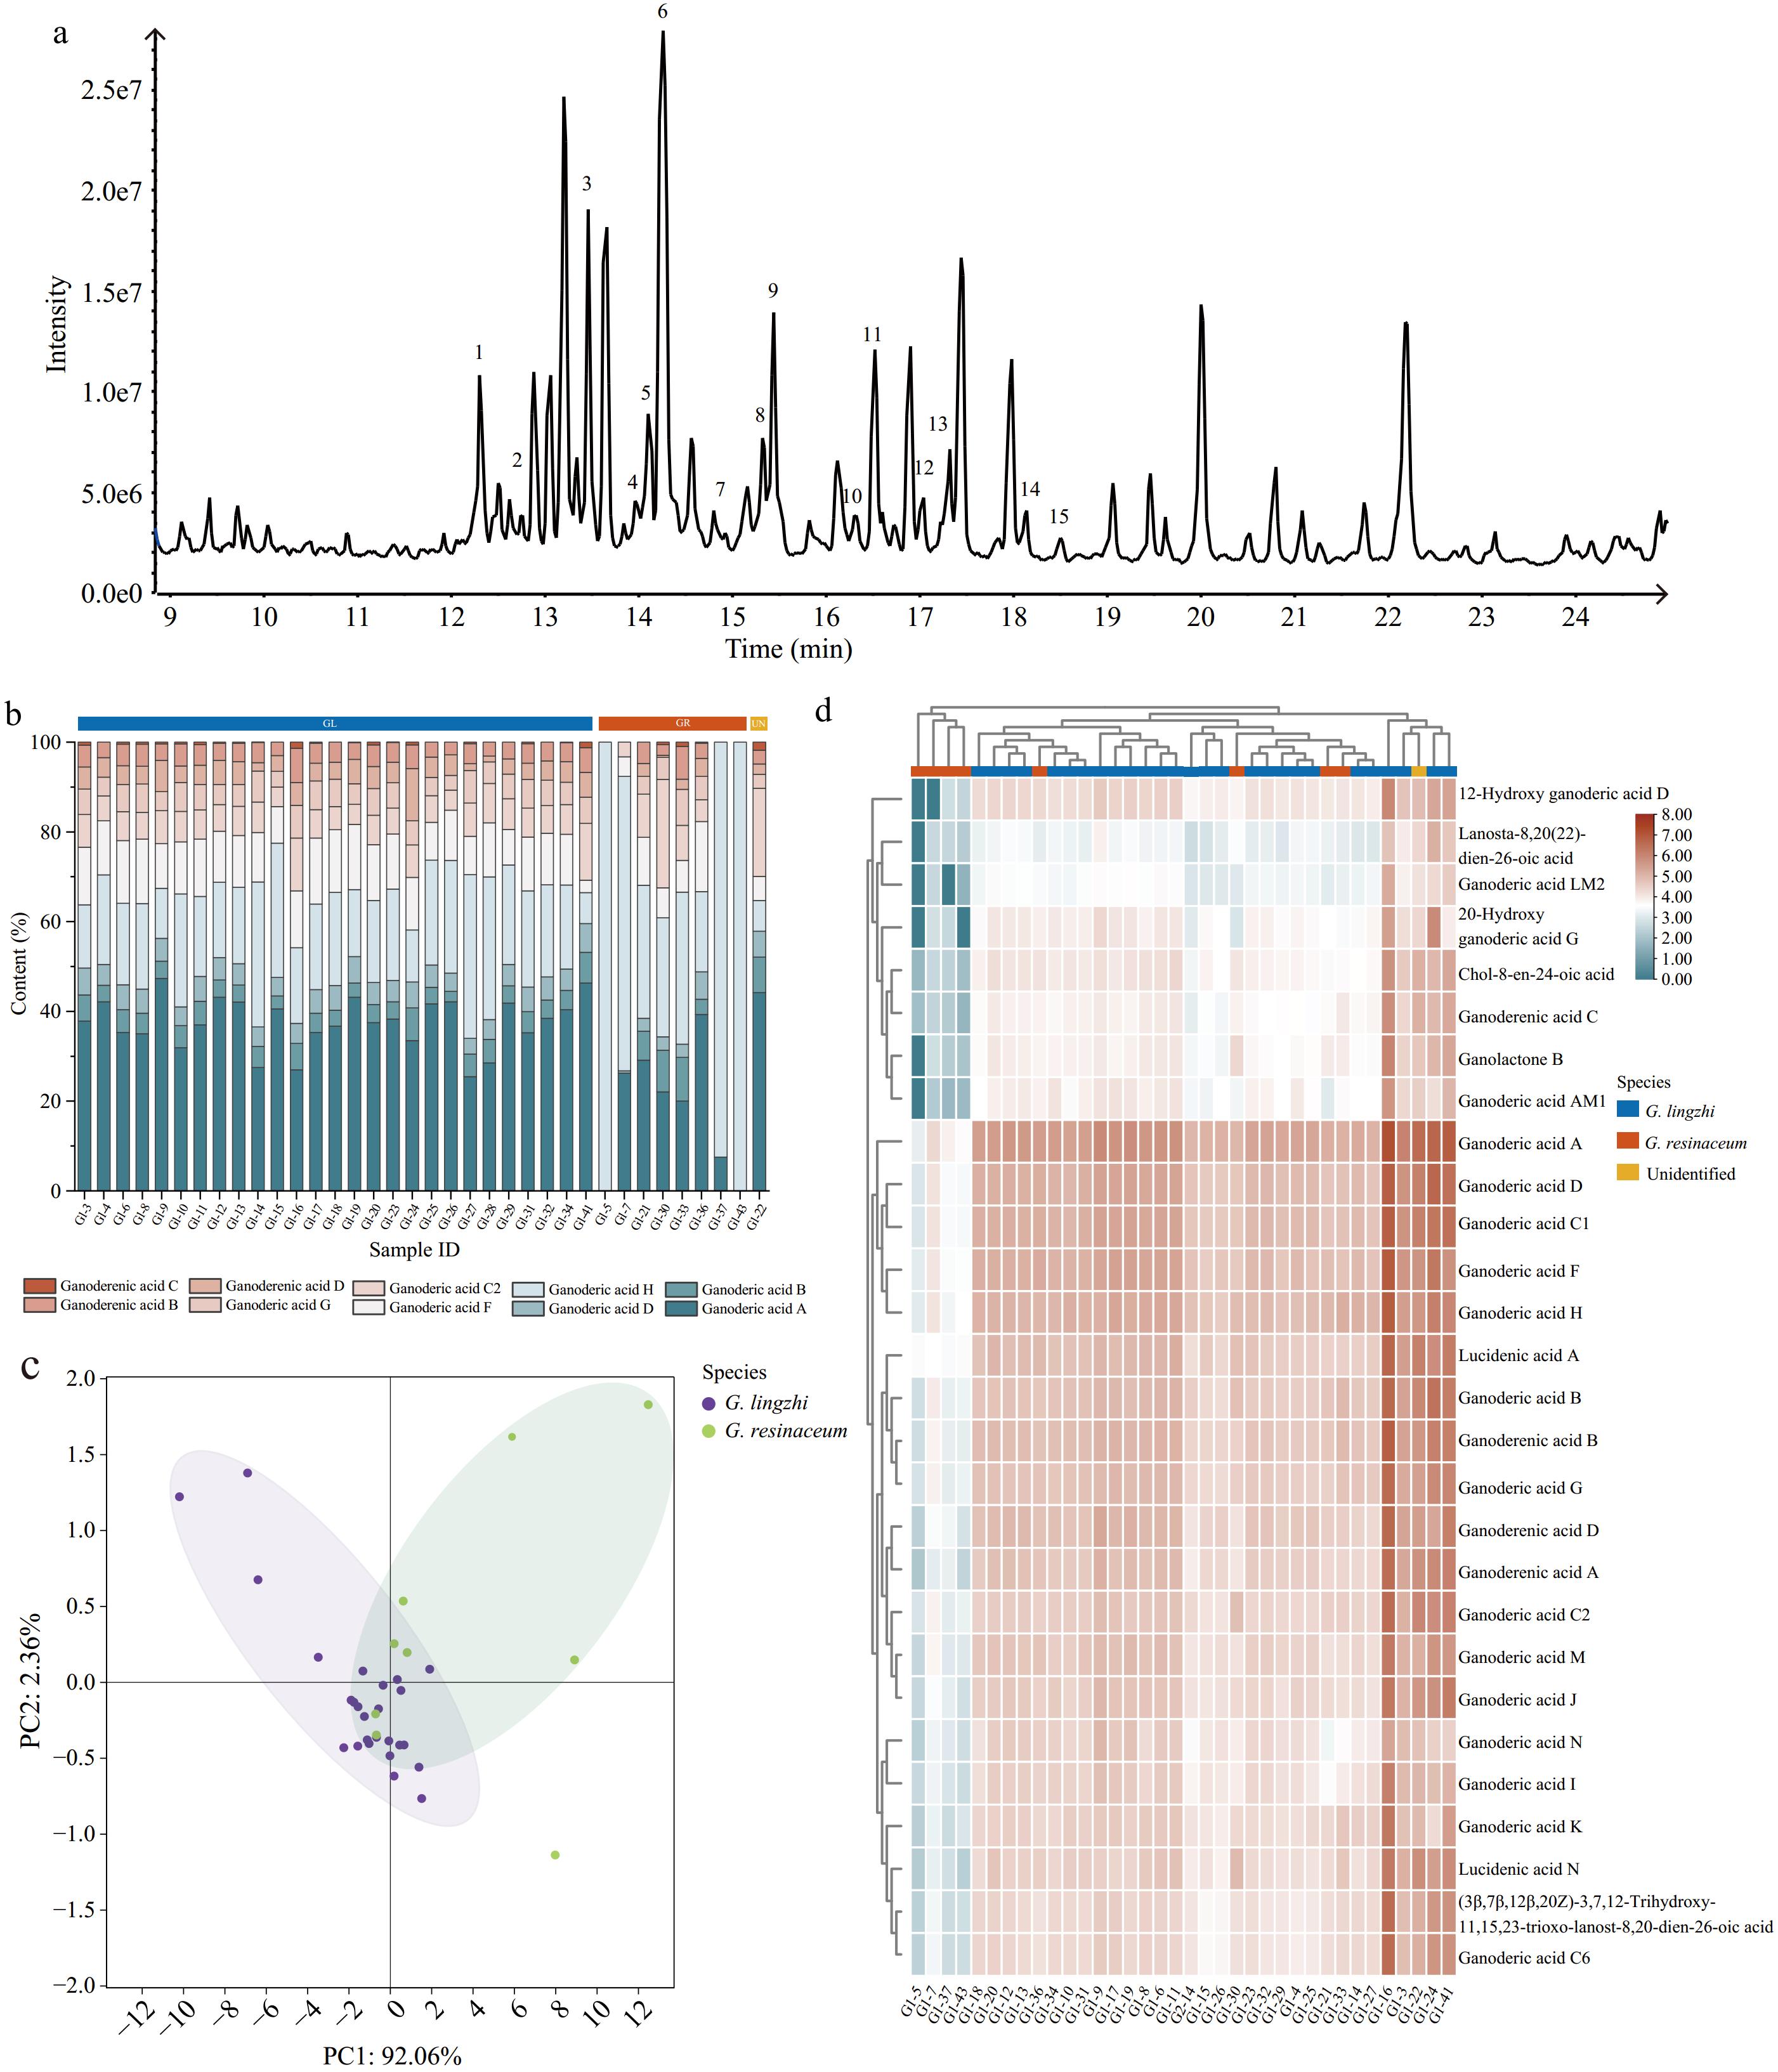
Figure 6.
Chemical profiling analysis of Ganoderma spore samples. (a) ESI-MS total ion chromatogram profiles of the Ganoderma spores. Peaks 1−15 correspond to the following compounds: Ganoderenic acid C; Ganoderic acid C2, C6, and G; Ganoderenic acid B; Ganoderic acid B; Ganoderenic acid A; Ganoderic acid A and H; Lucidenic acid A; Ganoderenic acid D; Ganoderic acid D, C1, F, and J. (b) Stacking diagram of ten ganoderic acid contents in Ganoderma spores. (c) HCA of Ganoderma spore samples. (d) PCA of Ganoderma spore samples.
In the PCA model (Fig. 6c), all samples belonging to G. lingzhi form a cohesive cluster positioned in the upper portion of the PCA plot, indicating a high degree of similarity within this group. Furthermore, the noticeable separation between G. resinaceum groups and G. lingzhi suggests their significant variations in chemical composition. To further explore the differences in metabolites across samples, hierarchical Cluster Analysis was employed. Hierarchical clustering was performed by using the relative content of 28 different metabolites (Fig. 6d, Supplementary Table S8). The results of PCA and HCA analysis also showed that distinguishing Ganoderma spores from their adulterants based on ganoderic acid content is challenging.
-
Ganoderma, renowned for its dual roles in both medicine and food, holds substantial economic significance. However, the huge demand in the Ganoderma market has resulted in issues of adulteration[27]. Moreover, the absence of systematic and comprehensive quality control measures hinders the sustainable development of the Ganoderma industry[24]. In the studies on species identification of Ganoderma, the types of samples involved are not comprehensive enough and the identification methods are not systematic enough[32,33,48]. Here, the ITS, ITS2, RPB2, and β-tubulin sequences were evaluated to determine the most suitable for Ganoderma identification. Additionally, a systematic and comprehensive quality control method was established by integrating total polysaccharides, total triterpenes, and specific ganoderic acids. This study will contribute to the sustainable development of the Ganoderma industry.
Using both ITS and tef1-alpha sequences for identification, Loyd et al.[49] found widespread label confusion in both 'Grow your own' kits (15/17) and manufactured herbal supplements (13/14) that were marketed as 'G. lingzhi'[31]. Wu et al. considered that 26% of their 19 samples were following their labels[30]. In this study, the suitability of the ITS, ITS2, RPB2, and β-tubulin sequences for Ganoderma identification was evaluated. The ITS2 sequence demonstrated precise identification of Ganoderma lingzhi and its adulterants, attributed to its concise sequence, high amplification efficiency, and abundant variant sites, which was consistent with previous research[33]. It is noteworthy that among the 84 Ganoderma samples, 16 were found to be adulterated (19.05%). Particularly concerning was the adulteration of Ganoderma spores, with ten out of 41 samples found to be adulterated, yielding a rate of 24.39%. Once in powdered form, Ganoderma loses its morphological and chemical characteristics, which exacerbates the potential for classification confusion[32]. This study underscores the issues regarding the quality of modern commercial Ganoderma[30,31,33,34]. DNA barcoding technology shows promise for effectively monitoring the Ganoderma market on a large scale.
Triterpenes and polysaccharides are the most important pharmacologically active compounds in Ganoderma. The content of these biologically active metabolites has been appraised as markers for assessing the quality of Ganoderma. The colorimetric method is one of the commonly used methods for the simultaneous determination of total triterpene and polysaccharide components in Ganoderma[39]. Since UV detection lacks specificity, it cannot accurately quantify the specific metabolite in the fruiting bodies or spores[50]. HPLC-UV methods may suffer from the concomitant determination of coeluting ganoderic acids due to the lack of assay selectivity[39]. Therefore, we detected and compared the total polysaccharide and triterpene content in commercial Ganoderma fruiting bodies and spores using a colorimetric assay and HPLC-MS/MS, respectively. Based on the MS/MS fragmentation patterns and product data from standards and literature, 28 ganoderic acids were identified and 15 of these were quantified. The results indicated that 34.88% of Ganoderma fruiting bodies met the evaluation criteria for total polysaccharide and total triterpene contents outlined in the Chinese Pharmacopoeia. Additionally, among the 21 Ganoderma fruiting bodies quantified by HPLC-MS/MS, 76.19% conformed to the Chinese Pharmacopoeia standard for triterpene content, while 47.62% conformed to the U.S. Pharmacopoeia standard for ganoderic acid content. In our study, 93.75% of the Ganoderma adulterants were identified as G. resinaceum. However, differentiating between G. resinaceum and G. lingzhi based on PCA analysis proved challenging, suggesting that the differences in their chemical composition may not be significant. Previous studies have shown that G. resinaceum contains a variety of terpenoids and its extracts possess antitumor and antioxidant capacities[51,52]. Therefore, the rationalization and standardization of the use of G. resinaceum in the herbal market merit further investigation.
However, studies on triterpenoids in the Ganoderma spore have yielded contradictory results. Several studies indicated that the content of triterpenoids in spores was higher than in fruiting bodies while other research demonstrated the opposite[53,54]. In our study, the method based on the Chinese Pharmacopoeia showed that the total triterpene content in spore samples (0.94%−10.56%) was significantly higher than that in fruiting body samples (0.21%−1.37%). In contrast, the method based on HPLC-MS/MS revealed that the content of 15 ganoderic acids was significantly higher in fruiting body samples than in spore samples. The fatty acid content in spores was much higher than that in fruiting bodies[55]. The fatty acids in the spores could react with perchloric acid, which may lead to an overestimation of the colorimetric results. Therefore, it could be considered that spore samples originally contained little triterpenes, suggesting that triterpenoids may not be suitable as quality control markers for spores. Compared to the colorimetric method, HPLC-MS/MS can simultaneously analyze multiple samples and avoid the interference of fatty acids in Ganoderma spores on the colorimetric method. The results indicated notable differences in metabolite content among various Ganoderma spores, highlighting the urgent need to establish quality evaluation standards for commercial Ganoderma spores.
Adulterated or substandard Ganoderma may pose a health risk to consumers. The evaluation system that integrates molecular identification and mass spectrometry quantification could serve as the standard for assessing the quality of Ganoderma lucidum. This system can be aligned with product certification standards to support industry self-regulation. Additionally, an online platform or database can be created to allow consumers to access information about Ganoderma lucidum product standards, certifications for production companies, and related research findings. This approach enhances product transparency and provides consumers with reliable information to make informed choices. To summarize, improving the quality of commercial Ganoderma and ensuring consumer rights require multifaceted efforts, including the integration of technological advancements, legal regulations, public education, and industry self-regulation. Through collaboration and innovation, it is possible to effectively identify and reduce the incidence of Ganoderma adulteration, thereby providing consumers with safe and reliable medicinal materials.
-
In this work, 84 batches of Ganoderma fruiting bodies and spores, gathered from the market, were identified and quantified. The evaluation system can first identify the authenticity of medicinal materials, and then systematically evaluate the quality of materials from different Ganoderma samples. Quality control of raw materials can be achieved using DNA barcoding and LC-MS/MS for traditional Chinese medicine decoctions and pharmaceutical manufacturers. This integrated molecular, chemical, and biological approach allows for accurate identification of Ganoderma and its adulterants and may serve as a model for the identification and quality control of other herbal materials. In future research, this evaluation system based on DNA barcoding for identification and LC-MS/MS for quantification was suggested to be widely applied across the medicinal industry.
This work was supported by the National Key Research and Development Program of China (2023YFC3504104); the National Natural Science Foundation of China (82360754); and Zhejiang Science and Technology Major Program on Agricultural New Variety Breeding (Grant No. 2021C02073).
-
The authors confirm contribution to the paper as follows: conceptualization, visualization, writing - review & editing: Liu L, Xu Z, Tian L, Sun W, Li Z; writing - manuscript preparation: Liu L; resources: Xu J, Xiong H, Zhou S; investigation and formal analysis: Ma S, Wei L; supervision, funding acquisition, project administration: Xu Z, Tian L. All authors reviewed the results and approved the final version of the manuscript.
-
All data generated or analyzed during this study are included in this published article and its supplementary information files.
-
The authors declare that they have no conflict of interest. Zhichao Xu and Wei Sun are the Editorial Board members of Medicinal Plant Biology who were blinded from reviewing or making decisions on the manuscript. The article was subject to the journal's standard procedures, with peer-review handled independently of these Editorial Board members and their research groups.
- Supplementary Table S1 The intra-GD and inter-GD of the RPB2, ITS2 , ITS and β-tubulin sequences of the Ganoderma species based on the K2P model.
- Supplementary Table S2 Total polysaccharide and total triterpene contents (%) in commercial Ganoderma fruiting bodies.
- Supplementary Table S3 Mass spectral information on representative ganoderic acid compounds.
- Supplementary Table S4 Contents of 15 representative ganoderic acids in 21 commercial Ganoderma fruiting bodies.
- Supplementary Table S5 Relative quantification of 28 ganoderic acids in commercial Ganoderma fruiting bodies.
- Supplementary Table S6 Total polysaccharide and total triterpene contents (%) in commercial Ganoderma spore powder.
- Supplementary Table S7 Contents of 15 representative ganoderic acids in 37 commercial Ganoderma spore powder.
- Supplementary Table S8 Relative quantification of 28 ganoderic acids in commercial Ganoderma spores.
- Supplementary Fig. S1 PCR amplification of ITS and ITS2 sequence from commercial Ganoderma fruiting bodies (a) and commercial Ganoderma spore (b). M: DL2000.
- Supplementary Fig. S2 Blue boxes highlight stable SNP sites in ITS (a) and ITS2 (b) sequences used for Ganoderma species identification. (c) Secondary structures of ITS2 in three Ganoderma species. Four-fingered palm-like structure was observed. The four stem-loop domains are indicated with I–IV. The bulges are shown on each of the stem-loop domains.
- Copyright: © 2025 by the author(s). Published by Maximum Academic Press, Fayetteville, GA. This article is an open access article distributed under Creative Commons Attribution License (CC BY 4.0), visit https://creativecommons.org/licenses/by/4.0/.
-
About this article
Cite this article
Liu L, Wei L, Xu J, Xiong H, Zhou S, et al. 2025. Molecular identification and quality evaluation of commercial Ganoderma. Medicinal Plant Biology 4: e004 doi: 10.48130/mpb-0025-0003 

Molecular identification and quality evaluation of commercial Ganoderma
- Received: 05 December 2024
- Revised: 13 January 2025
- Accepted: 20 January 2025
- Published online: 27 February 2025
Abstract: Ganoderma has long been renowned in oriental countries as a prominent medicinal and edible supplement, with the products holding a substantial market demand. However, there remains a lack of systematic and comprehensive studies on the quality evaluation of commercial Ganoderma. In this study, we analyzed 84 batches of Ganoderma, including the fruiting bodies and spores, sourced from various markets. DNA barcoding using the ITS2 marker was employed and demonstrated excellent discriminatory capacity, allowing for the precise identification of 16 adulterants among the 84 Ganoderma. According to the standard detection methods for total polysaccharides and triterpenes outlined in the Chinese Pharmacopoeia, remarkable variations in the tested Ganoderma samples were observed; the total polysaccharide contents ranged from 0.22% to 3.31%, while the total triterpenes levels varied from 0.21% to 10.56%. Furthermore, LC-MS/MS quantification based on targeted ganoderic acids for Ganoderma revealed triterpene contents ranging from 0.01% to 0.98%, highlighting the necessity for regulating the quality of Ganoderma in the market. A comprehensive evaluation system for commercial Ganoderma is proposed, integrating molecular identification and mass spectrometry quantification.
-
Key words:
- DNA barcoding /
- LC-MS/MS /
- Ganoderma /
- Molecular identification /
- Quality evaluation