


-
Plants with colored leaves are popular in landscaping because of their high ornamental value. Leaf color changes are complex and determined mainly by various pigments in the leaves, such as chlorophyll (Chl), carotenoids (Car), and anthocyanins[1]. Red or purple leaves are associated with high anthocyanin levels in several woody plants, including Acer rubrum[2], Populus deltoides[3], and Lagerstroemia indica[4]; and similarly golden leaves are associated with low Chl levels in plans, such as Ulmus pumila[5,6], Ginkgo biloba[1], and Lagerstroemia indica[7]. Unlike anthocyanins, Chl affects the leaf color of plants and is a key component of photosynthesis[8], so its dynamic regulation is more complicated. The Chl metabolic pathway in higher plants consists of the following three steps: Chl biosynthesis, the Chl cycle (interconversion of Chl a and Chl b), and Chl degradation[9,10]. Inhibition of Chl biosynthesis or acceleration of Chl degradation results in a leaf yellowing phenotype, known as golden leaf. For example, the inhibition of Mg-chelatase subunits I (ChlI) and D (ChlD), which are involved in Chl biosynthesis, causes leaf yellowing in rice and peas (Pisum sativum)[11,12]. The overexpression of staygreen (SGR) and pheophytin pheophorbide hydrolase (PPH), which regulate Chl degradation, causes a leaf-yellowing phenotype in rice and Arabidopsis[13,14].
In addition to the genes involved in Chl biosynthesis and degradation, the altered expression of light-harvesting Chl-binding complexes (LHC) and LHC-like genes also affect Chl levels. The conserved Chl-binding motif in the transmembrane helix is a key feature of both LHC and LHC-like proteins[15]. The Chl bound by the peripheral LHCI and LHCII of photosystems (PS) I and PSII absorbs light energy and transfers this excitation energy to the PS reaction centers. However, LHC-like proteins that bind with free Chl mainly protect PS by dissipating excess energy and participating in the non-photochemical quenching processes[15]. The LHC-like family comprises three-helix early light-induced proteins (Elips)[16], two-helix stress-enhanced proteins (Seps), light harvesting-like 3 (Lil3s, also called Sep3s)[17], and one-helix proteins (Ohps)[18]. AtElip2 overexpression causes leaf yellowing in Arabidopsis by reducing Chl content[19]. The AtSep2 protein contains 2 transmembrane structures, and its conserved Chl-binding site is located in the first transmembrane structure[20]. Our recent study showed that AtSep2 overexpression caused leaf yellowing in Arabidopsis by reducing Chl content. Moreover, transgenic Arabidopsis leaves overexpressing AtSep2 accumulated less reactive oxygen species (ROS) compared to wild-type (WT) leaves under high-light stress[20]. These results indicate that AtSep2 overexpression not only causes leaf yellowing but also reduces oxidative damage in transgenic plants. Therefore, LHC-like genes, especially AtSep2, may be used to genetically improve plants to have a golden leaf phenotype and tolerance to high light stress.
Poplars are an important tree species for urban greening, afforestation, and ecological and environmental protection because of their rapid growth, good morphology, and easy vegetative reproduction. Poplars with the golden leaf poplar (JHY), a bud mutation from Populus sp. Linn. '2025'[21], are economically more valuable because of their higher ornamental value. However, studies on the use of transgenic techniques to generate golden leaf poplar are scarce. In this study, the AtSep2 gene was overexpressed in the 84 K poplar (Populus alba × Populus glandulosa), which was then subjected to leaf color and physiological change analysis. Our results showed that AtSep2 overexpression caused leaf yellowing in 84 K poplar, namely the golden leaf phenotype, indicating that it can be used as a genetic resource for the improvement of golden leaves in ornamental plants.
-
Seedlings and plants of the 84 K (Populus alba × Populus glandulosa) poplar were grown in a greenhouse (24 ± 2 °C) under a 12 h light/12 h dark photoperiod at normal (150 μmol/m2/s) or high (500 μmol/m2/s) light intensity.
Genetic transformation in the poplar
-
The open reading frame (ORF) (without the stop codon) of AtSep2 (At2g21970) (Supplemental Fig. S1) was amplified using the primers AtSep2-F (5'-GGTACCATGGCTATGGCTACGCGAG-3') and AtSep2-R (5'-GTCGACAAGATCATCAGACCAATCACT-3') and cloned into a pCAMBIA1300-GFP (green fluorescent protein) vector using the Kpn I and Sal I sites. The reaction components per 20 μL were as follows: 7 μL H2O, 10 μL Premix Taq™ (RR003A, Takara, Japan), 1 μL 10 μM of each primer and 1 μL cDNA. The thermal cycling program was as follows: initial denaturation at 95 °C for 60 s, and 40 cycles at 95 °C for 10 s, 65 °C for 30 s, and 72 °C for 45 s. The construct was transformed into an 84 K poplar using the Agrobacterium-mediated leaf disc method, as described previously[22−24]. The concentration of Agrobacterium carrying the AtSep2 plasmid was controlled at OD600 ≈ 0.8 and co-cultured for 25 min. The leaves of 84 K poplar were incubated on 2.41 g/L woody plant media (pH 5.8) supplemented with 0.001 mg/L thidiazuron, 0.06 mg/L 6-benzylaminopurine, 0.01 mg/L indolebutyric acid (IBA), 200 mg/L cefotaxime (Cef), 3 mg/L hygromycin (Hyg), 25 g/L sucrose, and 0.8% (w/v) agar for shoot induction and selection. The regenerated shoots were individually detached from the callus and inserted into a rooting media (Murashige and Skoog [MS] medium supplemented with 0.05 mg/L IBA, 0.02 mg/L 1-naphthaleneacetic acid, 200 mg/L Cef, 3 mg/L Hyg, and 0.9% [w/v] agar). Transgenic poplar plants were identified using reverse transcription PCR. PtActin (PtActin-F: 5'-GAAGTCCTCTTCCAGCCTTCTC-3'; PtActin-R: 5'-CTTGATCTTCATGCTGCTTGGG-3') was used as the internal reference gene.
Chlorophyll (Chl) content and Chl fluorescence parameters
-
Pigments were extracted from the leaf tissues using 80% ice-cold acetone. Chl a, Chl b, and carotenoids were quantified using a UV/Vis spectrophotometer. The concentration of Chl a, Chl b, and Car were measured separately for light absorption values at 470, 645, and 663 nm, respectively. Chl fluorescence parameters, including minimum Chl fluorescence (F0), maximum Chl fluorescence (Fm), and maximum quantum yield of PSII photochemistry (Fv/Fm), were measured using kinetic chlorophyll fluorescence imaging systems (FluorCam, PSI, Czech Republic) at 76.2 μE actinic light and 906 μE saturating pulse.
Subcellular localization
-
Leaves of transgenic poplars stably expressing AtSep2-GFP were cut into small pieces and adhered to glass microscope slides. The GFP signals in the leaf epidermis of poplars were visualized using a confocal laser scanning microscope (Olympus FV3000, Tokyo, Japan). GFP and Chl autofluorescence signals were captured at 488 and 561 nm for excitation and 500‒530 and 680‒720 nm for emission, respectively.
Transmission electron microscopy
-
Leaves (0.5 cm × 0.5 cm) of poplars were incubated in the fixation solution (2.5% [v/v] glutaraldehyde in 0.1 M phosphate buffer, pH 7.4) under a vacuum for 12 h. The leaves of the fixed plants were dehydrated in ethanol and embedded in LR White resin (Sigma-Aldrich) for 12 h of polymerization at 50 °C. Ultrathin (60–80 nm) sections of poplar leaves were prepared using a Leica EM UC6 ultramicrotome (Leica, Vienna, Austria). The sections were post-stained with uranyl acetate and lead citrate and observed under an H-7500 transmission electron microscope (Hitachi, Tokyo, Japan) operated at 80 kV.
High light stress test
-
One-month-old soil-grown transgenic and WT poplar seedlings were treated under continuous high-light conditions (500 μmol/m2/s). Five plants were treated for each line. After treatment, leaves at the same position were used to detect Chl fluorescence parameters and ROS content.
Detection of ROS and net photosynthetic rate (Pn)
-
For superoxide anion (O2–) detection, detached leaves were immersed in a 6 mM nitroblue tetrazolium (NBT) solution containing 50 mM sodium phosphate (pH 7.5) for 12 h in the dark. To detect hydrogen peroxide (H2O2), detached leaves were immersed in 5 mM 3,3'-diaminobenzidine (DAB) solution containing 10 mM MES (pH 3.8) for 12 h in the dark. H2O2 content was measured using a Hydrogen Peroxide Assay Kit (BC3590, Solarbio, China), according to the manufacturer's instructions. The Pn was measured using a Li-6400XT portable photosynthetic system (LI-COR, Lincoln, NE, USA).
Statistical analyses
-
All experiments were conducted at least in three independent biological and three technical replicates. The data were analyzed using one-way analysis of variance by SPSS, and statistically significant differences were calculated based on Student's t-test, with p < 0.01 (**) as thresholds for significance.
-
AtSep2 contains two putative transmembrane structures, with a conserved Chl-binding motif (ExxGR) located in the first transmembrane structure (Fig. 1a, b). Glutamic acid (E105) in the Chl-binding motif is essential for Chl binding (Fig. 1c)[20]. To understand whether AtSep2 functions in poplar, a genetic transformation was performed using the leaf disc method (Supplemental Fig. S2a). Two transgenic poplar lines were generated and identified using reverse transcription PCR (Supplemental Fig. S2b). Based on phenotypic observations, transgenic poplar seedlings overexpressing AtSep2 exhibited marked leaf yellowing compared with WT leaves (Fig. 2a). This leaf yellowing phenotype continued in the annual plants and offspring of the cuttings (Supplemental Fig. S3a−f). Transgenic poplar grew slightly slower than WT, but there was no significant difference between them (Fig. 2a, Supplemental Fig. S3a−d). Pigment analysis revealed that the Chl a, Chl b, and Car levels in the leaves of transgenic poplar seedlings were significantly lower than that in the WT leaves (Fig. 2b−d), whereas the ratio of Chl a/b was significantly higher than that in the WT leaves (Fig. 2e). These results suggest that AtSep2 overexpression may cause leaf yellowing in poplar by reducing the Chl content.
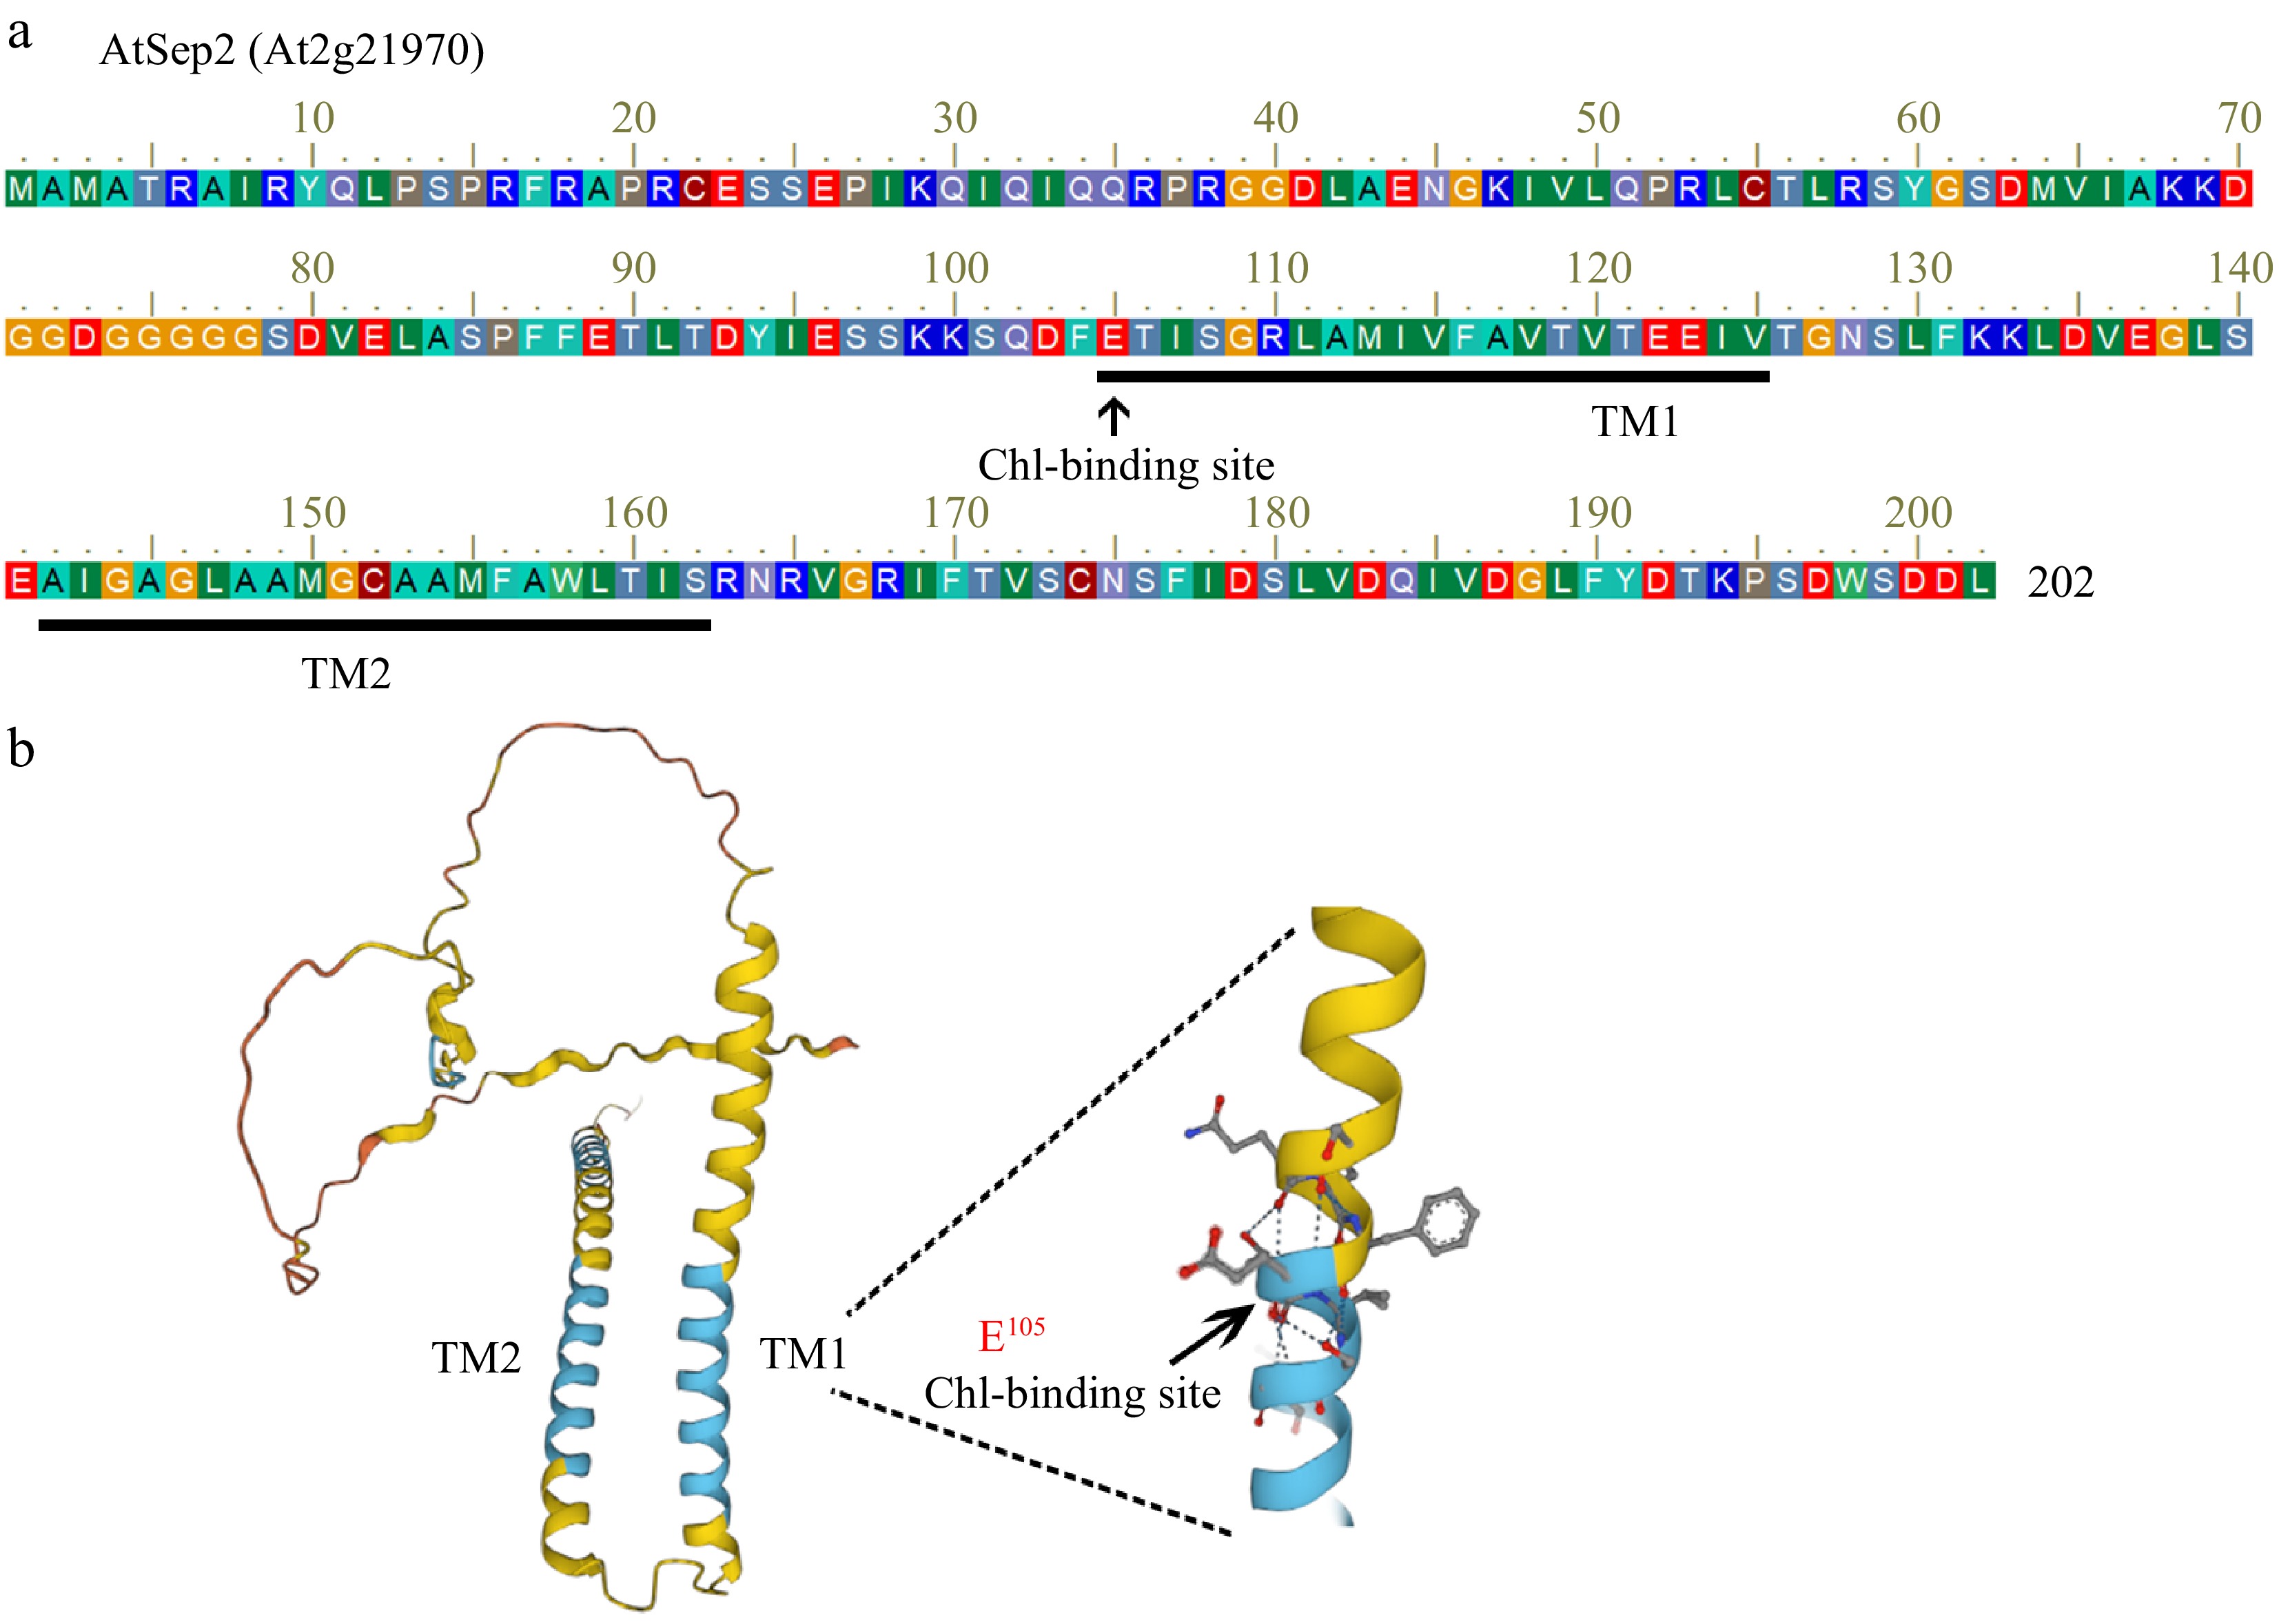
Figure 1.
Sequence analysis of AtSep2. (a) Amino acid sequence of AtSep2. (b) Predictive model of the AtSep2 protein structure. (c) Arrowheads indicate the conserved Chl-binding site E105 amino in the first transmembrane structure (TM).
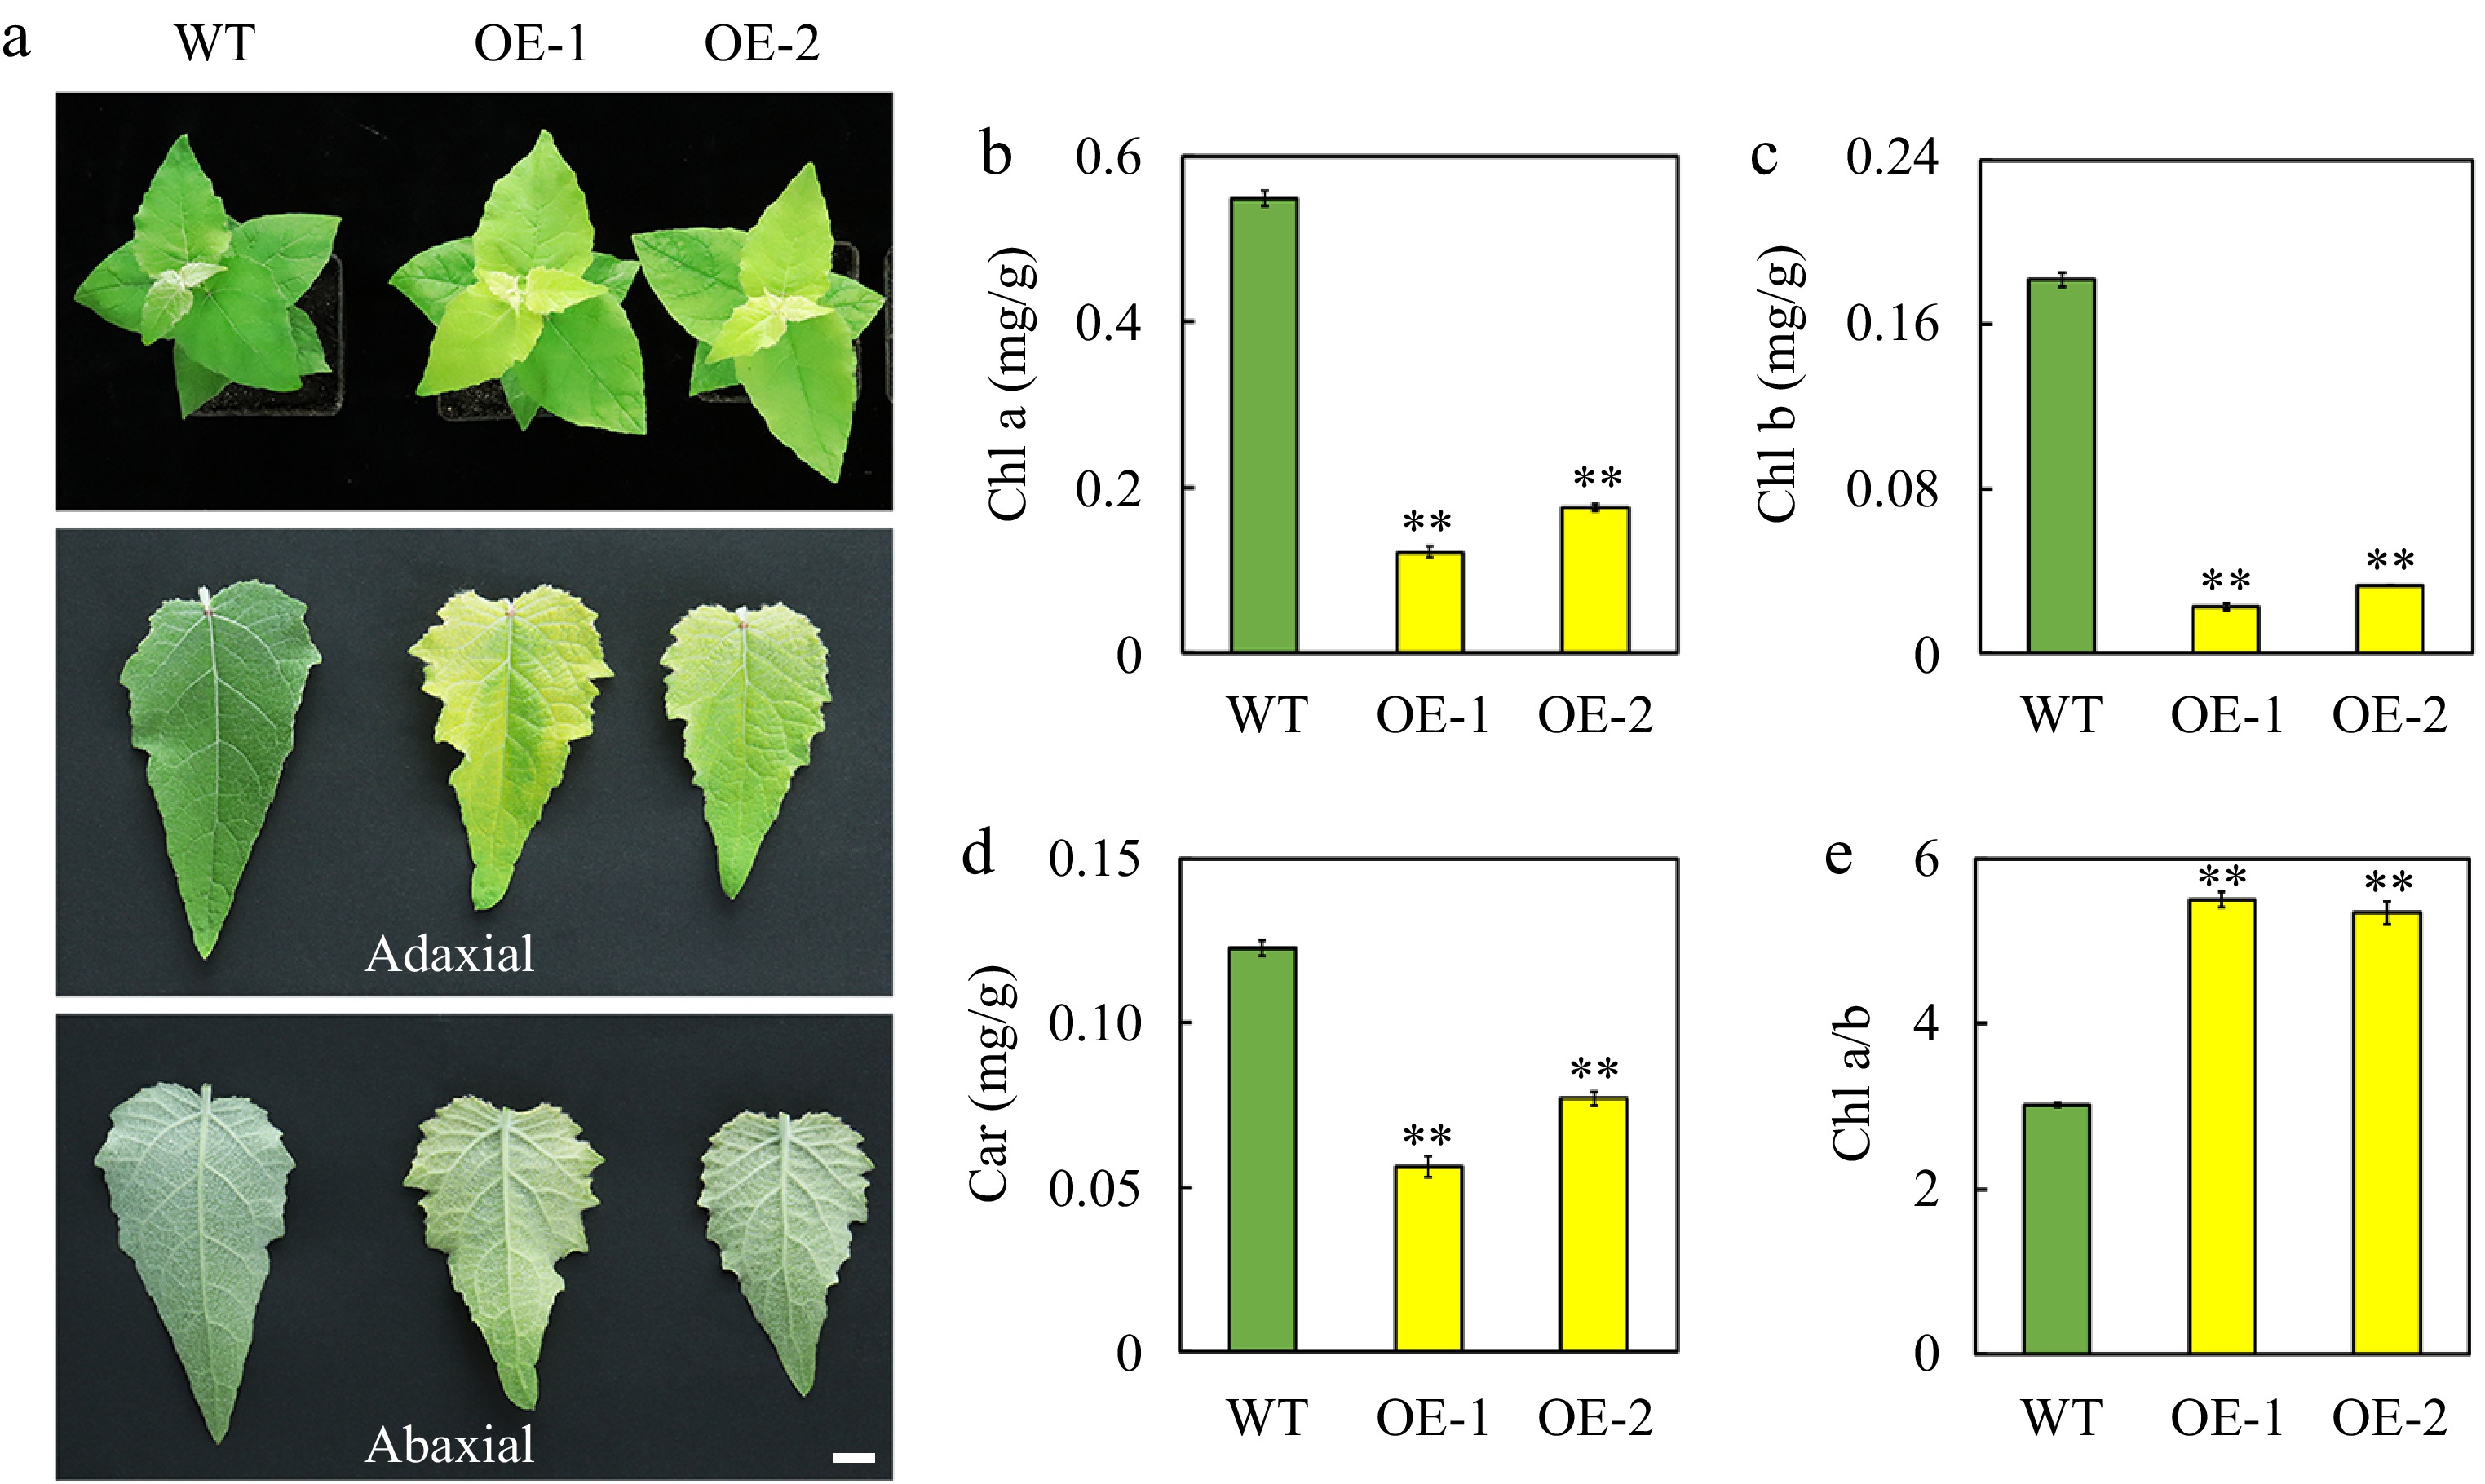
Figure 2.
Phenotype and pigment content of leaves of the wild-type (WT) and transgenic poplar seedlings overexpressing (OE) AtSep2. (a) Comparison of leaf (adaxial and abaxial) color of the WT and transgenic poplar seedlings. The content of (b) chlorophyll (Chl) a, (c) Chl b and (d) carotenoid (car) and the ratio of (e) Chl a and b in the leaves of WT and transgenic poplar seedlings. Asterisks indicate significant differences between WT and transgenic plants (** p < 0.01; Student's t-test). Error bars represent SE (n = 3). Scale bars = 1 cm.
AtSep2 localize in chloroplasts of poplar
-
Accurate localization of nuclear-encoded chloroplast proteins is a prerequisite for its function; therefore, the subcellular localization of AtSep2 in tobacco and poplar leaves was observed using GFP as a fusion marker. In tobacco leaves transiently expressing GFP as control, the GFP signals were mainly localized in the nucleus and cytoplasm (Supplemental Fig. S4a). However, in tobacco leaves transiently expressing AtSep2-GFP, the GFP signals mainly overlapped with the Chl autofluorescence signals (red) (Supplemental Fig. S4a), indicating that AtSep2-GFP was mainly localized in chloroplasts. Moreover, regions of tobacco leaves transiently expressing AtSep2-GFP showed yellowing, while regions transiently expressing GFP did not (Supplemental Fig. S4b). In transgenic poplar leaves stably expressing AtSep2-GFP, GFP signals were also mainly colocalized with Chl autofluorescence signals. However, no GFP signal was detected in the WT leaves (Fig. 3a). Chloroplast morphology observations showed that the transgenic poplar had smaller starch grains in the chloroplasts and thinner thylakoids than WT poplar (Fig. 3b). These results indicated that AtSep2 is mainly localized in the chloroplasts and its overexpression affected chloroplast morphology.
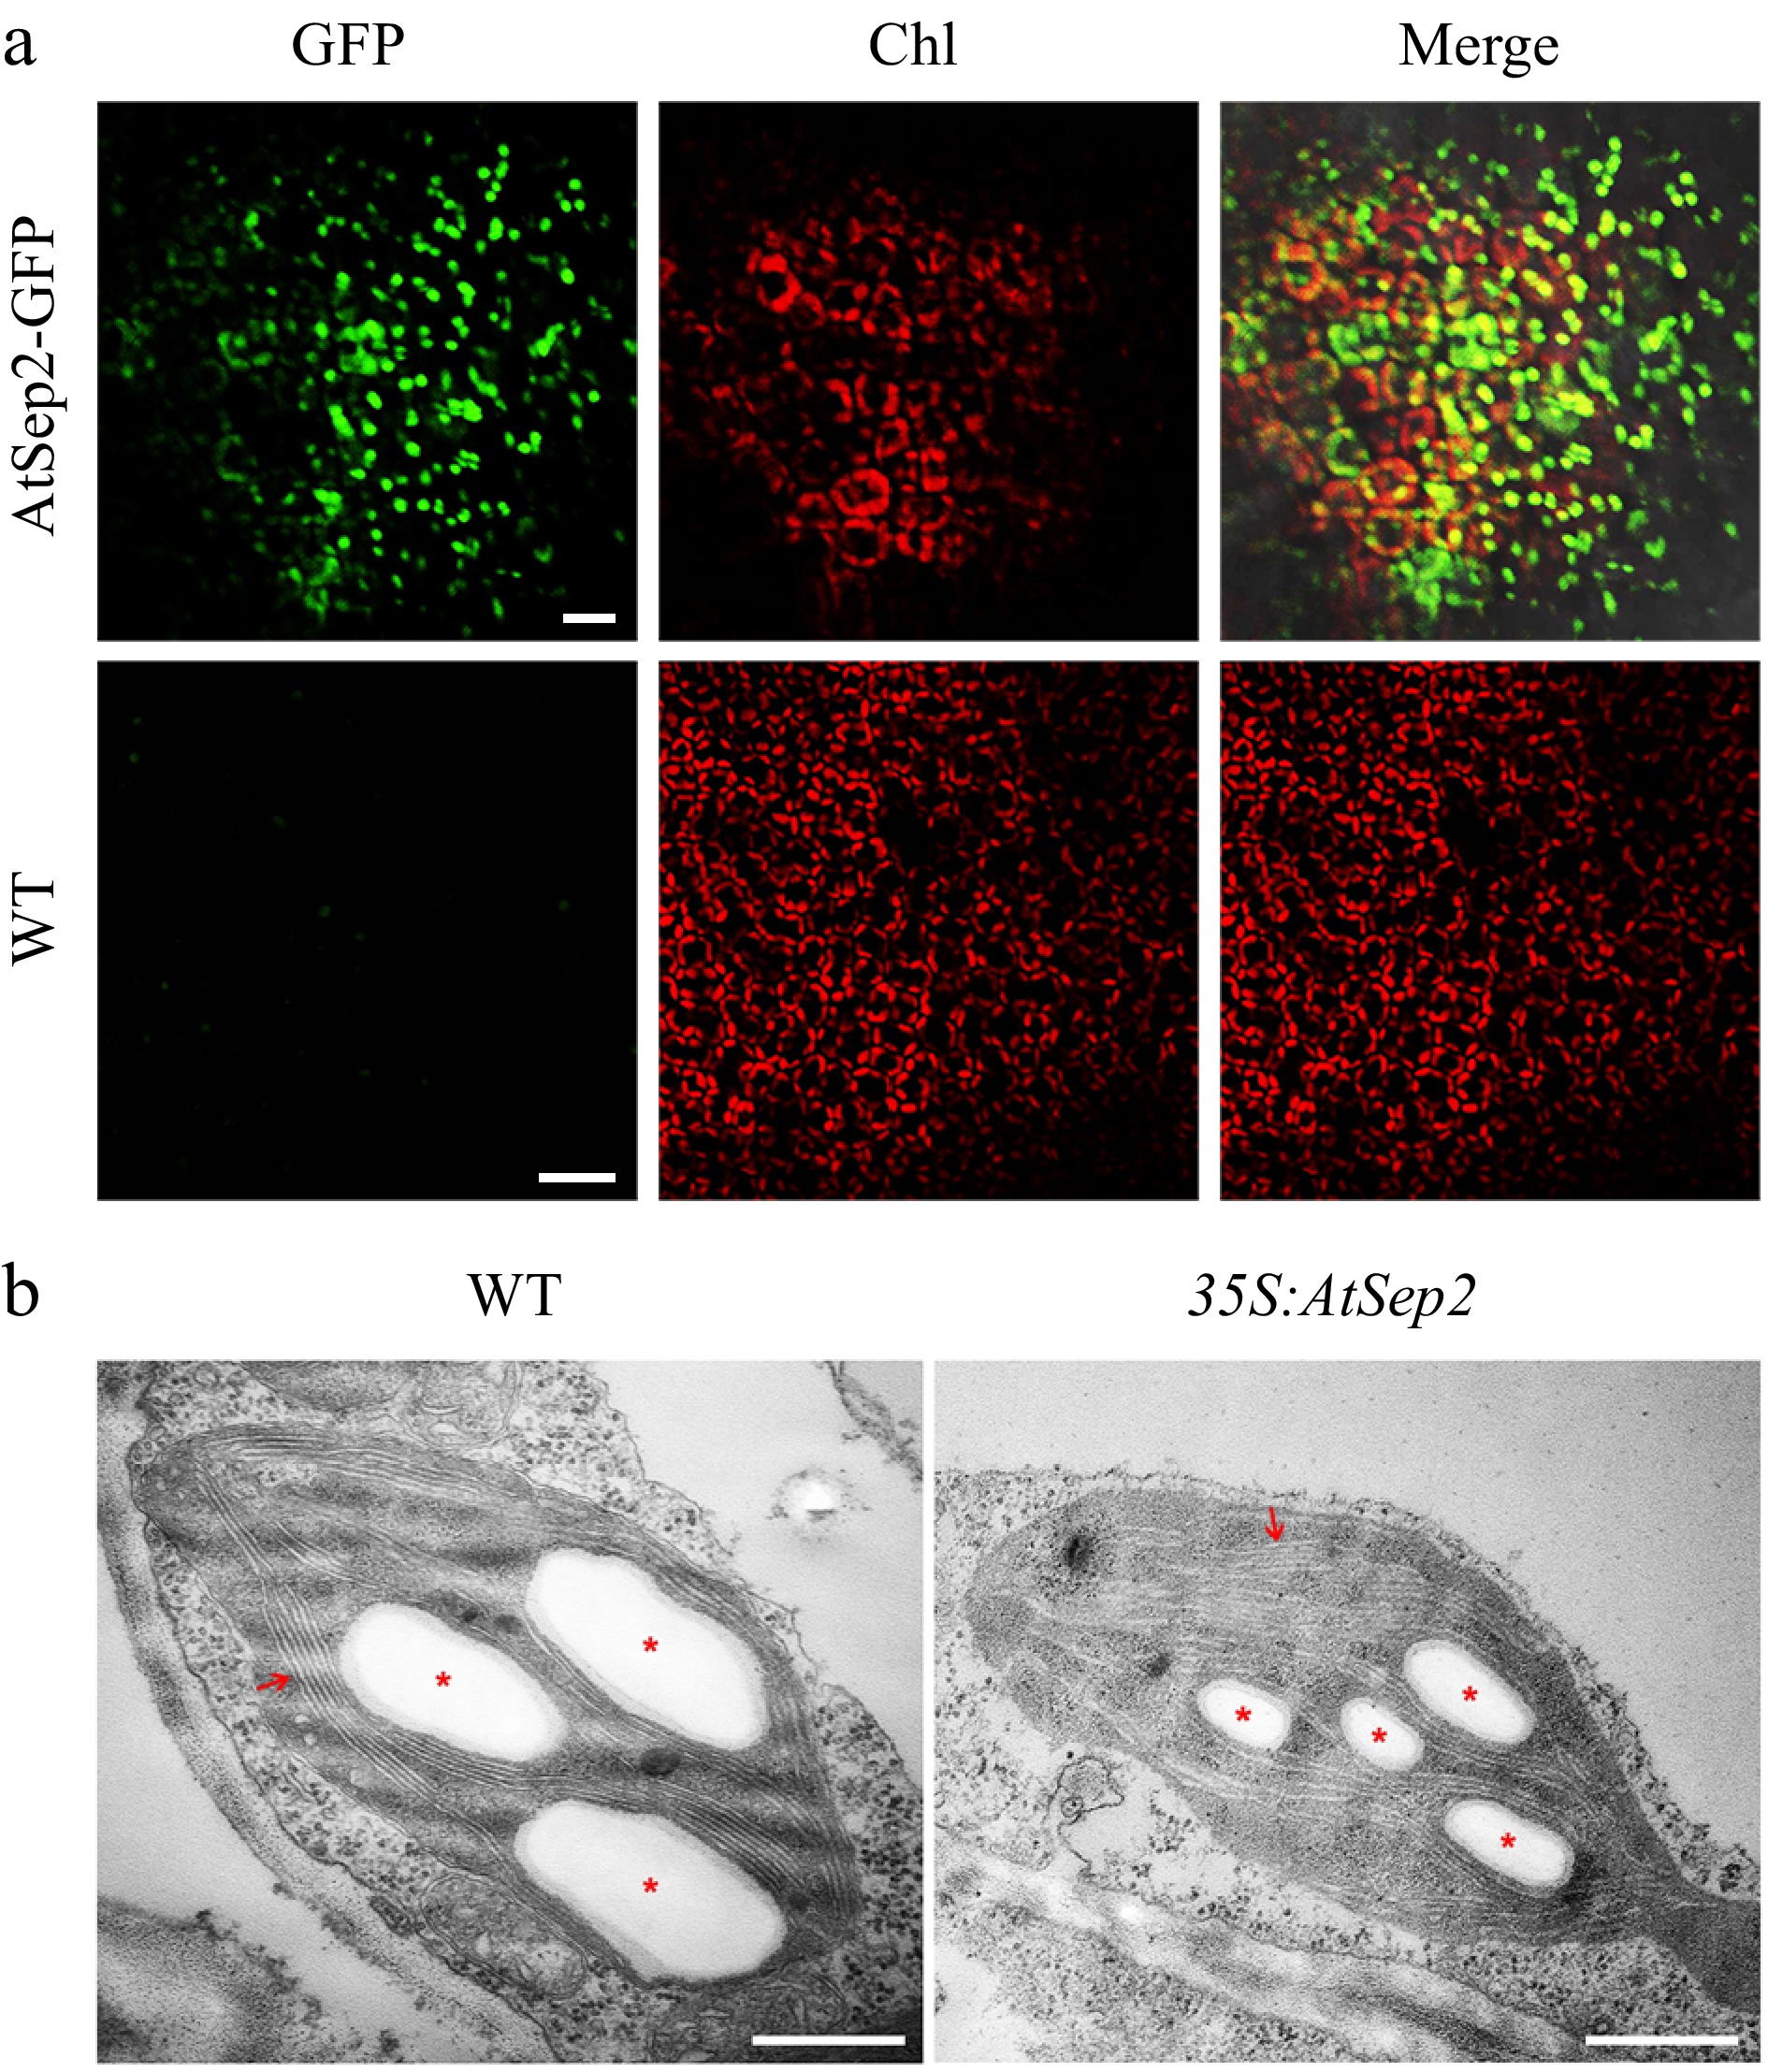
Figure 3.
Subcellular localization of AtSep2 and its effect on chloroplast ultrastructure in poplar. (a) Confocal images of leaves of wild-type (WT) and transgenic poplar stably expressing AtSep2-GFP. GFP fluorescence is green and Chl autofluorescence is red. Yellow signal is obtained by merging the GFP and Chl autofluorescence images. (b) Transmission electron microscopy (TEM) images of chloroplasts of wild-type (WT) and transgenic poplar overexpressing AtSep2. Red arrows indicate granum-thylakoid membranes, and asterisks indicate starch granules. Scale bars = (a) 20 μm, (b) 500 nm.
AtSep2 overexpression enhances the tolerance of high light stress in poplar leaves
-
AtSep2 is involved in light-stress response; therefore, the phenotype and physiology of transgenic poplars overexpressing AtSep2 and WT were compared under high light stress. After 14 days of high light stress, WT leaves were more purple than transgenic leaves (Fig. 4a, b), which is typical under light-induced stress. Before and after the stress, the Chl a, Chl b, and Car contents in the transgenic poplar leaves were significantly lower than those in the WT leaves, but their relative reduction in the WT leaves (approximately 80%) was greater than that in the transgenic leaves (approximately 60%) (Fig. 4c−e). The detection of Chl fluorescence parameters revealed that transgenic poplar leaves had lower F0 and Fm and higher Fv/Fm values than WT leaves before and after stress (Fig. 5a−d). Lower F0 and Fm values in transgenic poplar leaves were associated with their lower Chl content, while higher Fv/Fm values indicate that transgenic poplar leaves have higher intrinsic PSII efficiency compared to WT leaves. Moreover, higher Fv/Fm also indicated that high light stress had less effect on transgenic poplar leaves PSII than WT leaves. NBT staining showed that WT leaves had more staining than transgenic poplar leaves after high light stress (Fig. 6a), whereas DAB staining showed no significant difference between the WT and transgenic poplar leaves after high light stress (Fig. 6b). However, transgenic poplar leaves had significantly lower H2O2 accumulation than WT leaves after stress (Fig. 6c). Transgenic poplar leaves had significantly lower Pn than WT leaves under normal light conditions. However, Pn in transgenic poplar leaves was significantly higher than that in WT leaves after high light stress (Fig. 6d). Overall, although the transgenic poplar leaves had less Chl under normal conditions, their relative reduction after light stress was also small. Moreover, after light stress, transgenic poplar leaves showed higher Fv/Fm and Pn than WT leaves. These results indicate that transgenic poplar leaves have better tolerance to high light conditions than WT poplar leaves, as reflected by the higher Fv/Fm and Pn and lower accumulation of O2‒ and H2O2 after high light stress.
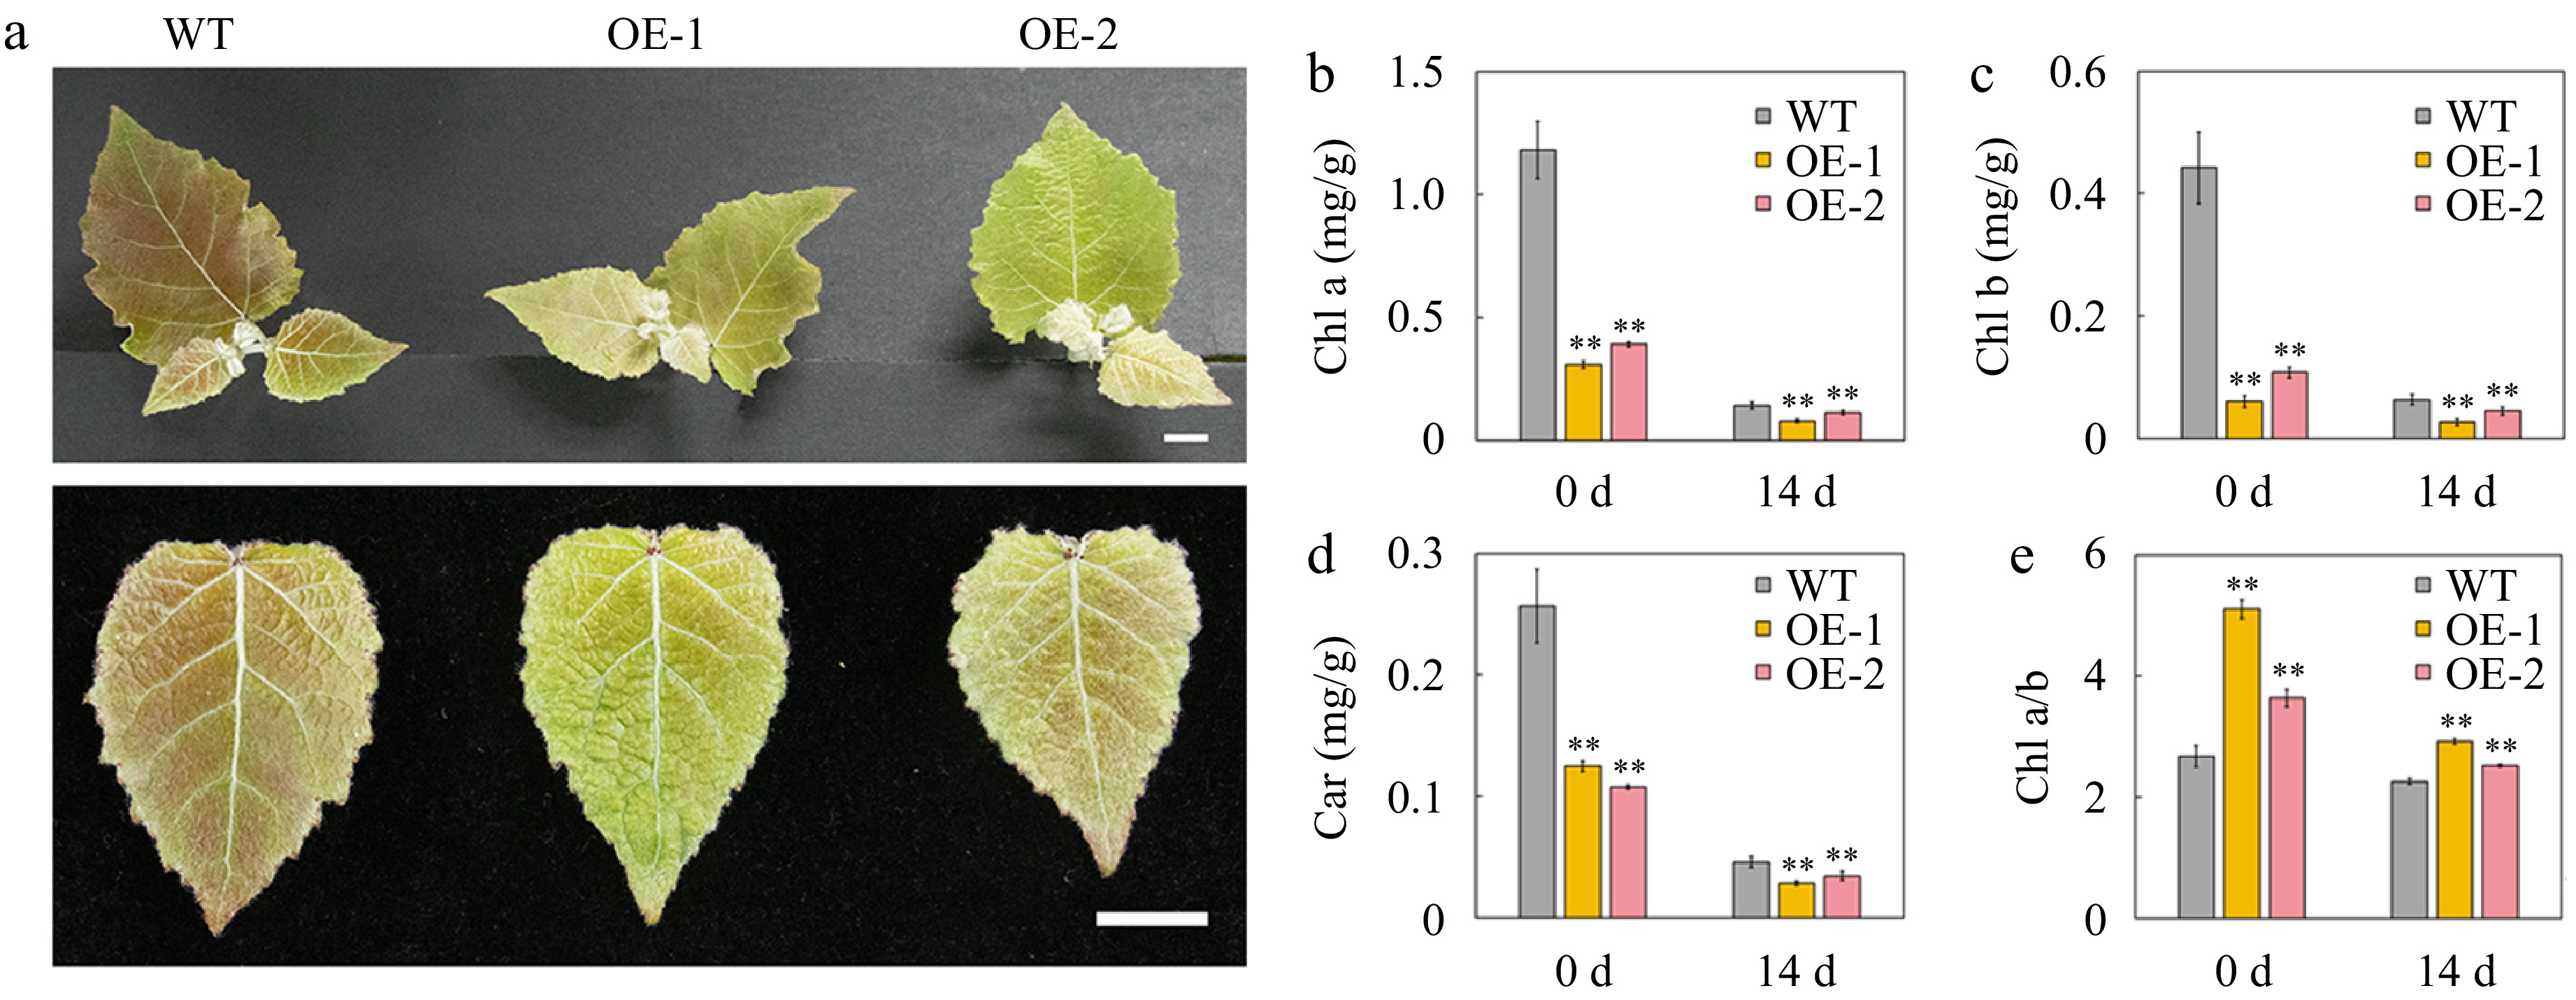
Figure 4.
Phenotype and pigment content of the leaves of wild-type (WT) and transgenic poplar overexpressing (OE) AtSep2 under high light stress. (a) Plant and leaf phenotypes of WT and transgenic poplar under high light stress for 14 d. The content of (b) chlorophyll (Chl) a, (c) Chl b and (d) carotenoid (car) and the ratio of (e) Chl a and b in the leaves of WT and transgenic poplar. Asterisks indicate significant differences between WT and transgenic plants (** p < 0.01; Student's t-test). Error bars represent SE (n = 3). Scale bars = 1 cm.
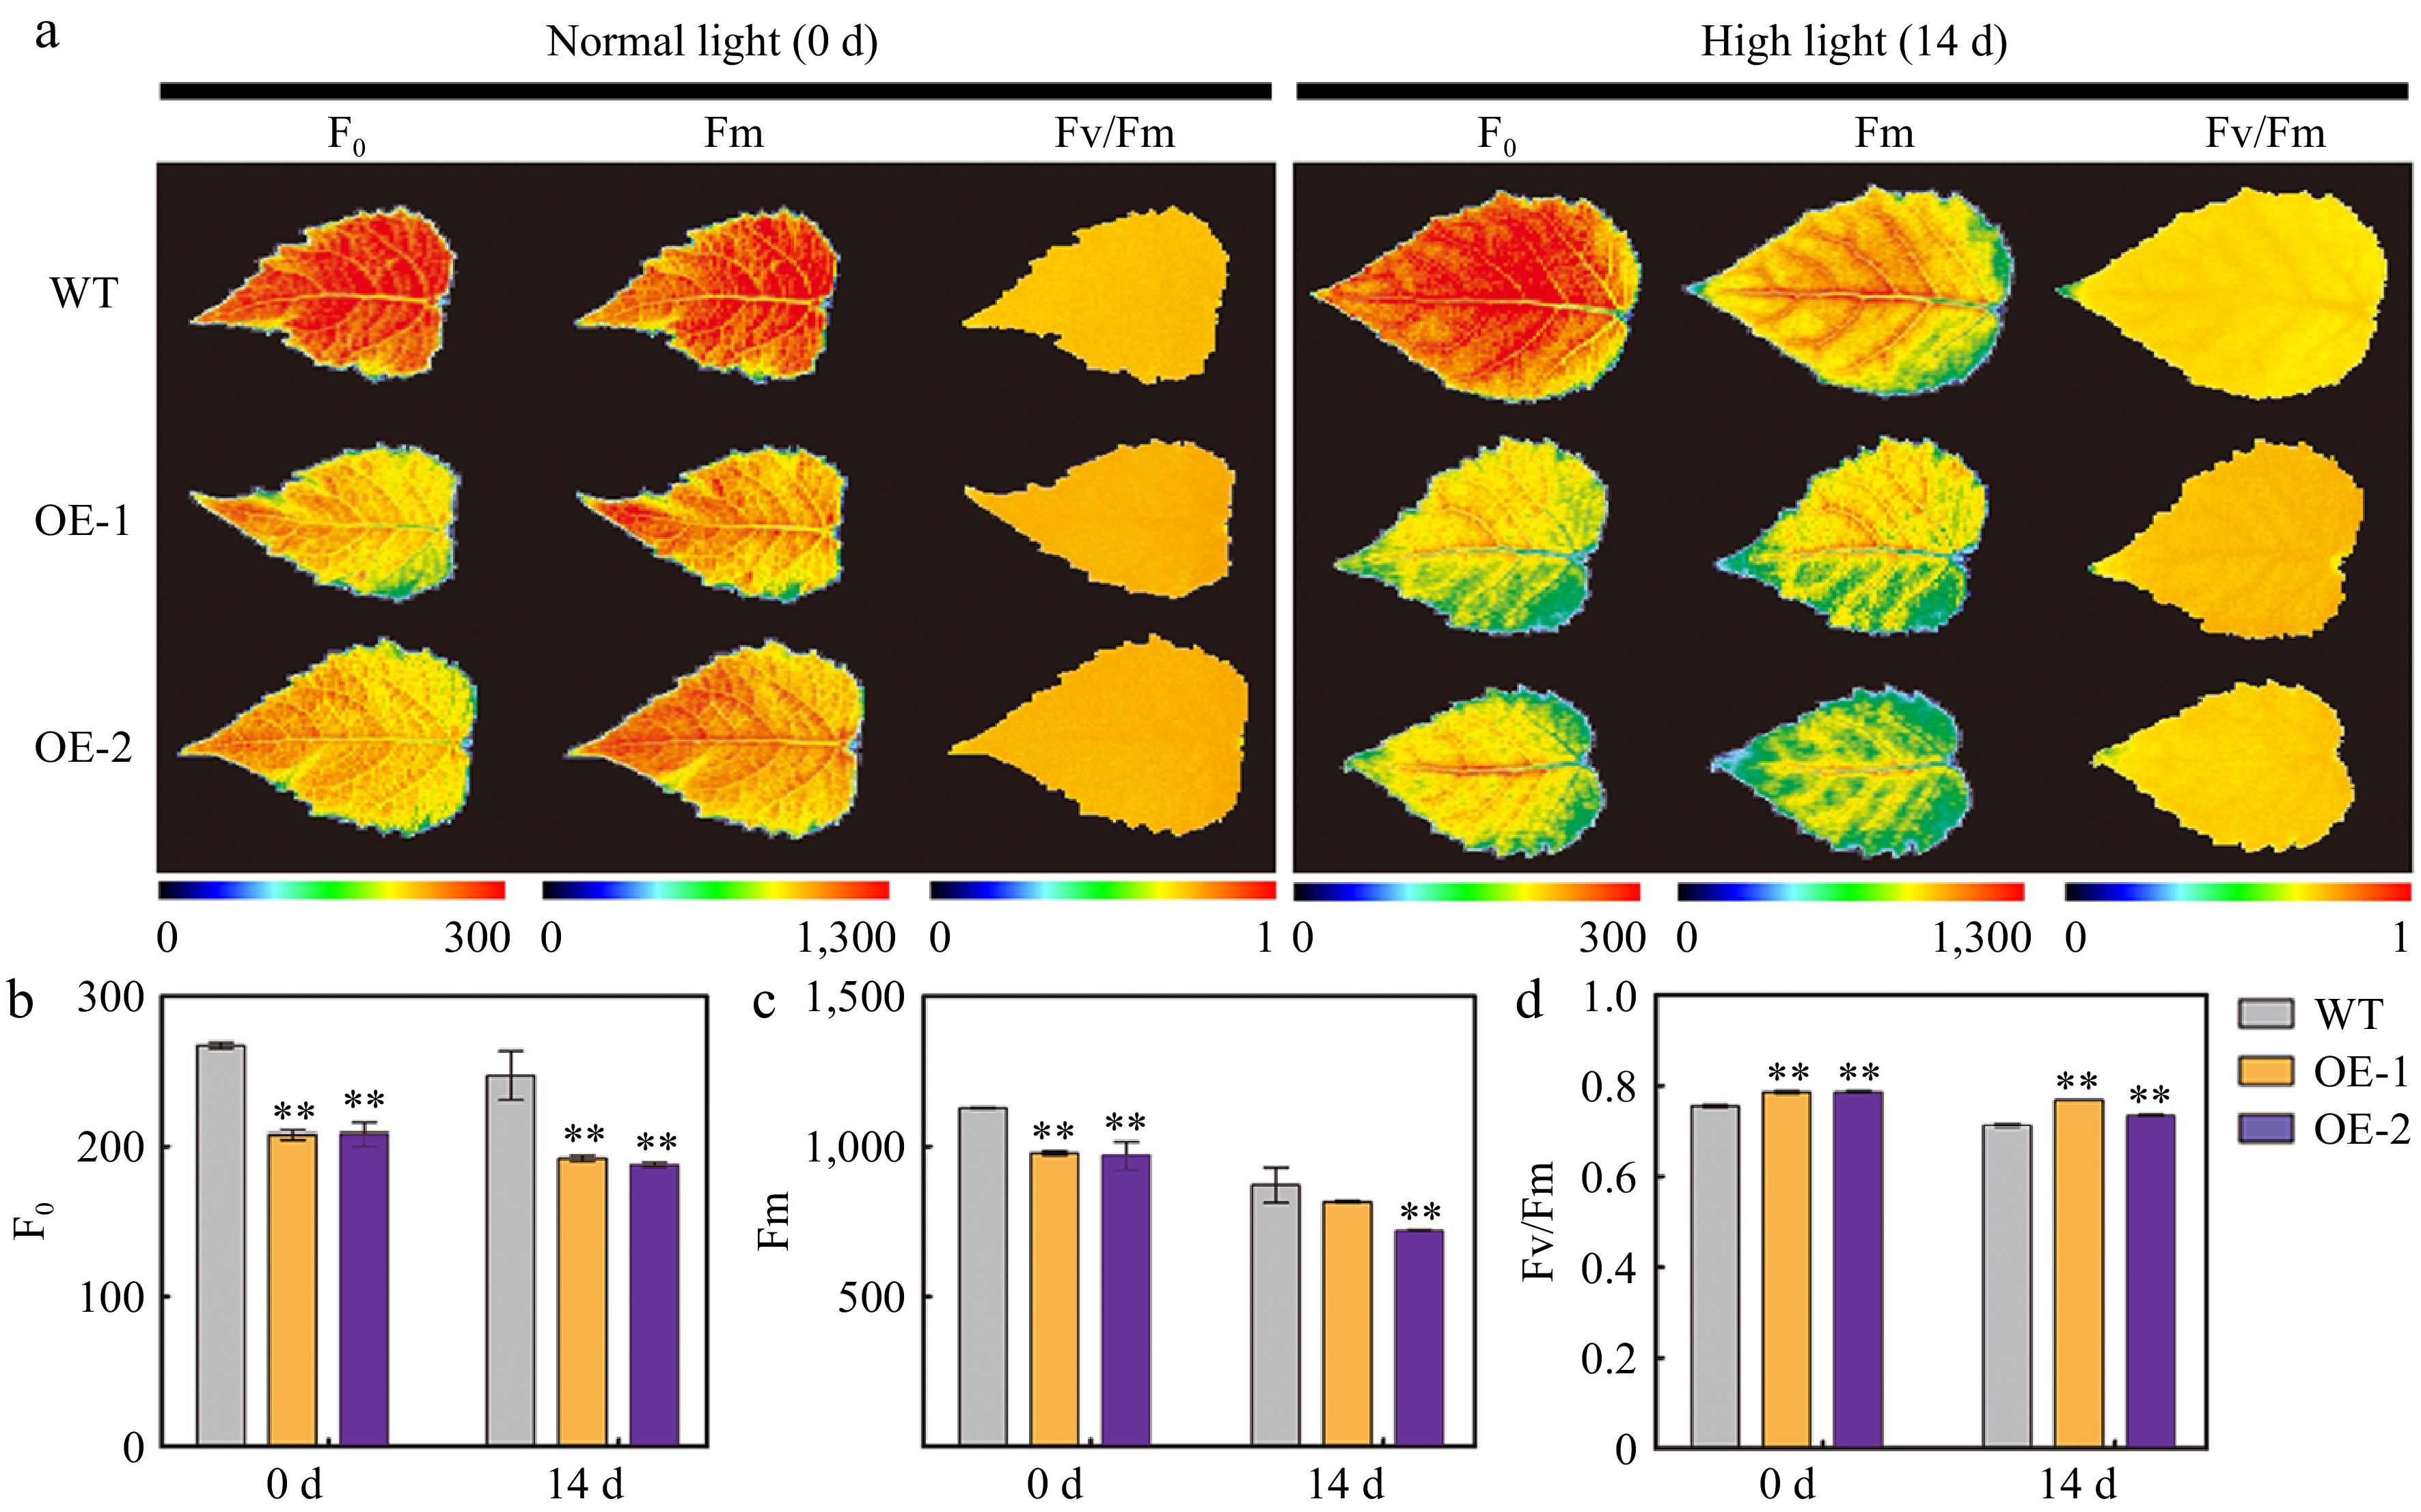
Figure 5.
Chlorophyll (Chl) fluorescence parameters in the leaves of wild type (WT) and transgenic poplar overexpressing (OE) AtSep2 under high light stress. (a) Minimum Chl fluorescence (F0), maximum Chl fluorescence (Fm), and maximal quantum yield of PSII photochemistry (Fv/Fm) images of the leaves of WT and transgenic poplar under normal light or high light stress for 14 d and (b)−(d) their quantitative analysis. Pseudo-colored bar depicted at the bottom of the panel ranges from 0 (black) to 300 (F0), 1,000 (Fm), or 1.0 (Fv/Fm) (red). Asterisks indicate significant differences between WT and transgenic plants (** p < 0.01; Student's t-test). Error bars represent SE (n = 3).
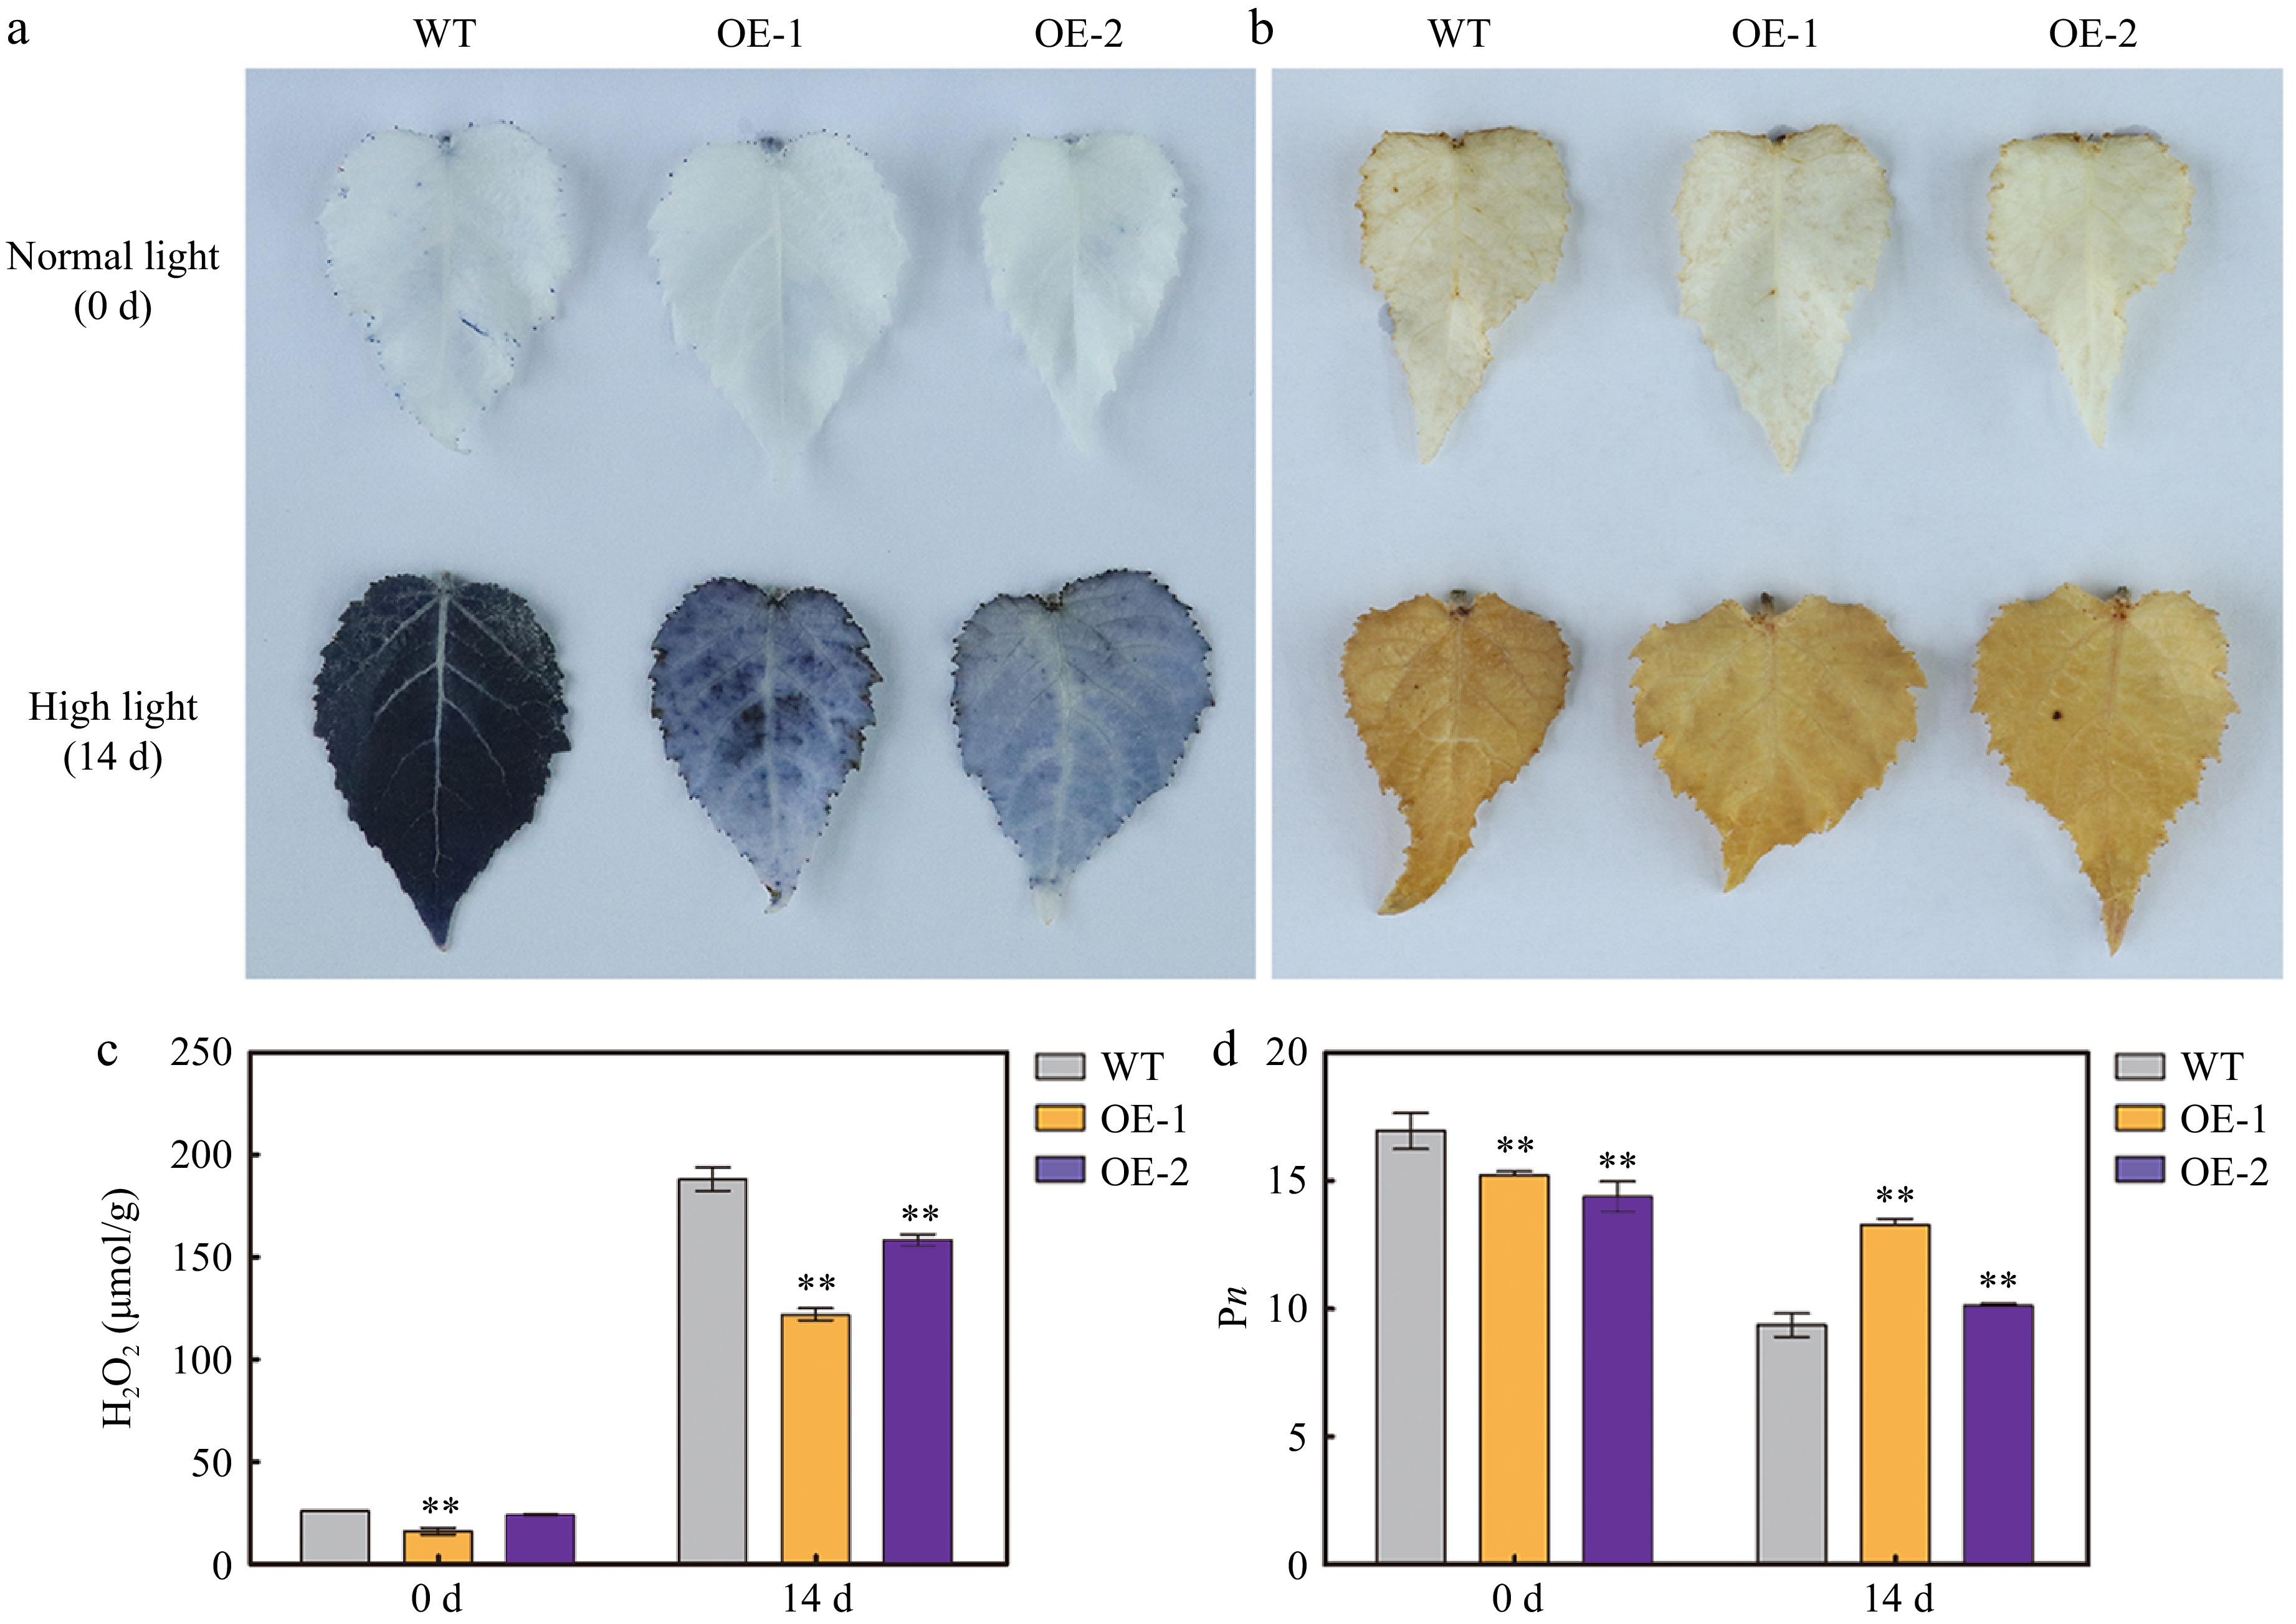
Figure 6.
Reactive oxygen species (ROS) accumulation and net photosynthetic rate (Pn) in the leaves of wild type (WT) and transgenic poplar overexpressing (OE) AtSep2 under high light stress. The O2– and H2O2 levels in the leaves of WT and transgenic poplar under normal light or high light stress for 14 d, as indicated by (a) nitroblue tetrazolium (NBT) and (b) 3,3'-diaminobenzidine (DAB) staining. (c) H2O2 content and (d) Pn in the leaves of WT and transgenic poplar under normal light or high light stress for 14 d. Asterisks indicate significant differences between WT and transgenic plants (** p < 0.01; Student's t-test). Error bars represent SE (n = 3).
-
Plants with differently colored leaves usually arise from natural mutations in their buds, which are stochastic and uncertain. Genetic engineering is an effective way to change the leaf color of plants. Poplar leaf color can be improved using transgenic methods. For example, overexpression of the R2R3-MYB transcription factors PtrMYB119 and PdMYB118 caused red leaf phenotypes in P. trichocarpa and P. deltoids, respectively, by promoting anthocyanin accumulation[3,25,26]. Suppression of GLK (golden2-like) gene expression caused the golden leaf phenotype in triploid poplar (P. alba × P. berlinensis)[27]. In the present study, AtSep2 overexpression caused the golden leaf phenotype in 84 K poplar by reducing Chl levels (Fig. 2). A previous study by the current authors confirmed that AtSep2 can bind free Chl under light stress[20]. High light stress causes saturation of the energy absorbed by the PSs. Excess energy triggers the transition of free Chl into Chl triplets, which then react with O2 to form harmful ROS in the chloroplast[15]. Thus, less accumulation of free Chl under light stress might be closely associated with less ROS production. In the present study, the transgenic poplar leaves had lower Chl content and less O2‒ and H2O2 accumulation than the WT leaves after high light stress (Figs 4, 6). Moreover, transgenic poplar leaves showed a stronger high light tolerance than WT leaves (Figs 4, 5). These results suggest that AtSep2 reduces ROS production by binding more free Chl, thereby enhancing the high light tolerance of transgenic poplar leaves (Fig. 7). Studies have revealed that LHC-like proteins are mainly responsible for photoprotection by reducing light-induced oxidative damage in chloroplasts[15]. In agreement, a previous study by the current authors also confirmed the function of AtSep2 in Arabidopsis[20], suggesting that it plays the same role in both Arabidopsis and poplar. Subcellular localization showed that AtSep2 can accurately localized to the chloroplasts of tobacco and poplar leaves by transient and stable expression experiments (Fig. 3a, Supplemental Fig. S4a). Chloroplast proteins are involved in post-transcriptional regulation, and their accurate localization is crucial for their function. The Chl metabolism process is mainly performed in chloroplasts, and the accurate localization of AtSep2 in chloroplasts also indicates that its function is conserved in poplar leaves.
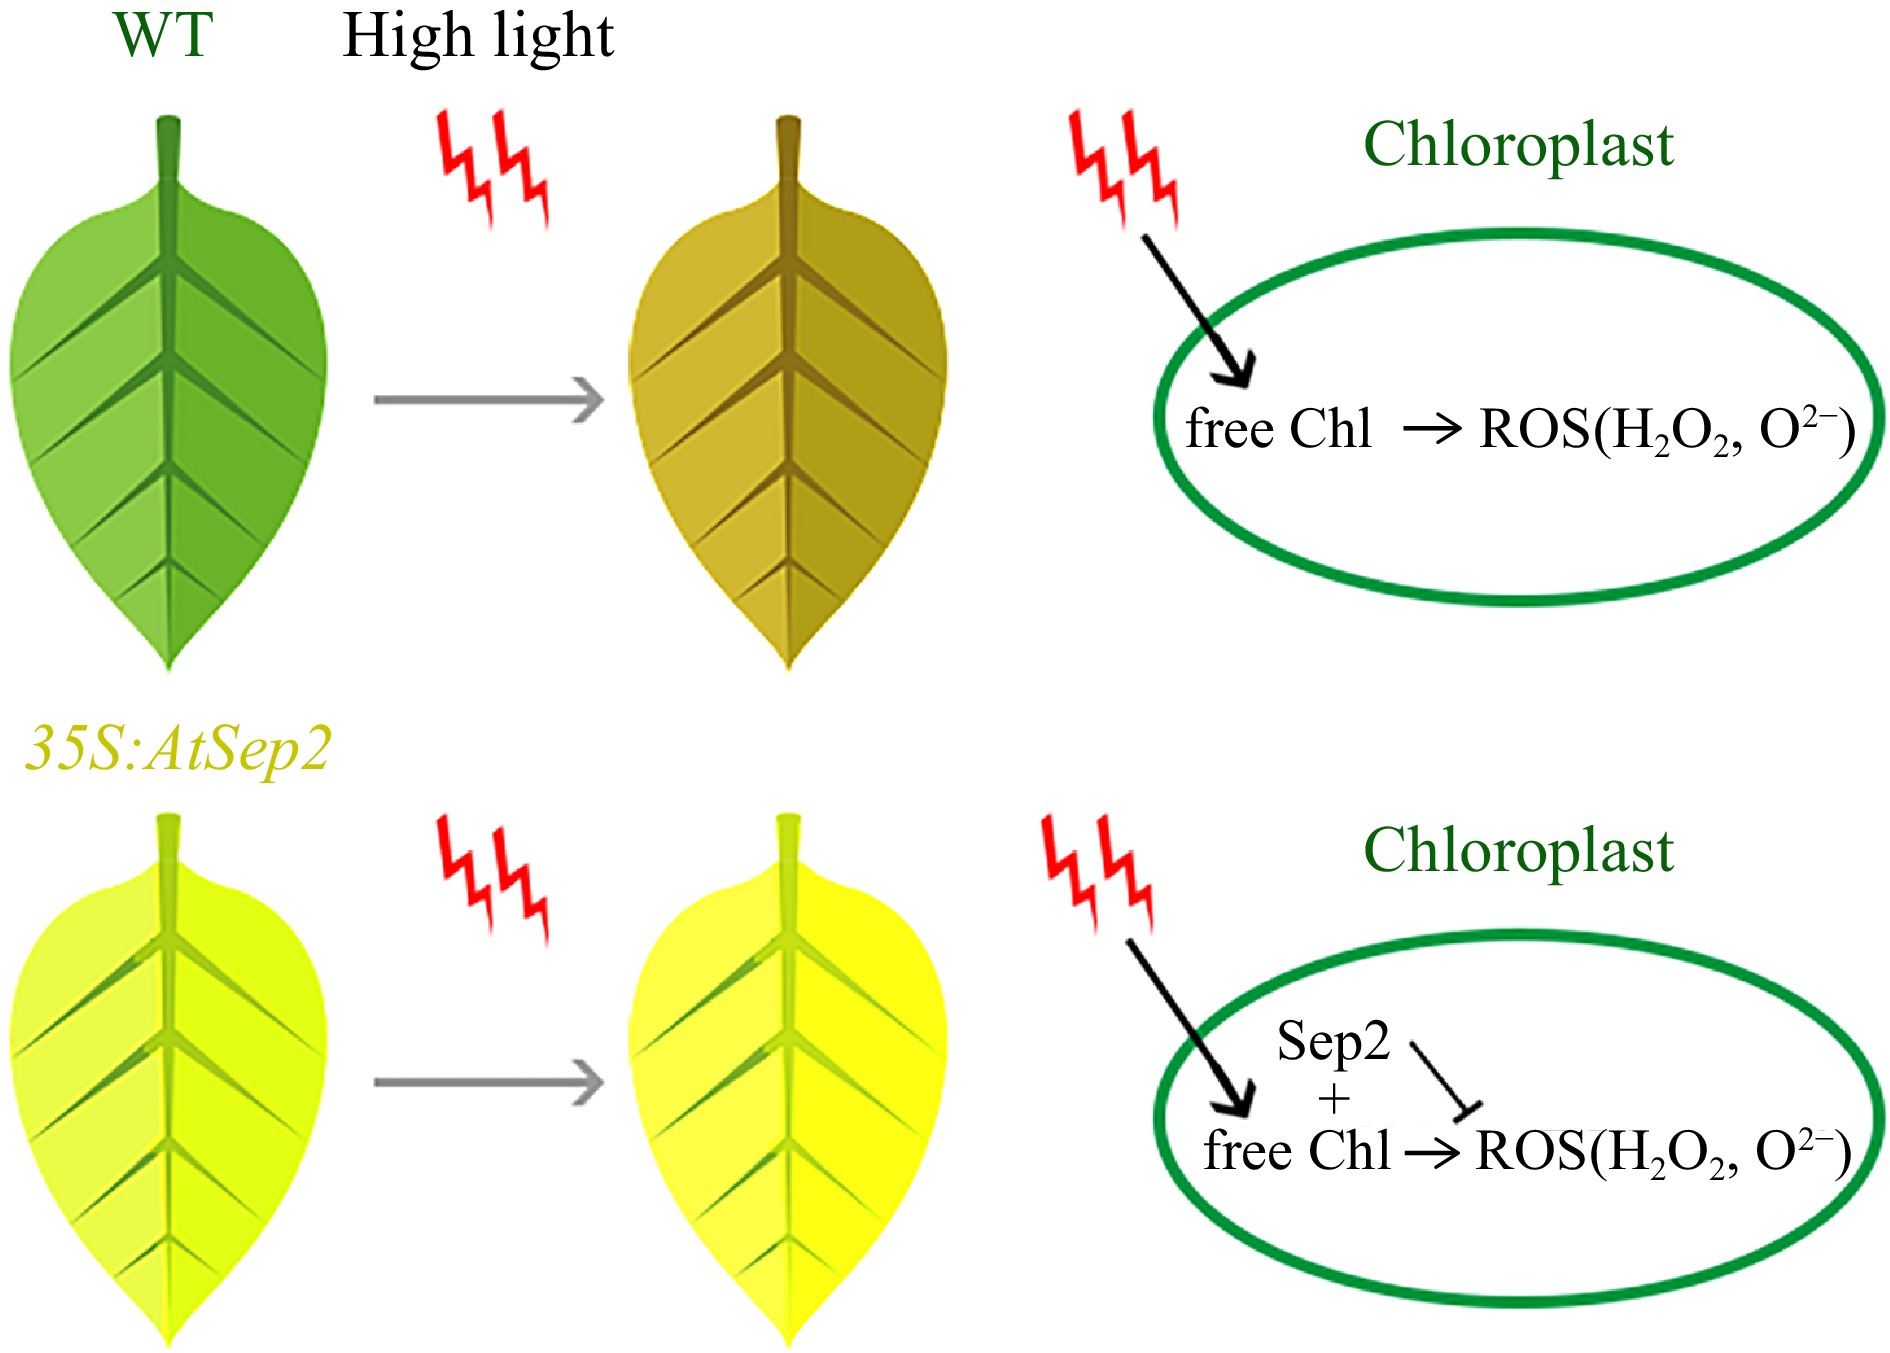
Figure 7.
Putative model of AtSep2 function in leaf yellowing and tolerance of high light stress in transgenic poplar. High light stress induces free chlorophyll (Chl) to form the Chl triplets, which react with O2 to form harmful reactive oxygen species (ROS), such as H2O2 and O2–; however, AtSep2 may prevent the further production of ROS by binding with free Chl.
Due to its higher ornamental value, AtSep2-transgenic golden leaf poplar should be more popular in urban greening and beautification. In addition, high-light stress is one of the environmental factors limiting the application of landscaping tree species in many areas at present, therefore, AtSep2-transgenic poplar with stronger high light tolerance will have greater application prospects. Although AtSep2 is derived from the herb Arabidopsis, the golden leaf phenotype is stable in transgenic poplar overexpressing AtSep2 (Figs 2, 4, Supplemental Fig. S3). Moreover, the growth of transgenic golden leaf poplar was slightly inhibited but did not produce a significant difference from WT (Figs 2, 4, Supplemental Fig. S3). Therefore, AtSep2 is the candidate gene in tree breeding for the generation of species with different leaf colors.
-
In summary, AtSep2 has a conserved Chl-binding motif, and its overexpression causes the golden leaf phenotype in poplar by reducing Chl content. AtSep2 was mainly localized in the chloroplasts in the leaves, and its overexpression altered the chloroplast micromorphology. Under high light stress, the transgenic poplar leaves exhibited higher light tolerance than the WT leaves, as indicated by a lower decrease in Fv/Fm, ROS accumulation, and higher Pn. Overall, AtSep2 may be used for the genetic improvement of golden leaf poplar through genetic engineering.
-
The authors confirm contribution to the paper as follows: literature collation: Chao D, Zhou A; experimental design and implementation: Zhang H, Zhou A; data analysis and visualization: Chao D, Zhai X, Ren L; writing and polishing: Chao D, Fu S, Zhang J; resources and project administration: Zhai X, Feng S; review and editing: Zhang H, Zhou A. All authors reviewed the results and approved the final version of the manuscript.
-
The datasets generated during and/or analyzed during the current study are available from the corresponding author on reasonable request.
This work was supported by the National Natural Science Foundation of China (32172619).
-
The authors declare that they have no conflict of interest.
- Supplemental Fig. S1 The DNA sequence of the AtSep2 gene.
- Supplemental Fig. S2 Genetic transformation and molecular characterization of AtSep2 in poplar. (A) Genetic transformation and resistant plant screening in poplar with the AtSep2 gene using the leaf plate method. (B) Identification of the DNA levels and semi-quantitative PCR analysis of AtSep2 transcription in the wild-type (WT) and transgenic poplar lines (#1, #2).
- Supplemental Fig. S3 Comparison of leaf color of wild-type (WT) and transgenic poplar plants overexpressing (OE) AtSep2. Phenotypes (A) of the year-old WT and transgenic poplar plants and their leaf color (B); New leaves (C) on cuttings of WT and transgenic poplar plants and their leaf color (D); Identification of leaf color of WT (E) and transgenic poplar (F) plants by color card.
- Supplemental Fig. S4 Subcellular localization of transient expression of AtSep2-GFP in tobacco leaves (A) and its effect on tobacco leaf color (B). Scale bars = 200 μm (A). The red fonts indicate the color of the tobacco leaves transiently expressing GFP and AtSep2-GFP, respectively.
- Copyright: © 2024 by the author(s). Published by Maximum Academic Press, Fayetteville, GA. This article is an open access article distributed under Creative Commons Attribution License (CC BY 4.0), visit https://creativecommons.org/licenses/by/4.0/.
-
About this article
Cite this article
Chao D, Zhai X, Ren L, Fu S, Zhang J, et al. 2024. Chlorophyll-binding protein AtSep2 overexpression causes leaf yellowing and enhances tolerance to high light stress in poplar. Ornamental Plant Research 4: e018 doi: 10.48130/opr-0024-0016 

Chlorophyll-binding protein AtSep2 overexpression causes leaf yellowing and enhances tolerance to high light stress in poplar
- Received: 20 March 2024
- Revised: 11 May 2024
- Accepted: 03 June 2024
- Published online: 02 July 2024
Abstract: Poplar is a tree species used in urban greening, and colored leaf poplar is in great demand because of its higher ornamental value and function. In this study, we generated a golden leaf 84 K poplar (Populus alba × Populus glandulosa) by overexpressing the AtSep2 (stress-enhanced protein) gene from Arabidopsis. AtSep2 belongs to the light-harvesting chlorophyll (Chl)-binding complex (LHC)-like family and contains a conserved Chl-binding motif. Subcellular localization analysis showed that AtSep2 was mainly localized in the chloroplasts of poplar leaves. AtSep2 overexpression caused the golden leaf phenotype in poplar by reducing total Chl content. Before and after high light stress, the relative reduction in total Chl content and maximum quantum yield of PSII photochemistry (Fv/Fm) in transgenic poplar leaves was lower than that in wild-type (WT) leaves. Transgenic poplar leaves accumulated less reactive oxygen species (ROS) and had a higher net photosynthetic rate (Pn) than WT leaves under high light stress. Overall, AtSep2 overexpression caused the golden leaf phenotype and enhanced the tolerance of poplar leaves to high light stress. The present study suggests that AtSep2 is ideal for the genetic improvement of the golden leaf phenotype in poplar and other ornamental plants.
-
Key words:
- Stress-enhanced protein /
- Poplar /
- Golden leaf /
- High light tolerance