


-
Flowers are the most beautiful and essential part of ornamental plants, and the flower color is one of the most important quality indicators[1,2]. Therefore, the mechanism of flower color formation has always been a research hotspot, and it has been studied in many plants. Studies have shown that many factors, such as the type, content, and pH of intracellular pigment[3,4], the shape and structure of epidermal cells, and environmental conditions can influence flower color formation, among which the pigments play an important role[5]. Anthocyanidin, formed from anthocyanin and glycosides, is one of the most important color-developing substances in plants. Based on the different hydroxyl groups in the B-ring, anthocyanins are divided into six types, namely cyanidin, pelargonidin, delphinidin, peonidin, petunidin, and malvidin[6]. Studies have shown differences in anthocyanin type, content, and biosynthetic pathways in many plant species. Therefore, identifying the kind of anthocyanins and exploring their biosynthetic pathways will lay a foundation for studying the molecular mechanism of flower color formation.
Orchidaceae is one of the largest flowering plant families with about 700 genera and 28,000 species[7]. Many orchids have high ornamental and economic value. During evolution, orchids have formed a unique perianth structure composed of three sepals, two petals, and a lip specialized from petal[8]. The color of the lips are usually very rich and bright, which can serve as a visual signal to attract pollinators and play an important role in pollination. Cymbidium floribundum, also known as bee orchids due to the resemblance of their flowers to bees, are quite popular because of their large inflorescences, numerous flowers, gorgeous flower color, ease of cultivation, and strong adaptability. It can be successfully crossed with C. faberi and C. ensifolium and therefore used for breeding new varieties. Previous studies mainly focused on tissue culture, hybrid breeding, and pollination[9−11]. However, the molecular mechanism of lip coloration in C. floribundum remain poorly understood.
In this study, we identified differential metabolites and genes before and after pollination in the lip of C. floribundum by metabolomics and transcriptome sequencing. Besides, the key genes leading to the lip color changes in C. floribundum were isolated. We hope this study can provide a basis reference for further studies on the gene regulation network of anthocyanin biosynthesis pathways involved in C. floribundum.
-
C. floribundum were planted in the greenhouse in the Forest Orchid Garden of Fujian Agriculture and Forestry University (Fuijian, China). The lips of C. floribundum were collected before pollination (NP) and 6 h (P6), 12 h (P12), 24 h (P24), 36 h (P36) and 48 h (P48) after pollination (Fig. 1), three biological replicates were maintained for each period, and each biological replicate had eight lips from three pots flowers. All samples were frozen in liquid nitrogen immediately after collection and stored in a refrigerator at −80 °C.
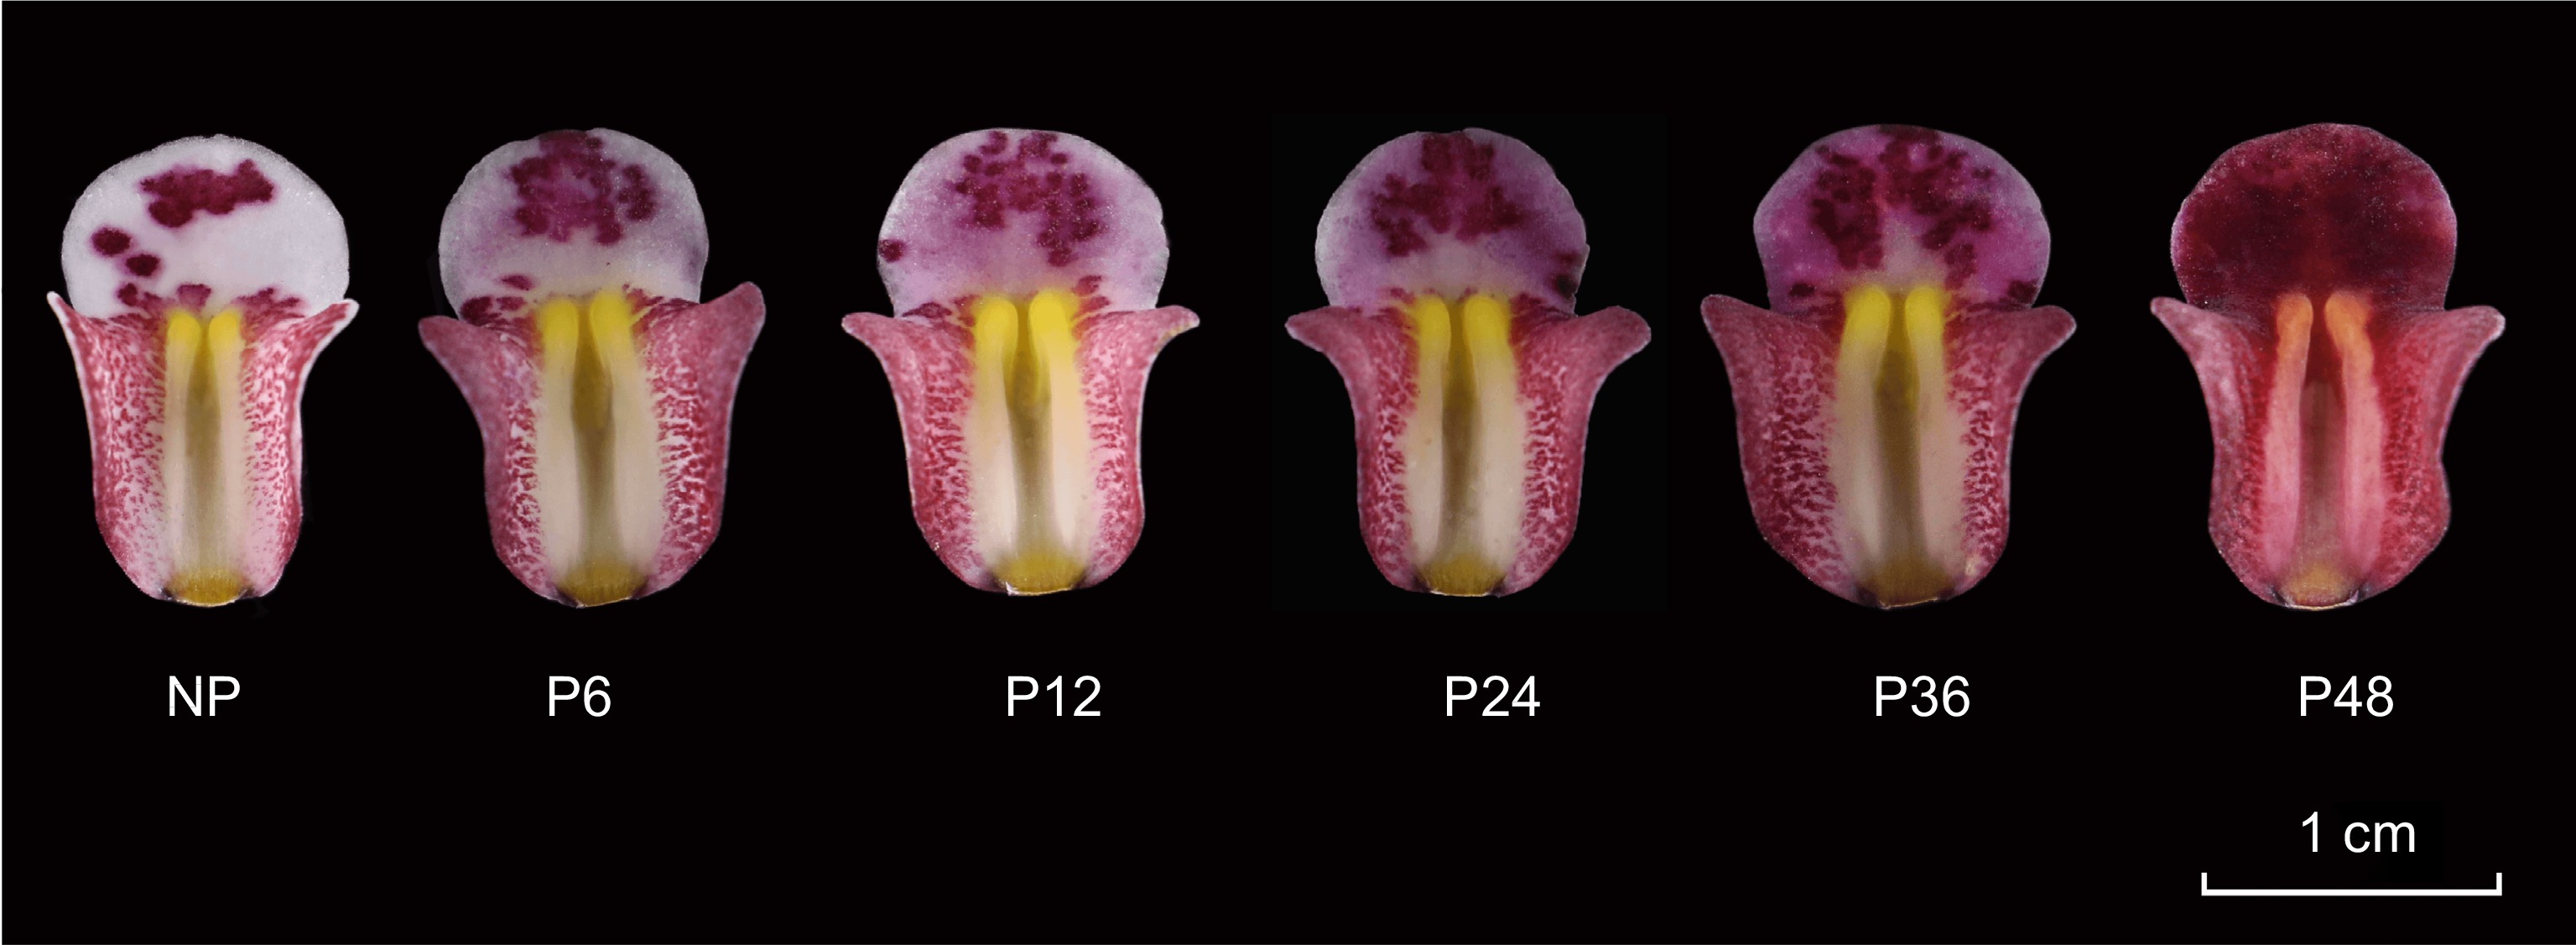
Figure 1.
Color change process of Cymbidium floribundum lip before and after pollination. NP, before pollination. P6, 6 h after pollination. P12, 12 h after pollination. P24, 24 h after pollination. P36, 36 h after pollination. P48, 48 h after pollination.
Metabolome analysis
-
The freeze-dried lips were crushed using a mixer mill (MM 400, Retsch). The samples were extracted overnight at 4 °C with 1.0 mL 70% aqueous methanol. Following centrifugation at 10,000× g for 10 min, the extracts were absorbed and filtrated. Then, the extracts were analyzed using an LC-ESI-MS/MS system (HPLC, Shim-pack UFLCSHIMADZU CBM30A system; MS, Applied Biosystems 4500 Q TRAP). The Heigh-performance liquid chromatography (HPLC) conditions and Mass spectrometry conditions were as described by Chen et al.[12]. Based on the database MWDB (metware database) and the public database of metabolite information, the primary and secondary spectral data of mass spectrometry assays were analyzed qualitatively. Quantitative analysis of metabolites is accomplished by multiple reaction monitoring (MRM) analysis using triple quadrupole mass spectrometry. The peak area of all substance mass spectra peaks was integrated using MultiaQuan software. The Analyst 1.6.3 software (AB Sciex) was used to process the mass spectrum data. Based on the results of principal component analysis (PCA) and orthogonal partial least squares discriminant analysis (OPLS-DA), the overall difference between samples in each group and the degree of variability between samples within the group were determined[13]. Furthermore, the differential metabolites were screened out by combining them with the fold change of importance projection (VIP) of the OPLS-DA model (VIP ≥ 1, fold change ≥ 2 or ≤ 0.5). The differential metabolites identified were submitted to the kyoto encyclopedia of genes and genomes (KEGG) website for relevant pathway analysis.
Transcriptome sequencing
-
The RNA was extracted using an Omega Plant RNA Kit (50) (R6827-01); the concentration, purity, and integrity of the RNA were measured with a NanoPhotometer spectrophotometer, Qubit2.0 Fluorometer, and Agilent 2100 bioanalyzer. The high-quality samples were used to construct a cDNA library, and the transcriptome sequencing was carried out on an Illumina Hiseq TM2500 platform. The clean reads obtained were used for subsequent analysis. Trinity was used for splicing the clean reads, and the transcript sequence obtained after splicing was used as the reference sequence[14]. The longest transcript of each gene was used as the representative of the gene. The seven databases including Nr, Nt, KOG, Swiss-Prot, KEGG, and GO were used to annotate the gene function and obtain comprehensive gene function information. The DESeq method based on negative binomial distribution was used to screen the differential genes, using the screening criterion of padj < 0.05. GOseq and KOBAS software were used to perform the GO function enrichment analysis and KEGG pathway enrichment analysis on the selected differential genes[15].
Analysis of ABP genes and TFs regulatory networks
-
The String online database (
https://string-db.org/ ) was used to search for the interaction relationships between structure genes and TFs. Then we used Cytoscape software (National Institute of General Medical Sciences, Bethesda, MD, USA) to construct a co-expression network to identify their main impact factors[16].qRT-PCR analysis of genes
-
Based on the annotation results and the FPKM (fragments per kilobase of transcript per million fragments mapped) value, eight genes encoding enzymes involved in flavonoid synthesis were selected for qRT-PCR detection. Each sample RNA (return sample from transcriptome sequencing) was reverse transcribed into cDNA using the PrimerScript RT Reagent Kit with gDNA Eraser (TaKaRa, Dalian, China). Primer premier 5.0 software was used to design the primers (Supplemental Table S1), and the ACTIN gene was used as the internal reference gene[17]. Real-time PCR was performed using TB Green Takara Premix Ex TaqTM II (TaKaRa, Japan), and real-time quantitative qRT-PCR analysis was performed on the ABI 7500 Real-Time System (Applied Biosystems, USA), the qRT-PCR procedure was proceeded as follows: 30 s at 95 °C, then 40 cycles at 95 °C for 5 s, 60 °C for 30 s. Melting curves were recorded at the end of 40 cycles, from 65 to 95 °C with a 0.5 °C increase every 5 s. Relative expression levels of each gene were calculated by the 2−ΔΔCᴛ method[18].
Subcellular localization of three CfMYBs
-
The open reading frames (ORFs) of CfMYB1, CfMYB3 and CfMYB4 without the termination codon were inserted into the pCAMBIA1302 vectors with NcoI and SpeI sites to create the pCAMBIA1302-CfMYB1-GFP, pCAMBIA1302-CfMYB3-GFP and pCAMBIA1302-CfMYB4-GFP fusion constructs. In addition, the recombinant plasmids and the control pCAMBIA1302-GFP plasmid were transferred into Agrobacterium tumefaciens GV3101 and injected into Nicotiana benthamiana leaves. After 48 h, the subcellular localization of CfMYB1, CfMYB3, and CfMYB4 were observed by confocal laser microscopy (CarlZeiss, Jena, Germany). The primer sequences are shown in Supplemental Table S2.
Transgenic verification of three CfMYBs
-
For gene functional analysis, The ORFs of CfMYB1, CfMYB3 and CfMYB4 were inserted into the pCAMBIA1302 vectors to create overexpression vectors, which were transformed into A. tumefaciens GV3101 and injected into the petals of Phalaenopsis hybrid 2 d before flowering. To facilitate observation, A. tumefaciens containing an empty vector was injected into the left petal and A. tumefaciens containing the overexpression vectors were injected into the right petal and sepal. Subsequently, the infected Phalaenopsis hybrid were cultivated in a greenhouse under normal conditions for 3−5 d. After the emergence of a stable phenotype, the transgenic petals were photographed, and RNA was extracted. Moreover, the expression of ABP genes (PeCHS, PeCHI, PeF3H, PeF3'H, PeF3'5'H, PeDFR, PeANS) after overexpression were analyzed by using the qRT-PCR. The primer sequences are shown in Supplemental Tables S1 & S3.
-
We used a combination of UPLC-MS/MS detection platform, self-built MetWare database and multivariate statistical analysis to study the metabolome differences between samples. The peak retention time and the peak area of the total ion current (TIC) for metabolite detection overlapped well, indicating good signal stability of mass spectrum when analyzing the same sample at different time points (Supplemental Fig. S1). Further, the principal component analysis (PCA) was used to gain a preliminary understanding of the overall metabolic differences between the samples of each group and the degree of variability between the samples within the group. In this study, there are obvious metabolic differences among the five comparison groups (NP, P12, P24, P36, and P48), and the differences within each period are relatively small, indicating good repeatability of the samples (Supplemental Fig. S2). A total of 230 metabolites belonging to 10 categories were detected, including 61 flavonoids, 42 alkaloids, and 37 amino acids, and their derivatives, 34 lipids, 29 other types, 16 nucleotides and their derivatives, 11 phenolic acids, seven organic acids, two lignins and coumarins, and one phenanthrene (Supplemental Table S4).
Screening and metabolic pathway analysis of differential metabolites
-
A method of combining fold change with the VIP value of the OPLS-DA model is adopted to screen for differential metabolites. The volcano maps showed that 16, 33, 39, and 45 differential metabolites were upregulated, and 20, 15, 26, and 25 were downregulated in NP vs P12, NP vs P24, NP vs P36, and NP vs P48 comparisons, respectively (Fig. 2a–d). Besides, 14 differential metabolites were shared among the four comparison groups, and 36, 48, 65, and 73 differential metabolites were present in each comparison group (Fig. 2e). The KEGG pathways of the differential metabolites identified in each comparison group were analyzed. The top 20 KEGG pathways significantly enriched were shown (Fig. 3). In the NP vs P12 comparison group, 13 metabolites were significantly different and annotated by KEGG; the most significantly enriched pathways of these differential metabolites were flavonoid biosynthesis, flavonol and flavonol biosynthesis, and cysteine and methionine metabolism (Fig. 3a). Meanwhile, dopaminergic synapse, purine metabolism, and flavonoid biosynthesis were the significantly enriched pathways associated with the differential metabolites of the NP vs P24 group (Fig. 3b); tyrosine metabolism, isoquinoline alkaloid biosynthesis, and flavonoid biosynthesis with those of the NP vs P36 group (Fig. 3c); and prolactin signaling pathway, dopaminergic synapse, and amphetamine addiction with those of the NP vs P48 group (Fig. 3d).
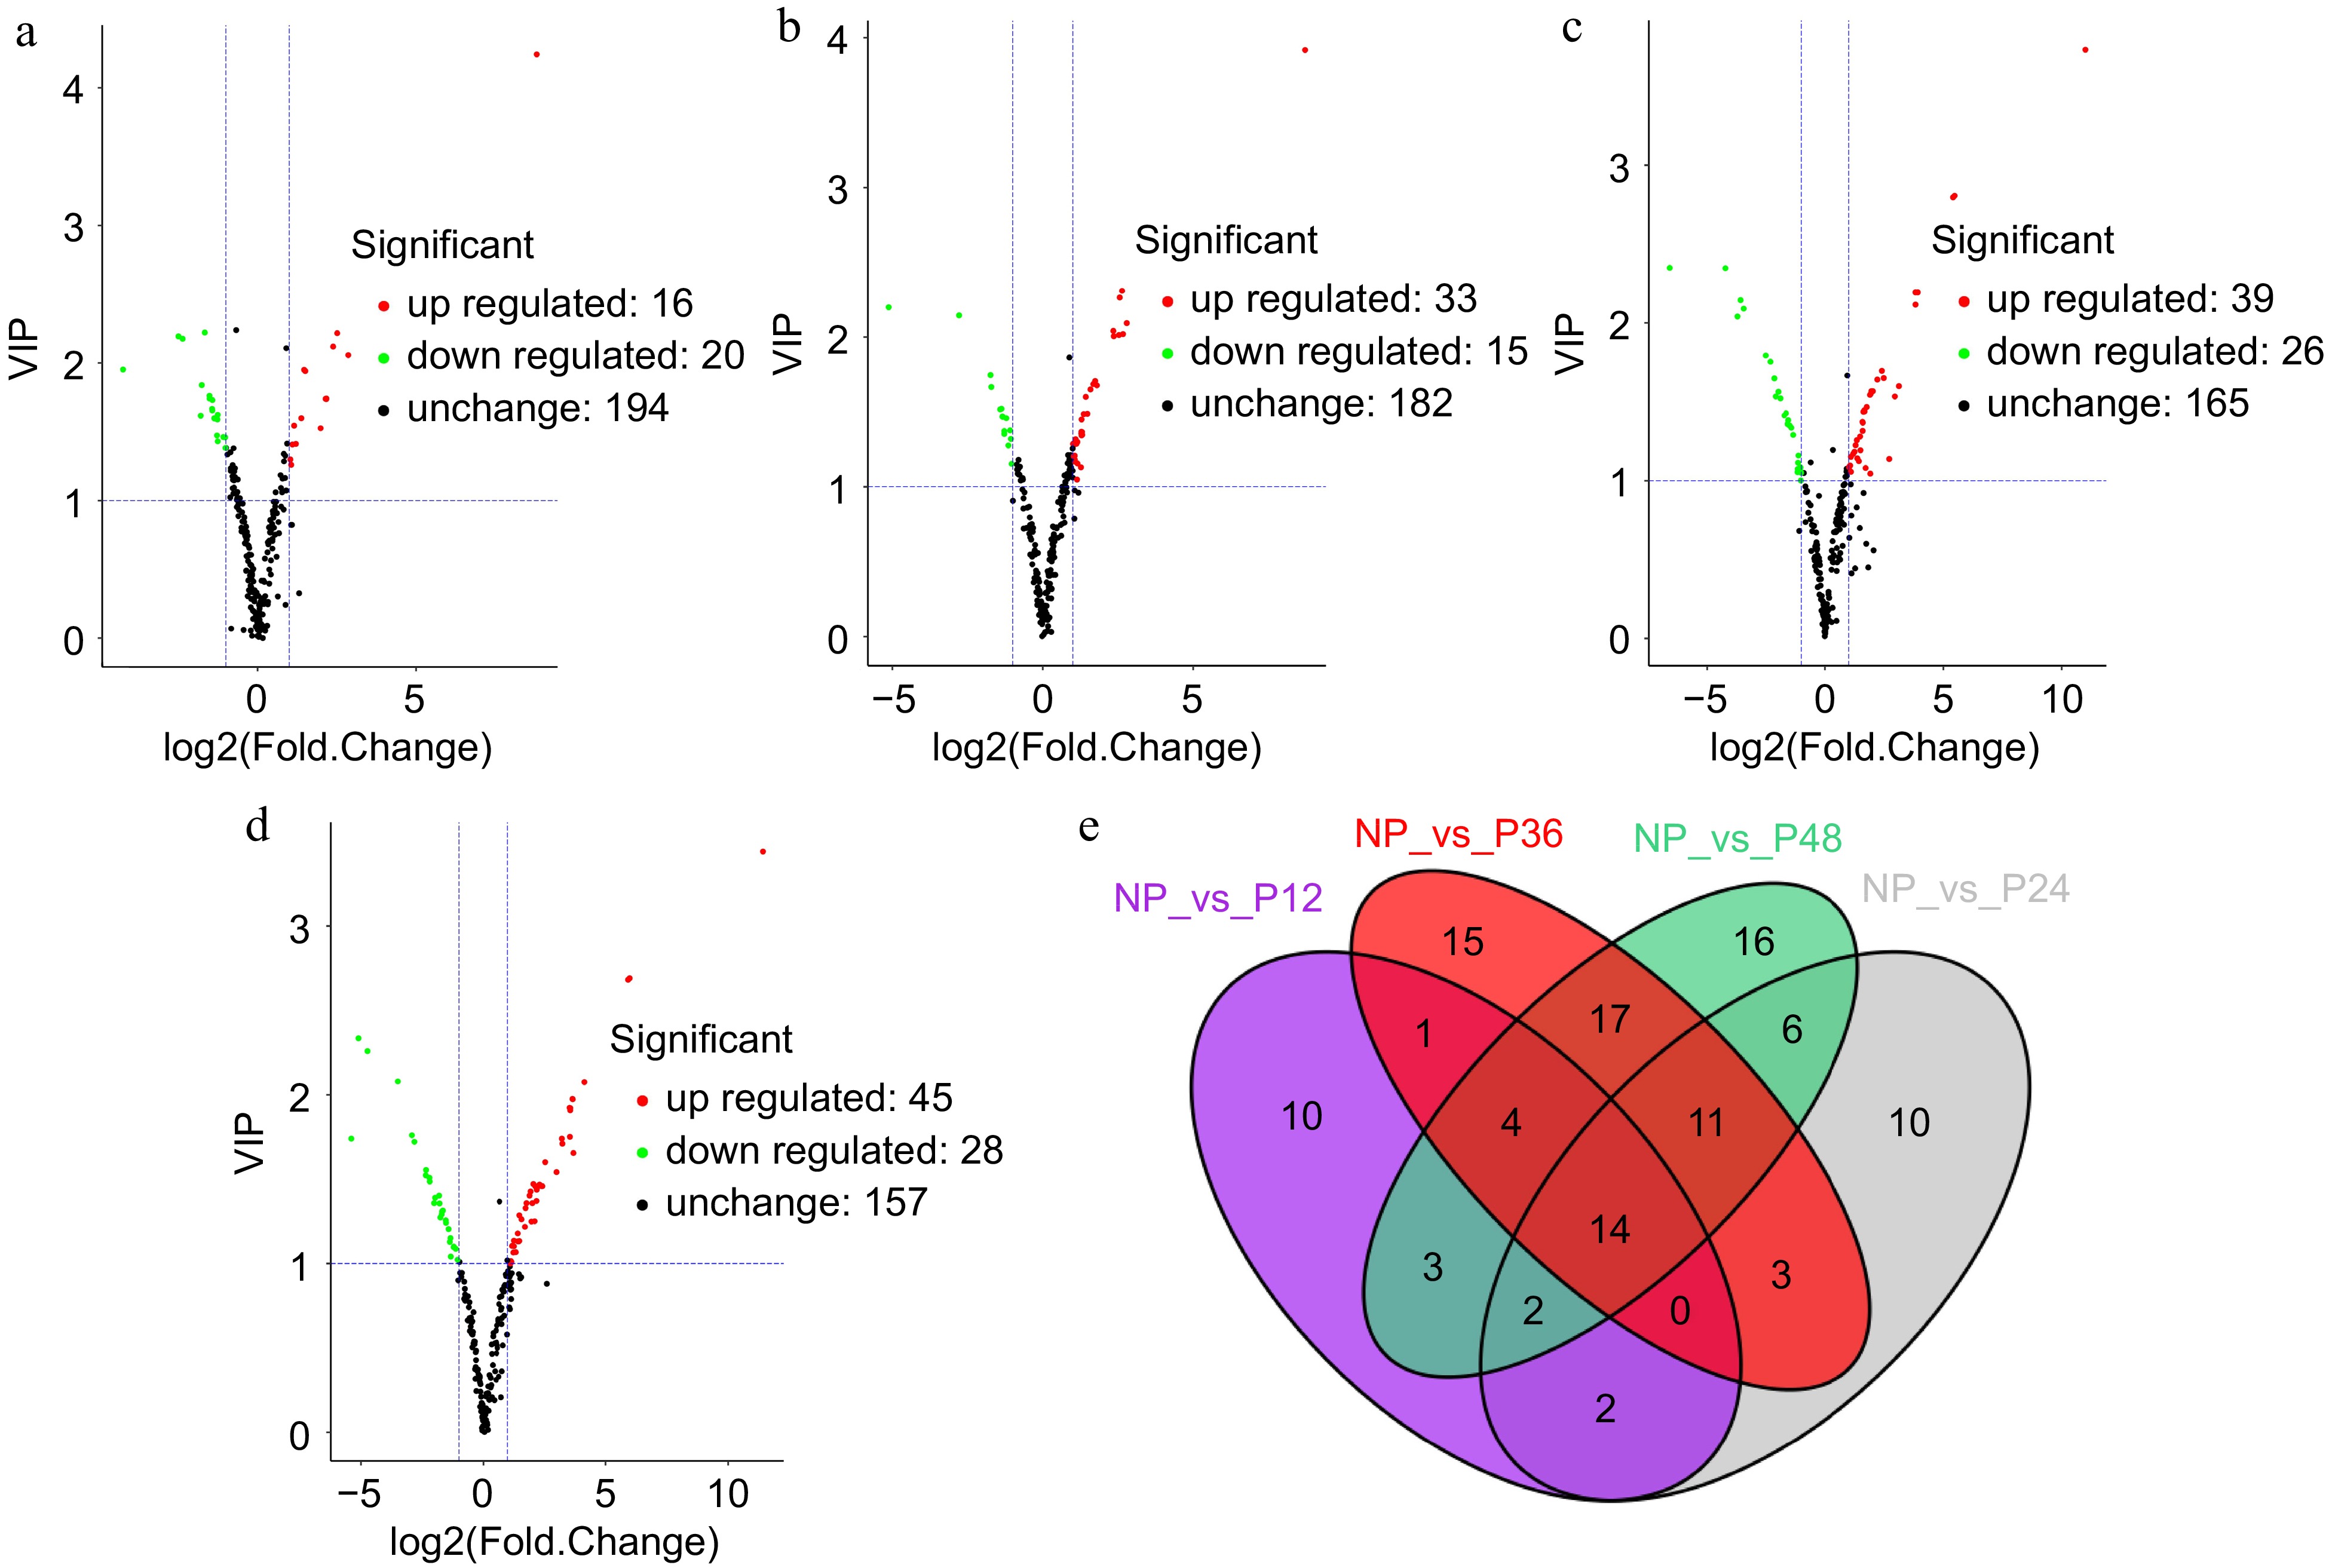
Figure 2.
Volcano plot and venn diagram of different metabolites. (a) NP and P12, (b) NP and P24, (c) NP and P36, and (d) NP and P48. (e) Venn diagram showing the shared and specific metabolites between the four compared groups.
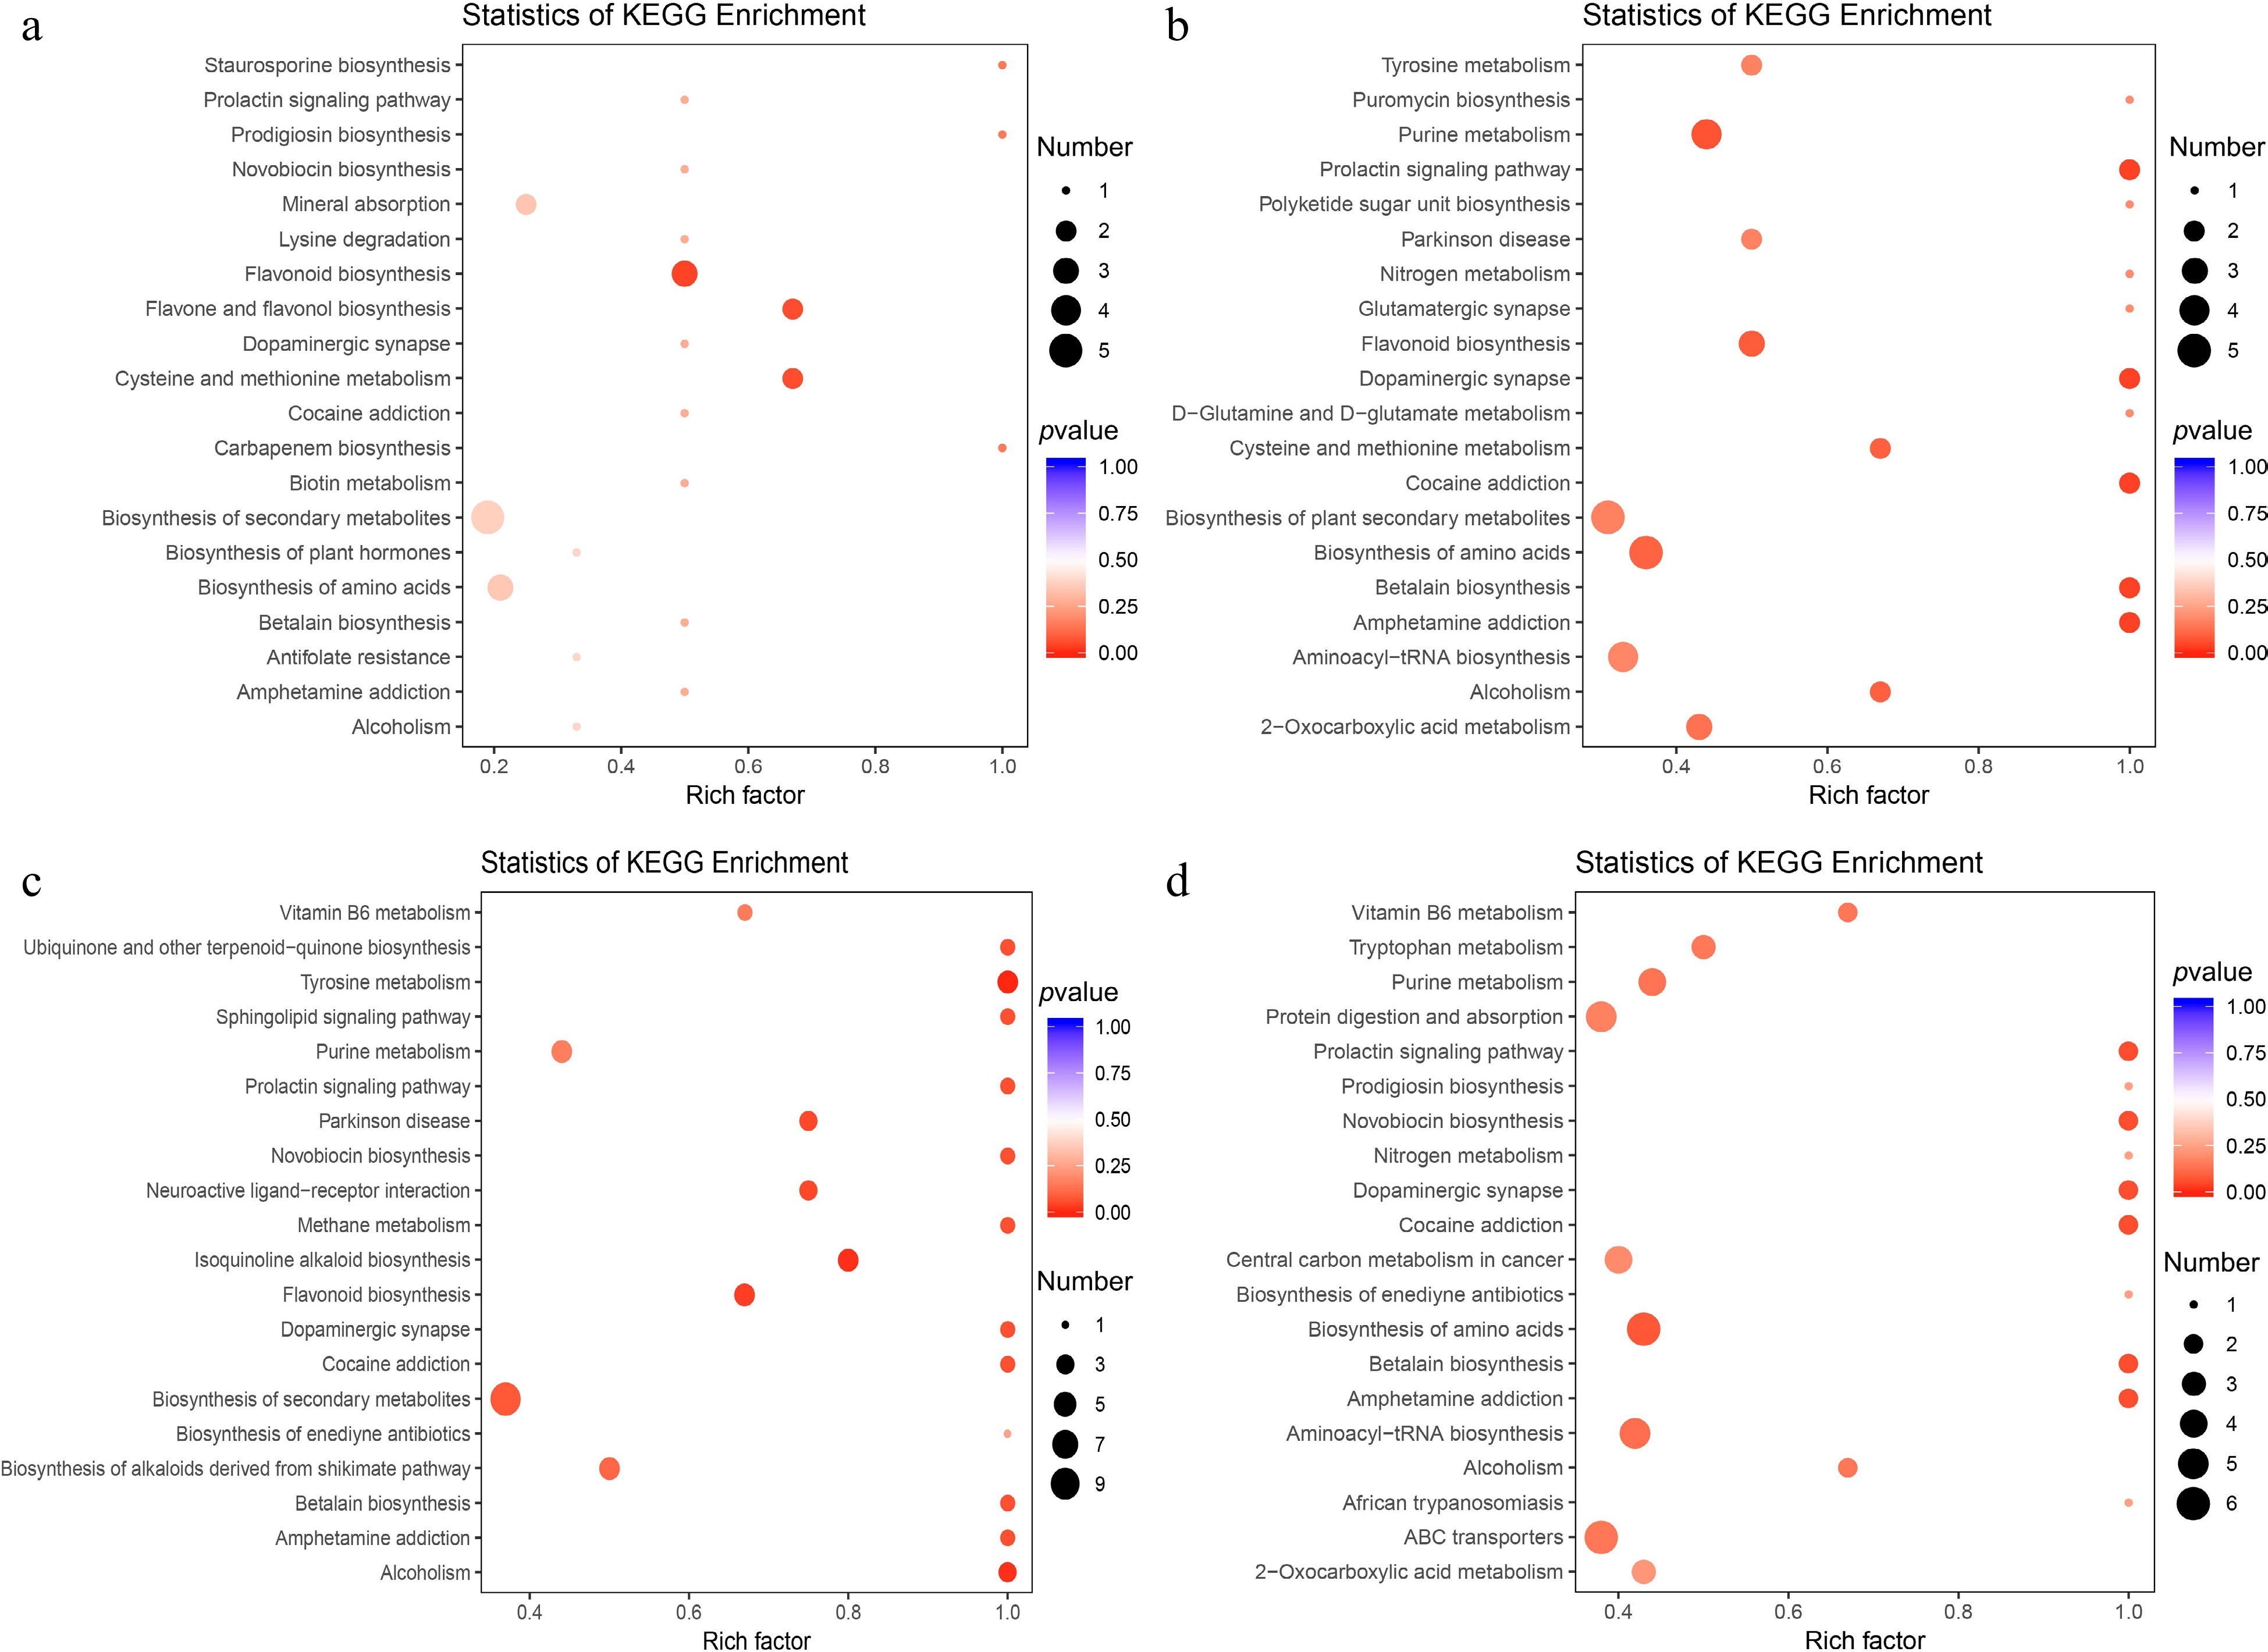
Figure 3.
KEGG pathway enrichment analysis of the differential metabolites between: (a) NP and P12, (b) NP and P24, (c) NP and P36, and (d) NP and P48.
Differential metabolites of flavonoids in lips before and after pollination of C. floribundum
-
There are mainly the following eight kinds of flavonoids were detected in the lips before and after pollination: flavonols, flavonoid, flavanols, anthocyanins, dihydroflavone, flavonoid carbonoside, isoflavones, and chalcones (Supplemental Table S5). The analysis of the content of these eight flavonoids compounds before and after pollination found that flavonoids, flavonoid carbonoside, isoflavones were the highest in the lip before pollination, and these levels gradually decreased after pollination (Fig. 4a). The content of anthocyanins showed the most obvious change and the content gradually increased after 12 h after pollination and reached the highest at 48 h after pollination (Fig. 4b). Anthocyanins mainly include the following eight kinds, cyanin chloride, petunidin 3-O-glucoside, peonidin 3-O-glucoside chloride, cyanidin 3-O-malonylhexoside, pelargonidin 3-O-malonylhexoside, peonidin, jaceosidin and anthocyanin 3-O-beta-D-glucoside. By analyzing the changes in the content of these eight anthocyanins before and after pollination, it was found peonidin 3-O-glucoside chloride, cyanin chloride and cyanidin 3-O-malonylhexoside levels were the lowest before pollination, which gradually increased after pollination and reached the highest at 48 h after pollination. The content of anthocyanin 3-O-beta-D-glucoside was high before pollination, which gradually decreased after pollination (Fig. 4b).
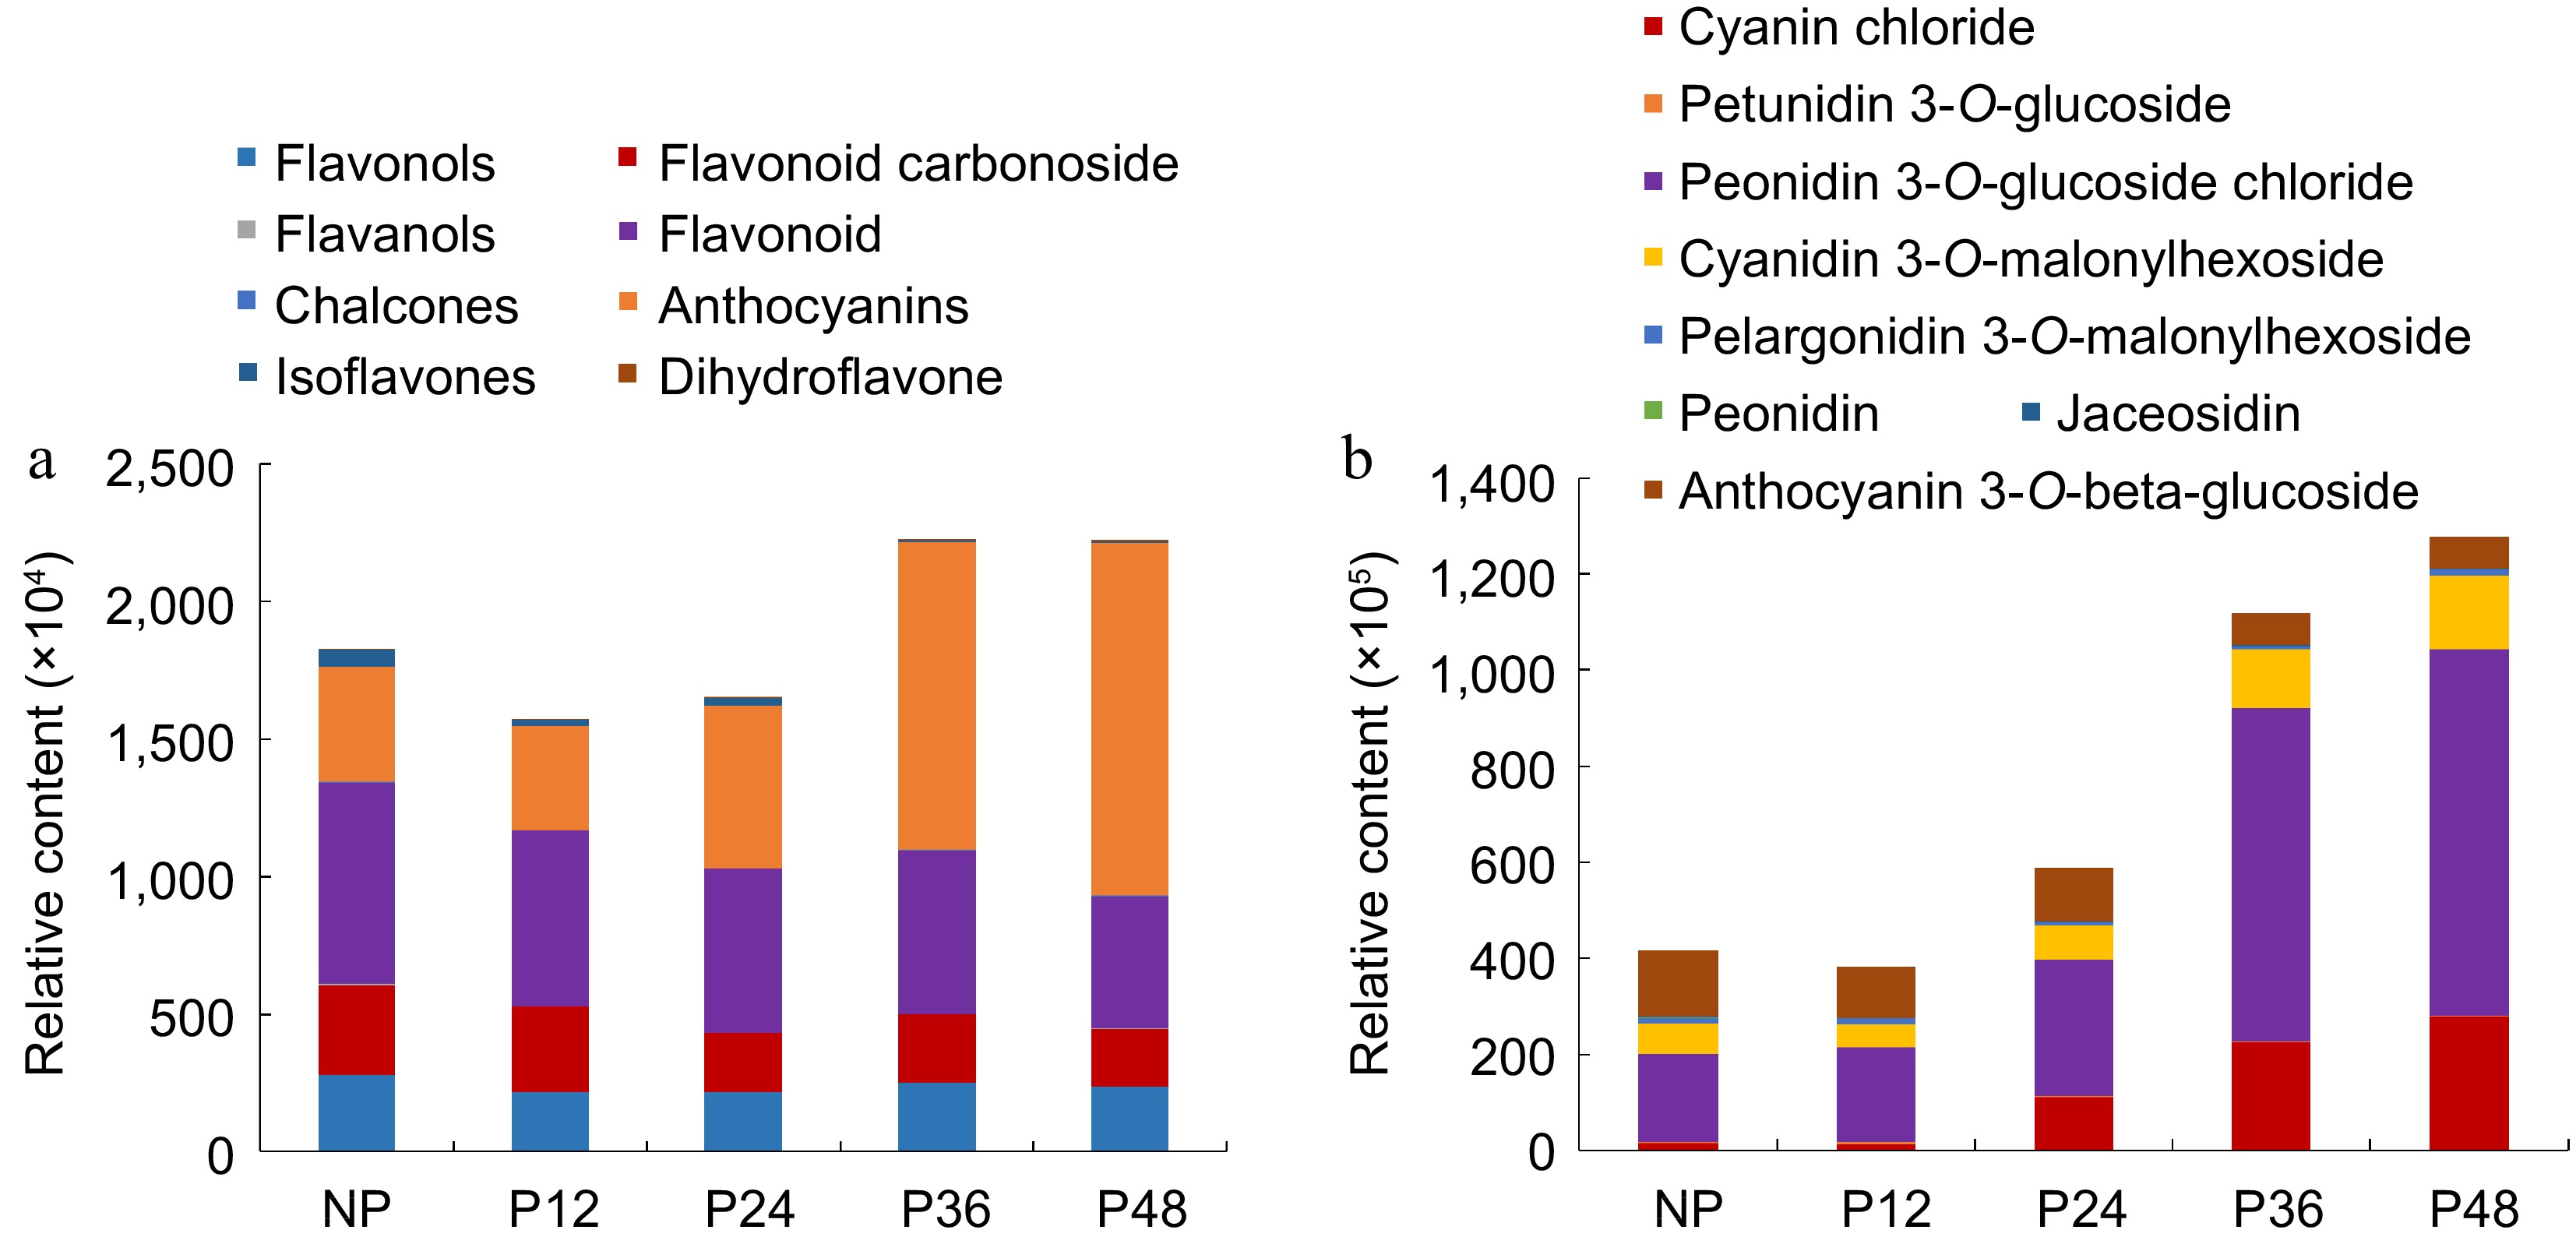
Figure 4.
The relative content of flavonoids and anthocyanins in the lips at various stages. (a) Eight kinds of flavonoids. (b) Eight kinds of anthocyanins.
Transcriptome analysis
Transcriptome sequencing and analysis of the lips before and after pollination of C. floribundum
-
A total of 18 cDNA libraries were constructed to explore the differences in the transcript levels in the lip before and after pollination. The transcriptome analysis generated 995,170,252 clean reads and a total of 106,983 unigenes were spliced by using the Trinity (Supplemental Table S6). 55,420 unigenes (51.8%) were successfully annotated with public databases Nr, Nt, Pfam, KOG, Swiss Prot, GO, and KEGG. A total of 52,396 DEGs were obtained comparing NP vs P6, NP vs P12, NP vs P24, NP vs P36, and NP vs P48 (Fig. 5a). Further, KEGG enrichment analysis was performed on the DEGs identified from different comparison groups to identify the major biological pathways enriched. The top 20 KEGG pathways with the most significant enrichment in the five comparison groups included phenylpropanoid biosynthesis (ko00940), flavonoid biosynthesis (ko00941), and flavonol and flavonol biosynthesis (ko00944) pathways are related to lip color changes (Fig. 5b–f).
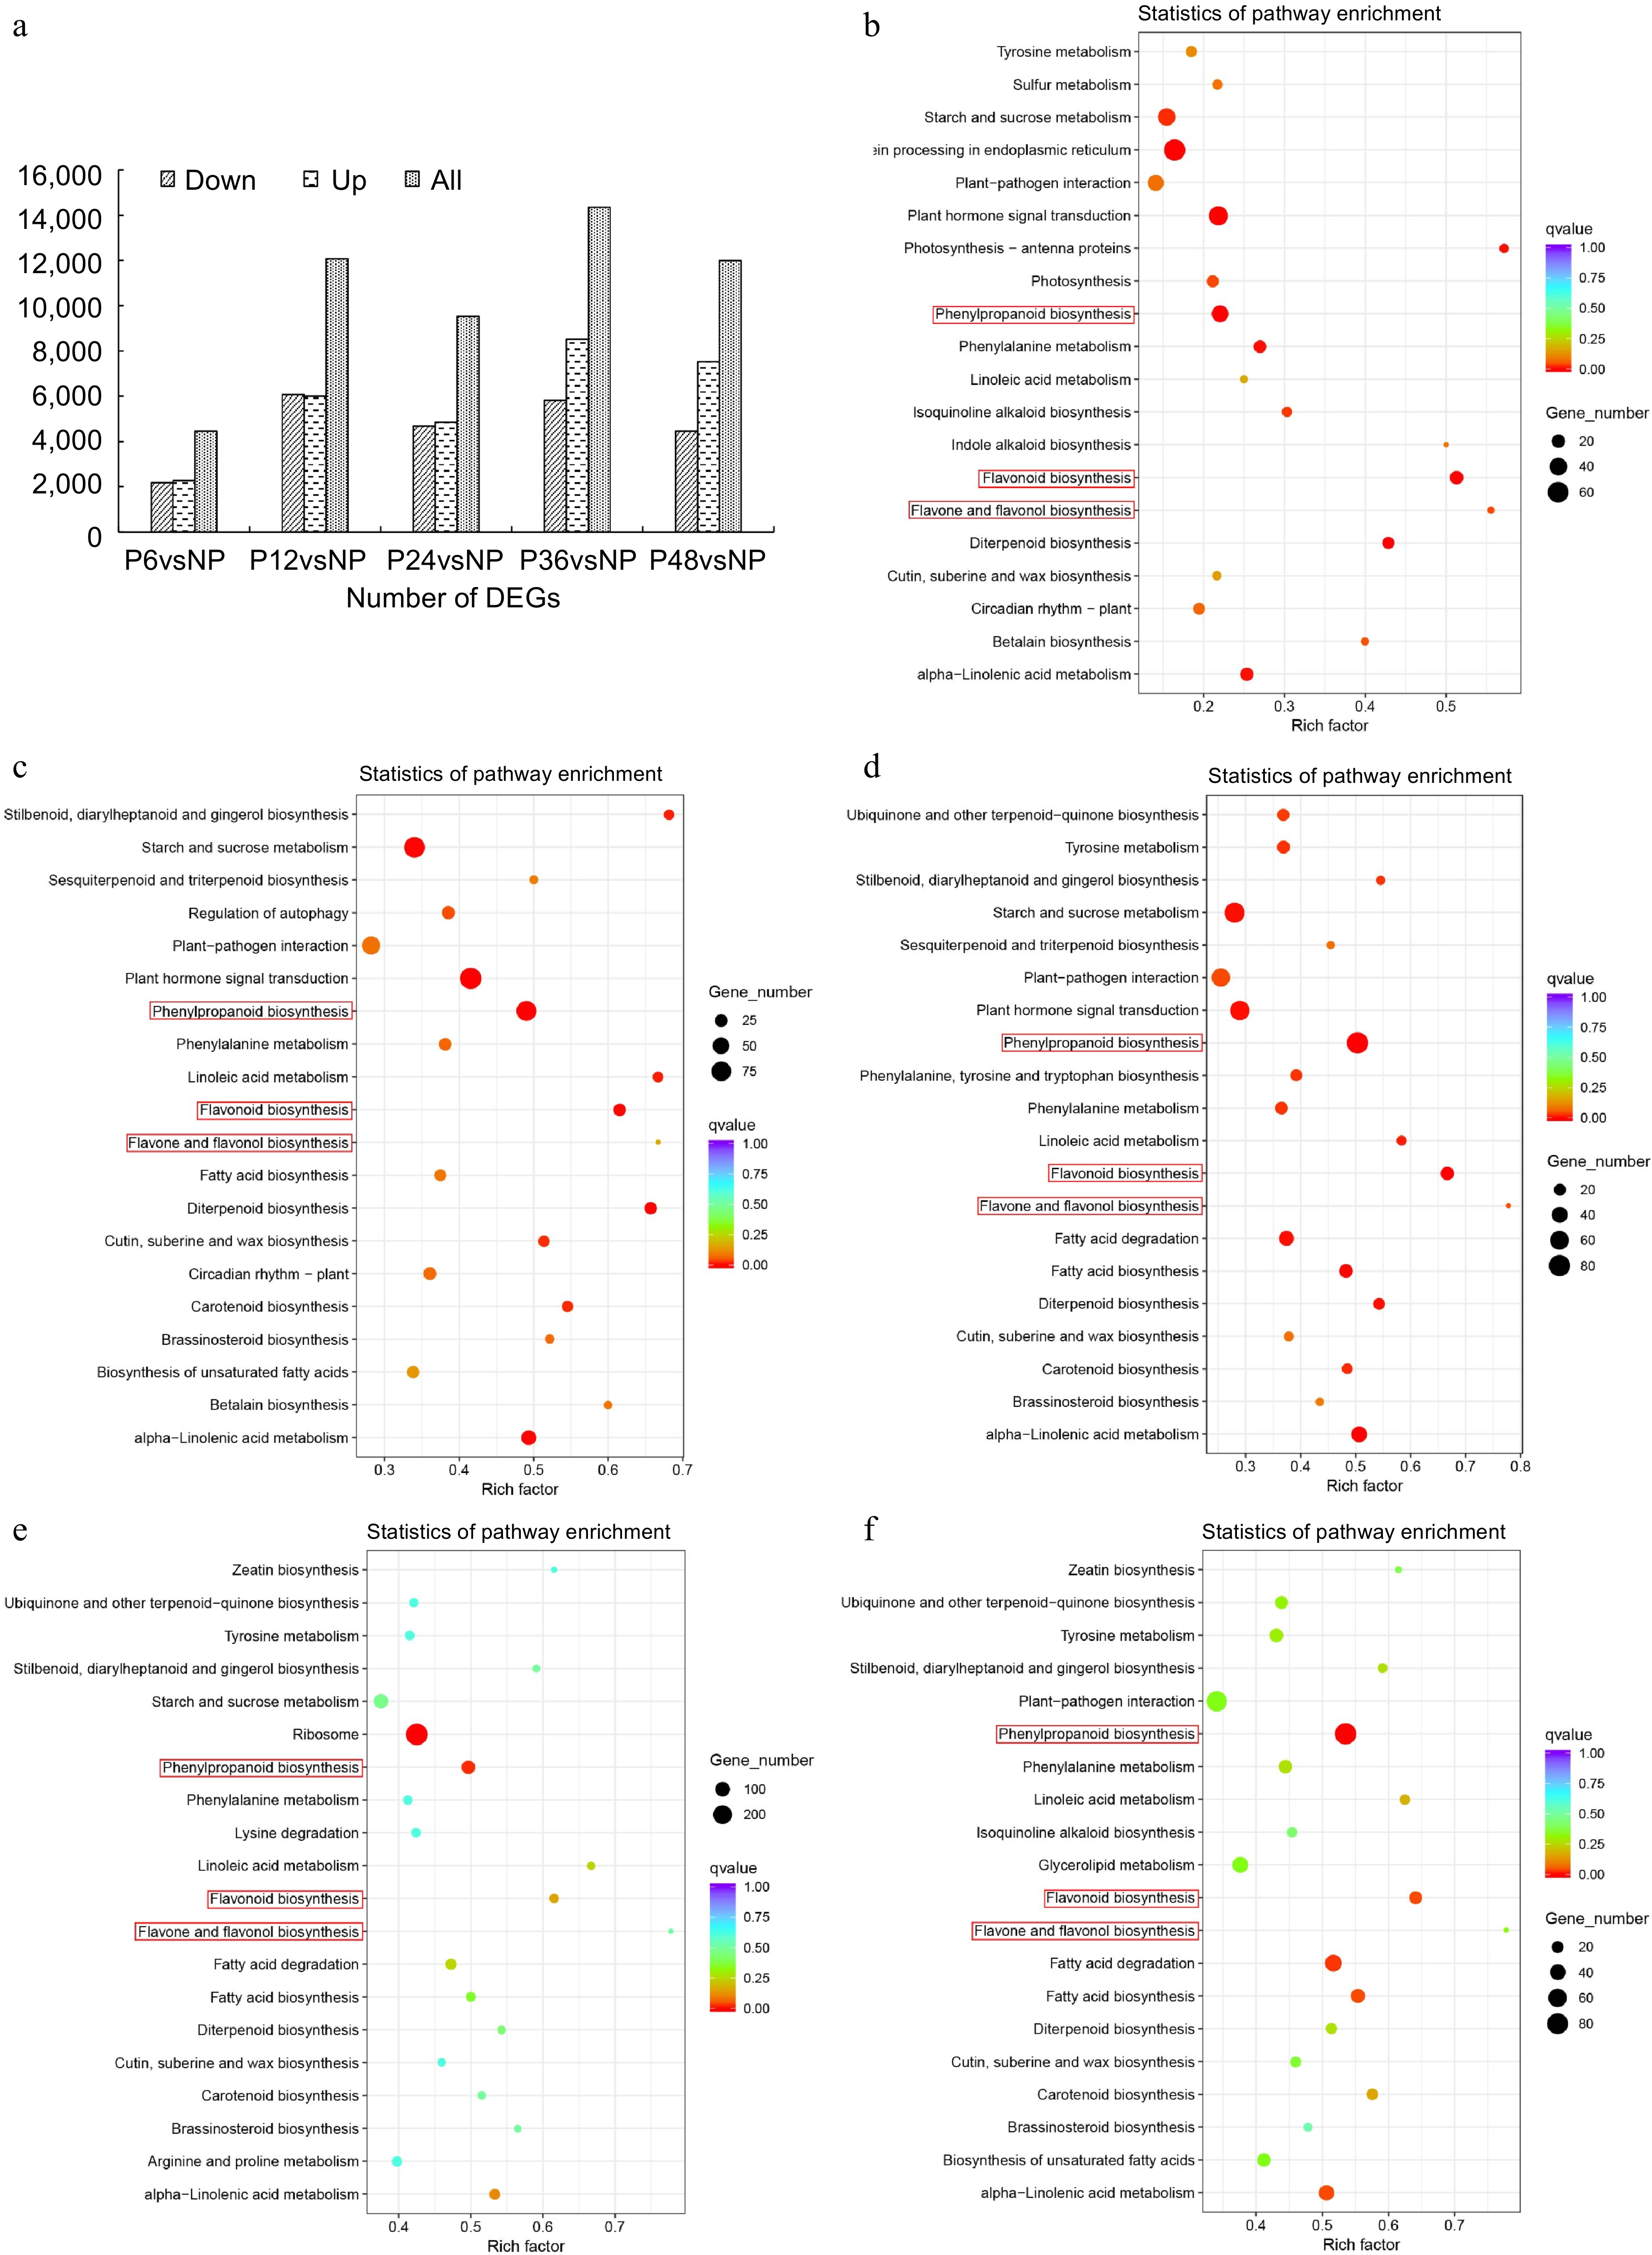
Figure 5.
Transcriptome analysis of lips before and after pollination in C. floribundum. (a) Number of DEGs among all comparison groups. KEGG pathway enrichment analysis of the DEGs between (b) NP and P12, (c) NP and P24, (d) NP and P36, (e) NP and P12, (f) NP and P48.
Screening of DEGs related to the anthocyanin biosynthesis pathway
-
Fourty three DEGs involved in the anthocyanin biosynthesis pathway (ABP) were screened out from the transcriptome database (Supplemental Table S7), and their expression patterns in lips before and after pollination in C. floribundum were analyzed. It can be seen that the expression of most ABP genes begins to increase after pollination (Fig. 6). The CfPALs, CfC4H1, CfCHSs, CfCHIs, CfDFRs, CfANSs, and CfF3H reached the highest level 12 h after pollination and then began to decline. The expression levels of all four CfF3'Hs increased after pollination, with the highest expression level at 24 h. The CfFLS and three CfUFGTs have the highest expression level at 36 h after pollination. The expression level of CfF3'5'H was the lowest before pollination and reached its highest level 48 h after pollination. Meanwhile, the expression levels of the four CfANRs were highest before pollination and decreased after pollination (Fig. 6). Previous studies have shown that ANR can inhibit the synthesis of anthocyanidin[19,20]. The expression of eight ABP genes were further analyzed by qRT-PCR. The expression patterns of these eight genes in the qRT-PCR analysis were consistent with their expression trends in the transcriptome analysis, indicating high accuracy and reliability of the transcriptome data (Supplemental Fig. S3).
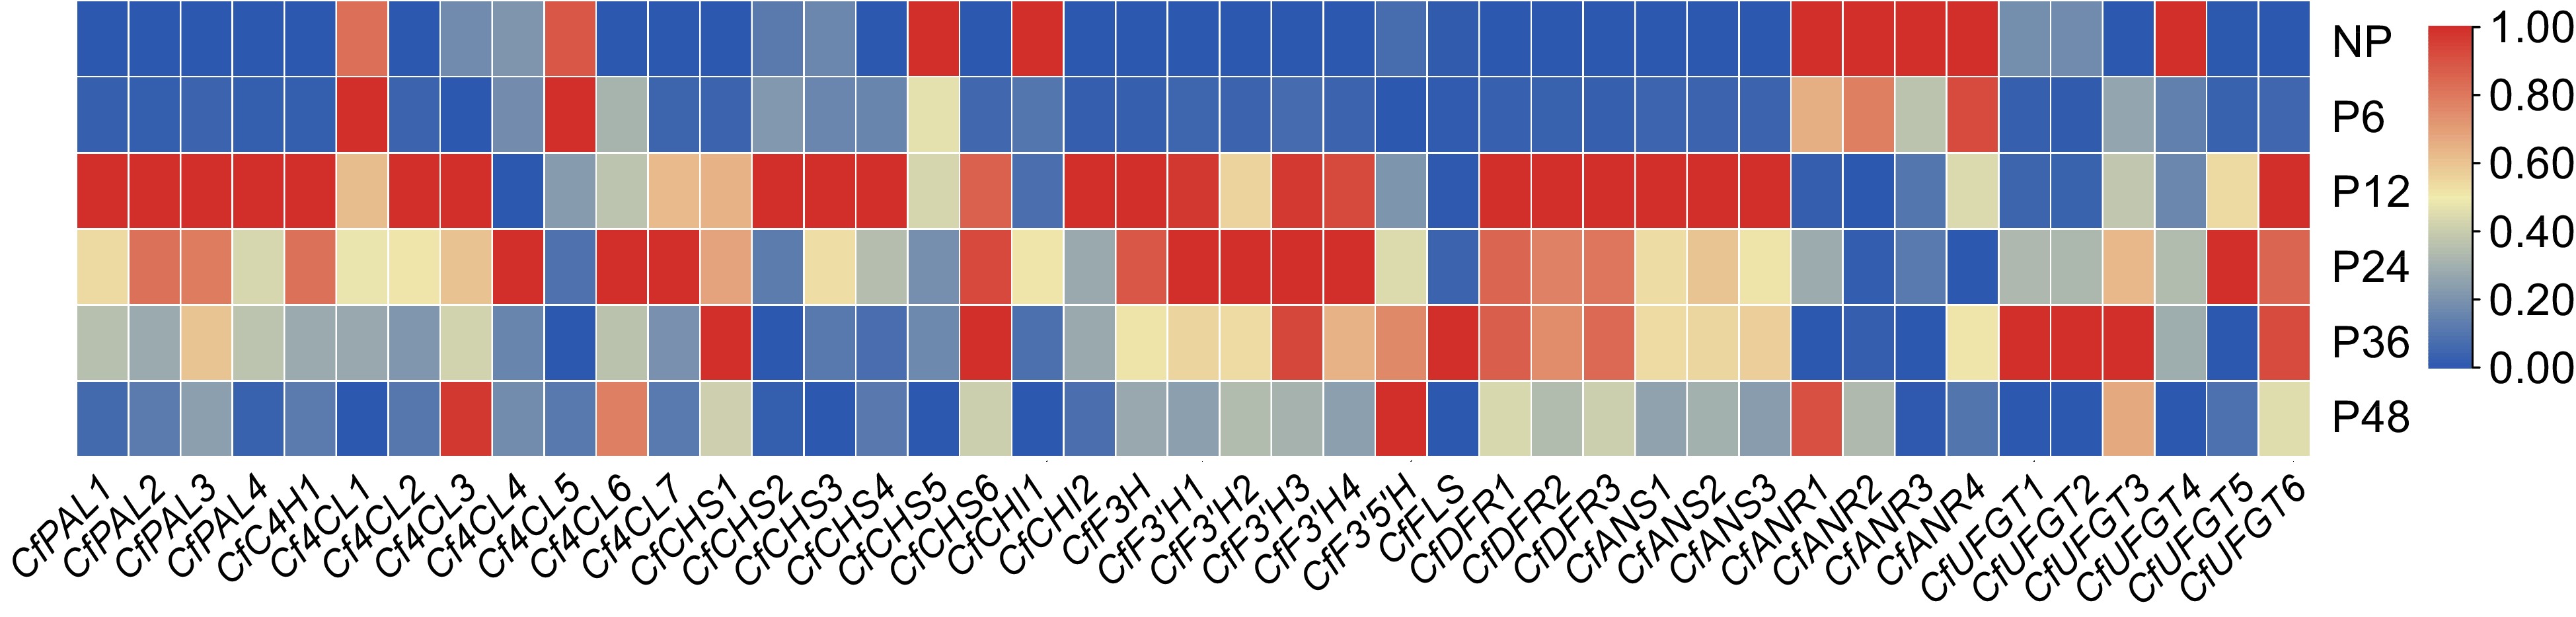
Figure 6.
Heat map of gene expression related to the anthocyanin biosynthesis pathway. A color bar is presented at the top right. Blue indicates low expression, and red indicates high expression.
Combined transcriptome and metabolome analysis
-
Combined the results of transcriptome and metabolomic analysis, the screened differential metabolites and genes were mapped to corresponding positions in the ABP, thus constructing a regulatory network for anthocyanin biosynthesis of lips before and after pollination in C. floribundum (Fig. 7). After pollination, phenylalanine is catalyzed by a series of enzymes such as PAL, C4H, CHI, and F3H to form the final anthocyanin product. The increased expression of ABP genes leads to the synthesis and accumulation of anthocyanins, resulting in the color changes in lips in C. floribundum.
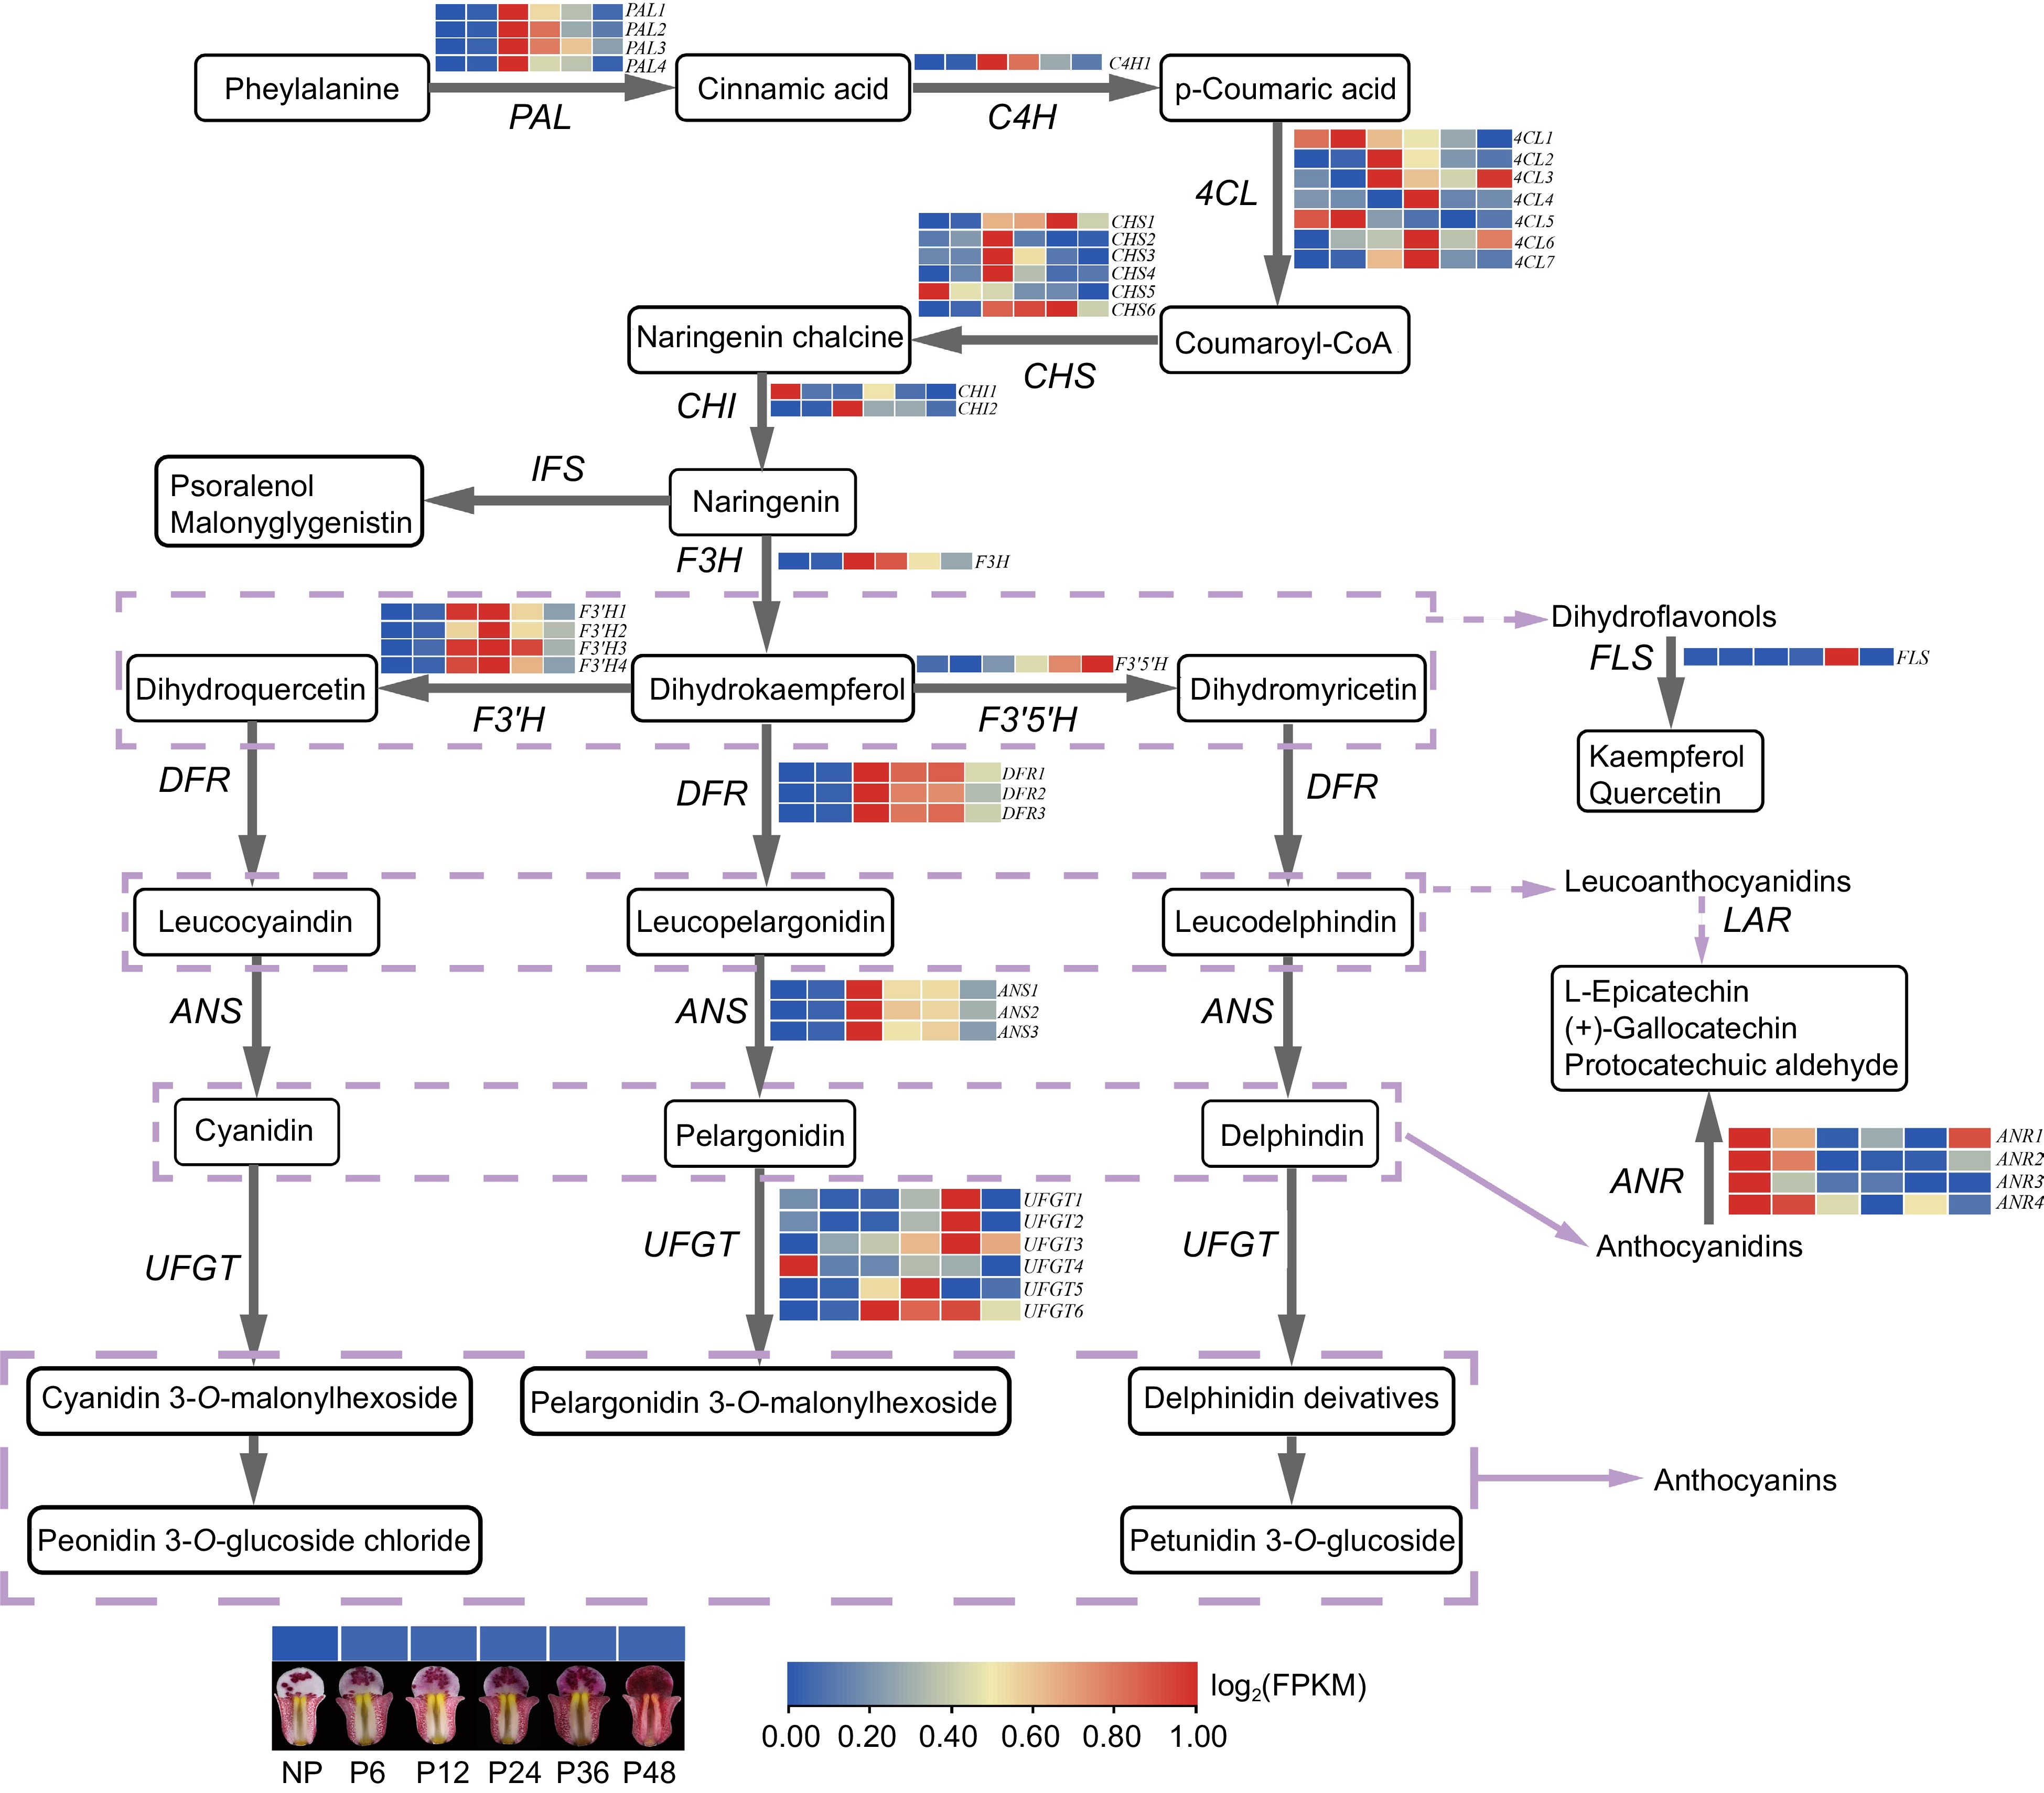
Figure 7.
The regulatory network of anthocyanin biosynthesis in lips before and after pollination in C. floribundum. PAL (phenylalanine ammonia-lyase); C4H (phenylalanine ammonia-lyase); 4CL (4-coumarate-CoA ligase); CHS (chalcone synthase); CHI (chalcone isomerase); F3H (flavanone 3-hydroxylase); F3'H (flavonoid 3'-hydroxylase); F3'5'H (flavonoid-3',5'-hydroxylase); FLS (flavonol synthase); DFR (dihydroflavonolreductase); ANS (anthocyanidinsynthase); UFGT (UDP-glucose: flavonoid-3-O-glycosyltranferase).
R2R3-MYB transcription factor identification in C. floribundum
-
The R2R3-MYB transcription factors (TFs) play an important role in anthocyanin biosynthesis, they typically act by regulating the expression of ABP genes[21−24]. In this study, 60 R2R3-MYB TFs were screened out from the transcriptome database of C. floribundum (Supplemental Table S8), and the phylogenetic tree was constructed (Fig. 8a). The correlation between the R2R3-MYB TFs and the ABP genes was predicted using the STRING database, and constructed a regulatory network using the Cytoscape software. The results showed that there was a regulatory relationship between three transcription factors (CfMYB1, CfMYB3, CfMYB4) and 11 ABP genes (CfPAL1, Cf4CL4, Cf4CL7, CfCHS6, CfCHI2, CfF3'H3, CfANS3, CfDFR2, CfFLS, CfUFGT1) (Fig. 8b). CfMYB1 may have regulatory relationship with CfANS3, CfCHI2, CfFLS, CfF3'H3, CfCHS6, CfUFGT1 and CfDFR2. CfMYB3 may have a regulatory relationship with CfF3'H3, CfFLS, CfCHS6, Cf4CL4, CfPAL1, CfUFGT1, CfDFR2, CfANS3 and CfCHI2. CfMYB4 may have a regulatory relationship with CfCHS6, CfDFR2, CfANS3, CfCHI2, CfFLS, and CfF3'H3. Through the analysis of the phylogenetic tree and co-expression network of R2R3-MYB, it was inferred that CfMYB1, CfMYB3 and CfMYB4 may be the main TFs promoting lip color change in C. floribundum after pollination.
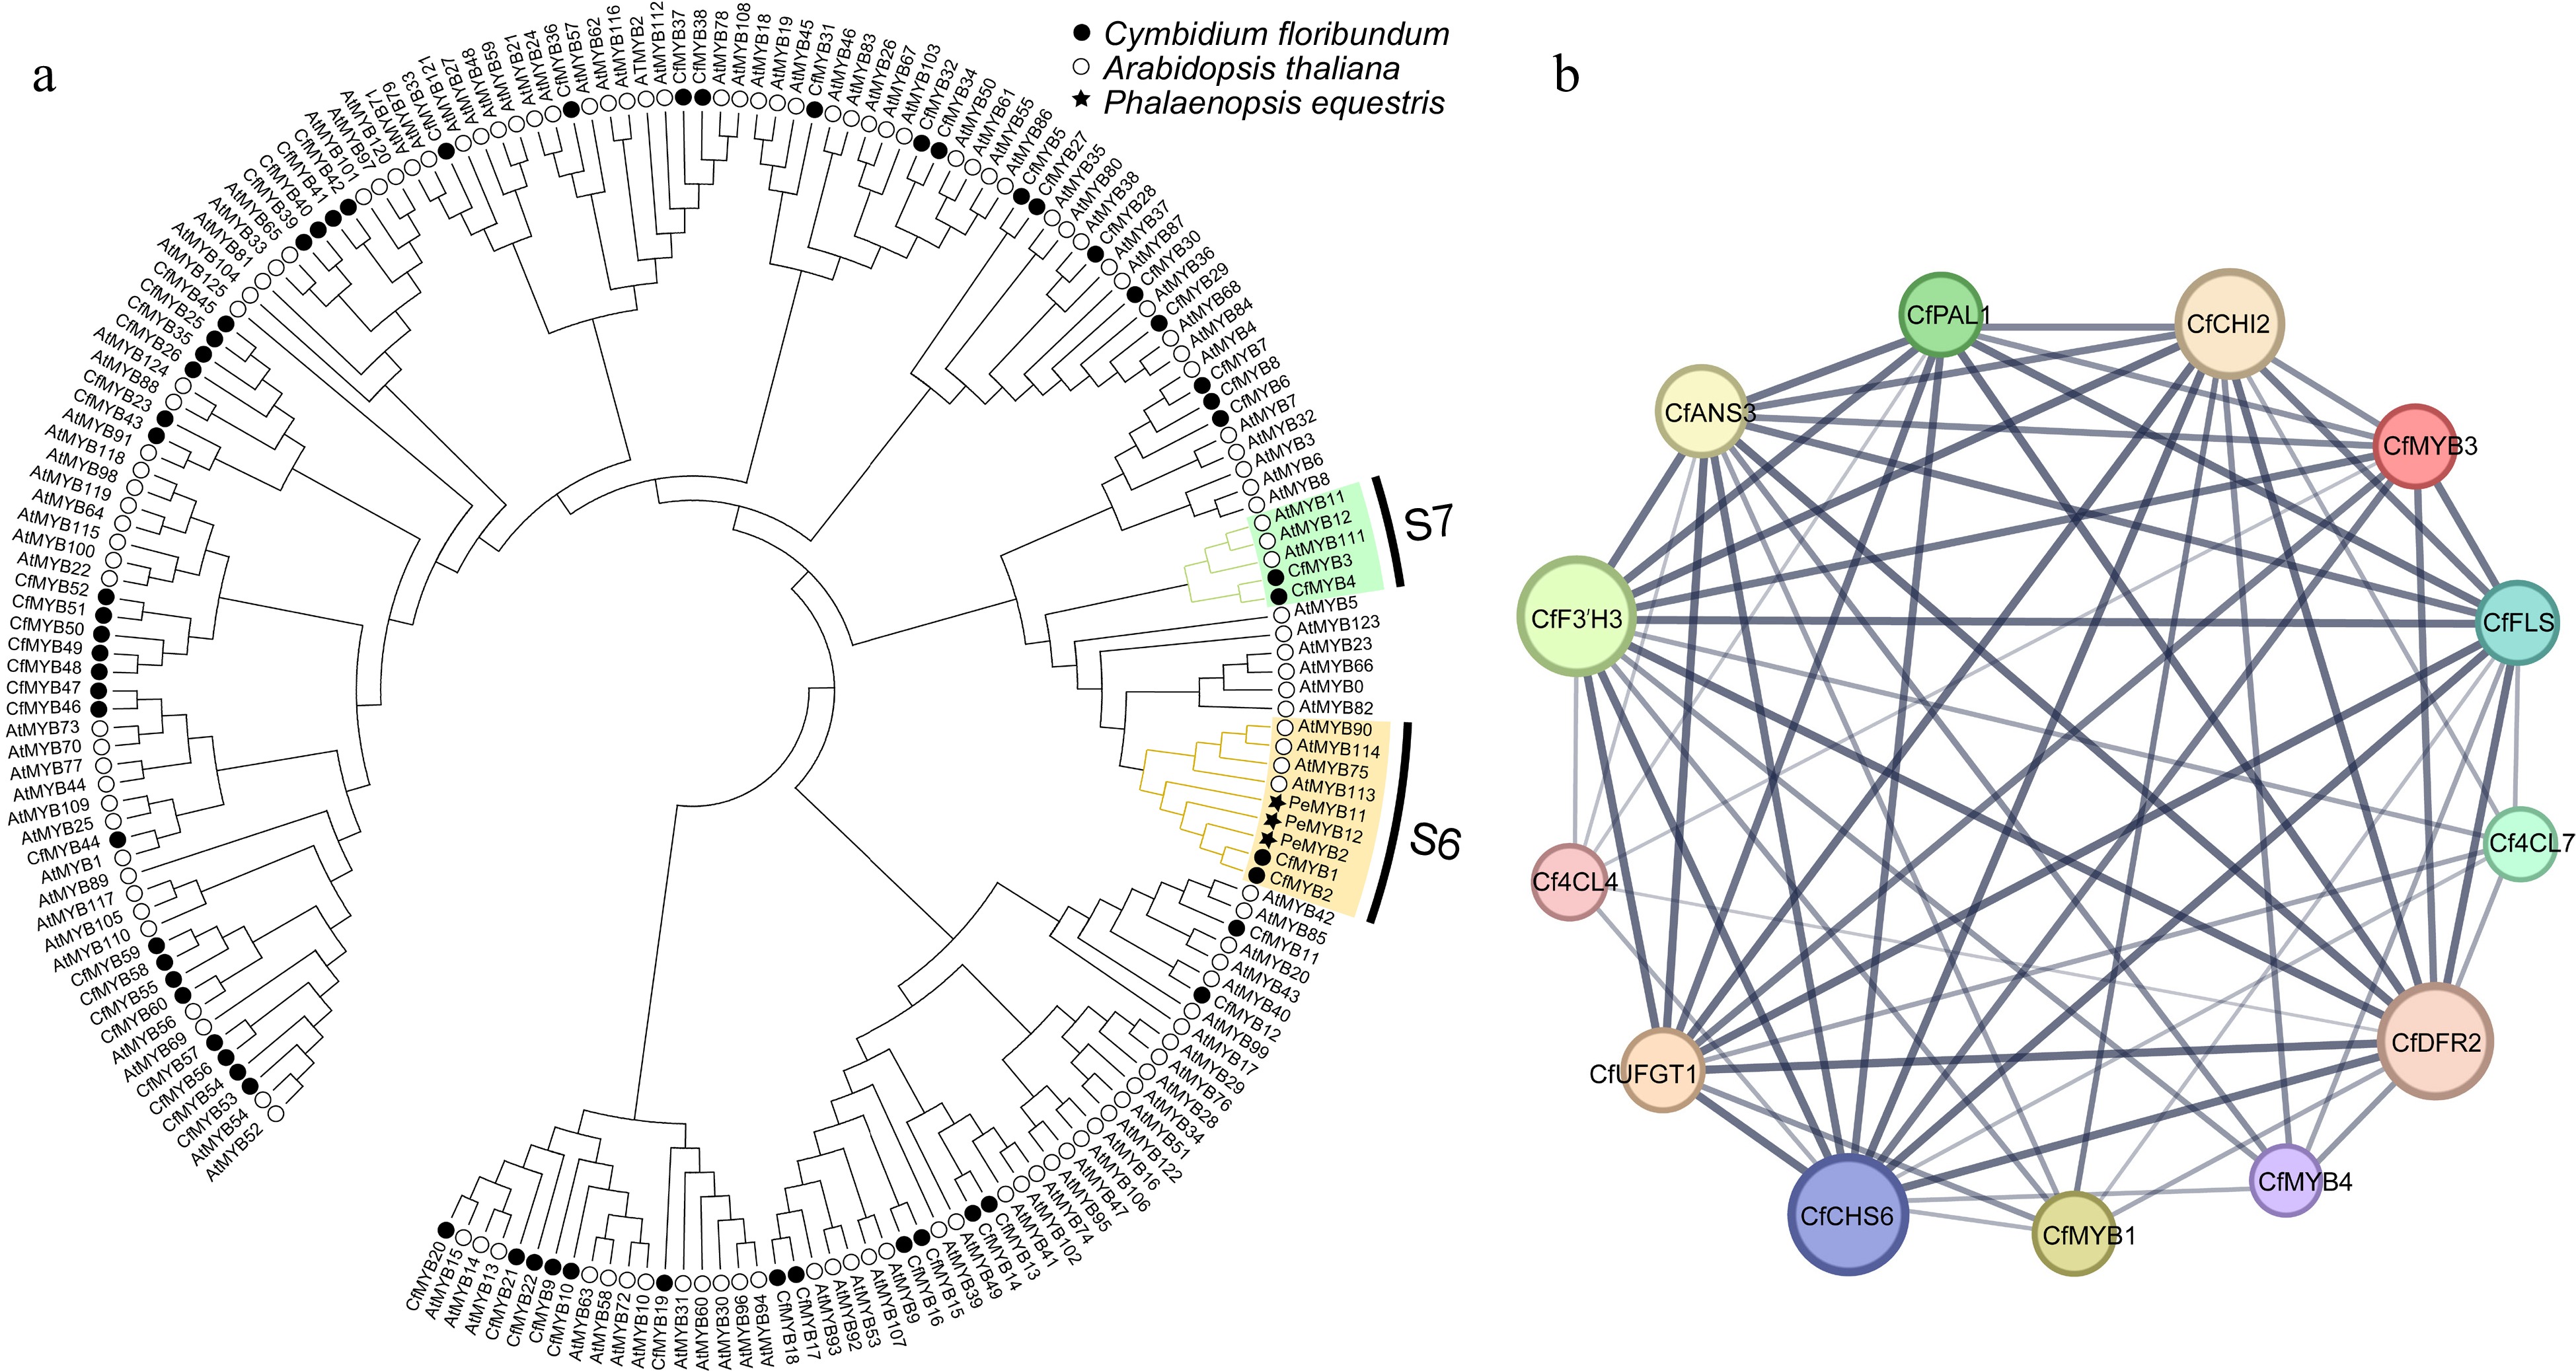
Figure 8.
Phylogenetic tree and co-expression network map of R2R3-MYB in C. floribundum. (a) NJ phylogenetic of R2R3-MYB protein sequence of C. floribundum. (b) The co-expression network interaction map between R2R3-MYB TFs and ABP genes. Circles represent different node genes. The straight lines represent the regulatory relationship between genes; the larger the circle, the greater the number of genes co-expressed with the gene.
Subcellular localization of CfMYB1, CfMYB3 and CfMYB4 proteins
-
As shown in Fig. 9, the GFP fluorescence signal of pCAMBIA1302-CfMYB1-GFP was significantly detected in the nucleus, while pCAMBIA1302-CfMYB3-GFP and pCAMBIA1302-CfMYB4-GFP both showed GFP fluorescence signals in the nucleus and cytoplasm, indicating that CfMYB1 was located in the nucleus, while CfMYB3 and CfMYB4 were located in the nucleus and cytoplasm.
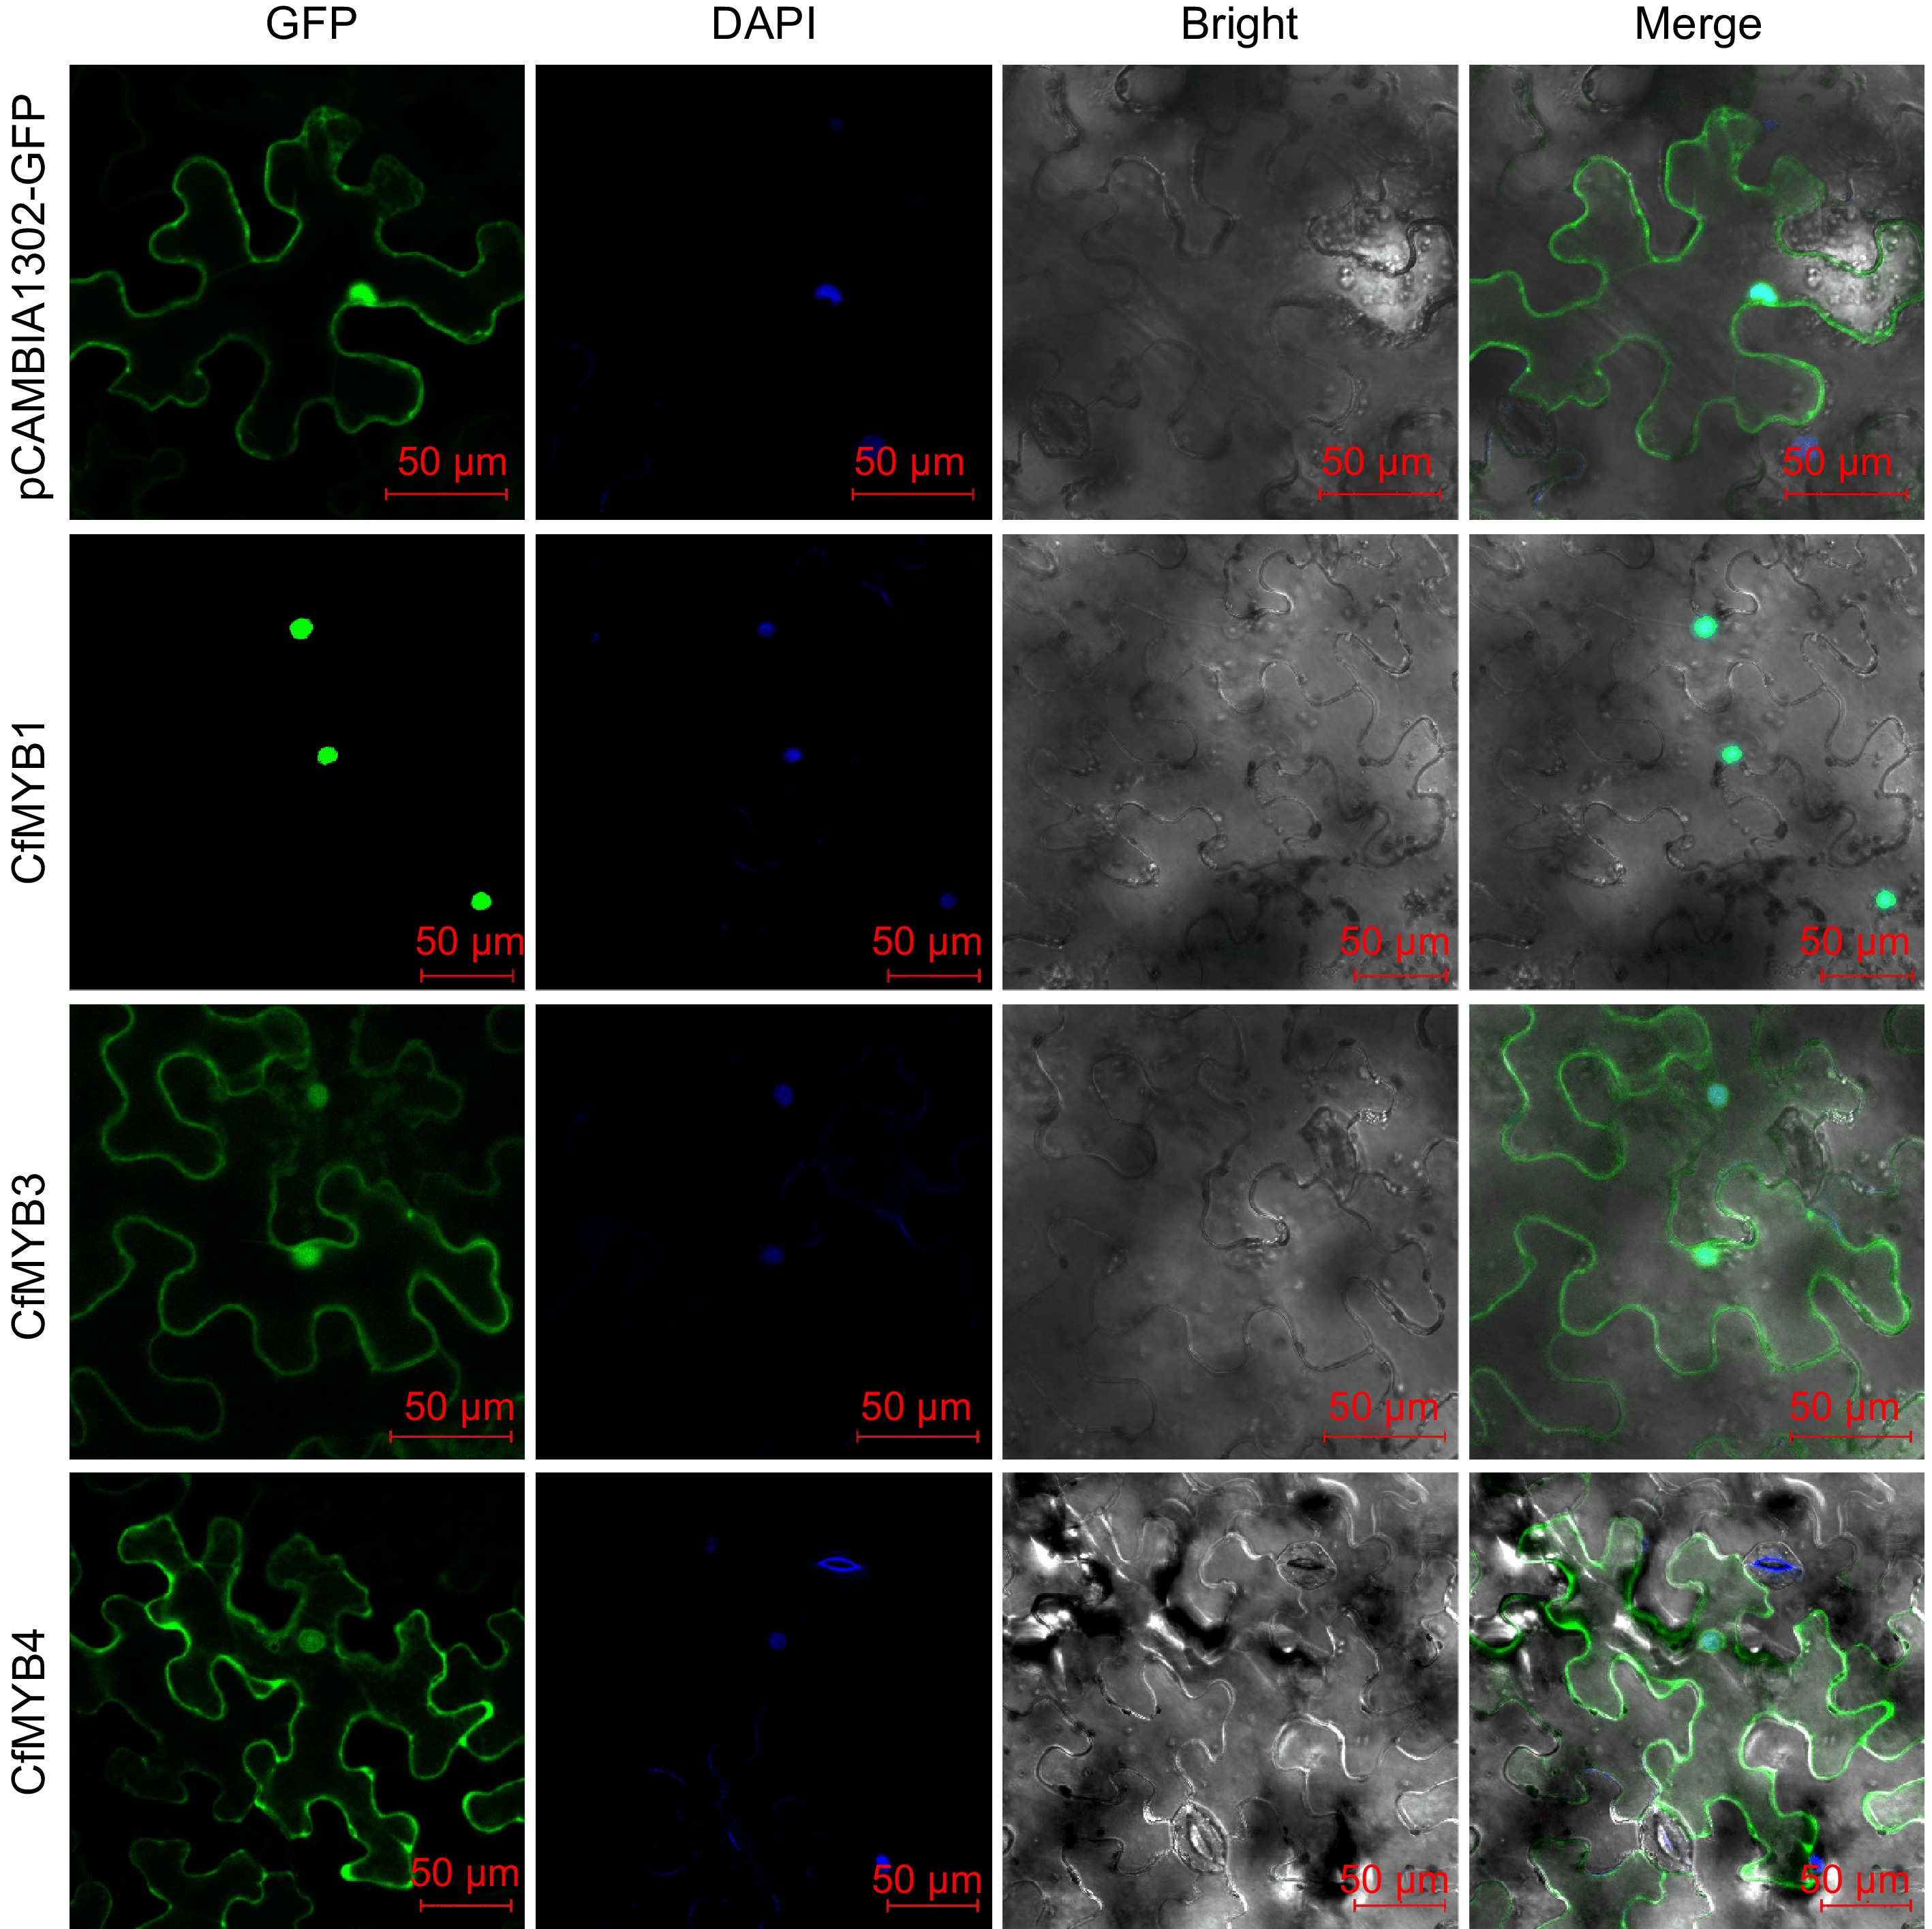
Figure 9.
Subcellular localization of CfMYB1, CfMYB3, and CfMYB4 proteins. GFP is green fluorescent protein. DAPI is blue fluorescent dye that can penetrate cell membrane. Bright is bright field. Merge is the superposition field of green fluorescence, bright field and blue fluorescent field of cell membrane.
Transgenic verification of CfMYB1, CfMYB3, and CfMYB4
-
To verify the biological functions of CfMYB1, CfMYB3 and CfMYB4, Agrobacterium containing recombinant plasmids were injected into the white petals of Phalaenopsis for transgenic validation. The results showed that there were obvious purple-red regions on the petals overexpressing CfMYB1 (Fig. 10a), while the overexpression of the empty vector did not change the color of the perianths (Fig. 10d). However, the overexpression of CfMYB3 and CfMYB4 resulted in slightly green (Fig. 10b & c), indicating that CfMYB1 can promote the synthesis and accumulation of anthocyanidin in the white petals of Phalaenopsis. To further verify the role of CfMYB1, CfMYB3 and CfMYB4, the expression of related genes (PeCHS, PeCHI, PeF3H, PeF3'H, PeF3'5'H, PeDFR, PeANS) in the anthocyanidin synthesis pathway of transgenic Phalaenopsis petals were analyzed. The results showed that the expression levels of PeCHI, PeF3H, PeF3'H, PeF3'5'H, PeDFR, and PeANS were significantly upregulated in the OE-CfMYB1 lines (Fig. 10f). In the OE-CfMYB3 lines and OE-CfMYB4 lines, the expression levels of most genes remained unchanged. These results indicated that CfMYB1 could activate ABP genes and promote purple-red pigmentation.
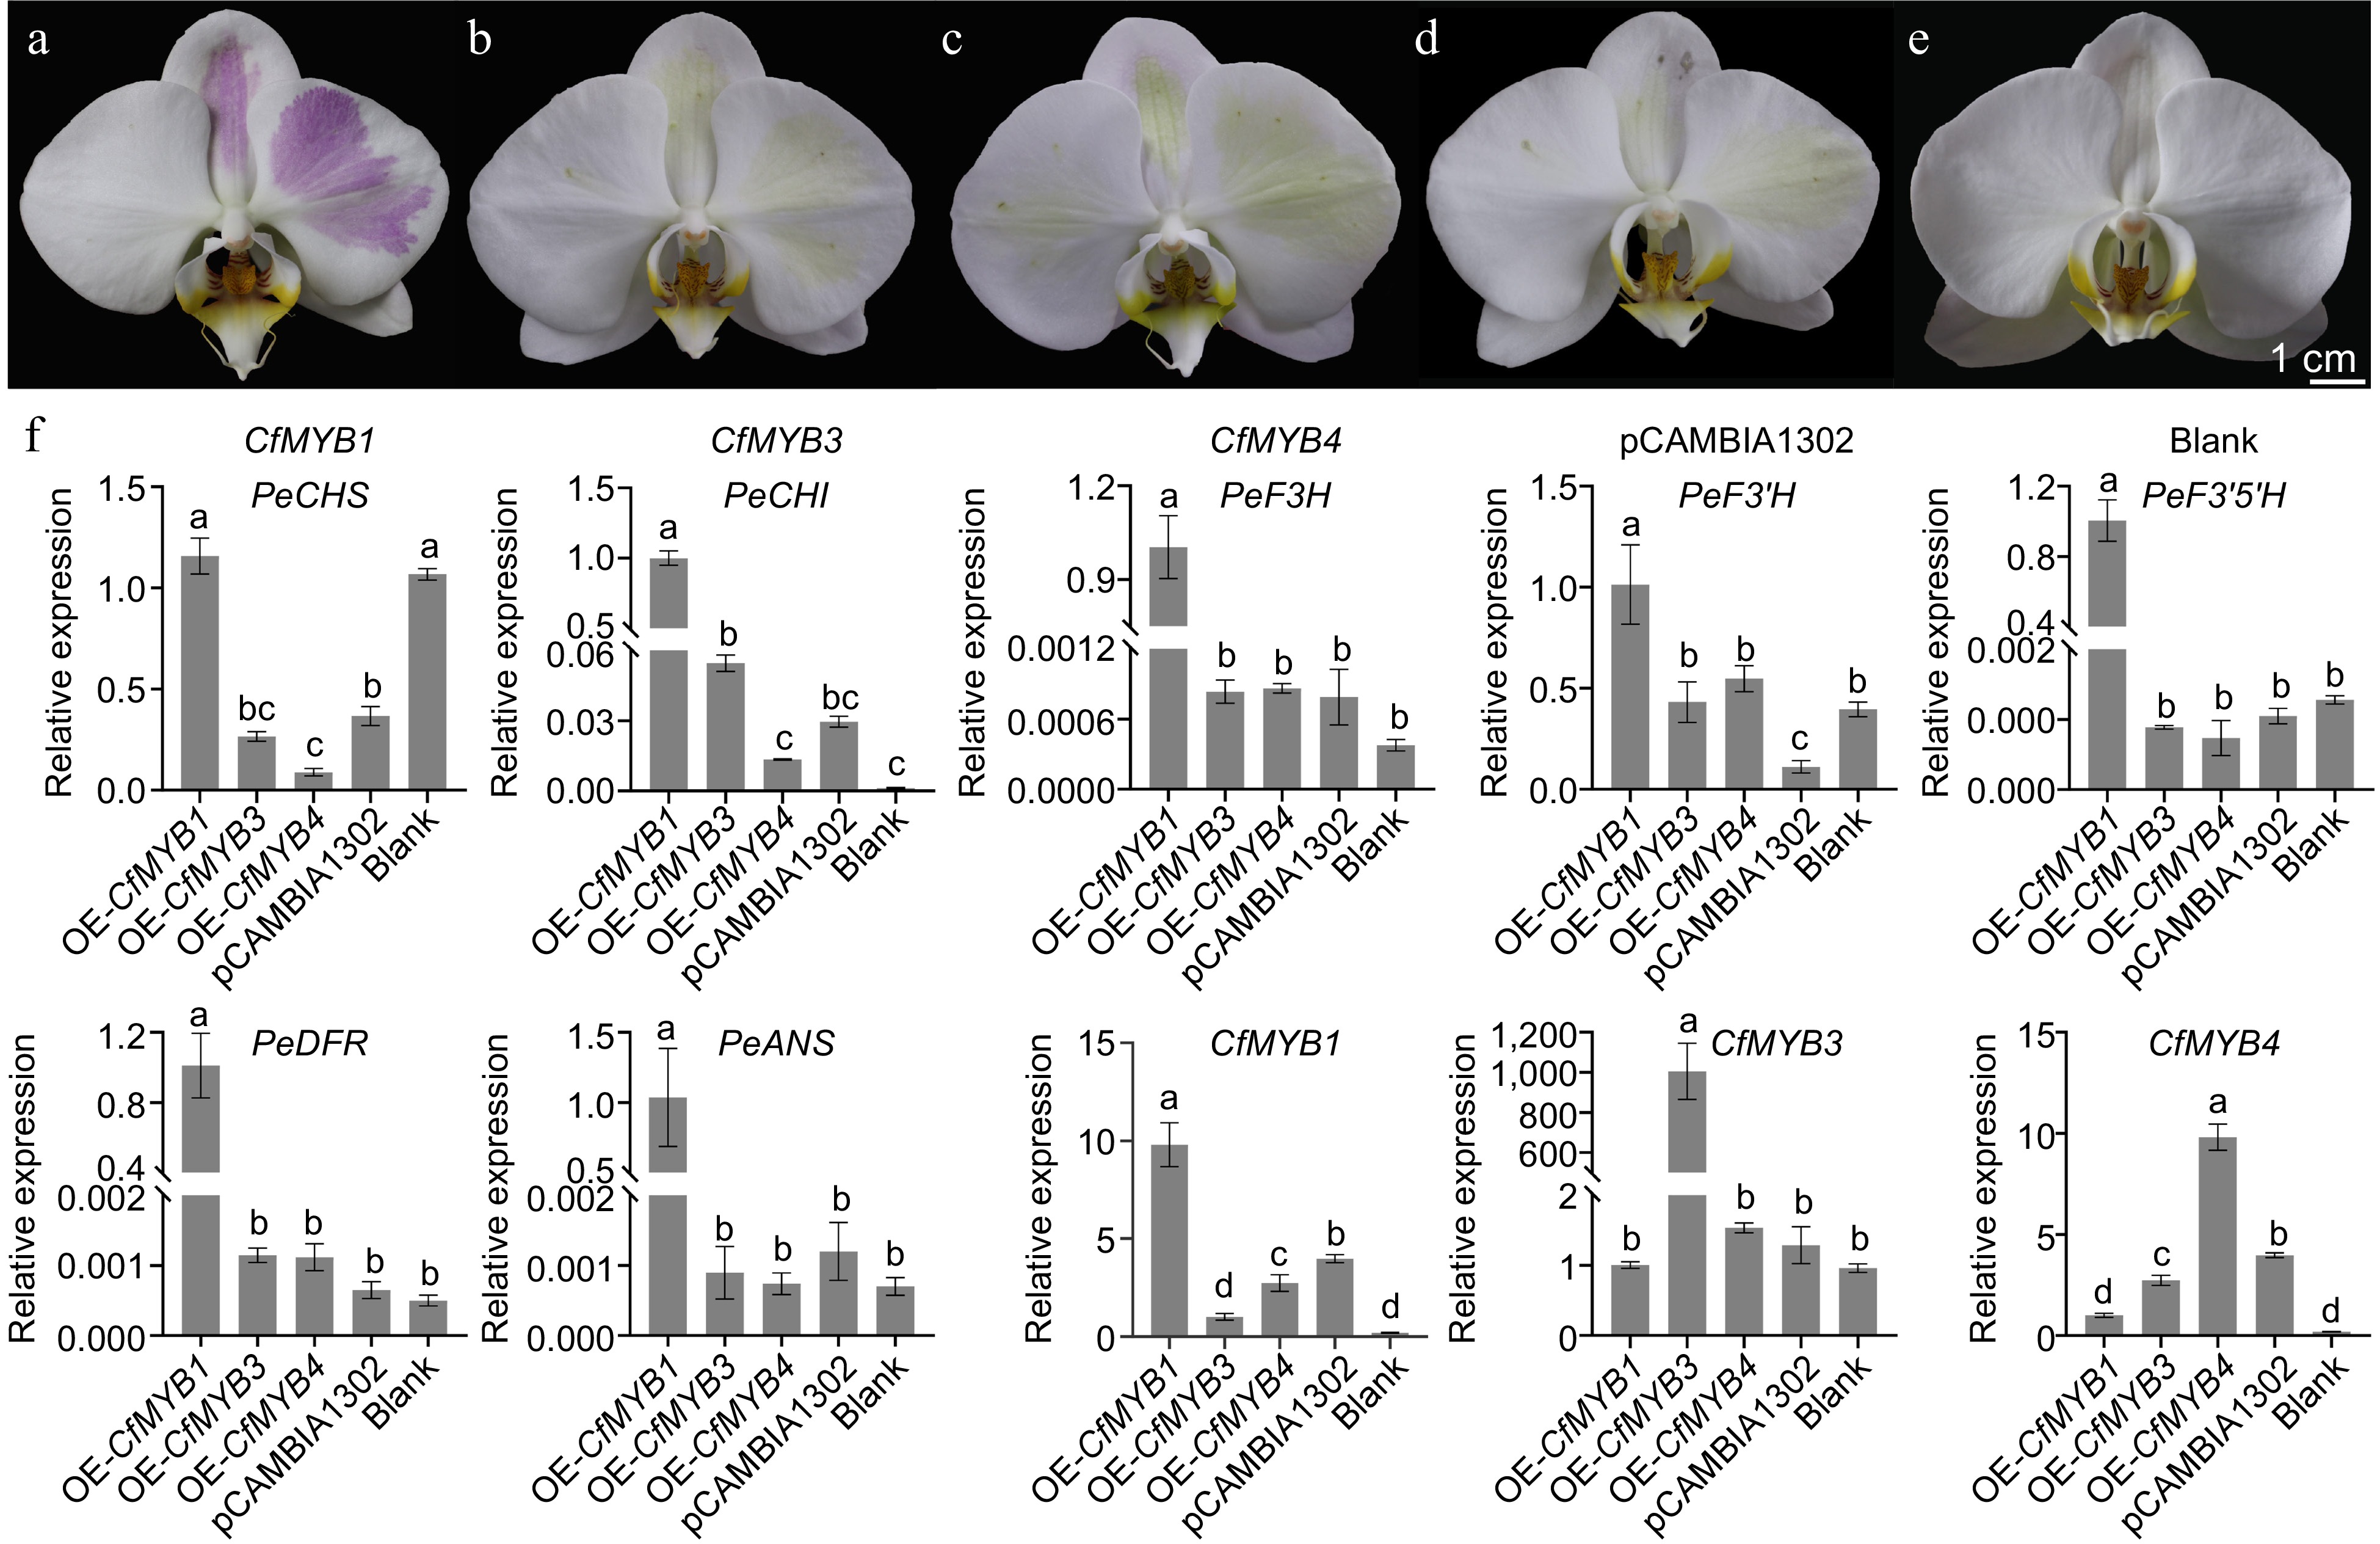
Figure 10.
The overexpression of CfMYB1, CfMYB3, CfMYB4 and the expression of anthocyanin synthesis related genes. (a)−(c) The plants overexpressing CfMYB1, CfMYB3, and CfMYB4, respectively. (d) The plants overexpression of the empty vector. (e) A normal plant without bacterial injection. (f) The expression of ABP related genes. The error bars in (f) indicate the standard deviation of three biological replicates, and the different letters represent significant differences (p < 0.05) based on Tukey's honestly significant difference test.
-
Variation in flower colors is an important trait considered for breeding new varieties of ornamental plants[25]. As an important secondary metabolite in plants, flavonoids have been found to play a key role in flower color formation[26]. Flavonoids can be divided into flavonols, flavones, isoflavones, anthocyanidins, flavanones, flavanols, and chalcones according to the structure[27]. Among them, anthocyanins are the most crucial color-developing flavonoid substances, which are closely related to flower color[28,29]. In this study, the metabolome analysis showed that the color change in lips was found to be related to the amount of flavonoids, particularly the anthocyanin content. A total of eight anthocyanin substances were detected, analysis of their content changes revealed that the peonidin 3-O-glucoside chloride, cyanin chloride, and cyanidin 3-O-malonylhexoside increased continuously with the deepening of the lip color after pollination, they may be the main pigment responsible for the changes in lip color after pollination.
The expression of ABP genes can directly determine the accumulation of anthocyanins[30−33]. CkCHS-1, CkDFR, and CkANS are the key genes involved in floral pigment accumulation in C. kanran[34]. In C. ensifolium it was found that the expression levels of ABP genes are closely related to the formation of the colorful perianth[35]. The same results have been reported in Phalaenopsis[36], Dendrobium[37], Vanda[38], Oncidium[39], Paphiopedilum[1], and so on. In this study, it was found that the expression levels of CfPAL, CfC4H, Cf4CL, CfCHS, CfCHI, CfF3H, CfF3'H, CfDFR, CfANS, and CfUFGT gradually increased after pollination, leading to a significant accumulation of anthocyanins and deepening of the purple-red color on the lips. Besides, the expression levels of four ANR genes were found opposite to that of anthocyanin content. Studies have shown that ANR, a gene that negatively regulates the anthocyanin metabolic pathway, has an important effect on the color of plants[40]. The ANR gene of Arabidopsis thaliana also called BANYULS (BAN), negatively regulates the color of the seed coat, and the lack of the ANR gene in A. thaliana increased the synthesis of anthocyanins[41]. MdANRs in apples inhibit the synthesis of anthocyanins in tobacco petals[20]. Therefore, it is hypothesized that the high expression of the ANR gene of C. floribundum before pollination may inhibit anthocyanin synthesis.
Furthermore, TFs can inhibit or activate the expression of target genes by combining with cis-acting elements in the promoter region of ABP genes[42]. R2R3-MYB is an important TF that regulates the synthesis of anthocyanins, especially the members belonging to S6 and S7 subfamilies, which can positively regulates anthocyanin biosynthesis[43−47]. A previous study showed that silencing of PeMYB2, PeMYB11, and PeMYB12 resulted in a loss of anthocyanin accumulation in P. equestris flowers[48]. In Cattleya hybrid 'KOVA', RcPAP1 and RcPAP2 might spatiotemporally regulate red color formation in flower segments during floral development[46]. DhMYB2 acts as the essential gene that positively regulates anthocyanin biosynthesis in sepals, petals, and mid-lobes of the labella of Dendrobium hybrids[49]. In C. goeringii, six R2R3-MYB genes can prompt anthocyanin accumulation in purple-red flowers[50]. CeMYB104 has been proved to be involved in the synthesis of anthocyanins in C. ensifolium[35]. Notably, CfMYB1 was belong to S6 and homologous to PeMYB2, PeMYB11, and PeMYB12, the transgenic verification assay showed that the overexpression of CfMYB1 leading to the accumulation of anthocyanin in the white petals of Phalaenopsis, indicating that CfMYB1 plays a positive regulatory role in the biosynthesis of anthocyanins in C. floribundum. In the future, CfMYB1 can be used as a genetic resource for color improvement and breeding of orchids. Besides, many studies have reported that MYB can interact with the bHLH and WD40 to form a MBW complex and activate the ABP genes[26]. By co-expression network analysis, CfMYB1 may act on the CfANS3, CfCHI2, CfF3'H3, and CfDFR2 to promote the synthesis of anthocyanin, which needs to be further clarified.
However, in the OE-CfMYB3 and OE-CfMYB4 lines, anthocyanin accumulation and the expression level of ABP genes were not obvious, their specific functions would still be further studied. It is hypothesized that these two genes need to form an MBW complex with the bHLH and WD40 to activate the ABP structural genes, which need to be tested in the future.
-
In conclusion, combined analysis of the transcriptome and metabolome shows that the peonidin 3-O-glucoside chloride, cyanin chloride, and cyanidin 3-O-malonylhexoside accumulated after pollination, which probably changed the lip color of C. floribundum after pollination were identified. 43 ABP genes and a R2R3-MYB TF, CfMYB1, which may be leading to the change of lip color in C. floribundum after pollination were screened, and the pathway map of anthocyanin synthesis was constructed. In summary, this study provides valuable information on anthocyanin biosynthesis during C. floribundum flower development.
-
The authors confirm contribution to the paper as follows: research conception and design: Ai Y; project planning and coordination: Lan S, Liu Z; performed the bioinformatic analysis, conducted experiments and wrote the manuscript: Ma S, Wang M, Li P; prepared samples and conducted metabolome and transcriptome sequencing: Ma S, Tian Y, Li J; analyzed the experimental results: Wang M, Li P, Guo L, Xiong L. All authors reviewed the results and approved the final version of the manuscript.
-
All data generated or analyzed during this study are included in this published article and its supplementary information files. The RNA-Seq data have been deposited in NCBI under SRA accession codes: PRJNA1017809.
This work was supported by The Fujian Natural Science Foundation Project of China (2020J01585), and The Outstanding Young Scientific Research Talent Project of Fujian Agriculture and Forestry University (No. xjq201910).
-
The authors declare that they have no conflict of interest.
-
# Authors contributed equally: Shanhu Ma, Mengjie Wang, Peng Li
- Supplemental Table S1 Primer sequences for qRT-PCR.
- Supplemental Table S2 Primer sequences for subcellular localization.
- Supplemental Table S3 Primer sequences for transgenic verification.
- Supplemental Fig. S1
- Supplemental Table S4 The average value of the composition, quantity and content of metabolites in the lip of Cymbidium floribundum before and after pollination in different periods.
- Supplemental Table S5 Flavonoids composition and content in each period.
- Supplemental Table S6 The splicing length distribution.
- Supplemental Table S7 Identification of differential genes related to anthocyanin biosynthesis in C. floribundum.
- Supplemental Table S8 Identification of R2R3-MYB transcription factors in Cymbidium floribundum.
- Supplemental Fig. S1 TIC of labellum of Cymbidium floribundum before and after pollination in different periods.
- Supplemental Fig. S2 PCA of labellum of Cymbidium floribundum before and after pollination in different periods.
- Supplemental Fig. S3 Quantitative real-time PCR (qRT-PCR) validation of 8 ABP genes.
- Copyright: © 2024 by the author(s). Published by Maximum Academic Press, Fayetteville, GA. This article is an open access article distributed under Creative Commons Attribution License (CC BY 4.0), visit https://creativecommons.org/licenses/by/4.0/.
-
About this article
Cite this article
Ma S, Wang M, Li P, Guo L, Xiong L, et al. 2024. Transcriptome and metabolome analysis reveal the lip color variation in Cymbidium floribundum. Ornamental Plant Research 4: e019 doi: 10.48130/opr-0024-0017 

Transcriptome and metabolome analysis reveal the lip color variation in Cymbidium floribundum
- Received: 17 January 2024
- Revised: 09 April 2024
- Accepted: 18 June 2024
- Published online: 10 July 2024
Abstract: Cymbidium floribundum is an ornamental plant with showy and colorful flowers. The color of its lip changes significantly after pollination. However, the mechanism of lip coloration remains unclear. In this study, the mechanism underlying lip color change in C. floribundum was investigated before and after pollination. Metabolome analysis detected 61 flavonoids in the lip, including 24 flavonoids, 13 flavonols, nine flavonoid carbonosides, eight anthocyanins, three flavanols, two isoflavones, one chalcone, and one dihydroflavone. Accumulation of peonidin 3-O-glucoside chloride, cyanin chloride, and cyanidin 3-O-malonylhexoside after pollination may be the key factors contributing to the change in lip color. Furthermore, transcriptome analysis identified 43 genes related to the anthocyanin biosynthesis pathway (ABP). Phylogenetic and co-expression analysis indicated that CfMYB1, CfMYB3, and CfMYB4 may be involved in the regulation of anthocyanin biosynthesis in the lips. Subcellular localization results showed that CfMYB1 was located in the nucleus, while CfMYB3 and CfMYB4 were located in the nucleus and cytoplasm. Further functional analysis verified that CfMYB1 could activate ABP genes and promote the synthesis and accumulation of anthocyanin, which may be the main transcription factors leading to the change of lip color in C. floribundum after pollination. These findings provide insight into the anthocyanin accumulation and coloration mechanisms during C. floribundum flower development. The results provide genetic resources and a theoretical basis for the improvement and breeding of flower color in C. floribundum.
-
Key words:
- Cymbidium floribundum /
- Lip /
- Anthocyanin /
- Metabolome /
- Transcriptome