ARTICLE   Open Access    

Anthocyanin contents and molecular changes in rose petals during the post-anthesis color transition

More Information
  • Flower color transitions during anthesis are taxonomically widespread; however, the mechanisms underlying post-anthesis color transition in roses are unclear. In this study, we collected petals of the butterfly rose (Rosa chinensis 'Mutabilis'), a post-anthesis color change cultivar, at different developmental stages and under different treatments. Anthocyanin composition and transcriptome data were analyzed to identify the environmental factors and crucial genes involved in post-anthesis color transition. The results showed that sunlight is a key factor triggering color transition. In butterfly rose flowers, color transition results from an increase in the accumulation of anthocyanins, primarily cyanidin-3-O-glucoside, and cyanidin-3,5-O-diglucoside. A combination of genome-wide identification, RNA-seq analysis, bioinformatics analysis, and quantitative real-time PCR verification revealed that RcUF3GT1 and RcGSTF2 genes were involved in anthocyanin production and anthocyanin transport, respectively. RcMYB114a may play a significant role in anthocyanin biosynthesis during color transition in roses, and RcBBX28 might be a crucial gene involved in this process. These insights contribute to our knowledge of flower color change and have implications for further research on plant genetics and flower color evolution.
  • Agricultural management practices impact soil physicochemical properties to a remarkable extent. Degradation of soil health has led to a contraction in agricultural production and soil biodiversity particularly due to conventional farming practices, indiscriminate use of inorganic fertilizers (INF) and inadequate input of residues[1]. Organic or inorganic fertilizers have been regarded as a critical component of agriculture to accomplish global food security goals[2]. The exogenous supply of fertilizers could easily alter soil properties by restoring the nutrients that have been absorbed by the plants[2]. Thus, implementing adequate nutrient management strategies could boost plant yield and sustain plant health. Tillage affects the soil, especially for crop production and consequently affects the agro-ecosystem functions. This involves the mechanical manipulation of the soil to modify soil attributes like soil water retention, evapotranspiration, and infiltration processes for better crop production. Thus, tillage practices coupled with fertilizer inputs may prove a viable strategy to improve soil health components such as nutrient status, biodiversity, and organic carbon.

    Soil serves as a major reservoir of nutrients for sustainable crop production. Intensive cultivation due to growing population burden has led to the decline of soil nutrient status that has adversely affected agricultural production. Various researchers have assessed the soil nutrient budget and the reasons behind decline of nutrient content in soil[3]. Soil management strategies have assisted in overcoming this problem to a greater extent. Tillage practices redistribute soil fertility and improve plant available nutrient content due to soil perturbations[4]. Different tillage and fertilization practices alter soil nutrient cycling over time[5]. Fertilization is an important agricultural practice which is known to increase nutrient availability in soil as well as plants[6]. A report has been compiled by Srivastava et al.[7], which assessed the effectiveness of different fertilizers on soil nutrient status in Indian soils.

    Soil biota has a vital role in the self-regulating functions of the soil to maintain soil quality which might reduce the reliance on anthropogenic activities. Soil microbial activities are sensitive to slight modifications in soil properties and could be used as an index of soil health[8]. Maintenance of microbial activity is essential for soil resilience as they influence a diverse range of parameters and activities including soil structure formation, soil SOM degradation, bio-geochemical cycling of nutrients etc.[9]. Various researchers have identified microbial parameters like microbial biomass carbon (MBC), potentially mineralizable nitrogen (PMN), soil respiration, microbial biomass nitrogen (MBN), and earthworm population as potential predictors of soil quality. Geisseler & Scow[10] have compiled a review on the affirmative influence of long-term mineral fertilization on the soil microbial community.

    Being the largest terrestrial carbon (C) reservoir, soil organic carbon (SOC) plays a significant role in agricultural productivity, soil quality, and climate change mitigation[11]. Manure addition, either solely or along with INF augments SOC content which helps in the maintenance and restoration of SOM more effectively as compared to the addition of INF alone[12]. Enhancement of recalcitrant and labile pools of SOC could be obtained through long-term manure application accentuating the necessity of continuous organic amendments for building up C and maintaining its stability[13]. Generally, compared with manure addition, INF application is relatively less capable of raising SOC and its labile fractions[14]. Alteration in SOC content because of management strategies and/or degradation or restoring processes is more prominent in the labile fraction of soil C[15]. Several fractions of soil C play vital roles in food web and nutrient cycles in soils besides influencing many biological properties of soil[16]. Thus, monitoring the response of SOC and its fractions to various management practices is of utmost importance.

    A positive impact on SOC under manure application coupled with INF in rice-wheat systems has been reported, as compared to sole applications of INFs[17]. Although ploughing and other mechanical disturbances in intensive farming cause rapid OM breakdown and SOC loss[18], additional carbon input into the soil through manure addition and rational fertilization increases carbon content[13]. Wei et al.[19] in light sandy loam soil of China found that the inclusion of crop straw together with inorganic N, P and K fertilizers showed better results for improving soil fertility over sole use of inorganic fertilizers. Zhu et al.[20] studied the influence of soil C through wheat straw, farmyard manure (FYM), green manure, and rice straw on plant growth, yield, and various soil properties and found that the recycling of SOM under intensive cultivation is completely reliant on net OM input and biomass inclusion. However, most of the studies on residue management and organically managed systems could not provide clear views regarding the relations between the quality of OM inputs and biological responses towards it. The disintegration of soil aggregates due to ploughing, use of heavy machinery, and residue removal has been reported widely under conventional tillage (CT) practices[21]. On the contrary, improvement in SOC stabilization has also been observed by some scientists[22]. Under CT, the disintegration of macro-aggregates into micro-aggregates is a prominent phenomenon, while conservation tillage has been identified as a useful practice for increasing macro-aggregates as well as carbon sequestration in agricultural soils[23]. By and large, the ploughing depth (0–20 cm) is taken into consideration for evaluating the impact of tillage and straw retention on soil aggregation[24], while degradation in deeper layers of soil is becoming a major constraint towards soil quality together with crop yield[25].

    Hence, the present review would be useful in determining how tillage practices and inorganic and organic fertilization impact nutrient availability in the soil, microbial composition and SOC fractions besides stocks under different land uses.

    Agricultural production is greatly influenced by nutrient availability and thus nutrient management is required for sustaining higher yields of crop. The term 'nutrient availability' refers to the quantity of nutrients in chemical forms accessible to plant roots or compounds likely to be converted to such forms throughout the growing season in lieu of the total amount of nutrients in the soil. For optimum growth, different crops require specifically designed nutrient ratios. Plants need macronutrients [nitrogen (N), phosphorus (P), potassium (K) in higher concentrations], secondary nutrients [calcium (Ca), magnesium (Mg), sulphur (S) in moderate amounts as compared to macronutrients] and Micronutrients [Zn (zinc), Fe (iron), Cu (copper), B (boron), Mn (manganese), Mo (molybdenum) in smaller amounts] for sustainable growth and production[26]. Fertilizers assist the monitoring of soil nutrient levels by direct addition of required nutrients into the soil through different sources and tillage practices may alter the concentration of available plant nutrients through soil perturbations. Various studies on the influence of fertilization and tillage practices on available plant nutrients have been discussed below.

    Yue et al.[27] reported that long-term fertilization through manure/INF improved the macronutrient content of Ultisol soil in China. Two doses of NPK (2NPK) considerably improved soil properties over a single dose (NPK). Combined application (NPK + OM) resulted in higher hydrolysable N and available P over the sole OM application. The total K content was higher under the treatments NPK, 2NPK and NPK + OM than sole OM treatment, whereas available K was higher in treatments NPK + OM and 2NPK over the sole OM and NPK. Likewise, OM, INF, and OM + INF were evaluated for their potential to regulate the soil macronutrient dynamics. Organic manure significantly improved the soil N content, whereas INF showed comparable results to that of the control treatment. Besides, all the treatments improved available P and exchangeable K concentration[28].

    Hasnain et al.[29] performed comparative studies of different ratios of INF + compost and different application times for the chemical N fertilizer on silty loamy soils of China. The available nitrogen and phosphorous content were greater in conjoint OM + INF application over the bare INF and control application irrespective of N application time. Soil quality substantially improved with increasing ratio of compost and 70:30 (INF to compost ratio) was found to be most suitable to maintain soil fertility and nutrient status. Another study by Liu et al.[30] reported the superior effects of NPK + pig manure and NPK + straw to improve soil available P and K over the control and sole NPK treatments. However, total N concentration did not exhibit any significant variation under any treatment.

    Shang et al.[31] accounted the positive impact of vermicompost and mushroom residue application on grassland soil fertility in China. The addition of organic manures improved available P and K content to a considerable extent. Under moisture-deficit winter wheat-fallow rotation, another study quantified the influence of residue management approaches and fertilizer rate on nutrient accrual. Residue burning resulted in no decline in soil macronutrient content, whereas the perpetual addition of FYM for 84 years significantly improved total N and extractable K and P concentration. Thus, residue incorporation along with FYM application may prove beneficial in reducing the temporal macronutrient decline[32].

    Ge et al.[33] examined the effects of NPK and NPK along with manure (NPKM) addition on the macronutrient status of Hapli-Udic Cambisol soil. The NPKM application resulted in the highest increase in total N, available-P and K concentration as compared to NPK and control. Likewise, mineral fertilization reduction and partial substitution with organic amendments have posed a significant influence on soil macronutrient status. Soil available P and K decreased after INF reduction[34]. Chen et al.[35] evinced that integrated application of manure and mineral fertilizers to red clay soil (typical Ultisols) improved hydrolyzed nitrogen and available P due to an increase in the decomposition of organic matter (OM) and N bio-fixation than sole mineral fertilizers and control.

    A long-term experiment was carried out out by Shiwakoti et al.[36] to ascertain the influence of N fertilization and tillage on macronutrient dynamics in soil. Nitrogen fertilization produced higher crop biomass which might have improved total N and P concentration in soil. Moreover, the reduced interaction between soil colloids and residue or greater cation exchange sites due to tillage practices could have augmented K concentration in 0−10 cm soil depth. Likewise, among tillage systems combined organic (poultry manure) and inorganic (lime and fertilizers) fertilization, no-tillage, and reduced tillage with organic fertilization resulted in higher availability of P owing to minimal disturbance of soil which decreases contact surface between phosphate ions and adsorption sites. Greater losses of K in runoff water under NT resulted in lower K availability under NT than CT[37].

    The influence of tillage systems on soil nutrient dynamics showed that minimal soil disturbances under zero tillage prohibited redistribution of soil nutrients and resulted in the highest available N, P, and K in the surface soil[38]. The influence of tillage timing on soil macronutrient status has also been assessed under tillage treatments that are fall tillage (FT), spring tillage (ST), no tillage (NT), and disk/chisel tillage (DT/CT) on mixed mesic Typic Haploxerolls soil. All the tillage systems differed in the quantity of residues generated. Thus, variation in the decomposition of crop residue and mineralization of SOM resulted in variable rates of nutrient release. The FT and ST had the highest N content over DT/CT and NT systems at corresponding depth. The N content also decreased with soil depth irrespective of tillage treatment. The available P and extractable K were highest under NT at the top 10 cm soil depth and increased over time[39]. Residue management in combination with tillage treatments (ST and CT) has been reported to affect the soil macronutrient status in Bangladesh. Tillage treatments enhanced the total N content to a considerable extent. Moreover, 3 years of residue retention led to a higher concentration of total N, available P and K in the soil.

    The combinations of N, P, and K in different ratios together with two rates of organic fertilizer (OF) applied on the aquic Inceptisol having sandy loam texture influenced the micronutrient status of the soil[40]. Soil Zn content decreased with time when no fertilizer was applied as compared to organic fertilizer (OF) application. The mineral fertilizer treatments led to a substantial increase in DTPA-extractable micronutrients in the soil. The higher micronutrient concentration due to higher OM highlights the importance of maintaining OM for soil fertility and higher crop production. Further studies revealed that long-term application of sole N fertilizers led to a significant decline in total Zn and Cu, whereas Mn and Fe status improved through atmospheric deposition. Phosphorus and OF addition along with straw incorporation markedly increased total Zn, Cu, Fe, and Mn. The DTPA-extractable Mn, Zn, Fe, and Cu were also higher in OF treatment, thus demonstrating the beneficial effects of constant OM application for maintaining the nutrient status of soil[41].

    López-Fando & Pardo[42] quantified the impact of various tillage practices including NT, CT, minimum tillage (MT), and zone-tillage (ZT) on soil micronutrient stocks. Tillage systems did exhibit a significant influence on plant available Fe stocks in the topsoil; however, diminished with depth under ZT, NT and MT. Manganese was higher in NT and ZT at all depths and increased with soil depth. Zinc was highest under NT and other results did not vary significantly as in the case of Cu. The SOC levels were also found to be responsible to affect micronutrients due to tillage practices. Likewise, in Calciortidic Haploxeralf soil the distribution of soil micronutrients (Zn, Mn, Fe, Cu) was ascertained under different tillage practices (CT, MT, and NT). The micronutrient status was highest under NT in the upper layers due to the higher SOC level[43].

    Sharma & Dhaliwal[44] determined that the combined application of nitrogen and rice residues facilitated the transformation of micronutrients (Zn, Mn, Fe, Cu). Among different fractions, the predominant fractions were crystalline Fe bound in Zn, Mn, and Cu and amorphous Fe oxide in Fe with 120 kg N ha˗1 and 7.5-ton rice residue incorporation. The higher content of occluded fractions adduced the increment in cationic micronutrient availability in soil with residue incorporation together with N fertilization due to increased biomass. Rice straw compost along with sewage sludge (SS) and INF also affected the micronutrient availability under the RW cropping system. Nitrogen fertilization through inorganic fertilizers and rice straw compost and sewage sludge (50% + 50%) improved soil micronutrient status due to an increase in SOM over sole NPK fertilizers[45]. Earlier, Dhaliwal et al.[46] in a long-term experiment determined that different combinations of NPK along with biogas slurry as an organic source modified the extractable micronutrient status of the soil.

    A comparative study was carried out by Dhaliwal et al.[47] to ascertain the long-term impact of agro-forestry and rice–wheat systems on the distribution of soil micronutrients. The DTPA-extractable and total Cu, Zn, Fe, and Mn were greater in the RW system due to the reduced conditions because of rice cultivation. Under the RW system Zn removal was higher which was balanced by continuous Zn application. The higher availability of Fe under the RW system was due to reduced conditions. Contrarily, Mn was greater under the agro-forestry system owing to nutrient recycling from leaf litter.

    The long-term impact of integrated application of FYM, GM, WCS (wheat-cut straw) and INF on the soil micronutrients (Zn, Mn, Cu, and Fe) have been studied by Dhaliwal et al.[48]. The FYM application substantially improved DTPA-extractable Zn status followed by GM and WCS, whereas Cu content was maximum in the plots with OM application. The highest Fe concentration was recorded in treatment in which 50% recommended N supplied through FYM. This could be ascribed to the release of micronutrients from OM at low soil pH.

    Shiwakoti et al.[49] studied the dual effects of tillage methods (MP, DP, SW) and variable rates of N (0, 45, 90, 135 and 180 kg ha−1) on the distribution of micronutrients under a moisture-deficit winter wheat-fallow system. The soil Mn content was highest under the DP regime. Inorganic N application reduced Cu content in the soil. Comparative studies with adjacent undisturbed grass pasture indicated the loss of Zn and Cu to a significant extent. Thus, DP along with nitrogen added through inorganic fertilizers could improve micronutrient concentration in the soil. Moreover, the results implied that long-term cultivation with nitrogen fertilization and tillage results in the decline of essential plant nutrients in the soil. Thus, organic amendments along with INF may prove an effective approach to increase soil micronutrient content. In another study conducted by Lozano-García & Parras-Alcántara[50] tillage practices such as NT under apple orchard, CT with the wheat-soybean system and puddling (PD) in the rice-rice cropping system were found to affect nutrient status. Under CT, Cu content was lowest and Zn content was highest. On the contrary, puddling caused an increase in Fe and Mn concentration owing to the dispersion of soil aggregates which reduced the percolation of water and created an anaerobic environment thereby enhancing the availability of Fe and Mn.

    Tillage practices along with gypsum fertilization have been known to affect secondary nutrient concentrations in soil. In a long-term experiment, FYM application showed maximum response to increased S concentration due to the maximum addition of OM through FYM over other treatments as S is an essential component of OM and FYM[32]. Higher Mg content was recorded in FYM and pea vine treatments because the application of organic matter through organic manure or pea vines outright led to Mg accrual. The lower Mg concentration in topsoil than the lower layers was due to the competition between Mg and K for adsorbing sites and thus displacement of Mg by K. Han et al.[28] while ascertaining the impact of organic manures and mineral fertilizers (NPK) on soil chemical attributes determined that INF application reduced exchangeable calcium, whereas no significant changes were exhibited in the magnesium concentrations. The OM application significantly increased both the calcium and magnesium concentrations in the soil.

    While ascertaining the effect of different tillage treatments such as CT, NT, and MT on exchangeable and water-soluble cations, Lozano-García & Parras-Alcántara[50] recorded that NT had greater content of exchangeable Ca2+ and Mg2+ than MT and CT. The exchangeable Ca2+ decreased with depth, however, opposite results were observed for Mg2+ which might be due to the higher uptake of Mg2+ by the crop. On another note, there might be the existence of Mg2+-deficient minerals on the surface horizon. Alam et al.[51] studied the temporal effect of tillage systems on S distribution in the soil and observed that available S was 19%, 31%, and 34% higher in zero tillage than in minimum tillage, conventional tillage, and deep tillage, respectively.

    Kumar et al.[38] appraised the impact of tillage systems on surface soil nutrient dynamics under the following conditions: conventional tillage, zero till seeding with bullock drawn, conventional tillage with bullock drawn seeding, utera cropping and conservation tillage seeding with country plough and observed that tillage had a significant impact on the available S content. Compared with conventional tillage, zero and minimum tillage had higher S content as there was none or limited tillage operations which led to the accumulation of root stubble in the soil that decomposed over time and increased S concentration.

    Soil is considered a hotspot for microbial biodiversity which plays an important role in building a complex link between plants and soil. The microbial components exhibit dynamic nature and, therefore, are characterized as good indicators of soil quality[52]. These components include MBC, MBN, PMN and microbial respiration which not only assist in biological transformations like OM conversion, and biological nitrogen fixation but also increase nutrient availability for crop uptake. Management strategies such as fertilizer inputs and tillage practices may exert beneficial effects on soil biota as discussed below.

    Soil is an abode to a considerable portion of global biodiversity. This biodiversity not only plays a pivotal role in regulating soil functions but also provides a fertile ground for advancing global sustainability, especially agricultural ventures. Thus, the maintenance of soil biodiversity is of paramount importance for sustaining ecosystem services. Soil biodiversity is the diverse community of living creatures in the soil that interact not only with one another but also with plants and small animals to regulate various biological activities[53]. Additionally, it increases the fertility of soil by converting organic litter to SOM thereby enhancing SOC content. Thus, the SOM measures the number and activity of soil biota. Furthermore, the quality and amount of SOC, as well as plant diversity have a considerable impact on the soil microbial community structure[54].

    Dangi et al.[55] ascertained the impact of integrated nutrient management and biochar on soil microbial characteristics and observed that soil amended with biochar or the addition of organic manures influenced microbial community composition and biomass and crop yield. After two years, the higher rates of biochar significantly enhanced the levels of gram-positive and gram-negative bacterial phospholipid fatty acid (PLFA), total arbuscular mycorrhizal fungal (AMF) than lower rates, unfertilized and non-amended soil. Luan et al.[56] conducted a comparison study in a greenhouse to assess the effects of various rates of N fertilizer and kinds (inorganic and organic) on enzyme activities and soil microbial characteristics. Microbial growth (greater total PLFAs and microbial biomass carbon) and activity were promoted by manure substitution of mineral fertilizer, particularly at a higher replacement rate. On account of lower response in bacterial over fungal growth, manure addition led to a greater fungi/bacteria ratio. Furthermore, manure application significantly enhanced microbial communities, bacterial stress indicators and functional diversity. Lazcano et al.[57] determined the influence of different fertilization strategies on microbial community structure and function, soil biochemical properties and crop yield three months after addition of fertilizer. The integrated fertilizer regimes augmented microbial growth with improved enzyme activity as compared to sole inorganic amendments. Bacterial growth showed variable response with variation in fertilizer regime used whereas fungal growth varied with the amount of fertilizer added. Compared to mineral fertilizers, manure application led to a rapid increase in PLFA biomarkers for gram-negative bacteria. The organic amendments exhibited significant effects even at small concentration of the total quantity of nutrients applied through them; thus, confirming the viability of integrated fertilizer strategies in the short term.

    Kamaa et al.[58] assessed the long-term effect of crop manure and INF on the composition of microbial communities. The organic treatments comprised of maize (Zea mays) stover (MS) at 10 t ha−1 and FYM @ 10 t ha−1, INF treatments (120 kg N, 52.8 kg P-N2P2), integrated treatments (N2P2 + MS, N2P2 + FYM), fallow plot and control. The treatment N2P2 exhibited unfavourable effects on bacterial community structure and diversity that were more closely connected to the bacterial structure in control soils than integrated treatments or sole INF. In N2P2, fungal diversity varied differently than bacterial diversity but fungal diversity was similar in the N2P2 + FYM and N2P2 + MS-treated plots. Thus, the total diversity of fungal and bacterial communities was linked to agroecosystem management approaches which could explain some of the yield variations observed between the treatments. Furthermore, a long-term experiment was performed by Liu et al.[59] to study the efficiency of pig manure and compost as a source for N fertilization and found unique prokaryotic communities with variable abundance of Proteobacteria under compost and pig manure treatments.

    Recently, Li et al.[60] assessed the influence of different tillage practices (no-tillage, shallow tillage, deep tillage, no-tillage with straw retention, shallow tillage with straw retention and deep tillage with straw retention) on microbial communities and observed that tillage practices improved the bacterial Shannon index to a greater extent over the no-tillage plots in which the least value was recorded. Another research study by He et al.[61] reported the effect of tillage practices on enzyme activities at various growth stages. Across all the growth stages, enzyme activities of cellobiohydrolase (CBH), β-xylosidase (BXYL), alkaline phosphatase (AP), β-glucosidase (BG), β-N-acetylglucosamines (NAG) were 17%−169%, 7%−97%, 0.12%−29%, 3%−66%, 23%−137% greater after NT/ST, NT, ST, ST/PT, and PT/NT treatments as compared to plow tillage. The NT/ST treatment resulted in highest soil enzyme activities and yield, and thus was an effective and sustainable method to enhance soil quality and crop production.

    Microbes play a crucial role in controlling different soil functions and soil ecology and microbial community show significant variation across as well as within the landscape. On average, the total biomass of microbes exceeds 500 mg C kg soil−1[62]. Microbial biomass carbon is an active constituent of SOM which constitutes a fundamental soil quality parameter because SOM serves as a source of energy for microbial processes and is a measure of potential microbial activity[48,63]. Soil systems that have higher amounts of OM indicate higher levels of MBC. Microbial biomass carbon is influenced by many parameters like OM content in the soil, land use, and management strategies[64]. The MBC and soil aggregate stability are strongly related because MBC integrates soil physical and chemical properties responds to anthropogenic activities.

    Microbial biomass is regarded as a determinative criterion to assess the functional state of soil. Soils having high functional diversity of microbes which, by and large, occurs under organic agricultural practices, acquire disease and insect-suppressive characteristics that could assist in inducing resistance in plants[65]. Dou et al.[66] determined that soil microbial biomass C (SMBC) was 5% to 8% under wheat-based cropping systems and zero tillage significantly enhanced SMBC in the 0−30 cm depth, particularly in the upper 0 to 5 cm. According to Liang et al.[67], SMBC and soil microbial biomass N (SMBN) in the 0−10 cm surface layer were greater in the fertilized plots in comparison to the unfertilized plots on all sampling dates whereas microbial biomass C and N were highest at the grain filling stage. Mandal et al.[68] demonstrated that MBC also varied significantly with soil depth. Surface soil possessed a maximum MBC value than lower soil layers due to addition of crop residues and root biomass on the surface soil. The MBC content was highest with combined application of INF along with farmyard manure and GM, whereas untreated plots showed minimum MBC values. The incorporation of CR slows down the rate of mineralization processes; therefore, microbes require more time to decompose the residues and utilize the nutrients released[69]. On the other hand, incorporation of GR having a narrow C:N ratio enhances microbial activity and consequently accelerates mineralization in the soil. Malviya[70] also recorded that the SMBC contents were significantly greater under RT than CT, regardless of soil depth which was also assigned to residue incorporation which increases microbial biomass on account of higher carbon substrate in RT.

    Naresh et al.[71] studied the vertical distribution of MBC under no-tillage (NT), shallow (reduced) tillage and normal cultivated fields. A shallow tillage system significantly altered the tillage induced distribution of MBC. In a field experiment, Nakhro & Dkhar[72] examined the microbial populations and MBC in paddy fields under organic and inorganic farming approaches. The organic source used was a combination of rock phosphate, FYM and neem cake, whereas a mixture of urea, muriate of potash and single super phosphate was used as an inorganic source. The organically treated plots exhibited the highest MBC compared to inorganically treated plots and control. Organic carbon exhibited a direct and significant correlation with bacterial and fungal populations. The addition of organic fertilizers enhanced the content of SOC and consequently resulted in higher microbial count and MBC. Ramdas et al.[73] investigated the influence of inorganic and organic sources of nutrients (as minerals or INF) applied over a five-year period on SOC, MBC and other variables. It was observed that the addition of FYM and conjoint application of paddy straw (dry) and water hyacinth (PsWh) (fresh) significantly increased the SOC content than vermicompost, Chromolaena adenophorum (fresh) and Glyricidia aculeate (fresh), and Sesbania rostrata (fresh).

    Xu et al.[74] evaluated the influence of long-term fertilization strategies on the SOC content, soil MBN, soil MBC, and soil microbial quotient (SMQ) in a continuous rice system and observed that MBC at the main growth stages of early and late rice under 30% organic matter and 70% mineral fertilizer and 60% organic matter and 40% mineral fertilizer treatments was greater as compared to mineral fertilizer alone (MF), rice straw residues and mineral fertilizer (RF), and no fertilizer (CK) treatments. However, SMBC levels at late growth stages were greater in comparison to early growth stages. A recent study by Xiao et al.[75] demonstrated that increasing tillage frequency (no-tillage, semi-annual tillage, and tillage after every four months, two months, and one month) decreased soil MBC. Microbial biomass carbon content was significantly greater in no-till treatment (597 g kg−1) than in tillage every four months (421 g kg−1), two months (342 g kg−1) and one month (222 g kg−1). The decrease in the content of MBC in association with tillage practices is due to soil perturbations which enhanced soil temperature, diminished soil moisture content, and resulted in the destruction of microbial habitat and fungal hyphae. Therefore, the MBC content eventually affected the N cycle.

    Li et al.[76] reported that in comparison to CT, NT and RT resulted in increased MBC content and NT significantly increased MBC by 33.1% over CT. Furthermore, MBC concentration was 34.1% greater in NT than RT. The increase in MBC concentration was correlated with the results of increase in SOC concentration. Site-specific factors including soil depth and mean annual temperature significantly affected the response ratio of MBC under NT as compared to the duration of NT.

    Microbial biomass nitrogen (MBN) is a prominent indicator of soil fertility as it quantifies the biological status of soil. Soil MBN is strongly associated with organic matter of the soil. The nitrogen in MBN has a rapid turnover rate thereby reflecting the changes in management strategies way before the transformations in total N are discernable[77].

    In an experiment on continuous silage maize cultivation with crop rotation, Cerny et al.[78] observed that organic fertilizers exerted an affirmative influence on the soil MBN. During the application of organic manure MBN decreased, but there was higher MBN content as compared to control. However, addition of mineral nitrogenous fertilizers exerted an adverse effect on MBN content in experiments with maize. El-Sharkawi[79] recorded that organic matter-treated pots resulted in maximum MBN content than urea-treated pots. The sludge application enhanced total MBN and, therefore, could implicitly benefit crop production particularly in poor soils[18]. Sugihara et al.[80] observed that during the grain-filling stage in maize, residue and/or fertilizer addition exerted a pronounced influence on soil microbial dynamics; however, a clear effect of residue and ⁄or fertilizer addition was not observed. Microbial biomass nitrogen reduced dramatically from 63–71 to 18–33 kg N ha˗1 and C:N ratio at the same time increased more than ten-fold in all plots.

    Malik et al.[81] apprised that the organic amendments significantly enhanced MBN concentrations up to 50% more than the unamended soil. Wang et al.[82] evaluated the influence of organic materials on MBN content in an incubation and pot experiment with acidic and calcareous soils. The results revealed that MBN content which was affected by the different forms of organic amendments, increased by 23.37%−150.08% and 35.02%−160.02% in acidic and calcareous soils, respectively. The MBN content of both soils decreased with the increase in the C/N ratio of the organic materials, though a higher C/N ratio was effective for sustaining a greater MBN content for a very long time.

    Dhaliwal & Bijay-Singh[52] observed higher MBN levels in NT soils (116 kg ha−1) than in cultivated soils (80 kg ha−1). Kumar et al.[83] ascertained that in surface layer, MBN content was 11.8 mg kg−1 in CT which increased to 14.1 and 14.4 mg kg−1 in ZT and RT without residue retention and 20.2, 19.1 and 18.2 mg kg−1 in ZT, RT and CT with residue incorporation, respectively (Table 1). In the subsurface layer, the increased tendency on account of tillage and crop residue retention was identical to those of 0−15 cm layer but the magnitude was comparatively meagre (Table 1). In comparison to control, the persistent retention of crop residues led to significant accrual of MBN in the surface layer.

    Table 1.  Effect of different treatments on contents of various fractions of soil organic carbon[38].
    TreatmentsPMN (mg kg−1)MBC (mg kg−1)MBN (mg kg−1)DOC (mg kg−1)
    Depths (cm)
    0−1515−300−1515−300−1515−300−1515−30
    Tillage practices
    ZTR12.411.2562.5471.120.218.9198.6183.6
    ZTWR8.57.6350.4302.114.112.6167.1159.2
    RTR10.69.9490.2399.319.117.2186.4171.6
    RTWR7.66.6318.1299.814.413.7159.5148.7
    CTR9.38.5402.9354.418.216.6175.9168.9
    CT6.75.6307.9289.511.89.7142.5134.6
    Nitrogen management
    Control3.62.8218.3202.910.810.4103.792.3
    80 kg N ha−15.34.4241.1199.414.912.2128.3116.9
    120 kg N ha−18.97.6282.7220.916.516.1136.8123.6
    160 kg N ha−19.88.4343.9262.919.418.1164.8148.9
    200 kg N ha−110.49.7346.3269.622.721.7155.7136.4
    ZTR = Zero tillage with residue retention, ZTWR = Zero tillage without residue retention; RTR = Reduced tillage with residue retention, RTWR = Reduced tillage without residue retention, CTR = Conventional tillage with residue incorporation; CT = Conventional tillage without residue incorporation.
     | Show Table
    DownLoad: CSV

    Xiao et al.[75] determined that the MBN content decreased with tillage treatment having highest value in no tillage treatment, however, the difference among the treatments was negligible. Soil perturbations decreased the aggregate size and thus lower the soil aeration and exposure of fresh organic matter which restricted the growth of microorganisms. The results also concluded that MBN content is highly sensitive to tillage. Ginakes et al.[84] assessed the impact of zone tillage intensity on MBN in a corn-kura clover cropping sequence. Microbial biomass nitrogen was influenced by time and type of tillage treatment. Temporal studies revealed that MBN was higher after tillage treatment than the values possessed before tillage. Under different tillage treatments, higher values were recorded in ST (shank-till) and DT (double-till) over NT and RZT (zone-till) treatments.

    Another biological parameter, PMN, is a crucial parameter of soil fertility due to its association with soil N supply for crop growth. Also, PMN indicates the status of soil microbial community associated with PMN, whether it is improving or degrading. Forest soils are characterized by greater levels of PMN than CT receiving conventional chemical fertilizers which could be assignable to improved microbial activity in the former soils than the latter[48,77]. Aulakh et al.[85] assessed the effect of various combinations of fertilizer N, P, FYM and wheat residue (WR) applied to soybean and soybean residues added to wheat under CT and CA. The added fertilizers of N and P, FYM, and crop residue enhanced the mean weight diameter and water-stable aggregates thus favoured the development of macro-aggregates. The treatment INF + FYM + crop residue performed better among all the treatments. The net flux of mineral nitrogen from the mineralizable fraction is used to measure potentially mineralizable N which indicates the balance between mineralization and immobilization by soil microbes[77]. Nitrogen mineralization is widely used to assess the ability of SOM to supply inorganic nitrogen in the form of nitrate which is the most common form of plant-available nitrogen. Kumar et al.[83] observed an increase in PMN which was higher in surface soil than sub-surface soil thereby implying that high OC accumulation on account of crop residue retention was the most probable cause.

    Verma & Goyal[86] assessed the effect of INM and organic manuring on PMN and observed that PMN was substantially affected by different organic amendments. Potentially mineralizable nitrogen varied between 19.6−41.5 mg kg−1 soil with greater quantity (2.5%) in vermicompost applied plots than FYM treated plots. The INF treatments resulted in lower PMN content which could be due to nutrient immobilization by microbes. Mahal et al.[87] reported that no-till resulted in higher PMN content than conventional tillage treatments. This trend was due to the maintenance of SOM due to the residue cover and reduction of soil erosion under no-tillage system[88]. On the contrary, tillage practices led to the loss of SOC owing to loosened surface soil and higher mineralization of SOM.

    Soil respiration is referred as the sum of CO2 evolution from intact soils because of the respiration by soil organisms, mycorrhizae and roots[89]. Various researchers have proposed soil respiration as a potential indicator of soil microbial activity[52,77]. Gilani & Bahmanyar[90] observed that addition of organic amendments enhanced soil respiration more than the control and synthetic fertilizer treatments. Moreover, among organic amendment treatments, highest soil respiration was observed in sewage-sludge treated soils. Under controlled conditions in saline-sodic soil, Celis et al.[91] reported that sewage sludge resulted in a higher soil respiration rate than mined gypsum and synthetic gypsum. The application of gypsum because of minimal organic matter intake had little effect on soil respiration. The addition of organic matter especially during early spring led to higher microbial biomass and soil respiration albeit diminished levels of nitrate-N. Moreover, SOM hinders the leaching of nitrate ions thereby resulting in a better soil chemical environment[71].

    Faust et al.[92] observed that microbial respiration was associated with volumetric water content. The respiration declined with less availability of water, thus the lesser the tillage intensity, the more the volumetric water content which consequently resulted in higher microbial respiration. Another study by Bongiorno et al.[93] reflected the influence of soil management intensity on soil respiration. Reduced tillage practices resulted in 51% higher basal respiration than CT. Furthermore, this investigation suggested that microbial catabolic profile could be used as a useful biological soil quality indicator. Recently, Kalkhajeh et al.[94] ascertained the impact of simultaneous addition of N fertilizer and straw-decomposing microbial inoculant (SDMI) on soil respiration. The SDMI application boosted the soil microbial respiration which accelerated the decomposition of straw due to N fertilization. The C/N ratio did not affect the microbial respiration at elongation and heading stages, whereas N fertilization enhanced the microbial respiration to a greater extent than the unfertilized control. Additionally, the interaction between sampling time and basal N application significantly affected microbial respiration.

    Gong et al.[95] apprised the effect of conventional rotary tillage and deep ploughing on soil respiration in winter wheat and observed that deep ploughing resulted in a higher soil respiration rate than conventional rotary tillage. Soil moisture content and temperature are the dominating agents influencing soil respiration which is restricted by the soil porosity.

    Soil organic carbon plays a vital role in regulating various soil functions and ecosystem services. It is influenced by numerous factors like tillage practices and fertilization. Moreover, modified management practices may prove beneficial to avoid SOC loss by increasing its content. An exogenous supply of fertilizers may alter the chemical conditions of soil and thus result in transformation of SOC. Tillage practices lead to frequent soil disturbances which reduce the size of soil aggregates and accelerate the oxidation of SOC thereby reducing its content. The literature on the influence of fertilization and tillage practices on the transformation of SOC is discussed below.

    Soil organic carbon is a major part of the global carbon cycle which is associated not only with the soil but also takes part in the C cycling through vegetation, oceans and the atmosphere (Figs 1 & 2). Soil acts as a sink of approximately 1,500 Pg of C up to 1 m depth, which is greater than its storage in the atmosphere (approximately 800 Pg C) and terrestrial vegetation (500 Pg C) combined[96]. This dynamic carbon reservoir is continuously cycling in diverse molecular forms between the different carbon pools[97]. Fertilization (both organic and mineral) is one of the crucial factors that impart a notable influence on OC accretion in the soil. Many researchers have studied the soil C dynamics under different fertilizer treatments. Though inorganic fertilizers possess the advantage of easy handling, application and storage, they do not contribute to soil organic carbon. On the contrary, regardless of management method, plant residues are known to increase organic carbon content.

    Figure 1.  Impact of different fertilization regimes on abundance of the microbial biomarker groups . Error bars represent the standard error of the means and different letters indicate significant differences at p < 0.05 among treatments. Source: Li et al.[60].
    Figure 2.  Soil organic carbon (SOC) dynamics in the global carbon cycle.

    Katkar et al.[98] reported a higher soil quality index under conjunctive nutrient management strategies comprising addition of compost and green leaves along with mineral nutrients. Mazumdar et al.[99] investigated the impact of crop residue (CR), FYM, and leguminous green manure (GM) on SOC in continuous rice-wheat cropping sequence over a 25-year period. At the surface layer, the maximum SOC content was recorded under NPK + FYM than NPK + CR and NPK + GM treatments. SOC was significantly lower under sole application of INFs (NPK) than the mixed application of organic and inorganic treatments. A higher range of SOC content was recorded at a depth of 0.6 m in the rice-wheat system (1.8–6.2 g kg−1) in farmyard manure (FYM)-treated plots than 1.7–5.3 g kg−1 under NPK, and 0.9–3.0 g kg−1 in case of unfertilized plots[100]. In a research study Dutta et al.[101] reported that rice residue had a higher decomposition rate (k¼ 0.121 and 0.076 day−1) followed by wheat (0.073 and 0.042 day−1) and maize residues (0.041 day−1) when their respective residues placed on soil surface than incorporated in the soils. Naresh et al.[102] found FYM and dhaincha as GM/ sulphitation press mud (SPM) treatments are potent enough to enhance the SOC. Maximum SOC content was noted in 0–5 cm depth that reduced gradually along the profile. In surface soil, the total organic content (TOC) under different treatments varied with source used to supply a recommended dose of nitrogen (RDN) along with conventional fertilizer (CF).

    Cai et al.[103] ascertained that long-term manure application significantly improved SOC content in different size fractions which followed the sequence: 2,000–250 μm > 250–53 μm > 53 μm fraction. Naresh et al.[22] determined that mean SOC content increased from 0.54% in control to 0.65% in RDF and 0.82% in RDF + FYM treatment and improved enzyme activity; thus, ultimately influenced nutrient dynamics under field conditions. The treatments RDF + FYM and NPK resulted in 0.28 Mg C ha−1 yr−1 and 0.13 Mg C ha−1 yr−1, respectively and thus higher sequestration than control. Zhao et al.[104] determined that in the surface layer, significant increase in SOC content in each soil aggregate was noticed under straw incorporation treatments over no straw incorporated treatments (Fig. 3). Moreover, the aggregate associated OC was significantly higher in the surface layer than the sub-surface layer. The highest increment in aggregate-associated OC was noted in both maize and wheat straw (MR-WR) added plots followed by MR and least in WR. Besides, all of the three straw-incorporated treatments exhibited notable increase in SOC stock in each aggregate fraction in the surface layer of the soil. In the subsurface (20−40 cm) layer under MR-WR, significant rise in SOC stock of small macro-aggregates was observed, whereas there was a reduction in SOC stock in the silt + clay fraction than other treatments. The straw-incorporated treatments increased the quantity of mineral-associated organic matter (mSOM) and intra-aggregate particulate organic matter, (iPOM) within small macro-aggregates and micro-aggregates especially in the topmost layer of the soil.

    Figure 3.  Distribution of OC in coarse iPOM (intra-aggregate particulate organic matter) fine iPOM, mSOM (mineral-associated matter), and free LF (free light fraction) of small macro-aggregates and micro-aggregates in the 0–20 cm and 20–40 cm soil layers under MR-WR (return of both maize and wheat straw), MR (maize straw return), WR (wheat straw return). Different lowercase and uppercase letters indicate significant differences at p < 0.05 among treatments and depths respectively[104].

    Srinivasarao et al.[105] reported that SOC content was reduced with the addition of INFs (100% RDN) alone as compared to the conjunctive application of inorganic and organic or sole FYM treatments. Earlier, Srinivasarao et al.[106] reported that FYM treated plots exhibited greater per cent increase in SOC stock than mineral fertilized plots and control. Tong et al.[107] ascertained that the application of NP and NPK significantly improved SOC stocks. On the contrary, fertilized soils could also exhibit decrease in carbon content than control. Naresh et al.[108] determined that higher biomass C input significantly resulted in greater particulate organic carbon (POC) content. Zhang et al.[109] ascertained that long-term addition of NPK and animal manures significantly improved SOC stocks by a magnitude of 32%−87% whereas NPK and wheat/ and or maize straw incorporation enhanced the C stocks by 26%−38% than control. Kamp et al.[110] determined that continuous cultivation without fertilization decreased SOC content by 14% than uncultivated soil. However, super optimum dose of NPK, balanced NPK fertilization and integration of NPK with FYM not only improved SOC content but also SOC stocks over the first year. In conventionally tilled cotton-growing soils of southern USA, Franzluebbers et al.[111] estimated that carbon sequestration averaged 0.31 ± 0.19 Mg C ha−1 yr−1. Mandal et al.[112] reported maximum SOC stock in the surface layer of the soil (0–15 cm) which progressively diminished with depth in each land use system. A significant decrease in SOC stock along the profile depth was also observed by Dhaliwal et al.[47] in both croplands and agroforestry. In the topmost soil layer, highest SOC stock was recorded in rice–fallow system while the lowest was in the guava orchard[112].

    Nath et al.[113] determined that there was accrual of higher TOC in surface layers as compared to lower layers of soil under paddy cultivation. This accrual could be adduced to left-over crop residues and remnant root biomass which exhibited a decreasing trend with soil depth. Das et al.[114] determined that integrated use of fertilizers and organic sources resulted in greater TOC as compared to control or sole fertilizer application. Fang et al.[115] observed that the cumulative carbon mineralization differed with aggregate size in top soils of broad-leaved forests (BF) and coniferous forests (CF). However, in deep soil it was greater in macro-aggregates as compared to micro-aggregates in BF but not in CF (Fig. 4). By and large, the percent SOC mineralized was greater in macro-aggregates as compared to micro-aggregates. Dhaliwal et al.[100] ascertained that SOC accrual was considerably influenced by residue levels and tillage in surface soil (0−20 cm); albeit no variation was observed at lower depth (20−40 cm). The SOC content was greater in zero-tilled and permanently raised beds incorporated with residues as compared to puddled transplanted rice and conventionally planted wheat. Pandey et al.[116] reported that no-tillage prior to sowing of rice and wheat increased soil organic carbon by 0.6 Mg C ha–1 yr–1. The carbon sequestration rate on account of no-tillage or reduced tillage ranged between 0−2,114 kg ha–1 yr–1 in the predominant cropping system of South Asia, Xue et al.[117] observed that the long-term conventional tillage, by and large, exhibited a significant decline in SOC owing to degradation of soil structure, exposing protected soil organic matter (intra-soil aggregates) to microbes. Therefore, the adoption of no-tillage could hamper the loss of SOC thereby resulting in a greater or equivalent quantity of carbon in comparison to CT (Fig. 5).

    Figure 4.  (a) Soil aggregate fractions of two depths in two restored plantations of subtropical China, (b) organic carbon and (c) its mineralization from various soil aggregates within 71 d at various soil depths in two restored plantations of subtropical China. Error bars show the standard error of the mean. The different letters represent significant differences among the different soil aggregate fractions within a depth at p < 0.05[115].
    Figure 5.  The concentrations of (a) SOC, (b) total nitrogen (TN), and (c) soil C:N ratio for 0–50 cm profile under different tillage treatments in 2012 and 2013. NT = no-till with residue retention; RT = rotary tillage with residue incorporation; PT = plow tillage with residue incorporation; and PT0 = plow tillage with residue removed. The lowercase letters indicate statistical difference among treatments at p < 0.05[117].

    Singh et al.[118] determined that carbon stock in the 0-40 cm layer increased by 39, 35 and 19% in zero-tilled clay loam, loam, and sandy loam soils, respectively as compared to conventional tilled soils over a period of 15 years. Kuhn et al.[119] also apprised about the advantages of NT over CT vis-a-vis SOC stocks across soil depths. In the surface layer (0−20 cm) NT, by and large, resulted in higher SOC stocks as compared to CT; however, SOC stocks exhibited a declining trend with soil depth, in fact, became negative at depths lower than 20 cm. Sapkota et al.[120] observed that over a period of seven years, direct dry-seeded rice proceeded by wheat cultivation with residue retention enhanced SOC at 0-60 cm depth by a magnitude of 4.7 and 3.0 t C ha−1 in zero-tillage (ZTDSR-ZTW + R) and without tillage (PBDSR-PBW + R), respectively. On the contrary, the conventional tillage rice-wheat cropping system (CTR-CTW) decreased the SOC up to 0.9 t C ha−1 (Table 2).

    Table 2.  Influence of tillage and crop establishment methods on SOC stock and its temporal variation under rice–wheat system[120].
    Tillage and crop establishment methodsDepths (m)
    0–0.050.05–0.150.15–0.30.3–0.60–0.6
    Total SOC (t/ha)
    CTR-CTW3.5e7.1c8.77.026.2c
    CTR-ZTW3.9d7.6bc8.86.526.7c
    ZTDSR-CTW4.2d7.5bc9.26.327.3c
    ZTDSR-ZTW4.9c8.9ab8.26.228.2bc
    ZTDSR-ZTW+R6.1a9.0ab9.86.831.8a
    PBDSR-PBW+R5.5b9.3a9.36.030.1ab
    MSD0.41.72.01.42.49
    Treatment effect
    (p value)
    < 0.0010.040.1580.267< 0.001
    Initial SOC content3.6 ±
    0.15
    8.1 ±
    1.39
    8.78 ±
    1.07
    6.7 ±
    0.73
    27.1 ±
    1.21
    Change in SOC over seven years (t/ha)
    CTR-CTW−0.16−0.99−0.040.28−0.90
    CTR-ZTW0.28−0.500.01−0.20−0.41
    ZTDSR-CTW0.62−0.570.45−0.340.16
    ZTDSR-ZTW1.340.84−0.62−0.461.09
    ZTDSR-ZTW+R2.490.961.040.164.66
    PBDSR-PBW+R1.891.220.51−0.642.98
    CTR-CTW = Conventionally tilled puddled transplanted rice followed by conventionally tilled wheat, CTR-ZTW = Conventionally tilled puddled transplanted rice followed by zero-tilled wheat, ZTDSR-CTW = Zero-tilled direct dry-seeded rice followed by conventionally tilled wheat, ZTDSR-ZTW = Zero-tilled direct dry-seeded rice followed by zero-tilled wheat, ZTDSR-ZTW+R = Zero-tilled direct dry-seeded rice followed by zero-tilled wheat with residue retention, PBDSR-PBW+R = Direct dry-seeded rice followed by direct drilling of wheat both on permanent beds with residue retention, MSD, minimum significant difference. Significant different letters indicate significant differences at p < 0.05.
     | Show Table
    DownLoad: CSV

    Labile organic carbon (LC) is that fraction of SOC that is rapidly degraded by soil microbes, therefore, having the highest turnover rate. This fraction can turn over quickly on account of the change in land use and management strategies. From the crop production perspective, this fraction is crucial as it sustains the soil food cycle and, hence, considerably impacts nutrient cycling thereby altering soil quality and productivity. Short-term management could influence the labile fraction of carbon[121]. However, some site-specific problems and regional factors may influence their distribution in soil layers[102].

    Banger et al.[122] observed significant alteration in labile pools of C, for instance, particulate organic matter (POM), water-soluble C (WSC) and light fraction of C (LFC) because of the addition of fertilizers and/or FYM over a 16-year period. Particulate organic matter, LFC and WSC contributed 24%–35%, 12%–14% and 0.6%–0.8%, respectively, towards SOC. The increase in concentration of SOC including its pools like POC and the sequestration rate due to integrated nutrient management was also reported by Nayak et al.[123]. Gu et al.[124] observed that mulch-treated soils (straw and grass mulch) had significantly greater levels of LOC, POC, DOC and EOC as compared to no mulch-treated soils which could be adduced to the addition of straw, root and its sections into the soil. The content of labile C fractions across all treatments exhibited a decreasing trend with soil depth[23, 102, 125].

    In a long-term experiment, Anantha et al.[126] observed that the total organic carbon apportioned into labile carbon, non-labile, less labile, and very labile carbon constituted around 18.7%, 19.3%, 20.6% and 41.4% of the TOC, respectively (Table 3). Zhu et al.[20] determined that straw incorporation had a substantial impact on TOC and labile C fractions of the soil which were greater in straw incorporated treatments as compared to non-straw treatments across all the depths. Wang et al.[127] reported that the light fraction organic carbon (LFOC) and DOC were significantly greater in the straw-applied treatments than the control by a magnitude of 7%–129% for both the early and late season rice. The treatments NPK + FYM or NPK + GR + FYM resulted in greater content of very labile and labile C fractions whereas non-labile and less labile fractions were greater in control and NPK + CR treatment. There was 40.5% and 16.2% higher C build-up in sole FYM treated plots and 100% NPK + FYM, respectively over control. On the other hand, a net depletion of 1.2 and 1.8 Mg ha−1 in carbon stock was recorded under 50% NPK and control treatments, respectively. Out of the total C added through FYM, only 28.9% was stabilized as SOC, though an external supply of OM is a significant source of soil organic carbon[69]. Hence, to sustain the optimum SOC level at least an input of 2.3 Mg C ha−1 y−1 is required. A comparatively greater quantity of soil C in passive pools was observed in 100% NPK + FYM treatment. The increase in allocation of C into the passive pool was about 33%, 35%, 41% and 39% of TOC in control, suboptimal dose, optimal dose and super optimal dose of NPK which indicates that the concentration of passive pools increased with an increase in fertilization doses. Water-soluble carbon (WSC) was 5.48% greater in the upper soil layer as compared to lower layer of soil. In surface soil (0−15 cm), the values of light fraction carbon (LFC) were 81.3, 107.8, 155.2, 95.7, 128.8, 177.8 and 52.7 mg kg−1 in ZT without residue retention, ZT with 4 t ha−1 residue retention, ZT with 6 t ha−1 residue retention, FIRB without residue addition and FIRB with 4 and 6 t ha−1 residue addition and CT, respectively (Table 4). Tiwari et al.[128] determined that the decrease in POC was due to reduction in fine particulate organic matter in topsoil whereas decrement in dissolved organic carbon was observed largely in subsoil. Therefore, in surface soils fine POC and LFOC might be regarded as preliminary evidence of organic C alteration more precisely, while DOC could be considered as a useful indicator for subsoil. Reduction in allocations of fine POC, LFOC and DOC to SOC caused by tillage and straw management strategies indicated the decline in quality of SOC. A higher SOC concentration was recorded in the conjoint application of INF + FYM (0.82%) and sole application of INF (0.65%) than control (0.54%). Kumar et al.[83] reported that the CT without residue retention had significantly lower labile carbon fractions (27%–48%) than zero-tillage with 6-ton residue retention. Moreover, residue-retained fertilized treatments had significantly greater labile fractions of C than sole fertilized treatments[125]. Kumar et al.[83] reported highest change in DOC in zero-till with residue retention (28.2%) in comparison to conventional tillage practices. In ZT, absence of soil perturbations resulted in sustained supply of organic substrata for soil microbes which increases their activity. On the contrary, CT practices resulted in higher losses of C as CO2 due to frequent disturbances.

    Table 3.  Oxidisable organic carbon fractions in soils (g kg−1) at different layers[126].
    TreatmentDepths (cm)
    0−1515−3030−45Total
    Very Labile C
    Control3.6 ± 0.5c1.4 ± 0.3b1.3 ± 0.2a6.3 ± 0.4b
    50% NPK4.6 ± 0.3bc2.1 ± 0.7ab1.5 ± 0.1a8.1 ± 0.9a
    100% NPK4.4 ± 0.3bc2.3 ± 0.2a1.4 ± 0.5a8.0 ± 0.7a
    150% NPK5.0 ± 0.2ab2.6 ± 0.2a1.5 ± 0.1a9.0 ± 0.3a
    100% NPK + FYM4.8 ± 0.2ab2.0 ± 0.2ab1.3 ± 0.3a8.1 ± 0.2a
    FYM5.9 ± 1.3a2.2 ± 0.2a1.4 ± 0.3a9.5 ± 1.6a
    Fallow4.2 ± 0.7bc1.5 ± 0.5b0.7 ± 0.3b6.3 ± 0.8b
    Lbile C
    Control2.4 ± 0.3a1.0 ± 0.2a0.8 ± 0.4a4.2 ± 0.6a
    50% NPK1.7 ± 0.4ab0.9 ± 0.5a0.7 ± 0.2a3.3 ± 0.7a
    100% NPK1.8 ± 0.4ab0.8 ± 0.5a0.6 ± 0.3a3.2 ± 0.8a
    150% NPK1.2 ± 0.3b0.7 ± 0.2a0.9 ± 0.2a2.8 ± 0.4a
    100% NPK + FYM1.9 ± 0.3ab0.7 ± 0.2a0.7 ± 0.3a3.4 ± 0.2a
    FYM2.5 ± 0.9a0.7 ± 0.3a0.7 ± 0.2a3.9 ± 0.9a
    Fallow2.2 ± 1.0ab1.0 ± 0.3a1.0 ± 0.4a4.1 ± 1.1a
    Less labile C
    Control1.5 ± 0.3c0.6 ± 0.4c0.4 ± 0.0c2.6 ± 0.7d
    50% NPK1.8 ± 0.1c0.4 ± 0.1c0.5 ± 0.2c2.7 ± 0.1cd
    100% NPK2.5 ± 0.3ab0.8 ± 0.1bc1.1 ± 0.2ab4.4 ± 0.1b
    150% NPK2.6 ± 0.2a0.9 ± 0.1bc0.4 ± 0.2c3.9 ± 0.1b
    100% NPK + FYM2.7 ± 0.6a1.5 ± 0.2a1.4 ± 0.1a5.6 ± 0.7a
    FYM1.9 ± 0.7bc1.7 ± 0.2a1.0 ± 0.2b4.5 ± 0.7ab
    Fallow1.5 ± 0.3c1.3 ± 0.7ab0.9 ± 0.4b3.8 ± 1.2bc
    Non labile C
    Control1.2 ± 0.5b1.2 ± 0.3a0.2 ± 0.2b2.6 ± 0.5b
    50% NPK1.2 ± 0.9b1.7 ± 0.8a0.7 ± 0.4ab3.5 ± 1.8ab
    100% NPK1.3 ± 0.6b1.5 ± 0.6a0.5 ± 0.2ab3.3 ± 1.0ab
    150% NPK1.4 ± 0.3b1.5 ± 0.2a0.8 ± 0.1a3.7 ± 0.3ab
    100% NPK + FYM2.0 ± 0.8b1.3 ± 0.1a0.3 ± 0.3ab3.5 ± 0.7ab
    FYM3.7 ± 1.3a1.0 ± 0.2a0.5 ± 0.5ab5.1 ± 1.9a
    Fallow2.1 ± 0.2b1.4 ± 0.7a0.4 ± 0.2ab3.9 ± 0.9ab
    Values in the same column followed by different letters are significantly different at p < 0.001, ± indicates the standard deviation values of the means.
     | Show Table
    DownLoad: CSV
    Table 4.  Influence of tillage and nitrogen management on distribution of carbon fractions in soil[83].
    TreatmentsWSOC
    (g kg−1)
    SOC
    (g kg−1)
    OC
    (g kg−1)
    BC
    (g kg−1)
    POC
    (mg kg)
    PON
    (mg kg−1)
    LFOC
    (mg kg−1)
    LFON
    (mg kg−1)
    Depths (cm)
    0−1515−300−1515−300−1515−300−1515−300−1515−300−1515−300−1515−300−1515−30
    Tillage practices
    ZTR28.826.223.119.39.619.134.694.281342.8967.9119.5108.1194.7154.814.812.3
    ZTWR25.324.618.414.87.877.213.763.19981.1667.494.686.5120.5104.711.810.3
    RTR27.025.922.418.28.688.174.133.871230.2836.9109.797.8170.9144.913.711.6
    RTWR23.721.818.114.27.667.073.122.96869.4604.482.676.6107.197.39.78.6
    CTR26.124.421.817.48.497.963.823.481099.1779.498.489.3143.8115.912.810.9
    CT21.820.916.113.16.215.642.892.63617.5481.869.257.690.873.69.67.9
    Nitrogen management
    Control21.114.916.113.16.135.481.581.07709.7658.631.726.3123.9104.36.45.8
    80 kg N ha−128.321.217.814.76.466.162.461.75860.7785.668.456.2132.8116.17.66.9
    120 kg N ha−129.522.119.116.17.256.713.262.18952.2808.989.578.5150.6127.69.78.6
    160 kg N ha−130.223.120.818.27.757.283.822.661099.5823.896.883.4168.5145.710.29.8
    200 kg N ha−131.125.421.318.77.937.484.153.421153.1898.4103.997.3176.2152.911.710.6
    WSOC = Water soluble organic carbon, SOC = Total soil organic carbon, OC = Oxidizable organic carbon, BC =Black carbon, POC = particulate organic carbon, PON = particulate organic nitrogen, LFOC = labile fraction organic carbon, and LFON = labile fraction organic nitrogen. ZTR = Zero tillage with residue retention, ZTWR = Zero tillage without residue retention; RTR = Reduced tillage with residue retention, RTWR = Reduced tillage without residue retention, CTR = Conventional tillage with residue incorporation; CT = Conventional tillage without residue incorporation.
     | Show Table
    DownLoad: CSV

    The soil characteristics such as plant available nutrients, microbial diversity and soil organic carbon transformation are dwindling on account of intensive cultivation under conventional tillage practices, therefore, demand relevant management approaches for soil and crop sustainability. Long-term application of organic amendments significantly increases soil properties by increasing plant available macro, micro, secondary nutrients and soil organic C, whereas the increase in organic C by INF application is, by and large, due to increment in organic C content within macro-aggregates and in the silt + clay compartments. The soil organic carbon and other plant available nutrients were significantly greater in conservation tillage systems as compared to conventional tillage (CT) that conservation approaches could be an exemplary promoter of soil productivity by modifying soil structure thereby protecting SOM and maintaining higher nutrient content. The mean concentration of different fractions of carbon MBN, PMN and soil respiration under integrated nutrient management treatments was higher as compared with to control. Therefore, the conjoint use of organic manures or retention of crop residues with inorganic fertilizers is imperative to reduce the depletion of SOC while sustaining crop production as a realistic alternative. Future research should focus mainly on the usage of organic and mineral fertilizers in conjunction with conservation tillage approaches to sustain the soil environment.

    The authors confirm contribution to the paper as follows: study conception and design: Dhaliwal SS, Shukla AK, Randhawa MK, Behera SK; data collection: Sanddep S, Dhaliwal SS, Behera SK; analysis and interpretation of results: Dhaliwal SS, Gagandeep Kaur, Behera SK; draft manuscript preparation: Dhaliwal SS, walia, Shukla AK, Toor AS, Behera SK, Randhawa MK. All authors reviewed the results and approved the final version of the manuscript.

    Data sharing not applicable to this article as no datasets were generated or analyzed during the current study.

    The support rendered by the Departemnt of Soil Science, PAU, Ludhiana, RVSKVV, Gwailor, CSSRI, Karnal, IISS, Bhopal, School of Organic Farming, PAU Ludhiana and Washington State University, USA is fully acknowledged .

  • The authors declare that they have no conflict of interest.

  • Supplemental Table S1 List of structural genes involved in the anthocyanin biosynthesis pathway except the UDP‑glycosyltransferase (UGT) family in Rosa chinensis genome.
    Supplemental Table S2 Members of GST genes in Arabidopsis thaliana.
    Supplemental Table S3 Primer sequences of genes used for qRT-PCR analysis.
    Supplemental Table S4 The protein sequences encoded by transcripts of key genes.
    Supplemental Table S5 Members of GST and GST-p genes in Rosa chinensis and their sequence characteristics.
    Supplemental Table S6 Functionally identified GSTs in other plants.
    Supplemental Table S7 Other candidate genes involved in anthocyanin transport
    Supplemental Table S8 Key differential expressed genes during the post-anthesis color change in butterfly rose.
    Supplemental Table S9 Functionally identified R2R3-MYBs in other plants.
    Supplemental Table S10 Some differential expressed genes involved in anthocyanin-related pathway.
    Supplemental Fig. S1 Conserved domains of representative GST genes in Arabidopsis thaliana.
    Supplemental Fig. S2 Conserved domains of 80 full-length GST genes in Rosa chinensis genome.
    Supplemental Fig. S3 Expression patterns of four candidate transcription factors in different samples of Rosa hybrida 'Spectra'. Data are presented as the mean ± standard error (Student's t-test, *p < 0.05, ***p < 0.001).
  • [1]

    Boehm MMA, Ojeda DI, Cronk QCB. 2017. Dissecting the 'bacon and eggs' phenotype: transcriptomics of post-anthesis colour change in Lotus. Annals of Botany 120:563−75

    doi: 10.1093/aob/mcx090

    CrossRef   Google Scholar

    [2]

    Zhang Y, Zhao X, Huang S, Zhang L, Zhao J. 2012. Temporal pattern of floral color change and time retention of post-change flowers in Weigela japonica var. sinica (Caprifoliaceae). Journal of Systematics and Evolution 50:519−26

    doi: 10.1111/j.1759-6831.2012.00218.x

    CrossRef   Google Scholar

    [3]

    Brito VLG, Weynans K, Sazima M, Lunau K. 2015. Trees as huge flowers and flowers as oversized floral guides: the role of floral color change and retention of old flowers in Tibouchina pulchra. Frontiers in Plant Science 6:362

    doi: 10.3389/fpls.2015.00362

    CrossRef   Google Scholar

    [4]

    Weiss MR. 1995. Floral color change: a widespread functional convergence. American Journal of Botany 82:167−85

    doi: 10.1002/j.1537-2197.1995.tb11486.x

    CrossRef   Google Scholar

    [5]

    Monniaux M. 2023. Unusual suspects in flower color evolution. Science 379:534−35

    doi: 10.1126/science.adg2774

    CrossRef   Google Scholar

    [6]

    Xia Y, Chen W, Xiang W, Wang D, Xue B, et al. 2021. Integrated metabolic profiling and transcriptome analysis of pigment accumulation in Lonicera japonica flower petals during colour-transition. BMC Plant Biology 21:98

    doi: 10.1186/s12870-021-02877-y

    CrossRef   Google Scholar

    [7]

    Amrhein N, Frank G. 1989. Anthocyanin formation in the petals of Hibiscus mutabilis L. Zeitschrift für Naturforschung C 44:357−60

    doi: 10.1515/znc-1989-5-604

    CrossRef   Google Scholar

    [8]

    Macnish AJ, Jiang C, Negre-Zakharov F, Reid MS. 2010. Physiological and molecular changes during opening and senescence of Nicotiana mutabilis flowers. Plant Science 179:267−72

    doi: 10.1016/j.plantsci.2010.05.011

    CrossRef   Google Scholar

    [9]

    Farzad M, Griesbach R, Hammond J, Weiss MR, Elmendorf HG. 2003. Differential expression of three key anthocyanin biosynthetic genes in a color-changing flower, Viola cornuta cv. yesterday, today and tomorrow. Plant Science 165:1333−42

    doi: 10.1016/j.plantsci.2003.08.001

    CrossRef   Google Scholar

    [10]

    Fukuchi-Mizutani M, Akagi M, Ishiguro K, Katsumoto Y, Fukui Y, et al. 2011. Biochemical and molecular characterization of anthocyanidin/flavonol 3-glucosylation pathways in Rosa×hybrida. Plant Biotechnology 28:239−44

    doi: 10.5511/plantbiotechnology.10.1220a

    CrossRef   Google Scholar

    [11]

    Li M, Sun Y, Lu X, Debnath B, Mitra S, et al. 2019. Proteomics reveal the profiles of color change in Brunfelsia acuminata flowers. International Journal of Molecular Sciences 20:2000

    doi: 10.3390/ijms20082000

    CrossRef   Google Scholar

    [12]

    Yan J, Wang M, Zhang L. 2018. Light induces petal color change in Quisqualis indica (Combretaceae). Plant Diversity 40:28−34

    doi: 10.1016/j.pld.2017.11.004

    CrossRef   Google Scholar

    [13]

    McGimpsey VJ, Lord JM. 2015. In a world of white, flower colour matters: a white–purple transition signals lack of reward in an alpine Euphrasia. Austral Ecology 40:701−08

    doi: 10.1111/aec.12238

    CrossRef   Google Scholar

    [14]

    Zhao D, Tao J. 2015. Recent advances on the development and regulation of flower color in ornamental plants. Frontiers in Plant Science 6:261

    doi: 10.3389/fpls.2015.00261

    CrossRef   Google Scholar

    [15]

    Xu W, Dubos C, Lepiniec L. 2015. Transcriptional control of flavonoid biosynthesis by MYB–bHLH–WDR complexes. Trends in Plant Science 20:176−85

    doi: 10.1016/j.tplants.2014.12.001

    CrossRef   Google Scholar

    [16]

    Raymond O, Gouzy J, Just J, Badouin H, Verdenaud M, et al. 2018. The Rosa genome provides new insights into the domestication of modern roses. Nature Genetics 50:772−77

    doi: 10.1038/s41588-018-0110-3

    CrossRef   Google Scholar

    [17]

    Yan Y, Zhao J, Lin S, Li M, Liu J, et al. 2023. Light-mediated anthocyanin biosynthesis in rose petals involves a balanced regulatory module comprising transcription factors RhHY5, RhMYB114a, and RhMYB3b. Journal of Experimental Botany 74:erad253

    doi: 10.1093/jxb/erad253

    CrossRef   Google Scholar

    [18]

    He G, Zhang R, Jiang S, Wang H, Ming F. 2023. The MYB transcription factor RcMYB1 plays a central role in rose anthocyanin biosynthesis. Horticulture Research 10: uhad080

    doi: 10.1093/hr/uhad080

    CrossRef   Google Scholar

    [19]

    Wang Y, Xiao Y, Sun Y, Zhang X, Du B, et al. 2023. Two B-box proteins, PavBBX6/9, positively regulate light-induced anthocyanin accumulation in sweet cherry. Plant Physiology 192:2030−48

    doi: 10.1093/plphys/kiad137

    CrossRef   Google Scholar

    [20]

    Zhang S, Chen Y, Zhao L, Li C, Yu J, et al. 2020. A novel NAC transcription factor, MdNAC42, regulates anthocyanin accumulation in red-fleshed apple by interacting with MdMYB10. Tree Physiology 40:413−23

    doi: 10.1093/treephys/tpaa004

    CrossRef   Google Scholar

    [21]

    Alabd A, Ahmad M, Zhang X, Gao Y, Peng L, et al. 2022. Light-responsive transcription factor PpWRKY44 induces anthocyanin accumulation by regulating PpMYB10 expression in pear. Horticulture Research 9:uhac199

    doi: 10.1093/hr/uhac199

    CrossRef   Google Scholar

    [22]

    Jiang S, Chen M, He N, Chen X, Wang N, et al. 2019. MdGSTF6, activated by MdMYB1, plays an essential role in anthocyanin accumulation in apple. Horticulture Research 6:40

    doi: 10.1038/s41438-019-0118-6

    CrossRef   Google Scholar

    [23]

    Kaur S, Sharma N, Kapoor P, Chunduri V, Pandey AK, et al. 2021. Spotlight on the overlapping routes and partners for anthocyanin transport in plants. Physiologia Plantarum 171:868−81

    doi: 10.1111/ppl.13378

    CrossRef   Google Scholar

    [24]

    Marrs KA, Alfenito MR, Lloyd AM, Walbot V. 1995. A glutathione S-transferase involved in vacuolar transfer encoded by the maize gene Bronze-2. Nature 375:397−400

    doi: 10.1038/375397a0

    CrossRef   Google Scholar

    [25]

    Alfenito MR, Souer E, Goodman CD, Buell R, Mol J, et al. 1998. Functional complementation of anthocyanin sequestration in the vacuole by widely divergent glutathione S-transferases. The Plant Cell 10:1135−49

    doi: 10.1105/tpc.10.7.1135

    CrossRef   Google Scholar

    [26]

    Sun Y, Li H, Huang J. 2012. Arabidopsis TT19 functions as a carrier to transport anthocyanin from the cytosol to tonoplasts. Molecular Plant 5:387−400

    doi: 10.1093/mp/ssr110

    CrossRef   Google Scholar

    [27]

    Kitamura S, Akita Y, Ishizaka H, Narumi I, Tanaka A. 2012. Molecular characterization of an anthocyanin-related glutathione S-transferase gene in cyclamen. Journal of Plant Physiology 169:636−42

    doi: 10.1016/j.jplph.2011.12.011

    CrossRef   Google Scholar

    [28]

    Cheng J, Liao L, Zhou H, Gu C, Wang L, et al. 2015. A small indel mutation in an anthocyanin transporter causes variegated colouration of peach flowers. Journal of Experimental Botany 66:7227−39

    doi: 10.1093/jxb/erv419

    CrossRef   Google Scholar

    [29]

    Zhao Y, Dong W, Zhu Y, Allan AC, Lin-Wang K, et al. 2020. PpGST1, an anthocyanin-related glutathione S-transferase gene, is essential for fruit coloration in peach. Plant Biotechnology Journal 18:1284−95

    doi: 10.1111/pbi.13291

    CrossRef   Google Scholar

    [30]

    Pérez-Díaz R, Madrid-Espinoza J, Salinas-Cornejo J, González-Villanueva E, Ruiz-Lara S. 2016. Differential roles for VviGST1, VviGST3, and VviGST4 in proanthocyanidin and anthocyanin transport in Vitis vinífera. Frontiers in Plant Science 7:1166

    doi: 10.3389/fpls.2016.01166

    CrossRef   Google Scholar

    [31]

    Hu B, Zhao J, Lai B, Qin Y, Wang H, et al. 2016. LcGST4 is an anthocyanin-related glutathione S-transferase gene in Litchi chinensis Sonn. Plant Cell Reports 35:831−43

    doi: 10.1007/s00299-015-1924-4

    CrossRef   Google Scholar

    [32]

    Luo H, Dai C, Li Y, Feng J, Liu Z, et al. 2018. Reduced Anthocyanins in Petioles codes for a GST anthocyanin transporter that is essential for the foliage and fruit coloration in strawberry. Journal of Experimental Botany 69:2595−608

    doi: 10.1093/jxb/ery096

    CrossRef   Google Scholar

    [33]

    Wei K, Wang L, Zhang Y, Ruan L, Li H, et al. 2019. A coupled role for CsMYB75 and CsGSTF1 in anthocyanin hyperaccumulation in purple tea. The Plant Journal 97:825−40

    doi: 10.1111/tpj.14161

    CrossRef   Google Scholar

    [34]

    Kou M, Liu Y, Li Z, Zhang Y, Tang W, et al. 2019. A novel glutathione S-transferase gene from sweetpotato, IbGSTF4, is involved in anthocyanin sequestration. Plant Physiology and Biochemistry 135:395−403

    doi: 10.1016/j.plaphy.2018.12.028

    CrossRef   Google Scholar

    [35]

    Wang R, Lu N, Liu C, Dixon RA, Wu Q, et al. 2022. MtGSTF7, a TT19-like GST gene, is essential for accumulation of anthocyanins, but not proanthocyanins in Medicago truncatula. Journal of Experimental Botany 73:4129−46

    doi: 10.1093/jxb/erac112

    CrossRef   Google Scholar

    [36]

    Goodman CD, Casati P, Walbot V. 2004. A multidrug resistance–associated protein involved in anthocyanin transport in Zea mays. The Plant Cell 16:1812−26

    doi: 10.1105/tpc.022574

    CrossRef   Google Scholar

    [37]

    Francisco RM, Regalado A, Ageorges A, Burla BJ, Bassin B, et al. 2013. ABCC1, an ATP binding cassette protein from grape berry, transports anthocyanidin 3-O-glucosides. The Plant Cell 25:1840−54

    doi: 10.1105/tpc.112.102152

    CrossRef   Google Scholar

    [38]

    Gomez C, Terrier N, Torregrosa L, Vialet S, Fournier-Level A, et al. 2009. Grapevine MATE-type proteins act as vacuolar H+-dependent acylated anthocyanin transporters. Plant Physiology 150:402−15

    doi: 10.1104/pp.109.135624

    CrossRef   Google Scholar

    [39]

    Zhu Q, Xie X, Zhang J, Xiang G, Li Y, et al. 2013. In silico analysis of a MRP transporter gene reveals its possible role in anthocyanins or flavonoids transport in Oryze sativa. American Journal of Plant Sciences 4:555−60

    doi: 10.4236/ajps.2013.43072

    CrossRef   Google Scholar

    [40]

    Behrens CE, Smith KE, Iancu CV, Choe J, Dean JV. 2019. Transport of anthocyanins and other flavonoids by the Arabidopsis ATP-binding cassette transporter AtABCC2. Scientific Reports 9:437

    doi: 10.1038/s41598-018-37504-8

    CrossRef   Google Scholar

    [41]

    Marinova K, Pourcel L, Weder B, Schwarz M, Barron D, et al. 2007. The Arabidopsis MATE transporter TT12 acts as a vacuolar flavonoid/H+-antiporter active in proanthocyanidin-accumulating cells of the seed coat. The Plant Cell 19:2023−38

    doi: 10.1105/tpc.106.046029

    CrossRef   Google Scholar

    [42]

    Pal L, Dwivedi V, Gupta SK, Saxena S, Pandey A, et al. 2023. Biochemical analysis of anthocyanin and proanthocyanidin and their regulation in determining chickpea flower and seed coat colour. Journal of Experimental Botany 74:130−48

    doi: 10.1093/jxb/erac392

    CrossRef   Google Scholar

    [43]

    Mathews H, Clendennen SK, Caldwell CG, Liu XL, Connors K, et al. 2003. Activation tagging in tomato identifies a transcriptional regulator of anthocyanin biosynthesis, modification, and transport. The Plant Cell 15:1689−703

    doi: 10.1105/tpc.012963

    CrossRef   Google Scholar

    [44]

    Zhao J, Huhman D, Shadle G, He X, Sumner LW, et al. 2011. MATE2 mediates vacuolar sequestration of flavonoid glycosides and glycoside malonates in Medicago truncatula. The Plant Cell 23:1536−55

    doi: 10.1105/tpc.110.080804

    CrossRef   Google Scholar

    [45]

    Shisa M, Takano T. 1964. Effect of temperature and light on the coloration of rose flowers. Journal of the Japanese Society for Horticultural Science 33:140−46

    doi: 10.2503/jjshs.33.140

    CrossRef   Google Scholar

    [46]

    Hennayake CK, Kanechi M, Yasuda N, Uno Y, Inagaki N. 2006. Irradiation of UV-B induces biosynthesis of anthocyanins in flower petals of rose, Rosa hybrida cv. 'Charleston' and 'Ehigasa'. Environmental Control in Biology 44:103−10

    doi: 10.2525/ecb.44.103

    CrossRef   Google Scholar

    [47]

    Luo J, Li H, Bai B, Yu H, You J. 2013. Effect of light on the anthocyanin biosythesis and expression of CHS and DFR in Rosa chinensis 'Spectra'. Molecular Plant Breeding 11:126−31

    Google Scholar

    [48]

    Su M, Damaris RN, Hu Z, Yang P, Deng J. 2021. Metabolomic analysis on the petal of 'Chen Xi' rose with light-induced color changes. Plants 10:2065

    doi: 10.3390/plants10102065

    CrossRef   Google Scholar

    [49]

    Zhang Y, Wu Z, Feng M, Chen J, Qin M, et al. 2021. The circadian-controlled PIF8–BBX28 module regulates petal senescence in rose flowers by governing mitochondrial ROS homeostasis at night. The Plant Cell 33:2716−35

    doi: 10.1093/plcell/koab152

    CrossRef   Google Scholar

    [50]

    Wan H, Yu C, Han Y, Guo X, Luo L, et al. 2019. Determination of flavonoids and carotenoids and their contributions to various colors of rose cultivars (Rosa spp.). Frontiers in Plant Science 10:123

    doi: 10.3389/fpls.2019.00123

    CrossRef   Google Scholar

    [51]

    Wan H, Yu C, Han Y, Guo X, Ahmad S, et al. 2018. Flavonols and carotenoids in yellow petals of rose cultivar (Rosa 'Sun City'): a possible rich source of bioactive compounds. Journal of Agricultural and Food Chemistry 66:4171−81

    doi: 10.1021/acs.jafc.8b01509

    CrossRef   Google Scholar

    [52]

    Ren C, Chen C, Dong S, Wang R, Xian B, et al. 2022. Integrated metabolomics and transcriptome analysis on flavonoid biosynthesis in flowers of safflower (Carthamus tinctorius L.) during colour-transition. PeerJ 10:e13591

    doi: 10.7717/peerj.13591

    CrossRef   Google Scholar

    [53]

    Han Y, Yu J, Zhao T, Cheng T, Wang J, et al. 2019. Dissecting the genome-wide evolution and function of R2R3-MYB transcription factor family in Rosa chinensis. Genes 10:823

    doi: 10.3390/genes10100823

    CrossRef   Google Scholar

    [54]

    Sun Y, Zhang X, Zhong M, Dong X, Yu D, et al. 2020. Genome-wide identification of WD40 genes reveals a functional diversification of COP1-like genes in Rosaceae. Plant Molecular Biology 104:81−95

    doi: 10.1007/s11103-020-01026-7

    CrossRef   Google Scholar

    [55]

    Ullah I, Yuan W, Uzair M, Li S, Rehman OU, et al. 2022. Molecular characterization of bHLH transcription factor family in rose (Rosa chinensis Jacq.) under Botrytis cinerea infection. Horticulturae 8:989

    doi: 10.3390/horticulturae8110989

    CrossRef   Google Scholar

    [56]

    Li D, Li X, Liu X, Zhang Z. 2023. Comprehensive analysis of bZIP gene family and function of RcbZIP17 on Botrytis resistance in rose (Rosa chinensis). Gene 849:146867

    doi: 10.1016/j.gene.2022.146867

    CrossRef   Google Scholar

    [57]

    Geng L, Su L, Fu L, Lin S, Zhang J, et al. 2022. Genome-wide analysis of the rose (Rosa chinensis) NAC family and characterization of RcNAC091. Plant Molecular Biology 108:605−19

    doi: 10.1007/s11103-022-01250-3

    CrossRef   Google Scholar

    [58]

    Liu X, Li D, Zhang S, Xu Y, Zhang Z. 2019. Genome-wide characterization of the rose (Rosa chinensis) WRKY family and role of RcWRKY41 in gray mold resistance. BMC Plant Biology 19:522

    doi: 10.1186/s12870-019-2139-6

    CrossRef   Google Scholar

    [59]

    Shalmani A, Fan S, Jia P, Li G, Muhammad I, et al. 2018. Genome identification of B-BOX gene family members in seven Rosaceae species and their expression analysis in response to flower induction in Malus domestica. Molecules 23:1763

    doi: 10.3390/molecules23071763

    CrossRef   Google Scholar

    [60]

    Finn RD, Bateman A, Clements J, Coggill P, Eberhardt RY, et al. 2014. Pfam: the protein families database. Nucleic Acids Research 42:D222−D230

    doi: 10.1093/nar/gkt1223

    CrossRef   Google Scholar

    [61]

    Wei L, Zhu Y, Liu R, Zhang A, Zhu M, et al. 2019. Genome wide identification and comparative analysis of glutathione transferases (GST) family genes in Brassica napus. Scientific Reports 9:9196

    doi: 10.1038/s41598-019-45744-5

    CrossRef   Google Scholar

    [62]

    Letunic I, Khedkar S, Bork P. 2021. SMART: recent updates, new developments and status in 2020. Nucleic Acids Research 49:D458−D460

    doi: 10.1093/nar/gkaa937

    CrossRef   Google Scholar

    [63]

    Shao D, Li Y, Zhu Q, Zhang X, Liu F, et al. 2021. GhGSTF12, a glutathione S-transferase gene, is essential for anthocyanin accumulation in cotton (Gossypium hirsutum L.). Plant Science 305:110827

    doi: 10.1016/j.plantsci.2021.110827

    CrossRef   Google Scholar

    [64]

    Katoh K, Standley DM. 2013. MAFFT multiple sequence alignment software version 7: improvements in performance and usability. Molecular Biology and Evolution 30:772−80

    doi: 10.1093/molbev/mst010

    CrossRef   Google Scholar

    [65]

    Kong Y, Wang H, Lang L, Dou X, Bai J. 2022. Effect of developmental stages on genes involved in middle and downstream pathway of volatile terpene biosynthesis in rose petals. Genes 13:1177

    doi: 10.3390/genes13071177

    CrossRef   Google Scholar

    [66]

    Chen C, Chen H, Zhang Y, Thomas HR, Frank MH, et al. 2020. TBtools: an integrative toolkit developed for interactive analyses of big biological data. Molecular Plant 13:1194−202

    doi: 10.1016/j.molp.2020.06.009

    CrossRef   Google Scholar

    [67]

    Jung S, Lee T, Cheng CH, Buble K, Zheng P, et al. 2019. 15 years of GDR: new data and functionality in the Genome Database for Rosaceae. Nucleic Acids Research 47:D1137−D1145

    doi: 10.1093/nar/gky1000

    CrossRef   Google Scholar

    [68]

    Daccord N, Celton JM, Linsmith G, Becker C, Choisne N, et al. 2017. High-quality de novo assembly of the apple genome and methylome dynamics of early fruit development. Nature Genetics 49:1099−106

    doi: 10.1038/ng.3886

    CrossRef   Google Scholar

    [69]

    de Vienne DM. 2016. Lifemap: exploring the entire tree of life. PLoS Biology 14:e2001624

    doi: 10.1371/journal.pbio.2001624

    CrossRef   Google Scholar

    [70]

    Liu M, Xiao F, Zhu J, Fu D, Wang Z, Xiao R. 2023. Combined PacBio Iso-Seq and Illumina RNA-seq analysis of the Tuta absoluta (Meyrick) transcriptome and cytochrome P450 genes. Insects 14:363

    doi: 10.3390/insects14040363

    CrossRef   Google Scholar

    [71]

    Cheng C, Yu Q, Wang Y, Wang H, Dong Y, et al. 2021. Ethylene-regulated asymmetric growth of the petal base promotes flower opening in rose (Rosa hybrida). The Plant Cell 33:1229−51

    doi: 10.1093/plcell/koab031

    CrossRef   Google Scholar

    [72]

    Heberle H, Meirelles GV, da Silva FR, Telles GP, Minghim R. 2015. InteractiVenn: a web-based tool for the analysis of sets through Venn diagrams. BMC Bioinformatics 16:169

    doi: 10.1186/s12859-015-0611-3

    CrossRef   Google Scholar

    [73]

    Szklarczyk D, Kirsch R, Koutrouli M, Nastou K, Mehryary F, et al. 2023. The STRING database in 2023: protein–protein association networks and functional enrichment analyses for any sequenced genome of interest. Nucleic Acids Research 51:D638−D646

    doi: 10.1093/nar/gkac1000

    CrossRef   Google Scholar

    [74]

    Kong Y, Wang H, Lang L, Dou X, Bai J. 2021. Metabolome-based discrimination analysis of five Lilium bulbs associated with differences in secondary metabolites. Molecules 26:1340

    doi: 10.3390/molecules26051340

    CrossRef   Google Scholar

    [75]

    Hennayake CK, Kanechi M, Uno Y, Inagaki N. 2007. Differential expression of anthocyanin biosynthetic genes in 'Charleston' roses. Acta Horticulturae 760:643−50

    doi: 10.17660/actahortic.2007.760.91

    CrossRef   Google Scholar

    [76]

    Lallement PA, Brouwer B, Keech O, Hecker A, Rouhier N. 2014. The still mysterious roles of cysteine-containing glutathione transferases in plants. Frontiers in Pharmacology 5:192

    doi: 10.3389/fphar.2014.00192

    CrossRef   Google Scholar

    [77]

    Liu Y, Qi Y, Zhang A, Wu H, Liu Z, et al. 2019. Molecular cloning and functional characterization of AcGST1, an anthocyanin-related glutathione S-transferase gene in kiwifruit (Actinidia chinensis). Plant Molecular Biology 100:451−65

    doi: 10.1007/s11103-019-00870-6

    CrossRef   Google Scholar

    [78]

    Li B, Zhang X, Duan R, Han C, Yang J, et al. 2022. Genomic analysis of the glutathione S-transferase family in pear (Pyrus communis) and functional identification of PcGST57 in anthocyanin accumulation. International Journal of Molecular Sciences 23:746

    doi: 10.3390/ijms23020746

    CrossRef   Google Scholar

    [79]

    Davis GV, Glover BJ. 2024. Characterisation of the R2R3 Myb subgroup 9 family of transcription factors in tomato. PLoS ONE 19:e0295445

    doi: 10.1371/journal.pone.0295445

    CrossRef   Google Scholar

    [80]

    Muñoz-Gómez S, Suárez-Baron H, Alzate JF, González F, Pabón-Mora N. 2021. Evolution of the subgroup 6 R2R3-MYB genes and their contribution to floral color in the perianth-bearing piperales. Frontiers in Plant Science 12:633227

    doi: 10.3389/fpls.2021.633227

    CrossRef   Google Scholar

    [81]

    Narbona E, del Valle JC, Arista M, Buide ML, Ortiz PL. 2021. Major flower pigments originate different colour signals to pollinators. Frontiers in Ecology and Evolution 9:743850

    doi: 10.3389/fevo.2021.743850

    CrossRef   Google Scholar

    [82]

    Ohashi K, Makino TT, Arikawa K. 2015. Floral colour change in the eyes of pollinators: testing possible constraints and correlated evolution. Functional Ecology 29:1144−55

    doi: 10.1111/1365-2435.12420

    CrossRef   Google Scholar

    [83]

    Farzad M, Griesbach R, Weiss MR. 2002. Floral color change in Viola cornuta L. (Violaceae): a model system to study regulation of anthocyanin production. Plant Science 162:225−31

    doi: 10.1016/S0168-9452(01)00557-X

    CrossRef   Google Scholar

    [84]

    Rezende FM, Clausen MH, Rossi M, Furlan CM. 2020. The regulation of floral colour change in Pleroma raddianum (DC.) gardner. Molecules 25:4664

    doi: 10.3390/molecules25204664

    CrossRef   Google Scholar

    [85]

    Ueda Y, Akimoto S. 2001. Cross- and self-compatibility in various species of the genus Rosa. The Journal of Horticultural Science and Biotechnology 76:392−95

    doi: 10.1080/14620316.2001.11511382

    CrossRef   Google Scholar

    [86]

    Li M, Yang Y, Wang H, Fan Y, Sun P, et al. 2022. Identification and analysis of self incompatibility S-RNase in rose. Acta Horticulturae Sinica 49:157−65

    doi: 10.16420/j.issn.0513-353x.2020-0758

    CrossRef   Google Scholar

    [87]

    Bursch K, Toledo-Ortiz G, Pireyre M, Lohr M, Braatz C, et al. 2020. Identification of BBX proteins as rate-limiting cofactors of HY5. Nature Plants 6:921−28

    doi: 10.1038/s41477-020-0725-0

    CrossRef   Google Scholar

    [88]

    Li Y, Xu P, Chen G, Wu J, Liu Z, et al. 2020. FvbHLH9 functions as a positive regulator of anthocyanin biosynthesis by forming a HY5–bHLH9 transcription complex in strawberry fruits. Plant and Cell Physiology 61:826−37

    doi: 10.1093/pcp/pcaa010

    CrossRef   Google Scholar

    [89]

    Liu H, Su J, Zhu Y, Yao G, Allan AC, et al. 2019. The involvement of PybZIPa in light-induced anthocyanin accumulation via the activation of PyUFGT through binding to tandem G-boxes in its promoter. Horticulture Research 6:134

    doi: 10.1038/s41438-019-0217-4

    CrossRef   Google Scholar

    [90]

    Zhao L, Sun J, Cai Y, Yang Q, Zhang Y, et al. 2022. PpHYH is responsible for light-induced anthocyanin accumulation in fruit peel of Prunus persica. Tree Physiology 42:1662−77

    doi: 10.1093/treephys/tpac025

    CrossRef   Google Scholar

    [91]

    Bai S, Tao R, Tang Y, Yin L, Ma Y, et al. 2019. BBX16, a B-box protein, positively regulates light-induced anthocyanin accumulation by activating MYB10 in red pear. Plant Biotechnology Journal 17:1985−97

    doi: 10.1111/pbi.13114

    CrossRef   Google Scholar

    [92]

    Liu Y, Lin G, Yin C, Fang Y. 2020. B-box transcription factor 28 regulates flowering by interacting with constans. Scientific Reports 10:17789

    doi: 10.1038/s41598-020-74445-7

    CrossRef   Google Scholar

  • Cite this article

    Kong Y, Wang H, Qiu L, Dou X, Lang L, et al. 2024. Anthocyanin contents and molecular changes in rose petals during the post-anthesis color transition. Ornamental Plant Research 4: e020 doi: 10.48130/opr-0024-0019
    Kong Y, Wang H, Qiu L, Dou X, Lang L, et al. 2024. Anthocyanin contents and molecular changes in rose petals during the post-anthesis color transition. Ornamental Plant Research 4: e020 doi: 10.48130/opr-0024-0019

Figures(8)

Article Metrics

Article views(3075) PDF downloads(335)

ARTICLE   Open Access    

Anthocyanin contents and molecular changes in rose petals during the post-anthesis color transition

Ornamental Plant Research  4 Article number: e020  (2024)  |  Cite this article

Abstract: Flower color transitions during anthesis are taxonomically widespread; however, the mechanisms underlying post-anthesis color transition in roses are unclear. In this study, we collected petals of the butterfly rose (Rosa chinensis 'Mutabilis'), a post-anthesis color change cultivar, at different developmental stages and under different treatments. Anthocyanin composition and transcriptome data were analyzed to identify the environmental factors and crucial genes involved in post-anthesis color transition. The results showed that sunlight is a key factor triggering color transition. In butterfly rose flowers, color transition results from an increase in the accumulation of anthocyanins, primarily cyanidin-3-O-glucoside, and cyanidin-3,5-O-diglucoside. A combination of genome-wide identification, RNA-seq analysis, bioinformatics analysis, and quantitative real-time PCR verification revealed that RcUF3GT1 and RcGSTF2 genes were involved in anthocyanin production and anthocyanin transport, respectively. RcMYB114a may play a significant role in anthocyanin biosynthesis during color transition in roses, and RcBBX28 might be a crucial gene involved in this process. These insights contribute to our knowledge of flower color change and have implications for further research on plant genetics and flower color evolution.

    • Flower color change during anthesis, or post-anthesis color change (PACC), is a widespread and natural phenomenon, distinct from simple flower degeneration[1,2]. PACC is generally considered an adaptive signal indicating floral suitability to pollinators by redirecting pollinators to a close range while maintaining long-distance attraction to the plant's floral display[3,4]. PACC is also a favorable trait for horticultural plants as the retention of post-change older flowers enhances floral display size and prolongs the ornamental period.

      PACC is associated with changes in flower pigment composition, primarily of carotenoids and anthocyanins[5]. Color changes resulting from changes in carotenoid content mainly lead to minor hue changes in yellow and white flowers, such as Lonicera japonica[6]. Conversely, more striking color transitions are often accompanied by shifts in anthocyanin composition. Many plants exhibit PACC because of an increase or decrease in anthocyanin content, resulting in significant color changes; for example, the post-anthesis transition in flower color from white to red in Hisbiscus mutabilis[7], white to pink in Nicotiana mutabilis[8], white to purple in Viola cornuta 'Yesterday, Today and Tomorrow'[9], yellow to red in Lotus filicaulis and Rosa hybrida 'Ehigasa'[1,10], and purple to white in Brunfelsia acuminata[11]. Sunlight and pollination are critical environmental triggers for color changes[9]. For example, petal color change in Quisqualis indica was induced by light[12], and pollination significantly accelerated PACC in Lotus filicaulis and Euphrasia dyeri[1,13].

      The biosynthetic pathway and transcriptional regulation of anthocyanins in plants are well documented[14,15], and many structural genes involved in the anthocyanin biosynthesis pathway have been identified in roses[16]. Several transcription factors associated with the regulation of the anthocyanin biosynthetic pathway have also been characterized, and three MYB-bHLH-WD40 (MBW) complexes (RcMYB1-RcbHLH42-RcTTG1, RcMYB1-RcEGL1-RcTTG1, and MYB114a-bHLH3-WD40) have been linked to anthocyanin accumulation[17,18]. Other transcription factors, such as B-box zinc finger (BBX), NAC (NAM, ATAF, and CUC), and WRKY, also affect the transcriptional regulation of anthocyanin biosynthesis in Rosaceae plants[1921].

      Anthocyanins are biosynthesized on the cytoplasmic surface of the endoplasmic reticulum and transported into the vacuole for storage[22]. Many anthocyanin transport genes have been identified, including ATP-binding cassette (ABC), multidrug and toxic compound extrusion (MATE), and glutathione S-transferase (GST) genes[23]. Various GSTs function as anthocyanin transporters in plants, such as ZmBZ2 in maize (Zea mays)[24], PhAN9 in petunia (Petunia hybrida)[25], AtTT19 (AtGSTF12) in Arabidopsis thaliana[26], CkmGST3 in cyclamen (Cyclamen 'Kaori-no-mai')[27], PpRiant (PpGST1) in peach (Prunus persica)[28,29], VvGST4 in grapevine (Vitis vinifera)[30], LcGST4 in litchi (Litchi chinensis)[31], FvRAP in strawberry (Fragaria vesca)[32], CsGSTF1 in purple tea (Camellia sinensis)[33], IbGSTF4 in Ipomoea batatas[34], MdGSTF6 in apple (Malus × domestica)[22], and MtGSTF7 in Medicago truncatula[35], most of which belong to the Phi(F) class. Additionally, some plant ABC and MATE genes are involved in anthocyanin transport, including ZmMRP3 in maize[36], VvABCC1, VvAM1 and VvAM3 in grapevine[37,38], OsMRP15 in rice (Oryza sativa)[39], AtABCC2 and AtTT12 in A. thaliana[40,41], CaMATE1 in chickpea (Cicer arietinum)[42], SlMTP77 in tomato (Solanum lycopersicum)[43], and MtMATE2 in M. truncatula[44].

      Roses (Rosa spp.) are ornamental plants with global economic importance. Some rose cultivars exhibit a post-anthesis transition from yellow to red/orange-red, such as the flowers of R. hybrida 'Masquerade'[45], R. hybrida 'Ehigasa' and 'Charleston'[46], R. hybrida 'Spectra'[47], and R. hybrida 'Chen Xi'[48]. The flower color change in 'Ehigasa' and 'Charleston' rose is attributed to the accumulation of anthocyanins, and the flowers of 'Chen Xi' and 'Spectra' do not turn red under shading conditions[4648]. However, the mechanisms underlying post-anthesis color transition in roses are unclear. The butterfly rose (R. chinensis 'Mutabilis') is an ancient Chinese rose cultivar with single petals that change from light yellow to pink or dark pink during four-day anthesis. In this study, high-performance liquid chromatography-diode array detection (HPLC-DAD) and transcriptome analyses of butterfly rose samples were employed to determine the anthocyanin composition and molecular changes during PACC and identify the environmental factors influencing the PACC trait. This research offers a comprehensive analysis of the PACC trait in roses, as well as valuable information for understanding flower color evolution.

    • Samples of butterfly rose were collected from Kunming Yang Chinese Rose Gardening Co., Ltd., and planted in the germplasm garden of the Institute of Radiation Technology (116°43' N, 40°16' E) under open field conditions for 2–3 years. The PACC cultivar R. hybrida 'Spectra' was used for to verify candidate genes. Rosa hybrida 'Spectra' was cultivated in the China National Botanical Garden (North Garden). The collection of petal samples was authorized.

      Different floral developmental stages of butterfly rose flowers, namely the bud stage (one day before anthesis, S3), first day of anthesis (D1), second day of anthesis (D2), third day of anthesis (D3), and fourth day of anthesis (senescent flowering stage, D4), were collected from the upper half of the petals between 08:00 and 09:00 on sunny days. More than 30 flowers were collected at each stage. Petal samples with additional anthocyanin coloration on the abaxial surface were excluded. The red part (post-change, SR) and yellow part (pre-change, SY) of the middle-layer petals of R. hybrida 'Spectra' were collected on the fourth or fifth day of anthesis in the morning (equivalent to the D2 stage of butterfly rose). The samples were collected from more than 15 R. hybrida 'Spectra' flowers. The fresh petal samples were cut, weighed, and immediately frozen in liquid nitrogen. Three biological replicates were collected, and samples were frozen and stored at −80 °C.

    • Different treatments were used in this study to investigate the effects of light on butterfly rose petals, with buds about to open wrapped in different bags in the evening until the second day of anthesis (08:00–09:00) before flowering. First, paper bag treatment (PT) with semi-translucent paper bags (sketch tracing paper, Rotring, 78% light transmittance) was used under natural light–dark conditions. Second, aluminum foil bags were used for dark treatment (DT)[49]. Petals were sampled in the morning on the second day of anthesis. Additionally, in the afternoon (17:30) on the first day of anthesis, the flowers (equivalent to stage D1.5) were wrapped in aluminum foil bags until the next morning (08:00–09:00) (D1.5–2), and the petals of stages D1.5 and D1.5–2 were collected. More than 30 flowers were included under PT and DT, with more than 15 flowers collected from D1.5 and D1.5–2. D2 samples, which were opened under natural sunlight, were used as controls.

    • Anthocyanins were extracted according to the methods described by Wan et al.[50]. Approximately 0.1 g (fresh weight) of the sample was ground into a powder, transferred into a centrifuge tube, and extracted overnight at 4 °C using a 2 mL mixture of methanol:water:methane acid:trifluoroacetic acid (70:27:2:1, v/v/v/v). The extracts were centrifuged at 10,000× g and 4 °C for 10 min, and the supernatants were collected and filtrated (PTFE, 0.22 μm, Anpel). HPLC-DAD analysis was performed using an Agilent 1200/G1315D system in the wavelength range of 200–700 nm. The mobile phases comprised 0.5% aqueous formic acid (A) and acetonitrile (B). The gradient program has previously been described by Wan et al.[51]. A Zorbax SB-C18 analytical column (250 mm × 4.6 mm, 5 μm) was used. The column temperature, injection volume, and flow rate were set at 25 °C, 20 μL, and 0.5 mL/min, respectively. Anthocyanins were detected at a wavelength of 520 nm. In preliminary experiments, the anthocyanin composition was analyzed using ultra-performance liquid chromatography-electrospray tandem mass spectrometry (ExionLC AD; MS, Applied Biosystems 6500 Triple Quadrupole) using mixed petals at different developmental stages. Eight major anthocyanin components were identified. Anthocyanins were quantitatively analyzed using an external standard method[50]. Five anthocyanin standards, including cyanidin-3,5-O-diglucoside (Cy3G5G), cyanidin-3-O-glucoside (Cy3G), peonidin 3,5-O-diglucoside (Pn3G5G), peonidin 3-O-glucoside (Pn3G), and pelargonidin-3-O-diglucoside (Pg3G), were purchased from Sigma-Aldrich Chemical Co., Inc. (St. Louis, MO, USA). The remaining anthocyanins were quantified using a Cy3G standard curve.

    • According to the literature and our previous work, we identified 16 structural genes (excluding the UDP-glycosyltransferase family) involved in the flavonoid/anthocyanin biosynthetic pathway (Supplemental Table S1)[16]. The hidden Markov model profile PF00201 was used to search the rose genome for genes belonging to UDP glycosyltransferases (UGT), with an E-value of < 0.001, resulting in 217 candidate UGT genes[52]. Several transcription factor families involved in the regulation of anthocyanin biosynthesis have been identified in the rose genome, including 121 R2R3-MYB[53], 187 WD40[54], 100 bHLH[55], 48 basic leucine zipper (bZIP)[56],116 NAC[57], and 56 WRKY genes[58]. In addition, 23 BBX genes were re-identified in the rose genome based on a previous study[59].

    • The hidden Markov model profiles PF02798 (GST_N) and PF00043 (GST_C), downloaded from the Pfam website[60], were used to identify candidate GSTs in R. chinensis with an E-value of < 0.001. Additionally, 65 AtGST sequences (Supplemental Table S2) were downloaded from the genome of A. thaliana[61] and used as a query to search for candidate GSTs in the R. chinensis genome (https://lipm-browsers.toulouse.inra.fr/pub/RchiOBHm-V2/) using the BLASTp program with an E-value cutoff of 1e−5. All non-redundant RcGST candidate genes were further verified by submission to the SMART website (http://smart.embl.de/)[62]. The AtGST gene family contained 12 conserved motifs (E-value < 0.001), including GST_N (PF02798), GST_N_2 (PF13409), GST_N_3 (PF13417), GST_N_4 (PF17172), GST_C (PF00043), GST_C_2 (PF13410), GST_C_3 (PF14497), GST_C_6 (PF17171), EF1G (PF00647), Glutaredoxin (PF00462), Hemerythrin (PF01814), and membrane-associated proteins in eicosanoid and glutathione metabolism (MAPEG; PF01124) (Supplemental Fig. S1)[63]. Candidate RcGSTs and 65 AtGSTs were used to construct a neighbor-joining phylogenetic tree. RcGSTs in the same subfamily with the same domain(s) as A. thaliana were identified as full-length GST genes, whereas those with incomplete domain(s) were identified as partial GST (GST-p) genes (Supplemental Fig. S2).

      The identified full-length RcGST protein sequences were aligned using MAFFT 7.0 with default parameters[64], and phylogenetic trees were constructed using the maximum likelihood method on the RAxML online platform with 100 bootstrap replicates. The RcGST genes were mapped onto chromosomes based on the genome annotation document using TBtools, and tandemly duplicated genes were identified based on previous studies[65,66]. An intraspecies collinearity analysis of R. chinensis was conducted to identify segmentally duplicated genes. To study the evolution of GST genes among different plants, collinearity relationships were analyzed to infer the inter-species orthology between R. chinensis and other plants using TBtools software. Whole-genome sequences and annotation documents of peach, strawberry, and pear (Pyrus communis) were downloaded from the Genome Database for Rosaceae[67]. Whole-genome sequences and annotation documents of apple (Malus × domestica 'Golden Delicious') were downloaded from the official website[68]. Whole-genome sequences and annotation documents of grapevine, soybean (Glycine max), Medicago truncatula, and Populus trichocarpa were downloaded from the Ensembl website. An evolutionary tree between species was generated using the LifeMap website[69].

    • Twenty-one RNA-Seq libraries were generated from seven samples (S3, D1, D2, D3, D4, PT, and DT), and raw sequence data were deposited in the Genome Sequence Archive at the National Genomics Data Center, China National Center for Bioinformation/Beijing Institute of Genomics, Chinese Academy of Sciences (GSA: CRA006521)[65]. Fragments per kilobase million (FPKM) were used to determine gene expression.

    • For PacBio Iso-Seq, full-length cDNA from D2 samples was constructed according to the method described by Liu et al[70]. The amplified cDNA products were built into SMRTbell template libraries in accordance with the IsoSeq protocol (PacBio). The SMRTbell template was then annealed to the sequencing primer and bound to the polymerase. Finally, the templates were sequenced on the PacBio platform by Biomarker Technologies (Biomarker Technologies, Beijing, China). SMRTlink v10.0 software was used for Iso-Seq data analysis. The open reading frames were detected using TransDecoder v5.0 for isoform sequences to obtain coding and untranslated region sequences.

    • Total RNA was isolated from different rose samples using an OmniPlant RNA Kit (DNase I) (CoWin Biosciences, Taizhou, China). cDNA was synthesized by reverse transcription from 15 μL of total RNA using the MonScript™ RTIII All-in-One Mix with dsDNase (Monad Biotechnology Co., Ltd, Wuhan, China). RhUBI2 (JK618216) was used as an internal control[71]. The primers used for real-time PCR are listed in Supplemental Table S3. Real-time PCR was performed as previously described[65].

    • Significant differences (p < 0.05) were determined using Student's t-test and one-way analysis of variance (ANOVA) tests. The t-test was performed using Microsoft Excel 2019 (Seattle, Washington, USA), and ANOVA was conducted using SPSS 23 (SPSS Inc., Chicago, IL, USA). Differential expression analysis between rose samples was performed using DeSeq2 in the OmicShare tool, with a Q-value threshold of 0.05. Venn diagrams were plotted using InteractiVenn[72]. A protein–protein interaction network was generated using the STRING database[73]. Correlation analysis was performed using the corrplot package[74].

    • In the natural environment, the petals of butterfly rose were light yellow at the bud stage (S3) and newly opened flowering stage (D1), turning pink on the second day of flowering (D2) then dark pink at the late flowering stage (D3 and D4) (Fig. 1a). The total anthocyanin content was low at S3 and D1 then increased significantly at D2 and later stages (D3 and D4), resulting in a color change from light yellow to pink and dark pink (Fig. 1b).
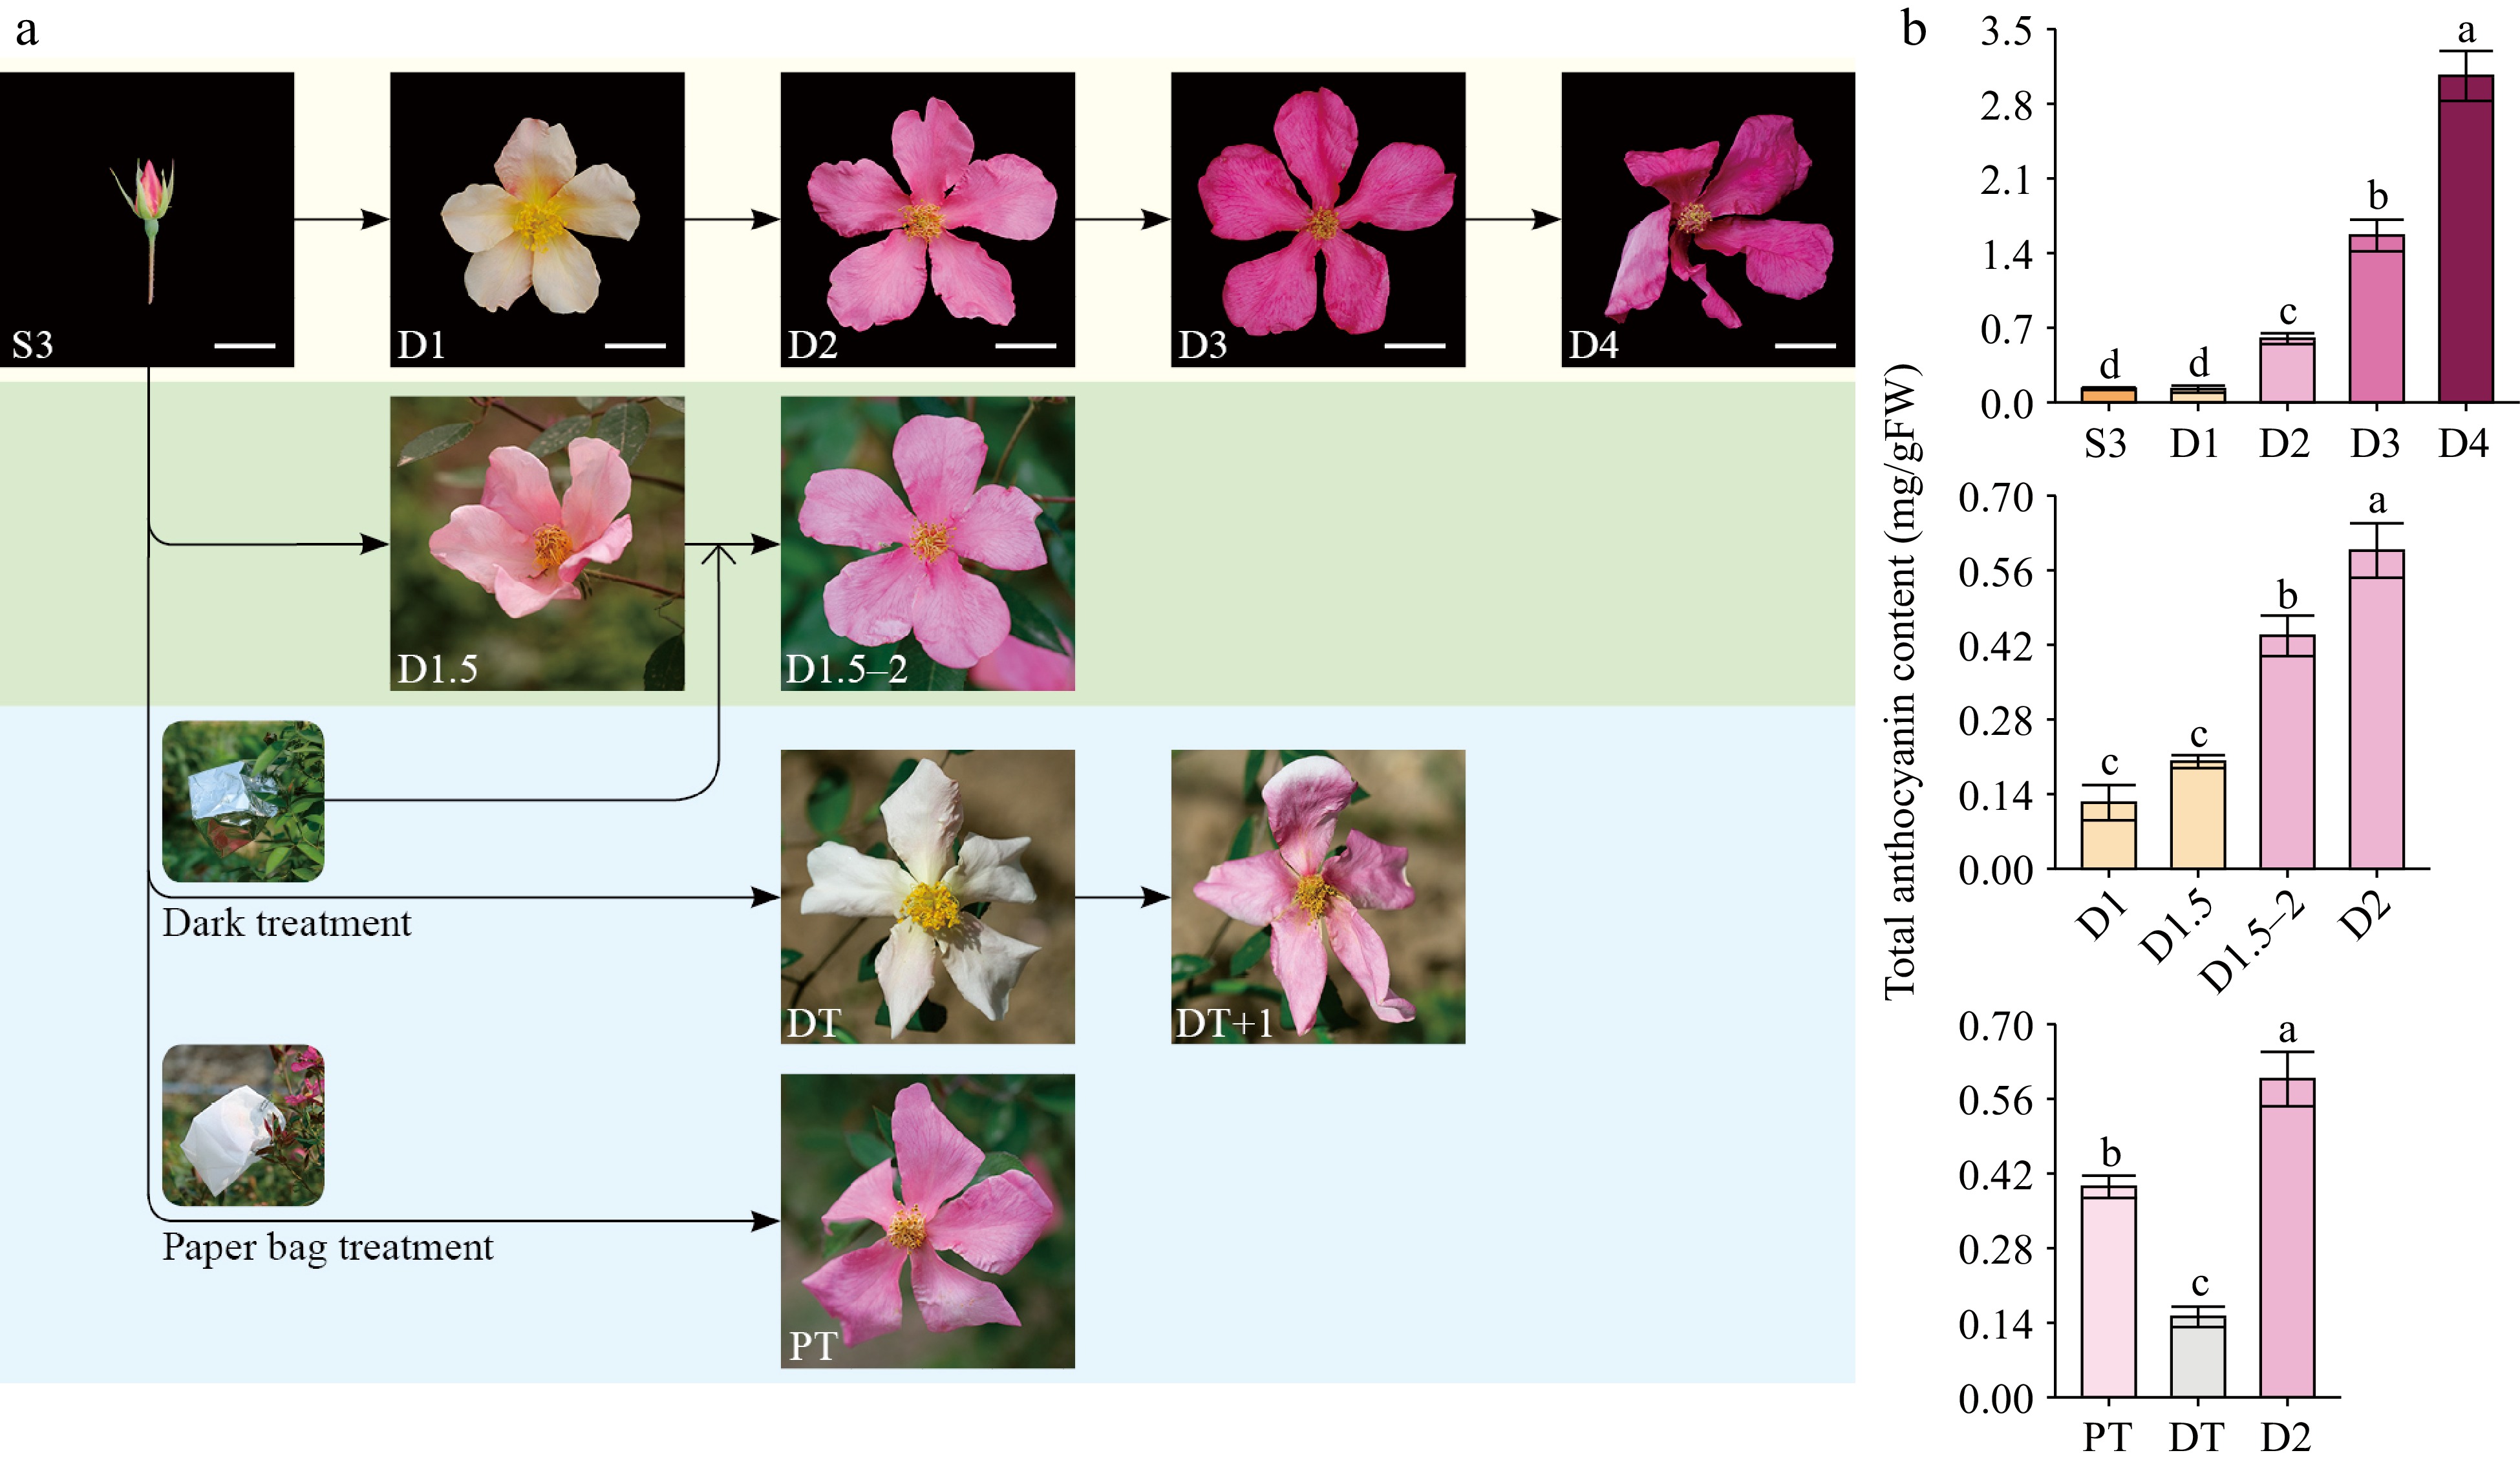
      Figure 1. 

      Phenotypes and total anthocyanins contents of butterfly rose (R. chinensis 'Mutabilis') samples. (a) Photos of butterfly rose flowers under natural conditions and different treatments. Scale bars = 2 cm. S3, bud stage (one day before anthesis); D1, first day of anthesis; D2, second day of anthesis; D3, third day of anthesis; D4, fourth day of anthesis. PT, paper bag treatment, DT, dark treatment; DT+1, dark treatment flower exposed to natural sunlight conditions for one day. D1.5, flowers collected in the afternoon (17:30) on the first day of flowering; D1.5–2, flowers at the D1.5 stage that were dark treated until the next morning. (b) Total anthocyanin contents of different butterfly rose samples (n = 3–4). Different lowercase letters indicate statistically significant differences (ANOVA test, p < 0.05).

      The butterfly rose petals turned light pink in the afternoon on the first day of anthesis (D1.5) and the total anthocyanin content of D1.5 samples was slightly higher than that of D1 samples. When D1.5 flowers were subjected to dark conditions until 08:00–09:00 the next day, the petals of D1.5–2 samples were pink and similar in color to those of D2 samples, but with a slightly lower total anthocyanin content (Fig. 1b). This may be because the D1.5–2 samples lacked 3–4 h of evening and morning sunlight. Thus, dark conditions (approximately 15 hours) had little effect on anthocyanin transport.

      Treatments with different light intensities were used to study the effect of sunlight on flower color transition. Under PT, the petals of butterfly rose turned pink, similar to those of D2 samples under natural light conditions (Fig. 1a). Under DT, the petals turned almost white on the second day of anthesis. When DT flowers were exposed to natural sunlight for one day, the petal color changed back to pink (Fig. 1a). The total anthocyanin content in PT samples (reduced sunlight) was lower than that in D2 samples under natural light conditions, whereas DT samples (no sunlight) showed low accumulation of total anthocyanins (Fig. 1b). This suggests that sunlight was an important environmental factor influencing PACCs in butterfly rose flowers.

    • Five butterfly rose samples at different developmental stages and two samples under different treatments were selected for anthocyanin analysis (Fig. 2a). Eight anthocyanins were detected in butterfly rose petals in the seven samples (Fig. 2b). More anthocyanin compounds were detected in dark pink samples (D3 and D4). Among the five developmental stages, the contents of five anthocyanins differed significantly between pink and light-yellow samples. Notably, Cy3G had the highest content in all pink samples, accounting for 72% of the total anthocyanin content at D2 and 86% at D4. Cy3G5G had the second-highest anthocyanin content. The other three differentially accumulated anthocyanins had very low contents (< 0.03 mg/gFW in D2 samples). Among the treated and control samples, five anthocyanins were differentially accumulated between DT and sunlight exposure (D2 and PT) samples, including the two main compounds, Cy3G and Cy3G5G (Fig. 2c). Therefore, the change in petal color from light yellow to pink in butterfly rose was caused by the accumulation of high anthocyanin contents, with Cy3G and Cy3G5G being the main components involved in petal coloration.
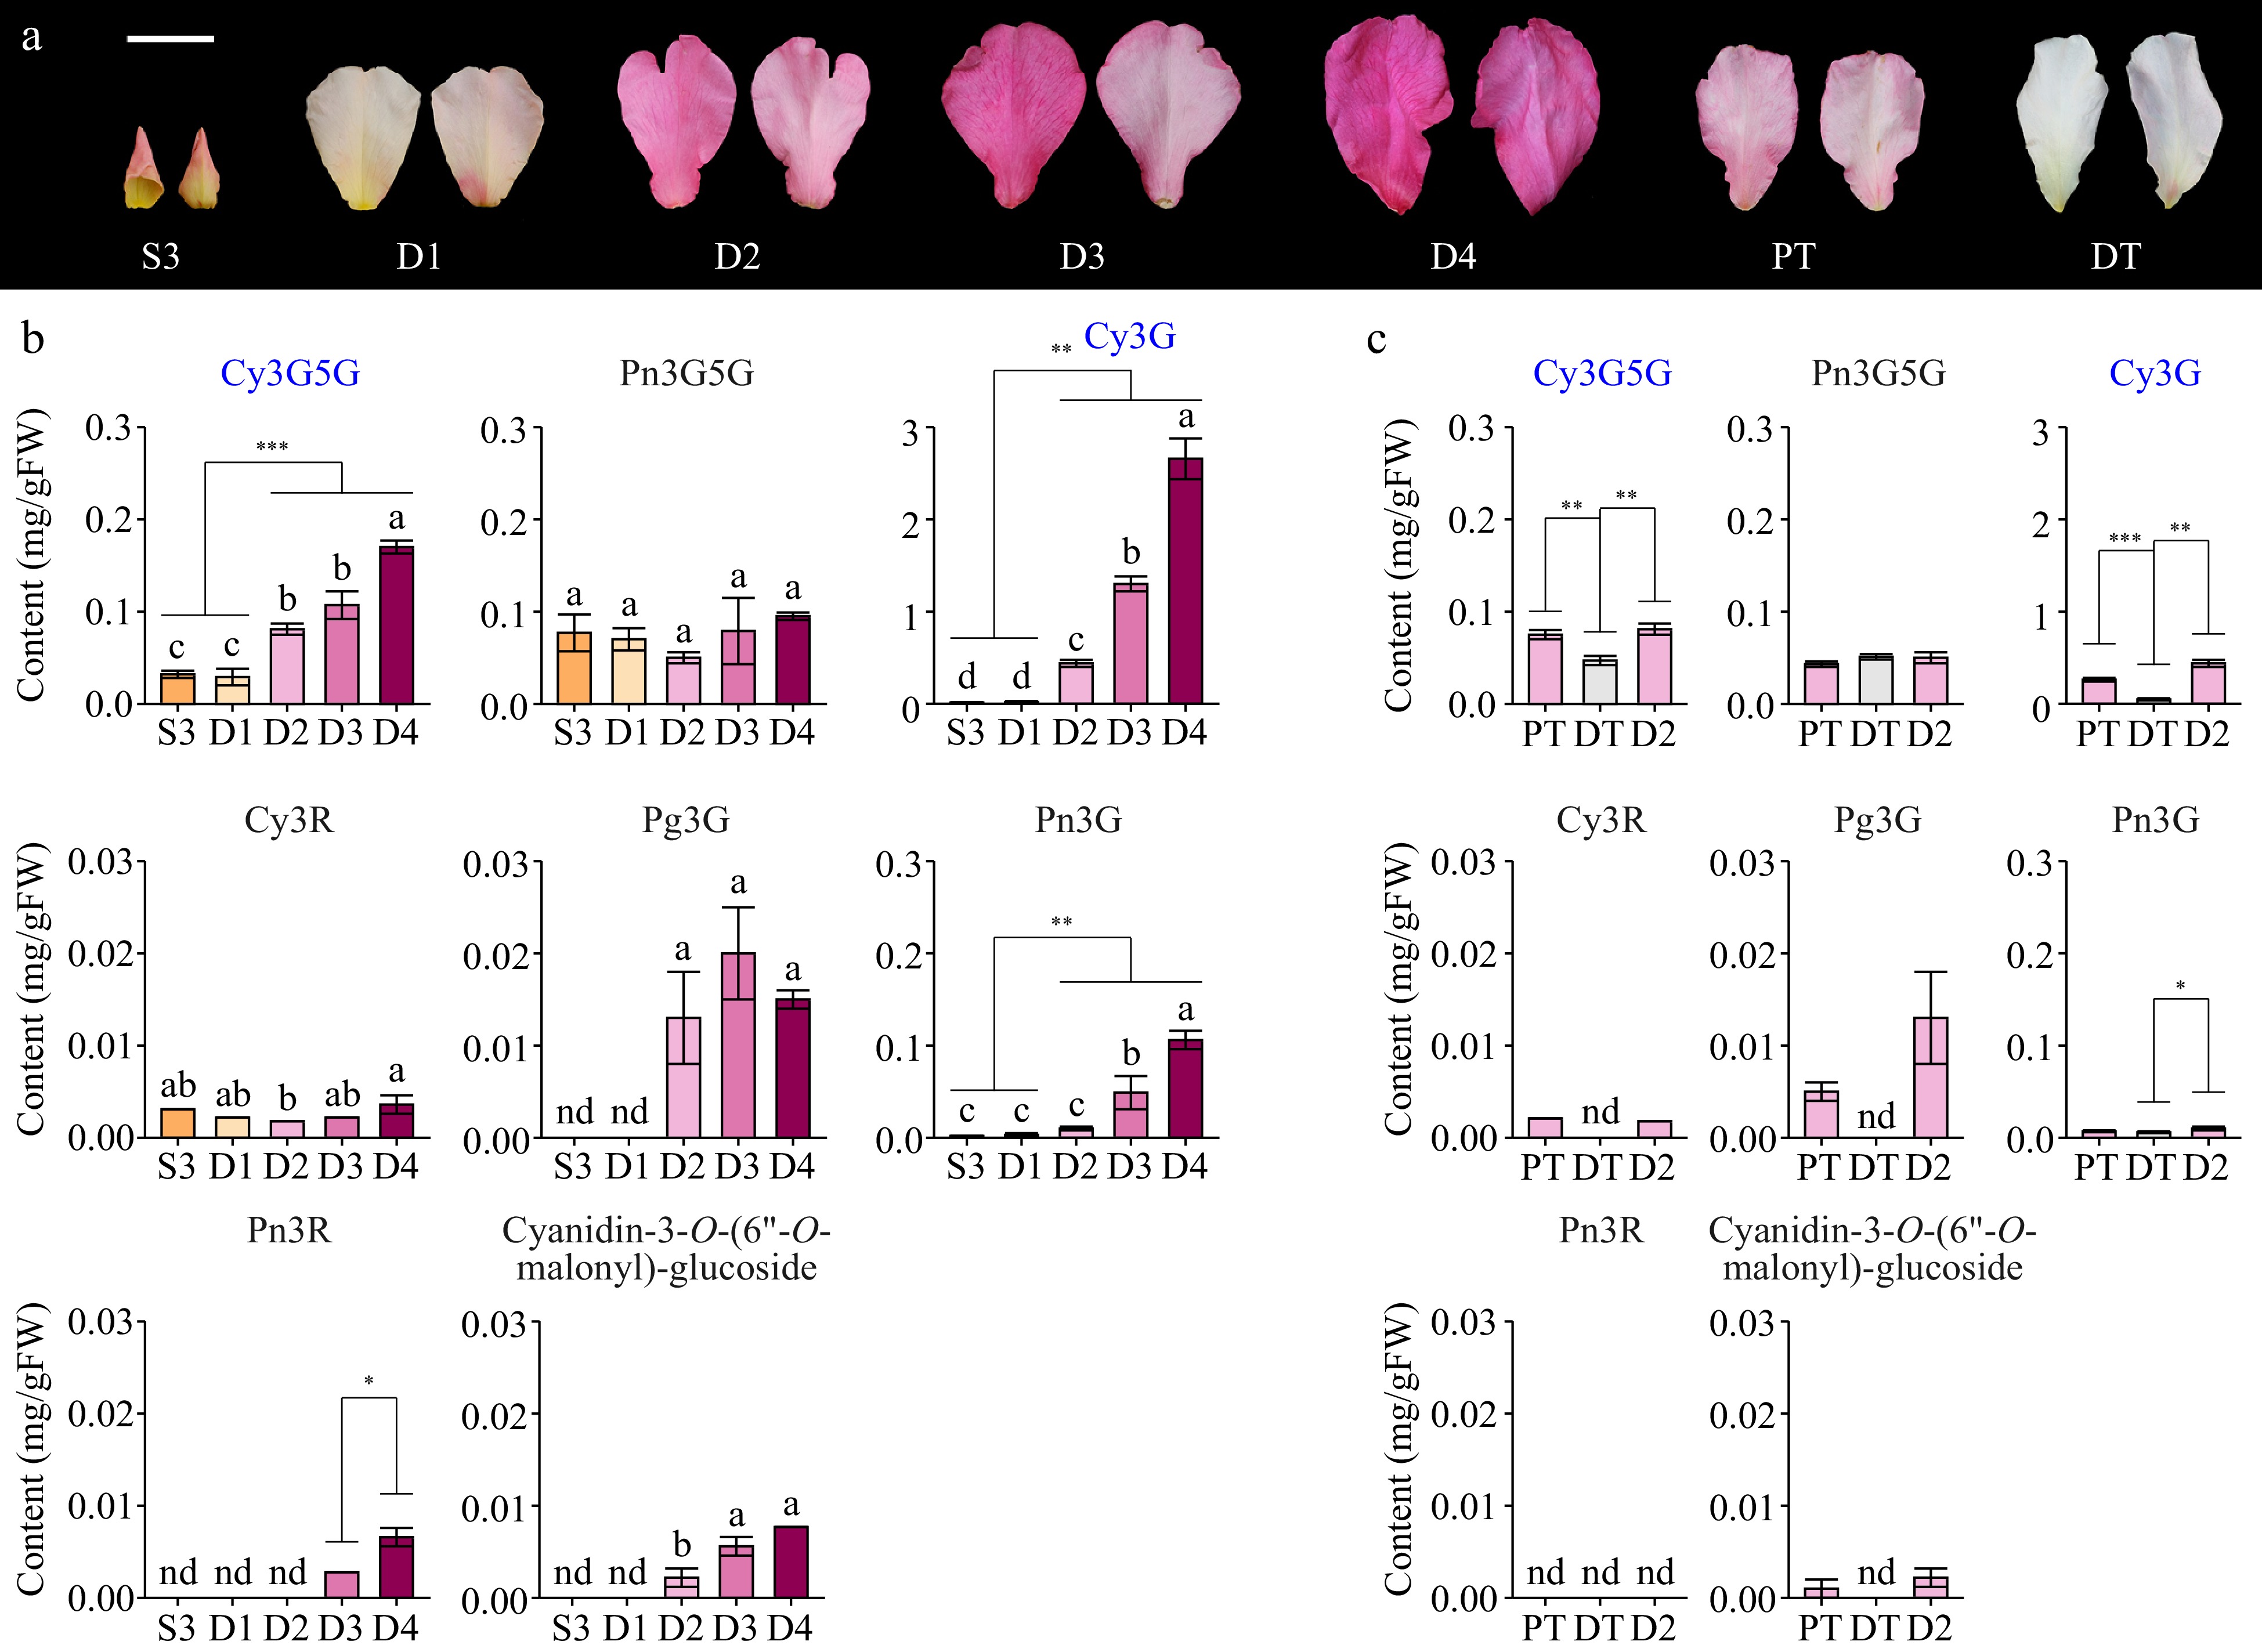
      Figure 2. 

      Anthocyanin compositions in different butterfly rose samples. (a) Adaxial and abaxial surfaces of the petals are shown. Scale bar = 2 cm. (b) Anthocyanin contents of butterfly rose petals at different stages. (c) Anthocyanin contents of butterfly rose petals under different treatments. Data are presented as the mean ± standard error (n = 3–4). Pn3R, peonidin-3-O-rutinoside; Cy3R, cyanidin-3-O-rutinoside. Key anthocyanins are highlighted in blue. Different lowercase letters indicate statistically significant differences (ANOVA test, p < 0.05). nd, not detected. *p < 0.05, **p < 0.01, ***p < 0.001 by Student's t-test.

    • Anthocyanins are biosynthesized via the flavonoid/anthocyanin biosynthetic pathway, and most structural genes involved in this pathway have been identified (Fig. 3a, Supplemental Table S1). Samples collected at different developmental stages (S3, D1, and D2) and under different treatments (D2, PT, and DT) were selected for further analyses. The expression patterns of structural genes involved in the anthocyanin biosynthetic pathway (except for UGT genes) in the different samples differed from those of key accumulated anthocyanins (Fig. 3b). Among the 217 candidate UGT genes obtained from the preliminary screening, only 91 were expressed in these five samples (average FPKM ≥ 1). Cluster analysis (Pearson correlation) was performed on the expression patterns of the 91 UGT genes and the contents of key anthocyanins (Fig. 3c). Thirteen UGT genes showed high expression in pink samples and low expression in bud and DT samples. However, only one of these genes had a high expression level, whereas the rest had relatively low expression levels (Fig. 3d). This gene is homologous to RhUF3GT1(AB292796)[10] and UF3GT (AB239786, partial)[75] and was named RcUF3GT1. RhUF3GT1 and UF3GT were cloned from the R. hybrida 'Ehigasa' and R. hybrida 'Charleston', respectively, both of which are PACC cultivars, and recombinant RhUF3GT1 expressed in yeast can catalyze the 3-glucosylation of anthocyanidins but not flavonols[10]. In butterfly rose the expression pattern of RcUF3GT1 corresponded to the increase in Cy3G content and RcUF3GT1 encodes a 466 amino acid protein in the D2 sample that shares 97.86% identity with the RhUF3GT1 protein (Supplemental Table S4), indicating that they have the same function. Therefore, among the structural genes involved in the anthocyanin biosynthesis pathway, only RcUF3GT1 may be involved in PACC.
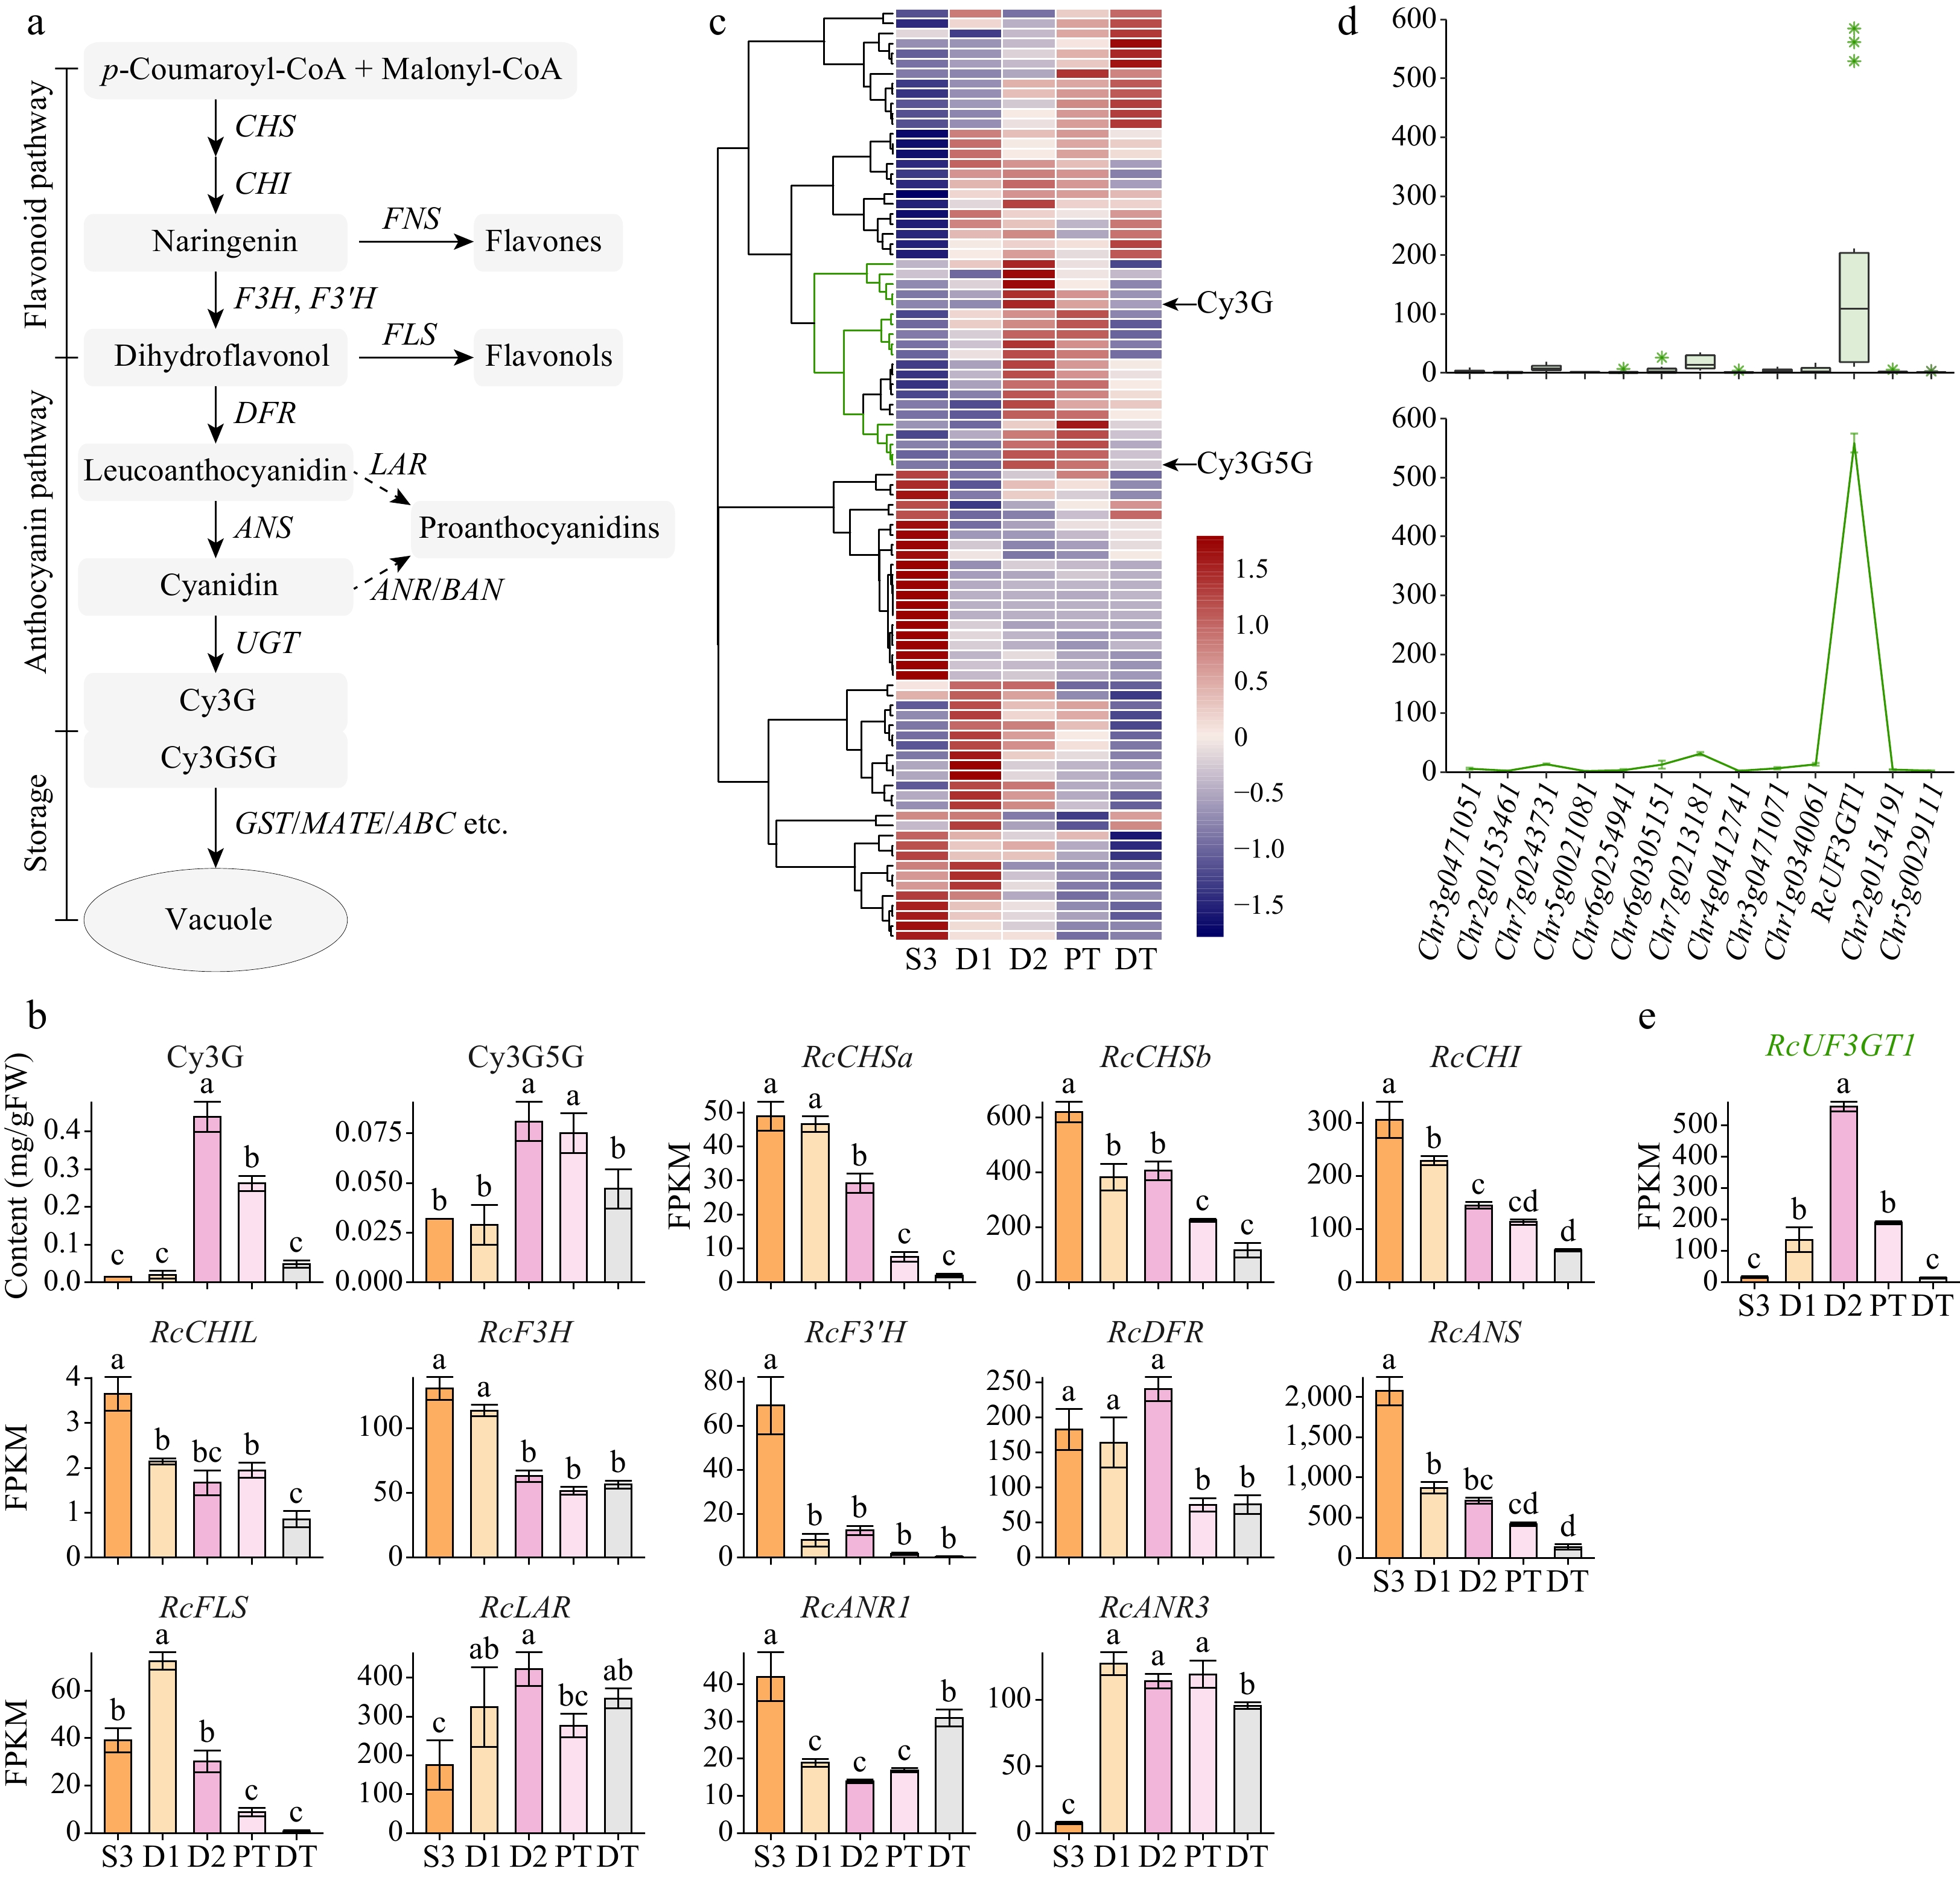
      Figure 3. 

      Expression patterns of structural genes involved in the anthocyanin biosynthetic pathway. Data are presented as the mean ± standard error (n = 3). Different lowercase letters indicate statistically significant differences (ANOVA test, p < 0.05). (a) Schematic representation of the anthocyanin biosynthetic pathway in plant cells[23]. CHS, chalcone synthase; CHI, chalcone isomerase; FNS, flavone synthase; F3H, flavanone 3-hydroxylase; F3'H, flavonoid 3'-hydroxylase; FLS, flavonol synthase; DFR, dihydroflavonol reductase; ANS, anthocyanidin synthase; UGT, UDP-glycosyltransferase; LAR, leucoanthocyanidin reductase; ANR, anthocyanidin reductase; BAN, BANYULS. (b) Expression profiles of two key anthocyanins and structural genes in anthocyanin biosynthetic pathway (excluding UGT genes). (c) Clustering heatmap of UGT genes expressed in petals (Pearson correlation, clustering_method = 'complete'). (d) Expression levels of candidate UGT genes. Boxplot, average expression levels in five samples; line plot, expression levels in D2 samples. RcUF3GT1, RchiOBHmChr1g0383951. (e) Expression patterns of RcUF3GT1 in five samples.

    • In total, 80 full-length and 32 partial RcGST genes were identified (Supplemental Table S5). To explore the evolutionary relationships between RcGSTs, a maximum likelihood phylogenetic tree was constructed using 80 full-length RcGST proteins and 65 AtGST proteins (Fig. 4a). The RcGST family was divided into 12 classes: Tau (U), Phi (F), Lambda (L), Zeta (Z), Theta (T), tetrachlorohydroquinone dehalogenaselike (TCHQD), dehydroascorbate reductase (DHAR), γ-subunit of the eukaryotic translation elongation factor 1B (EF1Bγ), glutathionyl hydroquinone reductase (GHR), microsomal prostaglandin E synthase type 2 (mPGES-2), GSTs with two thioredoxins (GST2N), and MAPEG[61,76]. The GSTU class was the largest subfamily, with 50 full-length RcGST members, followed by the GSTF class, with seven. The other classes had fewer full-length RcGSTs, with no more than four in each class. Unlike Arabidopsis, no hemerythrin (GSTH) genes were detected in the rose genome. In addition, GST genes belonging to the metaxin class in the rose genome were incomplete (partial). Identified GST genes were renamed based on their subfamilies and chromosomal locations.
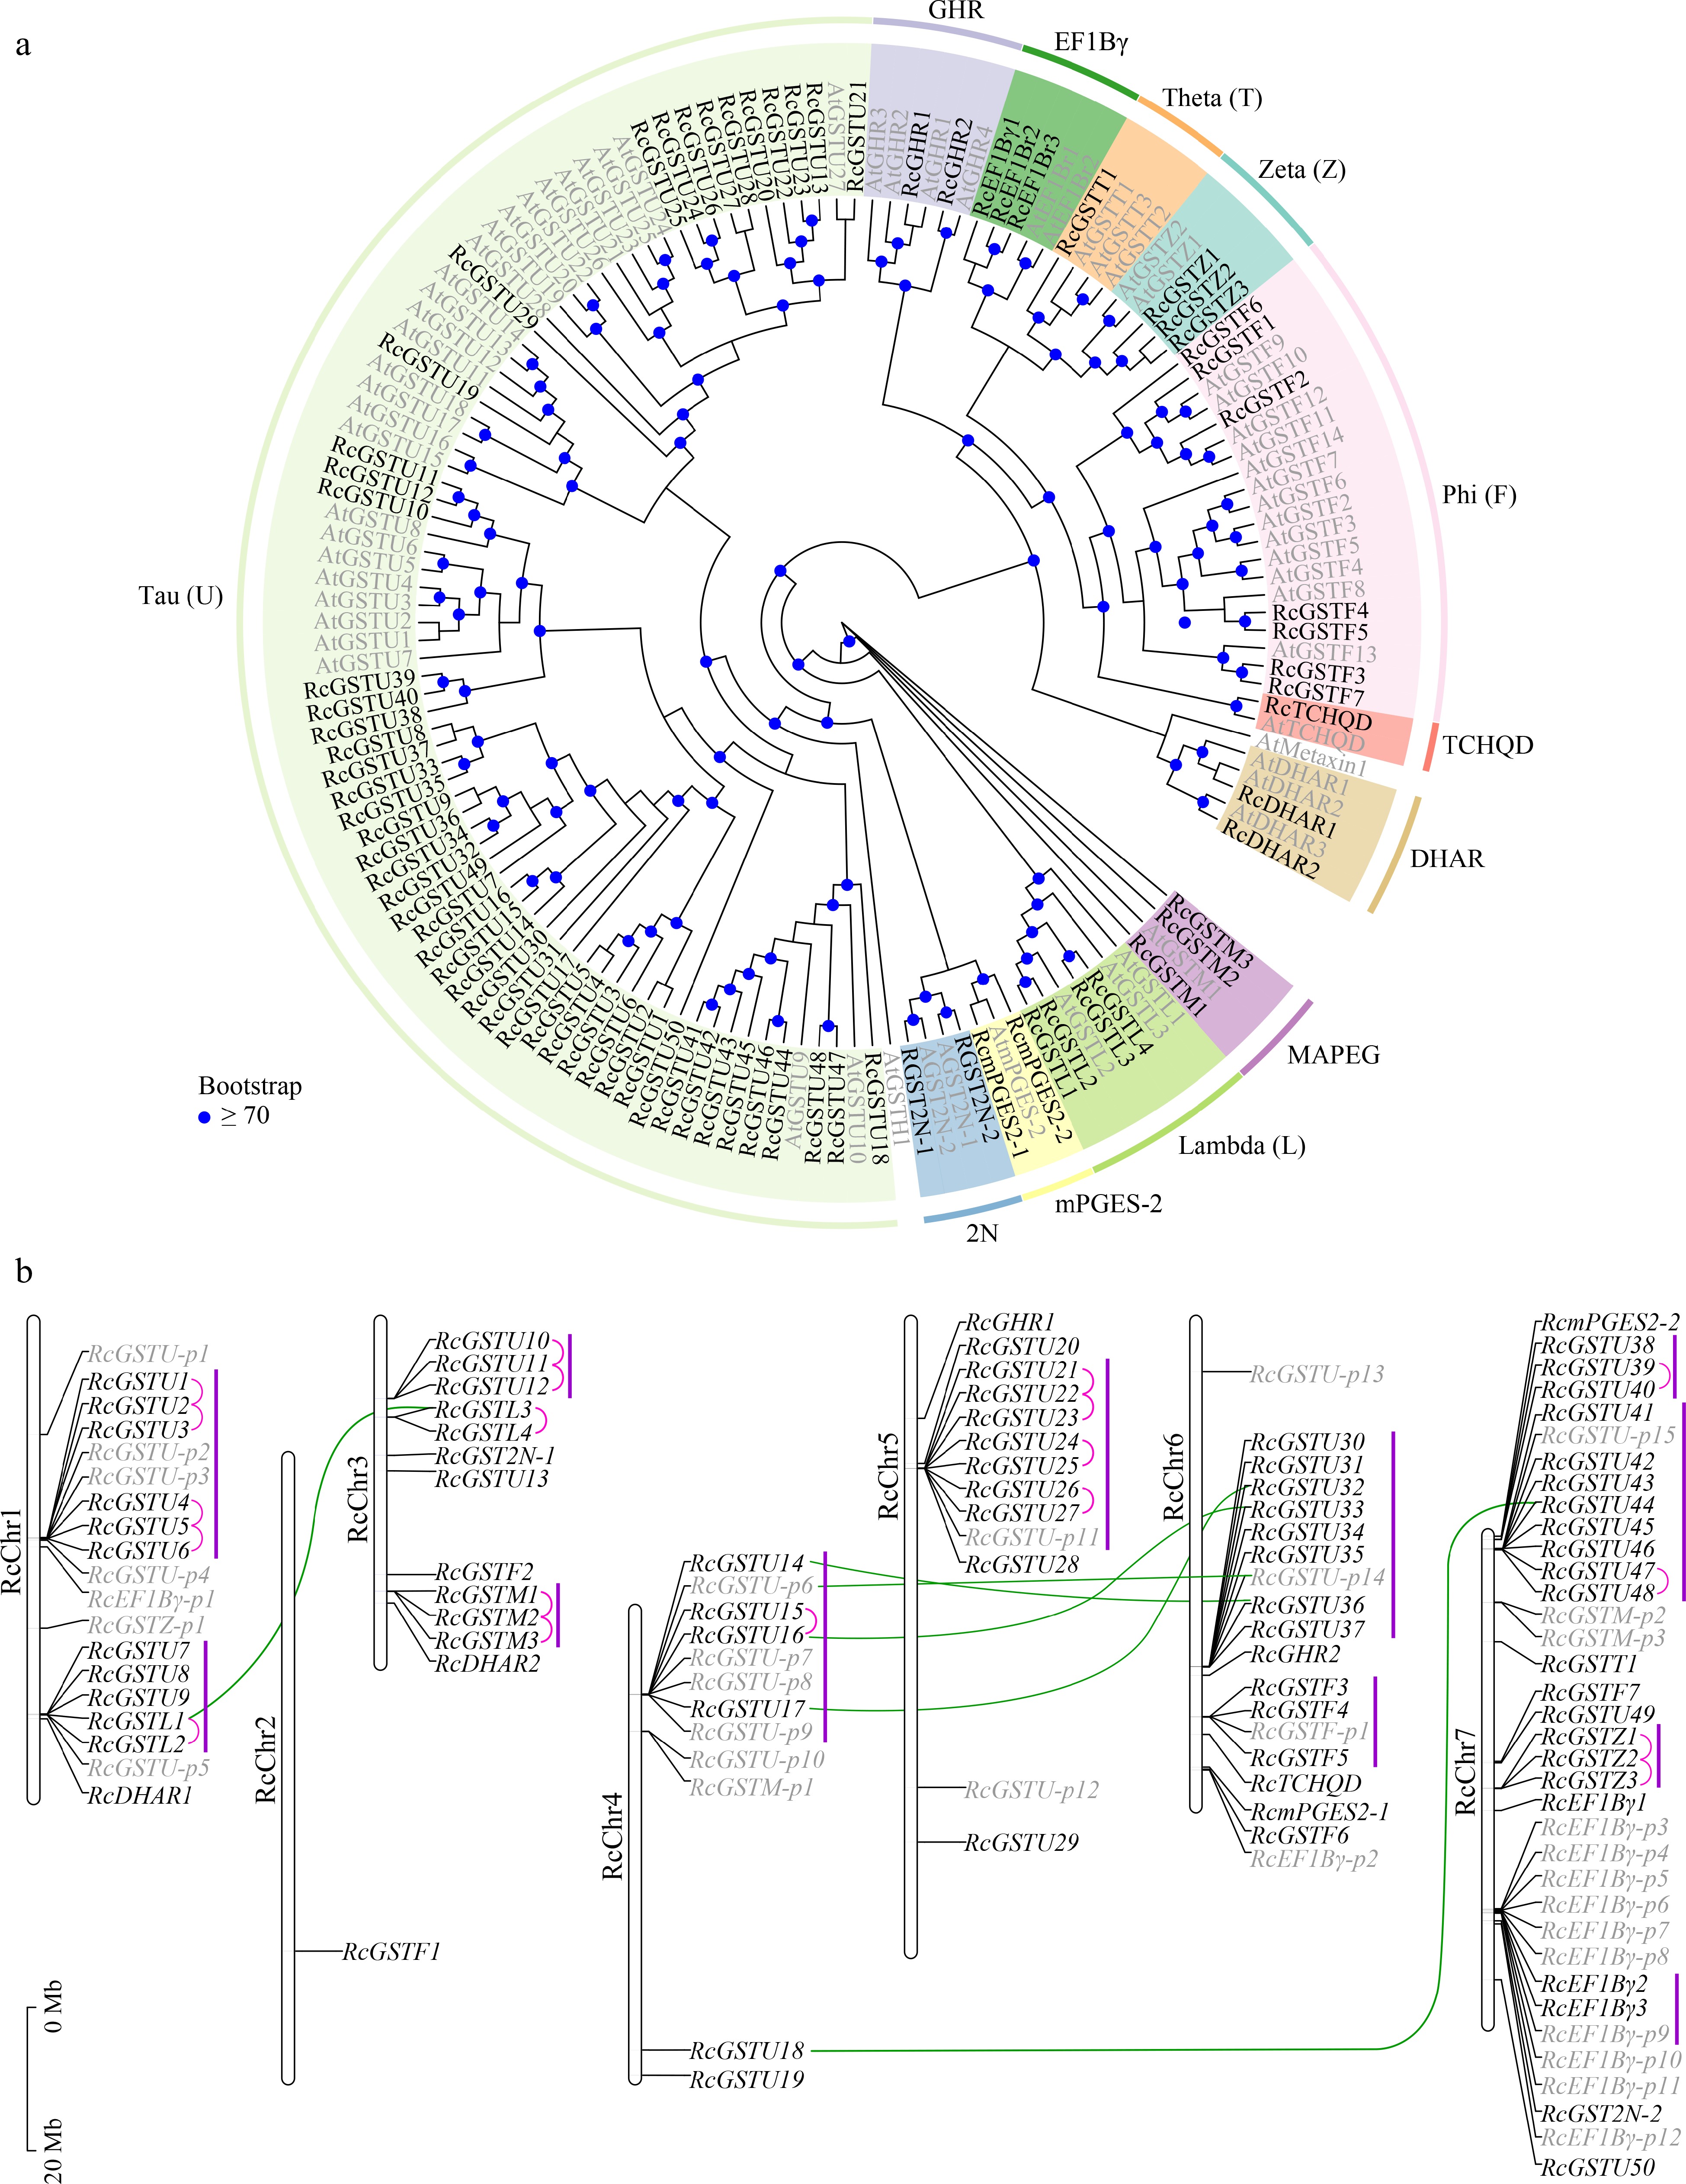
      Figure 4. 

      Identification and analysis of GSTs in the R. chinensis genome. (a) Maximum likelihood phylogenetic analysis and classification of putative full-length RcGST genes. Genome IDs of AtGSTs (shown in gray) are listed in Supplemental Table S2. (b) Chromosomal distribution of full-length and partial RcGST genes. Full-length GST genes are represented by black letters; putative partial GST (GST-p) genes are represented by gray letters. Pink lines indicate tandemly duplicated genes; green lines indicate segmentally duplicated genes. Gene clusters are indicated by purple lines.

      The mapping of 80 full-length and 32 partial RcGST genes to the chromosomes of R. chinensis revealed an uneven distribution among the chromosomes (Fig. 4b). RcChr 7 contained the largest number of GST genes, with 23 full-length and 13 partial RcGST genes, whereas only one RcGST gene was located in RcChr 2. Nineteen tandemly duplicated genes were detected in the R. chinensis genome, including 13 GSTU, two GSTL, two GSTZ, and two MAPEG genes. Additionally, six segmentally duplicated GST genes were detected, including five GSTU genes and one GSTL gene. These RcGST genes formed 12 gene clusters, including seven clusters comprising GSTU genes and one cluster comprising GSTU and GSTL genes. This indicates that the expansion of the GST gene family in R. chinensis was driven by tandem and segmental duplication, particularly in the GSTU and GSTL classes.

    • Previous studies have shown a positive correlation between anthocyanin content and the expression of GST genes involved in anthocyanin transport[33,77]. To screen for GSTs involved in anthocyanin transport, we excluded genes with low expression levels (average FPKM < 1 in the five samples). A total of 42 full-length GST genes and five partial GST genes were expressed in these samples. Correlation analysis between gene expression levels and key anthocyanin contents showed that only RcGSTF2 and RcGSTU39 exhibited high correlation coefficients (Pearson r ≥ 0.80) with the two key anthocyanins (Fig. 5a). Analysis of the expression patterns indicated that only RcGSTF2 expression was consistent with the accumulation of key anthocyanins, particularly Cy3G (Fig. 5b). The amino acid sequences of 80 full-length RcGSTs were aligned with those of other functionally identified GST proteins using MAFFT software, and a neighbor-joining evolutionary tree was constructed using MEGA7.0 software (Fig. 5c). Phylogenetic analysis revealed that only RcGSTF2 clustered with the characterized GSTs involved in anthocyanin transport in other plants, especially other Rosaceae plants, indicating their functional similarity. These results indicated that RcGSTF2 is the only candidate GST gene involved in anthocyanin transport. To investigate the evolutionary relationship of GST genes involved in anthocyanin transport across different plants, rose and four other Rosaceae plants (peach, apple, pear, strawberry), two Fabaceae plants (Medicago truncatula and soybean), and one Salicaceae plant (Populus trichocarpa) were selected for inter-species collinearity analysis. These eight plants belong to the fabids of Rosales, with grapevine (belonging to Vitales) selected as the outgroup of the evolutionary tree. The results showed that GST genes involved in anthocyanin transport exhibited collinearity across these plants, indicating conserved evolution (Fig. 5d)[77]. The bioinformatics analysis showed that RcGSTF2 may be involved in the anthocyanin transport in butterfly rose.
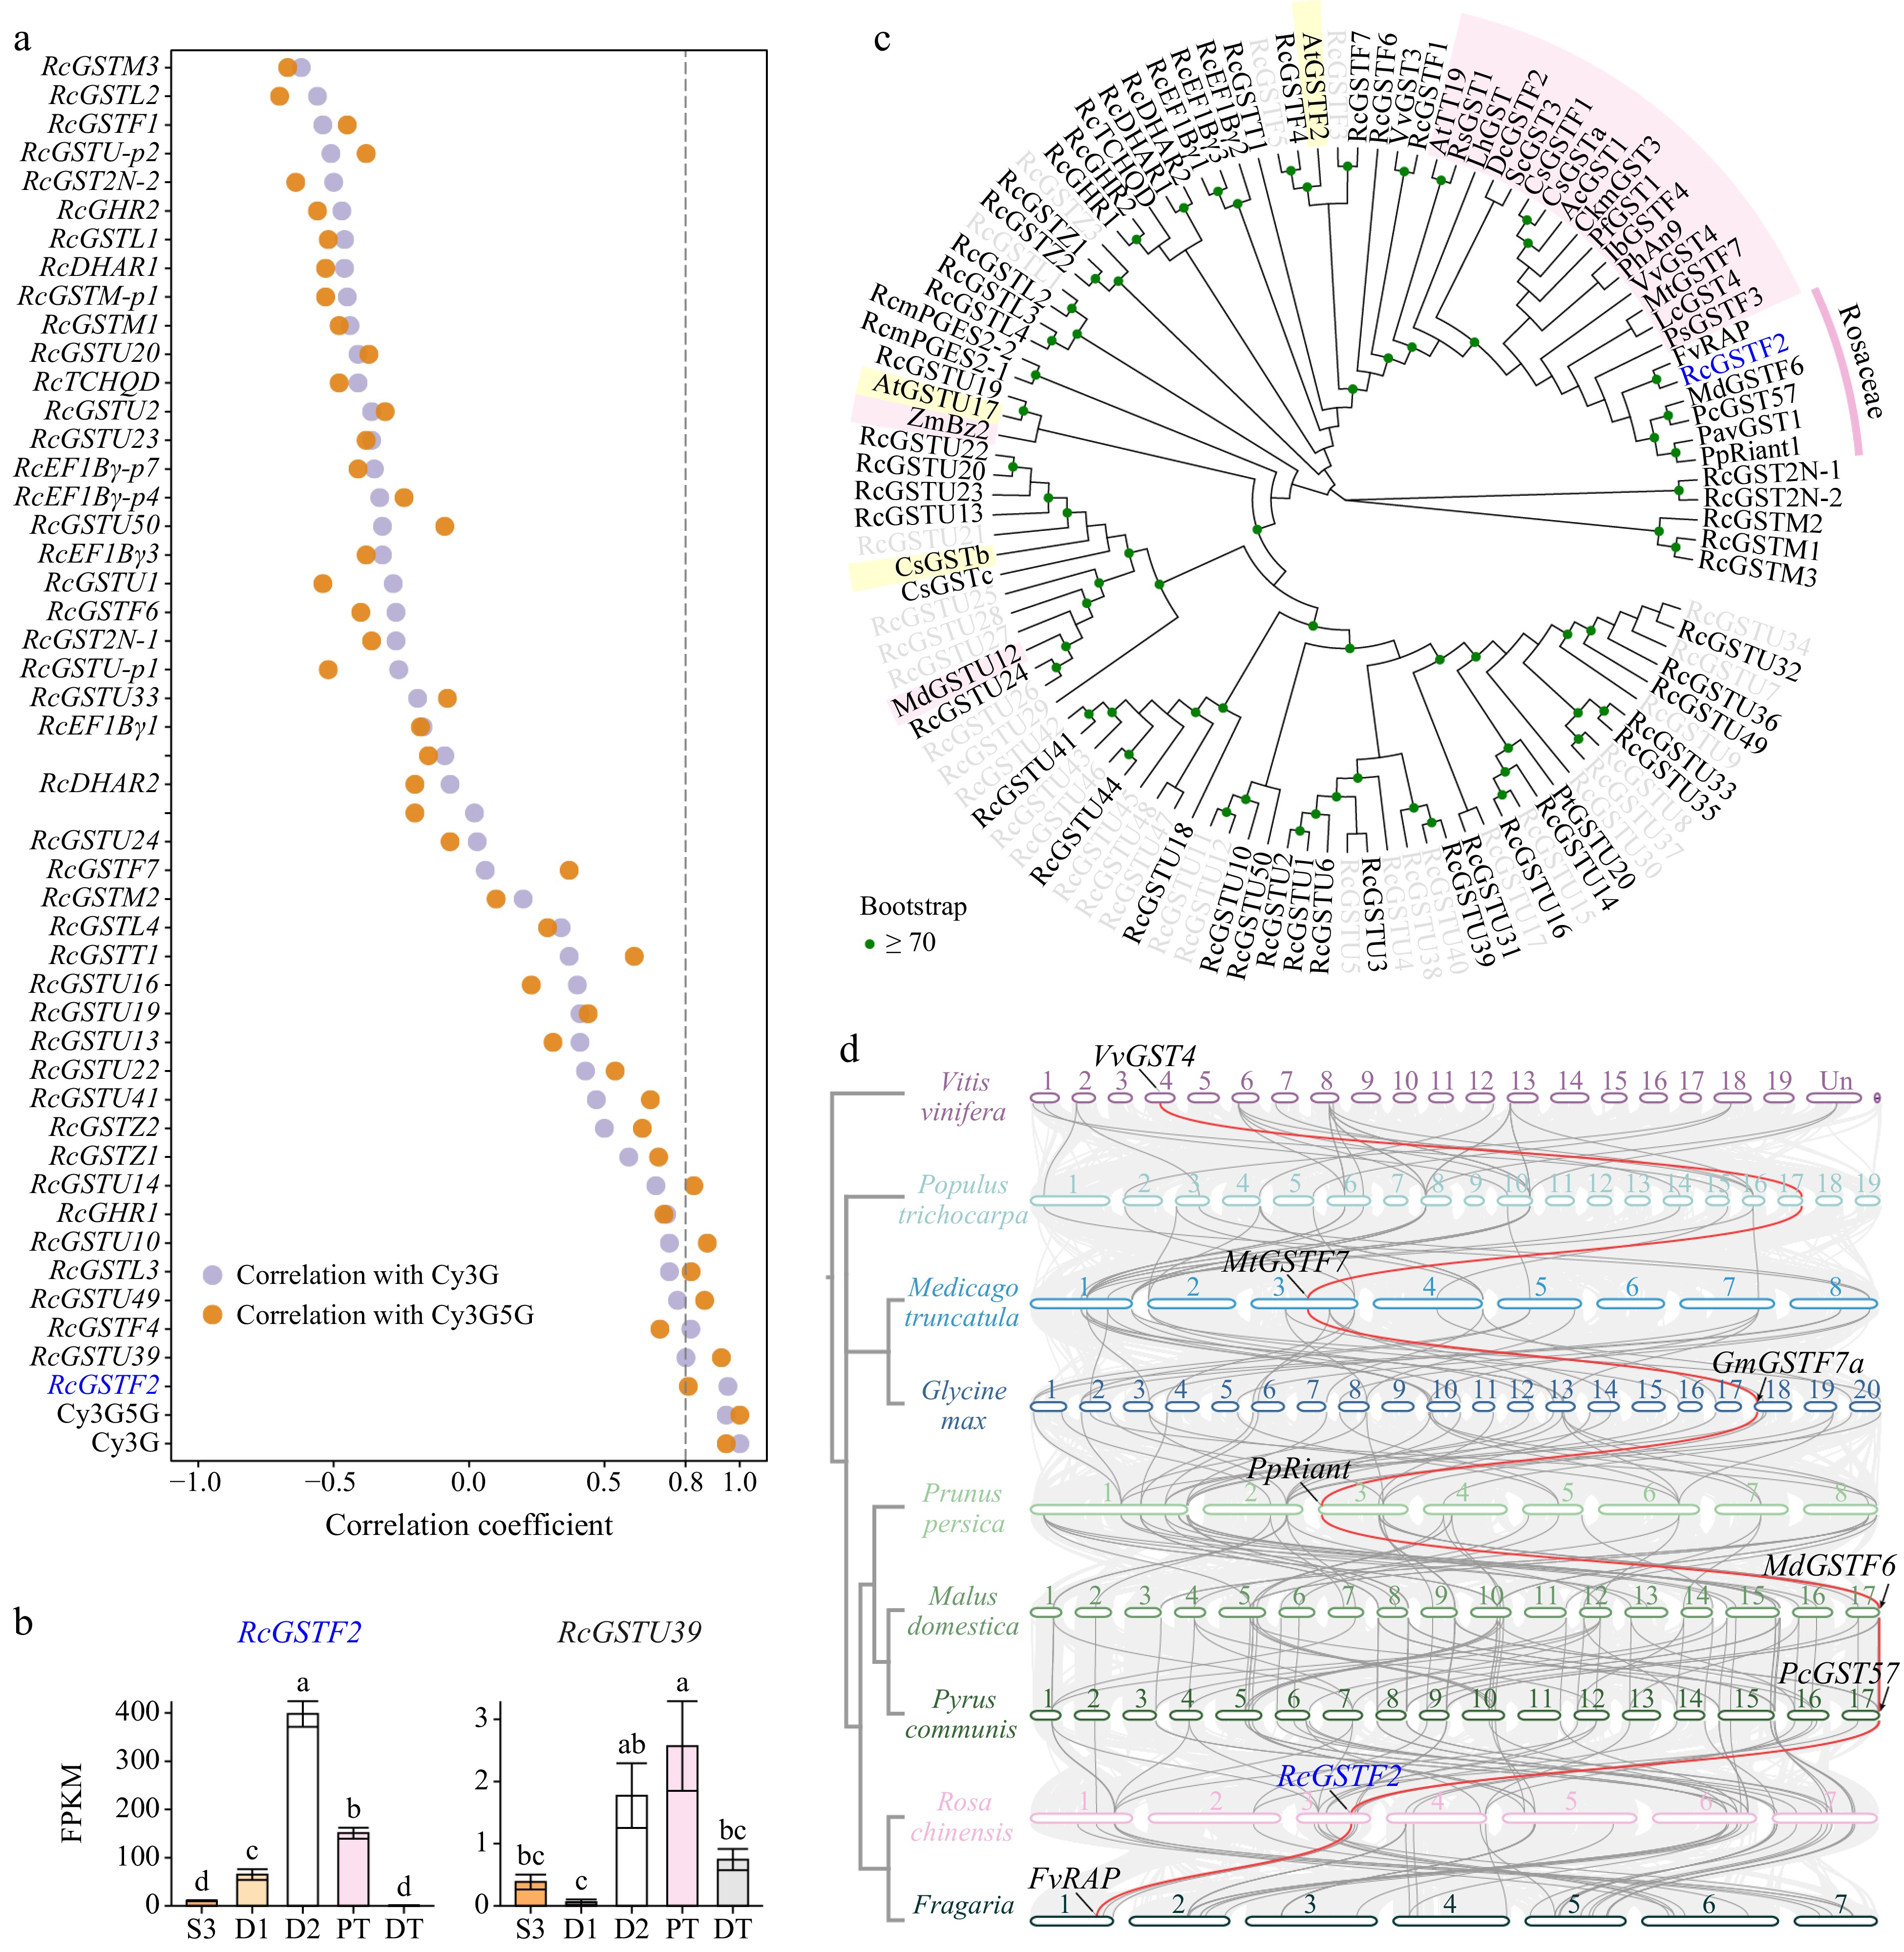
      Figure 5. 

      GST(s) involved in anthocyanin transport. (a) Pearson correlation coefficient between petal-expressed RcGSTs and two key anthocyanins in five samples. (b) Expression profiles of two key anthocyanins and two candidate RcGSTs in different samples. Data are presented as the mean ± standard error (n = 3). Different lowercase letters indicate statistically significant differences (ANOVA test, p < 0.05). (c) Neighbor-joining phylogenetic tree of full-length RcGSTs and other characterized GST proteins. Encoding proteins of the RcGSTs that were not expressed in butterfly rose petals are represented by gray letters. GSTs involved in anthocyanin transport and flavonoid transport are highlighted with pink and yellow backgrounds, respectively. GST sequences used in this analysis are listed in Supplemental Table S6. (d) Inter-species collinearity analysis among eight fabid plants and grapevine. Collinear blocks are represented by light gray lines in the background; collinear GST genes are represented by gray lines; collinear genes of RcGSTF2 are highlighted in red. GSTs characterized in these species were labeled as follows: VvGST4, NP_001267869.1 (VIT_13s0067g03420); MtGSTF7, Medtr3g064700[35]; GmGSTF7a, Glyma.18G043700[35]; PpRiant (PpGST1), Prupe.3G013600[28,29]; MdGSTF6, MD17G1272100[22]; PcGST57, pycom17g27080[78]; FvRAP, FvH4_1g27460[32].

    • BLASTp analysis (pident ≥ 55%, E-value < 1e−50) identified nine orthologs of AtABCC2/VvABCC1/ZmMRP3/OsMRP15 in the rose genome. In addition, three orthologs of AtTT12/CaMATE1 (pident ≥ 70%, E-value < 1e−50) and seven orthologs of SlMTP77/MtMATE2/VvAM1/VvAM3 (pident ≥ 55%, E-value < 1e−50) were detected in the rose genome (Supplemental Table S7). Of these 19 orthologs, eight genes were petal-expressed (average FPKM in five samples ≥ 1). Most genes exhibited low correlation coefficients with Cy3G or Cy3G5G and only RcABCC2b exhibited a trend similar to that of anthocyanin accumulation (Fig. 6). However, only four partial transcripts of RcABCC2b were detected in D2 samples, and the identity of the longest protein sequence encoded by them and the corresponding genome protein sequence was 33.73% (Supplemental Table S4). Whether RcABCC2b was involved in the transport of anthocyanins in butterfly roses is not clear.
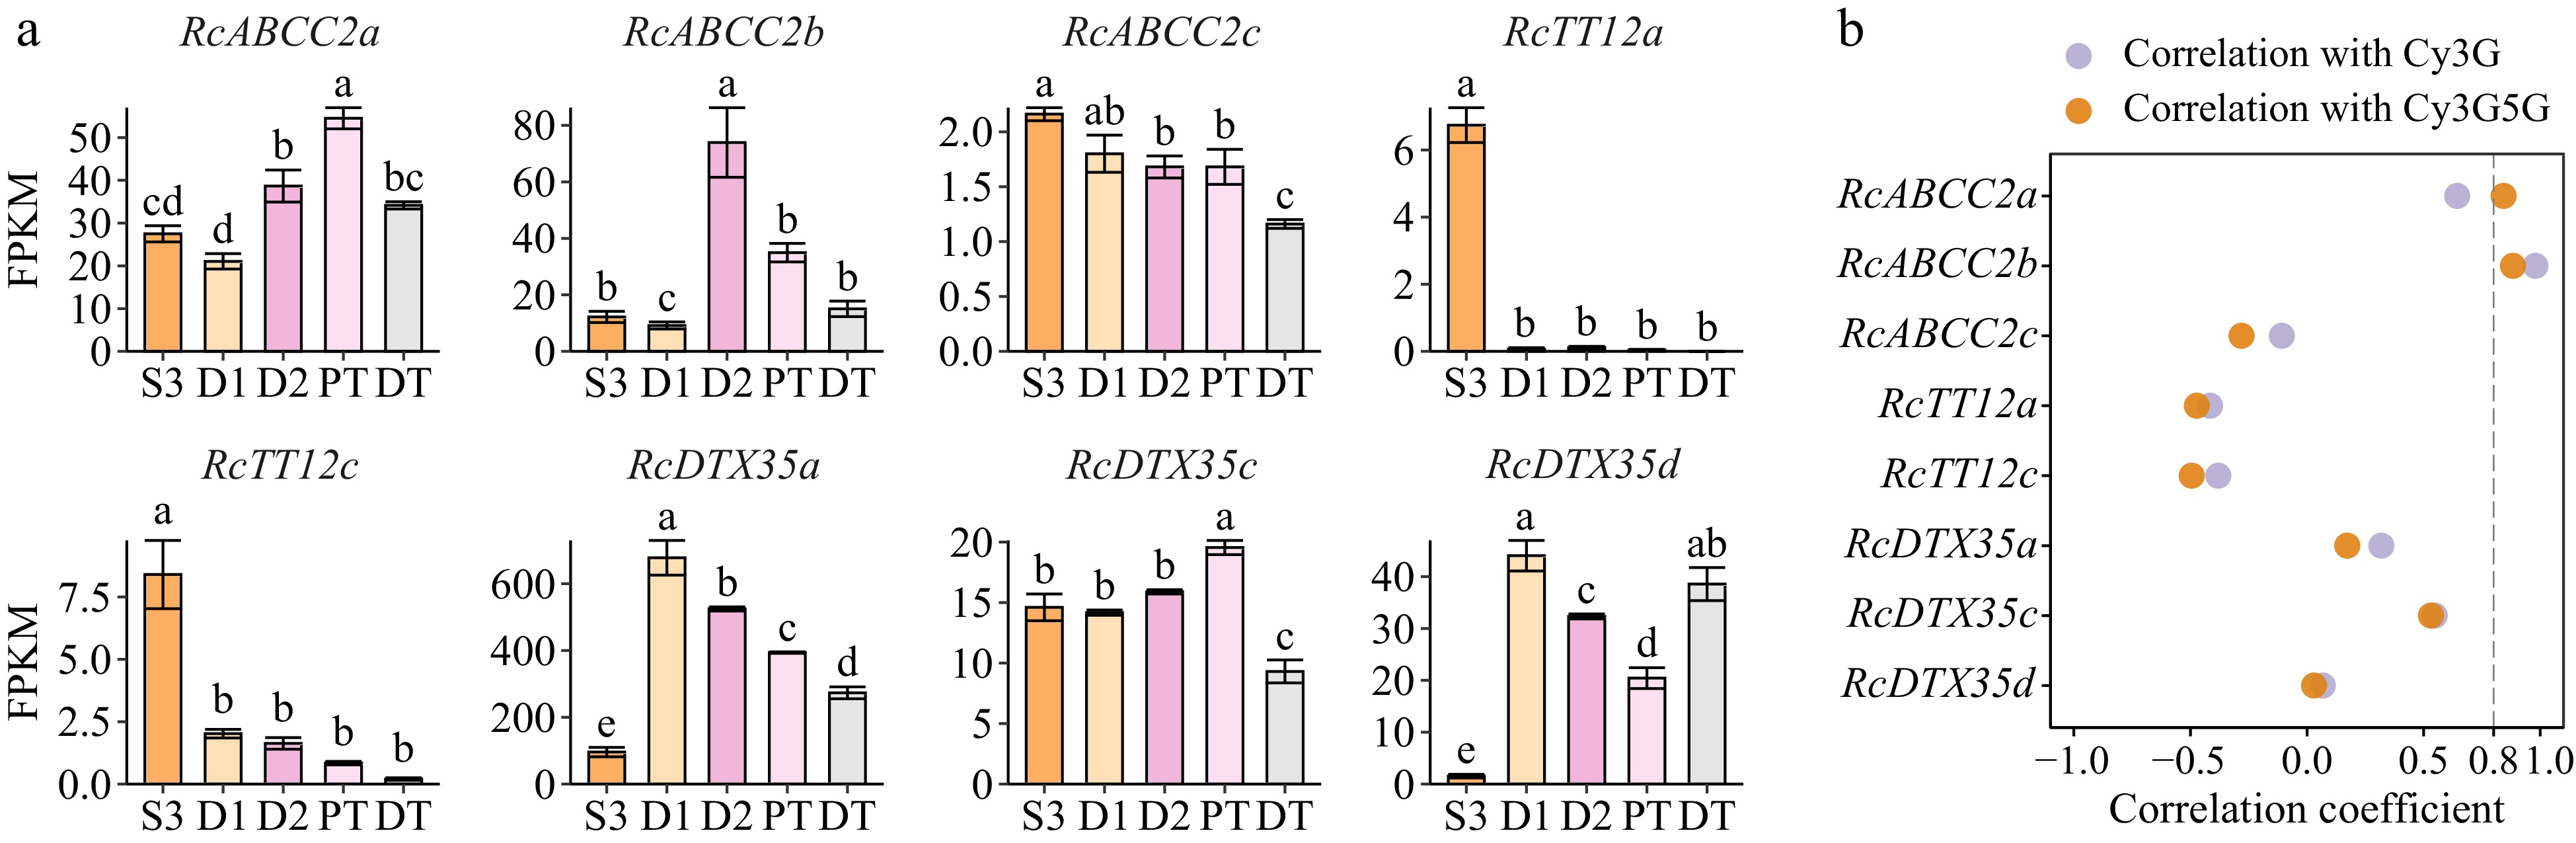
      Figure 6. 

      Orthologs of anthocyanin-related MATE and ABCC transporters in butterfly rose petals. Their genome IDs are listed in Supplemental Table S7. (a) Expression patterns of ABC and MATE genes in different samples of butterfly rose. Data are presented as the mean ± standard error (n = 3). Different lowercase letters indicate statistically significant differences (ANOVA test, p < 0.05). (b) Pearson correlation coefficient between candidate genes and two key anthocyanins in five samples.

    • To identify other genes involved in the flower color change of butterfly rose, the following criteria were applied: (1) upregulated expression (Log2FC ≥ 1, Q < 0.05) in color-changing petals (D2) compared to bud (S3) samples, and (2) upregulated expression in pink samples (D2 and PT) compared to white samples (DT) (Fig. 7a). Venn analysis of the number of differentially expressed genes (DEGs) between different samples revealed that 754 genes were co-upregulated (Fig. 7b). Considering that the biosynthesis of anthocyanins in the D1 stage has just started, we calculated the correlation coefficients between the expression levels of these 754 candidate DEGs and the accumulation of key anthocyanins (Cy3G and Cy3G5G) for four samples (S3, D2, PT, and DT). Genes with higher expression levels (average FPKM ≥ 2 in four samples) and higher correlation coefficients (Pearson r ≥ 0.80) with both key anthocyanins (Fig. 7c) were selected.
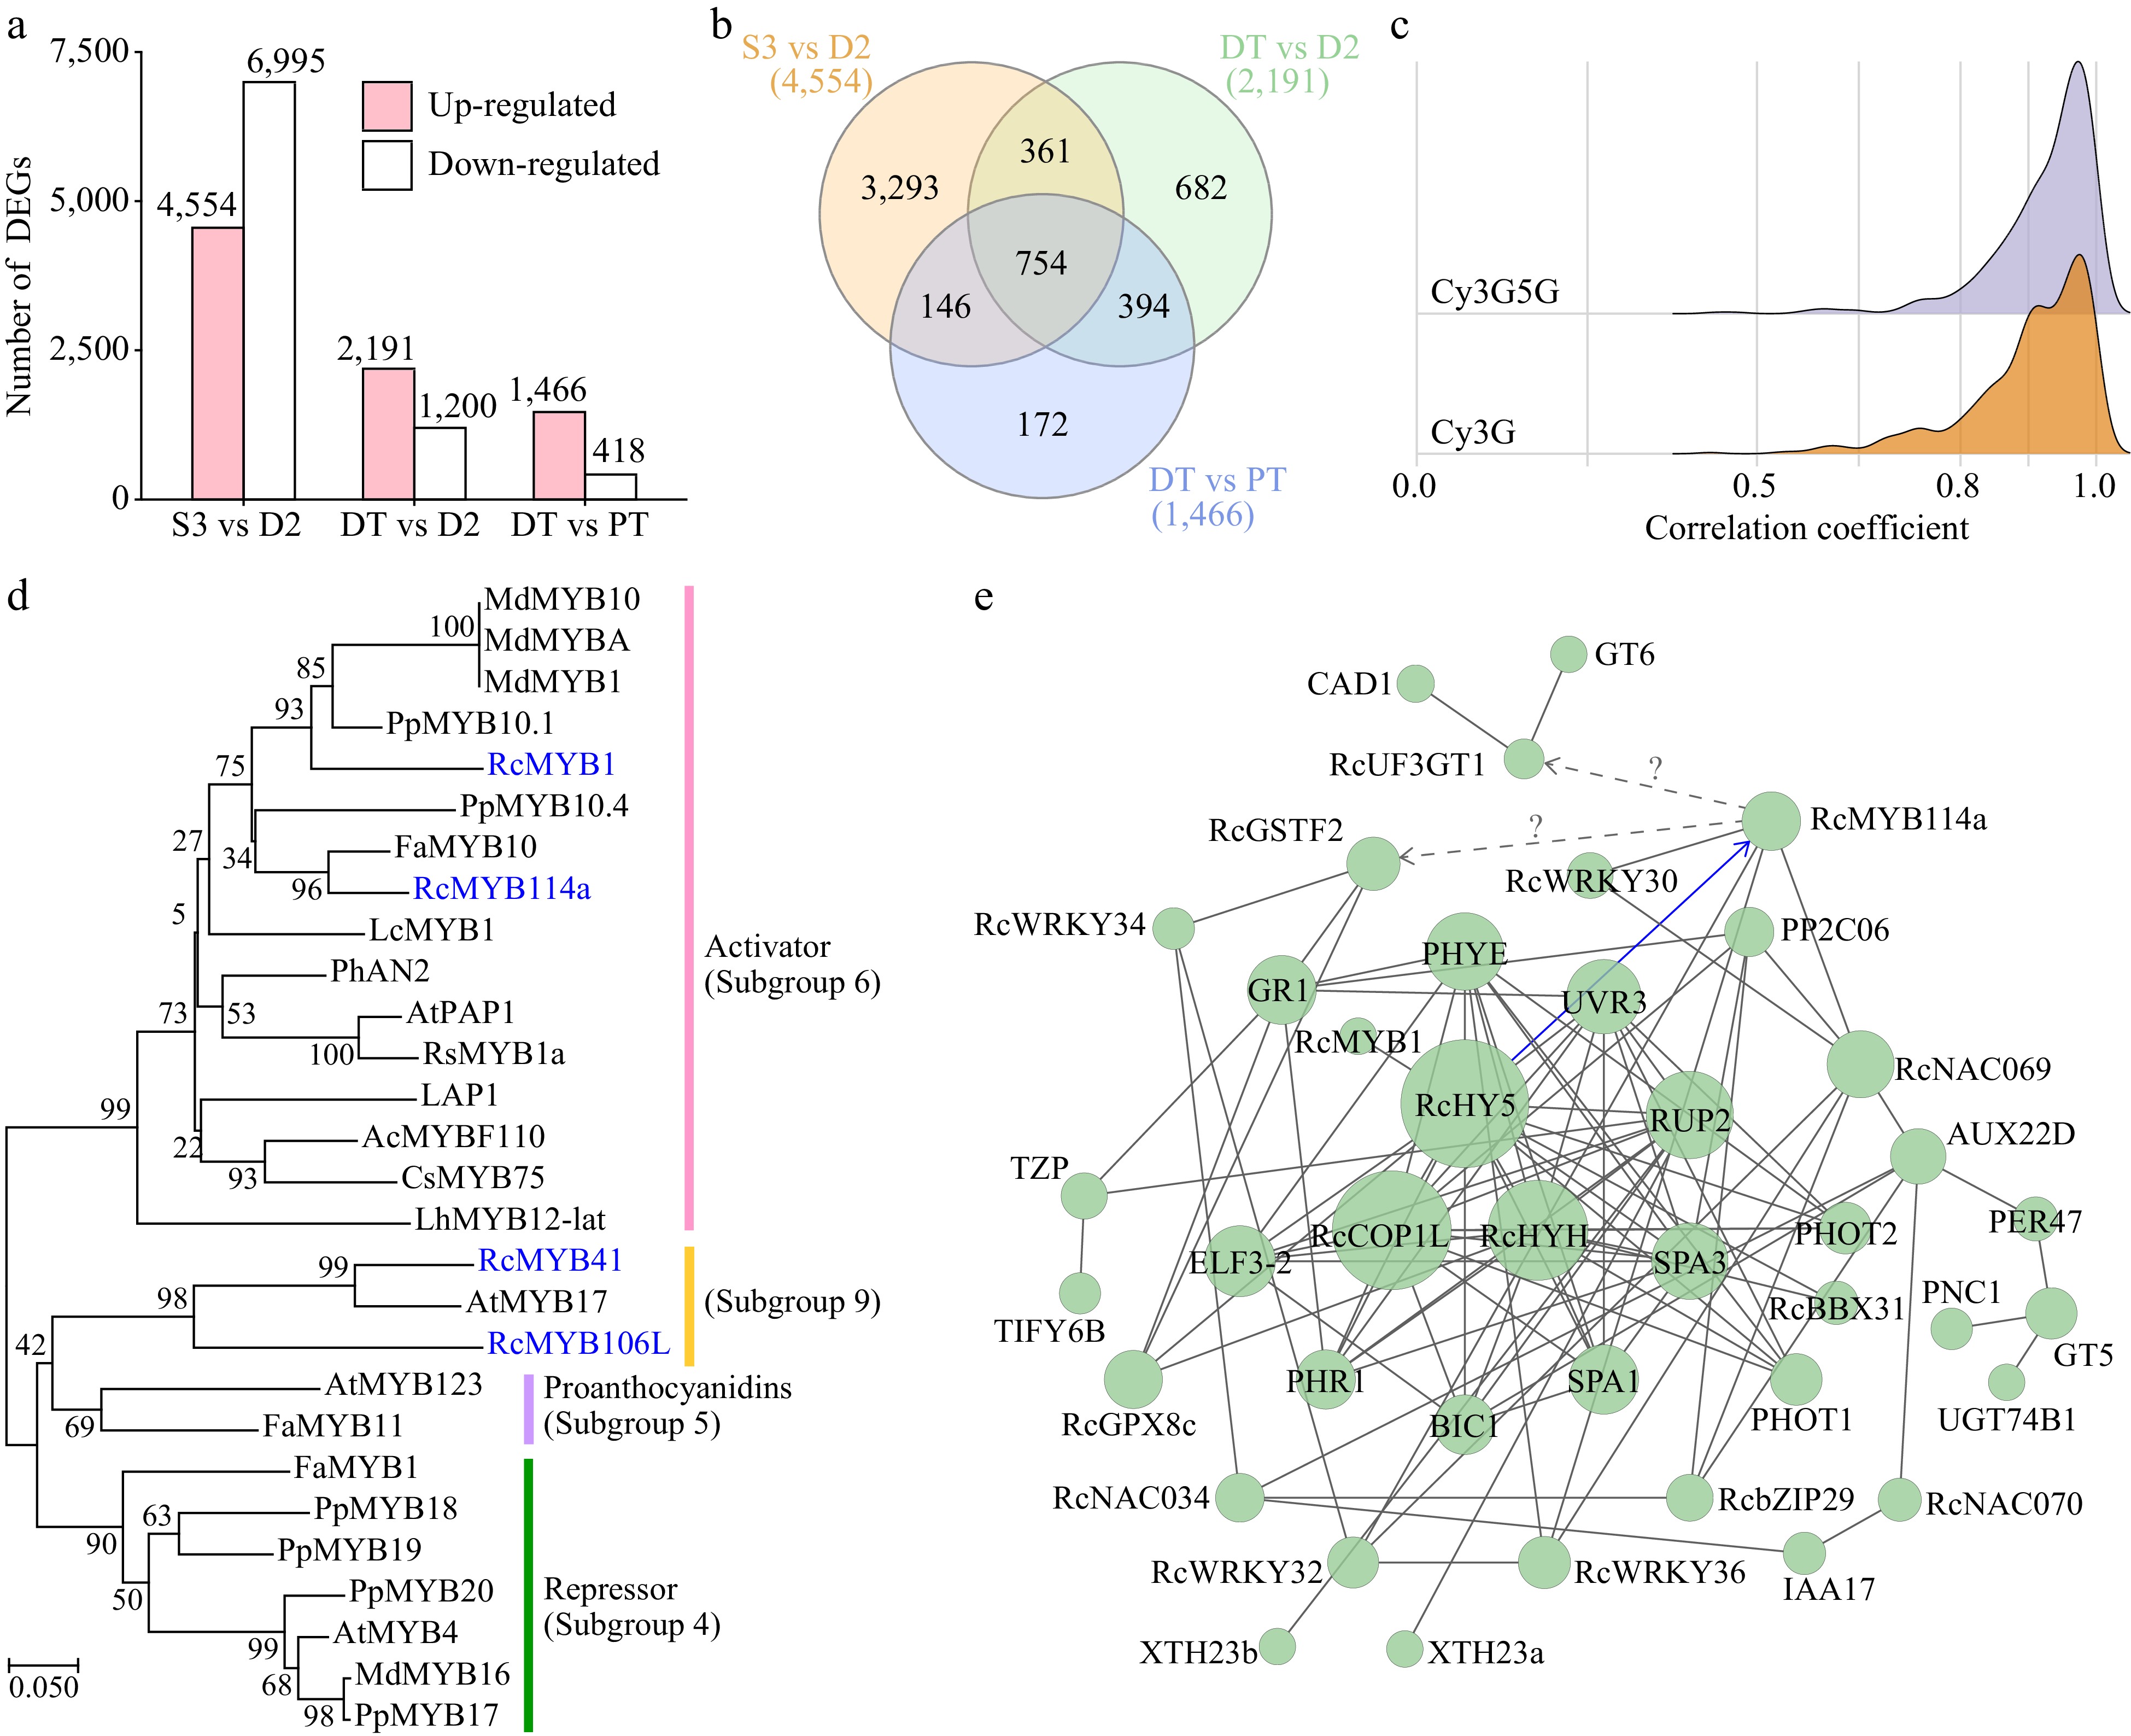
      Figure 7. 

      Differentially expressed genes (DEGs) during the post-anthesis color transition. (a) Number of DEGs between different samples. (b) Venn analysis of the number of DEGs. (c) Correlation coefficients between DEGs (average FPKM ≥ 2 in four samples) and key anthocyanins. (d) Neighbor-joining phylogenetic tree of four candidate R2R3-MYB proteins (highlighted in blue) with other characterized R2R3-MYBs. Protein sequences used in this analysis are listed in Supplemental Table S9. (e) Protein–protein interaction network of DEGs (confidence = 0.20). Their genome IDs are listed in Supplemental Table S10. The identified interaction is displayed as a blue line.

      A total of 445 DEGs were identified, including RcPAL2, 12 UGTs, RcGSTF2, and RcABCC2b. Among these, four R2R3-MYB genes (RcMYB1, RcMYB114a, RcMYB41, and RcMYB106L), four WD40 genes (RcSPA1, RcRUP1, RcCOP1L, and RcSPA3), three BBX genes (RcBBX28, RcBBX31, and RcBBX32), four bZIP genes (including RcHYH and RcHY5), three NAC genes, and four WRKY genes were identified as DEGs. No differentially expressed bHLH genes were detected. Key DEGs and their genome IDs are listed in Supplemental Table S8.

      The protein sequences of the four differentially expressed R2R3-MYB genes, along with those of other R2R3-MYB protein sequences involved in anthocyanin biosynthesis, were used to construct a neighbor-joining phylogenetic tree (Fig. 7d). Among these, RcMYB41 and RcMYB106L belong to subgroup 9 and potentially involved in epidermal cell outgrowth[79]. RcMYB1 and RcMYB114a were clustered with MYBs that activate anthocyanin accumulation in other plants (subgroup 6) and positively regulate anthocyanin biosynthesis[17,18,80].

      To predict the potential functions and relationships of these genes, we constructed a protein–protein interaction network among the DEGs involved in anthocyanin-related pathways. The results indicate that some BBX, bZIP, NAC, and WKRY transcription factors might be involved in PACC, while RcHY5, RcCOP1L and RcHYH might be the core regulators of color transition in rose petals. Indeed, RhHY5 induced the expression of RhMYB114a under light conditions in 'Burgundy Iceberg' rose[17]. However, the regulatory network of RcMYB114a, RcGSTF2 and RcUF3GT1 remain unclear.

    • Based on the above analysis, 21 candidate DEGs including four structural genes (RcUF3GT1, RcGSTF2, RcABCC2b, and RcPAL2) and 17 transcription factors were selected for further analysis (Supplemental Table S4). The genes whose transcripts encoding protein sequences showed high identity (> 60%) with corresponding genome protein were selected for RT-qPCR analysis. The expression levels of 15 candidate genes were analyzed in butterfly rose and R. hybrida 'Spectra'), both of which were PACC cultivars (Fig. 8a). In R. hybrida 'Spectra' petals, no anthocyanins were detected in the yellow petal (pre-change, SY) samples, whereas more anthocyanins accumulated in the red petal (post-change, SR) samples (Fig. 8b & c). The main anthocyanins that accumulated in the SR samples were Pg3G (76.84%) and Pg3G5G (12.14%), which differed from the anthocyanin profiles of D2 samples.
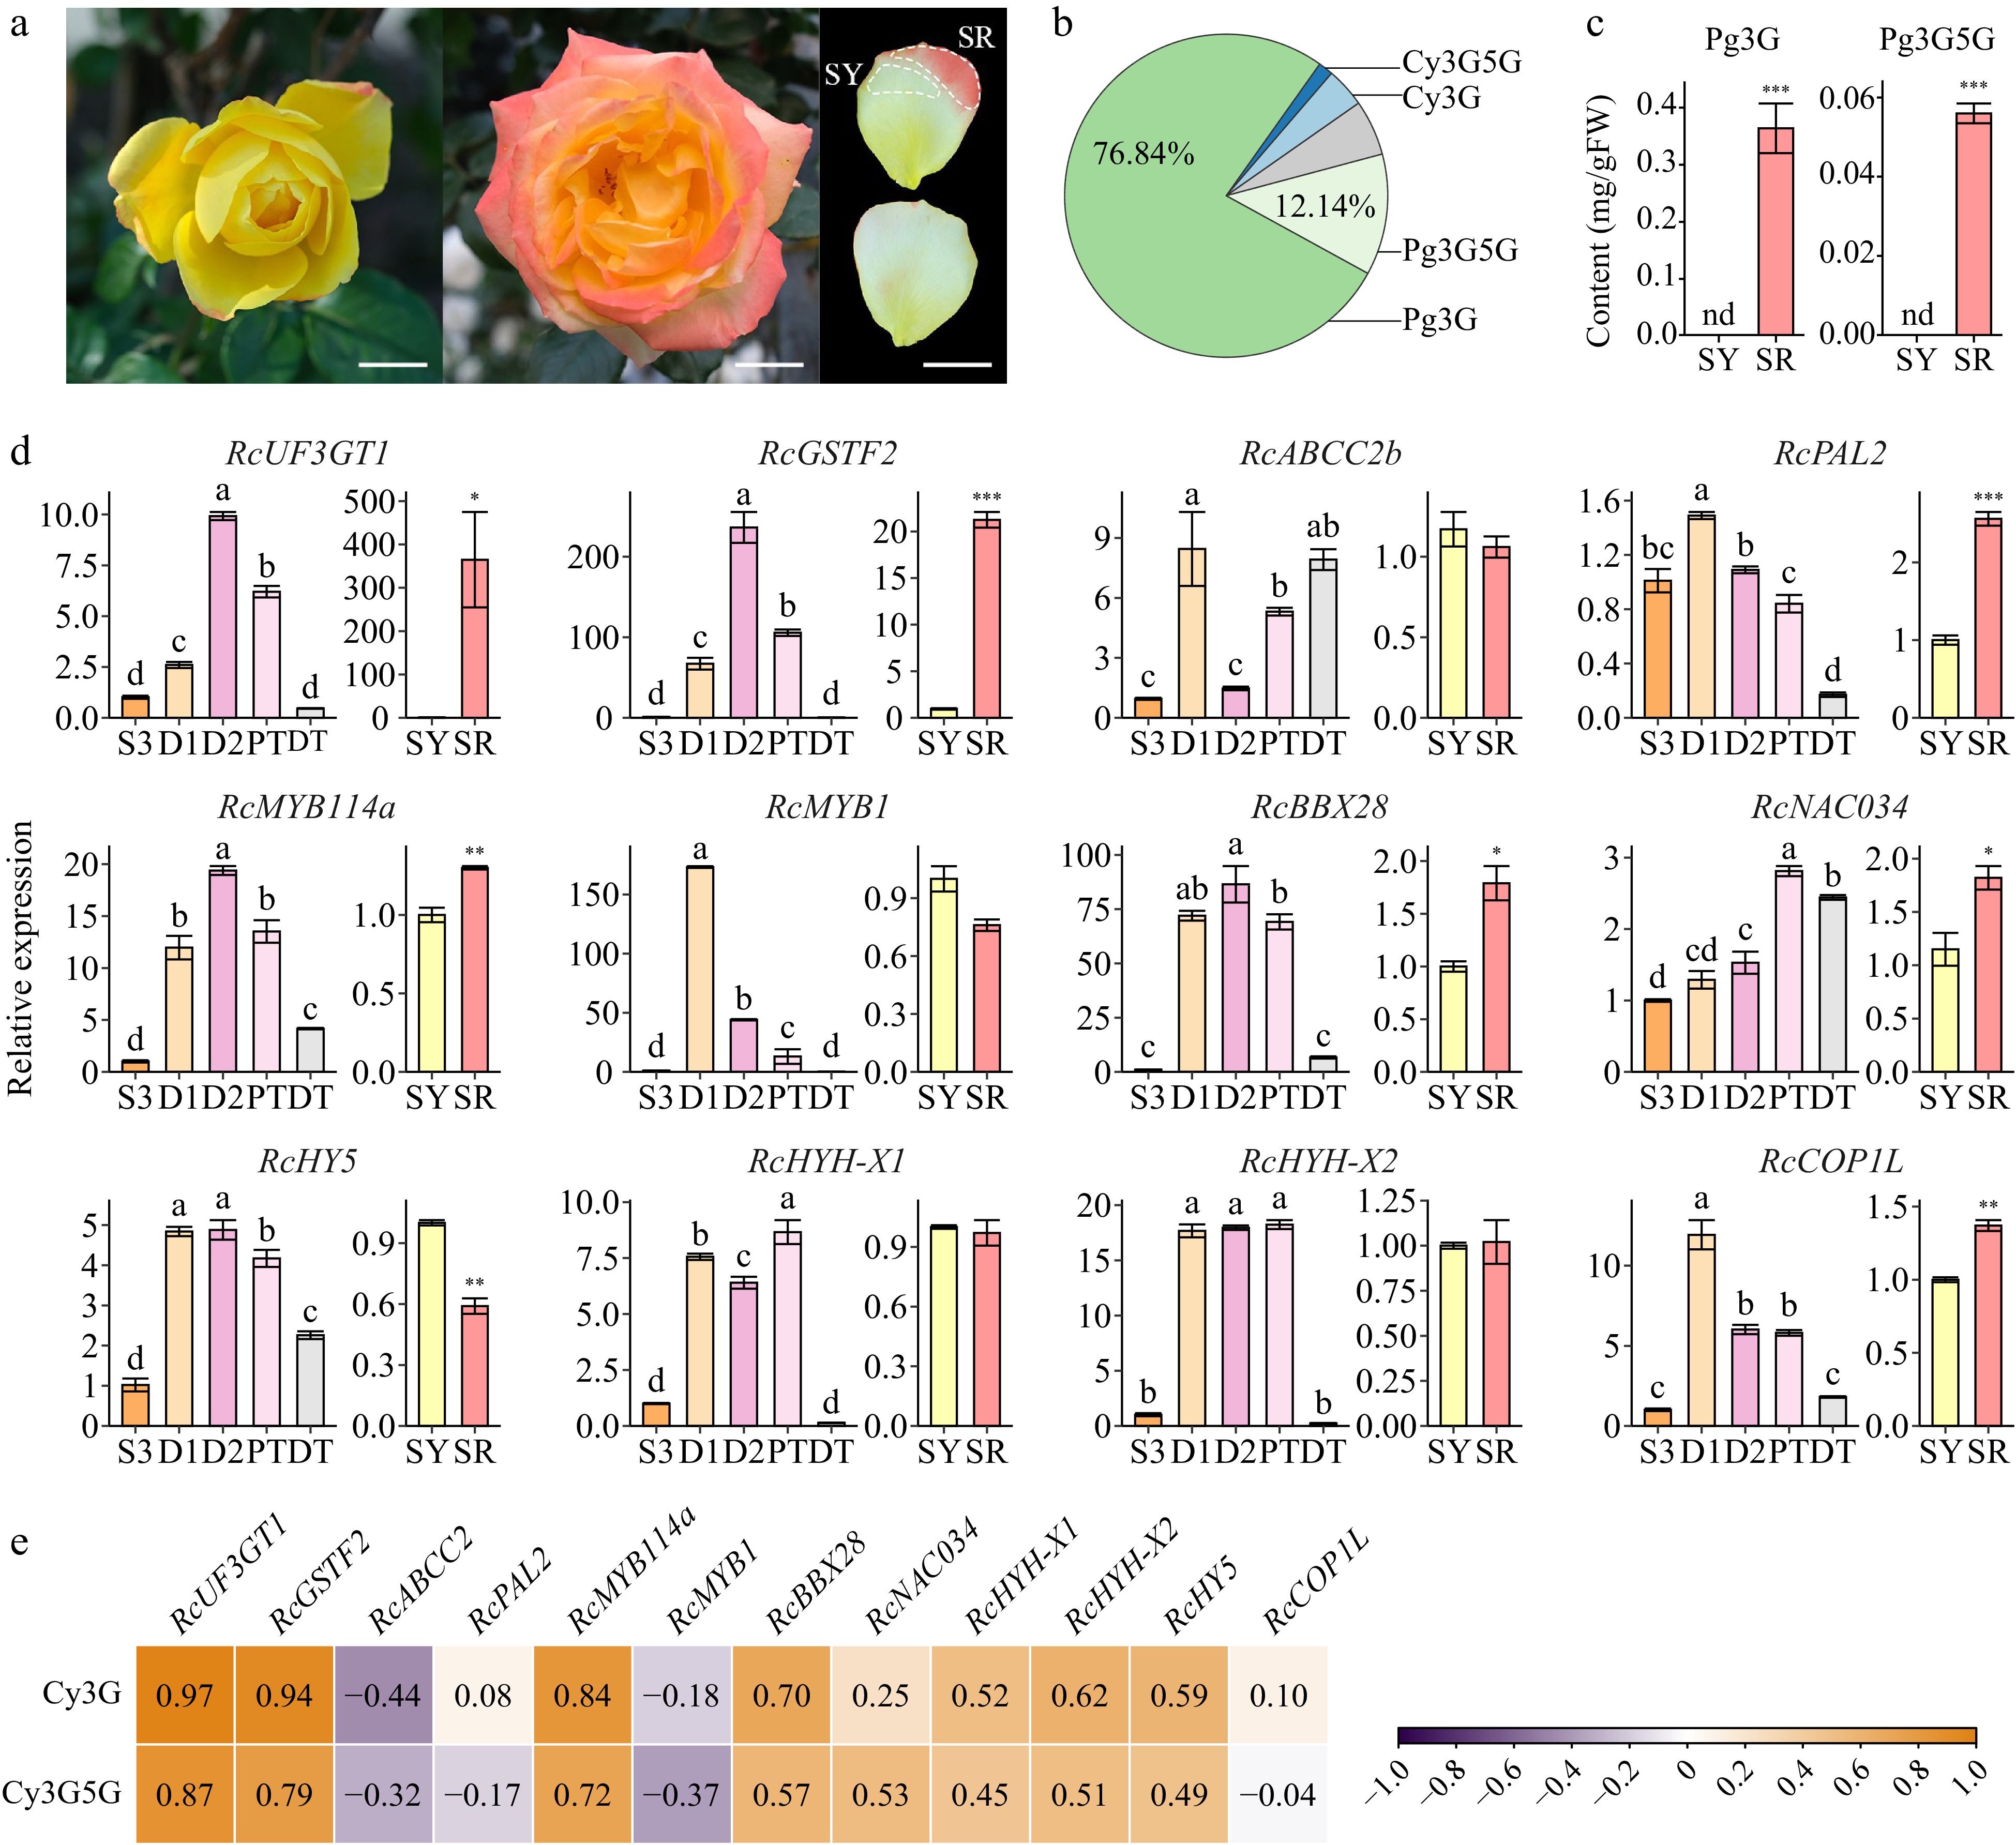
      Figure 8. 

      Analysis of candidate DEGs. Data are presented as the mean ± standard error (n = 3). (a) Photos of R. hybrida 'Spectra'. Scale bars = 2 cm. Left, newly opened flower; middle, full-bloom flower (fourth or fifth day of anthesis); upper right, adaxial surface of collected petal; lower right, abaxial surface of collected petal. (b) Two key anthocyanin contents in different samples of R. hybrida 'Spectra'. (c) Anthocyanin components in the red part of middle-layer petals of R. hybrida 'Spectra' (SR). (d) Expression levels of candidate DEGs in different samples of R. chinensis (ANOVA test, p < 0.05). and R. hybrida 'Spectra' (Student's t-test, *p < 0.05, **p < 0.01). (e) Correlation analysis between the expression of candidate DEGs and key anthocyanins in butterfly rose samples.

      In butterfly rose samples, RT-qPCR analysis confirmed the expression patterns of RcUF3GT1 and RcGSTF2, whose expression showed high correlations with anthocyanin contents, while the expression of RcPAL2 and RcABCC2b showed low correlations with anthocyanin contents. Similarly, RcUF3GT1 and RcGSTF2 were expressed higher in SR samples than in SY samples (Fig. 8d). In addition, RT-qPCR and correlation analysis on candidate transcription factors showed that RcMYB114a and RcBBX28 showed high correlations with anthocyanin contents in butterfly rose and were differentially expressed in R. hybrida 'Spectra' petals (Fig. 8d & e, Supplemental Fig. S3). Two distinct alternative splicing variants of RcHYH were detected in D2 samples (Supplemental Table S4), and the expression of RcHYH-X1 and RcHYH-X2 were more sensitive to sunlight than RcHY5. The expression patterns of RcHY5, RcHYH, and RcCOP1L were not strongly correlated with the anthocyanin content in different rose samples and their functions require further research. Together, these results suggest that RcUF3GT1, RcGSTF2, RcMYB114a and RcBBX28 are crucial genes involved in the post-anthesis transition in rose petals.

    • Flower color is a signal that plants use to communicate with their visitors; different messages can be sent to visitors by changing flower color. The retention of old flowers favors the attraction of visitors over long distances and directs nearby visitors toward rewarding flowers[3]. In this study, it was observed that visitors of butterfly rose flowers, including hoverflies and Italian bees, preferentially visited pre-changed (D1) flowers, followed by slightly post-changed (D2) flowers. White flowers after dark treatment were also popular among visitors. Hoverflies and bees preferred UV-absorbing yellow colors, which may contain pigments such as flavonoids and aurane chalcones[81]. From the bees' perspective, red appears similar to the background color of green leaves[3]. Therefore, plants such as butterfly rose change their flower color by accumulating anthocyanins in their petals to form different visual signals for visitors. This is a color-changing strategy used by many natural bee-pollinated plants[82].

      PACCs in different plants are induced by different structural genes. The transition of flower color from acyanic (white and yellow) to cyanic (pink, red, and purple) is primarily due to an increase in anthocyanin content, accompanied by the upregulation of structural genes involved in the anthocyanin biosynthesis pathway[8,46,83]. In Viola cornuta, VcANS is the key regulated gene for floral color change during development, whereas the upregulated expression of NmCHS is associated with an increase in anthocyanin content in Nicotiana mutabilis petals[8,9]. In Pleroma raddianum, CHS and ANS are upregulated during color transition[84]. In the present study, among the structural genes involved in the flavonoid/anthocyanin biosynthetic pathway, only RcUF3GT1, and several other low-expression UGT genes showed similar expression patterns for anthocyanin accumulation in petals, similar to that in safflower (Carthamus tinctorius)[52]. Among previous studies on PACC rose cultivars, such as 'Charleston', 'Ehigasa', and 'Masquerade', all cultivars accumulate Cy3G and Cy3G5G in the post-change petals[45,46], which was the same for butterfly rose. Different anthocyanin profiles accumulated in the post-change petals of R. hybrida 'Spectra', mainly Pg3G and Pg3G5G (Fig. 8b). This suggests that anthocyanins causing the color change in rose were not limited to cyanidin glycosides. Therefore, we speculate that the glycosylation of anthocyanidin is regulated during the post-anthesis color transition in rose flowers.

      Many rose cultivars are self-incompatible, such as R. chinensis var. spontanea and R. chinensis 'Slater's Crimson China'[85,86]. Under semi-transparent PT conditions, the exclusion of foreign pollen still resulted in a color change (Fig. 1a). This indicates that pollination may not be a key factor affecting PACC in butterfly rose. The same phenomenon was observed in Weigela japonica var. sinica, and its color change was independent of pollinator visits and flower pollination[2]. In the present study, a positive correlation was observed between anthocyanin accumulation and light intensity at the D2 stage. Butterfly rose petals showed minimal accumulation of anthocyanins under dark treatment but continued to accumulate anthocyanins after exposure to sunlight (Fig. 1a). It indicates that light is an important environmental factor affecting anthocyanin production.

      In this study many differentially expressed transcription factors are involved in the light signaling pathway (Supplemental Table S10). As a major positive regulator of light signaling in plants, HY5 directly binds to the promoters of anthocyanin biosynthesis genes and MYB transcription factors to regulate anthocyanin synthesis[87,88]. A recent study on rose flowers showed that RhHY5 induces the expression of RhMYB114a and positively regulates anthocyanin biosynthesis by directly activating anthocyanin structural genes via the MYB114a-bHLH3-WD40 complex[17]. R2R3-MYBs can directly regulate structural genes involved in the anthocyanin biosynthesis, as well as GST transporter of anthocyanins[22,29]. Whether RcMYB114a can directly regulate RcUF3GT1 and RcGSTF2 requires further experimental verification. HYH also regulates anthocyanin accumulation in pear and peach[89,90]. In pear fruits, PybZIPa promotes anthocyanin biosynthesis by regulating PyMYB114, PyMYB10, PyBBX22 and PyUFGT[89]. In peach fruit, PpHYH activates PpMYB10 in the presence of the cofactor PpBBX4, leading to anthocyanin accumulation in sun-exposed peels[90]. PavBBX6 and PavBBX9 can positively regulate light-induced anthocyanin in Prunus avium by promoting PavUFGT, while the PpBBX16/PpHY5 complex strongly induced the promoter activity of PpMYB10 in Pyrus pyrifolia[19,91]. BBX28 negatively regulate flowering in Arabidopsis, and the PIF8-BBX28 module regulates petal senescence in rose flowers[49,92]. RcCOP1L does not interact physically with RcHY5, and its function is unknown[54]. Further research is required to elucidate the complex regulatory network involved in light-induced anthocyanin pigmentation in R. chinensis 'Mutabilis' flowers.

    • This study elucidated the mechanisms underlying color transitions in rose flowers. We found that color changes in butterfly rose flowers resulted from an increased accumulation of anthocyanins, with Cy3G and Cy3G5G being the key components. Trace amounts of anthocyanins accumulated in the dark-treated samples, whereas pigmentation occurred in the samples exposed to sunlight. Thus, sunlight plays a crucial role in the post-change pink coloration of R. chinensis 'Mutabilis'. Among the structural genes involved in the flavonoid/anthocyanin biosynthetic pathway, only RcUF3GT1 was significantly correlated with anthocyanin accumulation in butterfly rose flowers. Among the 80 genome-wide identified full-length RcGST genes, the expression patterns, and bioinformatics analyses highlighted the involvement of RcGSTF2 in anthocyanin transport. Orthologs of anthocyanin-related MATE and ABCC transporters were inactive in butterfly rose petals. RcMYB114a was considered an important positive transcription factor. Additionally, RcBBX28 might play significant roles in regulating anthocyanin biosynthesis during post-anthesis color change. These insights contribute to our knowledge of flower color change and have implications for further research on plant genetics and flower color evolution.

    • The authors confirm contribution to the paper as follows: study conception and design: Kong Y, Bai J; sample collection: Kong Y, Qiu L, Dou X, Lang L; laboratory analysis: Kong Y, Wang H; draft manuscript preparation: Kong Y; feedback on the analysis and manuscript: Wang H, Bai J. All authors reviewed the results and approved the final version of the manuscript.

    • The datasets generated during and/or analyzed during the current study are available from the corresponding author on reasonable request.

      • This research was funded by the Beijing Natural Science Foundation (6222007), National Natural Science Foundation of China (31401901), and the Innovation and Development Program of Beijing Academy of Science and Technology (23CB092).

      • The authors declare that they have no conflict of interest.

      • Copyright: © 2024 by the author(s). Published by Maximum Academic Press, Fayetteville, GA. This article is an open access article distributed under Creative Commons Attribution License (CC BY 4.0), visit https://creativecommons.org/licenses/by/4.0/.
    Figure (8)  References (92)
  • About this article
    Cite this article
    Kong Y, Wang H, Qiu L, Dou X, Lang L, et al. 2024. Anthocyanin contents and molecular changes in rose petals during the post-anthesis color transition. Ornamental Plant Research 4: e020 doi: 10.48130/opr-0024-0019
    Kong Y, Wang H, Qiu L, Dou X, Lang L, et al. 2024. Anthocyanin contents and molecular changes in rose petals during the post-anthesis color transition. Ornamental Plant Research 4: e020 doi: 10.48130/opr-0024-0019

Catalog

  • About this article

/

DownLoad:  Full-Size Img  PowerPoint
Return
Return