


-
Tree peony (Paeonia × suffruticosa Andr.) is one of the ten traditional famous flowers in China, with large, colorful, and ornamental flowers, as well as symbols such as wealth and auspiciousness. Tree peony is native to China, and the group includes nine wild species[1], while wild tree peony has an important research and application value as a genetic resource for the origin and evolution of cultivated tree peony[2]. In addition to its rich floral patterns and colors, tree peony often shows red color in its new spring leaves. As one of the nine wild species, Paeonia qiui has the most typical red color characteristics of its new leaves, and spring leaves show reddish-purple color before blooming, and the red leaf period lasts for about one month, so it has a good foliage potential. Therefore, it can be used as an important resource for improving the leaf color of tree peonies, and it is of great significance to explore the mechanism of its color presentation.
The formation of plant color has complexity and is closely related to the type of pigment in the cell, cellular pH value, and the shape of the epidermal cells. Among them, the most important factor is the type and content of pigmented substances in the tissues, and the changes of these pigments are affected by the combination of intrinsic genetics and the external environment[3,4]. Phytochromes mainly include four major groups: flavonoids, carotenoids, chlorophylls, and alkaloids. Among them, flavonoids can produce the widest range of colors, from pale yellow to blue-purple; carotenoids present yellow, orange, or red; chlorophylls present green; and betalain present red or yellow. Compared to the other three widely distributed and more common pigments, betalain has a narrow distribution in nature and is mainly found in plants of the order Caryophyllales[5−7].
Flavonoids can be divided into two groups: anthocyanins and anthoxanthins. Anthocyanins are the main flavonoids that play an irreplaceable role in the color development of plants, showing a wide range of colors from pink to blue-purple, and mainly include six major classes of cyanidin, delphindin, malvidin, pelargonidin, peonidin, and petunidin. Anthoxanthins mainly produce colors ranging from white to dark yellow and consist of flavonols, flavones, flavanones, chalcones, etc., which are pale yellow or colorless except for chalcones, which are dark yellow[8].
As secondary metabolites, anthocyanins play a crucial role in mediating plant responses to biotic and abiotic environmental factors[9]. In addition, anthocyanins are thought to scavenge reactive oxygen species and prevent cardiovascular disease[10]. Anthocyanidin fractions and content affect the coloration of tissues, previous studies have confirmed that there are six main anthocyanidins in tree peony, namely pelargonidin-3-O-glucoside (Pg3G), pelargonidin-3,5-di-O-glucoside (Pg3G5G), cyanidin-3-O-glucoside (Cy3G), cyanidin-3,5-di-O-glucoside (Cy3G5G), peonidin-3-O-glucoside (Pn3G), and peonidin-3,5-di-O-glucoside (Pn3G5G)[11−13]. The biosynthetic pathways and transcriptional regulation of plant anthocyanins have been extensively studied, and their biosynthesis is catalyzed by enzymes encoded by a series of structural genes, including chalcone synthase (CHS), chalcone isomerase (CHI), flavanone-3-hydrolase (F3H), dihydroflavonol 4-reductase (DFR), and anthocyanidin synthase (ANS)[14−17]. In addition, transcription factors are also involved in anthocyanin biosynthesis, and the three TF families known to play major roles in this process are MYB, basic helix-loop-helix (bHLH), and WD40. Among them, MYB TFs are the most involved class in anthocyanin synthesis regulation research. They can regulate the expression of structural genes independently, or form MYB-bHLH-WD40 (MBW) protein complex to comprehensively regulate the expression of structural genes of anthocyanin synthesis[18−22].
Current studies on tree peony coloration have mostly focused on the phenotypic analysis of flower color and floral pigment composition of different varieties of tree peony[23−26]. In contrast, there is a paucity of studies on tree peony leaf color. In this study, we determined the color parameters, cellular pH, pigment composition, and content changes of P. qiui leaves and petals at different developmental stages, and quantitatively analyzed anthocyanidin components and genes related to anthocyanin synthesis, to explore the factors affecting the changes of P. qiui leaves and petals. This will provide theoretical references at the physiological and molecular levels for the conservation and exploitation of wild tree peony genetic resources, the study of tree peony leaf color and flower color, and the breeding of new varieties.
-
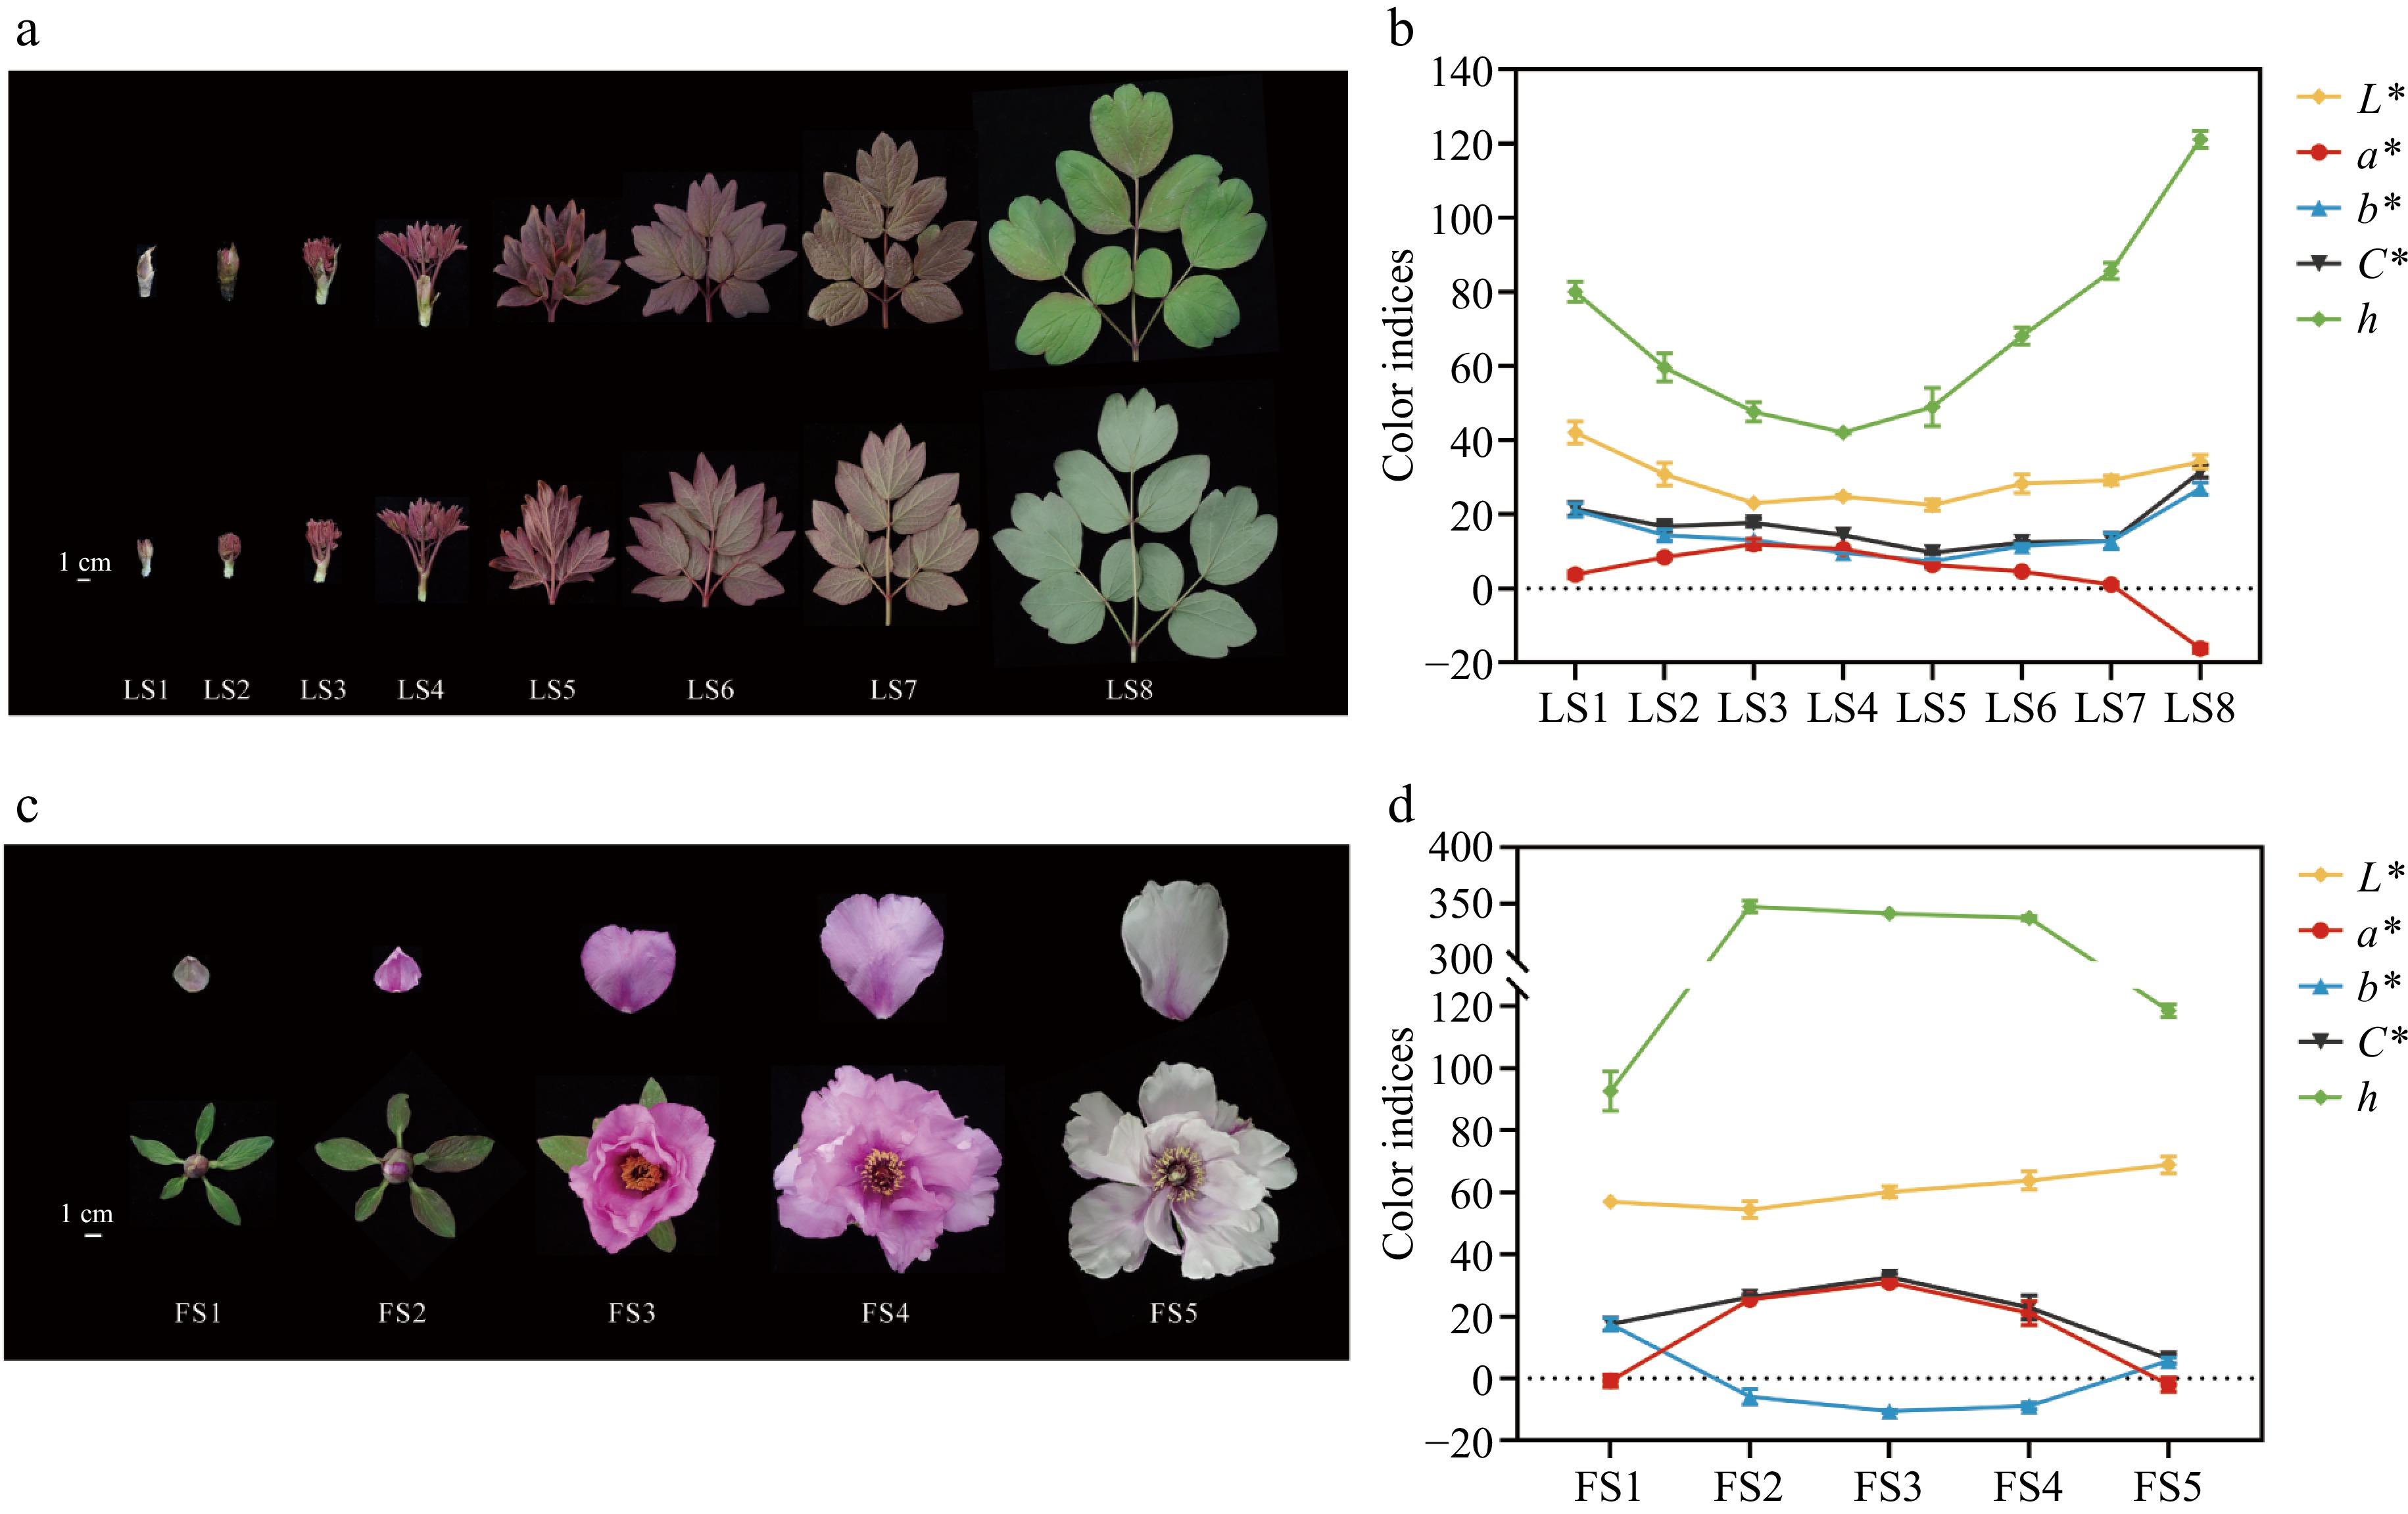
P. qiui plants were cultivated in the Tree Peony Garden of Northwest A&F University, Shaanxi Province, China (34°26' N, 108°07' E). Samples were collected from March to April 2023 based on leaf and flower development and phenotype, respectively. The leaves were collected for a total of eight periods from LS1 to LS8 (Fig. 1a): LS1 emergence stage, mixed buds began to expand; LS2 sprouting stage, flower buds began to open, revealing young leaves and apical buds; LS3 petiole visibility stage, leaf blades were revealed and petioles could be seen; LS4 petiole spreading stage, the petiole opens outward and the leaflets are still curled up; LS5 leaves at the unfolding stage, the leaflets gradually develop from the bottom upward; LS6 wind bell bud stage, the leaf blades are fully expanded, and the outer sepals of the flower buds unfold; LS7 petal coloring stage, the petals partially expose the sepals, and the leaf blades are green and obvious; LS8 full bloom stage, the petals are fully expanded, and the leaf blades are turning green. The petals were collected at five periods according to the flower development of P. qiui (Fig. 1c), which were: FS1 slightly pigmented soft bud; FS2 initially opened flower; FS3 half opened flower; FS4 fully opened flower; FS5 Decaying flowers. Arabidopsis thaliana and Nicotiana tabacum were incubated at 25 °C with a photoperiod of 16 h of light and 8 h of darkness.
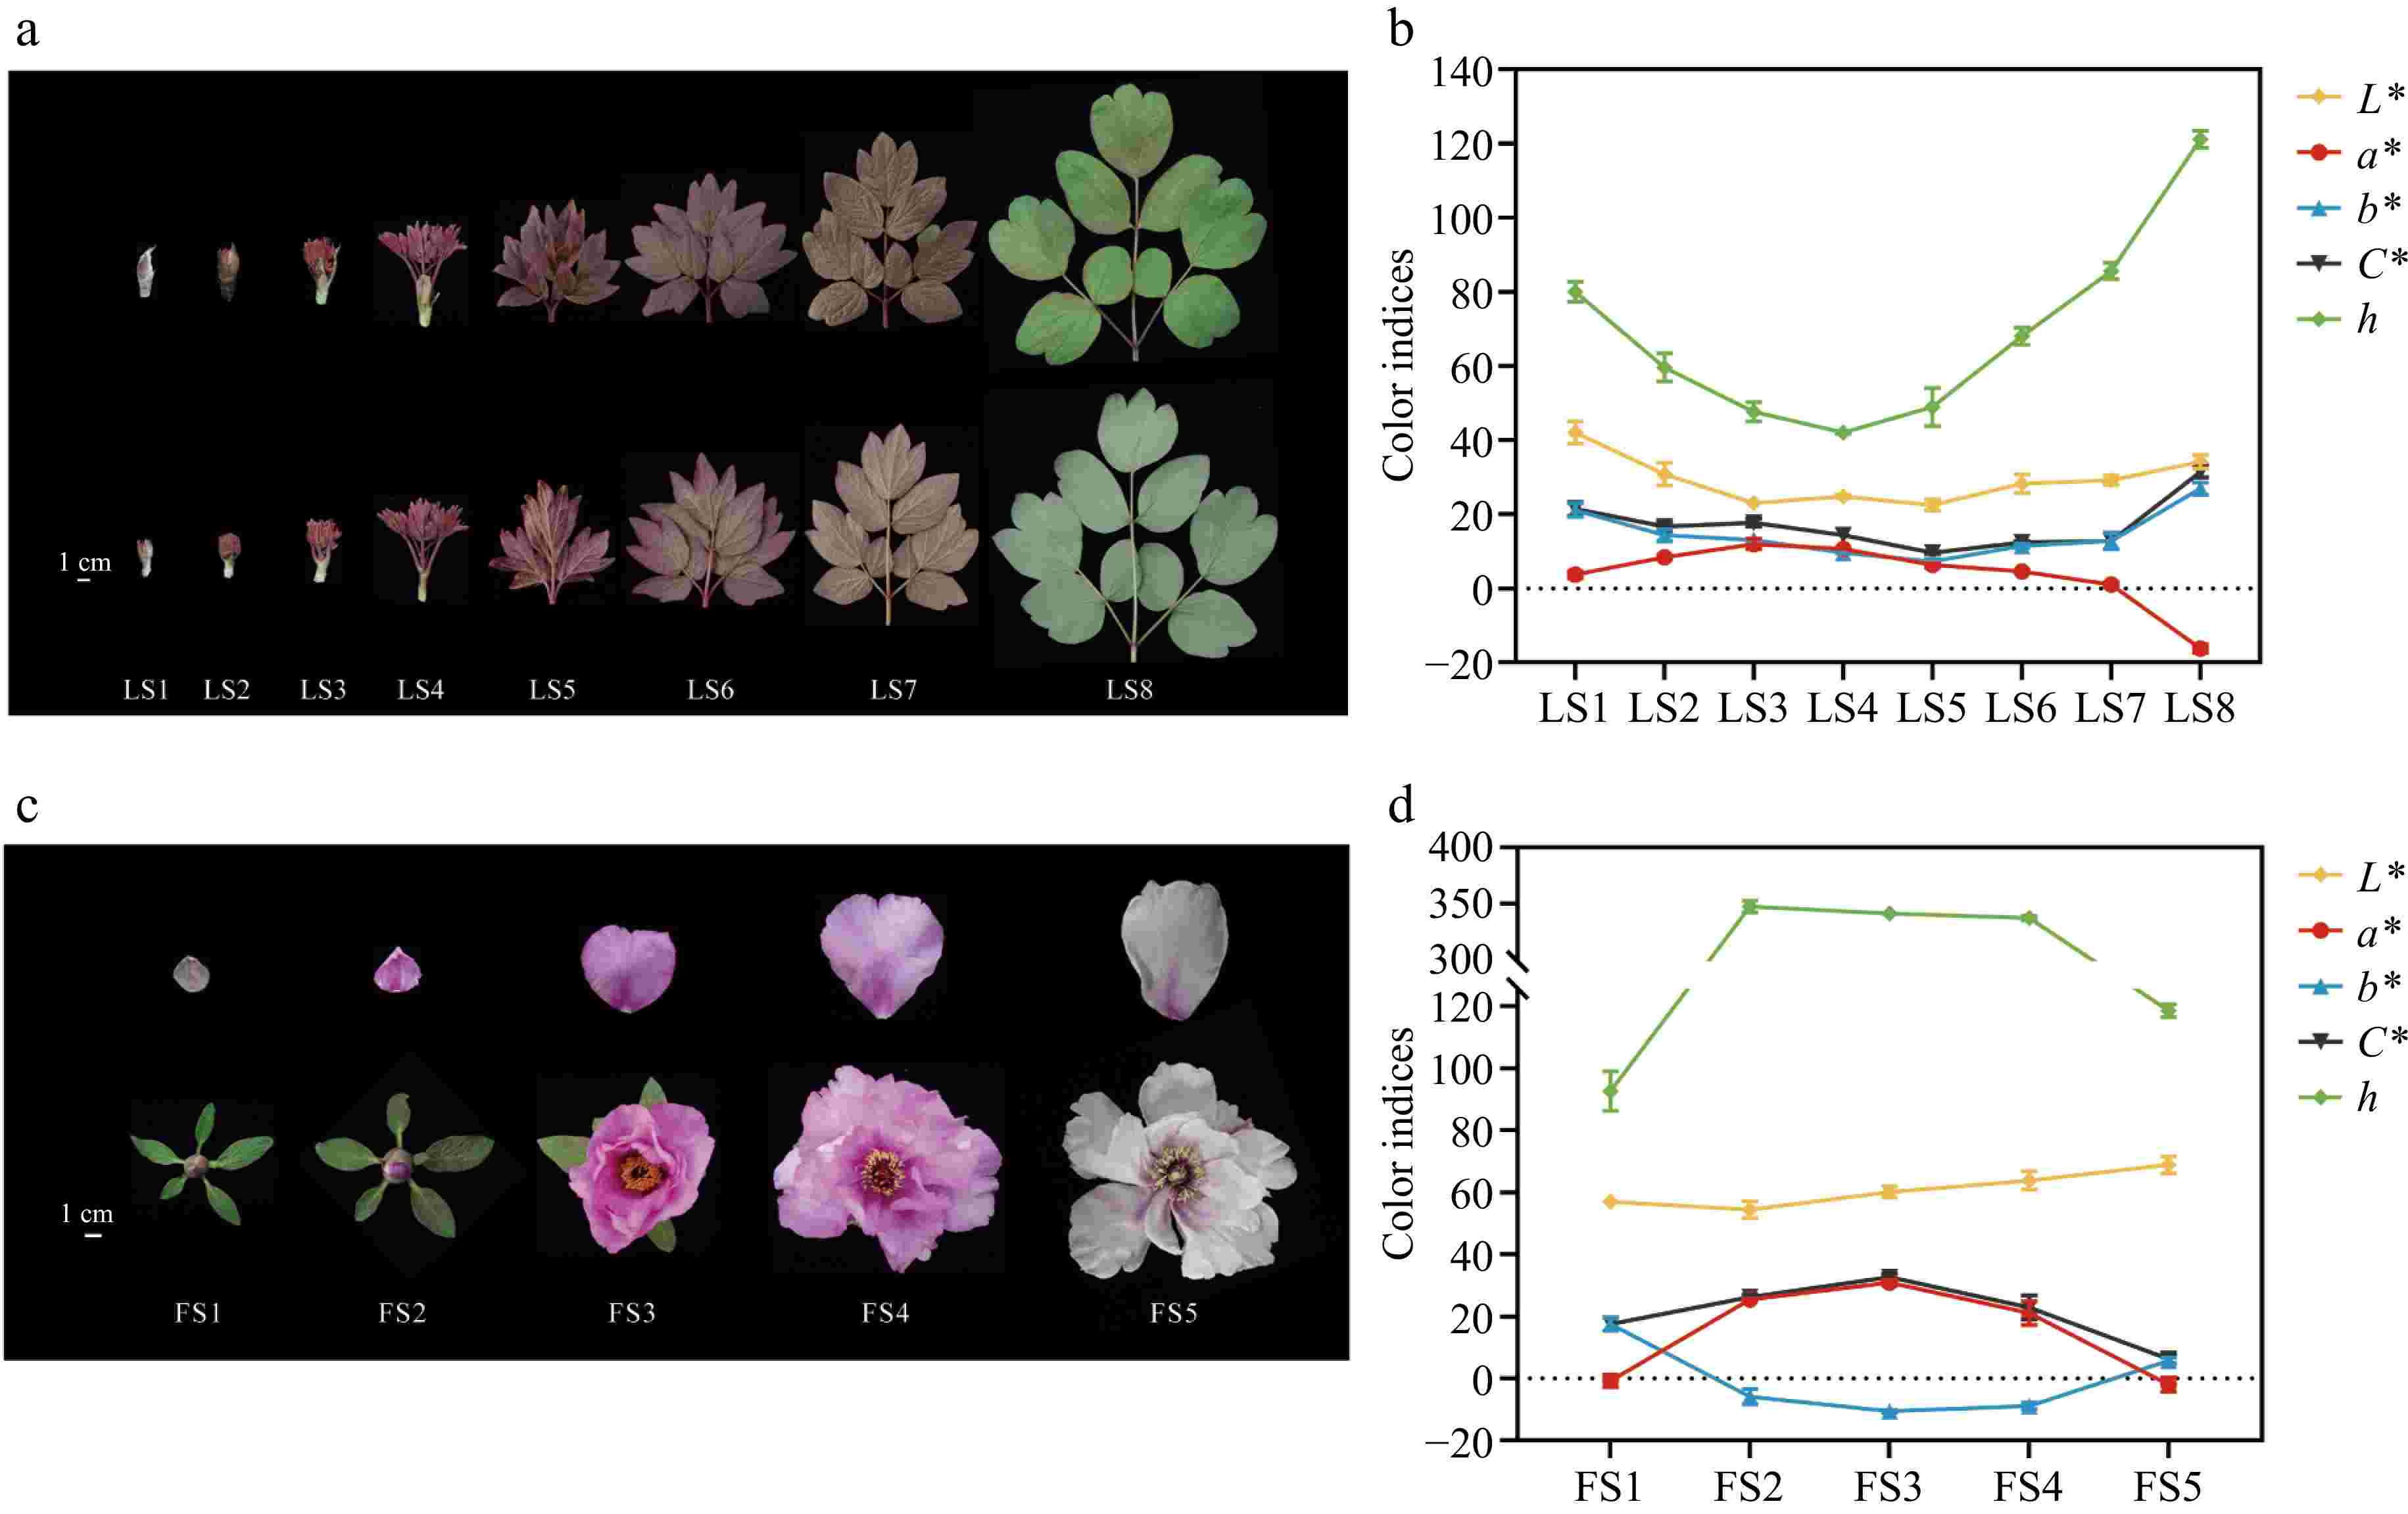
Figure 1.
Phenotypes and color indices of leaves and flowers of P. qiui at different time periods. (a) Leaf phenotypes of P. qiui. (b) Leaf color indices of P. qiui. (c) Flower phenotypes of P. qiui. (d) Flower color indices of P. qiui. LS1: emergence stage; LS2: sprouting stage; LS3: petiole visibility; LS4: petiole spreading; LS5: leaves unfolding; LS6: wind bell bud; LS7:petal coloring; LS8: full bloom stage. FS1: slightly pigmented soft bud; FS2: initially opened flower; FS3: half opened flower; FS4: fully opened flower; FS5: Decaying flowers. L* represents the brightness; a* and b* represent the redness and yellowness, respectively; C* represents chroma; h represents the hue angle.
Leaf and petal color measurement
-
The colors of fresh leaves and petals were initially classified according to the Royal Horticultural Society Color Chart (RHSCC), and then the color correlation values (L*, a*, and b*) were determined using a tristimulus color meter (CR-400, Konica Minolta, Osaka, Japan). L* denotes the luminance (0 = black, 100 = white), a* indicates red (positive)/green (negative) coordinates, and b* indicates yellow (positive)/blue (negative) coordinates. A total of eight periods of leaf and five periods of petal color were measured, and each measurement was repeated three times. Chroma (C*) and hue angle (h) were calculated by the equations:
C*2=(a*2+ b*2)1/2 h=tan(b*/a*) Cellular pH determination
-
Leaves and petals were harvested and selected for analysis. A total of 0.5 g of each was taken and combined with 2 mL water (without quartz sand) to create a homogenate, and the pH value of the homogenate measured with a functional Pen pH meter (PH5, Shanghai Sanxin Instrument Factory, China), and the procedure repeated three times for each species, and the average value taken[29].
Determination of total anthocyanin, chlorophyll, anthoxanthin, and carotenoid contents
-
The total anthocyanin concentration was determined according to the method described previously[30,31]. Twenty mg leaf or petal samples were ground in liquid nitrogen, anthocyanins were extracted with 1% HCL methanol solution for 24 h at 4 °C, mixtures centrifuged at 10,000 rpm for 10 min, and supernatants collected. The absorbance of the supernatant was measured at 530 and 657 nm using a spectrophotometer. The relative anthocyanin content was calculated using the formula
(A530nm − 0.33 × A657nm)/mg The extraction of anthoxanthin was carried out in the same way using a methanol solution. The relative anthoxanthin content was calculated using the formula
(A350nm − A650nm)/mg Chlorophylls and carotenoids were extracted as follows, weigh 20 mg of sample, add 1 mL of 80 % acetone solution, and store at 4 °C overnight. Centrifuge at 10,000 rpm for 10 min and collect the supernatant. The absorbance of the supernatant was measured at 645, 663, and 480 nm by a spectrophotometer. The formula is as follows:
Chlorophyll a (μg⋅mL−1)=12.7×A663nm−2.69×A645nm Chlorophyll b (μg⋅mL−1)=22.9×A645nm−2.69×A663nm Total Chlorophyll content (μg⋅mL−1)=Chlorophyll a+Chlorophyll b Carotenoid content(μg⋅mL−1)=A480nm+0.14×A663nm−0.638×A645nm Measurement of composition and content of anthocyanidin
-
Anthocyanidin composition and content were detected using a previously reported high-performance liquid chromatography (HPLC) method[32]. Frozen leaf and petal samples were promptly ground to a powder in liquid nitrogen. Approximately 20 mg leaf or petal powder was dissolved in 1 mL of methanol-hydrochloric acid solution (99:1, v/v), allowed to stand in the dark at 4 °C for 24 h, centrifuged at 10,000 rpm for 10 min, and the supernatant filtered through a 0.22 μm membrane. The pure supernatant was quantified by HPLC (LC-2030C 3D, Shimadzu, Kyoto, Japan) equipped with an L-2455 diode array detector at 200−700 nm, a ShimNex CS C18 column (250 nm × 4.6 mm, 5 μm), a column temperature of 40 °C, an injection volume of 10 μL, and a flow rate of 0.5 mL·min−1. The parameters of mobile phase A were: 0.04% formic acid aqueous solution, B: acetonitrile (chromatographic grade). Gradient elution was used, and the elution program was 1−40 min, 5%−40% B; 40−45 min, 40%−100% B; 45−60 min, 100% B; 60−70 min, 100%−5% B, and 70−80 min, 5% B. Anthocyanin glycoside standards Cy3G, Cy3G5G, Pg3G, Pg3G5G, Pn3G, and Pn3G5G were purchased from Shanghai Yuanye Technology Co. Ltd. (Shanghai, China). The standard curve was plotted and the mass fraction of each anthocyanidin was calculated.
Total RNA extraction and quantitative real-time polymerase chain reaction
-
Total RNA was isolated from the different leaf and petal stages of P. qiui using the TIANGEN RNA Prep Pure Plant kit (Tiangen Biotech Co., Ltd., Beijing, China). According to the manufacturer's instructions of the PrimeScript® RT reagent Kit (DRR047A, Takara, Japan), 1 μg DNA-free RNA sample was used to synthesize cDNA.
qRT-PCR was performed using SYBR®Premix Ex Taq™ II (DRR041A, Takara, Japan) with 18SITS-RNA as an internal control[33]. According to the transcriptome sequencing database (SRA Accession No. SRP123262) of P. qiui from our group, quantitative primers were designed for anthocyanin biosynthesis structural genes, PqCHS, PqCHI, PqF3H, PqF3'H, PqDFR, PqANS, and PqUFGT, as well as TF genes PqMYB113[34] and PqMYB4[30]. Primer sequences for qRT-PCR are listed in Supplementary Table S1.
Statistical analysis
-
All data are presented as the mean ± standard deviation across three samples. The significance of inter-sample differences was evaluated via a variance analysis (ANOVA). Moreover, the mean values were compared using Duncan's multiple test, with a 95% confidence level (p < 0.05). A linear correlation analysis was conducted using the Pearson's method to assess the relationship between variables. The above analysis was done using SPSS (Version 26).
-
To characterize the color development of leaves and petals of P. qiui, eight developmental stages of leaves and five developmental stages of petals were sampled separately (Fig. 1a, c). The leaf color indices of P. qiui were measured at LS1−LS8 (Fig. 1b), the petal color indices were measured at FS1-FS5 (Fig. 1d). The qualitative description of leaf and petal color of P. qiui in different periods was carried out by RHSCC (Supplementary Table S2).
In leaves of P. qiui, the L* (brightness) value was relatively low at LS5 and highest at LS1; the a* (redness) value showed a tendency of increasing and then decreasing, and it was relatively high at LS3 and lowest at LS8; the C* (chroma) and b* (yellowness) value showed a tendency of decreasing and then increasing, and it was relatively low at LS5 and highest at LS8; h (hue angle) decreased from LS1 to LS4, followed by a increase at LS5 and LS8. The results were basically consistent with those of the leaf phenotypes.
The L* value of petals increased gradually from FS2 to FS5, indicating the elevation of petal color brightness. Consistent with the flower color, the C* and a* value showed a tendency of increasing and then decreasing, which was relatively high at FS3 and lowest at FS5; the b* value showed a tendency of decreasing and then increasing, which was relatively high at and lowest at FS3; h increased from FS1 to FS2, slightly decreased from FS2 to FS4, and sharply decreased with the aging of flowers at FS5.
Cellular pH determination of leaves and petals of P. qiui at different periods
-
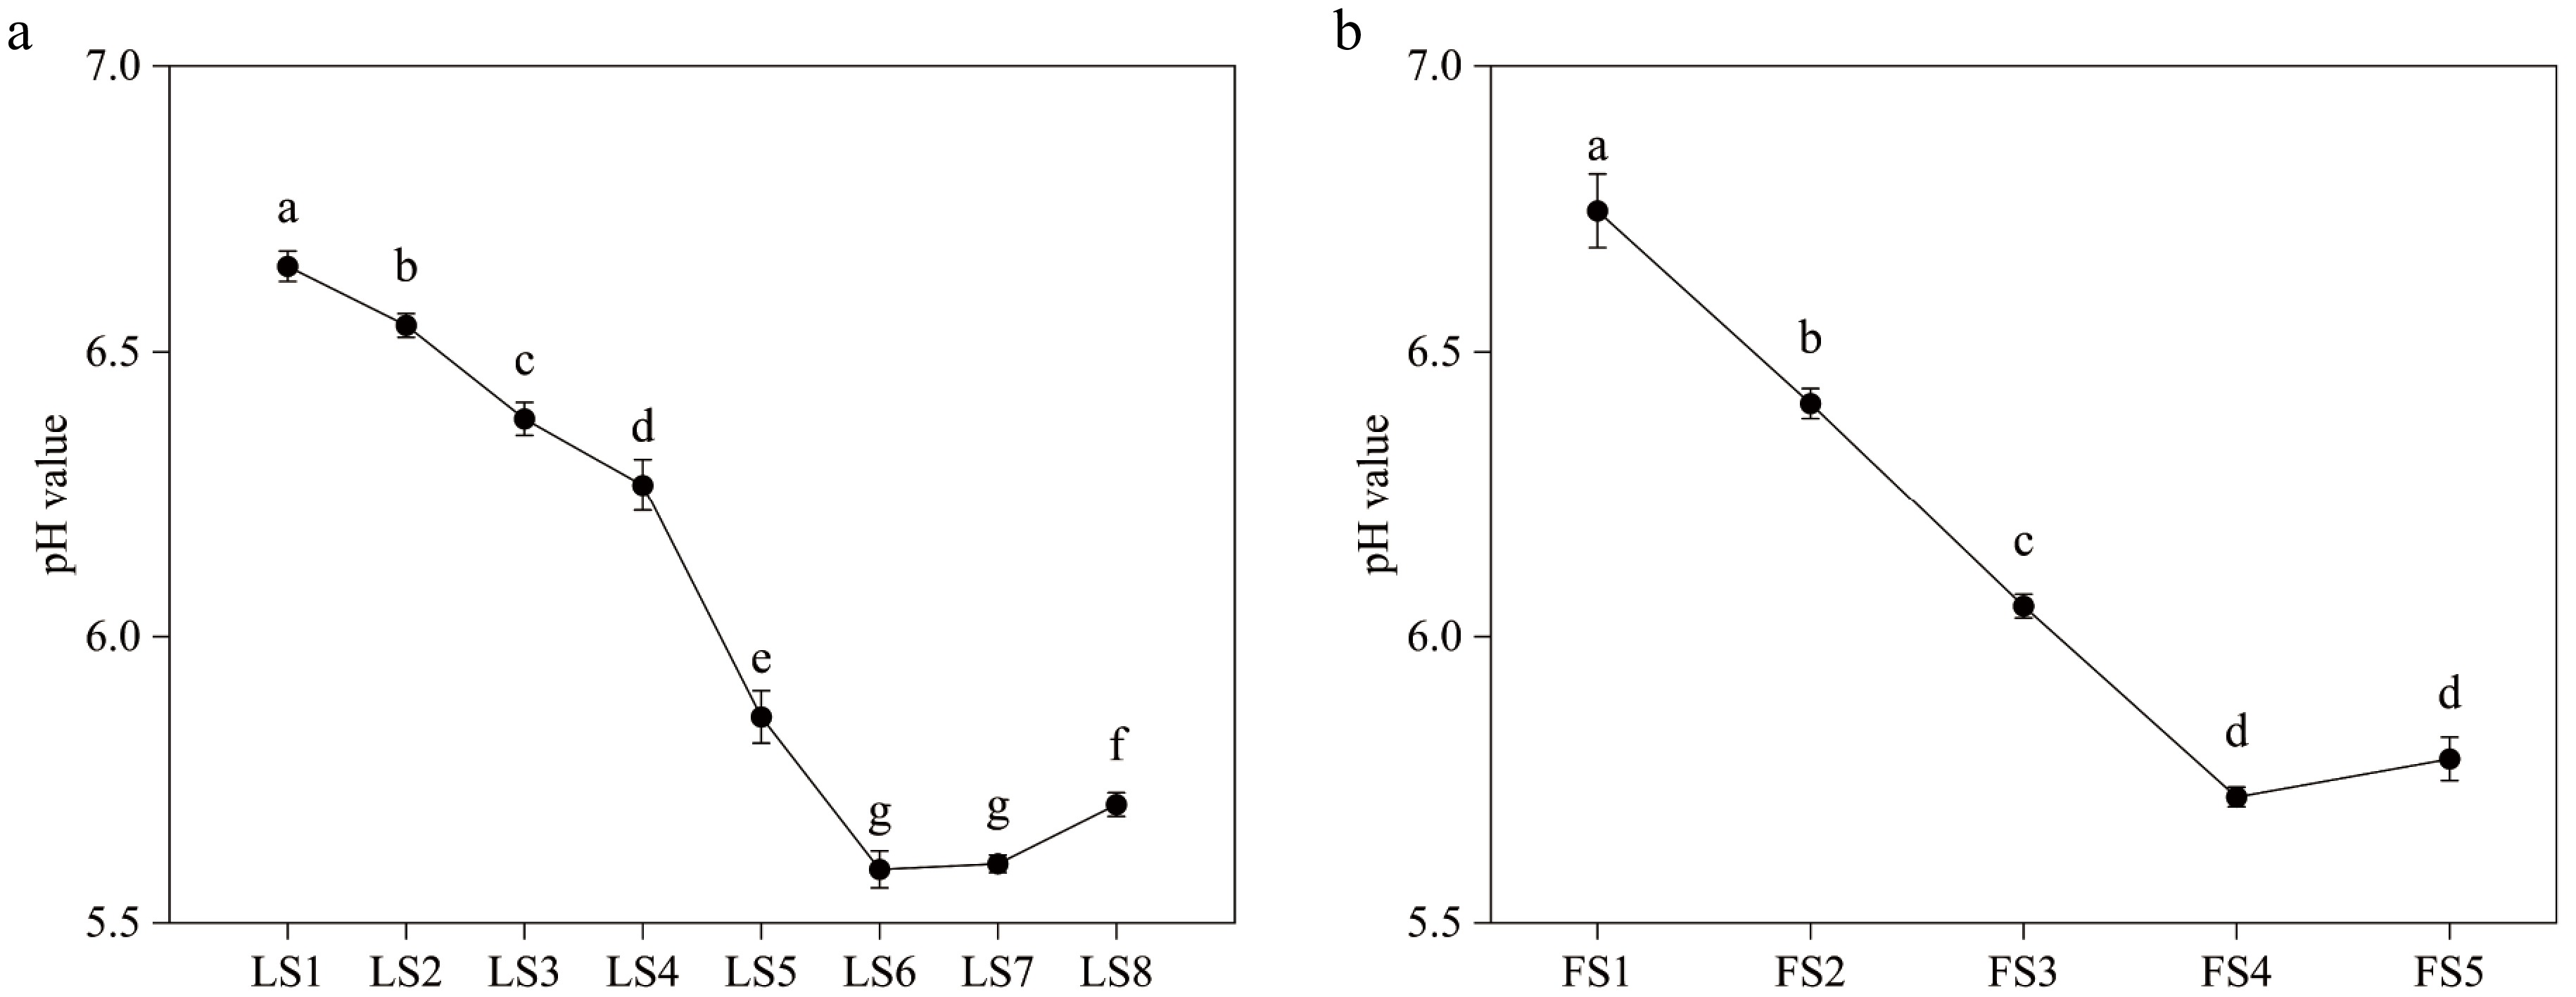
The cellular pH values of leaves and petals at different developmental periods were weakly acidic (Fig. 2). The pH value of leaf cell fluid was highest at 6.63−6.68 during the LS1 period, and continued to decrease from LS1 to LS6, with a minimum of 5.57−5.63 at FS6, after which it slightly increased. Similarly, the pH of the petal cell fluid was highest at FS1 at 6.7−6.82, and it decreased from FS1 to FS4, with the lowest at FS4 at 5.7−5.73, then the pH value increased with petal senescence.
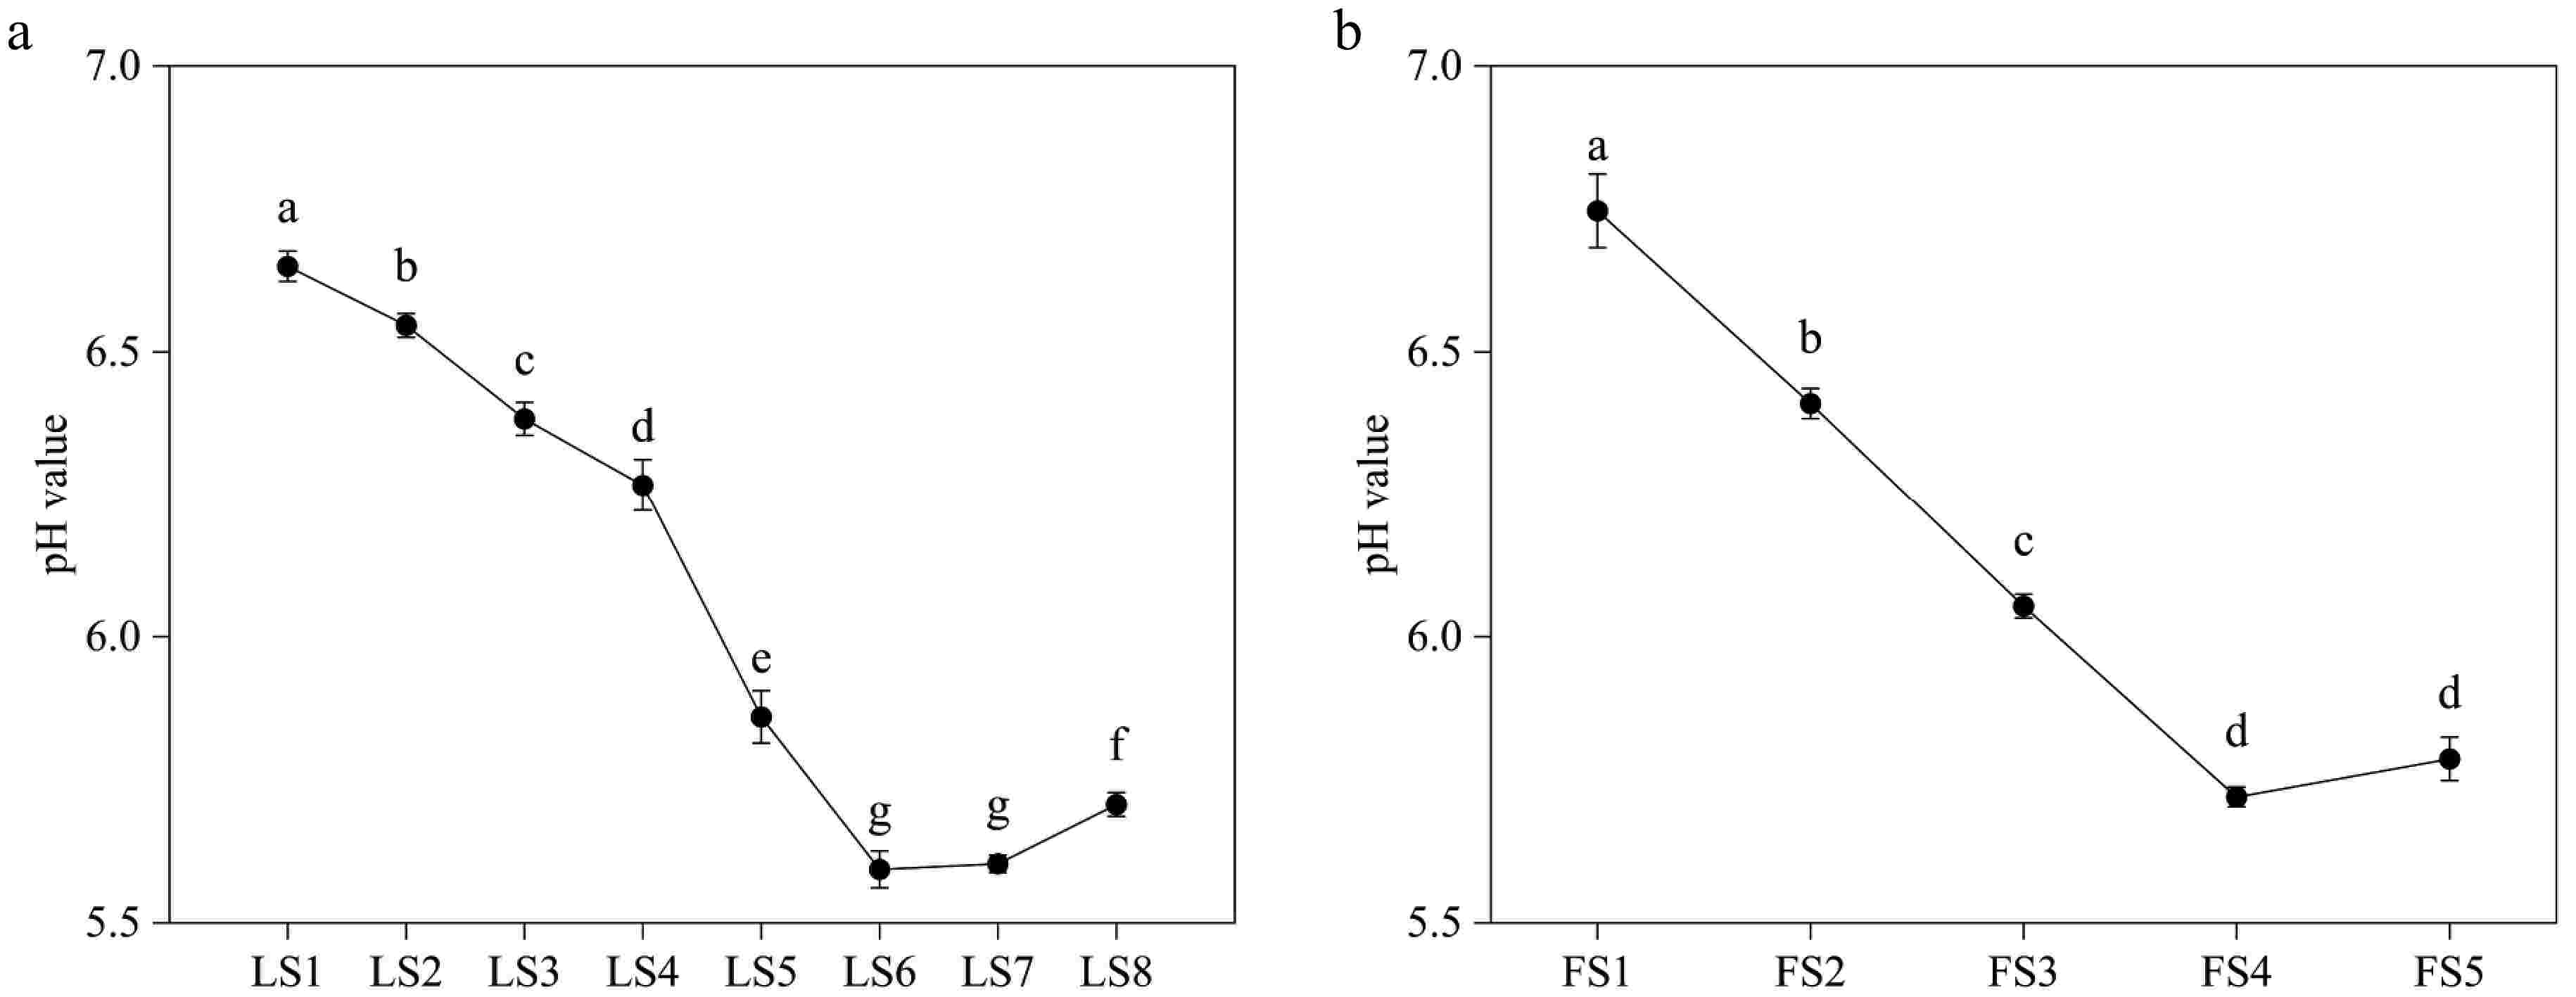
Figure 2.
Variations of pH value of leaves and petals of P. qiui at different periods. (a) Variations of pH value of P. qiui leaves at eight periods. (b) Variations of pH value of P. qiui petals at five periods. Different lowercase letters indicate significant differences at the p < 0.05 level by Duncan's test.
Contents of four types of pigments in leaves of P. qiui at eight developmental stages
-
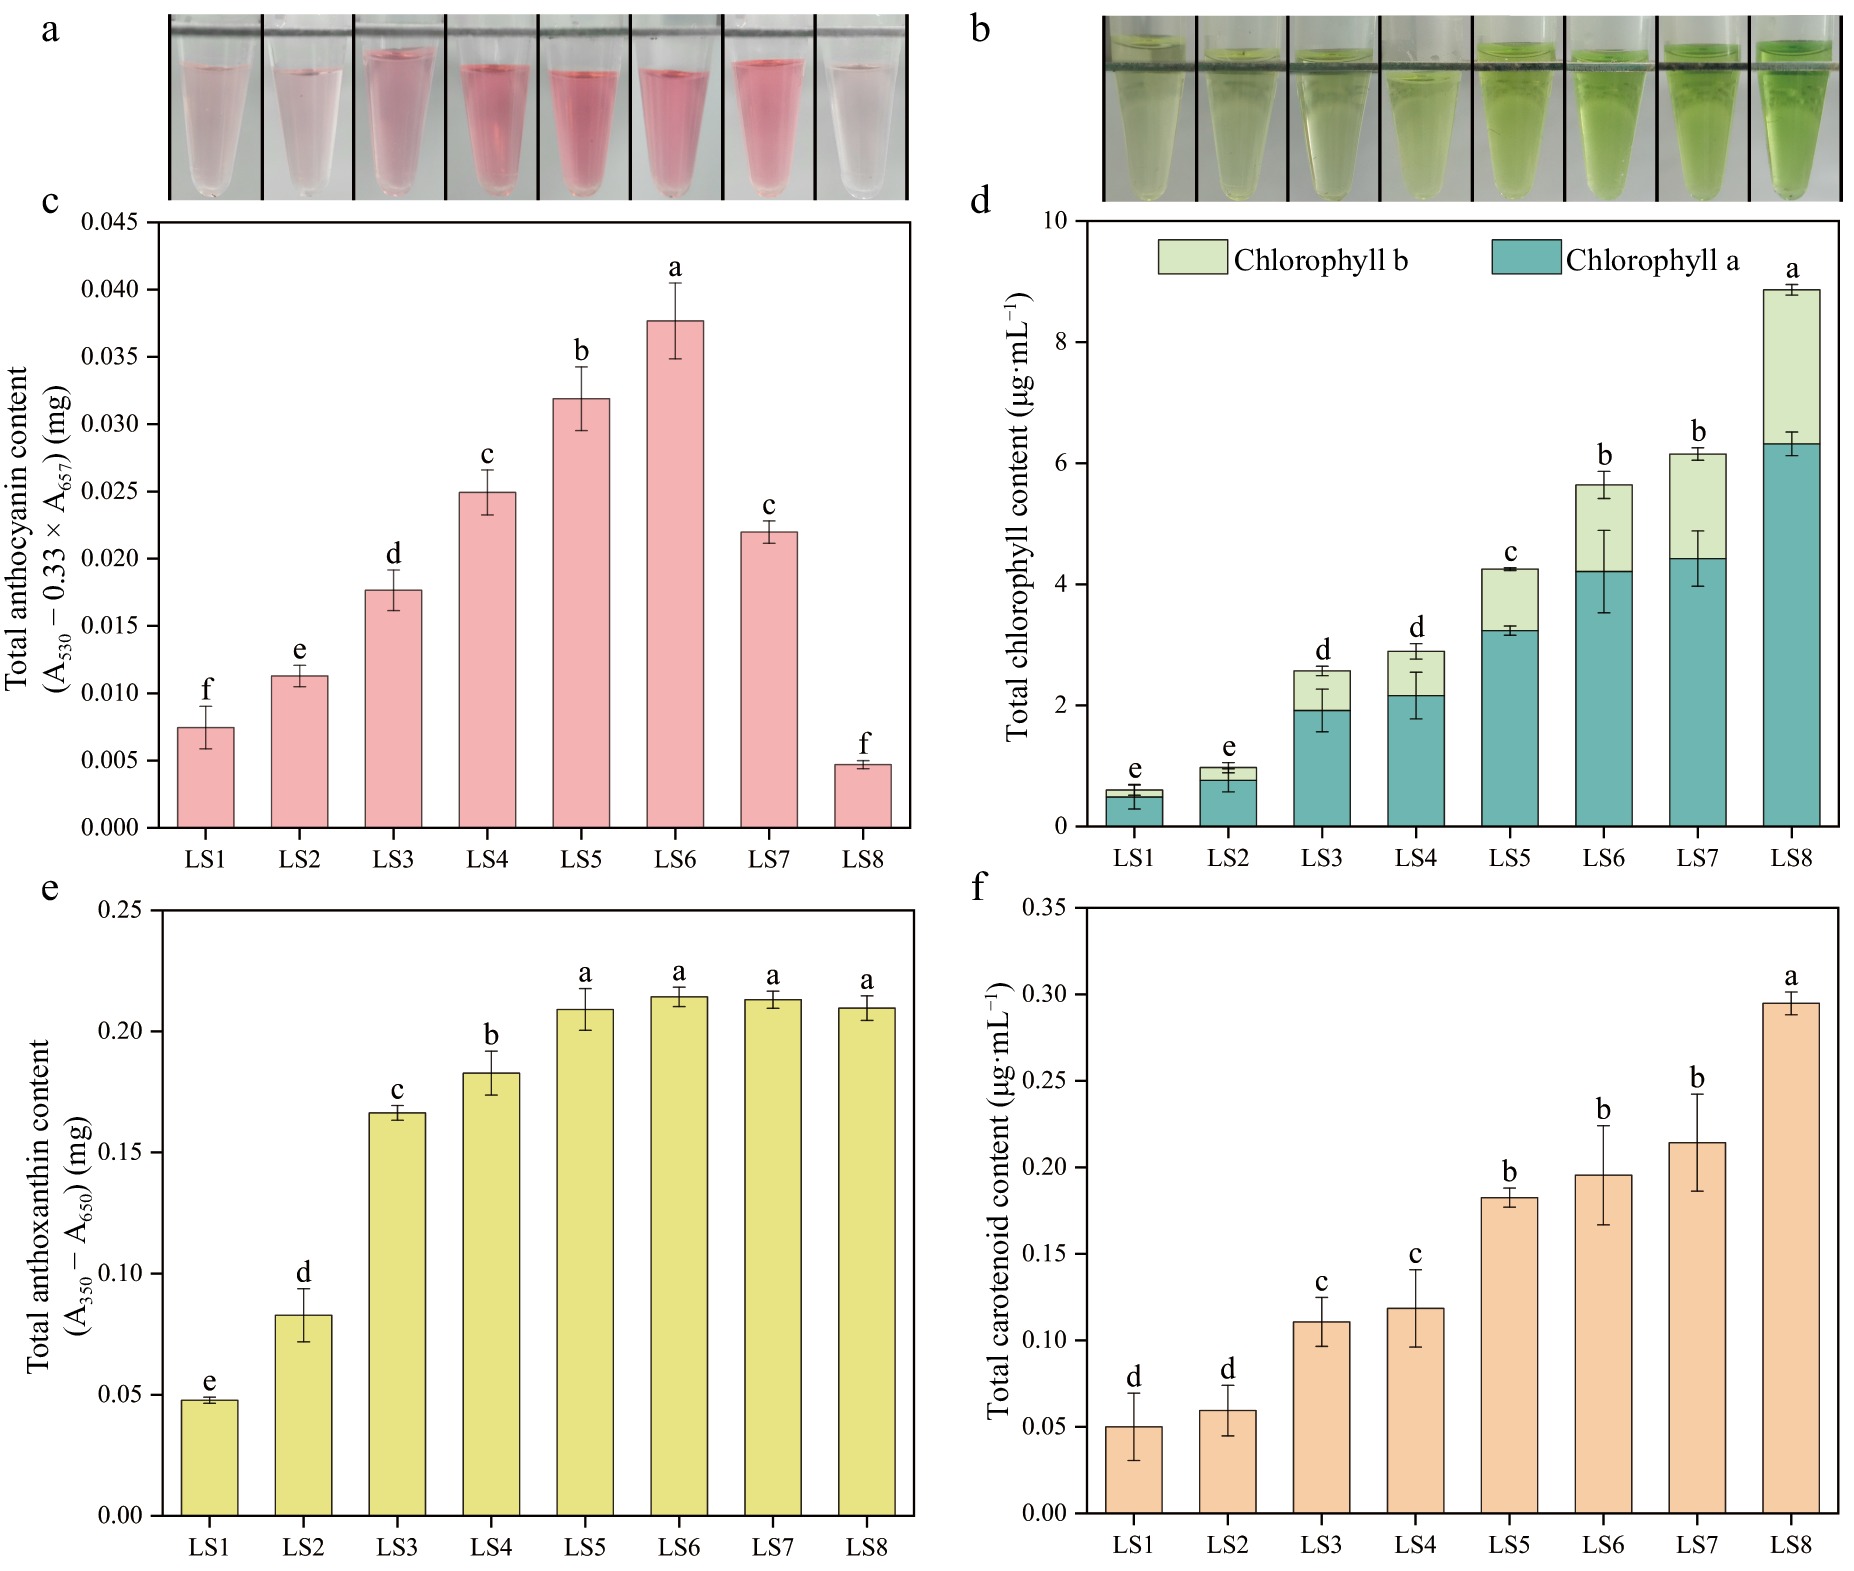
Through the determination of anthocyanin, chlorophyll, anthoxanthin, and carotenoid content of leaves of P. qiui in eight periods (Fig. 3), it was found that the content of leaf anthocyanin showed a trend of rising and then decreasing, it gradually rose from LS1 to LS6, and reached the highest at LS6, and then dropped dramatically at LS7 and LS8, which was consistent with the color change of the anthocyanin extraction solution. The chlorophyll content showed a continuous rising trend, with the highest at LS8, which was consistent with the color change of the chlorophyll extract. The anthoxanthin content continued to rise from LS1 to LS5 and was the same from LS5 to LS8. Consistent with trends in chlorophyll content, the carotenoids of the leaves also showed a continuous rising trend. The anthocyanin content was consistent with the phenotypic trend of red color deepening and fading during the eight periods of leaf development, thus indicating that anthocyanin was the key pigment determining the red color of young leaves of P. qiui.
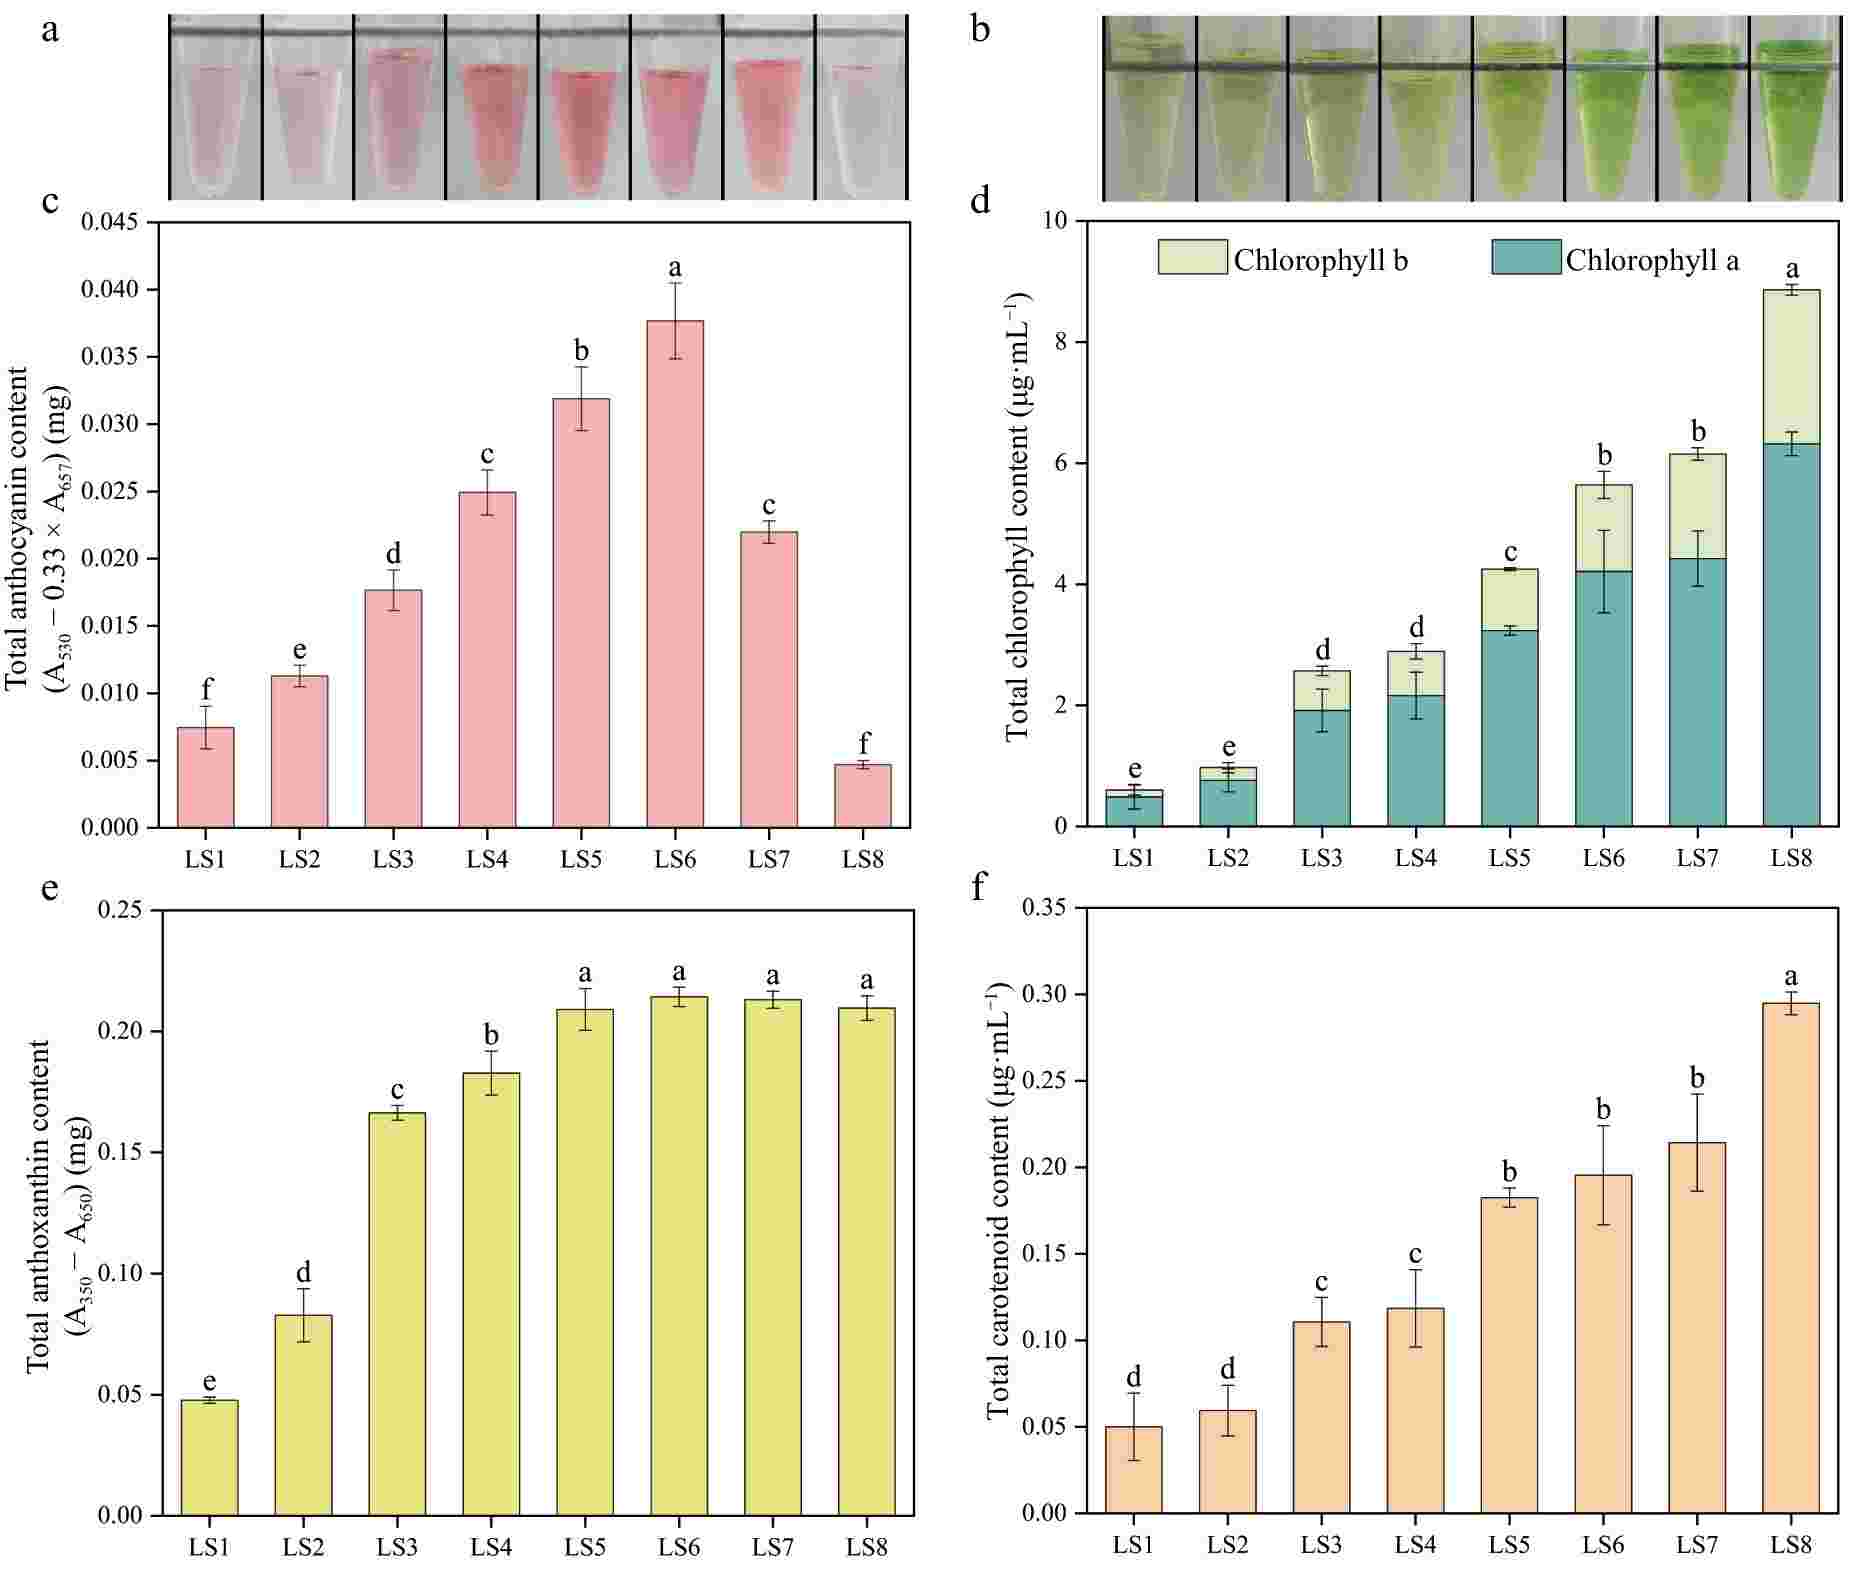
Figure 3.
Pigment contents of leaves at eight developmental stages of P. qiui. (a) Extracts of anthocyanin from leaves at eight stages. (b) Extracts of chlorophyll from leaves at eight stages. (c) Anthocyanin content of leaves at eight stages. (d) Chlorophyll content of leaves at eight stages. (e) Anthoxanthin content of leaves at eight stages. (f) Carotenoid content of leaves at eight stages. Different lowercase letters indicate significant differences at the p < 0.05 level by Duncan's test.
Contents of four types of pigments in petals of P. qiui at five developmental stages
-
Through the determination of various types of pigment contents of petals in five periods of P. qiui (Fig. 4), it was found that the anthocyanin content of petals continued to rise from FS1 to FS3, and no longer increased at FS4, and then decreased dramatically at FS5, which was consistent with the change of color of anthocyanin extract. The chlorophyll and carotenoid had the same trend of change, with a gradual decrease from FS1 to FS3, followed by a slow increase, both relatively low at FS3 and highest at FS1. The content of anthoxanthin showed the trend of increasing and then decreasing, with FS3 being the highest and FS1 the lowest.
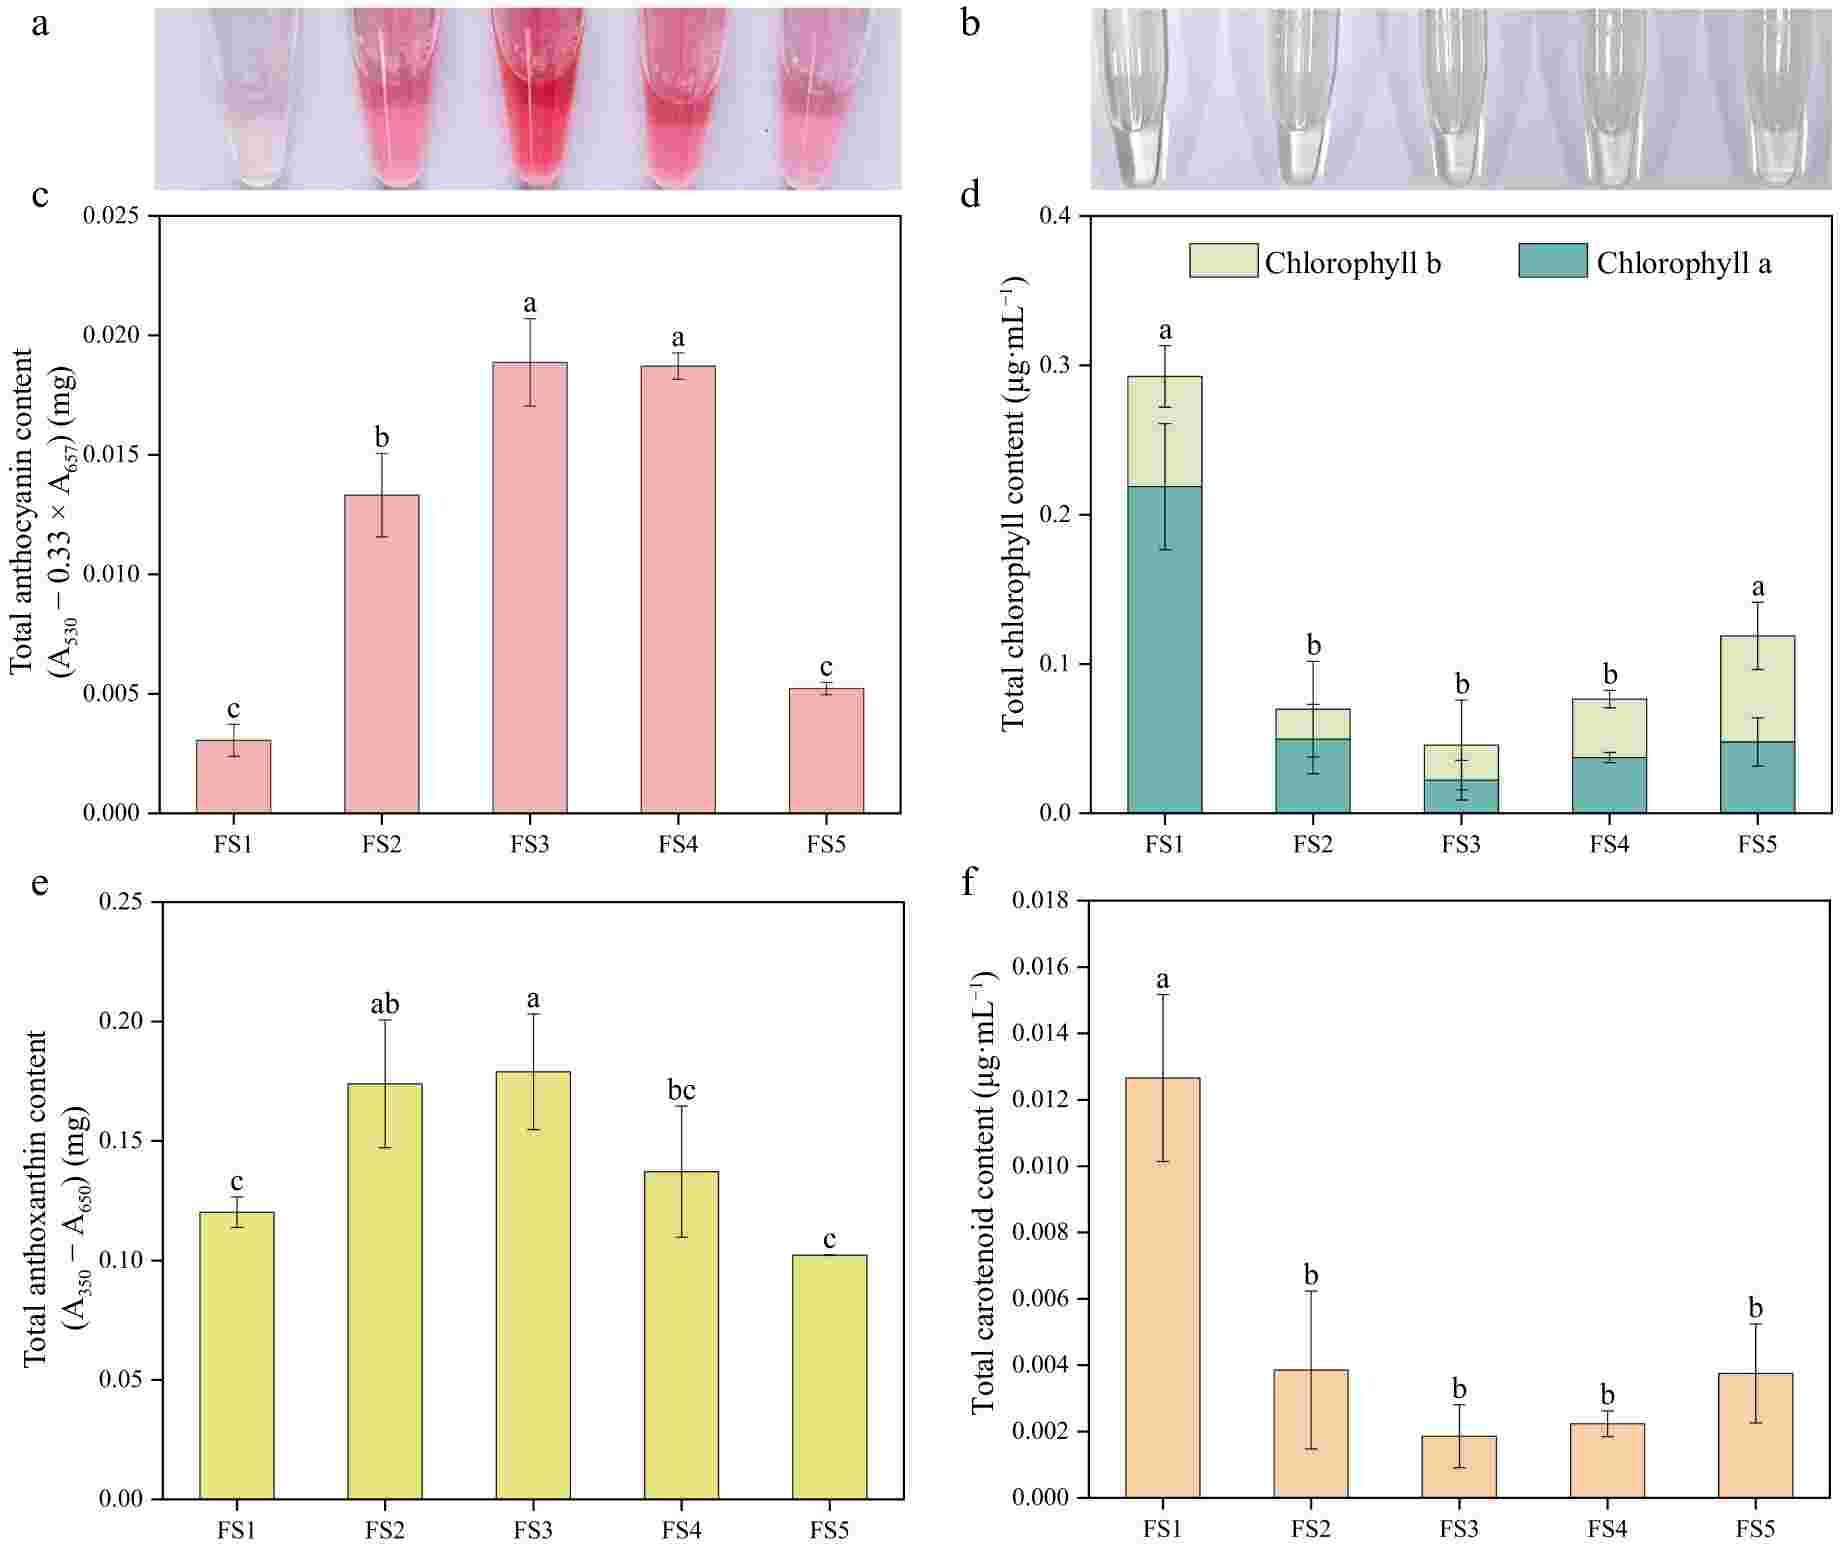
Figure 4.
Pigment contents of petals at five developmental stages of P. qiui. (a) Extracts of anthocyanin from flowers at five stages. (b) Extracts of chlorophyll from flowers at five stages. (c) Anthocyanin content of petals at five stages. (d) Chlorophyll content of petals at five stages. (e) Anthoxanthin content of petals at five stages. (f) Carotenoid content of petals at five stages. Different lowercase letters indicate significant differences at the p < 0.05 level by Duncan's test.
Correlation analysis of leaf and petal color index, cellular pH value, and pigment content
-
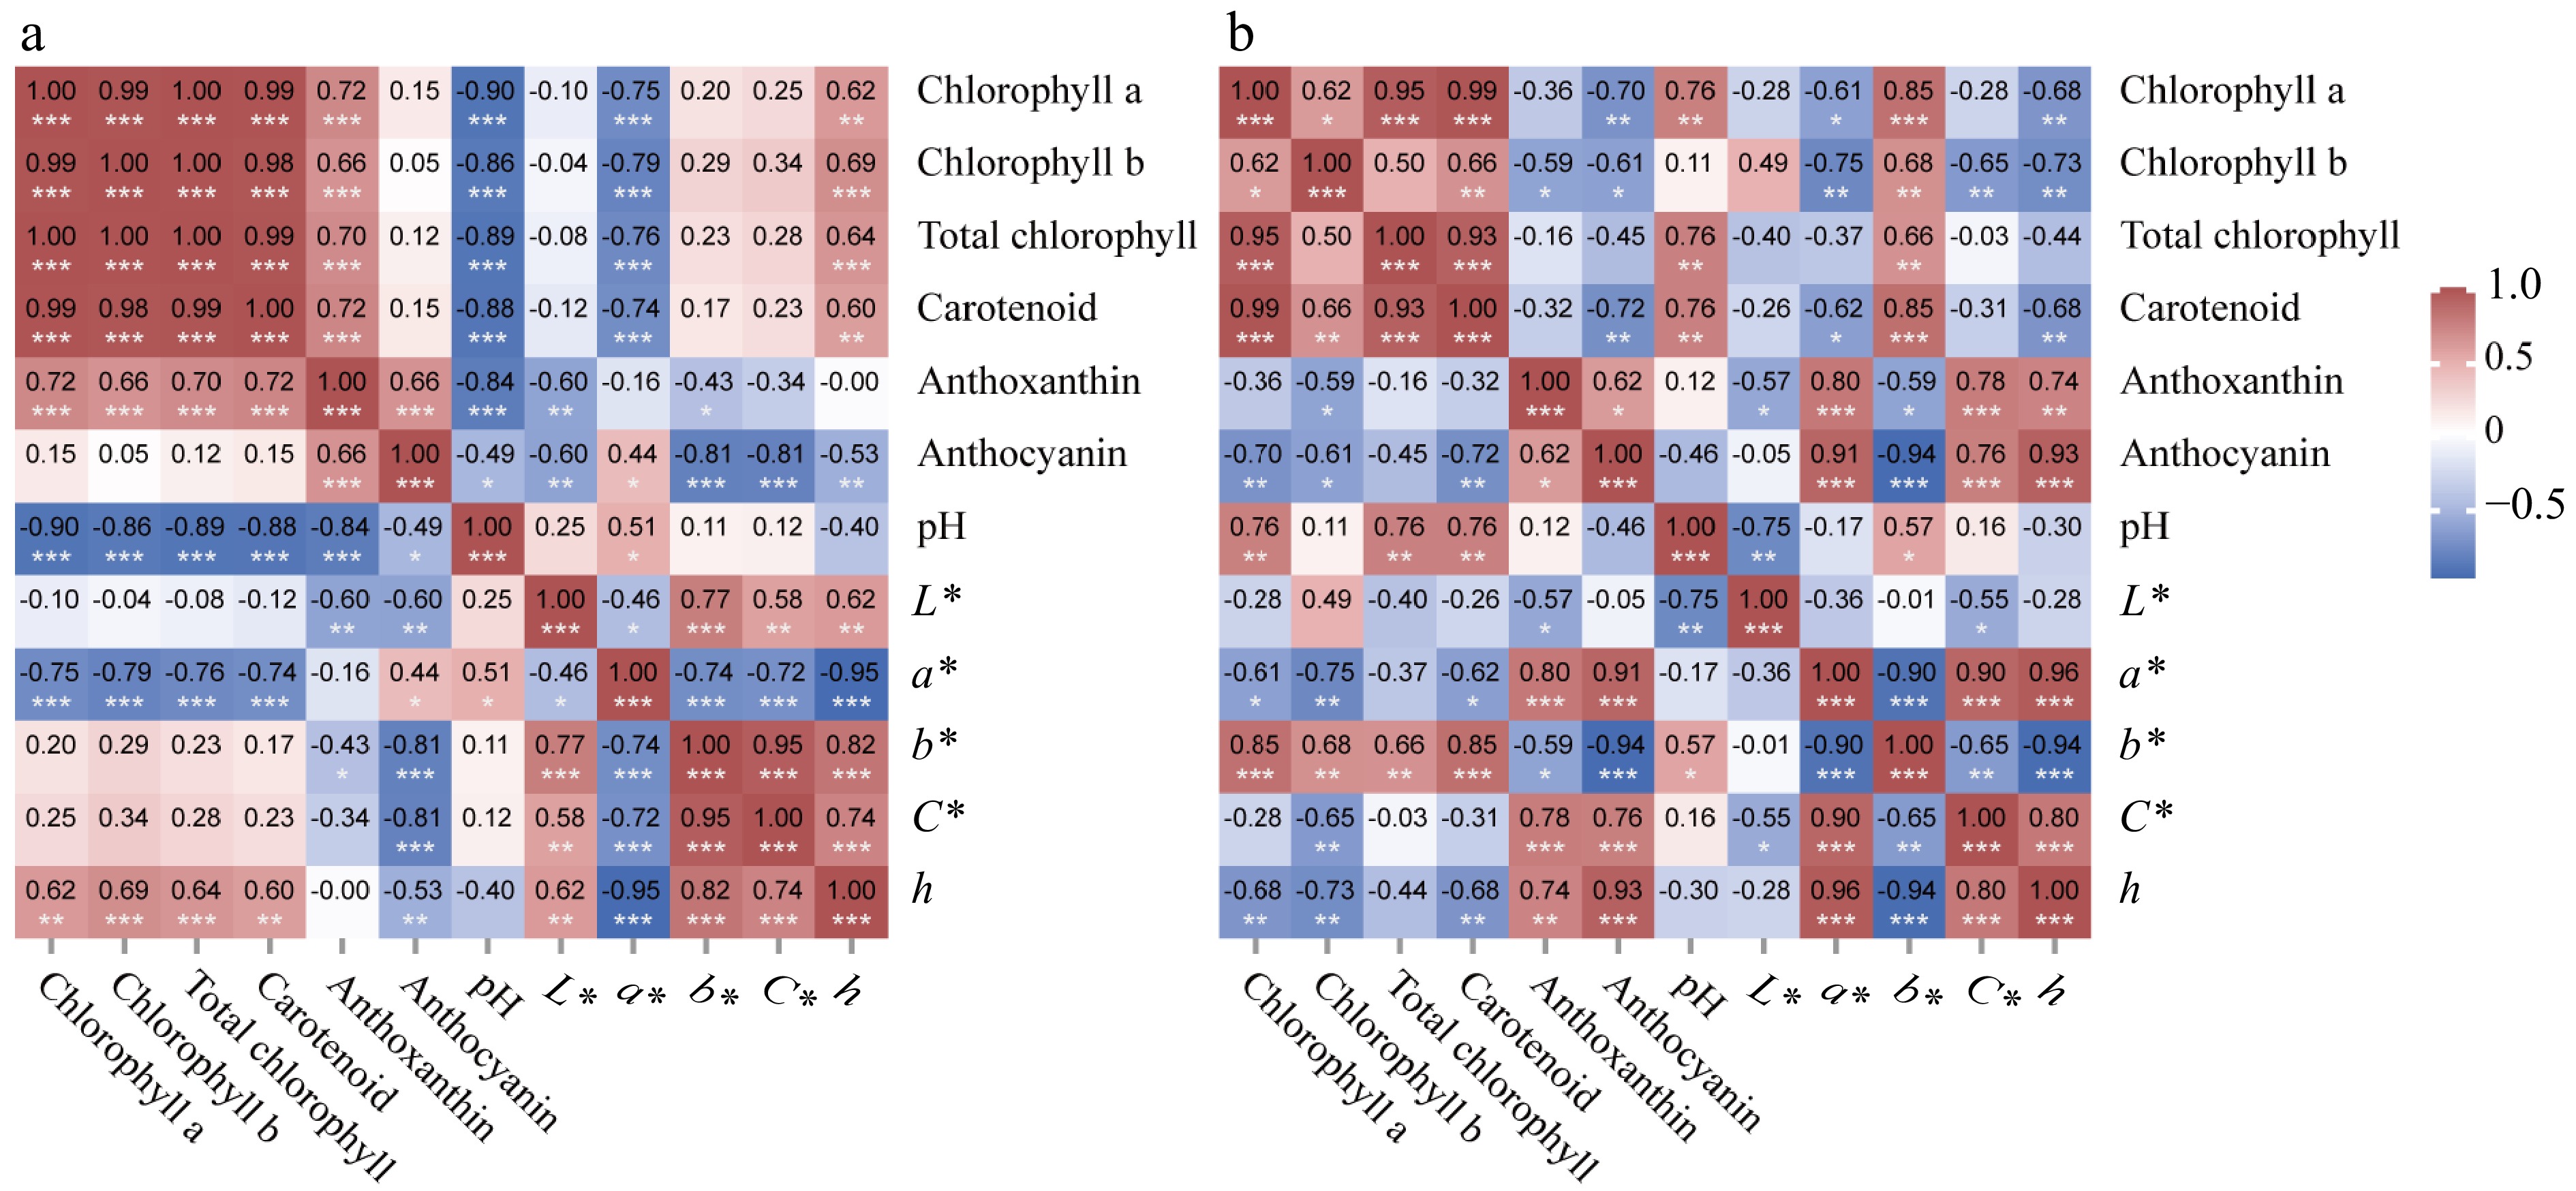
The correlation analysis of the color of leaves and petals and the influencing factors was carried out. The results showed that anthocyanin in leaves were significantly correlated with each color index, and anthocyanin content was positively correlated with the a* value and negatively correlated with L*, b*, C*, and h values. Chlorophyll and carotenoid were negatively correlated with a* value and positively correlated with h, while anthoxanthin was negatively correlated with L* and b* values. The pH of leaf cells was positively correlated with the a* value with a correlation coefficient of 0.51, there was no correlation with other color indices, and the pH value was negatively correlated with the content of all four pigments (Fig. 5a).
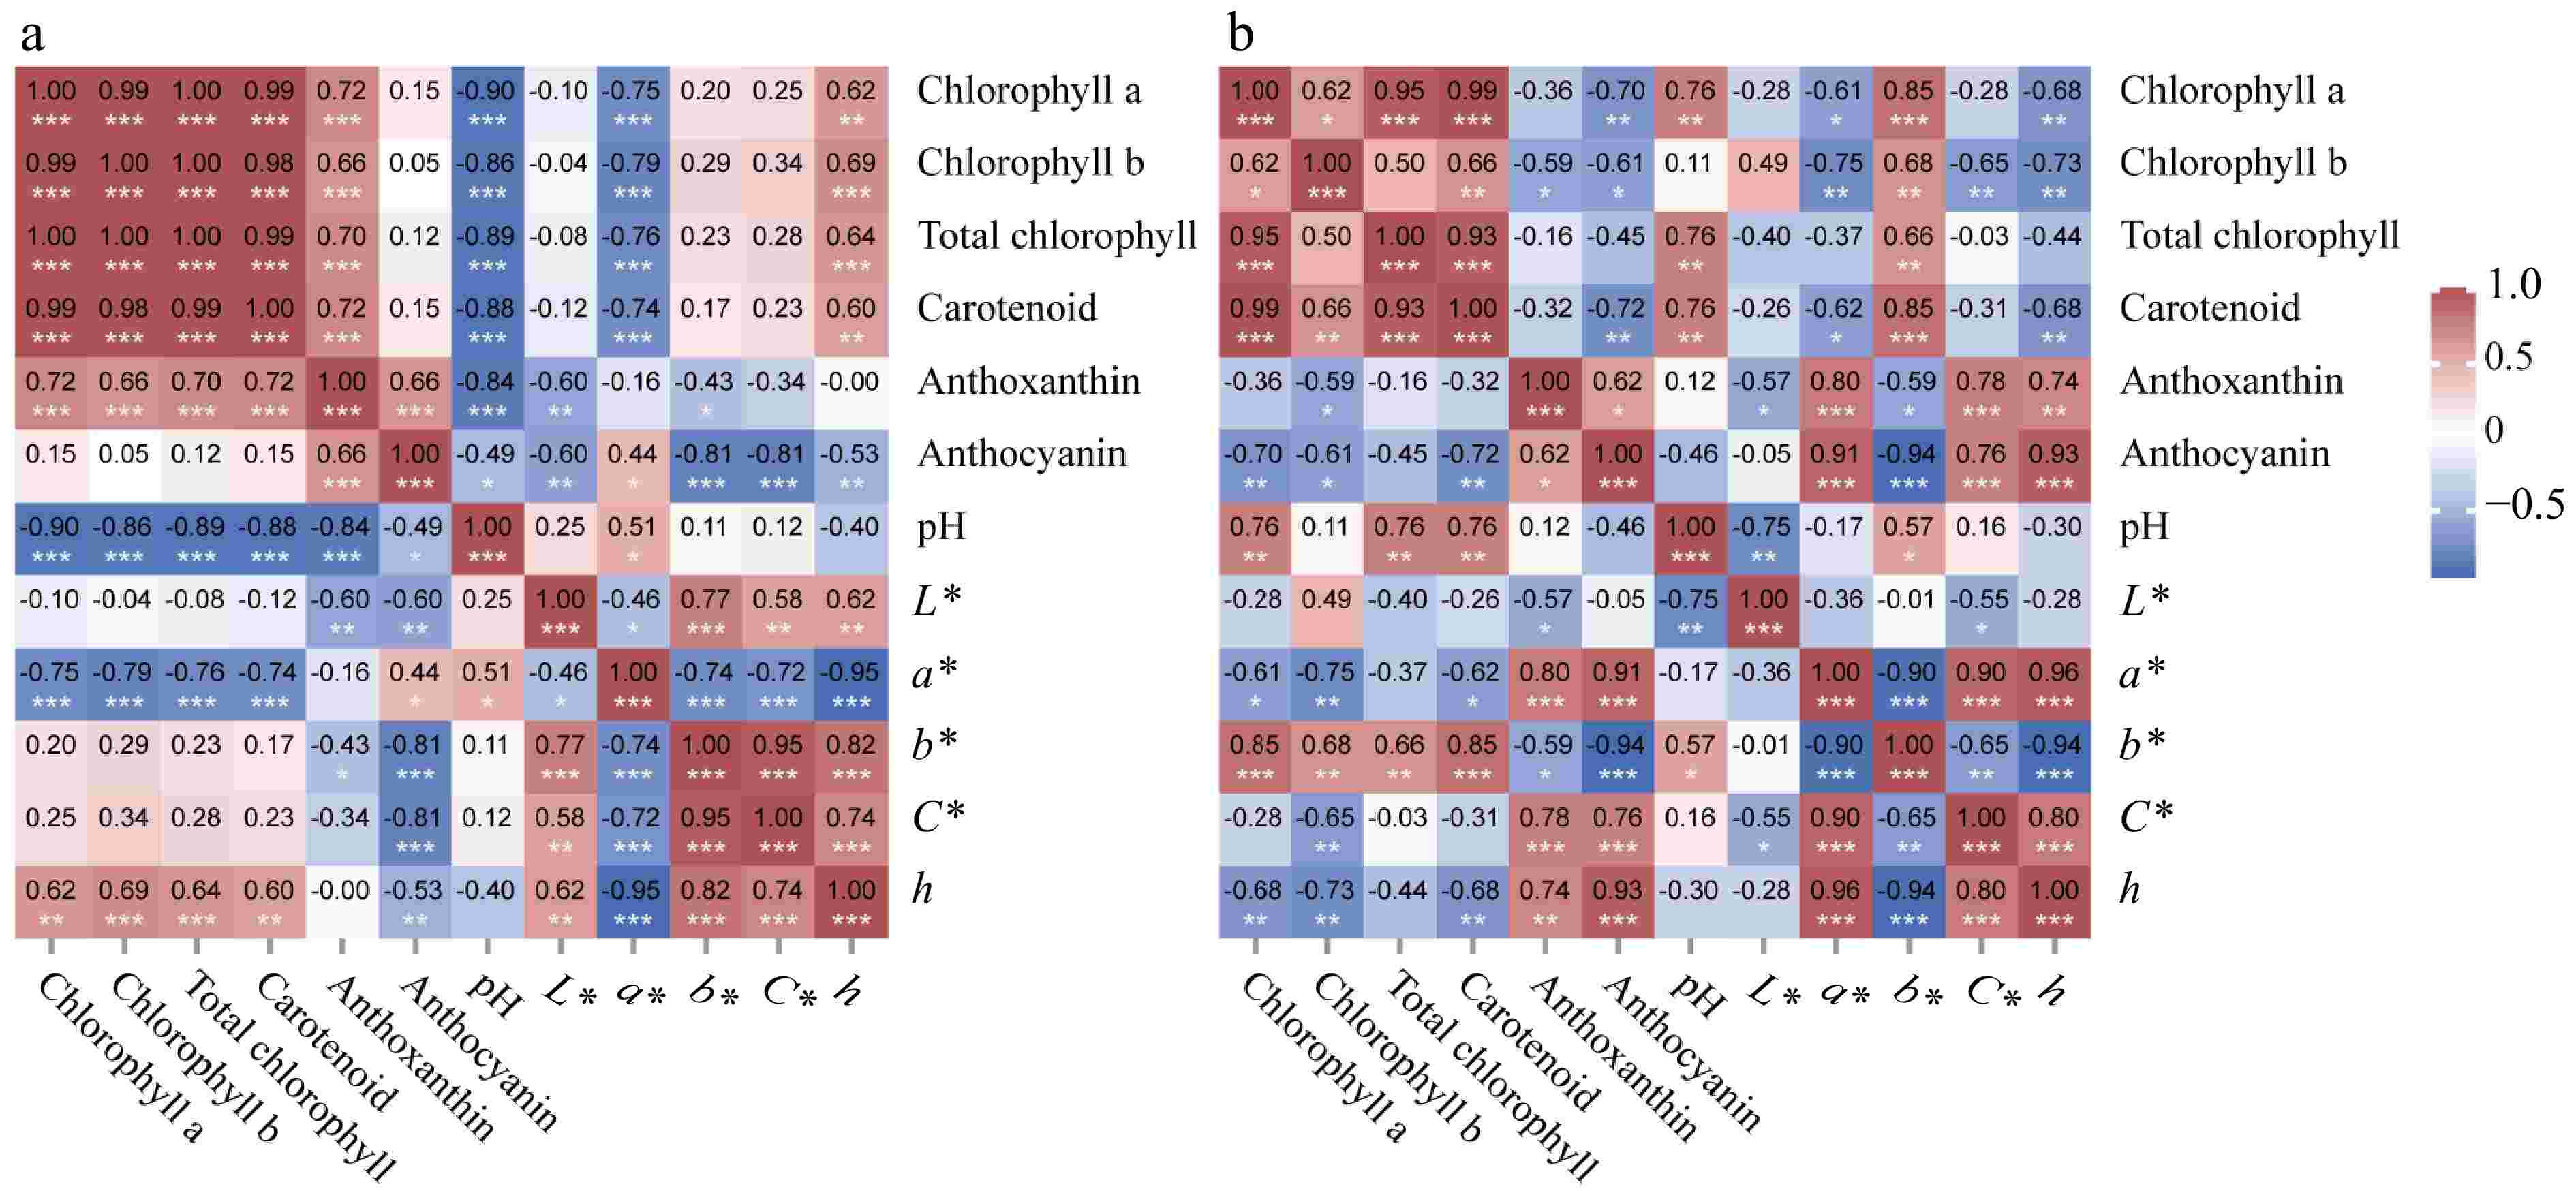
Figure 5.
Heat map of the correlation of leaf and petal color index, cellular pH value, and pigment content. (a) Heat map of the correlation of leaf color index, cellular pH value, and pigment content. (b) Heat map of the correlation of petal color index, cellular pH value, and pigment content. * p < 0.05, ** p < 0.01, *** p < 0.001.
In petals of P. qiui, anthocyanin content was significantly correlated with all color indices except L* and was positively correlated with values of a*, b*, and C*, among which the correlation coefficients with a* and b* were all greater than 0.9, and was negatively correlated with b*. Similarly, anthoxanthin was positively correlated with the values of a*, b*, and C*, and the three correlation coefficients are all between 0.7 and 0.8; carotenoid was positively correlated with the values of b*, and negatively correlated with a* and h; total chlorophyll was only positively correlated with the b* value. Petal cell pH value was positively correlated with the b* value with a correlation coefficient of 0.57. In addition, pH was positively correlated only with chlorophyll and carotenoid, and had no correlation with anthocyanin and anthoxanthin (Fig. 5b). Among the four pigments, anthocyanins demonstrated the most significant correlation with the color index, exhibiting high correlation coefficients. Therefore, anthocyanin is crucial factors that affect the color change of leaves and petals during the development of P. qiui.
Composition and content of anthocyanidin at different periods leaves and petals
-
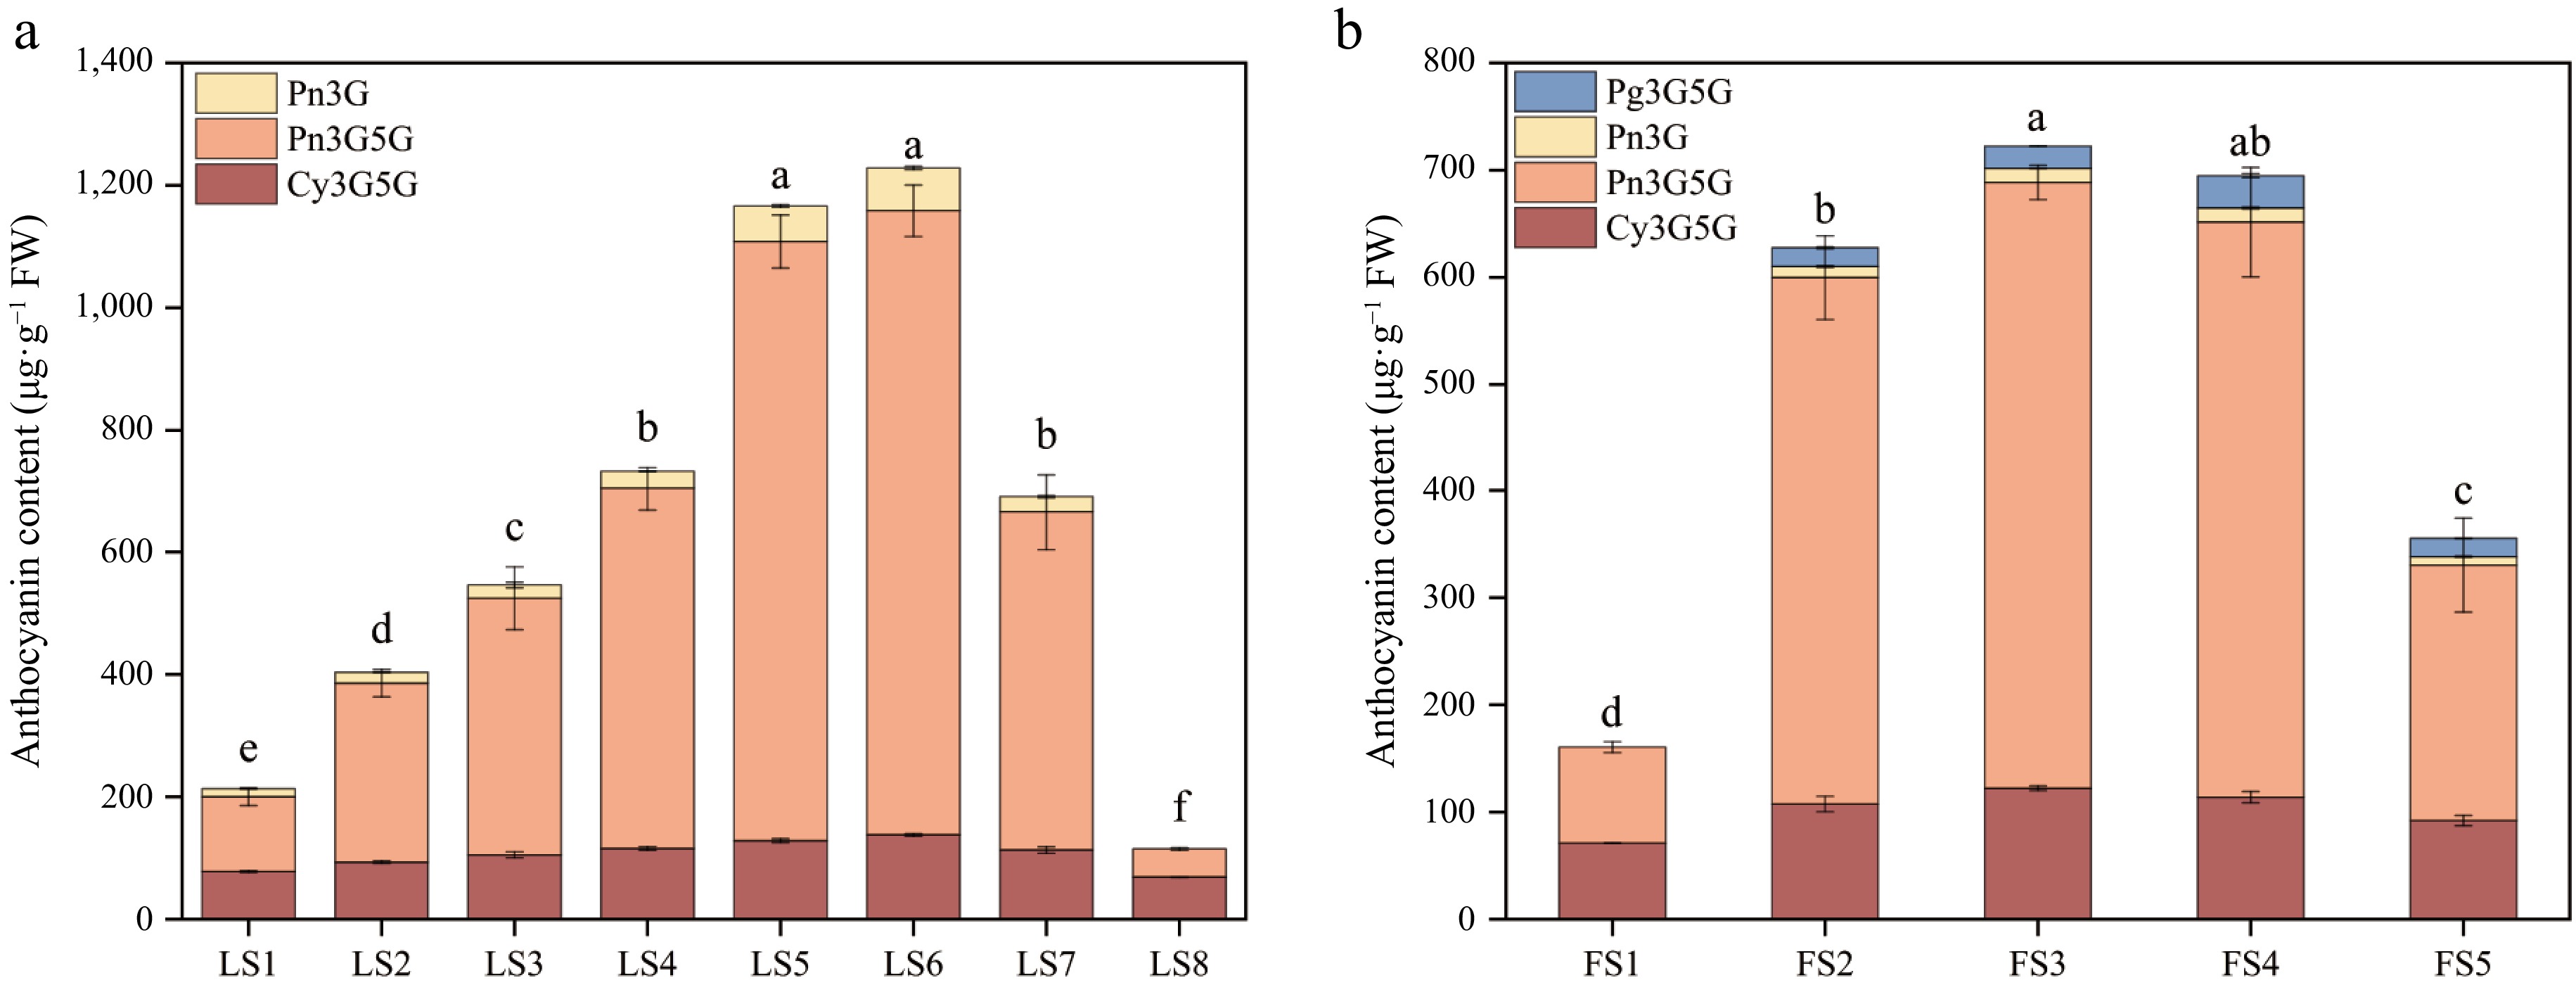
Determination of anthocyanidin components and contents in leaves and petals of P. qiui in different periods by HPLC chromatography revealed that there were three kinds of components in leaves, namely, Pn3G5G, Pn3G, and Cy3G5G, among which Pn3G5G is the most important component (Fig. 6a). In LS1, Pn3G5G accounted for 57% of the total anthocyanidin contents, Cy3G5G and Pn3G accounted for 37% and 6% respectively. Pn3G5G content accounted for 73%~85% of the total amount from LS2 to LS7, and the content first increased and then decreased, which was the determinant of the change of the total anthocyanidin content; Cy3G5G was less abundant, accounting for 11%~23% during the period of LS2 to LS7, and the content has little change in each period; Pn3G was the least abundant, accounting for 3%~6% from LS2 to LS7, and it was not detected at LS8 (Supplementary Table S3).
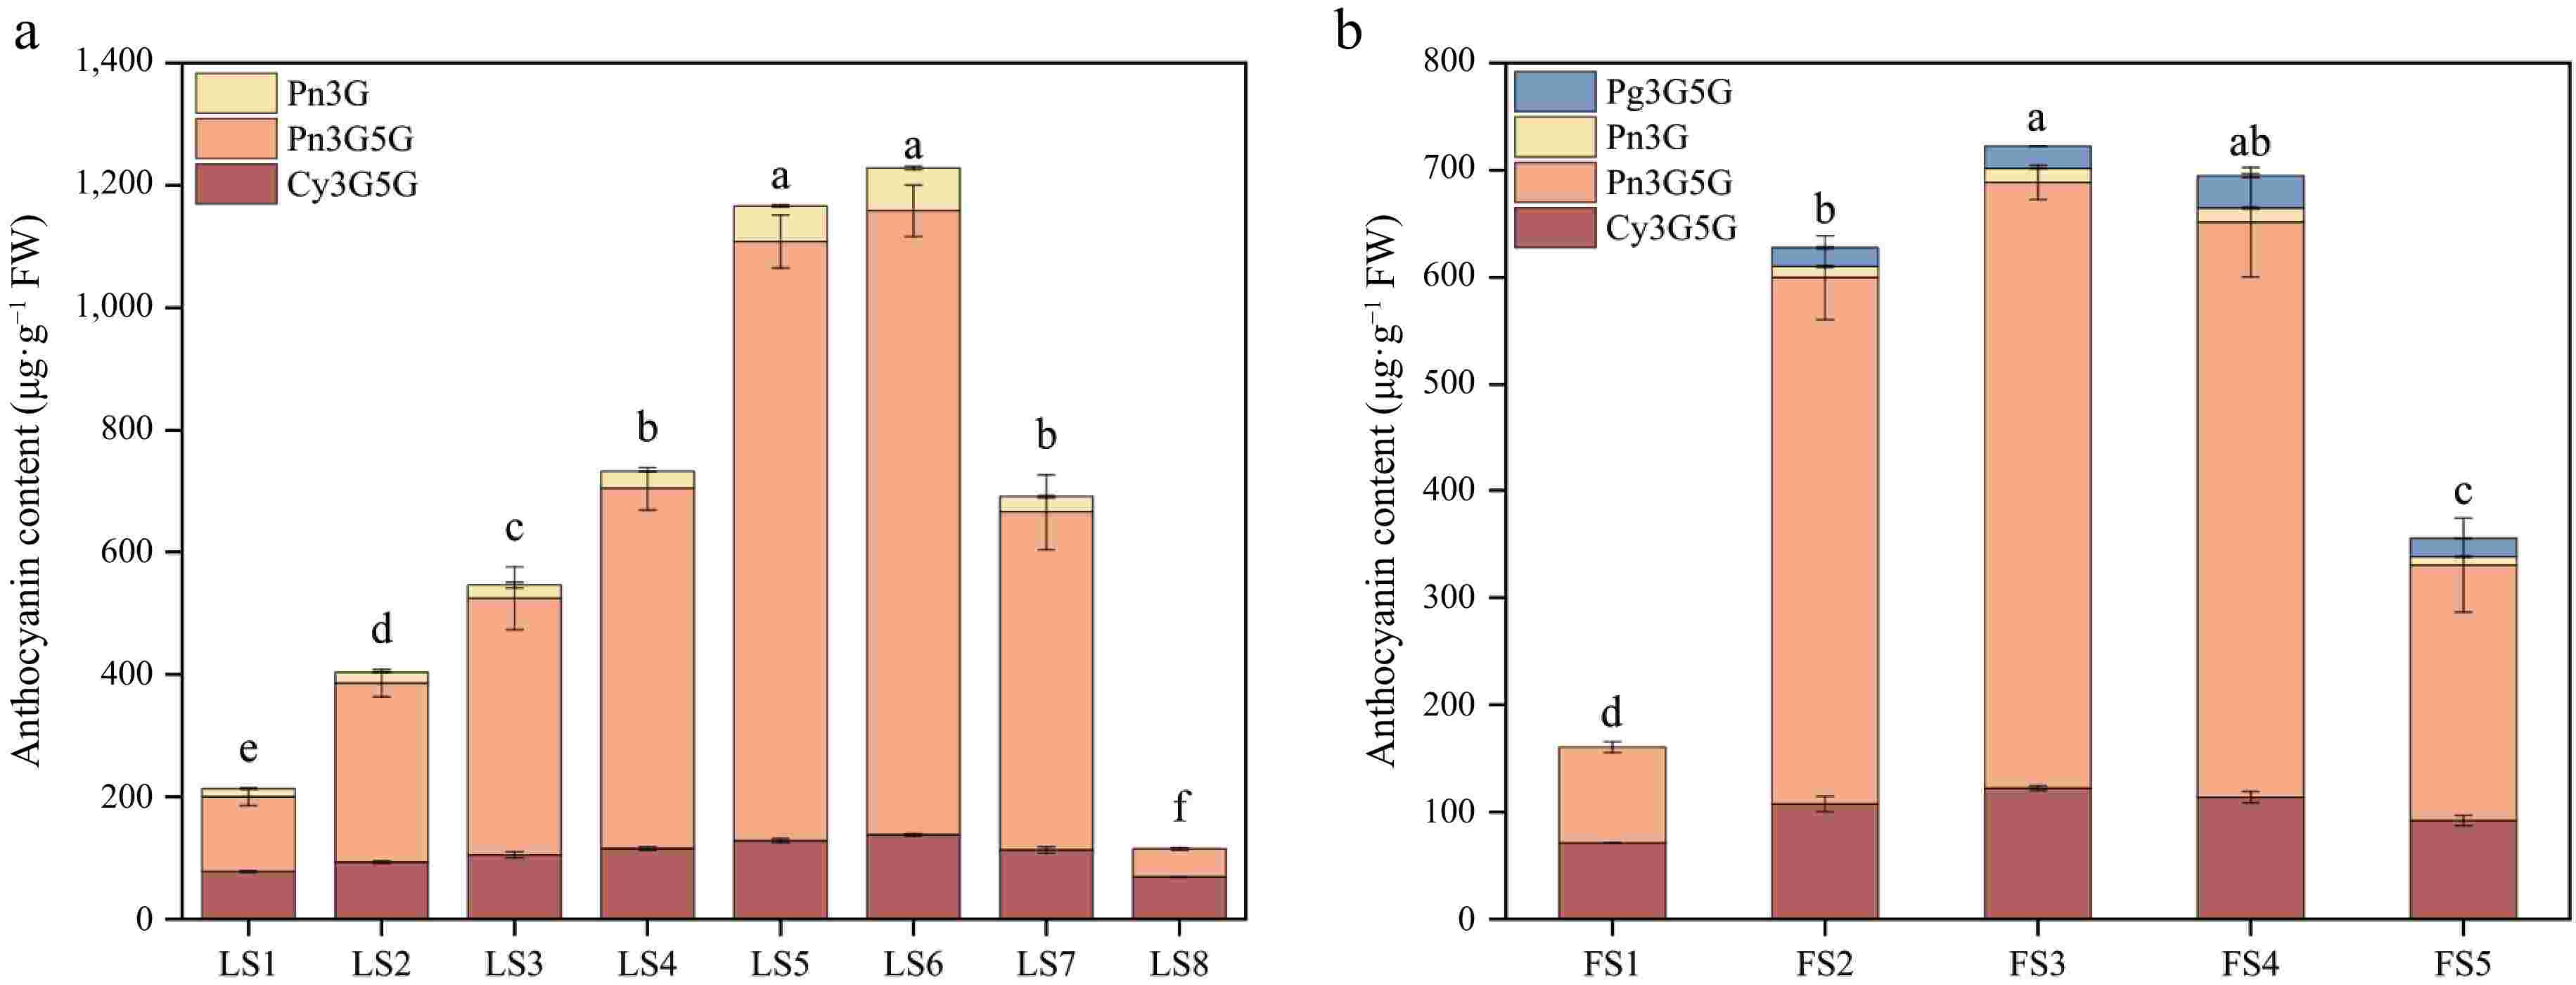
Figure 6.
Anthocyanidin composition and content of leaves and petals of P. qiui at different periods. (a) Anthocyanidin composition and content of P. qiui leaves at eight periods. (b) Anthocyanidin composition and content of P. qiui petals at five periods. Different lowercase letters indicate significant differences at the p < 0.05 level by Duncan's test.
The petals had four anthocyanidin components, Pn3G5G, Pn3G, Cy3G5G, and Pg3G5G (Fig. 6b), only Pn3G5G and Cy3G5G were present at FS1, accounting for 55% and 45%, respectively. Pn3G5G was the most abundant from FS2 to FS4, accounting for about 76% to 79% of the total anthocyanidin content, followed by Cy3G5G, accounting for about 16% to 19%, the content changes were small in each period. In FS8, Pn3G5G was still the main component, accounting for 67% of the total, followed by Cy3G5G at 28%. Pn3G and Pg3G5G only had less content from FS2 to FS5, and the total proportion of the two was less than 8% (Supplementary Table S3).
Expression patterns of genes related to anthocyanin synthesis in leaves
-
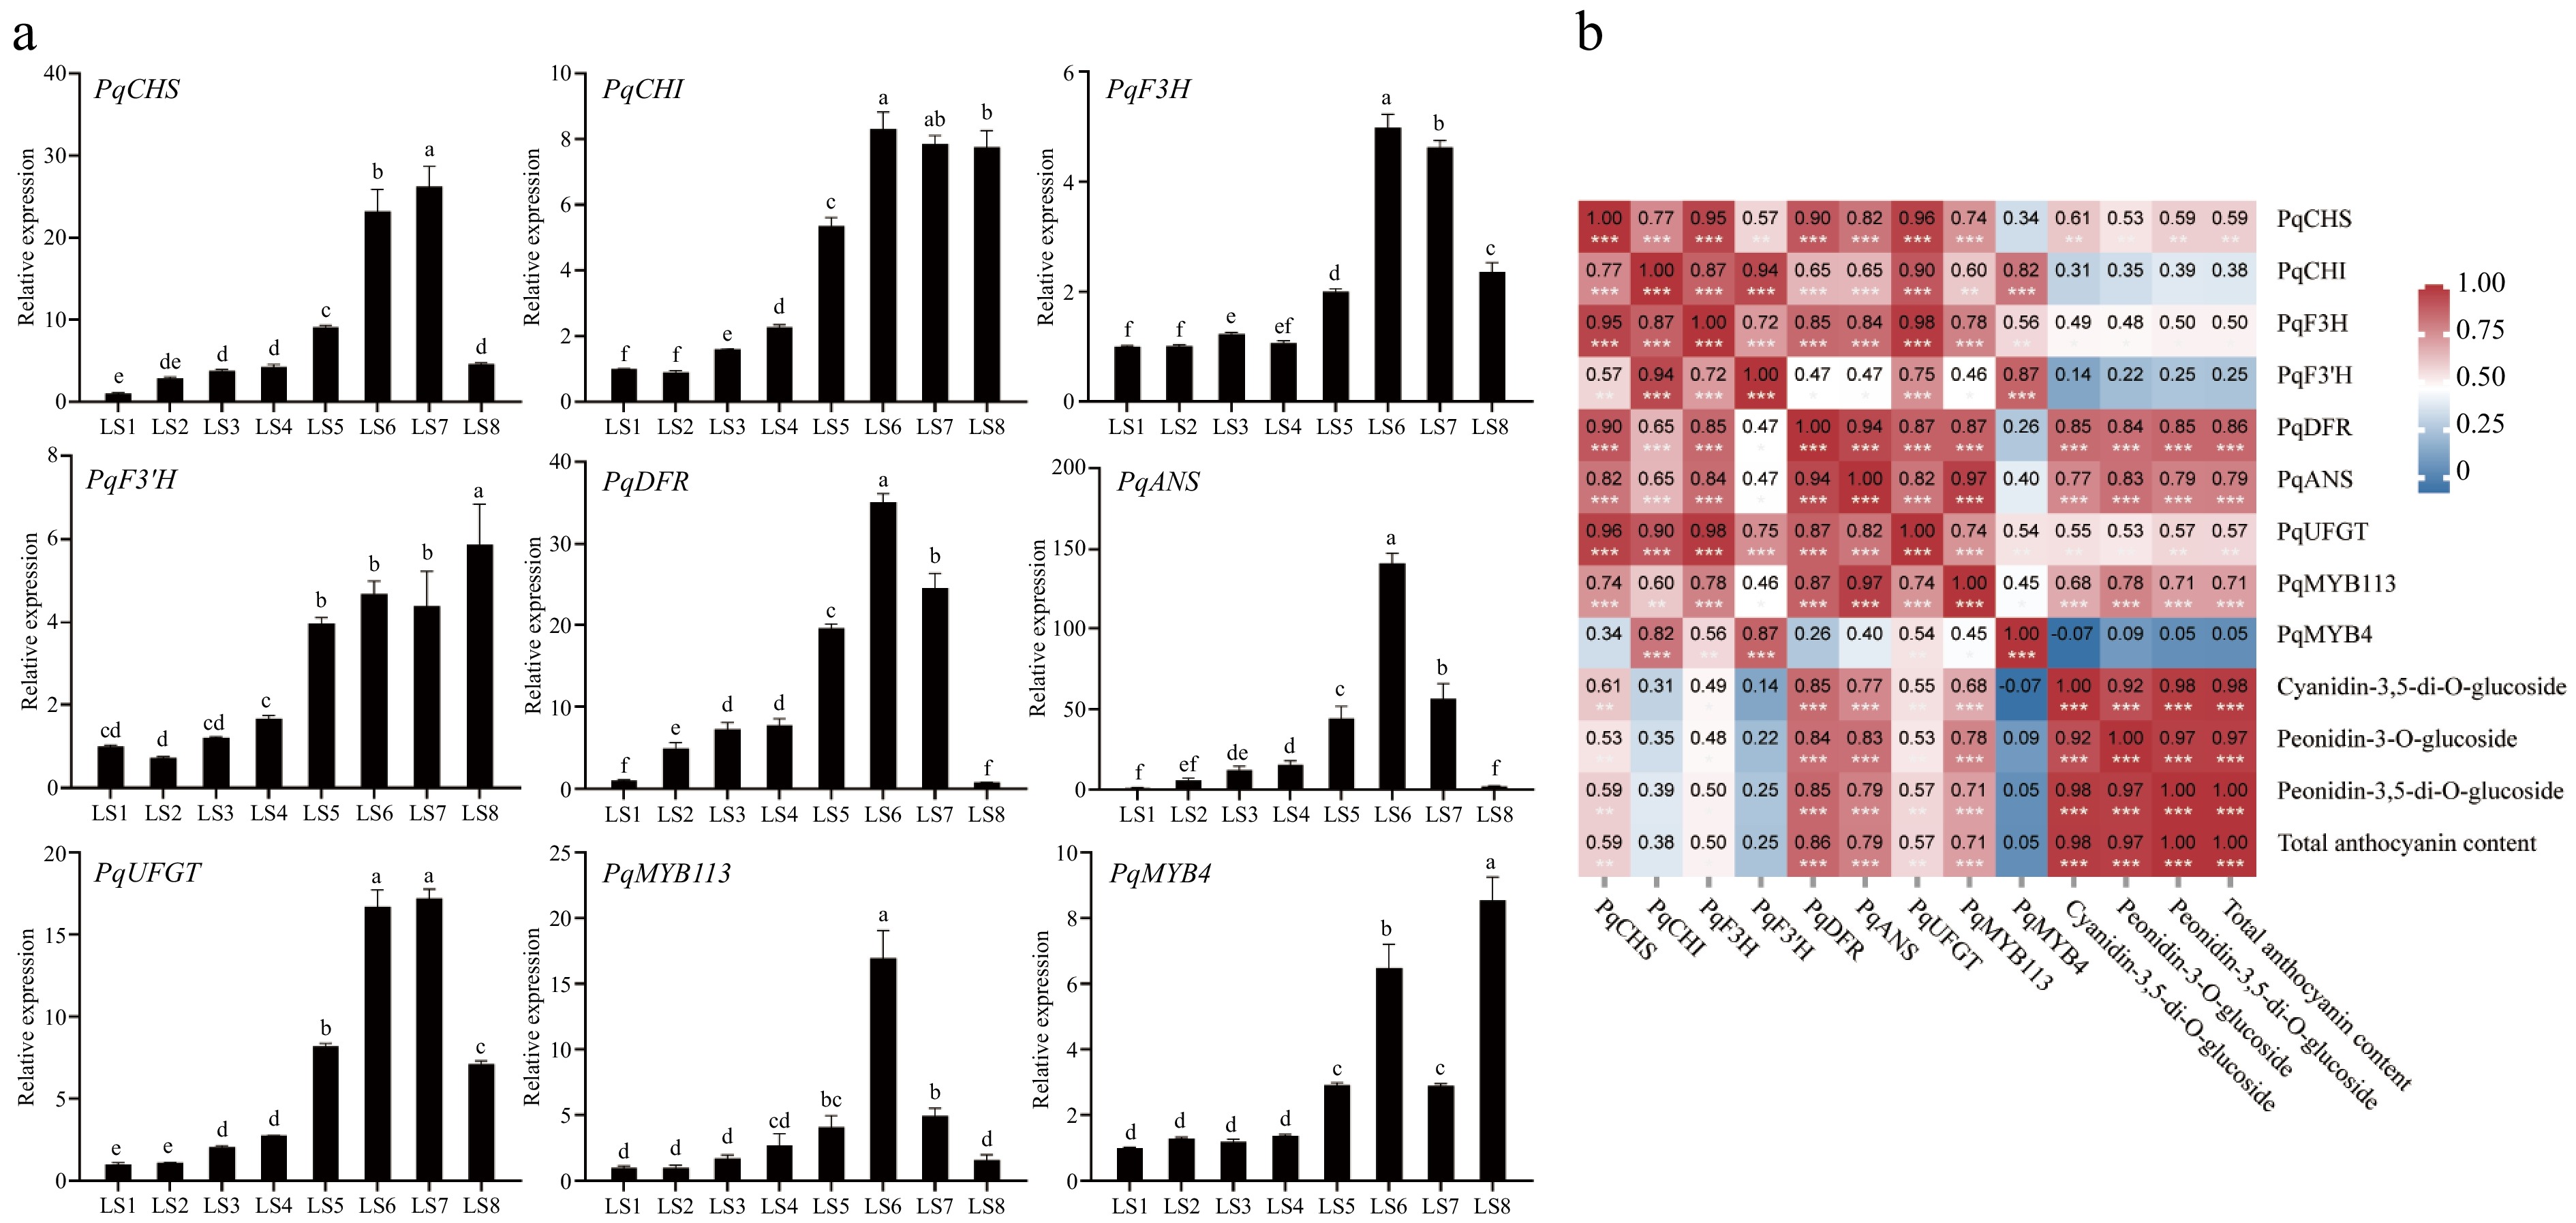
qRT-PCR analyses were conducted to investigate the expression patterns of genes involved in the synthesis of anthocyanins, including seven structural genes PqCHS, PqCHI, PqF3H, PqF3'H, PqDFR, PqANS, and PqUFGT, as well as TF genes PqMYB113 and PqMYB4 at eight period stages, LS1−LS8, in P. qiui leaves(Fig. 7a).
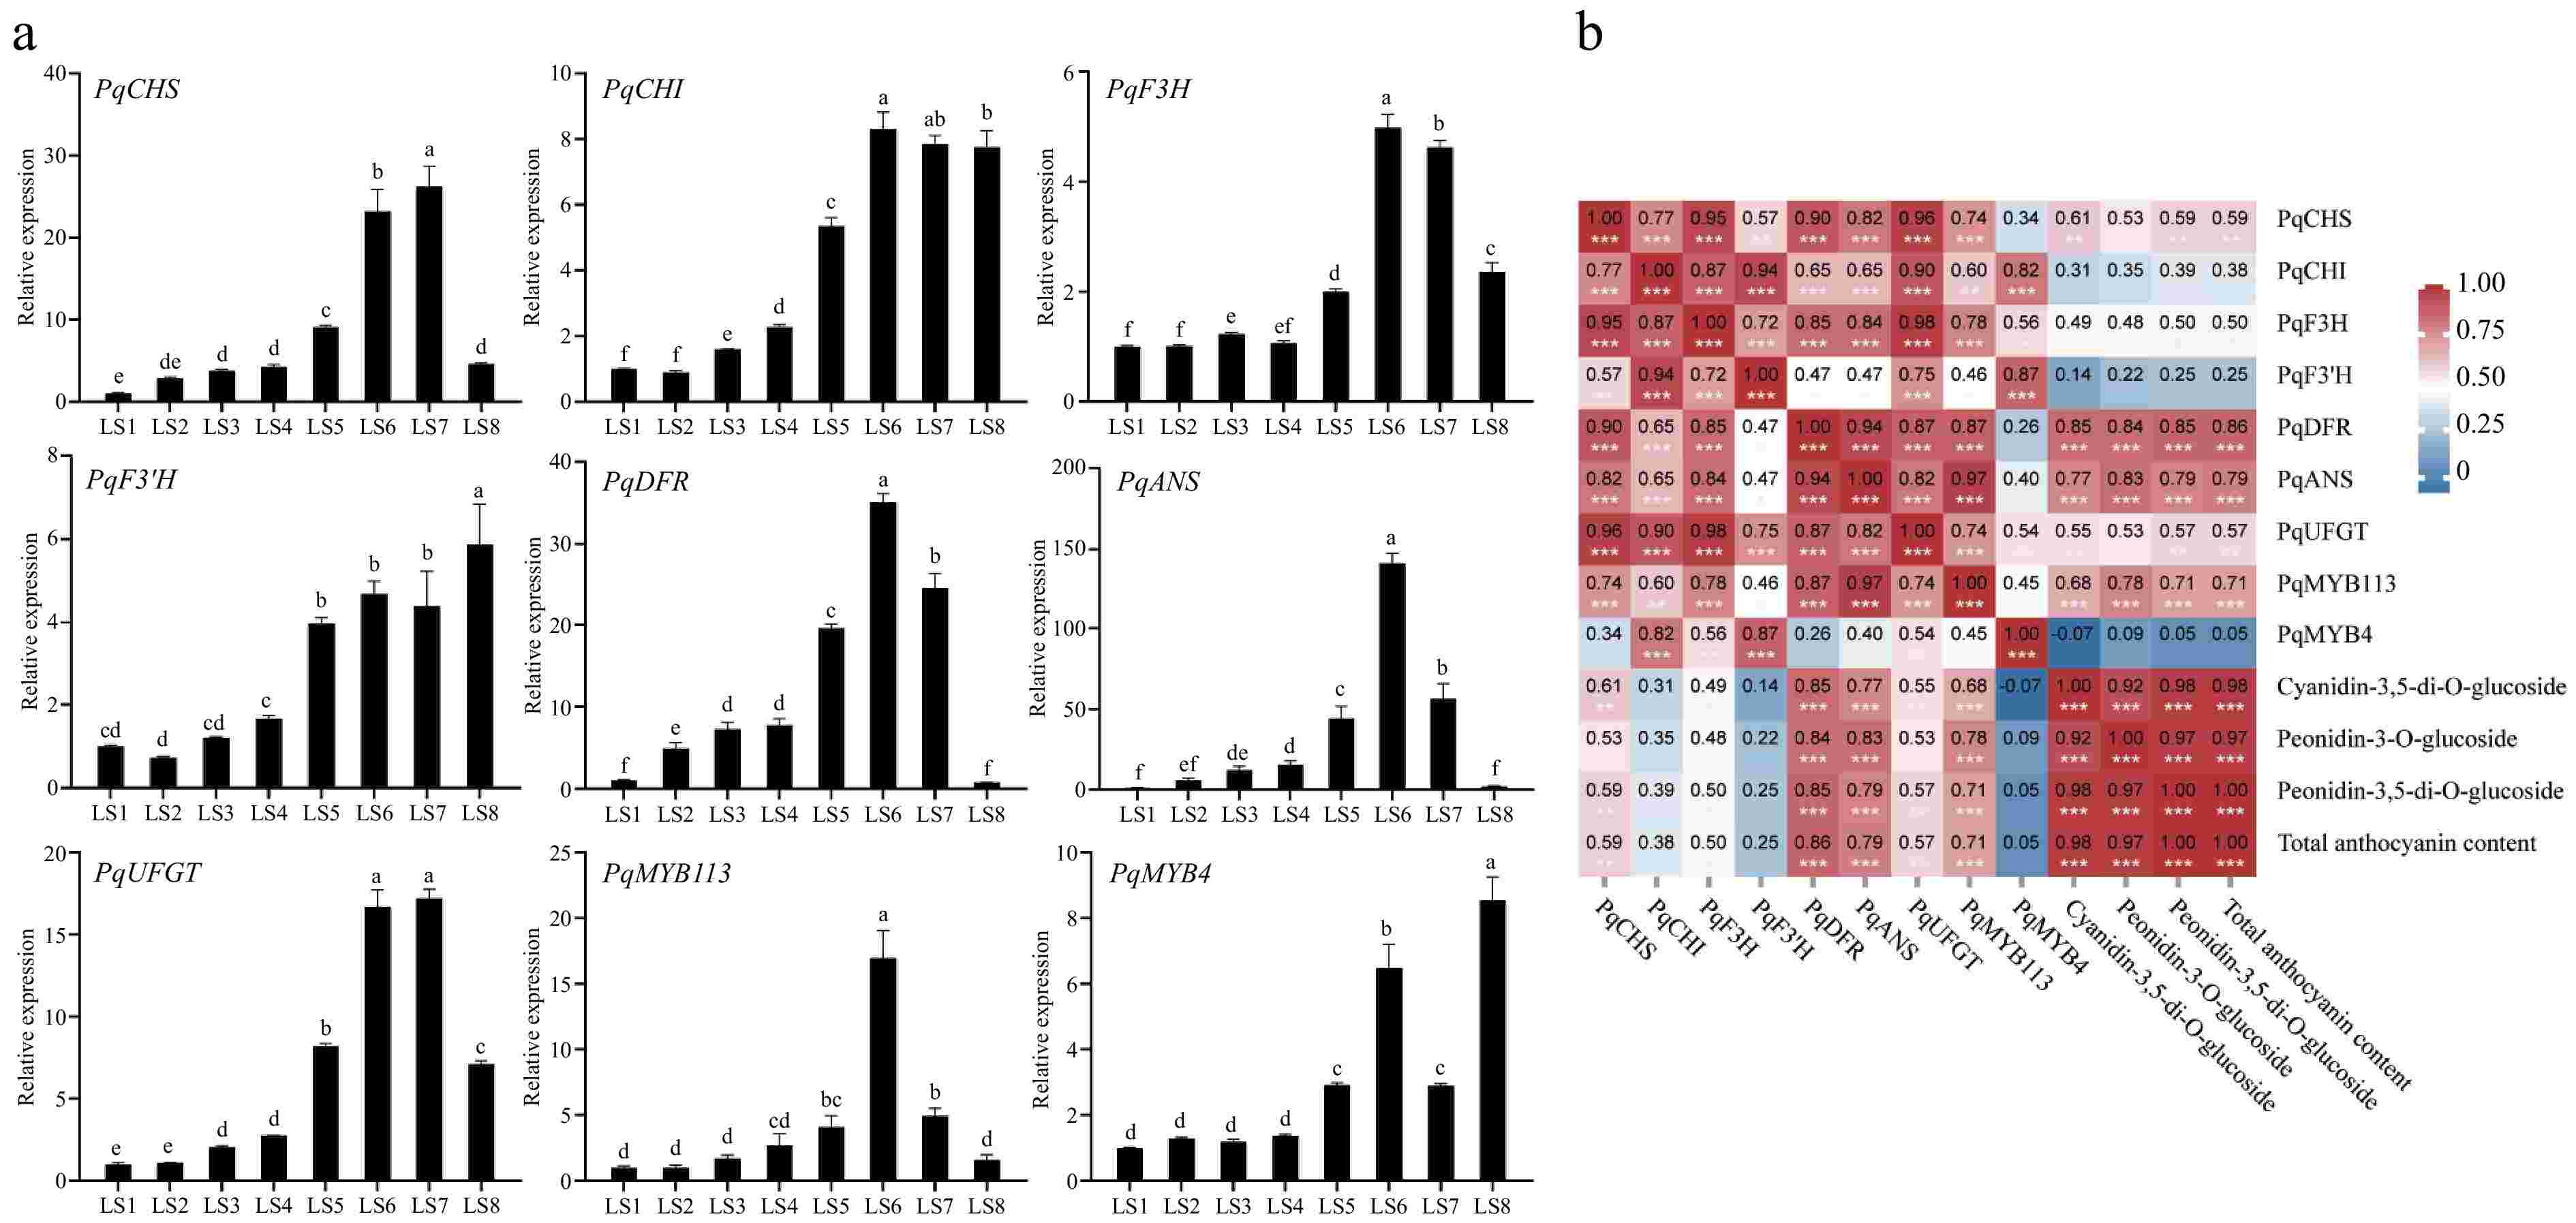
Figure 7.
Expression analysis of genes related to anthocyanin synthesis at eight periods in leaves of P. qiui. (a) Expression patterns of genes at eight periods in leaves of P. qiui. (b) Correlation analysis of key pigment compounds and differentially expressed genes in the anthocyanin synthesis pathway in leaves. Different lowercase letters indicate significant differences at the p < 0.05 level by Duncan's test. * p < 0.05, ** p < 0.01, *** p < 0.001.
With regard to the structural genes, PqCHS, PqF3H, PqDFR, PqANS, and PqUFGT exhibited trends that were consistent with the accumulation of anthocyanins, and the changes were more significant, with the relative expression levels of PqDFR and PqANS at LS6 were the highest, which were about 35 and 140 times higher than those in LS1, respectively. In addition, PqMYB113 was also consistent with the trend of changes in anthocyanin, with the highest relative expression level at LS6, about 17 times that in LS1, and the expression level of PqMYB4 was the highest in LS8.
Further compound correlation analysis was performed based on gene expression and anthocyanin accumulation profiles, the result showed that the expression levels of PqDFR, PqANS, and PqMYB113 were significantly positively correlated with the contents of anthocyanin (Fig. 7b). Therefore, PqDFR, PqANS, and PqMYB113 were identified as the key genes for anthocyanin synthesis in P. qiui leaves.
Expression patterns of genes related to anthocyanin synthesis in petals
-
qRT-PCR results showed that PqF3H in petals was consistent with the trend of anthocyanin content change and had the highest relative expression level, PqDFR and PqANS had the highest relative expression level at FS2, which could be the reason for the significant increase of anthocyanin content in petals during the FS2 period. The expression levels of PqMYB113 and PqMYB4 were highest at FS1 and then decreased, which was inconsistent with anthocyanin accumulation (Fig. 8a).
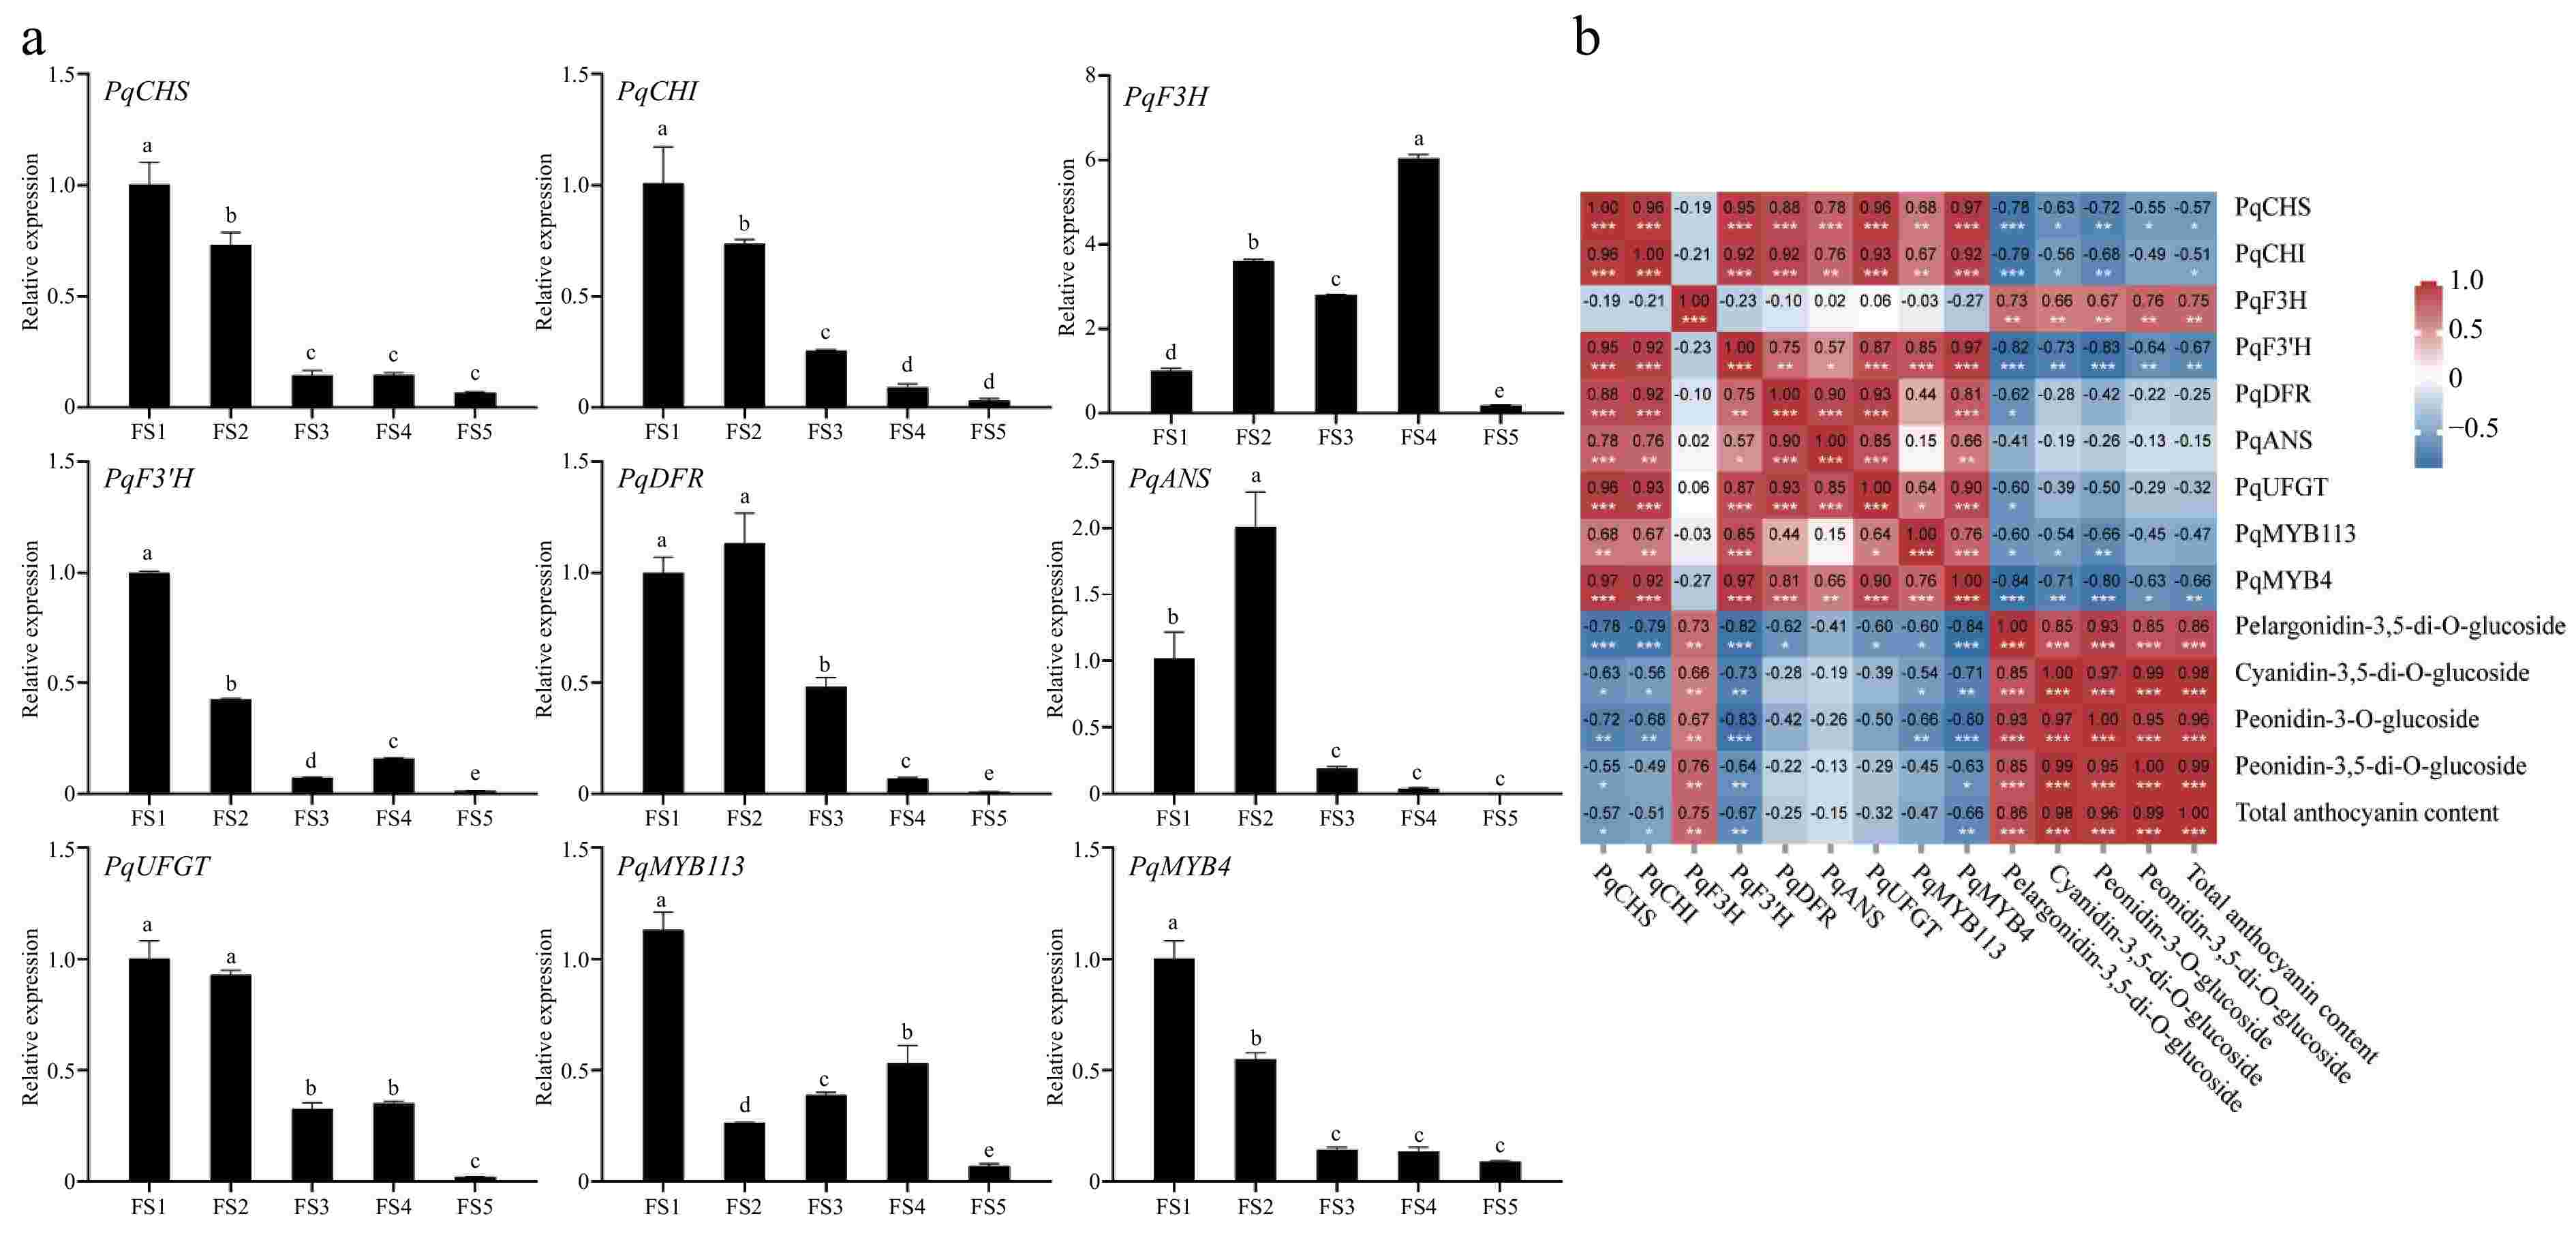
Figure 8.
Expression analysis of genes related to anthocyanin synthesis at five periods in petals of P. qiui. (a) Expression patterns of genes at five periods in petals of P. qiui. (b) Correlation analysis of key pigment compounds and differentially expressed genes in the anthocyanin synthesis pathway in petals. Different lowercase letters indicate significant differences at the p < 0.05 level by Duncan's test. * p < 0.05, ** p < 0.01, *** p < 0.001.
Further compound correlation analysis showed that expression levels of PqF3H were significantly positively correlated with the contents of anthocyanin (Fig. 8b), suggesting that PqF3H may play an important role in the biosynthesis of petal anthocyanins. However, PqCHS, PqCHI, PsF3'H, and PqMYB4 were negatively correlated with total anthocyanin content.
-
The leaf color of P. qiui experienced the process from light red to purplish red, and then the red color gradually faded, anthocyanins determine the red color of leaves. This is consistent with the findings of Duan et al.[35], and also similar reports in other plants, for example, Xie et al.[36] showed that a combination of reduced anthocyanin synthesis and increased anthocyanin degradation metabolism is responsible for the fading of the red color of Acer tutcheri leaves; Chen et al.[37] determined and found that the red autumn leaves of Sapium sebiferum are the result of the continuous anthocyanin. In addition, the color index of petals of P. qiui was mainly related to anthocyanins and anthoxanthins, in which the correlation between anthocyanins and the color index was stronger and had a greater influence on the color (Fig. 5b), and the anthocyanidins were accumulated during the opening process and reached the maximum value at FS3 stage, and the anthocyanin content decreased significantly with petal senescence (Fig. 6b). This also exists in other studies, Zhang et al.[38] found that the anthocyanin content of P. suffruticosa 'Luoyang Hong' increased continuously from flower expansion to half-opening; Cui et al.[39] found that 'Zhaofen' reached its maximum value at the full bloom, and 'Baixueta' reached its maximum value at the dew color stage. Therefore, the total anthocyanin content accumulated during the pre-flowering period, but the trend varied among varieties.
The cellular pH value is also an internal factor that affects the color performance, and the stability of anthocyanins is more obviously affected by the pH value, when the solution has pH 1, anthocyanins mainly in the form of yellow salt cations, the solution shows purple or red; when the pH value is between 2 and 4, anthocyanins lose the cation on the C epoxy to become the blue quinone-type base. Quinone base in acidic solution and the yellow salt cation reversible transformation; when the pH value rises to 5~6, mainly in the form of pseudovbasic and chalcone, two forms exist and the two can also be reversibly transformed, the solution is colorless. It means that when the pH value is between 4 and 6, four different structural forms of anthocyanins coexist, and they establish an equilibrium between the quinone group and the methanol group by means of the yellow salt cation, and when the pH value is higher than 7, anthocyanins will be degraded[40,41]. In this study, the pH values of leaves and petals of P. qiui at different periods were weakly acidic, which helped to maintain the stability of anthocyanins. Meanwhile, correlation analysis showed that both leaf and petal pH had low or no correlation with the color index. Leaf pH was negatively correlated with anthocyanin content, but the correlation index was 0.49, and petal pH had no correlation with anthocyanin content. Therefore, the change of pH was not the main factor affecting the color presentation.
The main component of anthocyanins in leaves and petals is Pn3G5G, which accounts for more than 70% of the total amount of anthocyanins in leaf from LS2 to LS7 and in petal FS2 to FS4 (Fig. 6). This is similar to the results of a previous study, Zhang et al.[42] analyzed the petal pigment composition and content of seven wild species of peony, and found that there were five anthocyanins, among which Pn3G5G accounted for about 90% of the total anthocyanin content in the petals of P. qiui. Moreover, the leaves have no Pg3G5G compared with the petals, which could be the reason for the difference in the red color of the leaves and petals. Wang et al.[43] conducted a similar study using the Japanese variety 'Taiyang' with bright red petals and the Chinese variety 'Huhong' with light red petals as test materials, and confirmed that Pg3G, which is unique to the Japanese variety, gave the petals a bright red color and Pg3G5G gave the petals a pink color.
The anthocyanin synthesis pathway is one of the more clearly studied metabolic pathways in plant secondary metabolism, and synthesis-related genes have been cloned and analyzed in many plants. The structural genes that play a key role in anthocyanin synthesis in different plants are also different. In Viola cornuta, VcANS is the key gene affecting flower color change[44]. The specific expression of PsCHS1 in petals of tree peony 'Guanshimoyu' is associated with anthocyanin accumulation[45]. In P. delavayi, the formation of purple-red petals is closely related to the increased expression of F3H, DFR, ANS, and 3GT[46]. In Rosa chinensis 'Mutabilis', only RcUF3GT1 and several other low-expression UGT genes showed similar patterns of anthocyanin accumulation in flower petals[47]. In the present study, PqDFR and PqANS were significantly positively correlated with anthocyanin content during leaf development (Fig. 7b); however, only PqF3H was positively correlated with petal anthocyanin content in petals (Fig. 8b). Anthocyanin accumulation is mainly affected by both structural genes and regulatory genes. The group previously identified two R2R3-MYB, PqMYB113, and PqMYB4, from the leaves of P. qiui, and overexpression of PqMYB113 in Arabidopsis thaliana and tobacco (Nicotiana tabacum) led to an increase in anthocyanin accumulation as well as the up-regulation of CHS, F3H, F3'H, DFR, and ANS, and PqMYB113 was able to activate the promoters of PqDFR and PqANS[34]. However, AtCHS, AtCHI, AtDFR, and AtANS expression levels were down-regulated and anthocyanin content was significantly reduced in PqMYB4 transgenic Arabidopsis[30]. In this study, it was found that PqMYB113 was only positively correlated with the anthocyanin content of the leaves (Fig. 7b), but was not in line with the trend of the petals, and the inhibition of anthocyanin synthesis by PqMYB4 was more significant in petals (Fig. 8), which suggested that the mechanism of anthocyanin synthesis in the leaves and petals of P. qiui is not consistent. Similar reports have been made in studies on tree peony petal coloration. Zhang et al.[48] found that the expression levels of PsCHS, PsF3'H, PsDFR, and PsANS in the purple-spotted region were higher than in the spotless region. Gu et al.[49] confirmed that the PsMYB12-bHLH-WD40 complex regulates the specific expression of PsCHS in the spots in the Northwest peony cultivar 'Qinghaihuyinbo', thus leading to the formation of color spots. Therefore, the temporal and spatial expression patterns of key genes for anthocyanin biosynthesis in leaves and petals of P. qiui differed, which affected anthocyanin accumulation and then affected the color changes of leaves and flowers. The interaction mechanism between key structural genes and regulatory genes needs to be explored, and the specific metabolic pathways need to be further investigated.
-
Anthocyanins in leaves were significantly positively correlated with the a* value, so anthocyanins were the factor directly determining the red coloration, while the petal color index was mainly related to anthocyanins and anthoxanthins, among which anthocyanins had a stronger correlation with the a* value, and had a greater influence on color presentation. The main component of anthocyanidin in leaves and petals was Pn3G5G, and the differences in anthocyanidin components and contents affected the differences in red color between leaves and petals. The structural genes PqDFR and PqANS and the TF genes PqMYB113 were significantly and positively correlated with anthocyanin synthesis in leaves, and the structural gene PqF3H had a more significant effect on anthocyanin biosynthesis in petals.
This study was supported by the National Natural Science Foundation of China (Grant Nos 31971709 and 32271950) and the Open Fund of Shanghai Key Laboratory of Plant Functional Genomics and Resources (PFGR202301).
-
The authors confirm contribution to the paper as follows: study conceptualization, supervision, project administration, funding acquisition, writing – review & editing: Luo J; methodology: Dong S, Yu S, Yang Z, Niu Y; investigation: Dong S, Yu S, Yang Z, Niu Y, Liu X, Wei X; resources: Liu X, Wei C; software: Dong S, Yu S; writing – original draft, Validation: Dong S. All authors reviewed the results and approved the final version of the manuscript.
-
The datasets generated during and/or analyzed during the current study are available from the corresponding author on reasonable request.
-
The authors declare that they have no conflict of interest.
- Supplementary Table S1 Sequence of primers for qRT-PCR.
- Supplementary Table S2 Leaf and flower color in different periods of Paeonia qiui.
- Supplementary Table S3 Contents of anthocyanidins identified from leaves and petals (ug·g−1 FW) (Mean ± SE, n = 3).
- Copyright: © 2025 by the author(s). Published by Maximum Academic Press, Fayetteville, GA. This article is an open access article distributed under Creative Commons Attribution License (CC BY 4.0), visit https://creativecommons.org/licenses/by/4.0/.
-
About this article
Cite this article
Dong S, Yu S, Yang Z, Niu Y, Liu X, et al. 2025. Analysis of physiological, biochemical mechanism, and pigment related genes in leaf and petal coloration of Paeonia qiui. Ornamental Plant Research 5: e012 doi: 10.48130/opr-0025-0011 

Figure 1.
Phenotypes and color indices of leaves and flowers of P. qiui at different time periods. (a) Leaf phenotypes of P. qiui. (b) Leaf color indices of P. qiui. (c) Flower phenotypes of P. qiui. (d) Flower color indices of P. qiui. LS1: emergence stage; LS2: sprouting stage; LS3: petiole visibility; LS4: petiole spreading; LS5: leaves unfolding; LS6: wind bell bud; LS7:petal coloring; LS8: full bloom stage. FS1: slightly pigmented soft bud; FS2: initially opened flower; FS3: half opened flower; FS4: fully opened flower; FS5: Decaying flowers. L* represents the brightness; a* and b* represent the redness and yellowness, respectively; C* represents chroma; h represents the hue angle.