


-
Sorghum (Sorghum bicolor (L.) Moench) belongs to the Poaceace family and it is one of the most globally important cereal crops. It is widely grown in the semi-arid tropics, where frequent drought is experienced. It is the fifth in line of production after maize, rice, wheat, and barley and feeds over 500 million people in the developing world[1−3]. Ethiopia is the fourth top sorghum producing country in the world following the USA, Nigeria, and Mexico[4]. Of the total cereal production of the country, sorghum accounts for 18.5% with a productivity of about 2.8 tons per hectare[5].
However, due to abiotic and biotic constraints, sorghum productivity potential is being compromised. Among the abiotic factors are low soil fertility, drought, and salinity. Agriculturally important biotic constraints include the hemi-parasitic weed Striga, panicle diseases, stem borers, and insects[6]. In Ethiopia, sorghum production challenges associated with both biotic and abiotic constraints vary from region to region. However, drought and Striga (Striga hermonthica) are the most important problems across the country[7].
Several of the Striga control approaches widely investigated and developed include cultural, chemical, biological, genetic or breeding for resistance and a combinations of more than one of these[8−10]. Many of these methods are either not practically successful or not economically feasible for low-income farmers in SSA[11].
Small-scale farmers, particularly in the Northern region of Ethiopia need easy, accessible, and effective S. hermonthica management strategies that are compatible with their production practices. Soil borne bacteria have potential to perturb the early stages of Striga and Orobanche growth by reducing their incidence by 90% to 100 %[12]. It has been also shown that soil- borne fluorescent Pseudomonad strains suppressed the germination of S. hermonthica and Orobanche seeds[13]. Moreover, a few pathogenic bacteria were found to be effective to control S. hermonthica and replace commercial chemical herbicides[14]. Mounde[15] showed the significant suppression of the key stages of Striga development by Bacillus strains. The study by Neondo[16] identified microbes that were potent against S. hermonthica and proposed their use in the reduction of S. hermonthica seed bank in infested soils. The communication between microbes and S. hermonthica depends on signal transduction, the expression of pathogenicity, and virulence factors of the microbe[16]. Thus, inoculation of microbes such as rhizobacteria could minimize the competition of cereal crops with weeds and may reduce the use of chemical herbicides and could benefit agriculture contributing to increased crop yields. However, isolation, characterization, and utilization of specific microbial agents capable of causing S. hermonthica seed decay has not been thoroughly exploited in Ethiopia. Therefore, the aim of this study was to identify specific rhizobacteria that have the potential of suppressing Striga infestation on sorghum.
-
The experiment was carried out in the Microbial Biotechnology and Striga Bioassay Laboratories at National Agricultural Biotechnology Research Center (NABRC), Holeta. NABRC is located at 9°3'N latitude and 38°30'E longitude, 34 km away from Addis Ababa, in the central part of Ethiopia, West Shoa Zone of Oromia Regional State.
Source of experimental materials
Soil sample
-
Soil samples were collected from three sorghum growing fields (sites) in the northern region of Ethiopia during the 2018 main crop season. These were Artuma Fursi district in Oromia zone of Amhara region (site 1), Kewet district in Semien Shoa Zone of Amhara region (site 2), and Qaftay Humera in the district West Tigray zone of Tigray region (site 3) with medium, low and high Striga infestation, respectively (Fig. 1). At each site, the soil samples were collected from four random spots in four quadrants after locating the fields using Global Positioning System (GPS) coordinates and recording the altitude for each site (Supplemental Table S1). Soil samples were collected using a sterile shovel at a depth of 20−30 cm and put into a labeled clean plastic bag and transported to the greenhouse facility at National Agricultural Biotechnology Research Center, Holeta.
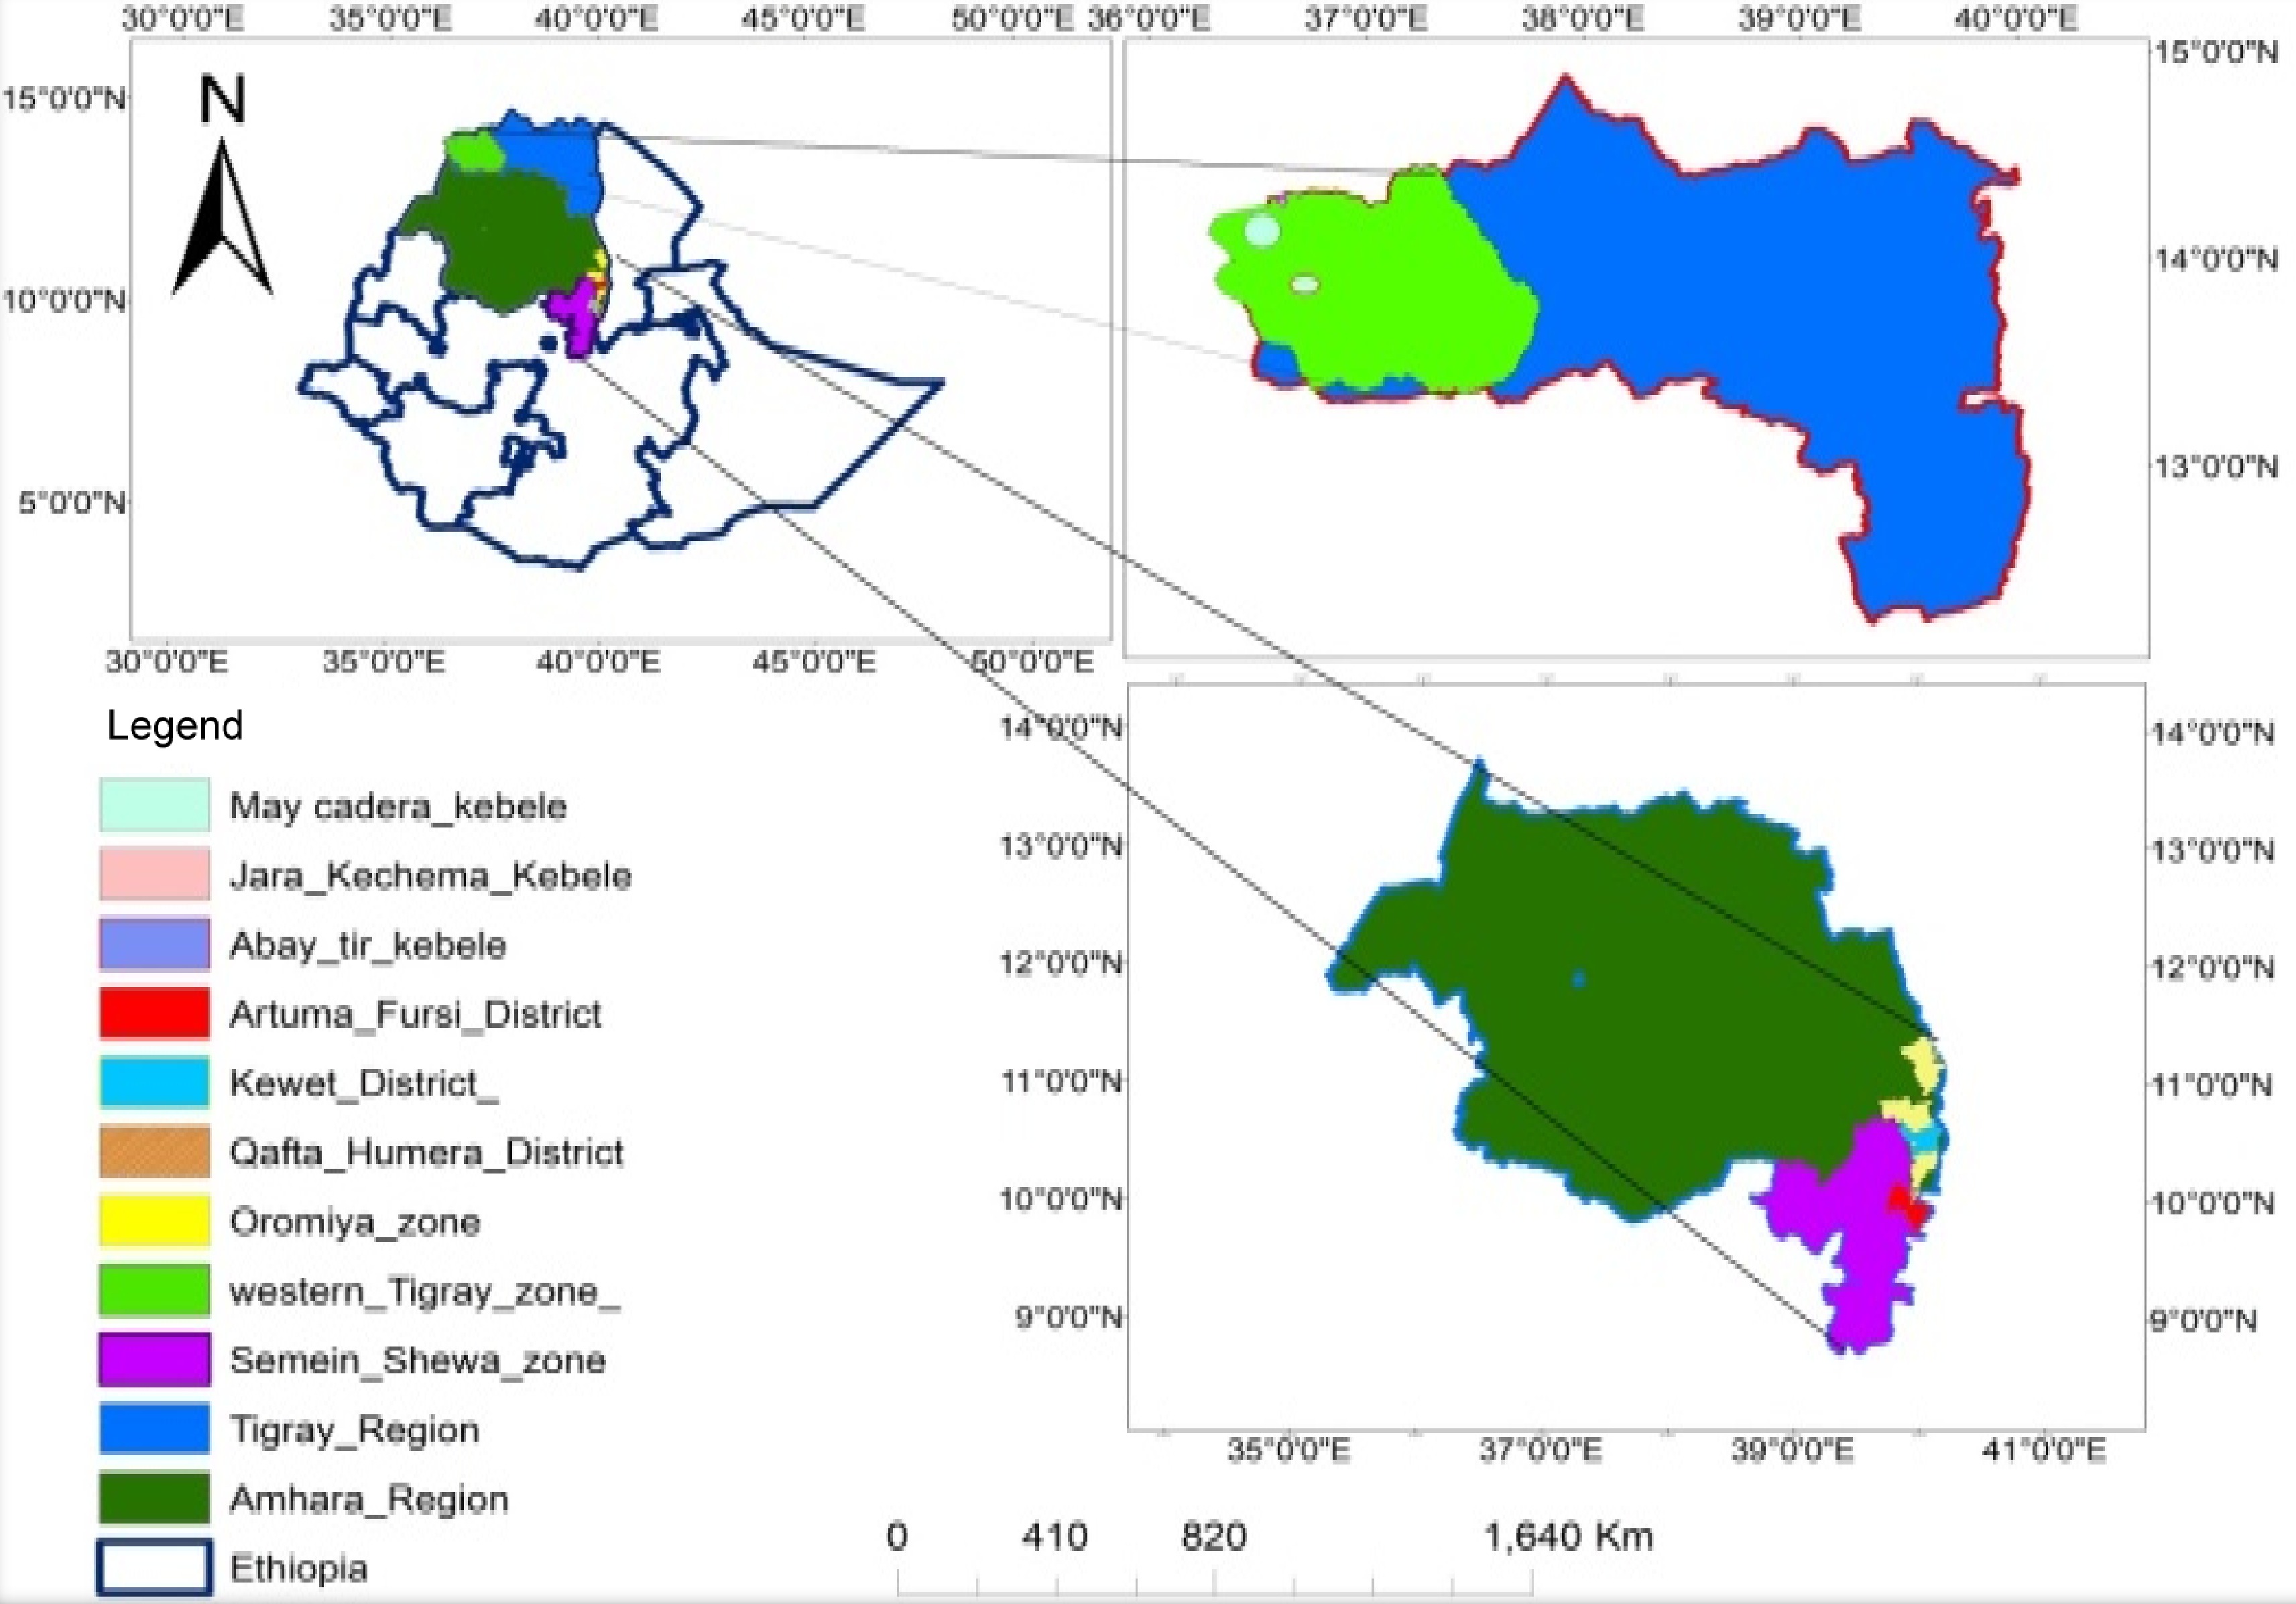
Figure 1.
Map of soil sample collection areas.
Sorghum seeds
-
Seeds of different sorghum germplasm that are known to be Striga susceptible, Striga resistant, drought tolerant, widely used, released, and local land races were used in this study (Table 1). The seeds were stored at the National Agricultural Biotechnology Research Center cold room by the national Integrated Striga Control (ISC) project under Ethiopian Institute of Agricultural Research.
Table 1. Sorghum genotype selection for greenhouse planting and isolation of bacteria.
Code Name Source Character Selection criteria G1 ETSL101847 Tigray Local land race Land race and widely used G2 ETWS 90754 Amhara Wild type Wild type G3 ETWS 91242 Beneshangul Wild type Wild type G4 Framida Purdue University Striga resistance Striga resistant and widely used G5 ETSL100046 Land race LGS Land race and LGS G6 ETSL101853 Land race HGS Land race, widely used and HGS G7 Misikir MI_Drought_Score Drought tolerant Drought tolerant G8 S35 ICRISAT Stay green Stay green or Drought tolerant G9 Shanqui red China Striga susceptible variety HGS and Striga susceptible variety G10 SR5-Ribka IBC Striga resistant and fusarium compatibility Striga resistant and fusarium compatibility G11 SRN39 Purdue University Striga resistance Striga resistant and widely used G12 Teshale ICRISAT Best released susceptible varieties Widely used LGS = low germination stimulant; HGS = high germination stimulant, G = genotype. Striga seeds
-
S. hermonthica seeds used for this experiment were collected from S. hermonthica-infested sorghum in farmers' fields in Ethiopia, Tigray Region, Central Zone Abergele District Titay Hagum Kebele during 2018 main cropping season (altitude: 1,466 m; latitude: 13.25'51.8'' East; longitude: 38.59'50.3'' North).
Planting sorghum in the soil in the greenhouse
-
Seeds of sorghum that were well matured and with good morphological characteristics were selected and surface sterilized in 1.5% bleach for 30 min. The seeds were then allowed to germinate for about 30 h in an incubator set to 30 °C. Seedlings were transferred to a pot and grown on the soils collected from various sorghum growing sites in greenhouses. The management including watering and weeding was made accordingly until it was set three leaves ready for harvesting rhizosphere soil samples.
Rhizosphere soil collection
-
Rhizosphere soil sample collection was made following the method described previously[17]. After setting the third leaf, the sorghum was uprooted and vigorously shaken by hand for 5 min until non-adhering soil was completely removed. Rhizosphere soil was collected by removing the sorghum's soil parts with a sterile blade and shaking the roots for 10 min in 50 mL falcon tubes containing 35 mL sterile distilled water to remove the adhering soil. The soil suspensions were then incubated to homogenize the soil content on a shaker (300 rpm, 90 min, and 25 °C) before being centrifuged at room temperature for 10 min to concentrate soil particles in the pellet.
Rhizosphere bacteria isolation
-
Rhizosphere bacteria were isolated by serial dilution technique. One gram of each soil pellet was suspended, each in 90 mL sterile distilled water in a 50 mL falcon tubes and mixed thoroughly overnight using a mechanical shaker at 110 rpm, until completely dispersed. Then a 100 µl aliquot was transferred with sterile pipettes to 9 mL sterile 0.85% saline solution in a test tube. A serial dilution (up to 10–8) was prepared. From each 10–4, 10–5, and 10–6 serial dilutions, 0.1 mL of an aliquot was spread on nutrient agar on Petri-dishes (90 mm), for each dilution in triplicate. Plates were incubated at 28 °C for 24 hours. Representative types of bacterial colonies were further purified by sub-culturing on fresh medium and used for downstream work or stored in 35% glycerol at −80 °C[12,17,18].
In vitro screening of rhizoabcterial isolates for their biocontrol traits
-
Rhizobacteria isolates were first screened for production of HCN followed by screening HCN positive isolates for IAA production. Common producers of HCN and IAA isolates were selected for further evaluation of their effects on S. hermonthica germination inhibition in vitro.
Hydrogen cyanide (HCN) production
-
HCN production by the bacterial isolates was tested qualitatively using the method previously reported[19] with slight modification in incubation period. The bacterial isolate cultures were streaked on Trypto Soya Agar amended with 4.4 g/L glycine. Whatman filter papers were sterilized and soaked in 2% sodium carbonate in 0.5% picric acid solution was placed in the top of each plate. Plates were sealed with parafilm and incubated for 4 days at 28 °C. The change in the color of Whatman filter paper from yellow to light brown, brown or reddish brown was observed as an indication of weak, moderate or strongly hydrogen cyanide producers, respectively.
Indole acetic acid (IAA) production
-
The ability to produce IAA of the isolate was detected from the culture of the bacterial isolates following the procedure described previously[20]. Briefly, pure colonies from a 24-h culture were inoculated into nutrient broth supplemented with 2 % tryptophan and in the absence of tryptophan (control), and incubated at 28 °C for 48 h. Five milliliter culture was removed from each tube and centrifuged at 12,000x g for 15 min. Two milliliter aliquot of the supernatant was transferred to a fresh tube. This was then treated with 2 mL salkowsky reagent (1 mL 0.5 M FeCl in 50 mL HClO4) and incubated at room temperature for 25 min. Development of pink color indicates positive result for IAA production.
In vitro evaluation of the effects of selected isolates on Striga germination
-
Each common HCN and IAA producing isolates was evaluated for their Striga germination and seed decay activity in Striga bioassay laboratory using Agar Gel Assay (AGA) and Whatman filter paper. To do this, S. hermonthica seed germination test was conducted to determine its viability prior to use in vitro evaluation of the effects of rhizobacterial isolates on the seed in the absence and presence of susceptible hosts. However, the seed had to be exposed to the right environmental conditions for the optimum period of time to break dormancy and ready for germination. Hence, the Striga seed was conditioned by incubating at 29 °C for 10−14 d. In each case, S. hermonthica seed was treated with each isolate and germination percentage computed to see the germination inhibitory activity of the isolates[21, 22].
Determination of germination percentage of S. hermonthica
-
S. hermonthica seed surface sterilization and preconditioning was made according to the protocol previously reported[22]. First, seeds were surface sterilized in 75% ethanol under a hood in a 50 mL flask for 2 min and rinsed three times with sterile double distilled water. This was followed by washing the seed with activated metricide (fungicide) for 2 min and rinsed three times with sterile double distilled water. Finally, 14.5 mL ddH2O and 1.5 mL of Benomyl solution (conditioning solution) was added to the flask. The flask was wrapped with aluminum foil and incubated at 30 °C for 10 d for preconditioning.
After 10 d of preconditioning, about hundred sterilized S. hermonthica seeds were transferred into a sterile glass fiber disc on a Petri plate lined with moist Whatman filter paper. Three glass fiber discs on each plate containing preconditioned S. hermonthica seeds were germinated by adding 20 µl of 0.1 ppm GR24 and incubated for 2 d at 28 °C[23]. Negative controls containing preconditioned S. hermonthica seeds were added to sterile distilled water. The numbers of germinated and non-germinated S. hermonthica seeds were counted using a binocular microscope fitted with a digital camera (Power Shot A640, Canon Inc., China). Germination percentage of Striga was determined by counting the total number of seeds on each disc and germinated Striga[22,16].
Evaluation of the effects of the isolates on S. hermonthica seed germination in the absence of host plants
-
The isolates were evaluated for their ability to reduce Striga germination by using GR-24, a synthetic germination stimulant. Striga seed surface sterilization and preconditioning was done as described in a previous section. About 100 preconditioned Striga seeds were added to glass fiber disc placed in Petri plate lined with double sterile filter papers and moistened with 3 mL of sterile ddH2O. The experiment was replicated 3 times each (three glass fiber discs per Petri plate). The seeds on the disc were treated with 100 µl of three days old bacterial suspensions in broth. In the control treatment, blank broth was added to discs containing preconditioned S. hermonthica seeds. The Petri plates were sealed with parafilm and incubated at 30 °C in the dark for 48 h.
After 48 h, 20 µl of 0.1 ppm GR24 was added to keep the germination uniform except for the effect of isolates and further incubated overnight at 29 °C. The number of total S. hermonthica seeds and the number of germinated/ inhibited per replicate was recorded under a stereomicroscope fitted with a camera[16]. Germination percentage for each replicate was calculated using the formula described previously[22].
$ \begin{aligned}&\rm Germination\;percentage\,(GP)=\rm\dfrac{\rm No.\; of\; germinated\; Striga \; seeds}{Total\;no.\;of\;Striga\;seeds}\times 100\end{aligned} $ Evaluation of the effects of the selected isolates on S. hermonthica seed in the presence of susceptible host
-
Striga conditioning was made as explained in the above section, but in this case, it was embedded in agar (bacto agar) solution after 5 d. By using a glass Pasteur pipette, a drop of preconditioned Striga seeds were added to the center bottom of a sterile plate in the conditioning flask. The seeds were treated with 0.5 mL of three days old of bacterial suspension in broth and kept for 30 min. In the control treatment, seeds were treated with blank nutrient broth media. Each treatment was replicated three times and arranged in RCD in an incubator at 30 °C. 0.7% (g/l) agar solution was prepared and autoclaved for 15 min and then allowed to cool in containment room water bath to 50 °C. The liquid agar was directly poured over the striga under hood until the agar reaches the sides of the plate and the striga seeds were distributed evenly across the plate. Plates were allowed to cool for 10 min before covering and placed in a dark at 30 °C in incubator for 10 d from the conditioning start date of the Striga seed.
Simultaneously with Striga conditioning, surface sterilization was made on susceptible sorghum seeds called Teshale using 1.5% bleach (containing a drop of Tween-20) and agitated three times for 30 min. The bleach solution was then poured off and rinsed two times with sterile ddH2O. The seeds were then soaked overnight to imbibe in 5 mL of a 5% (w/v) Captain solution. Next day, the Captain slurry was poured off under a laminar flow hood and rinsed with 5 mL sddH2O. Then, the seeds and water were poured into labeled sterile Petri dishes, each containing two Whatman filter paper (90 mm) circles and incubated until radicles emerged[22].
Next day, the germinated sorghum was gently picked up with sterile forceps and planted 1 cm from the edge of the plate pointing to the center of the plate in agar in which the Striga seeds were already embedded. The plates were incubated at 30 °C in an incubator where they remained for 3 d.
After 3 d, a 2 cm × 2.5 cm area measured was made along the main sorghum root 2 cm from the kernel at the back side of the agar plate using a thick water-resistant marker pen. This area is with high probability of Striga seeds coming into contact with sorghum root exudates. Total and germinated Striga seeds in each area were counted under a stereomicroscope and germination percentage computed using the methods described in the previous section[24,15].
Morphological and biochemical characterization and identification of the most effective rhizobacteria isolates
-
The most efficient bacterial isolates with production of HCN and IAA and corresponding inhibitor of S. hermonthica indicated by low mean germination percentage were selected. These isolates were morphologically and biochemically characterized using the method described previously[25,26] as described below.
Morphological characterization
-
The efficient bacterial isolates were characterized by growing on nutrient plate for 24 h at 28 °C. Best candidate of bacterial isolates were observed under stereomicroscope for colony size, shape, color, arrangement and gram reaction. For Gram staining, slide was cleaned with detergent and marked by codes of isolates. With the help of sterile wire loop, single colony of bacterial culture was made on clean glass slide and air dried and heat fixed. Then smear was covered with crystal violet for 1 min and slide was washed with drop of distilled water. Smear was covered with 2 drops of iodine solution for 30 s and slide was washed with alcohol and then distilled water. The smear was covered with 1 drop of safranin for 1min and then washed by distilled water, air dried and observed under microscope.
Biochemical characterization
-
Each efficient bacterial isolate was tested for sugar utilization, production of methyl red, indole and catalase. This would help to identify the isolates at genus level.
Sugar utilization test
-
The ability of the isolates to utilize carbohydrate sugars as a sole carbon source was determined in broth media containing specific sugar (glucose, fructose and sucrose) and Bromocrsol purple (0.4 g/l). A 96 deep well ELISA plate filled with 1 mL broth was inoculated by 0.1 mL of fresh culture in triplicate including control. The culture was incubated at 28 °C for 24 h and observed for the formation of yellow color as positive results.
Methyl red test
-
Broth containing (5 g of each Peptone, Glucose, Potassium phosphate and 1,000 ml distilled water; pH = 7) was prepared and steam sterilized using autoclave. In test tubes, 1.5 ml of the broth was poured and each was inoculated with test organism, and then incubated at 28 °C for 48 h. Four drops of methyl red indicator was added to each tube and gently shaken for 30 s. The tubes were kept for 15 min and observed for color change (where, positive test = bright red and negative test = yellow to orange)
Catalase test
-
The nutrient agar slants were inoculated with test isolates. An inoculated nutrient agar slant was kept as control. The cultures were incubated at 28 °C for 24 h. A loop full of bacterial culture was kept on a clean slide with the isolate label. A drop of 3% hydrogen peroxide was added on a slide. The culture was then observed for the gas bubble formation.
Statistical analysis
-
All the experimental units were arranged in CRD. Data on effects of selected isolates in S. hermonthica seeds germination was recorded. R software version 3.5.3 was used to perform analysis of variance (ANOVA) for all measured data. Tukey's test was used to compare and separate the means for significance level at 5%.
-
A total of 117 bacteria were isolated from rhizosphere of 12 sorghum varieties grown on soil collected from three different sorghum growing regions in Ethiopia (Supplemental Table S2). The isolates were first tested for their qualitative hydrogen cyanide production on a nutrient agar plate. From these, only 47 (40.2%) of the isolates were found to produce HCN with different levels (low producers, medium producers and strong producers).
Forty seven isolates capable of producing HCN were again tested for IAA production, another weed suppressive trait of rhizobacteria. Accordingly, six (12.8%) isolates were strong producers, 9 (19%) were moderate producers and 7 (14.9%) were low or weak producers and 25 (53.2%) were not producers of IAA at all.
From both test, 21 isolates were common producers of HCN and IAA. These include E19G1, E19G3, E19G6a, E19G9, E19G11a, E19G6b, E19G10, E19B, E19G7, E19G11b, E19G12, E29G2a, E29G11, E29G2b, E29G9, E29G7, E40G1a, E40G5, E40G1b, E40G10, and E40G12. These isolates were selected for further evaluation of their effects on S. hermonthica germination inhibition in vitro. Majority of the selected isolates did vary in their HCN and IAA production abilities. Some strong producers of HCN were comparably moderate and weak producers of IAA and vice versa. A few isolates, however, showed similarity in their HCN and IAA production. Two isolates, namely E19G12 and E29G7 were strong producers of both HCN and IAA in common.
Determination of germination percentage of S. hermonthica
-
In this study, the germination test for S. hermonthica resulted in 63% germination upon conditioning the seeds for 10 d and treating with GR-24, a synthetic germination stimulant.
In vitro evaluation of the effects of selected isolates on GR-24 induced germination of S. hermonthica
-
In this study, bacterial isolates were evaluated for their effects on Striga germination/inhibition in vitro. The results of the assay showed that significant differences (p < 0.001) were observed between some isolates on the effects of rhizobacteria isolates on GR-24 induced S. hermonthica germination in the filter paper (Figs 2 & 3). Regardless of considerable variation in their inhibition effects, all isolates showed a significant reduction in germination percentage compared to the control (broth treatment). But, the extent of germination inhibition varies from 9 to 59.7 mean germination percentage.
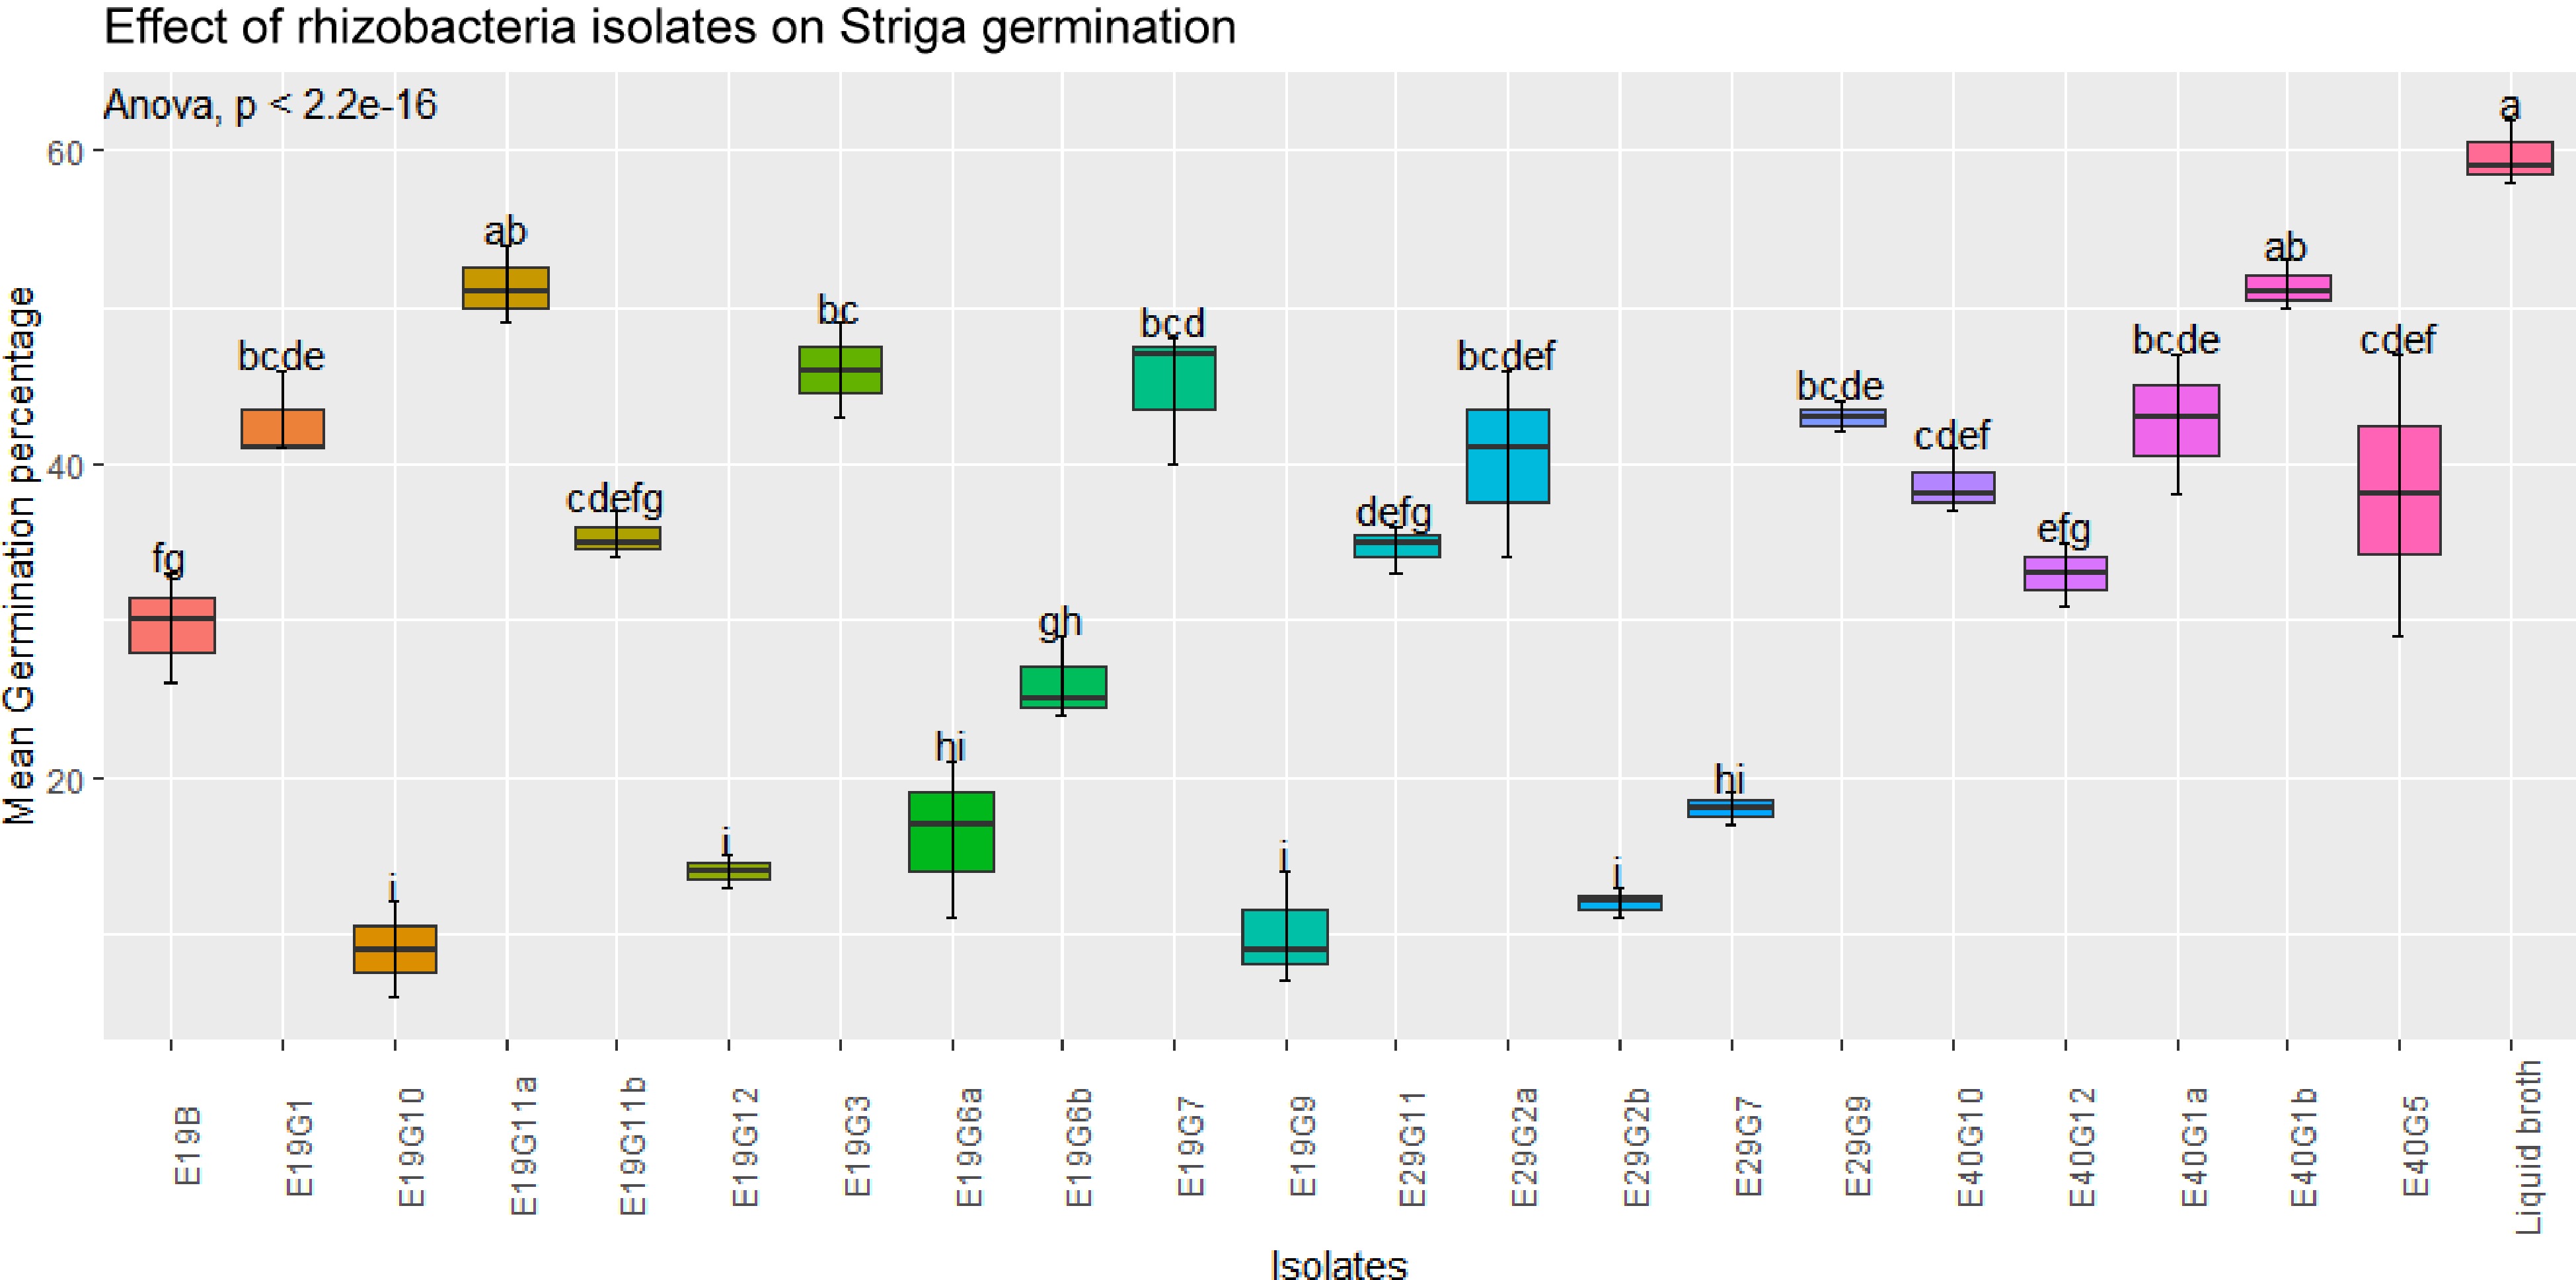
Figure 2.
Effect of rhizobacteria isolates on GR-24 induced S. hermonthica germination in filter paper assay. Values are means of combined data of three replicates each. Means followed by the same letter are not statistically different at p ≤ 0.05 according to the Tukey-test.
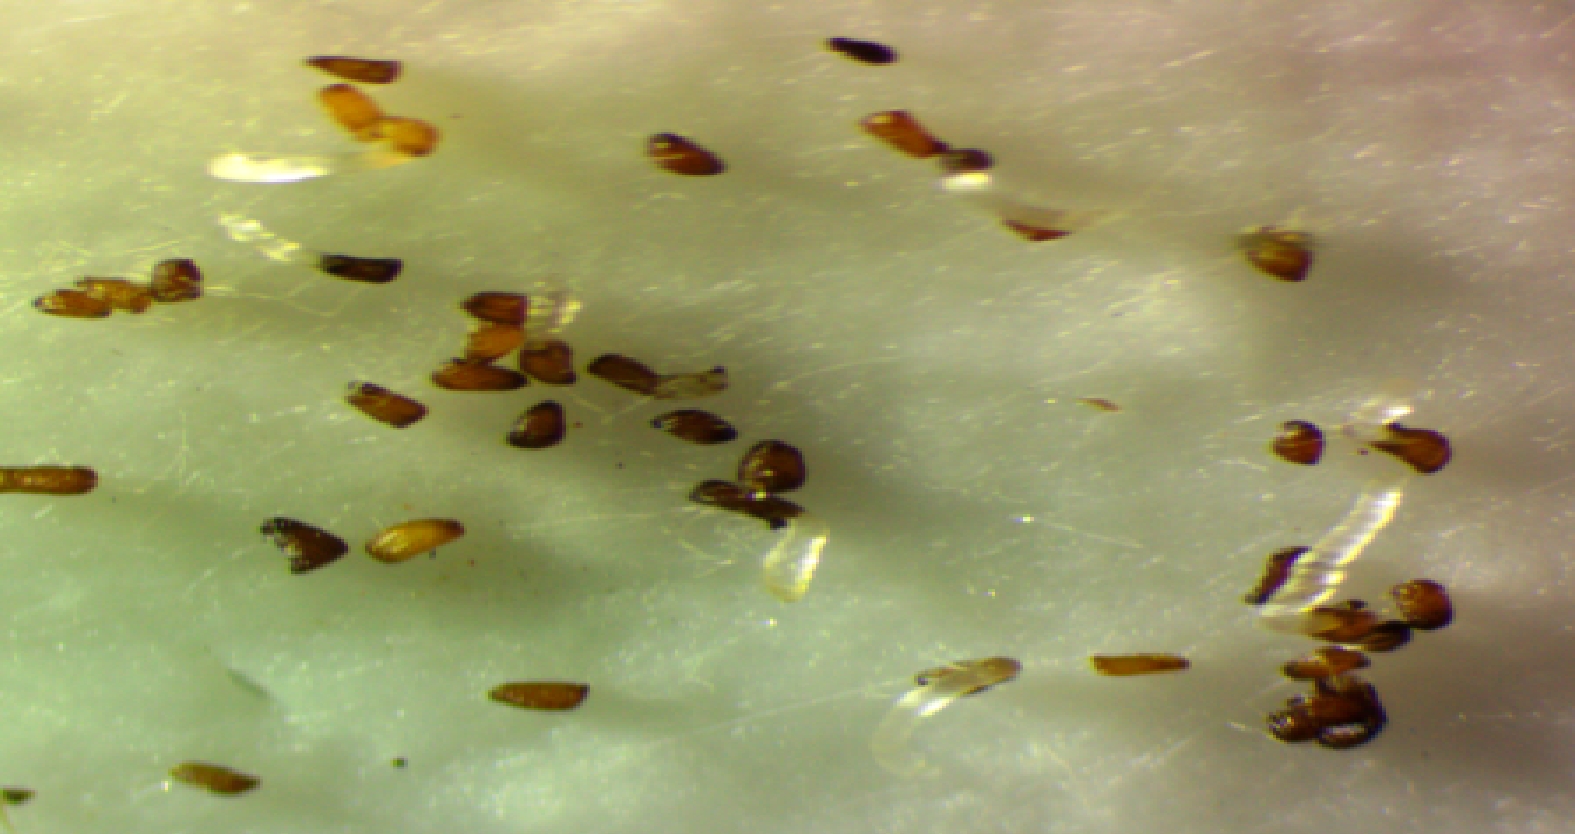
Figure 3.
Glass fiber filter paper based S. hermonthica germination assay.
Evaluation of the effects of selected isolates on S. hermonthica seed germination in the presence of susceptible host
-
This was an activity done as an alternative to the greenhouse evaluation to see whether there are similar or different trends compared to the evaluation using GR-24 as a stimulant. The study indicated that the germination of Striga in the presence of host plant was lower than that of GR-24 induced germination in all treatments. There was significant difference (p < 0.001) in mean germination percentage among isolates (Figs 4 & 5).
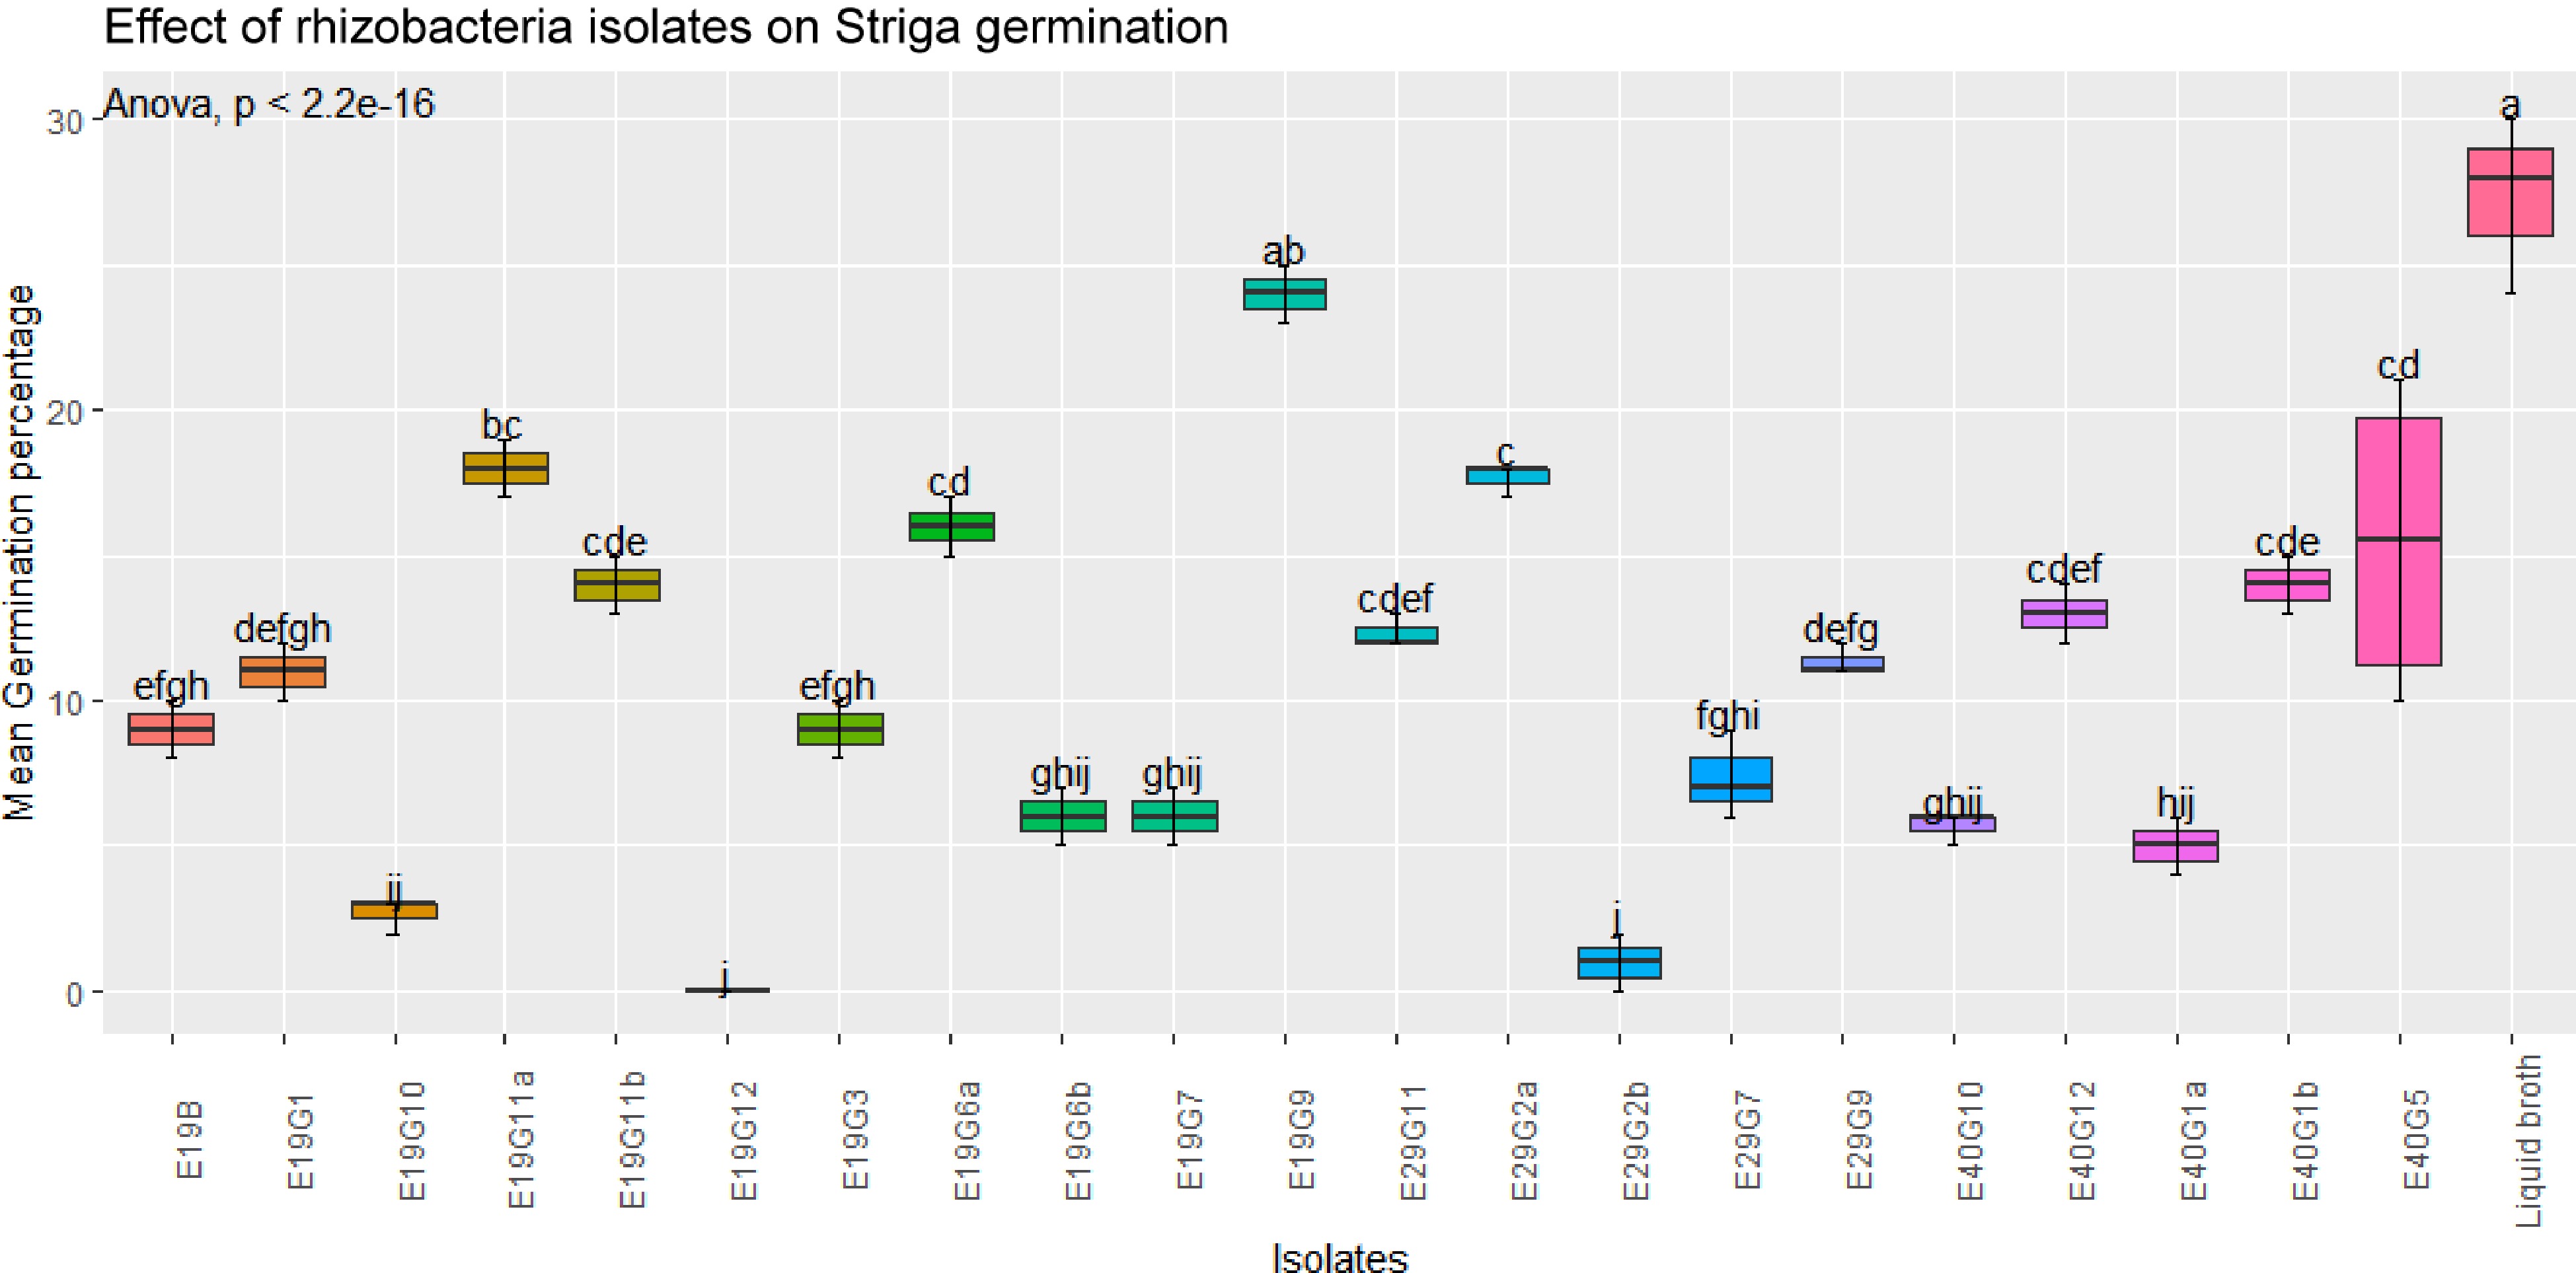
Figure 4.
Effects of rhizobacterial isolates on S. hermonthica seed germination in the presence of susceptible host plant.Values are means of combined data of three replicates each. Means followed by the same letter are not statistically different at p ≤ 0.05 according to the Tukey-test.
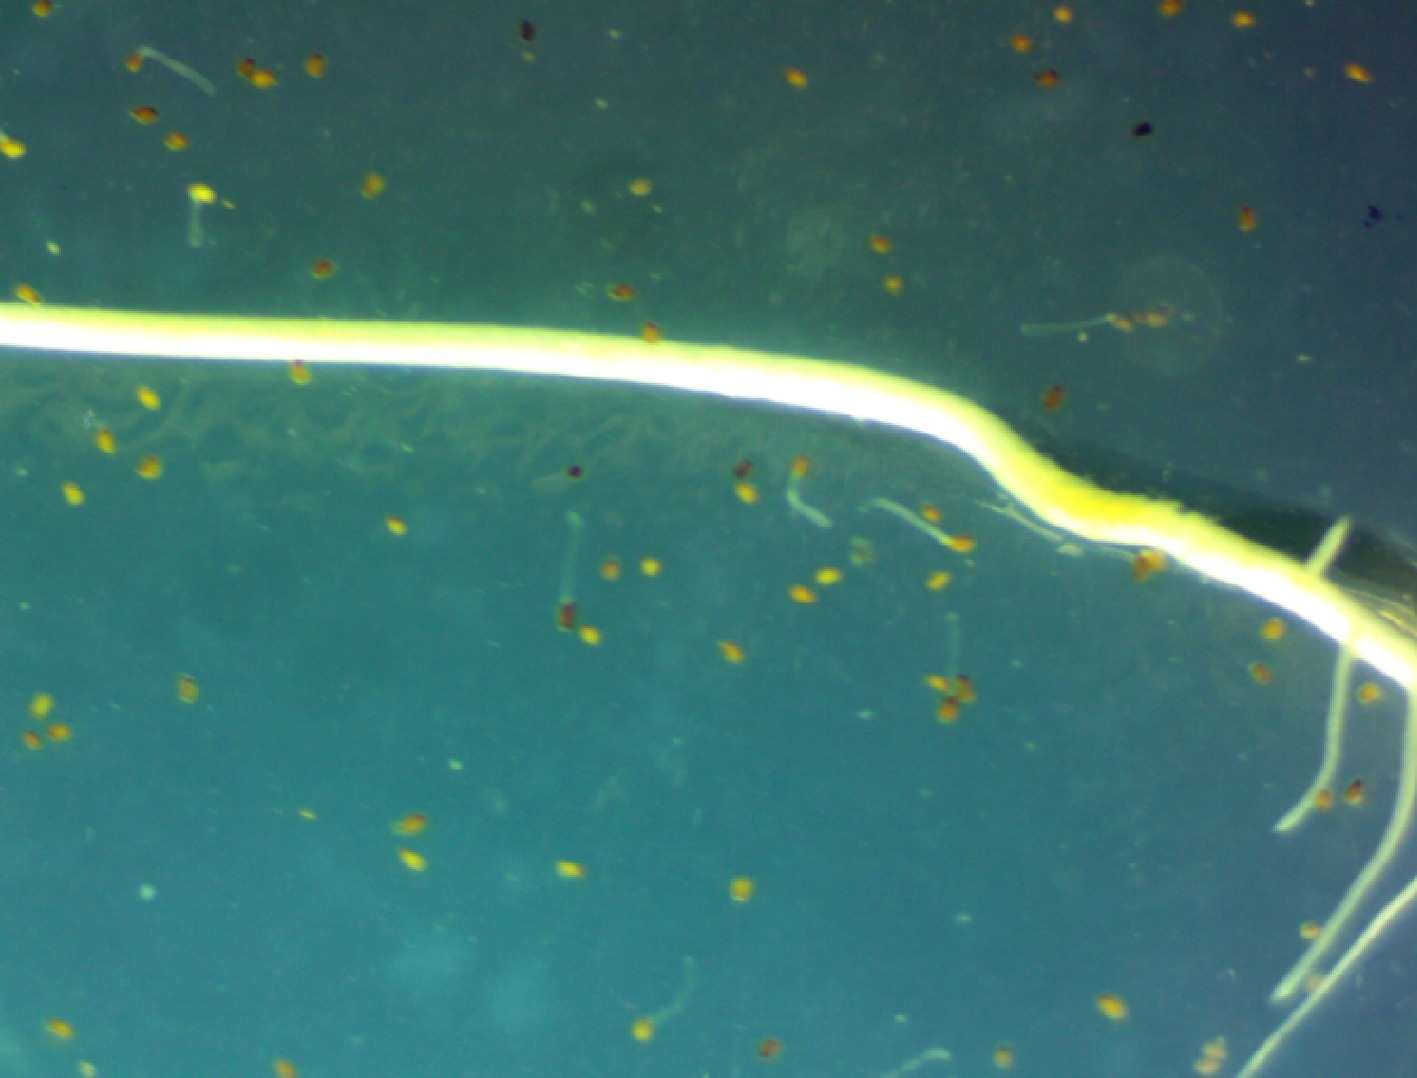
Figure 5.
Striga seed germination using agar gel assay.
A few isolates showed increased germination of S. hermonthica seeds, while many of them showed a significant suppression of S. hermonthica seed germination (p < 0.001) compared to control treatment (broth). The highest germination percentage (27%) were recorded in the control (blank broth treated seeds), followed by isolates E19G9 (24%) and E40G5 (20%). Treatment of S. hermonthica seeds with isolates E19G12, E29G2b, and E19G10 resulted in the lowest S. hermonthica seed germination of 0% 1%, and 2.7% respectively, which were significantly lower than any of the treatment (Fig. 4). Germination inhibition followed an almost similar pattern to the treatments without the presence of host plant except that treatment with the synthetic stimulant GR-24 caused an elevated germination percentage compared to treatment in the presence of host plant sorghum.
Regarding mean germination percentage in the absence of host plant, eight isolates, namely, E19G6a, E19G9, E19G6b, E19G10, E19B, E19G12, E29G2b, and E29G7 showed significant inhibition of S. hermonthica germination as indicated by low mean germination percentage, 16, 10, 26, 9, 29.7, 14, 12 and 18, respectively. Similarly, some isolates that have indicated high Striga germination inhibition in the absence of host plants also showed reduced germination in the presence of host plants although not correspondently or in the same pattern. There was also no consistent pattern in all isolates and parameters evaluated in association with various sorghum genotypes from where they have been isolated and the three soil types. But, majority of the bacterial isolated from the soil of low Striga infested site (E29) potentially inhibited Striga germination in the absence of host plant.
Morphological and biochemical characterization and identification of the most effective rhizobacteria isolates
-
Finally, upon in vitro evaluation, eight efficient rhizosphere bacteria isolates with different Striga suppressive effects were further morphologically and biochemically characterized for gram reaction, colony color, size, shape, margin, elevation, sugar utilization ability, catalase and methyl red test. Accordingly, 6 (75 % ) of the rhizosphere bacteria inhibiting Striga germination were found to be gram negative, 2 (25%) gram positive, 4 (50%) glucose positive, 7 (87.5% ) fructose positive, 2 (25%) sucrose positive, 6 (75%) methyl red positive, 6 (75%) catalase positive (Tables 2 & 3).
Table 2. Morphological characterization and identification of the most effective rhizobacteria isolates.
Isolates Morphological characterization Pigment Shape Size Elevation Margin Gram staining E19G6a White Circular Medium Raised Entire – E19G9 White Circular Medium Raised Entire – E19G6b Brown Circular Medium Raised Entire + E19G10 White Circular Medium Raised Entire – E19B Brown Irregular Large Raised Flat – E19G12 Brown Circular Medium Raised Entire + E29G2a White Irregular Large raised Mucoid – E29G7 White Circular Medium Raised Entire – + = Positive for a given test, – = Negative for a given test under consideration. Table 3. Biochemical characterization of the most effective rhizobacteria isolates.
Isolates Biochemical tests Glucose Fructose Sucrose Catalase Methyl red Tentative identification E19G6a + + – + + Pseudomonas sp. E19G9 – – – + + Pseudomonas sp. E19G6b – + – + + Bacillus sp. E19G10 + + + – – Klebsiella sp. E19B + + – + + Pseudomonas sp. E19G12 – + – + + Bacillus sp. E29G2a – + + – – Entrobacter sp. E29G7 + + – + + Pseudomonas sp. – = no sugar utilization, catalase and methyl red negative, + = sugar utilization, catalase and methyl red positive. Based on the comparative analysis of various morphological and biochemical characteristics, the bacterial isolates are identified to fall under four genera: Bacillus, Pseudomonas, Enterobacter and Klebsiella. Among the bacterial genera, four were Pseudomonas, two Bacillus, one Enterobacter and one Klebsiella (Table 3).
-
The potential of growth suppressive effects of rhizobacteria and their possible use as a biological control options in the management of S. hermonthica have been investigated to be agriculturally important to boost crop productivity[16,27]. A group of microorganisms with potential as biological control agents of weeds are the deleterious rhizosphere inhabiting bacteria (DRB) characterized as nonparasitic rhizobacteria colonizing plant root surfaces and being able to suppress plant growth[28−30]. Rhizosphere is the zone at the interface of soil-plant roots that harbors the most complex microbial communities[29,31]. The deleterious activity toward weed seed viability and seedling growth by most microorganisms under study for biological control is due to the production of phytotoxins. The common metabolites produced in the rhizosphere of plants that can be phytotoxic at higher than physiologic concentrations include the auxins and hydrogen cyanide[32].
HCN producing rhizobacteria have been known to act as biocontrol agents against weeds[33]. In this study, 117 rhizobacteria isolates were tested for HCN production and 47 (40.2%) were capable of producing HCN with different levels. Out of which, 11 (23.4%) isolates were strong producers, 15 (31.9%) were moderate producers and 21 (47%) were low or weak producers of hydrogen cyanide. Heydari et al.[34] conducted a similar study on weed germination inhibition potential of rhizosphere Pseudomonas and obtained 37% capability of HCN production of isolates and this capacity was different among the strains. According to the study by Kremer & Souissi[35], rhizobacteria such as Pseudomonads are known for their ability to produce HCN, but the quantity produced varies widely among species and strains of the bacterium.
It has been reported by Knowles[36] and Schippers et al.[33] that glycine is a direct precursor of HCN found in root exudates though several factors significantly influence its production across bacteria. For example, the level of HCN produced in root-free soil by P. putida and A. delafieldii generally increased with higher amounts of supplemental glycine, with P. putida typically generating more HCN at a given glycine level[37,38]. Studies have shown that HCN is a potential inhibitor of enzymes involved in metabolic processes like respiration, CO2 and nitrate assimilation, and carbohydrate metabolism. Hence, this gas is known to negatively affect root metabolism and root growth[33,39]. Furthermore, cyanide interacts with the protein plastocyanin, which inhibits the photosynthetic electron transport[35].
Many authors reported on the potential of cyanogenic rhizobacteria for weed suppression by producing HCN and the role they play in biological control of weed[40]. Cyanide producing rhizobacteria are specific in their actions and they do not generally negatively affect the host plants. A major group of rhizobacteria producing secondary metabolite hydrogen cyanide and with potential for biological control is the Pseudomonas[28,41]. Rhizosphere bacteria particularly, Pseudomonas spp. have the ability to reduce weed growth and they were proved to produce HCN. Pseudomonads isolated from rhizosphere of velvet leaf were able to reduce velvetleaf viability and emergence significantly[42,43].
The production of the IAA phytohormone is another common trait of rhizobacteria[44,45]. Indole-3-acetic acid (IAA) is the major naturally occurring auxins which influences the root and shoot growth of the plant, stimulating ethylene production, cell division and differentiation. The rate of production of ethylene is directly proportional to the concentration of IAA[46,47]. It has been noted that 80% of rhizospheric bacteria produce IAA by metabolizing L-tryptophan[48]. Rhizosphere-inhabiting soil microbes synthesize and release auxins as secondary metabolites because of rich supplies of substrates exuded from plant roots. Some microbes produce auxins in the presence of enough precursor molecules such as tryptophan[44,49].
The current study has shown that 46.8% of the tested isolates were capable of producing IAA. Similar study has been conducted by Idris et al.[50] on growth promotion of rhizobacterial isolates from the rhizosphere of sorghum and grasses in Ethiopia and South Africa and found 73% production of IAA in tested isolates in the presence of tryptophan. The authors further noted the tendency of decreasing IAA concentration in the absence of tryptophan. The lower number of IAA producers in this study than the previous report could be due the difference in sorghum varieties from where the rhizobacteria isolated and other factors in the soil.
Similarly, the report on the study of the effects of rhizobacteria on plants indicated their use as bioherbicides to control weeds[51]. Rhizosphere microorganisms mediated suppression of plant growth during interaction is linked to the secretion of secondary metabolites from microorganisms[52]. Detection of Enterobacter sp. found significant amount of IAA secretion due to the presence of an increased activity of tryptophan deaminase, an enzyme which produces IAA from its precursor molecule tryptophan[53]. The negative effect of IAA is associated with the elevated levels of IAA production[54] For example, Patten & Glick[55] demonstrated the role of accumulated production of IAA by P. putida and its effects in inhibition on plant growth. The increased IAA production stimulates biosynthesis of ethylene by the enzyme aminocyclopropane-1-carboxylate (ACC)[56]. IAA producing Enterobacter sp also showed to inhibit lettuce plant growth and enhanced ethylene synthesis[57].
Prior to conducting any germination assay, seed viability test and knowing its percentage of germination are fundamentally important to use it in the subsequent experimentation. In the current study, S. hermonthica seed viability test resulted in 63% germination percentage on conditioning the seed in benomyl solution for 10 d and treating the seed with a synthetic germination stimulant GR-24. This agrees with a previous report[22] which suggested that the germination percentage of Striga seed has to be at least 30% for downstream application of the seed and[18] indicated 55%−57% germination induction by GR-24 in seed condition in water in testing Striga seed germination.
Isolation of weeds inhibiting rhizobacteria was made from sorghum rhizosphere and the mechanism involved in weed inhibition of Striga seed germination inhibition was undertaken to identify potential Striga suppressive rhizobacteria associated with the host plant sorghum. In vitro evaluation of the effects of inoculation of bacterial isolates on the inhibition of S. hermonthica was studied under laboratory bioassay. This technique was developed for the selection of bacteria inhibitory to the germination of S. hermonthica seeds in such a way that adequate contact between the bacteria and S. hermonthica seeds was ensured without the bacterial culture medium itself inhibiting S. hermonthica seed germination. The study focused on germination inhibition at the early stage of S. hermonthica and generated information to develop reliable and accessible Striga control strategies for small holder farmers.
There was considerable variation in the inhibition of Striga germination by bacterial isolates obtained from sorghum rhizosphere grown on soil collected from different sites. The lowest (9%) and highest (59.7%) germination percentage was observed in E19G10 and broth (control treatment), respectively. A similar study on rhizobacterial strains for suppression of germination of S. hermonthica[13] found a wide range of results (13%−50% germination of S. hermonthica seeds). Our study indicated the potential of rhizosphere bacteria in inhibiting the early stages of S. hermonthica development. This helps to reduce much of the damage caused by Strigas before emerging above the ground.
The study showed variations in the inhibition of Striga germination by isolates obtained from sorghum rhizosphere grown on soil collected from different sites. For example, many of the bacteria isolated from soil E19 (Amhara Region, Oromo Special Zone) significantly reduced the germination percentage of S. hermonthica. Soil E19 was obtained from site 1, where there was low Striga infestation. The low infestation of Striga in the field from where soil E19 was obtained may be associated with Striga germination inhibition by the bacterial population and other factors in the vicinity. Some soils are known to be suppressive to Striga, and their suppression was linked to the microbial populations[58].
On the other hand, isolating E19G11a from the same soil E19 but isolated from the rhizosphere of Striga resistant SRN-39 did not significantly reduce Striga germination. The enhanced germination of Striga by this isolate may be again explained by the nature of the microbiome of the soil. This is consistent with previous findings[13] in which few isolates increased germination of S. hermonthica seeds, others had no effect on seed germination, while some showed a significant suppression of S. hermonthica seed germination compared with the check (no bacterium). Furthermore, it has been previously suggested[59] that both inhibition and promotion of Striga germination can be attributed to microbial action and this can be achieved by manipulation of ethylene biosynthesis, ethylene action, or by promotion of ethylene metabolism or that of its immediate precursor ACC (1-aminocyclopropane-1-carboxylic acid). Generally, there was no consistent pattern in Striga germination inhibition of the soils collected from the three sites. However, many of the isolates collected from site 1 (E19) resulted in low mean germination percentage regardless of the sorghum variety from where the bacteria were isolated.
The use of weed management strategies involving chemical herbicides generally alters soil structure going alongside with changes in the microbial community[40]. Using soil microorganisms to control weeds is an alternative method to herbicides that may reduce dependence on chemical herbicides and increase the use of environmentally sound practices that are easily available to small holder farmers. The soil microbiome plays an important role in the establishment of weeds and invasive plants with which they are associated and build up close relationships. For example, sorghum seedlings [Sorghum bicolor (L) Moench] of different genotypes differ in association with soil microorganisms[60].
Evaluation of the effects of isolates from various sorghum varieties grown on soil collected from different sorghum growing regions in Ethiopia was also conducted in the presence of a host plants called Teshale variety (sorghum) using Agar Gel Assay (AGA). This method helps to overcome the limitations experienced during field evaluation in establishing a uniform environment to study host-parasite interaction, as it happens in a controlled environment laboratory. The method also allows observation of host-parasite interaction at various stages of Striga life cycle[22].
In this study, the lowest (0%) and highest (27%) mean germination of S. hermonthica seeds was obtained in the presence of the host plant. This is much higher than the finding of Ahonsi et al.[13] who obtained the lowest (13%) reduction in germination percentage of S. hermonthica inoculated with bacterial isolates in the presence of host plant sorghum. Similarly, Babalola et al.[18] studied the use of rhizobacteria to control S. hermonthica and observed the inhibition of Striga germination by bacterial isolates. The germination inhibition of bacterial isolates could be associated with a direct effect of the isolates on the seed or indirectly via the production of chemicals that are toxic to seeds, inhibitors/ promoters of ethylene biosynthesis or its action[12,61,62].
Furthermore, the study demonstrated that the control (broth) treatment in the presence of host plant resulted in the highest mean germination percentage, but it was still lower than GR- 24 induced germination percentage of seeds in the absence of host. This finding agreed with the study by Barillot et al.[17] on the effectiveness of GR-24 in S. hermonthica seed germination stimulatory activity.
Morphological and biochemical characterization of the most effective shortlisted isolates in vitro evaluation finally resulted in four different genera of bacteria: Pseudomonas, Bacillus, Klebssiella and Eentrobacter (Table 3). A variety of rhizobacteria, including Bacillus[63], Pseudomonas[64], Azospirillum[65] species are commonly found in the rhizosphere of crops. The study indicated that majority of the isolates were strong producer of HCN and IAA and deduced to belong to the Pseudomonas genera. This agrees with a previous report[41] that HCN production is found to be a common trait of Pseudomonas (88.89%) and Bacillus (50%) in the rhizospheric soil and plant root nodules.
Pseudomonas is among the common plant root inhabiting soil bacteria[66]. Rhizobacetria genera including Pseudomonas sp., Klebsiella oxytoca and Enterobacter sakazakii were also shown to inhibit S. hermonthica seed germination[67].
-
The results of this study have revealed that there are novel rhizobacteria with a great potential of inhibiting Striga seed germination resulting in reduction of parasitic infestation on sorghum. This potential can be exploited by isolating and characterizing rhizospheric bacteria associated with sorghum and evaluating their Striga suppressive effects. The suppression effects of rhizobacteria on Striga seed could be associated with microbial production of phytotoxic secondary metabolites and inhibitory chemicals such as HCN and IAA that could induce a biocontrol effect. Many of the isolates with most effective Striga suppression were obtained from low Striga infested field (E19) indicating that rhizospheric bacteria could contribute to the reduction in parasitic infestation. It has been also shown that, regardless of the level of inhibition, all rhizobacterial isolates suppressed Striga germination up on in vitro evaluation in the presence and absence of host plant sorghum. The most effective Striga suppressive isolates were identified under four bacterial genera and the majority of them belong to the Pseudomonas genus. The isolates are good candidates for addressing Striga associated constraints in sorghum production where there is a low input for small holder farmers in Ethiopia.
-
The authors confirm contribution to the paper as follows: study conception and design: Tulu US, Abera S, Haileselassie T: experiments and statistical analysis: Tulu UT; draft manuscript preparation: Tulu UT, Haileselassie T, Tessema T. All authors read and approved the final manuscript.
-
The datasets used and analyzed during the current study are available from the corresponding author on reasonable request
-
We thank the National Agricultural Biotechnology Research Center and its staff for helping with the provision of facilities during the study. We are also grateful to the Ethiopian Institute of Agricultural Research for facilitating this research from sample collection to laboratory analysis of the evaluation of the isolates.
-
The authors declare that they have no conflict of interest.
- Supplementary Table S1 List of soil samples used in the study based on their collection Regional States and zones.
- Supplementary Table S2 Bacteria isolates obtained from soils collected from different sorghum growing areas in Ethiopia during cropping season.
- Copyright: © 2024 by the author(s). Published by Maximum Academic Press, Fayetteville, GA. This article is an open access article distributed under Creative Commons Attribution License (CC BY 4.0), visit https://creativecommons.org/licenses/by/4.0/.
-
About this article
Cite this article
Tulu UT, Haileselassie T, Abera S, Tessema T. 2024. Screening and identification of potential Striga [Striga hermonthica (Del.)] suppressing rhizobacteria associated with Sorghum [Sorghum bicolor (L.) Moench] in Northern Ethiopia. Technology in Agronomy 4: e013 doi: 10.48130/tia-0024-0008 

Screening and identification of potential Striga [Striga hermonthica (Del.)] suppressing rhizobacteria associated with Sorghum [Sorghum bicolor (L.) Moench] in Northern Ethiopia
- Received: 25 December 2023
- Revised: 21 March 2024
- Accepted: 07 April 2024
- Published online: 04 June 2024
Abstract: Sorghum (Sorghum bicolor (L.) Moench) is one of the globally important cereal crops well adapted to Sub-Saharan Africa (SSA) agro-ecology. However, the productivity of sorghum is hindered by both abiotic and biotic factors including drought, Striga, insect pests, poor soil fertility, and diseases. Among the constraints, Striga (genus), also called witch weed, is the most important production problem in the area. Although there have been various control methods practiced for years, none of these have been practically effective in eradicating Striga, neither are they easily accessible for small holder farmers, while some are also not environmentally friendly. Therefore, this study was designed with the objective of identifying potential Striga suppressing rhizobacteria associated with sorghum. Treatment of S. hermonthica seeds with isolates E19G12, E29G2b and E19G10 resulted in the lowest S. hermonthica seed germination of 0%, 1%, and 2.7% respectively, which were significantly lower than any of the treatments. Mean germination percentage ranged from 9 to 59.7 and 0 to 27 in the absence and presence of host plants, respectively. The results showed a statistically significant germination inhibition (p < 0.001). Finally, the most effective isolates were shortlisted, E19G6a, E19G9, E19G6b, E19G10, E19B, E19G12, E29G2a, and E29G7 were morphologically and biochemically identified to belong to the genera of Pseudomonas, Klebssiella, Bacillus and Entrobacter. The results of the study demonstrated the existence of promising soil-borne bacteria that could be exploited as bioherbicides to control Striga infestation on sorghum provided that broader samples from various parts of the country are explored.
-
Key words:
- Bioherbicides /
- Germination inhibition /
- Rhizosphere /
- Striga infestation /
- Susceptible host