


-
Intensive agricultural practices driven by burgeoning population has led to extensive use of chemical fertilizers and pesticides causing severe environmental pollution Crop loss due to diseases coupled with evolving pesticide resistance and frequent breakdown of host plant resistance are major problems all over the world warranting an alternative strategy for the management of the evolving pathogens[1,2]. This necessitates a strategy that could manage plant growth and alleviate stress with minimum damage on environment and humans. Antagonistic and phyto-stimulant activities by micro-organisms called plant growth promoting rhizobacteria (PGPR), currently including rhizosphere fungi too, resident in the soil may hold a great promise for sustainable agriculture[3]. Selective manipulation and augmentation of these specialized microbial societies offer a successful strategy to manage plant diseases and improve plant growth in the most sustained and eco-friendly manner[4]. These rhizobacteria exert antimicrobial activity by direct parasitism, secreting bioactive molecules suppress disease-causing pathogens and sometimes serve as antibiotics, vitamins, and other molecules of industrial importance[5]. Bacterial strains from native rice soils of India viz., B. velezensis Strain BIK2, B. cabrialesii Strain BIK3, and B. paralicheniformis Strain BIK4 used in the study have shown dominant antagonistic properties[6,7], improving soil[8] and improving plant vigor, enhancing root and shoot growth in rice[7,9]. These bacteria exist as both free-living and endophytic in rice, resistant to several antibiotics, and compatible with an effective biocontrol agent, Trichoderma asperellum[8].
Bacillus spp. are a class of endospore-forming, gram-positive bacteria that have evolved to produce various potent secondary metabolites essential for their survival[10]. Their significance in agriculture lies in their ability to form highly resilient endospores, facilitating their storage as dry powders with extended shelf lives[11]. The secondary metabolites they produce play a vital role in improving plant growth, stimulate plant immune response against phytopathogens, and facilitate soil nutrients available to plants[12]. B. cabrialesii and B. velezensis are effective, free living or endophytic bacterium that promote plant growth and antagonistic against many plant pathogens and nematodes[11,13,14]. While B. paralicheniformis, akin to B. licheniformis, finds industrial applications in enzyme and antibiotic synthesis, as well as various biochemical and consumer products[10,15].
Thorough in-vitro, in-vivo, and field trials of BIK2, BIK3, and BIK3 strains have demonstrated significant plant growth-promoting and biocontrol effects against major rice pathogens such as Rhizoctonia solani, Ustilaginoidea virens, Sclerotium oryzae, and Xanthomonas oryzae pv. oryzae. These native strains have been extensively tested across various field conditions, that includes institute trial and farmers' fields. These studies have consistently shown the biocontrol efficiency of the isolates in the field conditions, supporting the practical applicability of these bioagents in diverse agricultural environments[8,9,16]. In this study, the focus is on whole genome comparison of these three native strains viz., BIK2, BIK3, and BIK3 in terms of their genome composition, virulence and antibiotic resistance, production of secondary metabolites, and their potential benefits to facilitate plant growth, resistance against plant pathogens and tolerance against abiotic stress. With the use of sophisticated bioinformatics tools, post-sequencing analysis of a large amount of data generated provides a meaningful interpretation of DNA sequence. This manuscript aims to answer the following questions:
What are the genetic probabilities of these bacterial strains in producing secondary metabolites of agricultural and other uses?
What are the target genes in native bacterial isolates for establishing beneficial relationships with host rice plants?
Do the effectors in the three isolates have unique sequences as compared to other reported isolates that may help as biomarkers?
Can modern bioinformatics tools help identify the phenotypic prospects from the genetic information available?
-
The overall workflow for the current study is described in Fig. 1.
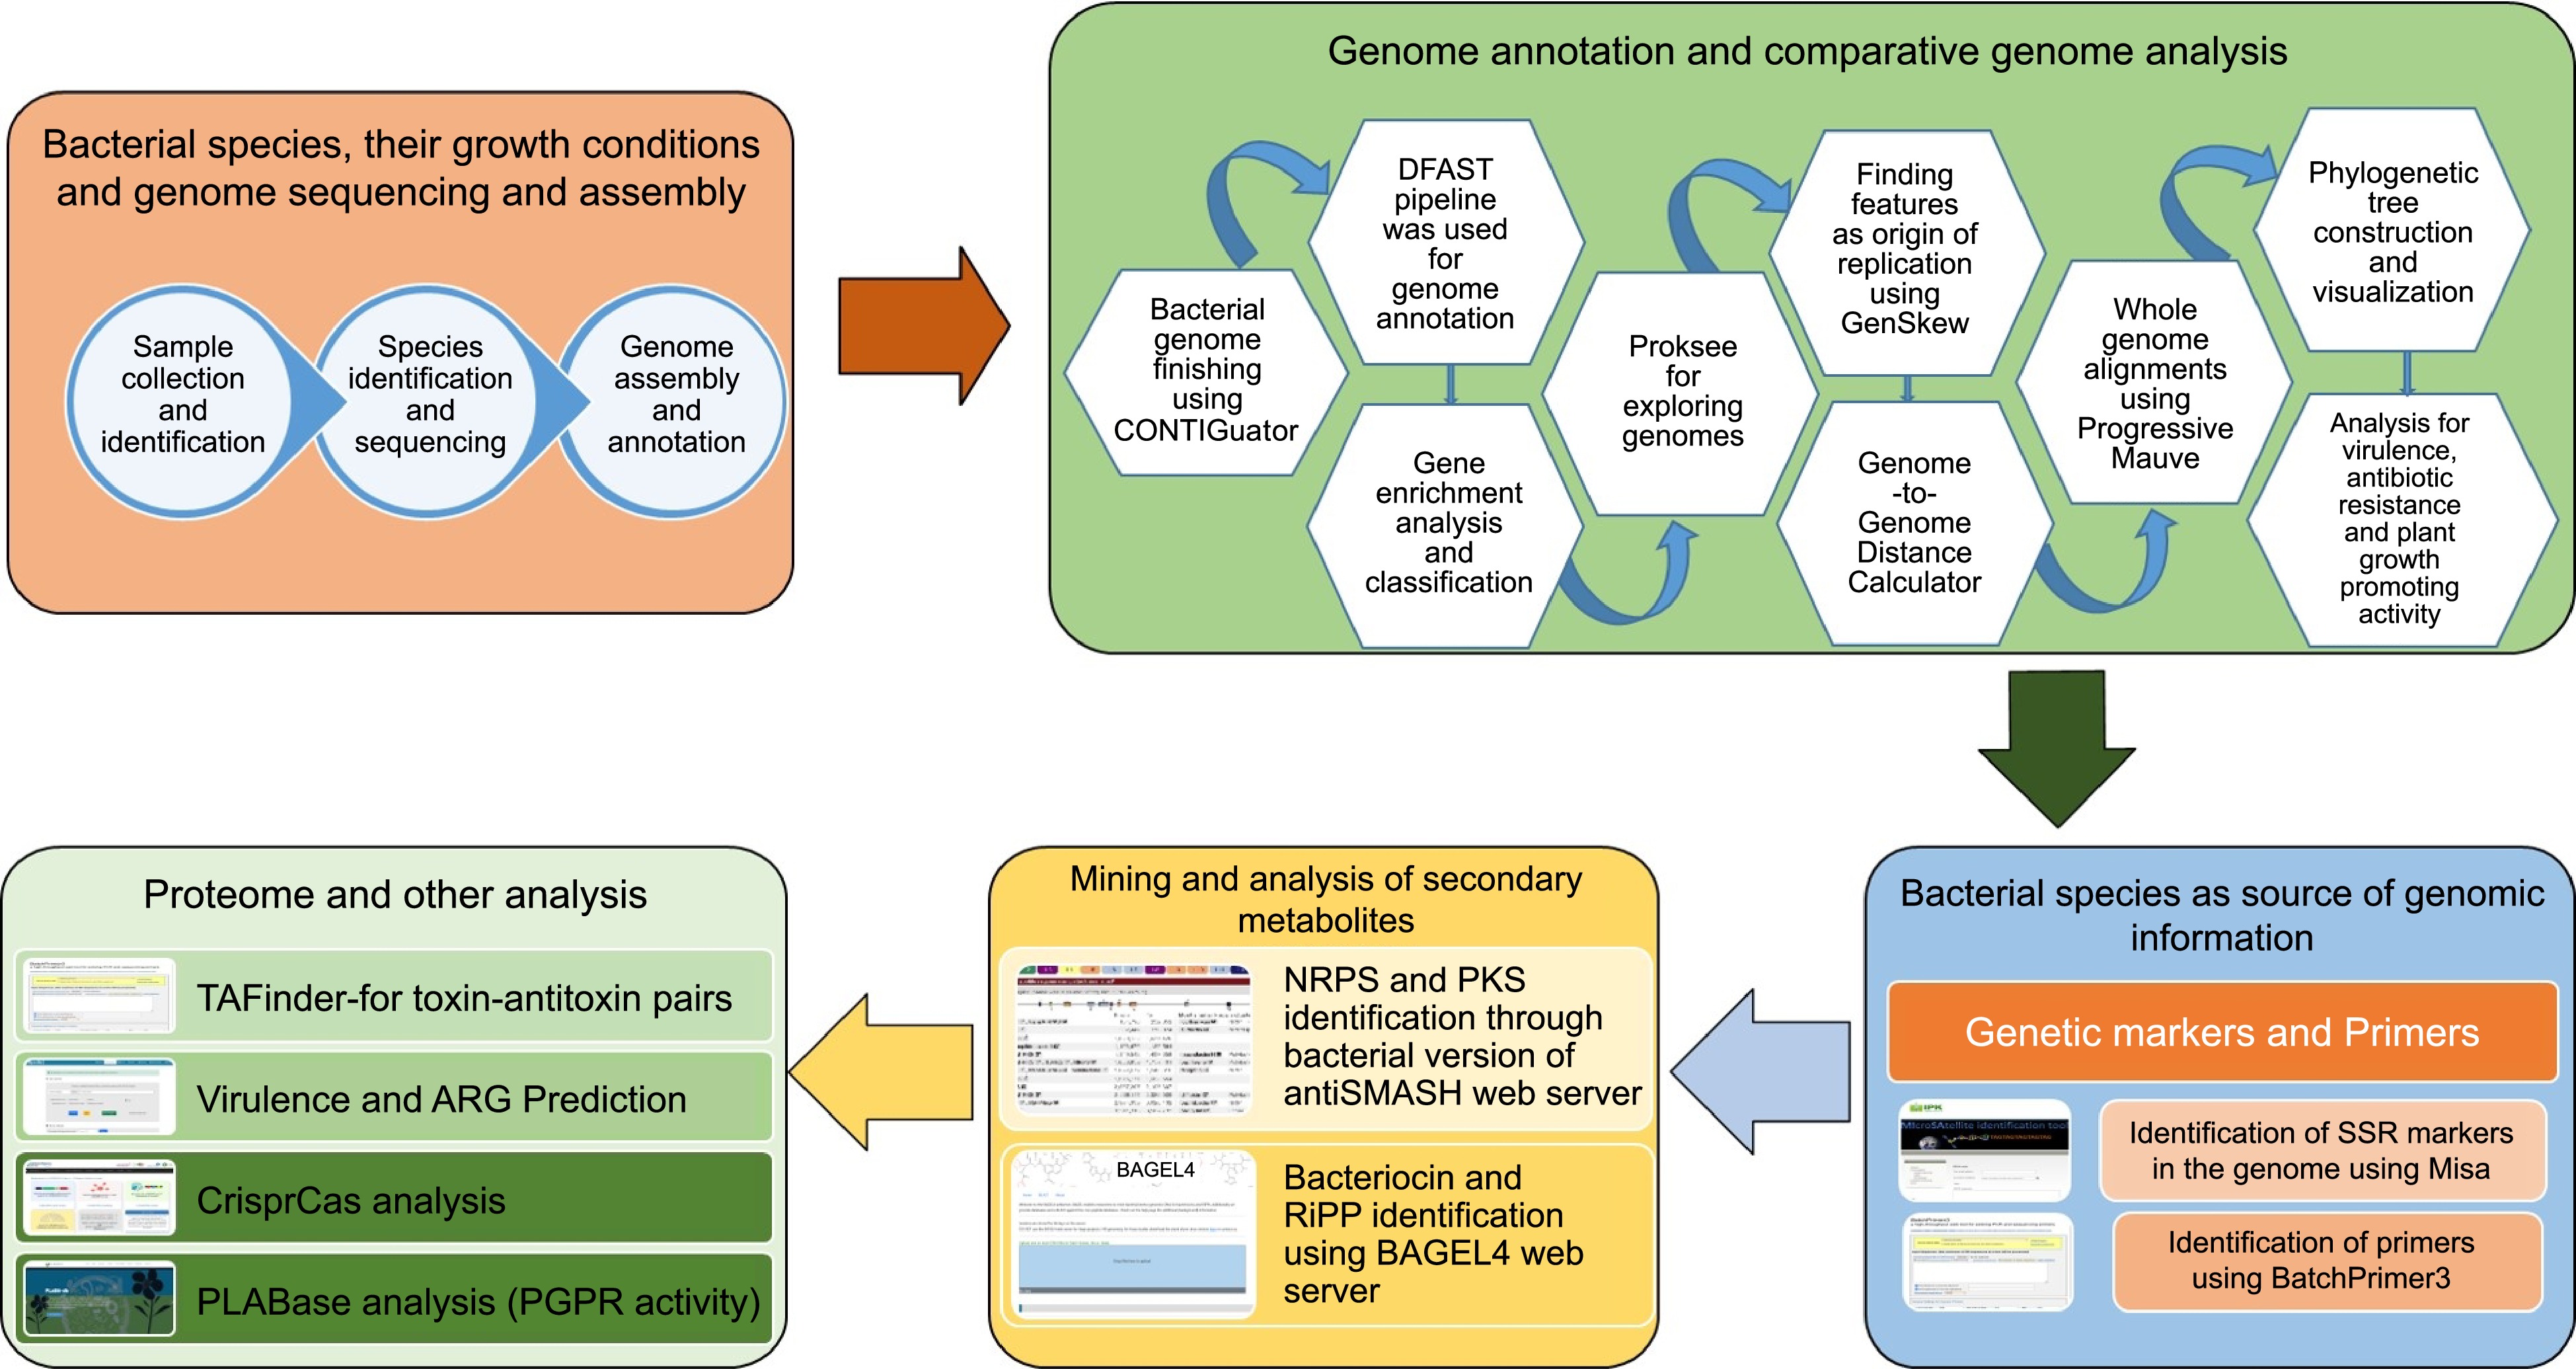
Figure 1.
Overall workflow of the BIK2, BIK3, and BIK3 analysis.
Collection and characterization of the bacterial isolates
-
All the three native isolates of Bacillus were obtained from the culture collections maintained by this group at the ICAR- Indian Institute of Rice Research, Hyderabad, India. The cultures were recorded for their phyto-stimulant and biocontrol activities in rice over 3 years[7−9]. The strains were morphologically characterized and whole genome sequenced using genomic DNA. DNA isolation kit NucleoSpin® microbial DNA kit was used for DNA extraction as per the manufacturer's protocol (Macherey-Nagel, Germany), DNA libraries processed using standard protocols and sequenced using the HiSeq 2500 instrumentation platform (Agri Genome Labs Private Limited, Kochi, India)[7].
Genome annotation and comparative genome analysis
-
The Next-generation sequencing platforms generate vast datasets, with Illumina being a prevalent choice for sequencing and deciphering microbial genomes and being the prevalent platform. Assembly sequences of Bacillus velezensis Strain BIK2 (GenBank assembly accession number GCA_019336145.1), Bacillus cabrialesii Strain BIK3 (GCA_018829645.1), and Bacillus paralicheniformis Strain BIK4 (GCA_019336205.1) were obtained from the NCBI genome portal. Additionally representative sequences for corresponding species i.e., B. velezensis JS25R (GCF_0000769555.1), B. cabrialesii TE3 (GCA_004124315.2), and B. paralicheniformis Bac84 (GCA_002993925.1) were obtained for assessment. By using the online software REALPHY (Reference sequence Alignment based Phylogeny builder) another phylogenetic tress was built with the whole genome sequence datasets of seven Bacillus species other than our three datasets [Bacillus amyloliquefaciens (GCF_022559645.1), Bacillus subtilis (GCF_002055965.1), Bacillus licheniformis (GCF_022630555.1), Bacillus velezensis (GCF_002117165.1), Bacillus cabrialesii (GCF_032461835.1), Bacillus paralicheniformis (GCF_002993925.1), Bacillus cereus (GCF_002220285.1)]. The web-based tool was run with the default parameters that can infer phylogenetic trees from whole genome sequence data. From these alignments multiple sequence alignments will be reconstructed from which phylogenetic trees are inferred via PhyML[17].
Genome finishing using CONTIGuator
-
Genome finishing generates complete and accurate representation of the genome of an organism. CONTIGuator (
https://contiguator.sourceforge.net/ )[18] is the widely used bioinformatics tool that orients the contigs based on a reference genome to infer relative positions of each contig in the draft genome by BIK2, BIK3, and BIK4 draft genomes along with their corresponding reference genomes in fasta format were analyzed with the default parameters.Whole genome alignment
-
Mauve is a powerful software tool designed for whole-genome alignment, facilitating the comparison of orthologous and xenologous regions among two or more genome sequences, even in the presence of extensive local and large-scale changes[19]. This alignment method enables the identification of evolutionary changes in DNA by aligning homologous regions of sequences and identifying their match, rearrangements, and variations. Fasta sequences with a match seed weight of 15, ideal for genomes around 5 MB is set which for analysis of BIK2, BIK3, and BIK4 with reference genomes and other complete genomes (Supplementary Table S1) submitted as input for alignment. By default, a full alignment and iterative refinement option was set for detailed analysis (applies MUSCLE 3.6).
GGDC-Genome-to-Genome Distance Calculator
-
GGDC web server (
https://ggdc.dsmz.de/ggdc.php# )[20] compares the G+C content differences from the species with DNA-DNA Hybridization (DDH) similarities by maintaining a threshold level of 70% similarity between the species boundaries. This web service is used for genome-based species and subspecies delineation. In addition, the GGDC reports the difference in G+C content, which can also be reliably used for species delineation (Supplementary Table S2).Annotation of assembled genomes using the DFAST pipeline
-
Genome sequence files of BIK2, BIK3, and BIK4 scaffolds were submitted in fasta format to the pipeline for further annotation and checked for completeness using 122 Bacillus genomes with 170 markers set. The DFAST (
https://dfast.ddbj.nig.ac.jp/ ) stands for (DNA database of Japan) DDBJ Fast Annotation and Submission Tool was used for this analysis[21]. MetaGeneAnnotator for CDS, Barrnap for rRNA, Aragorn for tRNA, and CRT for CRISPR were used for the structural annotation used. The pipeline analysis resulted in fasta files for genomic, rRNA, tRNA, and protein sequences along with annotation and features files. In addition, FACoP (FACoP (molgenrug.nl)), a supporting system for FUNAGE-Pro[22] to classify genes for Gene Set Enrichment Analysis, was deployed with the supported classes GO, InterPro (IPR), KEGG-orthology KO, KEGG-pathways, eggNOG, COG, and PFAM. Protein sequences obtained from the DFAST annotation file were given as input to the server to perform enrichment analysis and classification (Supplementary Table S3 & S4).Mining for potential bacterial operons
-
GC skew is the difference between guanine (G) and cytosine (C) content in a DNA sequence and is anlyzed using GenSkew. GenSkew is used for identifying potential operons in bacterial genomes based on the analysis of GC skew. Sequences of BIK2, BIK3, and BIK4 scaffolds in fasta format were given as input to WebSkew (
https://genskew.csb.univie.ac.at/webskew ). The output was obtained in a tabular and graphical form. The global minimum and maximum are displayed in the cumulative graph. GenSkew identifies regions where the skew undergoes significant changes, and these changes are indicative of the boundaries of potential operons. The upper and lower bounds of GC-skew can be used to predict the origin of replication (minimum) and the terminus location (maximum) in prokaryotic genomes.Prediction of phenotype
-
PhenDB (
https://phendb.org/ ) is a bacterial trait identification interface based on comparative genomics, first predicts protein-coding genes in the given genome and then checks the completeness of the genome along with the prediction of marker genes in the orthologous groups of proteins (ENOGS) followed by the trait prediction using PICA. The submission form was filled with the scaffolded sequences of BIK2, BIK3, and BIK4 in fasta format for the prediction of phenotype. We used 0.75 as the balanced accuracy cut-off and 0.6 as confidence cut-off for predictions (Supplementary Table S5).Prediction for combat capabilities
-
Diverse mobile genetic elements in our bacterial genome in in fasta sequence were identified using VRprofile2 (
https://tool2-mml.sjtu.edu.cn/VRprofile/ )[23]. This helped us to predict mobilome, possible mobilome interactions, and bacteria-mobilome-antibiotic resistance genes (ARGs) relationships. The pipeline includes the prediction of integron using IntegronFinder, SCCmec detection using SCCmecFinder, BLASTp for transposase (TnpA) and resolvase (TnpR) searches against TnCentral and TnRegistry databases (Supplementary Table S6).Determination of CRISPRS
-
In silico characterization of CRISPR-Cas system on bacterial genomes is essential for understanding adaptive immunity. The CRISPRloci (
https://rna.informatik.uni-freiburg.de/CRISPRloci/Input.jsp ) provides an automated and comprehensive in silico characterization of CRISPR-Cas system on bacterial genomes including CRISPR array orientation, detection of conserved leaders, Cas gene annotation, and subtype classification[24]. The scaffold genomic sequences of BIK2, BIK3, and BIK4 in fasta format were submitted to the server to identify the CRISPR-Cas genes. The server confirms the completeness of the genome and was set to identify the following viz., IS elements, degenerated repeat candidates on both ends of the CRISPR array candidate with range of 21 and 55 for repeat length and range of 18 and 78 for spacer length in the predicted array. To predict the Cas genes, ERT was used to assign the subtype of the identified CRISPR cassettes as well as to estimate the normalized bit scores of potentially missing proteins in the identified CRISPR cassettes (Supplementary Table S7).Digging for secondary metabolites (SM)
-
The bacterial version of antiSMASH (Antibiotics & Secondary Metabolite Analysis Shell) (
https://antismash.secondarymetabolites.org/#!/start )[25] was used under strict detection mode for identification and annotation, of genes and gene clusters of secondary metabolites in BIK2, BIK3, and BIK4 genomes. It integrates and cross-links with a large number of in silico secondary metabolite analysis tools (Supplementary Table S8).For additional information, the BAGEL4 webserver (
http://bagel5.molgenrug.nl/ ) (BActeriocin GEnome mining tool)[26] was used to extract bacteriocins and other ribosomally synthesized and post-translationally modified proteins from BIK2, BIK3, and BIK4 genomes given fasta sequences as input.Modeling three-dimensional structures of SM
-
The amino acid sequences of secondary metabolites in fasta format were used to search for homologous sequences and based on their structures, allowed us to predict the structure model of our molecules. SWISSModel (
https://swissmodel.expasy.org/ ) which is a homology-based structure prediction server is used of this analysis. The models were evaluated by the server for structure quality and QMEAN scores were considered for model evaluation.Prediction of binding sites of SM
-
The amino acid sequences of all the secondary metabolites from BIK2, BIK3, and BIK4 in fasta format were submitted to the DisoRDPbind webserver (
http://biomine.cs.vcu.edu/ ) that predicts RNA-, DNA-, and protein-binding residues located in the intrinsically disordered regions in a given protein sequence. The server performs analysis based on the information extracted from the physiochemical properties of amino acids, sequence complexity, putative structure and disorder, and sequence alignment.Proteome analysis
Prediction of secreted proteins and protein secretion systems
-
EffectiveDB (
http://effectivedb.org ) is an online reference library that contains pre-calculated information of bacterial-secreted proteins and intact secretion systems[27]. This includes various tools to recognize Type III secretion signals, conserved binding sites of Type III chaperones, Type IV secretion peptides, eukaryotic-like domains, and subcellular targeting signals in the host. Protein sequences of BIK2, BIK3, and BIK4 in Fasta format were input to the submission form. Effective T3 was allowed to predict Type III secreted proteins based on their signal peptide with a minimal score of 0.9999 and T4SEpre (beta) for Type IV secreted proteins on the amino acid-based C-termini composition with a minimum score of 0.5. Effective CCBD Type III secreted protein on their secretion was allowed with a chaperon binding site. Predator was enabled to predict the subcellular localization of secreted proteins in plants (Supplementary Table S9).Plant growth-promoting genes
-
Plant-interacting bacterial proteins were identified using the PIFAR module from PLant-associated BActeria web resource (PLABase)[28] using blastp + hmmer against the PIFAR protein collection and classification. Annotation of bacterial plant growth-promoting traits (proteins) 'PGPTs' was performed using blast (relaxed mode) and blastp + hmmer (strict) or IMG-KEGG-annotation mapping against the PGPT ontology. The protein sequences of BIK2, BIK3, and BIK4 genomes were submitted to identify the molecules involved in interaction with plants and show plant growth-promoting activity (Supplementary Table S10).
Toxin-antitoxin pairs identification
-
Toxin-antitoxin (TA) systems are the pairs of genes in a toxin system where in a stable toxin impedes the host cell growth by interfering with basic cellular processes and a corresponding unstable antitoxin in the host hampering the toxin activity. The reference TAfinder web server was used (
https://bioinfo-mml.sjtu.edu.cn/TAfinder/TAfinder.php ), which is designed to quickly predict and compare type II TA loci in newly sequenced bacterial genomes. It combines a homologous search module and an operon detection module to enhance the prediction performance. Scaffold sequences of BIK2, BIK3, and BIK4 in fasta format were submitted to identify the pairs with the parameters set as e-value for blast-0.01, e-value for HMMer-1, the maximum length of potential toxin/antitoxin-30 amino acids with maximum distance/overlap of −2 to 150 (Supplementary Table S11).Mining for gene transfer and transposons
-
Proksee (
https://proksee.ca ) converts raw bacterial sequence data into whole-genome assemblies for description and interpretation. Sequences of BIK2, BIK3 BIK4 and their reference genomes JS25R, TE3, and Bac84 respectively in fasta format were submitted as input for displaying features as mobile genetic elements detected by mobileOG-db and categorized as integration/excision, replication/recombination/repair, transfer, stability/transfer/defense, and prophage-specific processes. In addition, a separate track was set to display putative Horizontal Gene Transfer (HGT) events as predicted by Alien Hunter.SSR mining and primer designing
-
MISA v2.1 was employed to generate SSR markers[29] for the BIK2 genome, while Primer3 was utilized for primer design. The process involved running the MISA Perl file alongside the BIK2 CONTIGuator fasta sequence via the command line, resulting in the creation of a statistics file and an SSR file for the BIK2 genome. Minimum numbers of repeats were set as 6, 5, 4, 3, and 3 for unit sizes 2, 3, 4, 5, and 6, respectively.
BatchPrimer3[30] was used to find the possible generic primers for BIK2 with a product size of minimum 200 and maximum 350, primer size of minimum 18 and maximum 22 nucleotides, primer temperature is a minimum of 58 and maximum 60 degrees Celsius and primer GC% as the minimum of 40 and maximum of 45 (Supplementary Table S12).
-
The BIK2 draft assembly sequence consisted of 36 contigs, BIK3 with 49 contigs, and BIK4 with 56 contigs. These draft genomes were mapped against their respective reference genomes, which featured chromosome-level assemblies. Among these mappings, 18 were short and unmapped contigs, and four contigs exhibited duplication out of 22 for the BIK2 genome, while the remaining 15 were successfully mapped to reference genome (Fig. 2). For BIK3, 32 contigs were short and unmapped, and two contigs showing duplication and 1 contig showing poor coverage out of 35 total and the remaining 21 were potentially mapped to the reference genome (Fig. 3). Similarly, for BIK4, 22 contigs were short and unmapped, with two contigs exhibiting duplication out of 28 total, and the remaining 21 were mapped to the reference genome (Fig. 4).
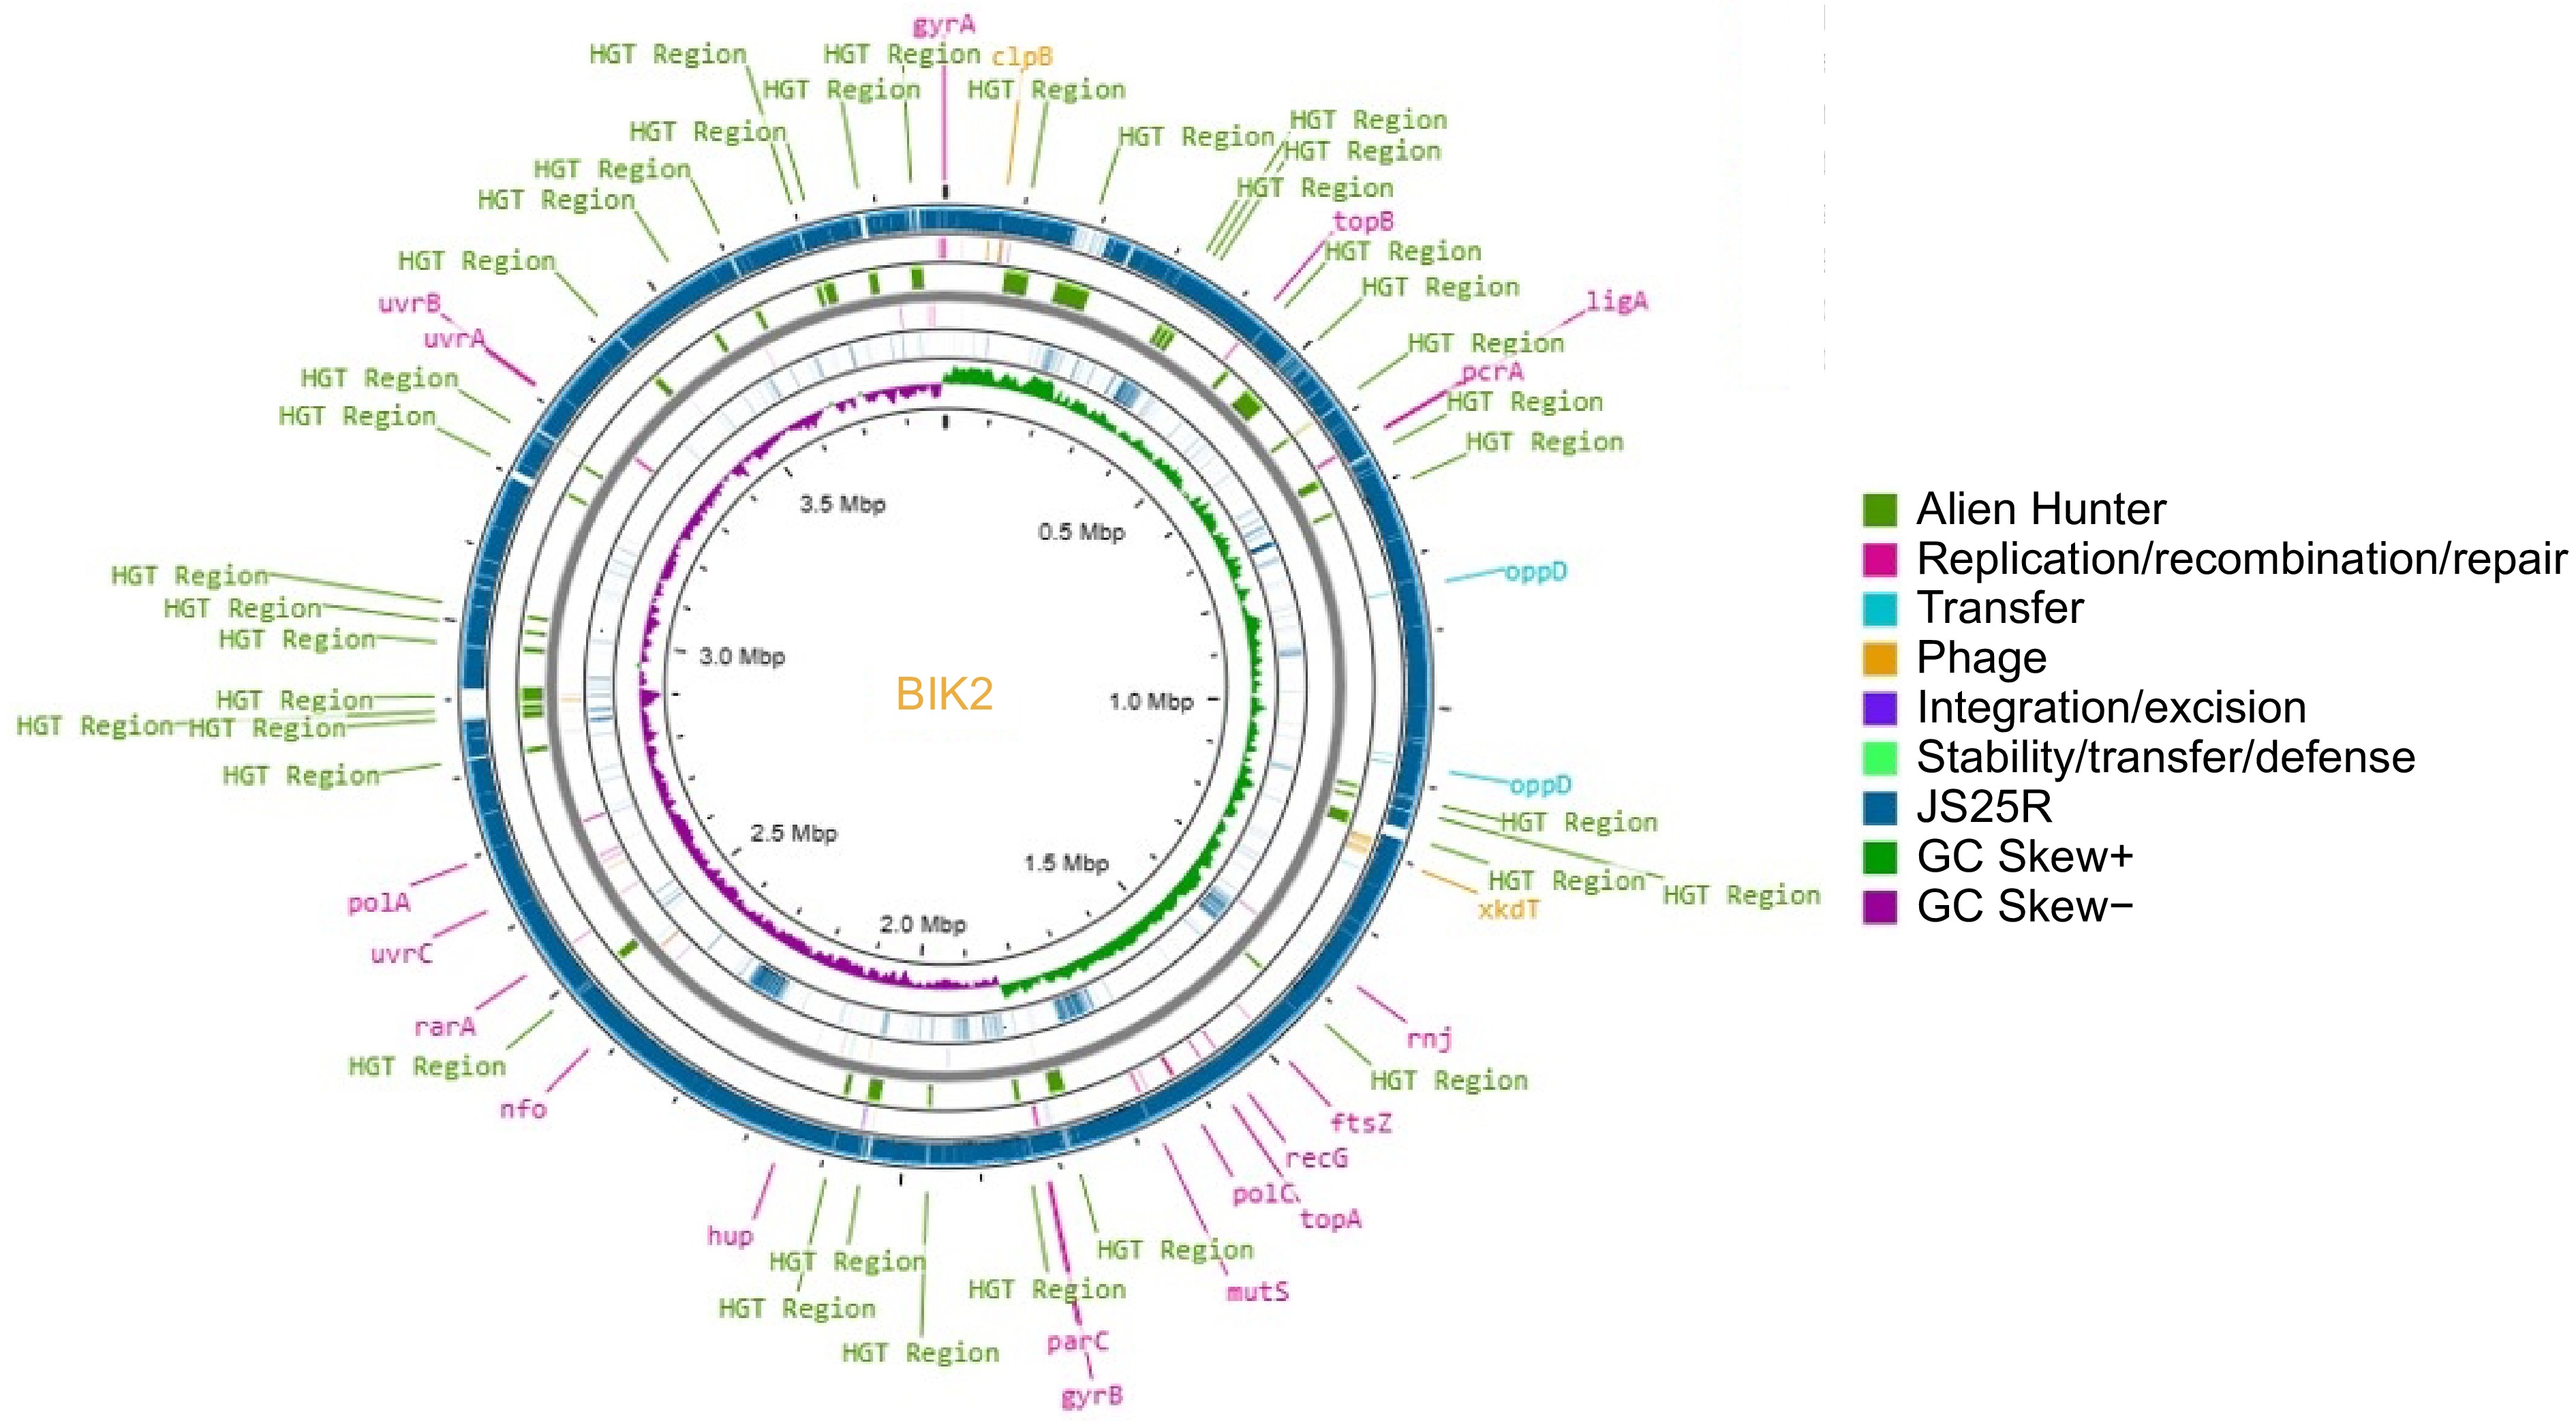
Figure 2.
Circular representation of BIK2 genome (innermost ring) along with reference genome B. velezensis JS25R. Putative Horizontal Gene Transfer (HGT) events were Predicted using Alien Hunter and are represented in green. The reference genome JSR is presented in teal, GC skew+ in green, and GC screw− in purple. Legends of genes in yellow represent the prophage genes, mustard yellow represent transfer-related mobile elements. Pink legends are for replication/recombination/repair genes, likewise.
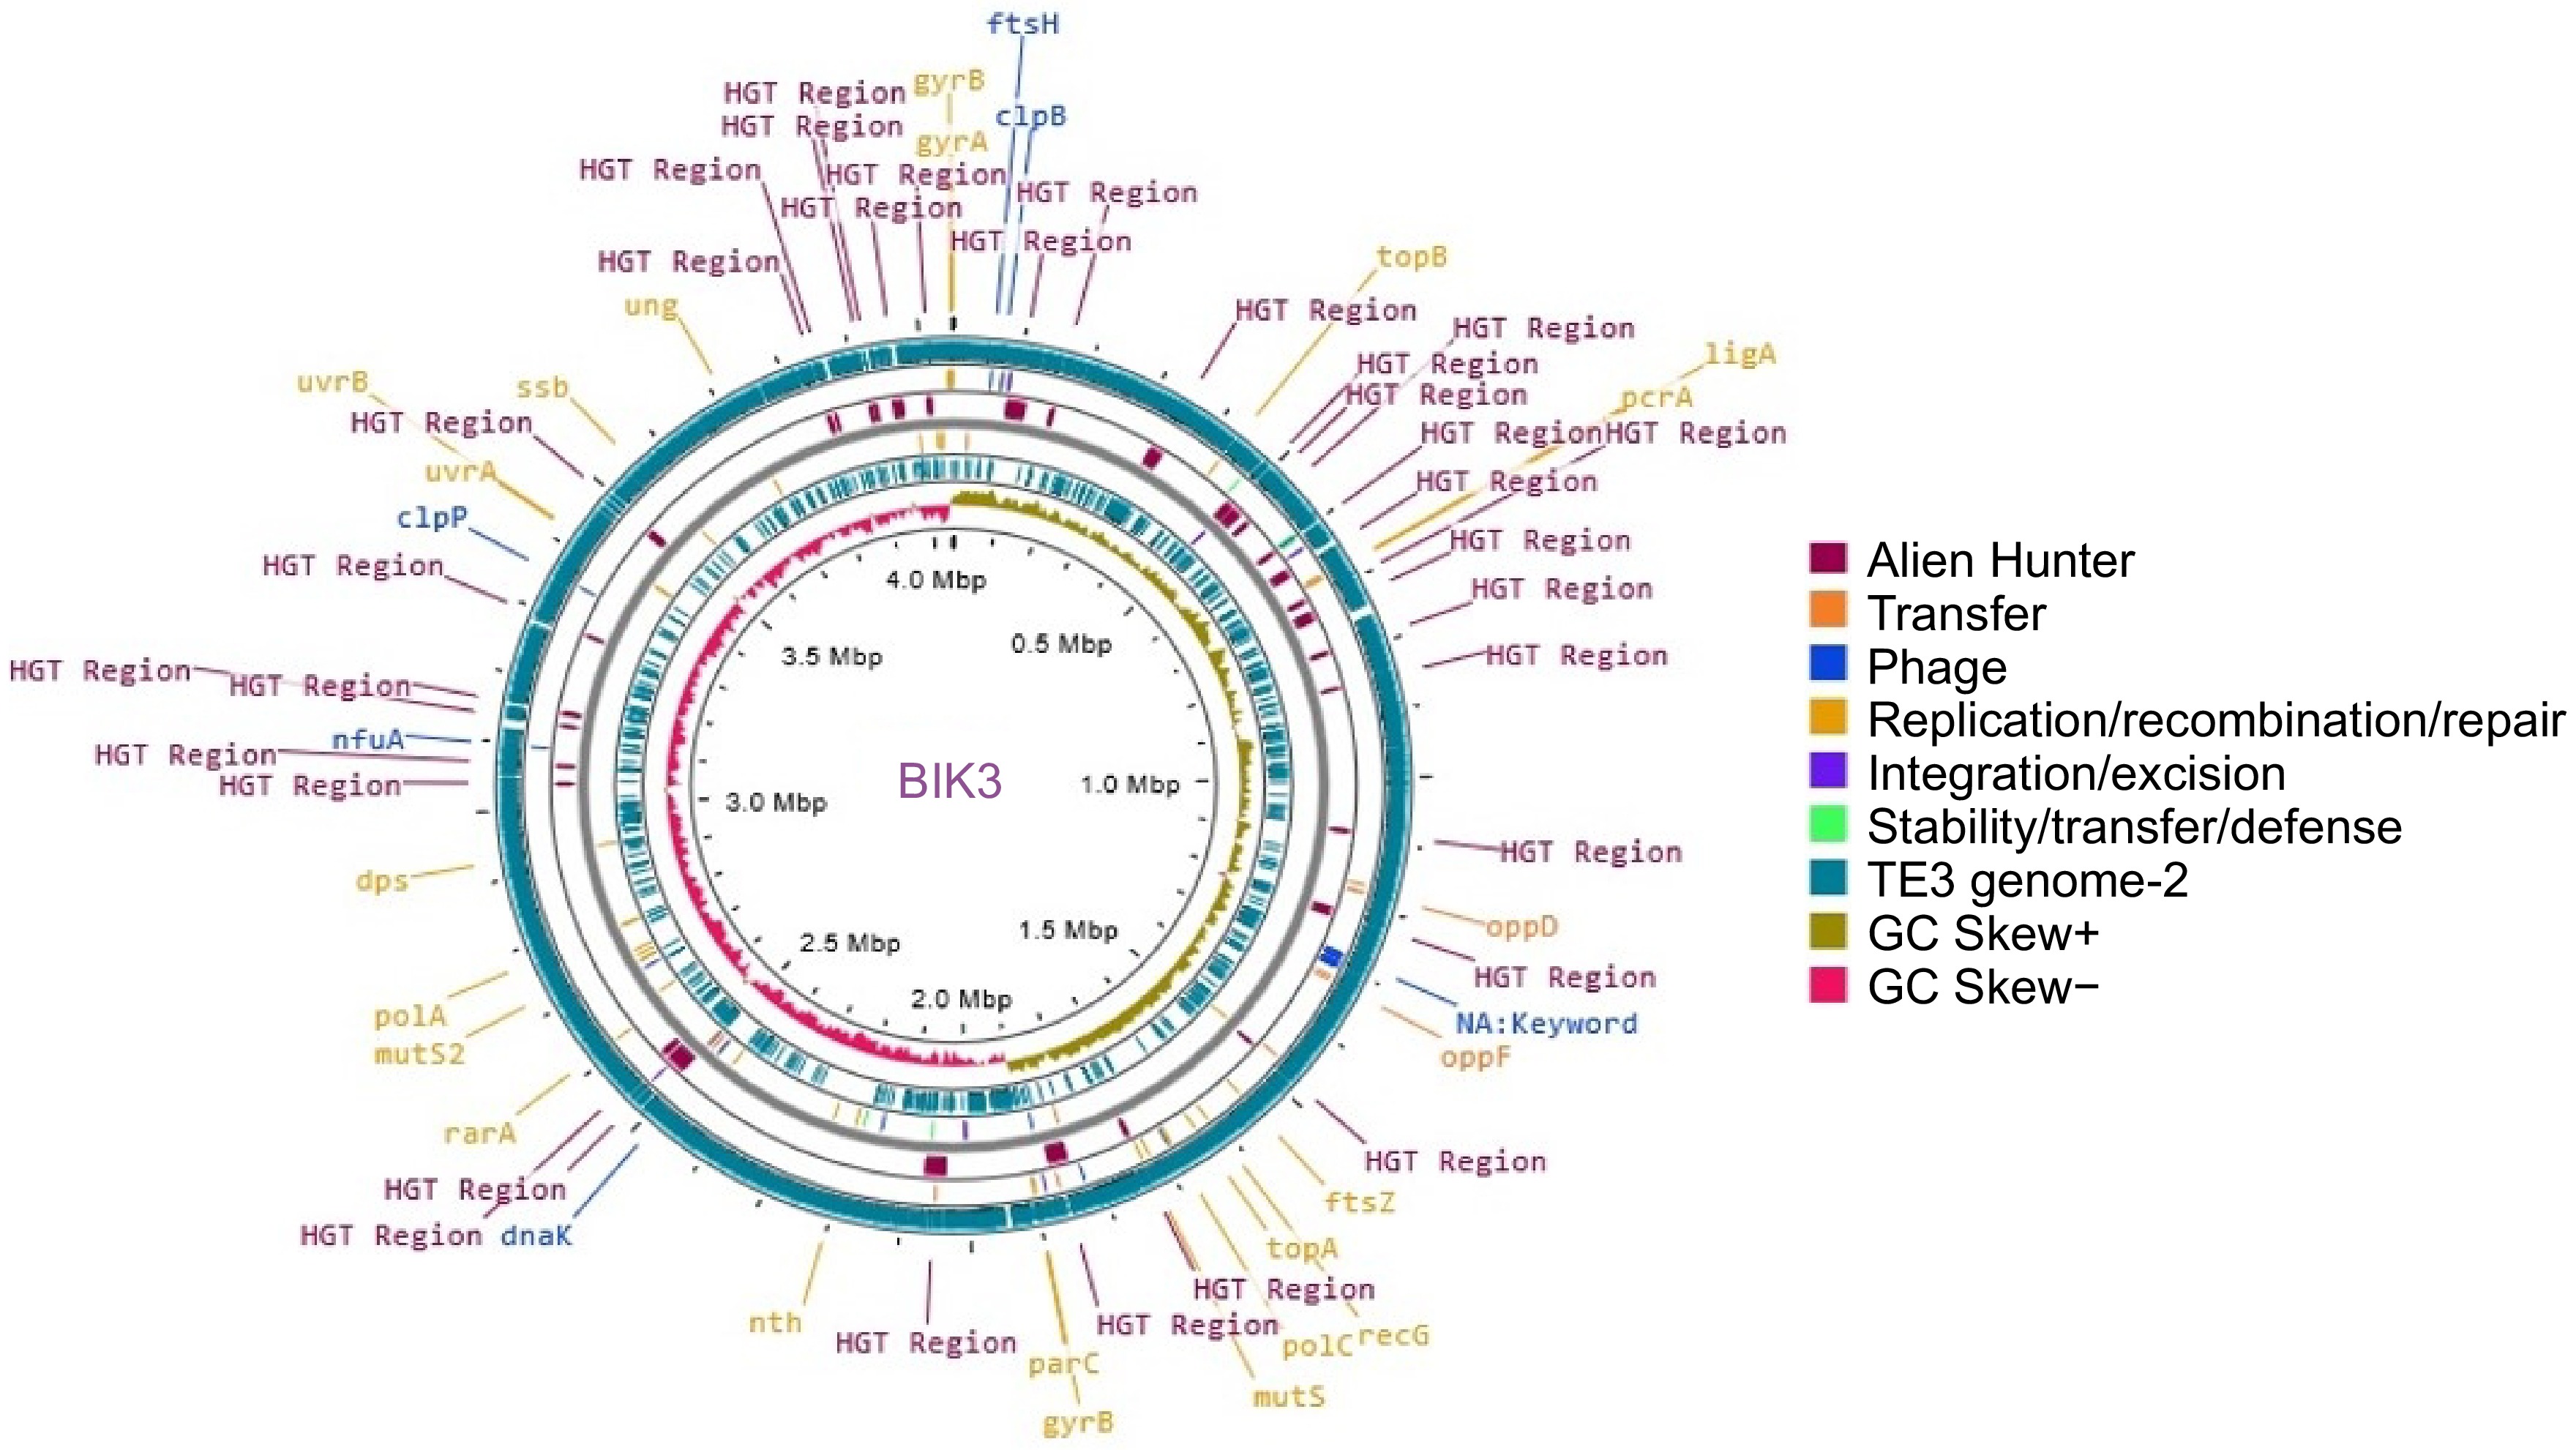
Figure 3.
Circular representation of BIK3 (innermost ring) along with reference genome B. cabrialesii TE3. Putative Horizontal Gene Transfer (HGT) events were predicted using Alien Hunter and are represented in maroon. The reference genome TE3 is presented in teal, with GC skew, and mobile genetic elements.
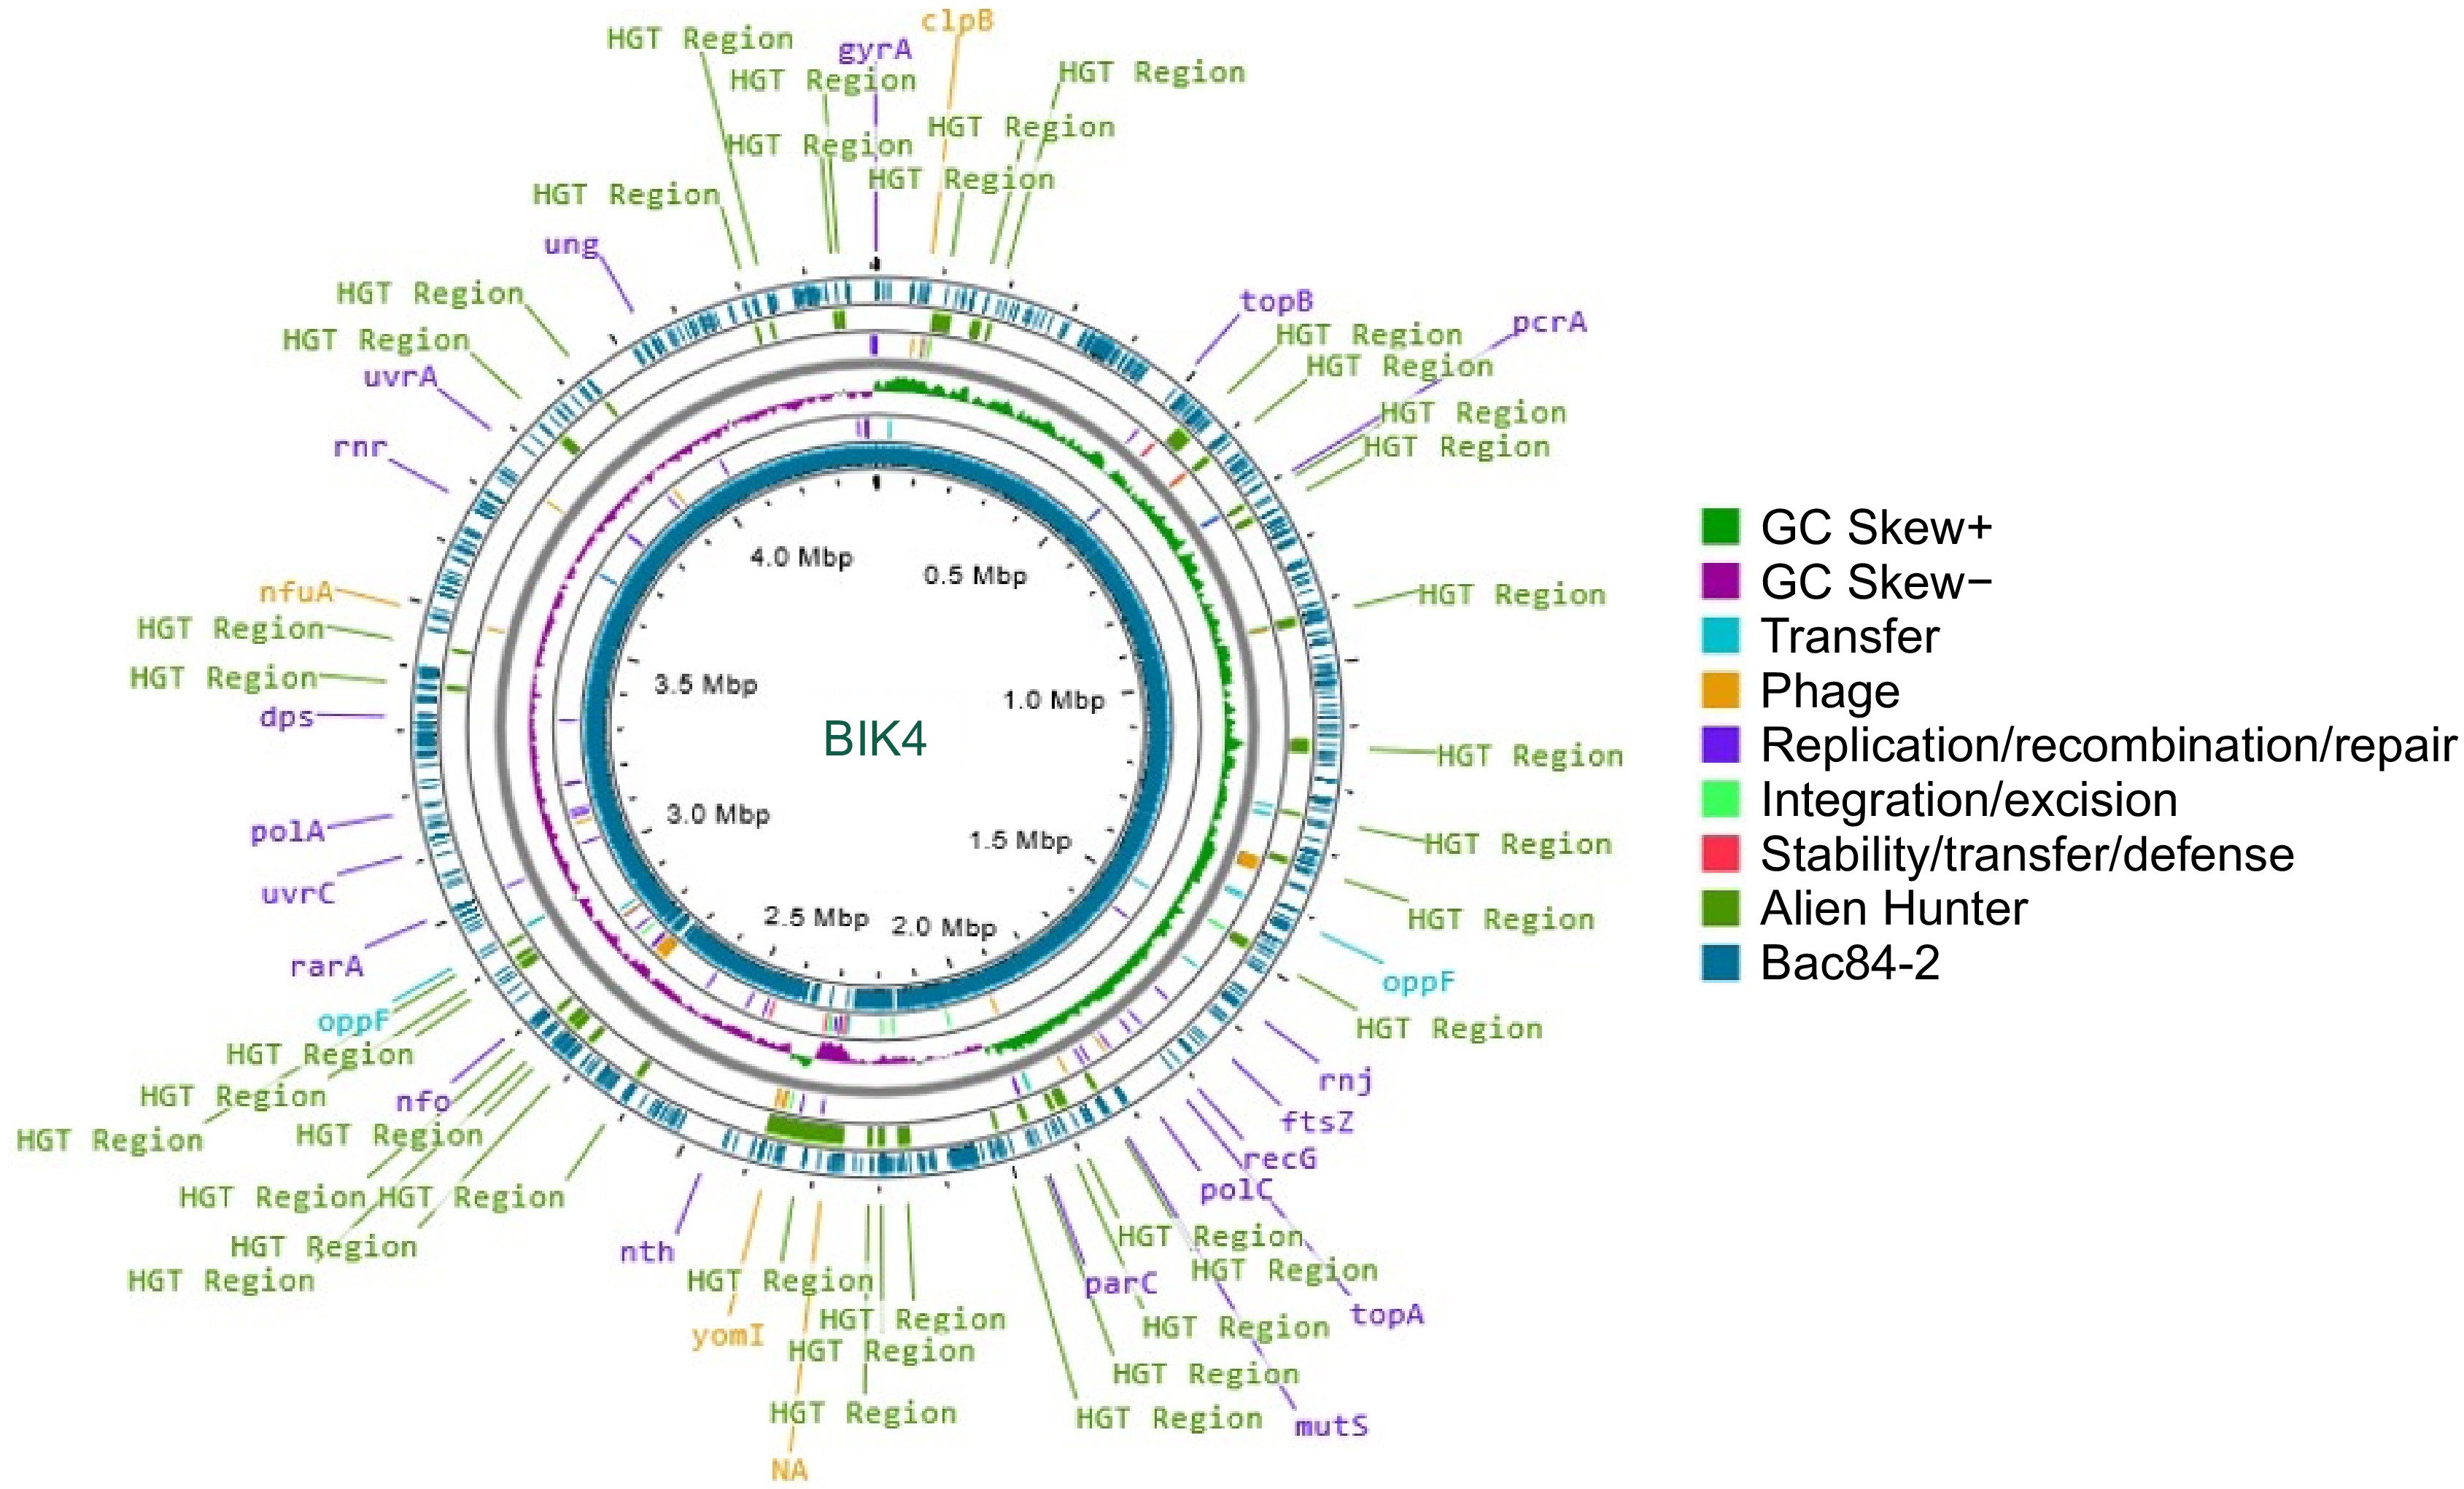
Figure 4.
Circular representation of BIK4 (innermost ring) along with reference genome B. paralicheniformis Bac84. Putative Horizontal Gene Transfer (HGT) events were predicted using Alien Hunter and are represented in green and prophage genes in yellow. The reference genome Bac84 is presented in teal, with GC skew, and mobile genetic elements.
The finished genome of BIK2 was annotated with 59 tRNA genes with a calculated genome completeness of 99.41% and 46.5% GC content based on the coverages of single-copy orthologous gene markers. Annotation revealed about 3,743 coding sequences (CDSs), 69 tRNA, and 144 as pseudogenes for the BIK2 scaffold. Gene enrichment analysis categorized genes into various functional groups, 119 in cell wall/membrane/envelope biogenesis, 29 in cell motility, 64 in post-translational modification, protein turnover, and chaperones, 123 in inorganic ion transport and metabolism, 44 in secondary metabolites biosynthesis, transport, and catabolism, 408 with unknown functions, 85 in signal transduction mechanisms, 14 in intracellular trafficking, secretion, and vesicular transport, and 35 in defense mechanisms. Similarly, for BIK3, the finished genome annotation consists of 4,008 CDSs, 59 tRNA, and one rRNA gene along with 115 pseudogenes with a genome completeness of 99.41% with 0.59% of contamination and 44.2% GC content. Gene enrichment analysis delineated genes related to 22 genes under chromosome partitioning, cellular processing and signaling, 31 under cell motility, 145 under envelope biogenesis, 45 under defense mechanisms, 14 under intracellular trafficking, secretion, and vesicular transport, 36 under secondary metabolite biosynthesis, transport and catabolism, and 520 with unknown functions.
The genome completeness for BIK4 was estimated to be 100% with no contamination. Annotation identified 4,507 CDSs, 2 RNA, 70 tRNA, and 184 pseudogenes accompanied with a GC content of 45.5%. Gene enrichment analysis highlighted about 34 proteins involved in envelope biogenesis, 22 in defense mechanism, eight in secondary metabolite biosynthesis, transport, and catabolism, and 32 in signal transduction mechanisms. About 162 proteins were poorly characterized or with unknown functions (Fig. 5).
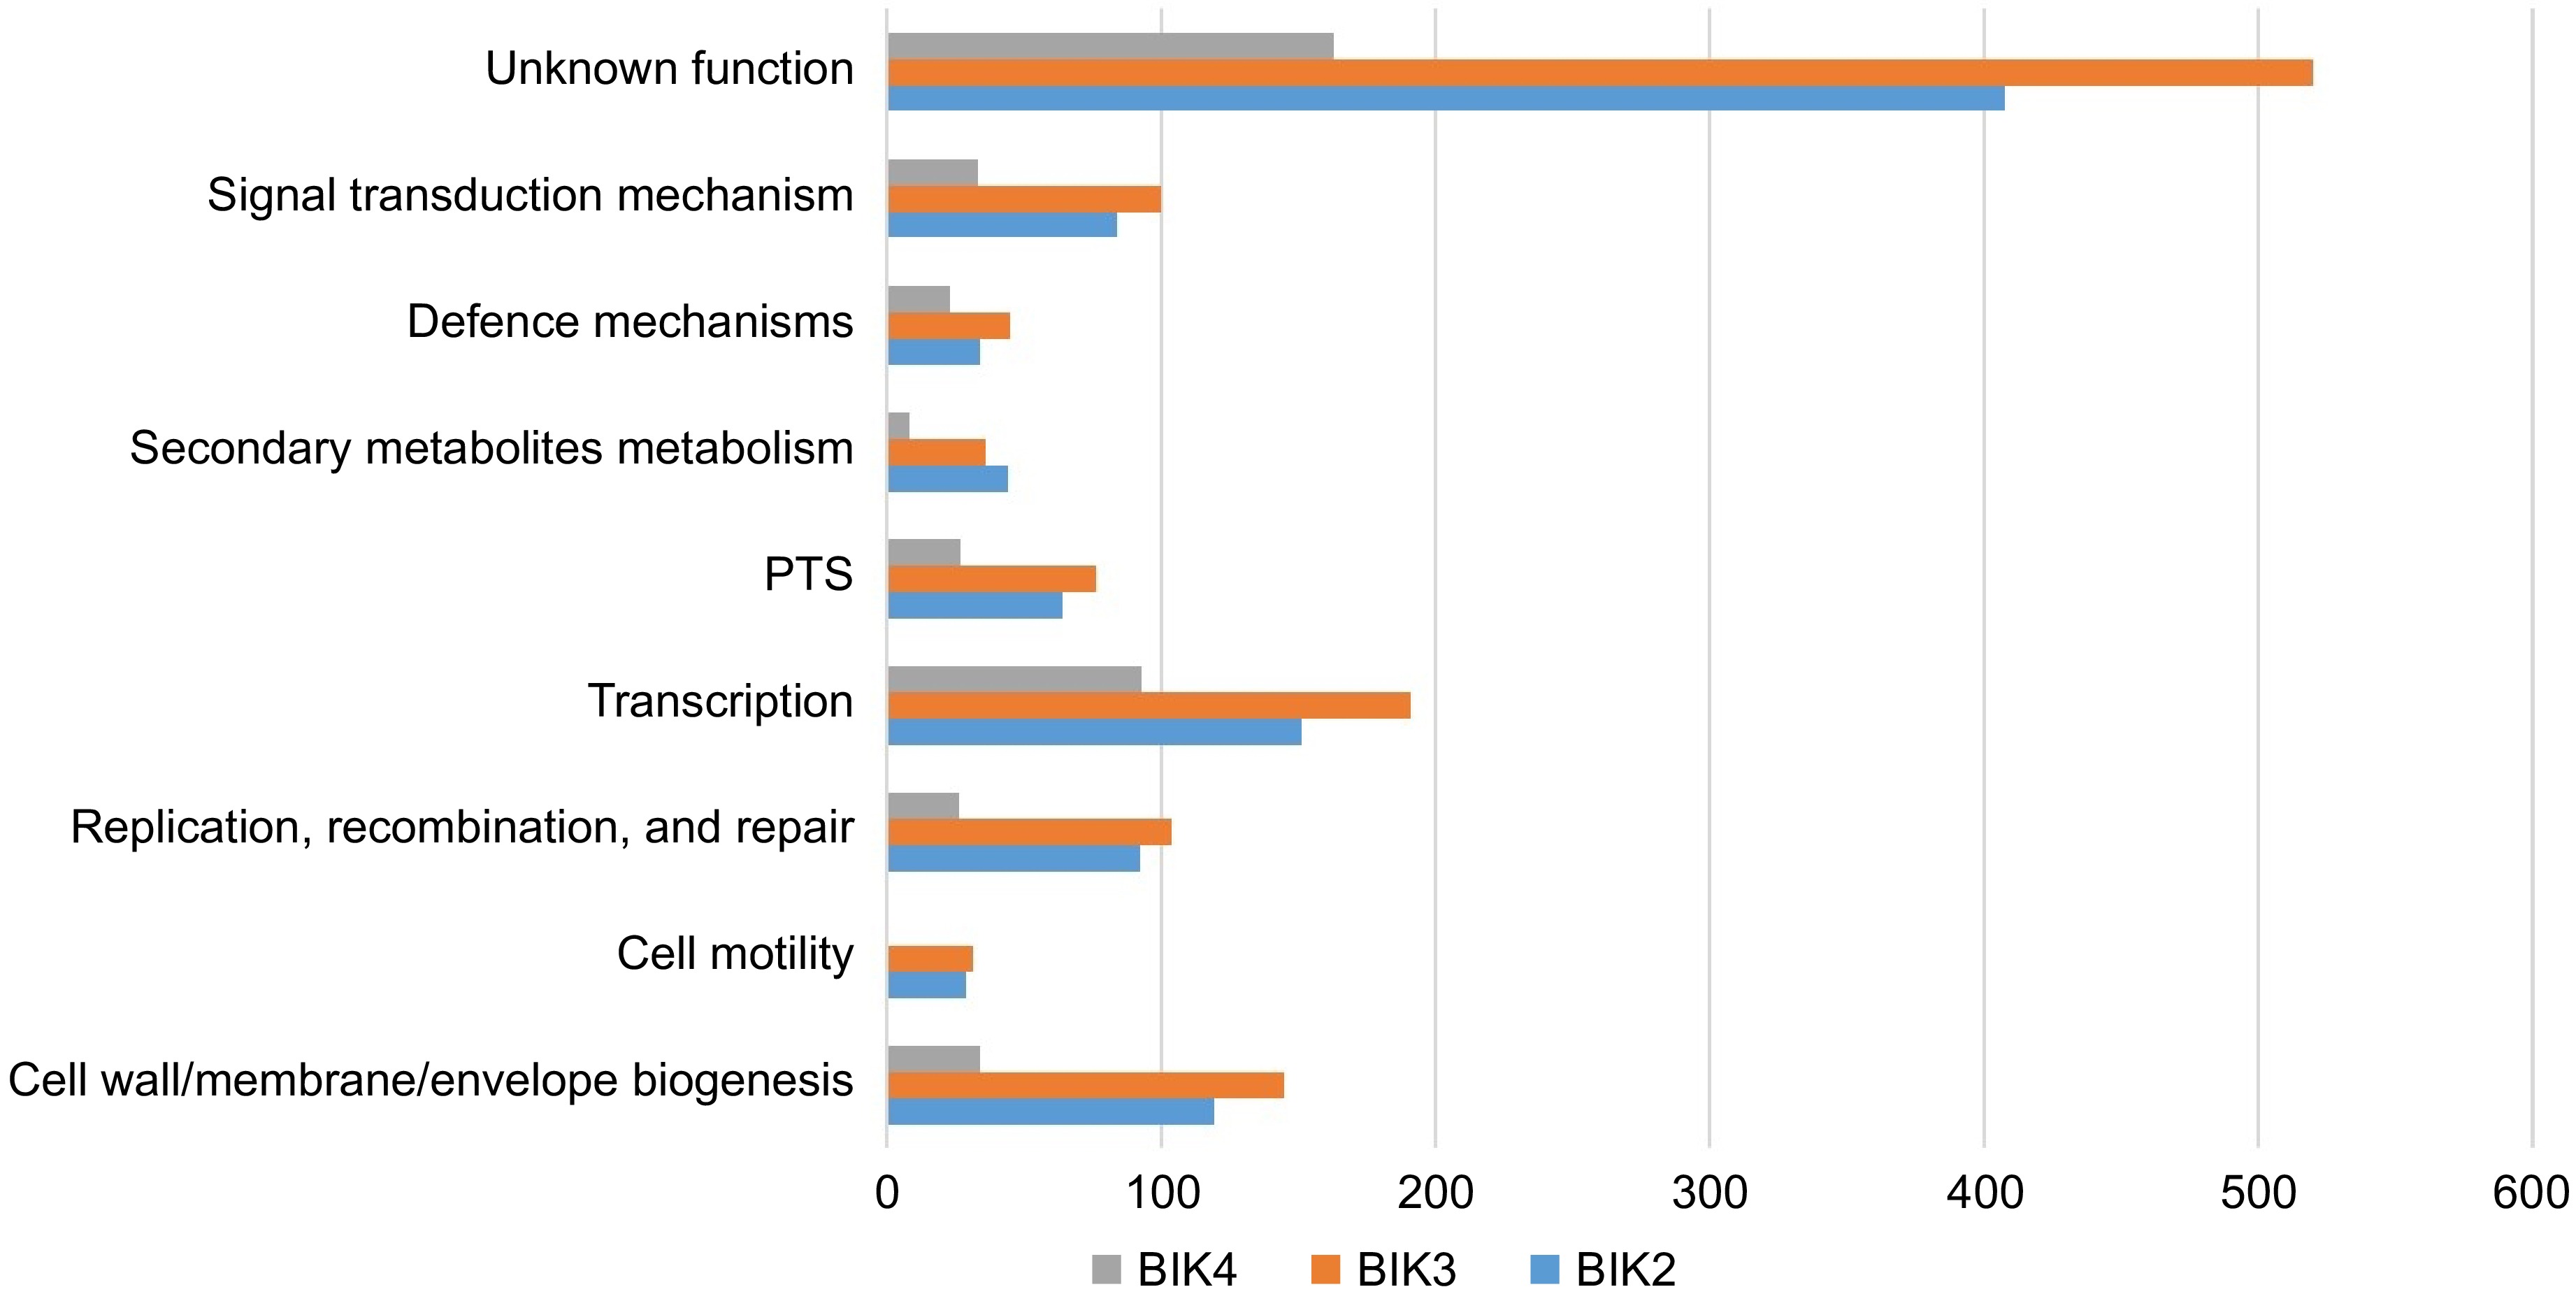
Figure 5.
Comparative analysis of BIK2, BIK3, and BIK4 major classes of proteins involved in different processes. PTS-post-translational modifications, protein turnover, and chaperones (bar diagram), shows the classification of BIK2, BIK3, and BIK4 proteins under some of the major processes.
The presence of pseudogenes, which are nonfunctional broken gene fragments that are formed after ecological shifts or extreme population bottlenecks[31] enable us to understand the evolutionary forces that have acted upon, and their functional capacities encoded within the bacterial genome. The presence of 146 pseudogenes in BIK2 compared to 58 pseudogenes in the reference genome, 115 in BIK3 compared to 100 in the reference genome TE3, and 184 in BIK4 compared to 66 in the reference genome Bac84 reveal the fact that these may have originated evolutionarily by either the disruption of a reading frame or promoter regions by point mutations, frameshifts, or by the integration of transposable elements[32] (Table 1; Supplementary Table S1 & Table S3).
Table 1. Scaffolding and annotation summary of BIK2, BIK3, and BIK4 along gene enrichment analysis.
Variables B. velezensis BIK2 B. cabrialesii BIK3 B. paralicheniformis BIK4 Scaffolding with CONTIGuator Input contigs 37 (3,902,606 bp) 49 (4,113,954 bp) 56 (4,424,204 bp) Mappeda contigs 15 (3,887,215 bp) 21 (4,046,514 bp) 21 (4,405,346 bp) Unmappedb contigs 22 (15,391 bp) 28 (67,440 bp) 35 (18,858 bp) Unmapped: short contigs 18 (7,793 bp) 22 (5,737 bp) 32 (10,951 bp) Unmapped: poor coverage 0 4 (57,117 bp) 1 (3,632 bp) Unmapped: duplicated hits 4 (7,598 bp) 2 (4,586 bp) 2 (4,275 bp) Annotation of scaffolds N50 (bp) 3,888,615 4,048,514 4,407,346 Completeness (BUSCO) 99.41% 99.41% 100% Gap ratio (%) 0.036003 0.049401 0.045379 GC content (%) 46.5 44.2 45.5 Number of CDSs 3,743 4,008 4,507 Coding ratio (%) 89.5 88.9 87.9 Number of rRNAs 0 1 2 Number of tRNAs 59 59 70 Pseudogenes 146 115 184 Gene enrichment analysis GO terms 1,955c uniques
(8,176d duplicates)2,262 uniques
(10,047 duplicates)1,011 uniques
(2,826 duplicates)COG categories 1,923 2,342 777 Cellular processes and signaling 363 433 124 Information storage and processing 367 435 186 Metabolism 787 953 305 Poorly characterised/ unknown functions 408 520 162 a, Contigs those aligned to reference genome; b, Contigs not aligned to reference genome; c, Uniques are those genes involved in single activity d, Duplicates are those involved in multiple activities. GGDC-Genome-to-Genome Distance Calculator
-
The GGDC genome service was used to identify sub-species delineation and calculate the intergenomic distances for BIK2 along with 25 other reference genomes. GGDC initially determines a set of Highly Scoring Pairs (HSPs) or MUMs between two genomes, calculates the distances from these sets, then converts these distances in percent-wise similarities, analogous to DDH. As the genomes of BIK2, BIK3, and BIK3 are incomplete, we relied on formula 2-based results that are sequence-based calculations rather than the gene content of a species, to interpret the results. Accordingly, the results indicated that the J01 isolate is closer to BIK2 with 99.1% similarity and 0.32% G+C difference. Similarly based on the DDH similarity of 91%, it was observed that the TSO2 genome is closer to BIK3 compared to TE3, with a difference of 0.23% in G+C content. In the case of BIK4, it was observed that Bac84 is closer with 94.7% DDH similarity and has a difference of 0.38 % G+C content (Supplementary Table S2).
Exploration of genomic features
-
The Proksee representation illustrates the comparison between the BIK2 genome and the reference genome JS25R, highlighting mobile genetic elements detected by the mobileOG_db. In BIK2 a total of 92 genes related to various functions were identified, five genes for integration/excision, 41 involved in replication/recombination/repair, 32 genes of prophage, three for stability/transfer/defense and 11 for transfer. The innermost ring represents the BIK2 genome compared with the JS25R genome and the gapsin the representation shows the dissimilarities between the genomes. Further detailed analysis of the BIK3 genome indicate the presence of 94 mobile genetic elements along with 32 HGTs Specifically nine genes were found to be responsible for integration/excision, 30 for prophage sequences, 38 for replication/recombination/repair, five for stability/transfer/defense, and 13, exclusively for the transfer of genes. Analysis of the BIK4 genome, estimated about 130 mobile genetic elements with 13 genes involved in the integration/excision, 46 in replication/recombination/repair, 49 as prophage sequences, seven for stability/transfer/defense, and 15 for transfer (Supplementary Table S4).
Origin of replication
-
The skew line depicted in blue and the cumulative line in red. The blue figure displays the skew over the length of the genome, the X-axis is the position in the genome, and the Y-axis is the skew. The cumulative skew adds up all previous values to a specific position. It also displays the global minimum and maximum, which are shown in the graph by the two green lines. These values estimate the origin of replication at 0 and the terminus location at 1,831,248 in the BIK2 genome with a step size and window size of 3,888 (Fig. 6). For the BIK3 genome, the origin of replication is predicted to be at the position of 4,035,856 and termination at 1,902,560 with a step size and window size of 4,048 (Fig. 7). The origin of replication for the BIK4 genome is estimate to be at position 4,393,779 and termination at 1,983,150 with a step size and window size of 4,407 (Fig. 8).
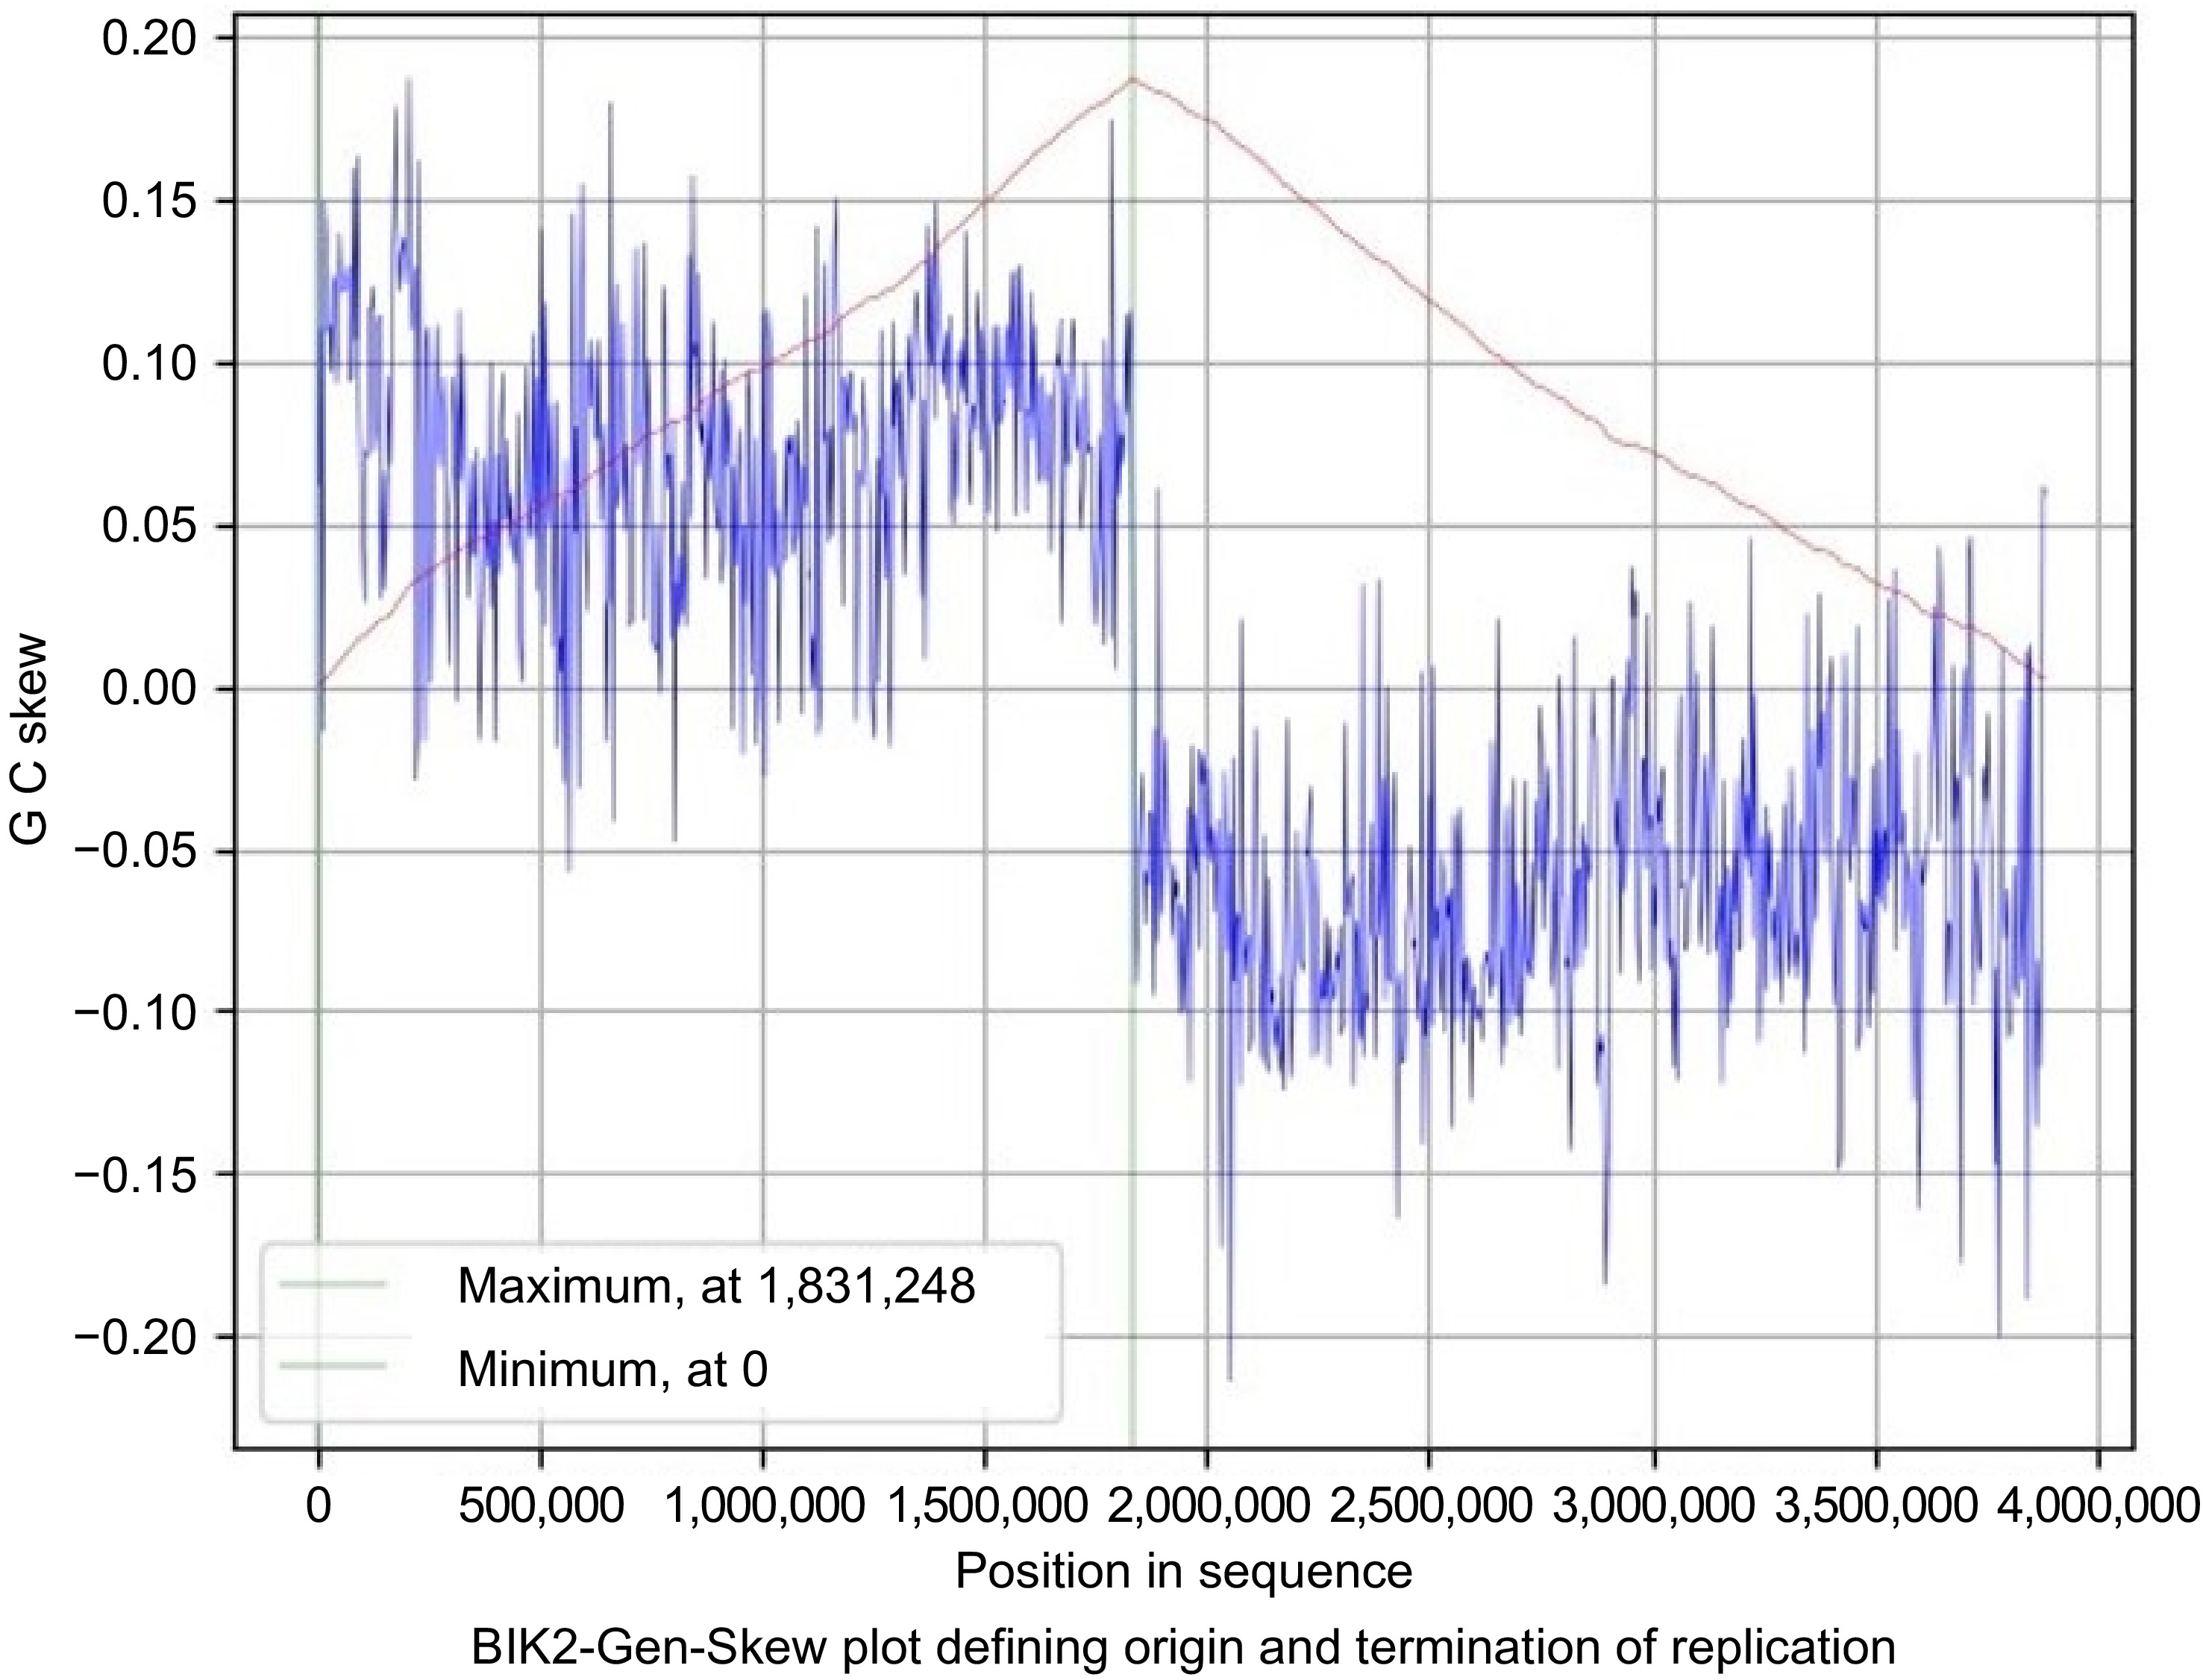
Figure 6.
Gen-Skew: predicting the origin of replication for BIK2. The above figure shows the cumulative line in red and the skew line in blue, with minimum as origin of replication and maximum as termination of replication. X-axis denotes the positions in genomes and Y-axis denotes skew. For BIK2, replication starts at 0 position and terminates at 1,831,248 position.
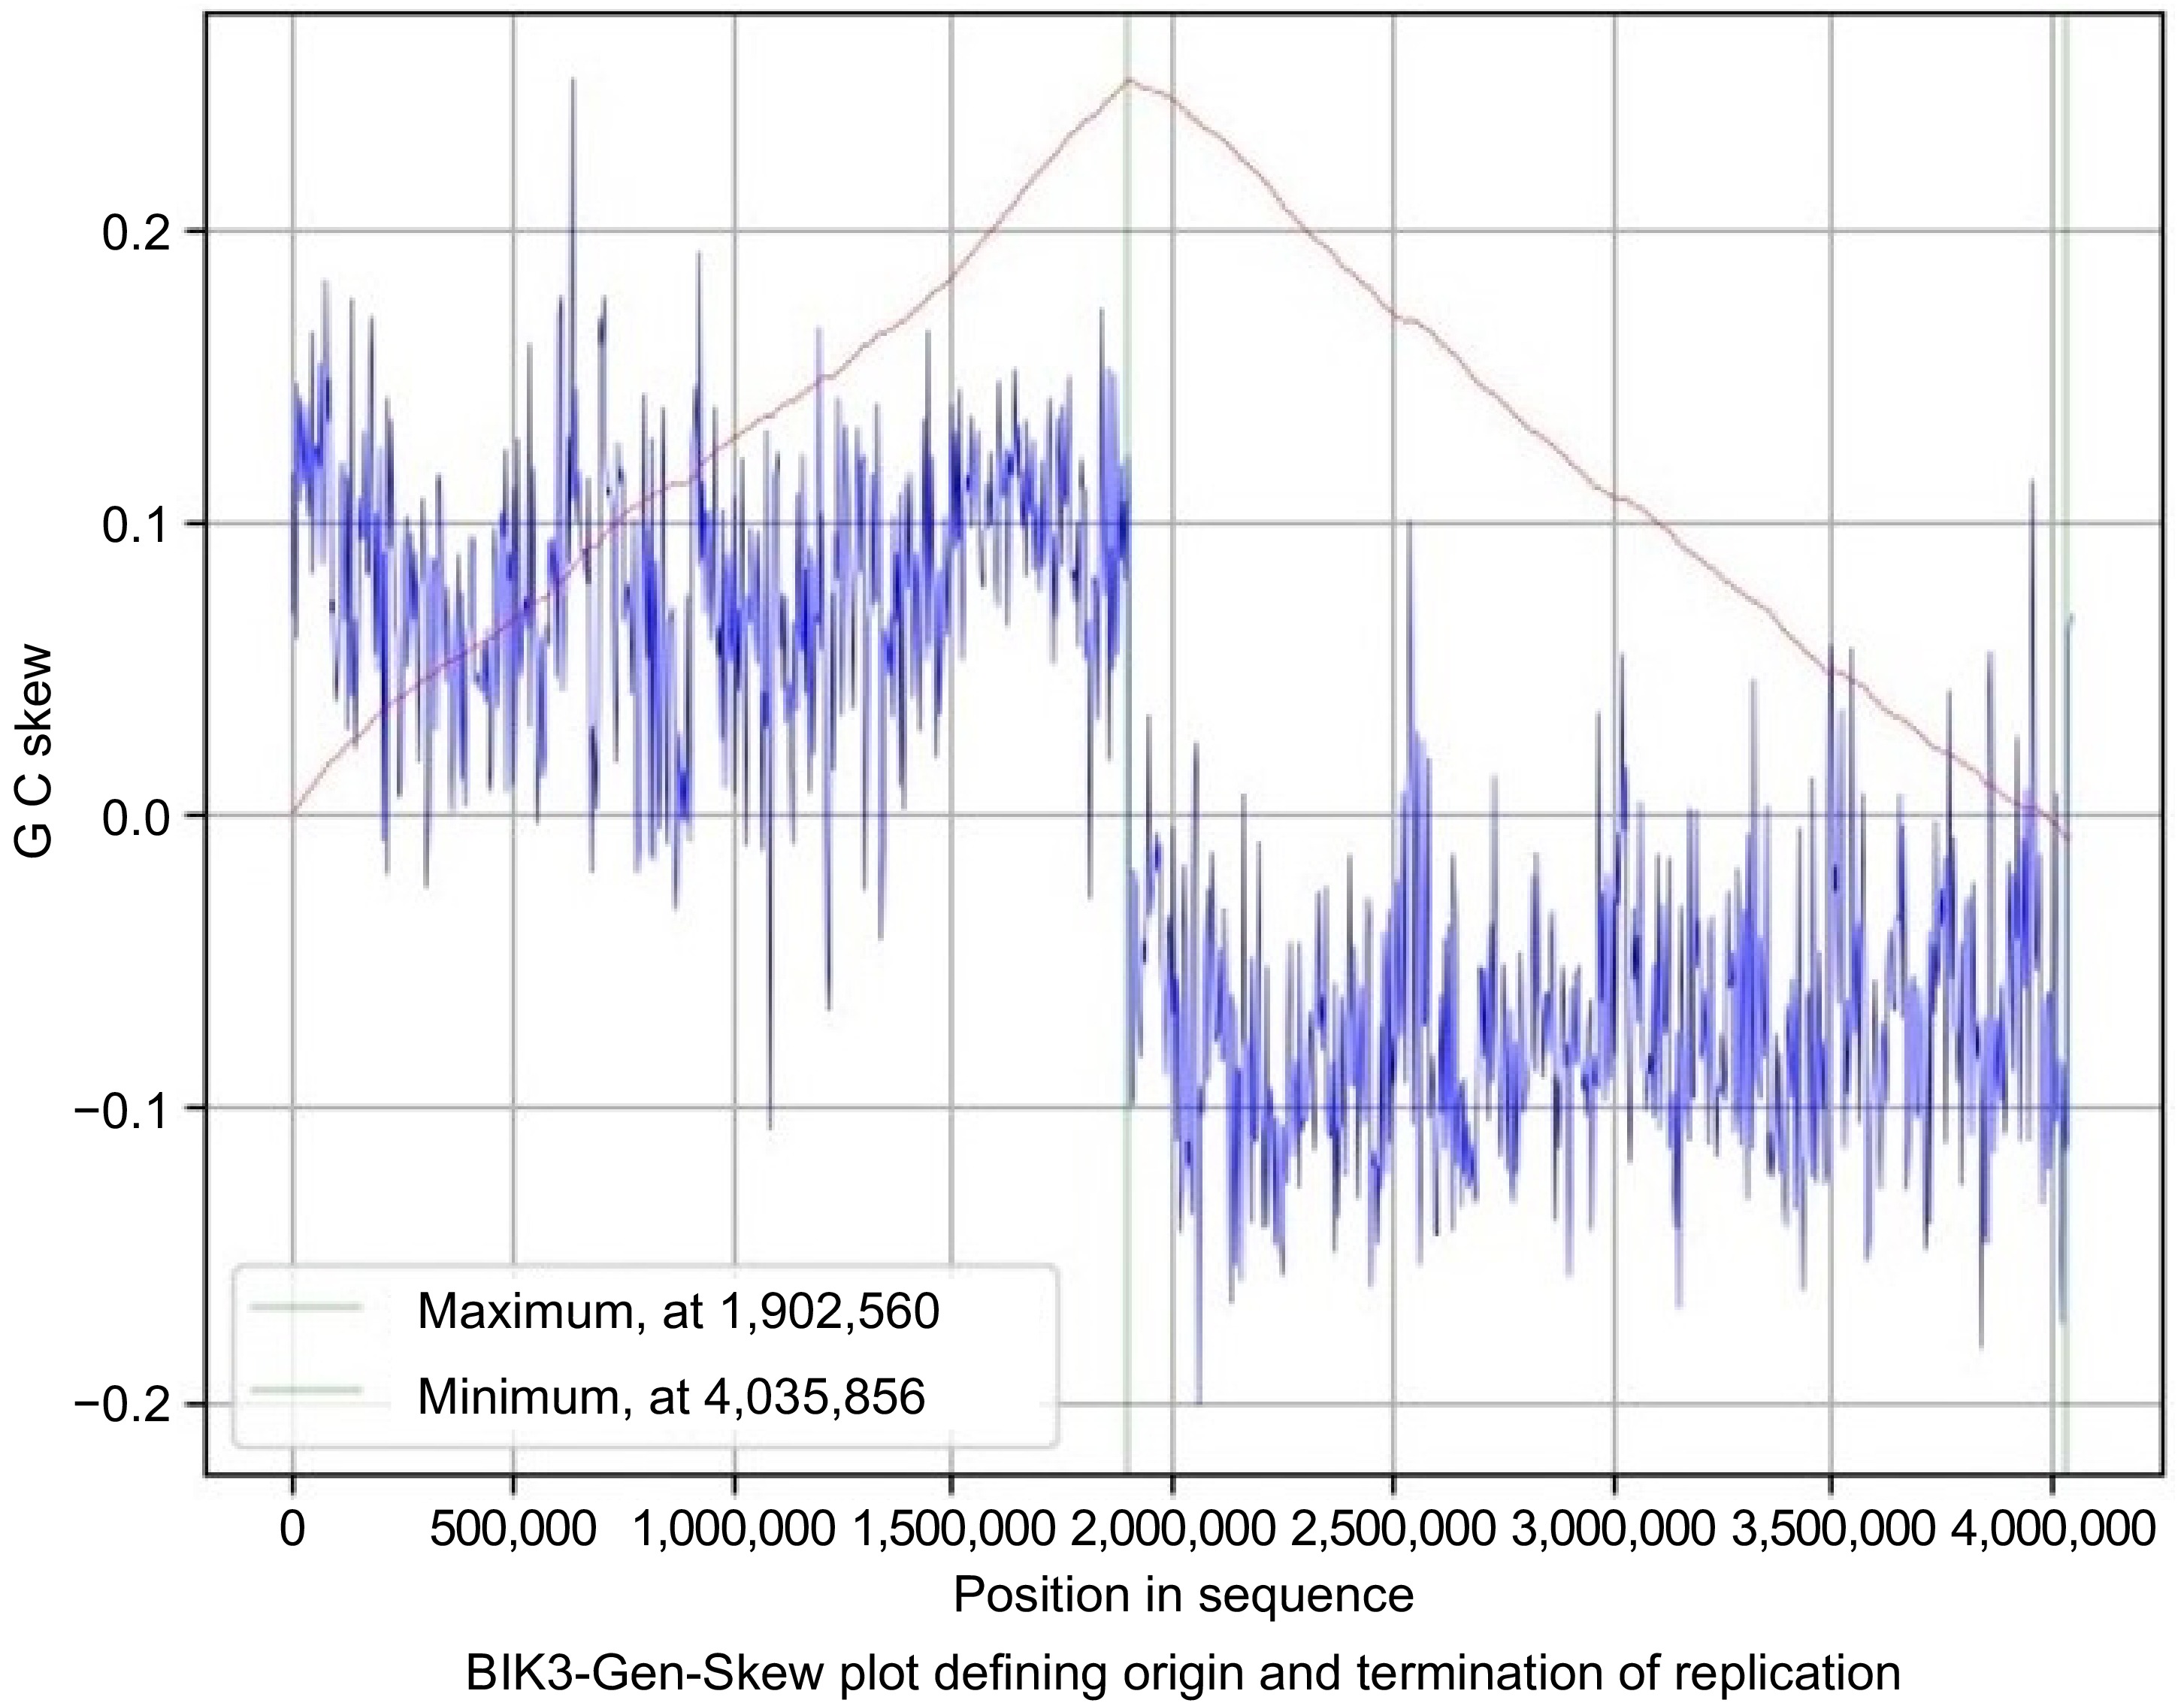
Figure 7.
Gen-Skew: predicting the origin of replication for BIK3. The above figure shows the cumulative line in red and the skew line in blue, with minimum as origin of replication and maximum as termination of replication. X-axis denotes the positions in genomes and Y-axis denotes skew. For BIK3, replication starts at 4,035,856 position and terminates at 1,902,560 position.
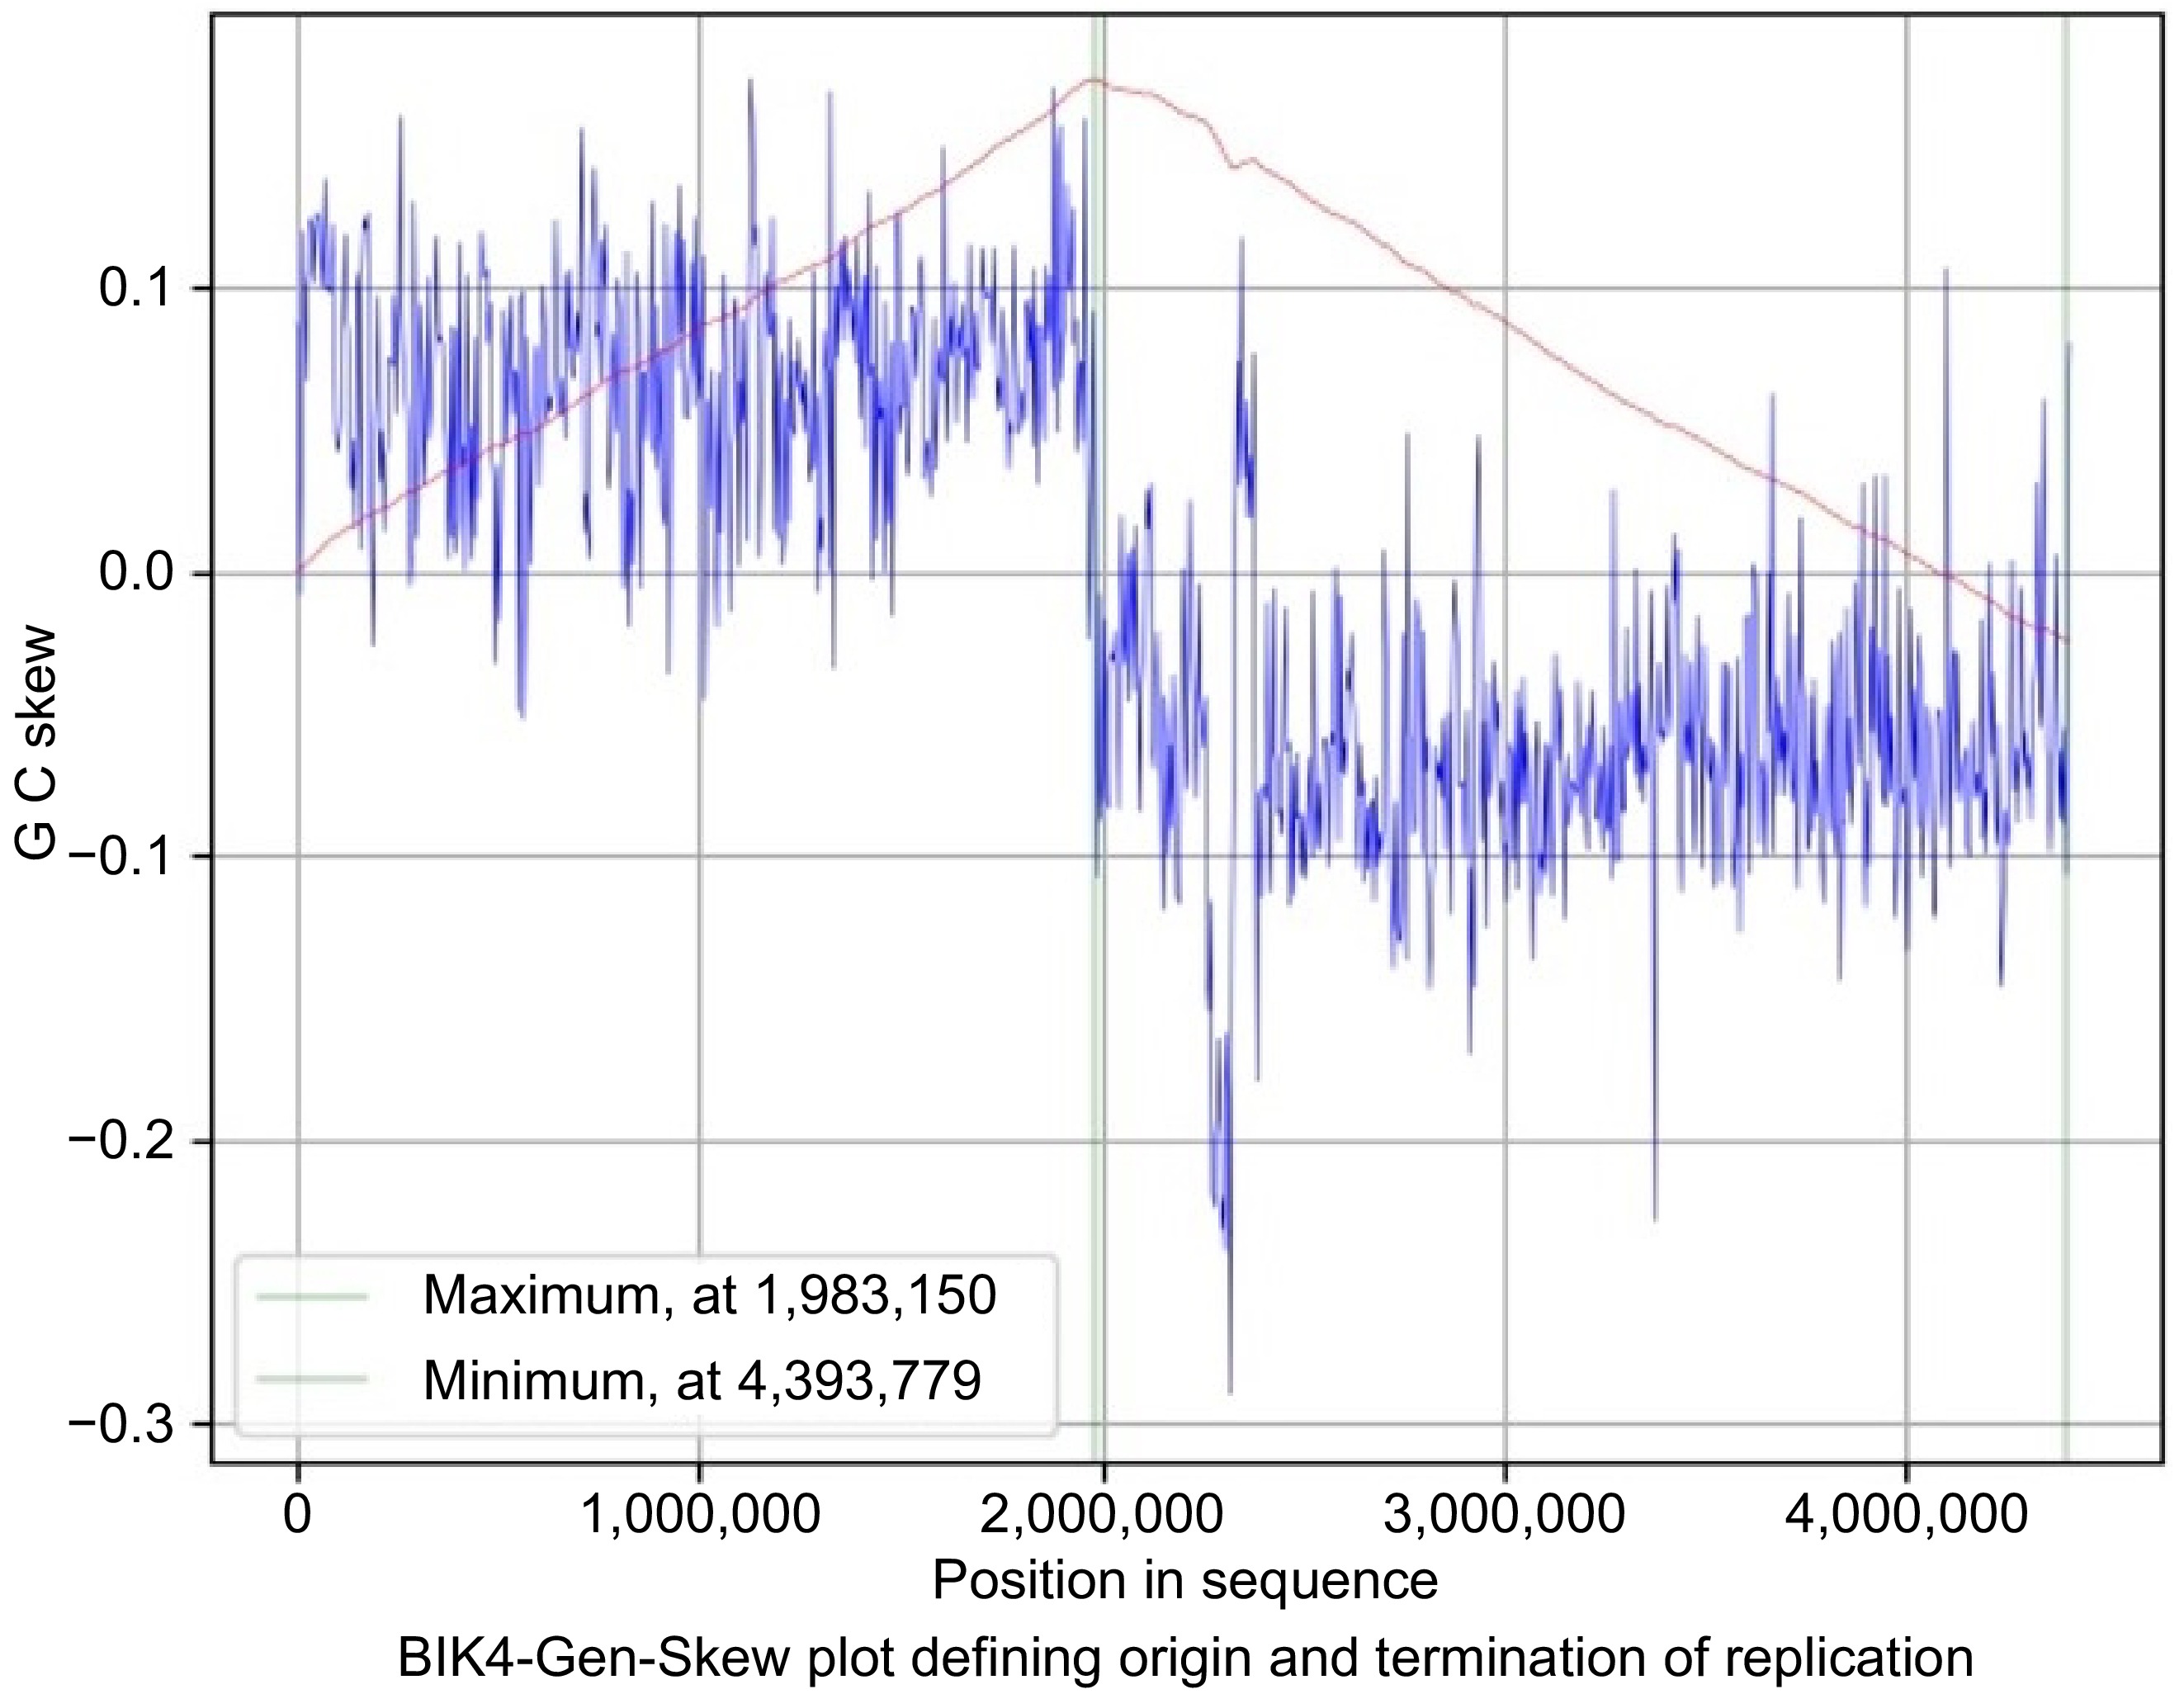
Figure 8.
Gen-Skew: predicting the origin of replication for BIK4. The above figure shows the cumulative line in red and the skew line in blue, with minimum as origin of replication and maximum as termination of replication. X-axis denotes the positions in genomes and Y-axis denotes skew. For BIK4, replication starts at 4,393,779 position and terminates at 1,983,150 position.
Phenotype prediction
-
The PhenDB analysis indicated that BIK2, a Gram-positive bacterium is capable of aerobic respiration, with a fermentative lifestyle, capable of producing R_acetoin (a natural product) and with a Type IV secretory system. In addition, it is capable of self-propelled motion and can produce endospores for persistence. Data also shows that BIK2 may produce ethanol, formic acid, hydrogen, butyric acid, etc (Supplementary Table S5).
Virulence prediction
-
The VRprofile2 analysis revealed the presence of - antibiotic resistance genes cfr(B) and tet(L) in the BIK2 scaffold. Precisely, the cfr(B) spanning the regions 520,020−521,069 conferring resistance to drugs Chloramphenicol, Florfenicol, Clindamycin, Lincomycin, Linezolid, Dalfopristin, Pristinamycin & IIA, Virginiamycin & M, Tiamulin of the drug classes Oxazolidinone, Phenicol, Lincosamide, Streptogramin & A, Pleuromutilin. Meanwhile tet(L) occupies the regions of 2,486,195−2,487,571 and endows. Cfr (B) gene exhibits resistance to Doxycycline which belong to a tetracycline class. No virulence factors were detected for the BIK2 genome. IN the case of BIK3 genome, the VRprofile2 analysis showed the presence of genes mph (K) spanning the region 228,851−22,977 conferring resistance to Spiramycin, and Telithromycin belonging to the class of Macrolide, and aadK genes occupying the regions between 2,550,575 to 2,551,429 and conferring resistance to streptomycin belonging to the class aminoglycoside. No virulence factors were detected for the BIK3 genome. Five genomic islands were identified in the BIK3 genome, confirming the horizontal gene transfer events. In the case of BIK4 genome, a virulent gene clpE (ATP-dependent protease) was found to be associated with the mobile genetic element for Listeria monocytogenes EGD-e. The VRprofile2 also detected the erm(D) gene responsible for resistance to erythromycin from the Macrolide drug class, lincomycin belonging to Lincosamide, clindamycin, quinupristin, pristinamycin and IA belonging to Virginiamycin, Streptogramin and B (Supplementary Table S6).
CRISPRloci – Bacillus defence mechanism
-
CRISPRloci identified about 10 Cas proteins of CAS-VI-C class and 10 for CAS-VI-B class in BIK2, eight cas genes of subtype V-A, six of subtype V-F, and 21 of VI-B in the BIK3 genome and four cas genes with subtype V-A, three of V-B, and 12 of subtype VI-B in the BIK4 genome (Supplementary Table S7).
Whole genome alignment
-
The BIK2, BIK3, and BIK4 genomes were subjected to whole genome alignment with their respective reference genomes and other completed genomes of corresponding species. In addition, the BIK2 genomic sequence was scaffolded along with 25 complete genomic sequences of B. velezensis in fasta formats. Results indicated that in the case of BIK2 genome the root alignment has 2,400 super intervals and the root alignment length was 6,265,618, 80 super intervals and root alignment length of 4,603,858 in BIK3 and 975 super intervals with 7,858,026 root alignment length in BIK4 (Fig. 9; Supplementary Table S1). The clustering pattern using REALPHY web-based tool showed that the three isolates grouped with their respective subspecies (Fig. 10).
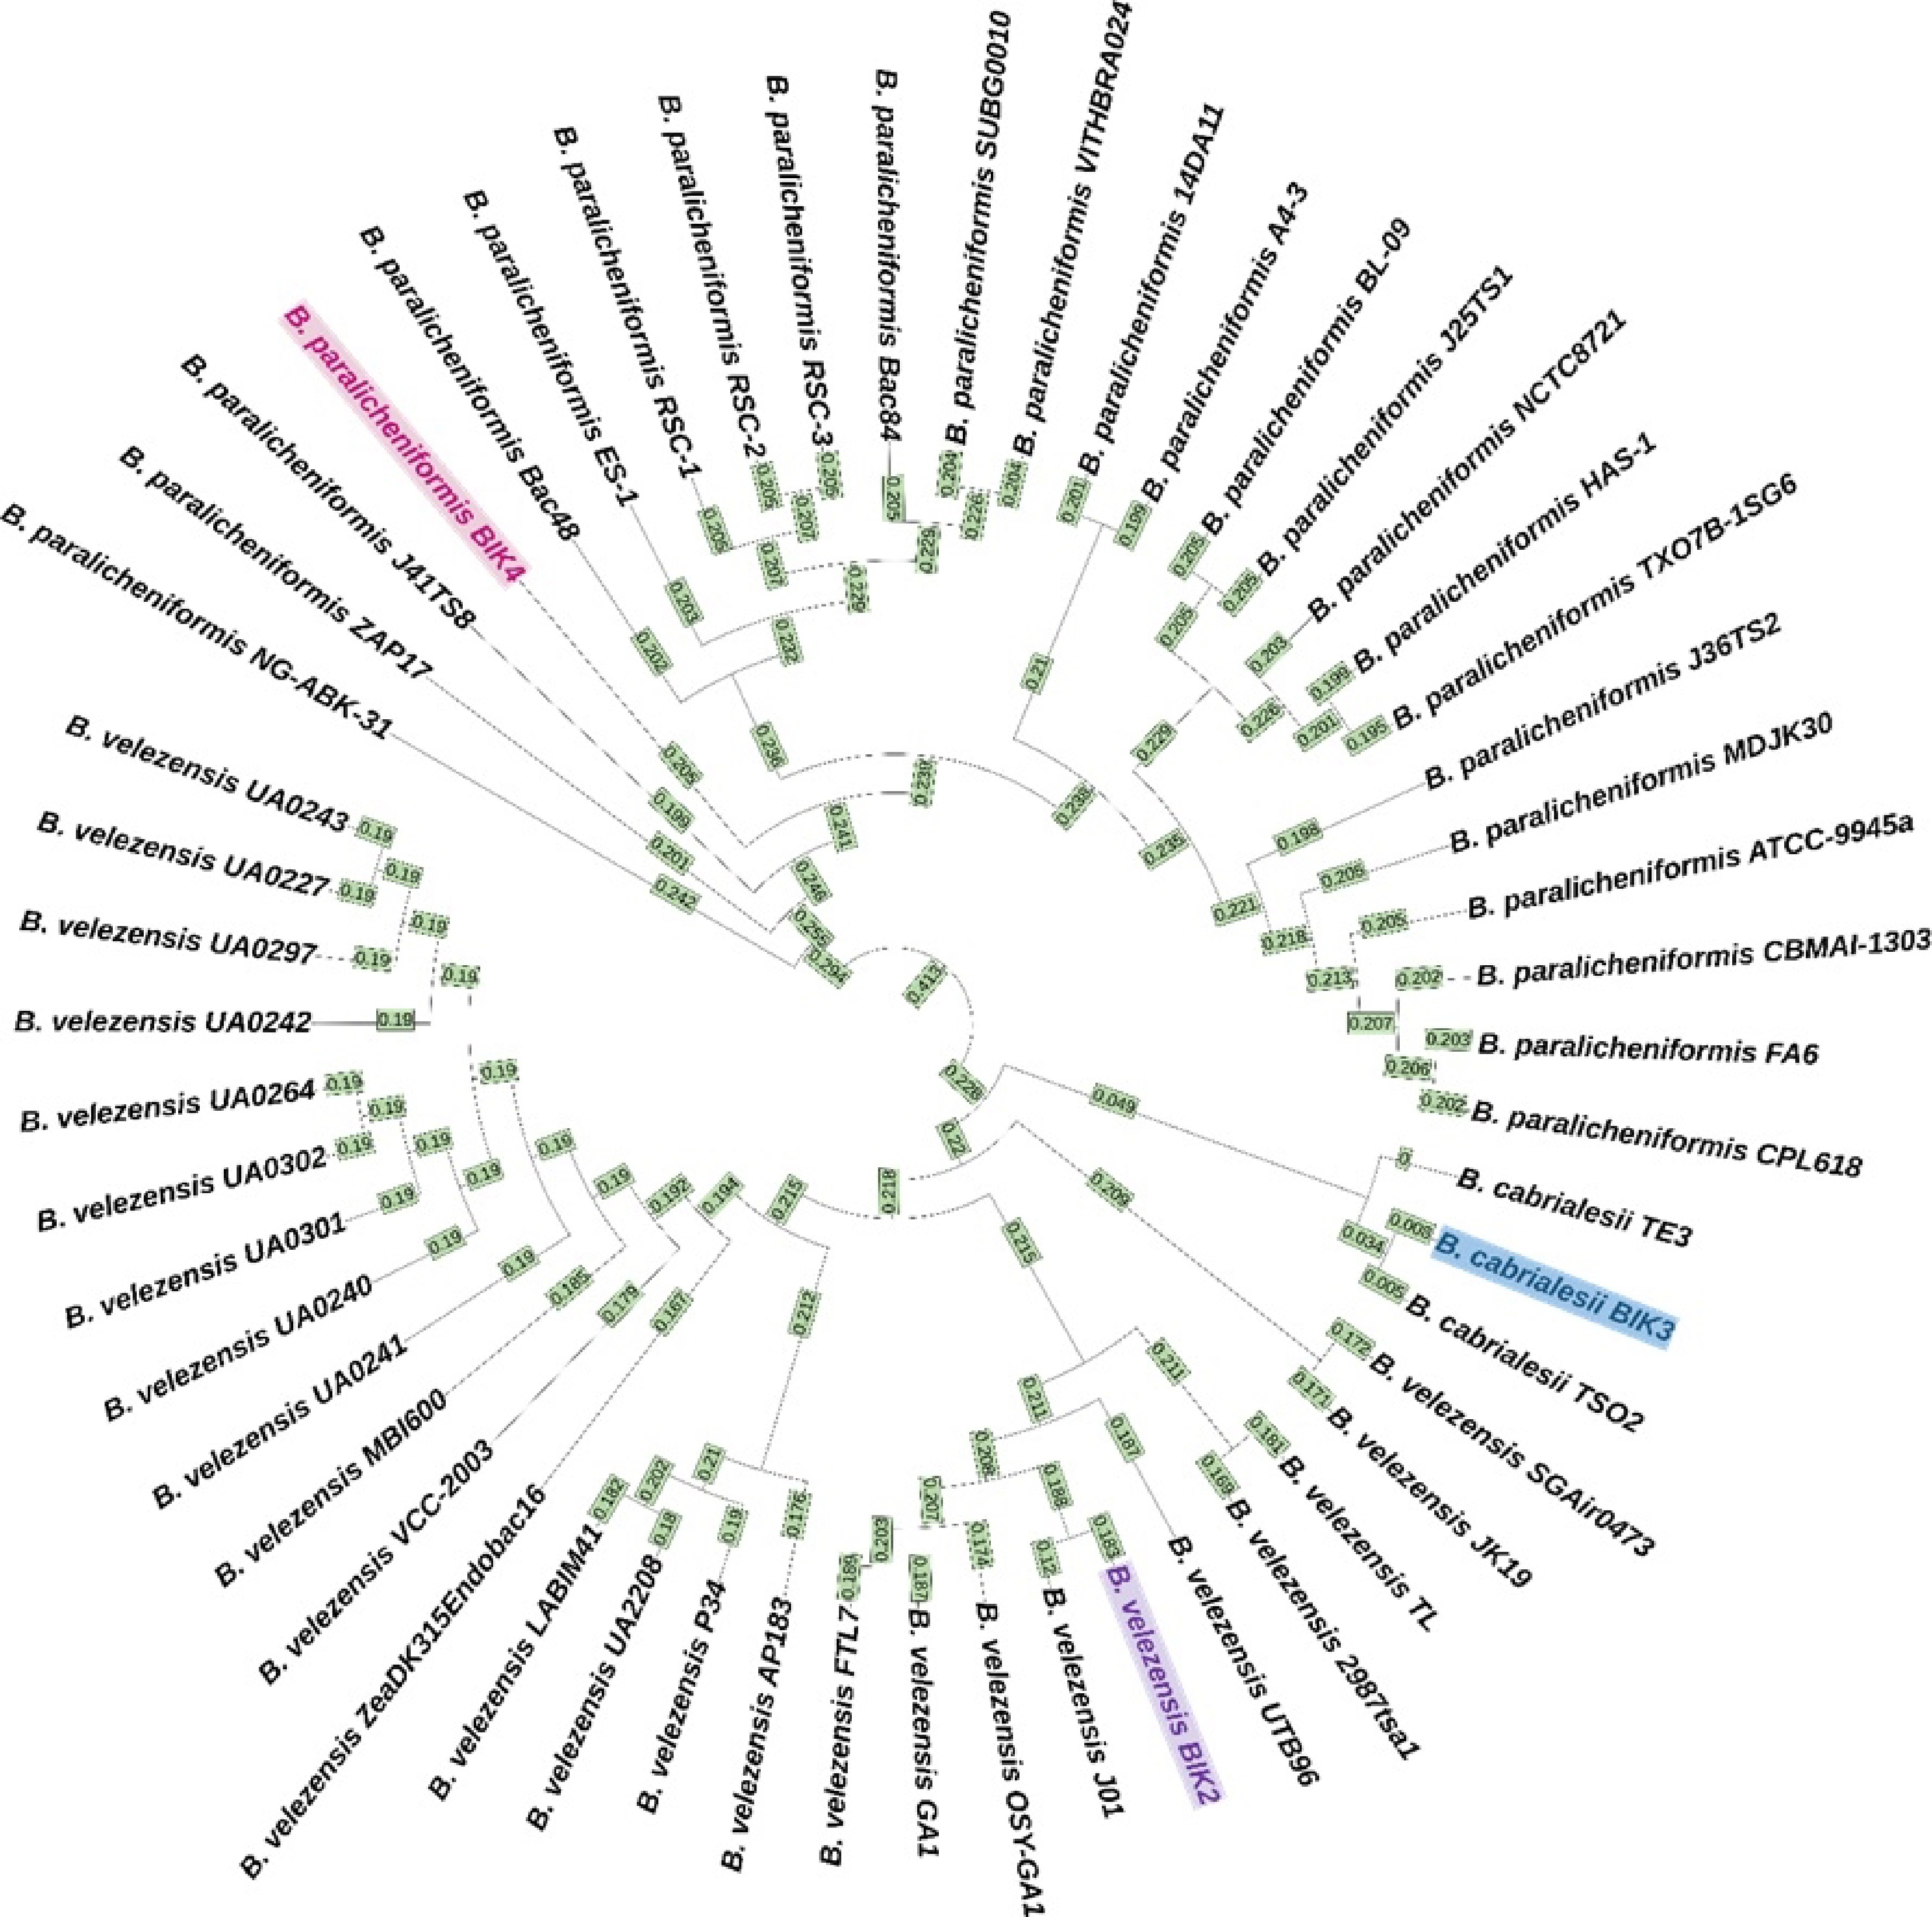
Figure 9.
Whole genome phylogenetic tree of BIK-2, 3 and 4. The tree is generated after whole genome alignment visualized with iTOL version 6.6. The isolates BIK-2, 3 and 4 are highlighted in different colours. Numbers on the branches denote the age of the node instead of raw branch length values. Farthest leaf in the tree has the age zero, and the age increases towards the root of the tree. Here, B. cabrialesii TE3 has node age 0, meaning that it is the farthest node. (The node age is restricted to three decimals).
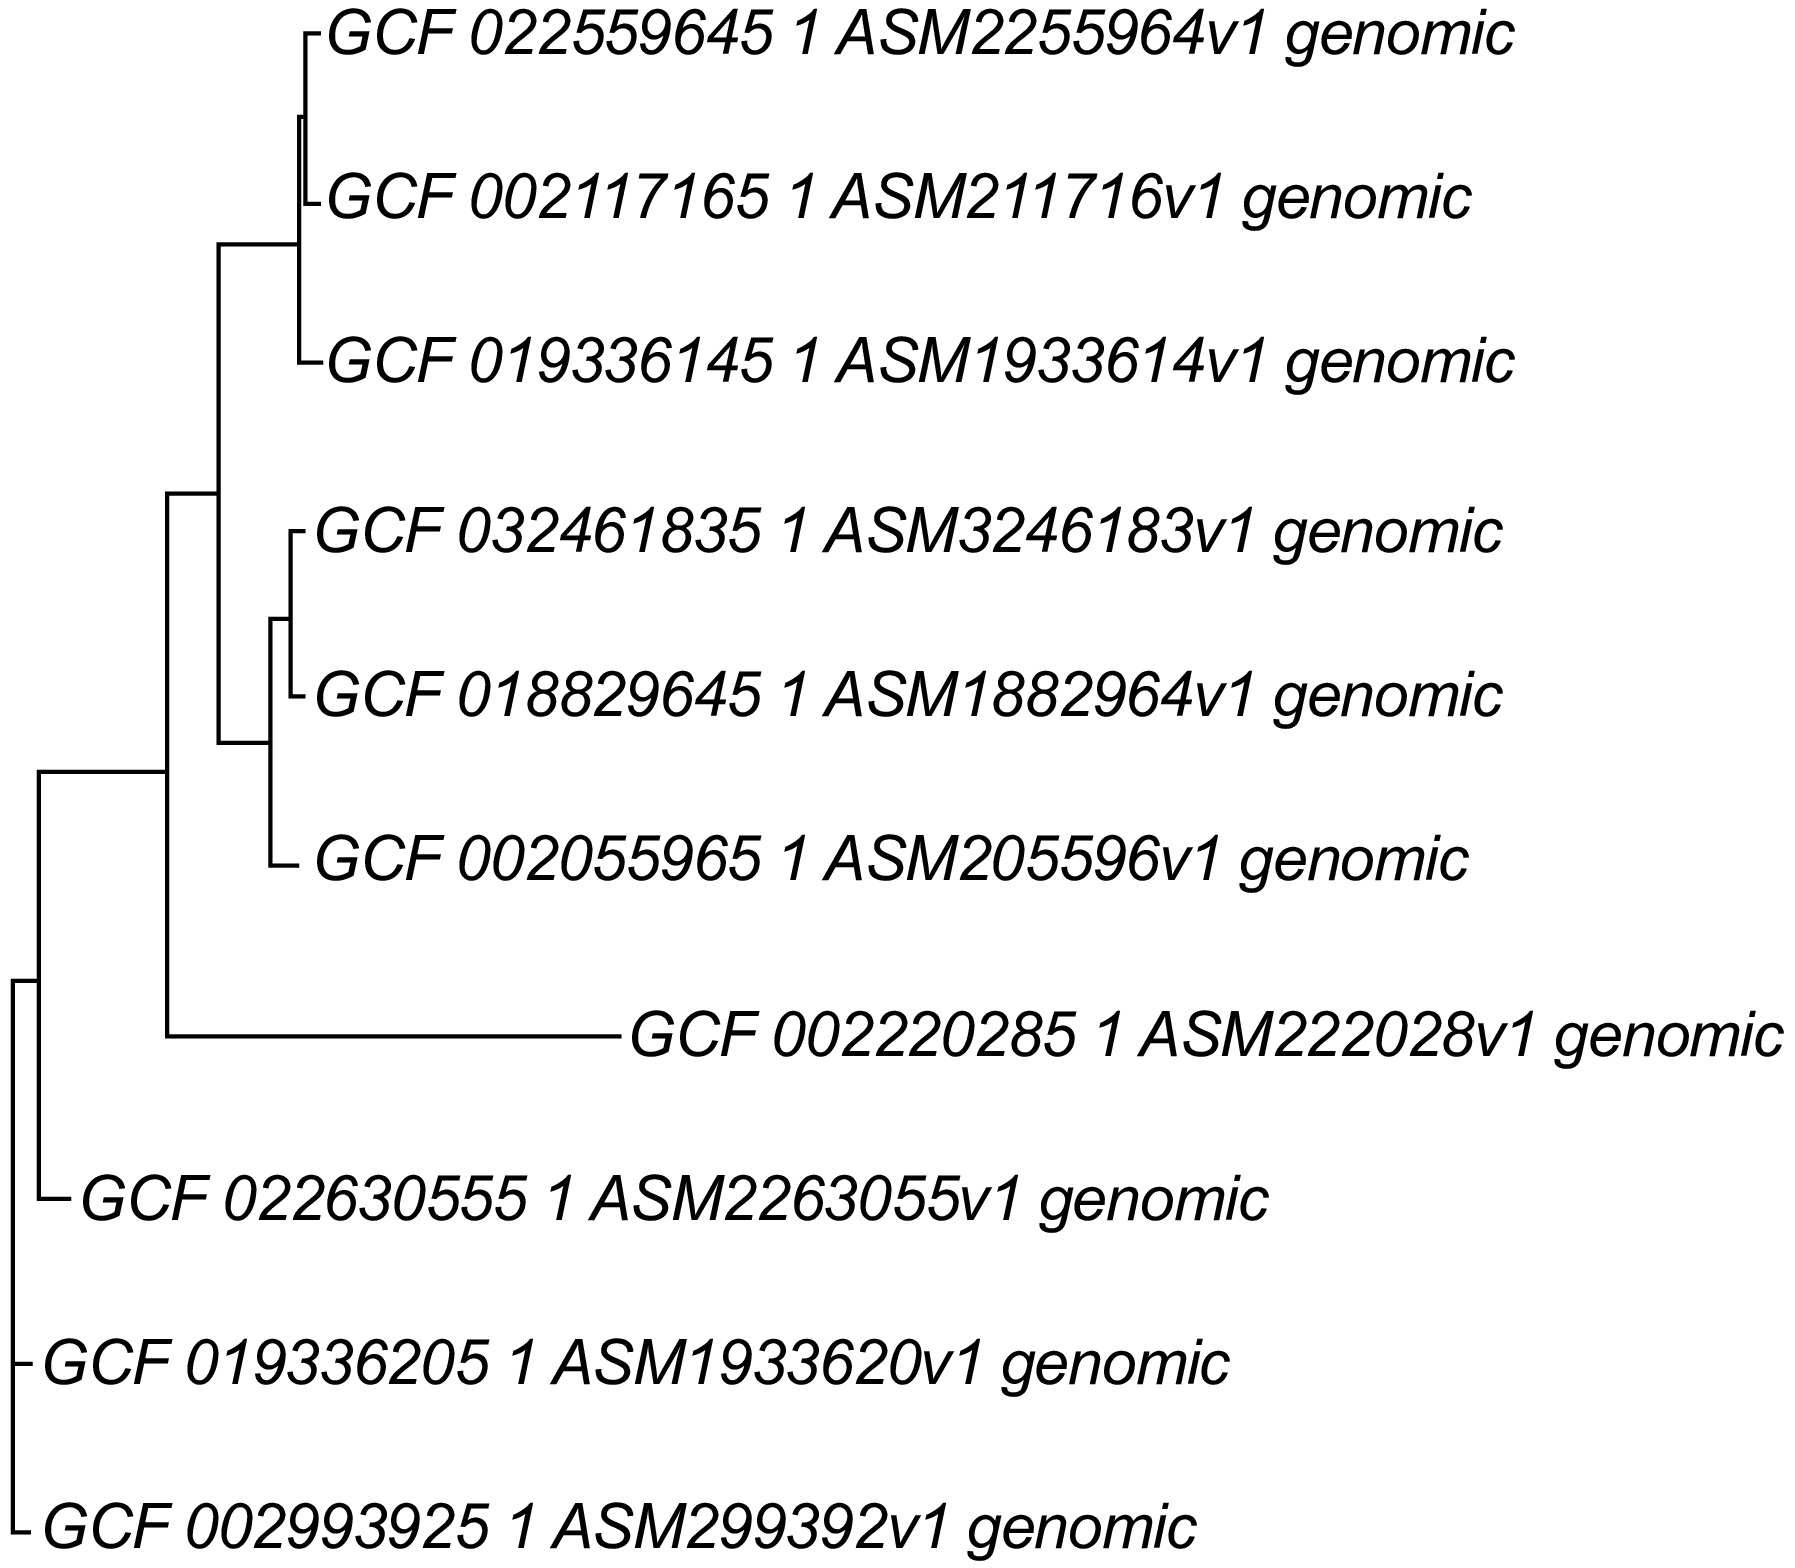
Figure 10.
Whole genome phylogeny using of beneficial Bacillus species using REALPHY programme. REALPHY web-based programme. Bacillus velezensis-BIK2 (GCF_019336145.1), Bacillus cabrialesii-BIK3 (GCF_018829645.1), Bacillus paralicheniformis-BIK4 (GCF_019336205.1), Bacillus amyloliquefaciens (GCF_022559645.1), Bacillus subtilis (GCF_002055965.1), Bacillus licheniformis (GCF_022630555.1), Bacillus velezensis (GCF_002117165.1), Bacillus cabrialesii (GCF_032461835.1), Bacillus paralicheniformis (GCF_002993925.1), Bacillus cereus (GCF_002220285.1). REALPHY uses phyML fast maximum likelihood methods for the analysis.
Digging for SM
-
Bacterial version of the antiSMASH software was used to analyze the genomic locations in the bacterial genomes to estimate their ability to produce antimicrobial SM. Accordingly the analysis of the BIK2 scaffold revealed its potential to produce surfactin, macrolactinH, bacillaene, fengycin, difficidin, bacillibactin, and bacilysin, were located in the genome with 100 % similarity of known clusters. These SM, notably, Difficidin and bacilysin are well-known antibacterial agents which may favorably contribute for the for the biocontrol activity of the bacterial strain. The table describes the antiSMASH bacterial version results of B. velezensis BIK2 for the detection of secondary metabolite encoding clusters along with their genomic locations. Clusters with a threshold similarity of more than 70% were considered. Many transport-related, regulatory and other genes were identified in BCGs of secondary metabolites. Analysis using BAGEL4 resulted in the identification of a class II lanthipeptide lichenicidin, which is a novel circular bacteriocin-amylocyclicin, competence pheromone ComX, and an antimicrobial peptide LCI. Along with several other NRPS and PKS compounds, RiPP molecules in the strain BIK3. Similarly, the SM compounds antibiotic dehydratase, subtilosin_A, competence pheromone ComX, and colicin. BAGEL4 identified sonorensin, enterocin, Fengycin and competence pheromone ComX were detected from the strain BIK4. Refer to Tables 2−4, Supplementary Table S8 for more details.
Table 2. antiSMASH bacterial version results of B. velezensis BIK2.
Type Biosynthetic class Location Most similar known cluster Similarity (%) transAT-PKS Polyketide 1,349,542−1,437,358 Macrolactin H 100% transAT-PKS, T3PKS, NRPS Polyketide + NRP 1,656,859−1,757,461 Bacillaene 100% NRPS, transAT-PKS, betalactone NRP 1,822,672−1,948,610 Fengycin 100% NRPS, RiPP-like NRP 2,974,339−3,026,132 Bacillibactin 100% Other Other 3,541,315−3,582,733 Bacilysin 100% transAT-PKS Polyketide + NRP 2,236,311−2,326,509 Difficidin 100% NRPS NRP 302,447−378,024 Surfactin 82% Table 3. Secondary metabolites identified by antiSMASH bacterial version for B. cabrialesii BIK3 scaffold.
Type Biosynthetic class Location Most similar known cluster Similarity (%) NRPS NRP: Lipopeptide 314,344−378,335 Surfactin 86% TransAT-PKS, T3PKS, NRPS Polyketide + NRP 1,718,221−1,823,173 Bacillaene 100% NRPS, transAT-PKS, betalactone NRP 1,893,277−2,016,972 Fengycin 100% NRPS NRP 3,046,631−3,093,767 Bacillibactin 100% Sactipeptide RiPP: Thiopeptide 3,643,594−3,665,205 Subtilosin 100% Other Other 3,668,257−3,709,675 Bacilysin 100% Table 4. Secondary metabolites identified by antiSMASH bacterial version for Bacillus paralicheniformis BIK4 scaffold.
Type Biosynthetic class Location Most similar
known clusterSimilarity
(%)NRPS NRP 334,165−396,222 Lichenycin 100% NRPS, betalactone NRP 2,028,578−2,099,
311Fengycin 86% Molecules having less than threshold % similarity were discarded. Proteins secreted and their secretory system in BIK2, BIK3, and BIK4
-
Class 1B chaperone prediction assisted estimation of Type III secreted proteins follows the explicit pattern (LMIF)1XXX(IV)5XX(IV)8X(N)10 according to Costa et al.[33]. The server analysis for strain BIK2 predicted 97 proteins with conserved binding sites to chaperones, 23 of which were located within the N-terminal regions of secreted proteins and additionally, the secretion of 180 type III molecules. For BIK3, the analysis Effective T3 from Effective DB revealed the presence of 198 secreted type III proteins and the identification of 82 proteins with conserved binding sites to chaperones with 28 within the N-terminal region. The BIK4 genome was found to code for 74 secreted type III proteins. 19 proteins having conserved binding sites for chaperones along with 14 being within the N-terminal region were detected (Supplementary Table S9).
Genes and their products in rice-Bacillus interaction and growth-promotion
-
Analysis of the genomes indicated that about 26% of the BIK2 genome is predicted to be involved in colonizing plant systems, 22% in stress and biocontrol activity, 21% in competitive exclusion, 12% in biofertilization, 10% in plant signal production, and 2% in plant immune response stimulation. It was further estimated that 39% of the BIK2 genome produces toxins, 21% extracellular polymeric substances, 7% in detoxification, 1% in plant cell wall degrading enzymes production, and 1% in volatile production. Notably, the BIK2 genome encodes for siderophores such as equibactin, mycobactin, petrobactin, coprogen, and rhizobactin along with Bacillibactin and Enterobactin. 36 genes are found to be involved in nitrogen acquisition, 80 genes in phosphate solubilization, 67 genes in potassium solubilization. Several genes such as iscR, pstA, pstC, arsB, arsC1, czcD, chrR, etc. are found to be present in BIK2, exhibiting resistance to heavy metals such as arsenic, chromate, cobalt, bismuth, copper, cadmium, and iron, etc. In all, 622 genes were identified as responsible for colonizing plant systems including attachment, adhesion, cell wall degradation (amyA, abnA, xynD, lacG, celJ, sacA, treC, xynC, srfJ, etc.), and invasion in the plant cell. 53 genes encoding toxic compounds for competitive exclusion exhibit resistance to surfactin, tetracycline, rifamycin, quinolone, etc. were identified. Seventy-two genes including regulators, transporter, quorum sensing, etc. are found to be involved in biofilm formation. BIK2 genes as bpsA and bpsB, involved in alkylresorcinol are found to have antiprotistal activity. Along with bactericidal molecules bacillaene, bacitracin, difficidin, and fengycin, predicted by antiSMASH and BAGEL4, PGPT-Pred can predict molecules such as nisin, plipastatin, cycloserine (antibiotic), cephaloporin (antimicrobial activity), toxoflavin (antifungal, antibiotic, phytotoxin), tylosin (macrolide antibiotic), spermidine and tetracycline. BIK2 genes encoding fengycin, bacillimycin, ansamitosin, and alkylresorcinol were found to have fungicidal activity. Genes such as gabP, gabT, and puuE involved in gamma-aminobutyric acid biosynthesis were found to have insecticidal activity. 716 genes/proteins from BIK2 were found to have a direct effect on plants, 1,924 indirect effects, and seven being predicted as putative plant growth-promoting molecules (Fig. 11).

Figure 11.
Distribution of BIK2 proteins. The figure explains PIFAR-Pred annotation and classification of BIK2 proteins interacting with host plants. Annotations are obtained from PIFAR protein collection after blastp + hmmer analysis.
Similar analysis of BIK3 genome indicated that 28% of its total genome is involved in colonizing plant systems, 22% in competitive exclusion, 21% in biocontrol and stress control activity, 10% in plant signal production, 11% in the biofertilization process, 2% in plant immune response stimulation. It was predicted that 35% of the BIK3 genome produces toxins, 25% extracellular polymeric substances, 2% plant cell wall degrading enzymes, 1% volatile substances, 8% detoxifying enzymes, 2% enzymes required for adhesion to plant, and 2% for movement. For BIK3, proteins involved in xenobiotic transport and production of bactericidal compound nisin were the most frequent class followed by siderophore Bacillibactin production, prodigiosin production, biotin biosynthesis (Vitamin B7) required for root colonization. Along with siderophores Bacillibactin and Enterobactin, coprogen, and mycobactin were predicted to be involved in iron acquisition. BIK3 53 genes were involved in nitrogen acquisition including genes involved in allantoin metabolism (allB, allC), glutamate transport (TC_AAT/yifK, gltP, ntrA), nitrogenase biosynthesis (nifS, nifU), and many other transports and regulatory molecules. BIK3 118 genes were predicted to be involved in phosphate solubilisation, whereas 101 in potassium solubilisation. Two genes TC_CIC|eriC and crcB were found to exhibit resistance to fluoride. 134 genes were found to exhibit resistance to heavy metals such as copper, nickel, manganese, tellurium, tungstate, lead, zinc etc. 29 cell wall degrading enzymes with many other cell attachment, adherence and invasion proteins were identified. 13 genes involved in niacin biosynthesis and 16 genes involved in biotin biosynthesis were found to be needed for root colonization. Genes such as glpT, glmS, maa|nodL, glpA|glpD, glpK and nodX were found to colonize roots by nodulation. Genes exhibiting resistance antimicrobial compounds included resistance to bacitracin, beta-lactam, bleomycin, catechol, bacitracin, chromanon, Lincomycin, fosfomycin etc. BIK3 128 genes were predicted to be involved in biofilm formation including several transporters, regulators, and signaling molecules. 45 proteins involved in thiamin (vitamin B1), riboflavin (vitamin B2), and proteins involved in 3-BUTANEDIOL_BIOSYNTHESIS were found to induce systemic resistance (ISR). 22 proteins were found to trigger PAMP response in plant. Genes bpsB, and bpsA products involved in alkylpyrone biosynthesis were predicted to have antiprotistal and bactericidal activity. Along with difficidin, bacillaene etc, molecules as auracin, spermidine, nisin, prodigiosin, nocardicin A−D (beta-lactam antibiotic), cycloserine etc were predicted to have bactericidal activity. BIK3 814 proteins were predicted to have direct effect on plants, 2,242 indirect effects with eight molecules being predicted to have PGPR activity. Presence of several fungicidal molecules were predicted to be involved in mycosubtilin metabolism, toxoflavin metabolism, fungal glycogen degradation, motility-mediated defence signaling etc. (Fig. 12).
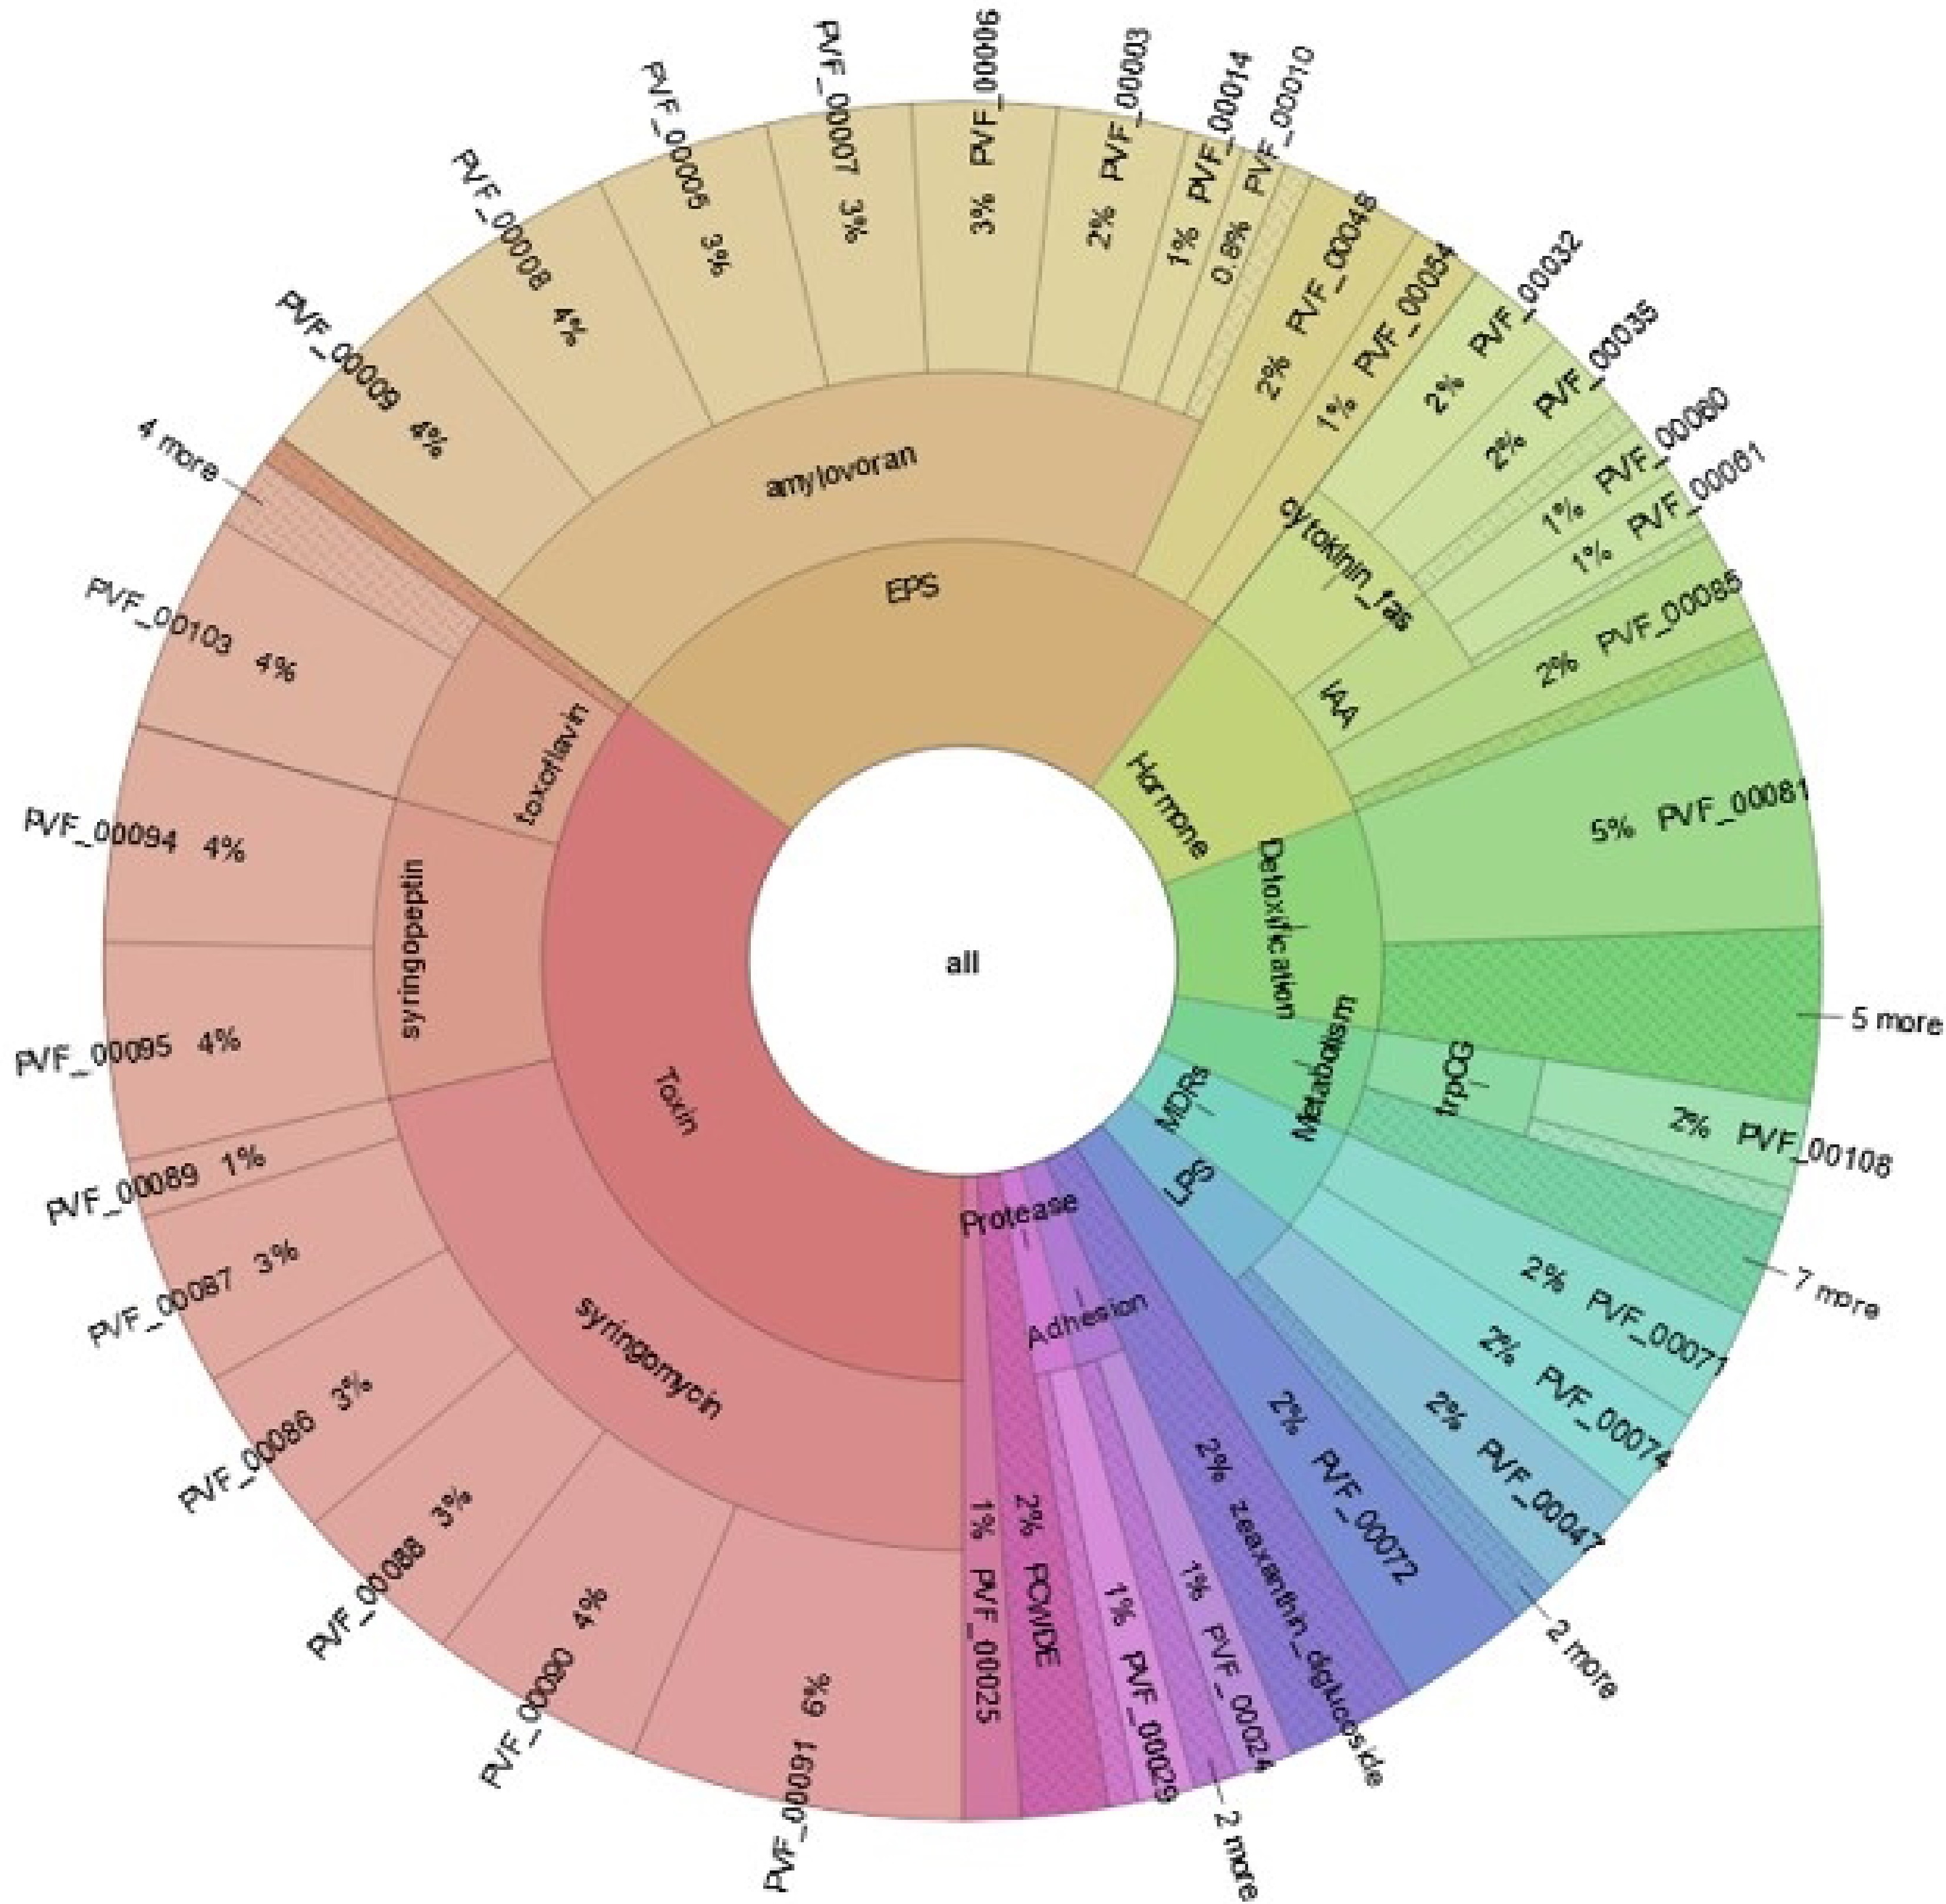
Figure 12.
Distribution of BIK3 proteins. The figure explains PIFAR-Pred annotation and classification of BIK3 proteins interacting with host plants. Annotations are obtained from PIFAR protein collection after blastp + hmmer analysis.
The analysis of BIK4 genome estimated that about 29% of the genome is to be involved in colonizing the plant system, 22% in biocontrol and stress control activity, 21% in competitive exclusion, 9% in biofertilization, 9% in plant signal production, 8% in bioremediation, and 2% in plant immune response stimulation. It was predicted that 38% of BIK4 genome is involved in toxin production, 16% in extracellular polymeric substance production (natural polymers required for biofilm structural and functional integrity), 5% in detoxification processes, 1% in volatiles production and plant cell wall degrading enzymes. BIK4 proteins interacting with plants were annotated and classified using PIFAR-Pred and PGPT_Pred at six different levels with their frequencies (Fig. 13). Production of bactericidal compounds/antibiotics and xenobiotic degradation by transport of proteins were the most frequent molecules in plant interaction. Presence of siderophores such as Bacillibactin, coprogen, desferrioxamine, petrobactin and rhizobactin were predicted to interact with plant. Presence of fluoride resistance gene crcB along with genes exhibiting resistance to heavy metals such as antimony, arsenic, bismuth, cobalt, copper, iron, manganese, nickel, tellurium, zinc, and tungstate were predicted to be in BIK4 genome. The server annotated BIK4 genes bsdA, bsdC and ubiX responsible for colonization to plant by inhibiting the activity of plant hormone salicylic acid. Also, several cell wall degrading enzymes encoding genes such as amylase (amyA), arabinanase (abnA), carrageenase (celF), galactosaminidase (nagZ), galactosidase (bgaB, bglA, melA) etc. were identified. It identified genes such as iunH, nadE, npdA etc. involved in niacin biosynthesis (vitamin B3) and genes such as fabF, fabH, bioA, bioB etc. involved in biotin biosynthesis (vitamin B7) required for colonization at plant root. In all 57 genes were found to be involved in biofilm formation including biofilm regulators, transporters, and quorum sensing response proteins. BIK4 is also predicted to produce riboflavin (vitamin B2), 3-butanediol (volatiles) and thiamine (vitamin B1) responsible for stimulating induced systemic resistance in plants. Two genes namely elf18 (bacterial EF-TU) and srfATE (surfactin) are found to trigger PAMP responses in plant. Along with the secondary metabolites identified through BAGEL4 and antiSMASH, PLaBASE identified several bactericidal molecules such as ansamitosin (antimicrobial, antifungal and antitumor activity), nisin (antibacterial peptide), aklavinone (antineoplastic agent), mithramycin (antineoplastic antibiotic), tetracycline, tetracenomycin etc. Also, phenazine, natural bacterial antibiotic, is found to be present in BIK4 genome which might help protect plants from diseases. Gene encoding gamma-aminobutyric acid (gabT) is found to exhibit insecticidal activity. 315 BIK4 proteins were predicted to have direct effects on plant, 909 indirect effects and two proteins were predicted to have putative plant growth-promoting activity (Supplementary Table S10; Fig. 14).
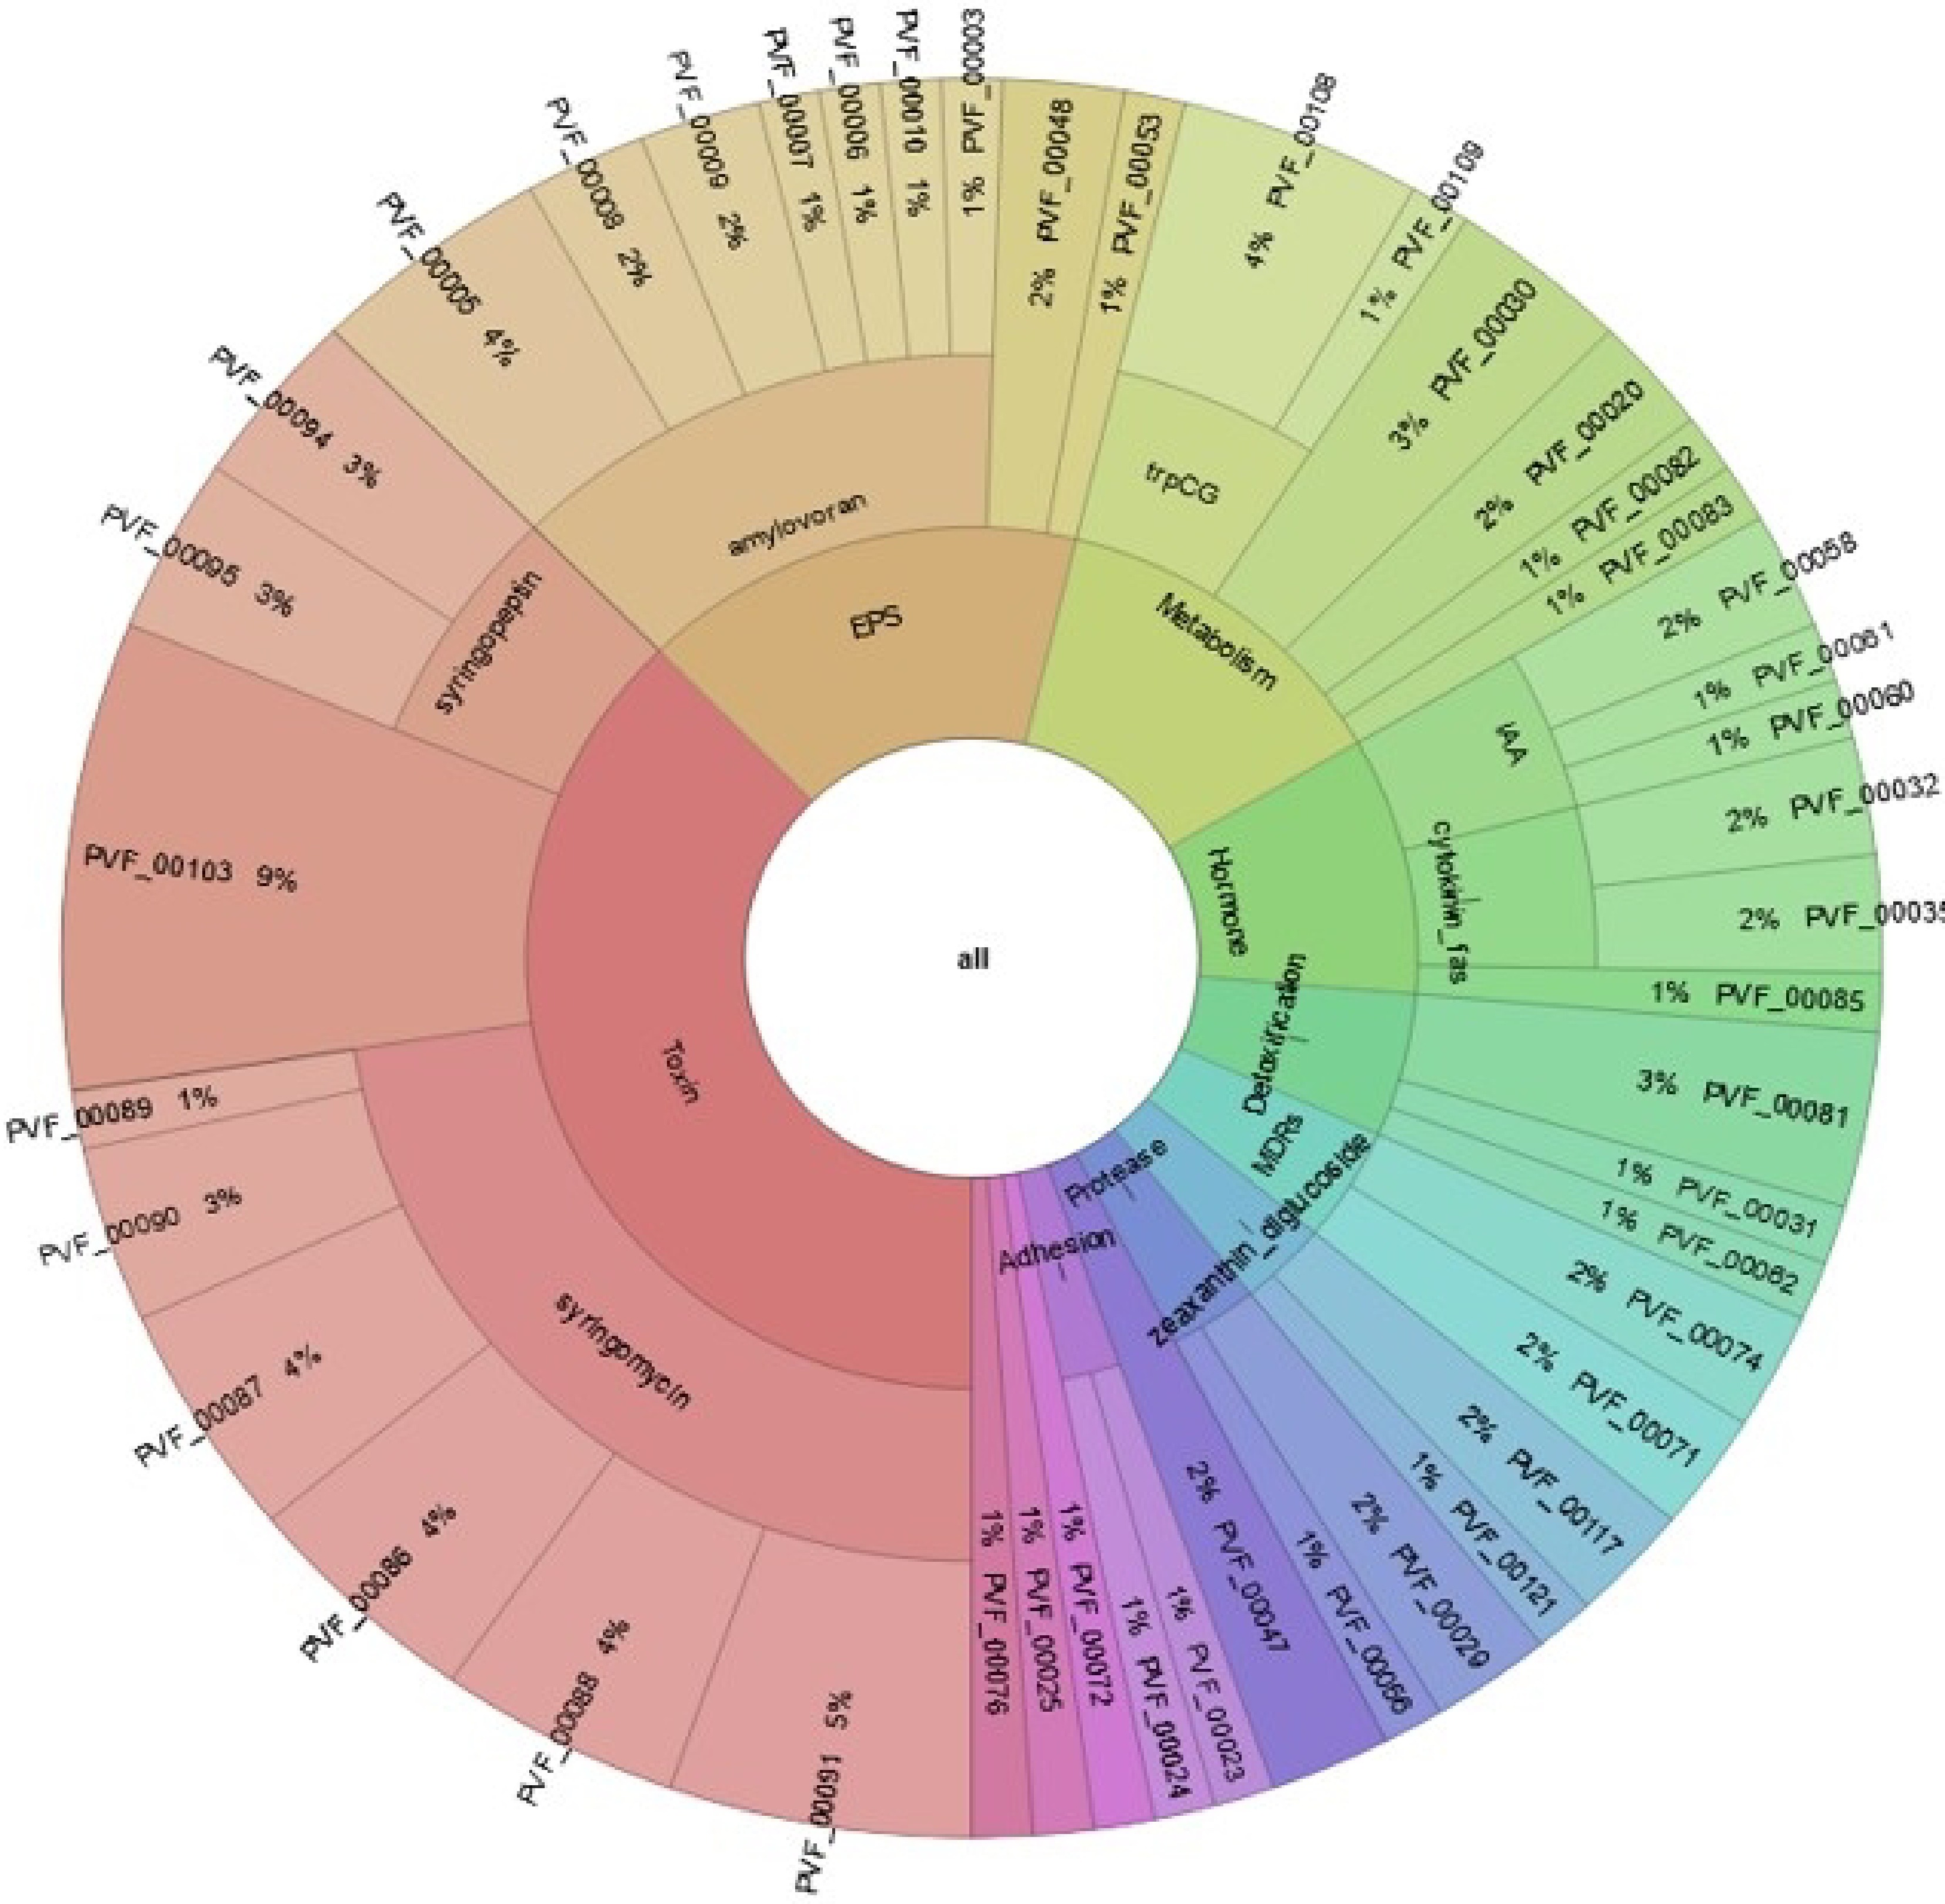
Figure 13.
Distribution of BIK4 proteins. The figure explains PIFAR-Pred annotation and classification of BIK4 proteins interacting with host plants. Annotations are obtained from PIFAR protein collection after blastp + hmmer analysis.
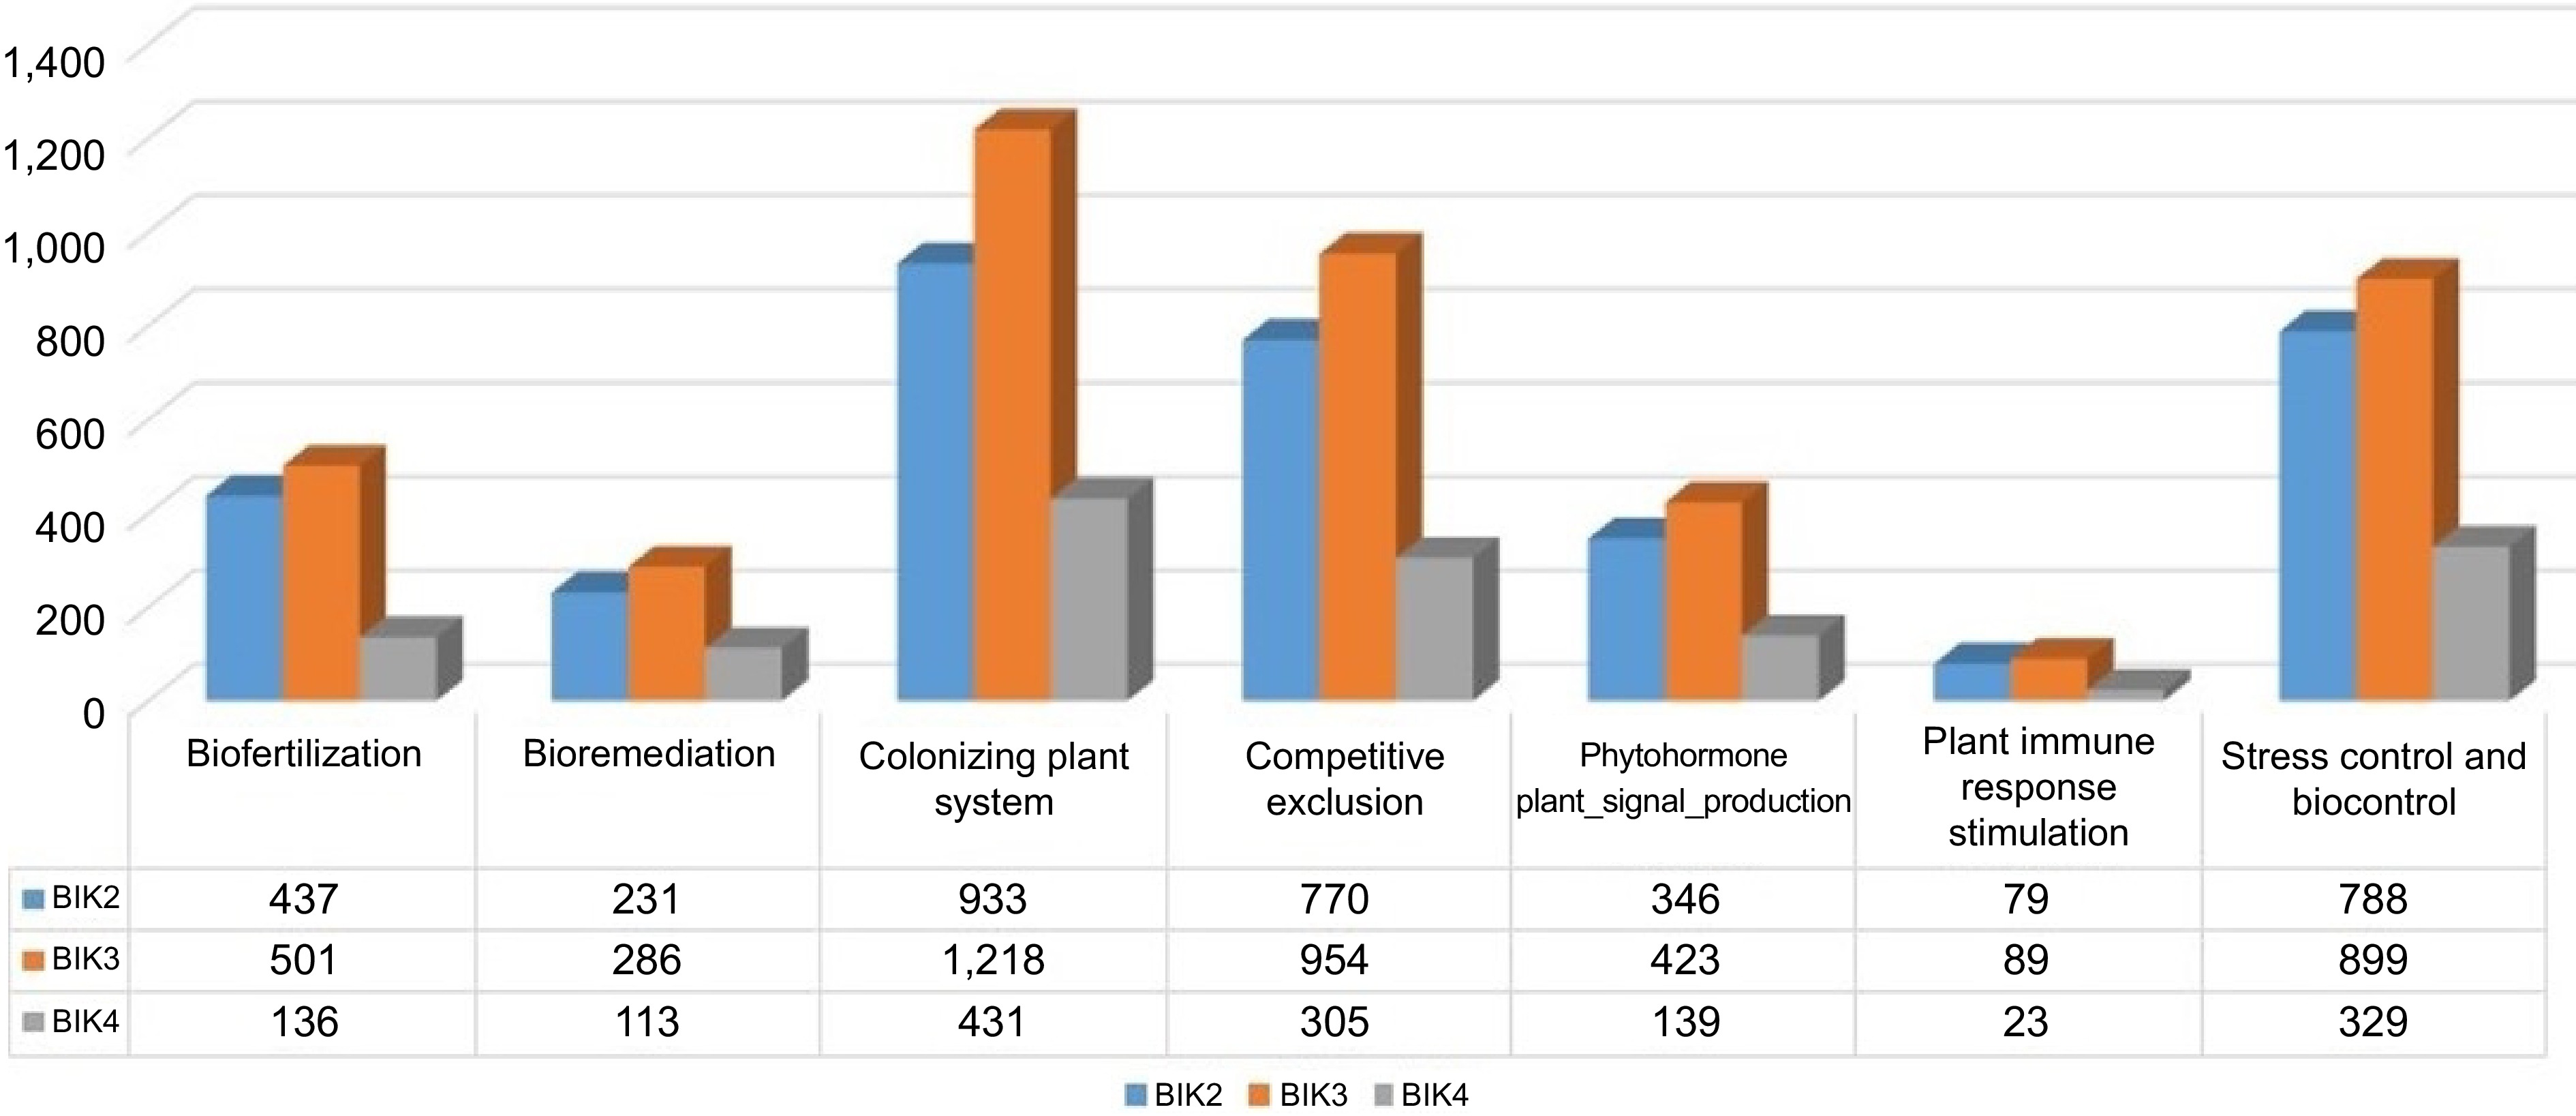
Figure 14.
Histogram showing distribution of bacterial proteins interacting with plant. BIK2, BIK3, and BIK4 proteins are found to interact with plants in various ways. Molecules are classified under different stages of interaction.
Identification of toxin-antitoxin pairs in the Bacillus isolates
-
Toxin-antitoxin systems have been classified into five types according to the molecular nature of the antitoxin and how it neutralizes the toxin. In the type II TA system, both the antitoxin and toxin are proteins and the neutralization is performed by forming a toxin-antitoxin complex. It shows that TA systems are related to the formation of persistence cells, stress resistance, regulation of biofilm formation, programmed cell death, and other biological process. Due to its contribution to genetic elements maintenance, TA systems could be extensively applied in genetic manipulation. For BIK2, the server predicted 15 pairs of TA systems. The pairs included the proteins from families COG2856like_domain, Xrelike_domain, mazF, and mazE. TAFinder resulted in no identification of the TA system in BIK3 and BIK4 genomes. PLaBASE, on the other hand, annotated 15 entries for TA systems in BIK3 and 8 entries for BIK4 (Supplementary Table S8). This suggests that PLaBASE, using its distinct algorithms or databases, identified potential TA systems in these genomes. The differences in results between TAFinder and PLaBASE could stem from variations in prediction methods, databases used, or the specific criteria for identifying TA systems. This could be due to the diversity of TA systems, variations in sequence motifs, or limitations of the prediction tool. Bacteria possess multiple mechanisms to cope with stress and ensure survival. While TA systems are one such mechanism, bacteria may rely on alternative systems, specific ecological niche of the bacterial strain or strategies to respond to environmental challenges (Supplementary Table S11).
SSR mining and primer designing
-
Ten SSRs for the CDS sequence of BIK2 were identified with one trimer ATC/ATG, 4 pentamers, and the most frequent hexamer AGGCGG/CCGCCT. For BIK3, 12 SSR markers were identified for CDS sequences with ATC/ATG trimer, AAAAC/GTTTT frequent pentamer, and four hexamers. For BIK4, one SSR marker AACGG/CCGTT was identified as p5 SSR type starting from the region 184−198 for ABC_transporter_permease (Supplementary Table S9). Out of 10, primers were designed for seven protein sequences viz. cell wall binding protein YocH, stage III sporulation protein AF, alanine tRNA ligase, GTPase Obg, ESX secretion system protein YueB, aminopeptidase YwaD, and one hypothetical protein for BIK2 CDS. For BIK3 CDS, primers were designed for putative transporter YdbO, zinc-specific metallo regulatory protein, and one hypothetical protein. No primers were designed for BIK4 (Table 5; Supplementary Table S12).
Table 5. Frequency of identified SSR motifs in BIK2, BIK3, and BIK4.
Parameters of SSR search BIK2 BIK3 BIK4 Parameters CDS CDS CDS The total number of sequences
examined3,743 3,326 1,238 The total size of examined
sequences (bp)3,481,005 2,998,222 1,108,330 A total number of identified SSRs 10 12 1 Number of SSR-containing sequences 10 12 1 Trimers 1 3 − Pentamers 4 5 1 Hexamers 5 4 − -
Biotic and abiotic factors have always affected the activities of bacteria and in response, bacteria have adapted to these stresses by mutating their genomes in terms of loss and/or gains of genes, and mobile elements. The BIK4 genome has been shown to have more prophage genes compared to BIK2 and BIK3. Several horizontally transferred genes have been identified in the three species which could be predicted to show antibiotic resistance. Genome finishing is done for BIK2, BIK3, and BIK4 allowing the visualization of maps of contigs, underlining the loss and/or gain of genetic elements, and permitting to finish of multipartite genomes. BIK4 was noted to have virulence gene clpE for Listeria monocytogenes EGD-e. Difficidin and bacilysin-like molecules are proven to have antibacterial activity[34]. Bacilysin is also known to have anticyanobacterial activity against harmful alga Microcystis aeruginosa and thus could be used as a targeted biocontrol agent[11]. Phosphate and potassium solubilizing properties and nitrogen acquisition properties of BIK2, BIK3, and BIK4 make these species more beneficial to the plants. Macrolactins are mostly produced by marine microorganisms. These have unique structures and novel activities. Different types of macrolactins exhibit different potentials for antibacterial, antifungal, antiviral, anticancer, anti-inflammatory, anti-angiogenic (against cancer), and other activities. Bacterial siderophores perform several functions like they alter the microbial community in the soil, promoting plant growth, and enhancing the bioremediation of heavy metals. Volatile organic compounds (VOCs), acetoin, and 2,3-butanediol produced by these species could be predicted to suppress virulent microbes. Fengycin, from BIK2, BIK3, and BIK4 can be said to have antifungal activity and may prove beneficial to plants to survive against fungal attacks. Several secreted effector molecules were predicted for BIK2, BIK3, and BIK4 genomes.
The genetic stability of the strains under different environmental conditions were checked rigorously by continuous application over two consecutive years across various field trials in different regions of India. The microbial strains were reisolated and compared with the initial load in the soil. The results have indicated an increase in the colony forming unit (CFU) content even in the following season in the same soils where the microbes were applied previously. This indicates that the microbial strains have better competitive saprophytic ability (CSA) to survive in the introduced soils. Furthermore, the strains have continuously shown robust antagonistic capacities throughout these studies, showing no evidence of genetic changes or diminished efficiency. This consistency across diverse environments indicates that these organisms are genetically stable and capable of maintaining their performance over long-term application[7−9]. The exploration of genomic features provides insights into the genetic composition, potential phenotypes, virulence factors, and defense mechanisms of the three bacterial genomes.
The presence of antibiotic-resistance genes and the diversity in CRISPR loci highlight the adaptive strategies and evolutionary dynamics of these bacteria. Further research could explore the implications of these genomic features in environmental adaptation, host interactions, and bacterial evolution. Understanding the presence of mobile genetic elements, such as prophages and genes associated with replication/recombination/repair, provides insights into the evolutionary history of these bacteria. This knowledge aids researchers in tracing the genetic changes and adaptations that have occurred over time, contributing to our understanding of microbial evolution. The diversity of genomic features, including mobile elements and CRISPRloci, highlights the genomic plasticity and adaptability of these bacterial genomes. Microbial research can delve into the specific environmental cues that trigger genetic changes, providing insights into how bacteria adapt to different ecological niches. Predictions related to phenotype, such as metabolic capabilities and lifestyle traits, offer valuable information for researchers studying the ecological roles of these bacteria. The whole genome alignment and GGDC results emphasize the genomic diversity among the Bacillus isolates. The variations in alignment lengths and super intervals suggest that each isolate has unique genomic characteristics. The identification of close relatives and reference genomes provides information on their evolutionary relationships, shedding light on the genetic variations that have occurred over time. The presence of secondary metabolites, including antibacterial agents like difficidin and bacilysin, underscores the biocontrol potential of these Bacillus isolates. These compounds have known antimicrobial activities and can contribute to the inhibition of pathogenic organisms in agricultural settings. All these three strains were naturally isolated from the soil, and phenotypically shown antagonistic ability against the major rice pathogens such as Rhizoctonia solani, Ustilaginoidea virens, Sclerotium oryzae, and Xanthomonas oryzae pv. oryzae under in-vitro and in-vivo conditions. These results shed light on the effectiveness of these strains against wide-range of diseases[7−9,16]. The identification of bioactive proteins and secretory systems further supports their role in biocontrol strategies[35−39]. Enterobactin is found to be responsible for inducing systemic resistance (ISR) in plants along with genes involved in thiamin biosynthesis (adk, dxs, phoA, rsgA, tenA, etc.), riboflavin biosynthesis (bluB, ribBA, ribD, ribE, ribF, yigB, etc.) and butanediol biosynthesis (acoA, acoB, acuA, acuB, budA, etc.). The gene entE involved in salicylic acid biosynthesis is found to induce systemic acquired resistance (SAR) in plants. Genes involved in flagellin-triggered immunity (fliC, flgK, fliD), surfactin production (srfAA, srfAC), teichuronic acid (tuaA, tuaB, tuaC, tuaE, tuaH, tuaG, wecA) are found to trigger PAMP response[40].
The SSR markers mined from the genomic data can be deployed in population genetic and molecular diversity studies and evolutionary analysis in a large collection of isolates. These SSR primers can be deployed to generate unique SSR profiles for bacterial isolates for providing specific genetic fingerprints, determination, and characterization. Hence, the mined SSR markers have added to the repertoire of the data available for these beneficial isolates[41].
The Bacillus strains used in the current study were isolated from natural soils and have been tested for their impact on plant growth and pathogen resistance in rice. These strains are safe for use in agriculture and are currently undergoing multilocation field trials in India to evaluate their efficacy and monitor potential ecological risks. The antibiotic resistance genes in these strains help individual microbes survive in soil and function efficiently. In addition to this the prediction of potential toxin-antitoxin systems in these genomes have led us to do more functional investigations and validation of their roles in the ecological adaptation and biocontrol potential of the strains in the future.
-
The genomic analysis of Bacillus isolates BIK2, BIK3, and BIK4 provides a comprehensive understanding of their genetic makeup and functional potential. It can be inferred based on the genomic features of the three isolates, BIK2, BIK3, and BIK4 employ diverse strategies, including toxin production, secondary metabolite synthesis, and biofilm formation, suggesting their versatility in environmental adaptation and plant-microbe interactions. The presence of genes involved in stress response, metal resistance, and biofilm formation indicates the adaptability of these Bacillus isolates to different environmental conditions. Harnessing these natural defense mechanisms could lead to the development of eco-friendly alternatives for disease and pest management in agriculture. The identification of novel secondary metabolites, antimicrobial compounds, TA systems, CRISPRs has implications for agriculture, biotechnology, and microbial ecology, contributing to ongoing efforts to harness the capabilities of beneficial bacteria for sustainable and resilient ecosystems.
Authors acknowledge the ICAR-Indian Institute of Rice Research for funding this work.
-
The authors confirm contribution to the paper as follows: study conception and design: Chinnaswami K, Barbadikar MB; data collection: Barbadikar MB, Chinnaswami K, Attal N; analysis and interpretation of results: Barbadikar MB, Attal N; draft manuscript preparation: Attal N; practical experiments and timely inputs: Vanama S, Pesari M; technical check: Kattupalli D; project supervision and critical comments: Sundaram RM; overall supervision and critical revisions: Chinnaswami K. All authors reviewed the results and approved the final version of the manuscript.
-
All data generated or analyzed during this study are included in this published article and its supplementary information files.
-
The authors declare that they have no conflict of interest.
-
# Authors contributed equally: Kalyani M. Barbadikar, Neha Attal
- Supplementary Table S1 WGA genomes of BIK2, BIK3, BIK4.
- Supplementary Table S2 GGDC of BIK2, BIK3, BIK4.
- Supplementary Table S3 DFAST annotation of BIK2, BIK3, BIK4.
- Supplementary Table S4 FACoP of BIK2, BIK3, BIK4.
- Supplementary Table S5 PhenDP of BIK2, BIK3, BIK4.
- Supplementary Table S6 VRprofile of BIK2, BIK3, BIK4.
- Supplementary Table S7 CRISPRloci of BIK2, BIK3, BIK4.
- Supplementary Table S8 antiSMASH of BIK2, BIK3, BIK4.
- Supplementary Table S9 Effective DB of BIK2, BIK3, BIK4.
- Supplementary Table S10 PLaBAse of BIK2, BIK3, BIK4.
- Supplementary Table S11 TAFinder of BIK2, BIK3, BIK4.
- Supplementary Table S12 Misa-BatchPrimer-3 of BIK2, BIK3, BIK4.
- Copyright: © 2024 by the author(s). Published by Maximum Academic Press, Fayetteville, GA. This article is an open access article distributed under Creative Commons Attribution License (CC BY 4.0), visit https://creativecommons.org/licenses/by/4.0/.
-
About this article
Cite this article
Barbadikar KM, Attal N, Vanama S, Pesari M, Kattupalli D, et al. 2024. Benign Bacillus: decoding the genetic potential of native rhizosphere Bacillus spp. from rice, to induce plant growth and defense. Technology in Agronomy 4: e032 doi: 10.48130/tia-0024-0028 

Benign Bacillus: decoding the genetic potential of native rhizosphere Bacillus spp. from rice, to induce plant growth and defense
- Received: 18 July 2024
- Revised: 11 September 2024
- Accepted: 19 September 2024
- Published online: 05 December 2024
Abstract: Three bacterial strains namely Bacillus velezensis Strain BIK2, B. cabrialesii Strain BIK3, and B. paralicheniformis Strain BIK4, were extracted from indigenous rice soils in India. These strains demonstrated potent efficacy against major pathogens while stimulating plant growth in rice. Their genomic analysis indicated a rich array of genes associated with secondary metabolite production, plant growth promotion, elicitation, and biocontrol activities. Biosynthetic gene clusters having different classes of secondary metabolites surfactin, macrolactinH, bacillaene, fengycin, difficidin, bacillibactin, and bacilysin were identified using various online tools. This information may be used as template for identification of novel bioactive antibacterial, antifungal, and organic plant growth-promoting compounds. Toxin-antitoxin gene pairs identified could play roles in their antibiotic resistance and prevention of harmful deletions in the bacterial genomes. CRISPRs detected in these isolates offer prospects for future gene editing and patenting endeavors. Notably, the genomic profiles of BIK2, BIK3, and BIK4 underscore their emphasis on plant growth enhancement, evident through the presence of genes facilitating nitrogen fixation, phosphate, and potassium solubilization, and siderophore production. This comprehensive genomic insight paves the way for tailored Bacillus strains, facilitating the industrial production of efficacious biomolecules for enhancing plant growth, controlling pathogens, and advancing pharmacological applications.