


-
Modern agriculture has been revolutionized by producing high-quality horticultural crops in controlled environments, particularly hydroponic systems. Lettuce, a staple in global agriculture, has garnered significant attention in the past two decades due to its adaptability in soilless hydroponic systems. As a versatile leafy vegetable, it is an ideal crop for studying the impacts of environmental factors on plant growth and development. The major versatility of lettuce in hydroponics is underscored by its short crop cycle, low labor demands, high water use efficiency, and economic significance in modern horticulture[1,2]. In 2015, the USDA National Agricultural Statistics Service (NASS) reported that US lettuce production was 119,000 acres which increased to 333,100 acres by 2023. The number of farms growing lettuce on 5 acres or fewer increased by 38% between 2007 and 2012. In 2015, lettuce production in the United States was worth about USD
${\$} $ ${\$} $ ${\$} $ ${\$} $ Lettuce, being a primary crop for hydroponic cultivation, enables plant scientists to understand how varying environmental conditions impact its physiology and morphology[4,5]. In addition, lettuce is an important crop for Controlled Environment Agriculture (CEA) systems due to its economic viability in CEA. Therefore, it is crucial to optimize resource use efficiency (lower EC) and the environment to promote plant growth and health. On the other hand, hydroponic systems, characterized by soilless cultivation, have revolutionized agricultural practices, offering precise control over nutrient supply and environmental conditions. In these systems, plants receive nutrients dissolved in water and the total amount of dissolved ions in the solution is referred to as electrical conductivity (EC). The ideal range of EC ensures optimal uptake and assimilation of water and essential mineral nutrients into plant tissue that has the potential to rapidly increase biomass and phytonutrient concentrations that are critical for high-quality produce[6,7]. The delicate balance among nutrient availability, water potential, and osmotic pressure is important for optimizing lettuce growth and yield in hydroponics[2,8,9]. The impact of EC levels on lettuce growth is multifaceted. Higher EC levels often indicate increased salt concentrations, affecting nutrient availability and osmotic balance[10]. High EC water sources may contain elements harmful to plant health to prevent adverse effects on crop growth and yield[11,12]. The addition of fertilizers to already high EC solutions could exceed the optimal EC range for plant growth, leading to physiological stress and reduced crop performance. High baseline EC can also restrict the choice and quantity of fertilizers that can be added without surpassing the crop's EC tolerance threshold, complicating nutrient management strategies[11,13]. Additionally, higher EC can lead to alterations in stomatal conductance (gs), transpiration rate (E), leaf temperature (Tleaf), and ultimately, fresh mass (FM) production[14]. Stomatal conductance, pivotal for net CO2 assimilation (A) has been shown to decrease under higher EC conditions, potentially reducing E and impacting water usage efficiency[11,15,16]. Previous research has indicated that high EC can have a negative impact on yield when compared to an optimal range. For example, Conversa et al.[15] demonstrated that lettuce grown at 3.5 mS·cm−1 had a slight reduction in lettuce yield compared to a 2.5 mS·cm−1 treatment. Additionally, research results from Ding et al.[12] demonstrated that pakchoi (Brassica campestris L. ssp. Chinesis) grown under very high EC levels topping 9.6 mS·cm−1 had decreased plant biomass, photosynthetic efficiency, gs, and E. Conversely, lower EC levels indicate inadequate nutrient supply, impacting overall plant vigor and growth[17,18]. For instance, Sublett et al.[6] found that low nutrient solution EC treatments negatively affected lettuce cultivars 'Winter Density' and 'Rhazes' biomass and significantly impacted mineral and phytonutrient concentrations in the leaf tissue. Furthermore, lower EC can result in higher water uptake and increased E to compensate for nutrient deficiencies[19,20]. Lower EC can also have a significant negative impact on plant biomass, photosynthetic efficiency, gs, and E[7,11].
The EC of the nutrient applied in the hydroponic solution plays an important role in nutrient availability and uptake. Besides, seasonal change also has a major impact on the EC of the nutrient solution which can alter the lettuce yield and quality. Managing EC levels is essential for optimizing lettuce yield and quality, as fluctuations can lead to significant physiological changes within the plant. In the US, where hydroponic systems are increasingly popular for lettuce production, precise control of EC can prevent potential yield losses, which are critical given lettuce's role as a staple in diets and its economic importance in the agricultural sector. The current study aims to explore the seasonal dynamics of lettuce responses to varying EC levels. The hypothesis posits that different EC levels will elicit varied physiological and morphological responses in lettuce across different seasons. By examining the impact of EC on plant physiology parameters such as gs and E, Tleaf, and biomass production, this study endeavors to provide comprehensive insights into optimizing hydroponic conditions for enhanced lettuce growth in different growing seasons.
-
Three independent-season greenhouse experiments were undertaken from June 2022 to March 2023 in the greenhouse at North Mississippi Research and Extension Center, Verona, Mississippi State University (USA) (34°09'53.2" N, 88°43'28.5" W). Lettuce (Lactuca sativa L.) 'Cegolaine Bibb' (CB) seeds were purchased from Johnny's Selected Seeds (Fairfield, ME, USA). The seeds were first sown into rockwool cubes (3.81 cm × 3.81 cm × 3.81 cm; CropKing, Lodi, OH, USA) and germinated in growth chambers (E-41L2, Percival Scientific, Perry, IA, USA) with 70%−80% relative humidity, 22−28/16−20 °C day/night temperatures with a 16-h photoperiod. Light intensity was constant during the day growth period at 350 μmol·m2·s−1, calculated to a 20.16 daily light integral. Twenty-one days after sowing, lettuce seedlings were transplanted into a nutrient film technique (NFT) hydroponic system in a greenhouse environment (North Mississippi Research and Extension Center, Verona, MS, USA; 34° N, 89° W) at 22−28/16−20 °C (day/night), with RH ranging from 55−80. The nutrient solution was made up of a 5-11-26 (N-P-K) hydroponic special fertilizer (Peters Professional, Summerville, SC, USA) and 15.5-0-0 + 19% calcium nitrate (YaraLiva Calcinit; Yara North America, Tampa, FL, USA). The initial average EC of water without nutrient addition was less than 0.4 mS·cm−1 and pH was mostly between 6.8 to 7.1 for all the seasons. Newly established plants were put into the NFT system containing half-strength nutrient solution until plants were at the sixth leaf stage, then the solution was changed to the final full-strength solution. The final concentration (ppm) of N-P-K + Ca was N (178), P (1.0), K (229) and Ca (153). Detailed information on added nutrients and their estimated EC and estimated Na and Ca are mentioned in Table 1. The solution was added every two to three days to make up for transpiration loss, and the entire solution was replaced every week.
Table 1. Electrical conductivity of different nutrient treatment concentrations and their nitrogen and calcium content.
Concentration 5-11-26 (g) 15.5-0-0 (g) EC (dS·m−1 or mS·cm−1) Nitrogen (ppm) Calcium (ppm) 200% 184.27 121.9 3.8−4.4 300 232 100% 92.13 60.95 1.9−2.2 150 116 50% 46.06 30.47 0.9−1.1 75 58 25% 23.03 15.23 0.45−0.6 37.5 29 The experimental design was a randomized complete block with four EC concentrations of 0.5 (the lowest), 1.0 (lower), 2.0 (control/reference), and 4.0 mS·cm−1 (high) and lettuce plants grown over three environmental seasons spring, summer, and winter. Each growing season lasted for 56−60 d from the day of sowing till harvest. Plants were arranged within two blocks, six replications, and six plants per replication. Electroconductivity readings were measured weekly with a portable pH/EC meter (Accumet AP85; Fisher Scientific, Hampton, NH, USA). The water pH was adjusted to 6.8−7.1 using either phosphoric acid or bicarbonates depending on the basicity or acidity in the water.
Data collection
Physiological traits
-
The gs, E, quantum efficiencies of photosynthetic electron transport through photosystem II (PhiPS2), and Tleaf were measured on the fully expanded young third leaf before the destructive harvest (35 d after transplanting) using a portable handheld LI-600 porometer system integrated with a fluorometer (LI-COR Biosciences, Lincoln, USA). On bright days, all measurements were obtained on the third fully developed third leaf across all treatments between 10:00 a.m. and 12:00 p.m.
Plant morphology measurements
-
Lettuce plants were harvested 35 d after transplant (DAT) by replication and treatment. Plants were cut at the base of the plant and above-ground leaf tissue was weighed for FM. After weighing for FM, plant leaf tissue was dried in a forced-air oven (Sheldon Manufacturing Inc., Cornelius, OR, USA) for 48–72 h at 80 °C then weighed again to determine plant dry mass (DM).
Data analysis
-
Statistical analysis of the data was performed using SAS (version 9.4; SAS Institute, Cary, NC, USA). Data were analyzed using PROC GLM analysis of variance (two-way ANOVA) followed by mean separation. The standard errors were based on the pooled error term from the ANOVA table. Tukey's HSD test was used for the mean separation. The differences were considered significant when p < 0.05. The library 'ggpubr' was used to create the bubble plot. All graphs and figures were generated using Excel and R version 4.2.2 (
www.R-project.org , R Core). -
In winter, FM at EC 4.0 increased by approximately 29.3% compared to EC 2.0, whereas EC 0.5 and EC 1.0 decreased by about 23.4% and 24.8%, respectively, compared to EC 2.0 (Fig. 1). On the other hand, spring lettuce indicated a minor increase in FM at EC 4.0 of about 2.1% compared to EC 2.0. EC 0.5, and EC 1.0 displayed more significant decreases of approximately 44.0% and 17.0%, respectively. During summer, there was a striking increase in FM at EC 4.0 by about 23.6% compared to EC 2.0. In contrast, EC 0.5 and EC 1.0 demonstrated a considerable decline of approximately 65.2% and 27.5%, respectively, relative to EC 2.0 (Fig. 1).
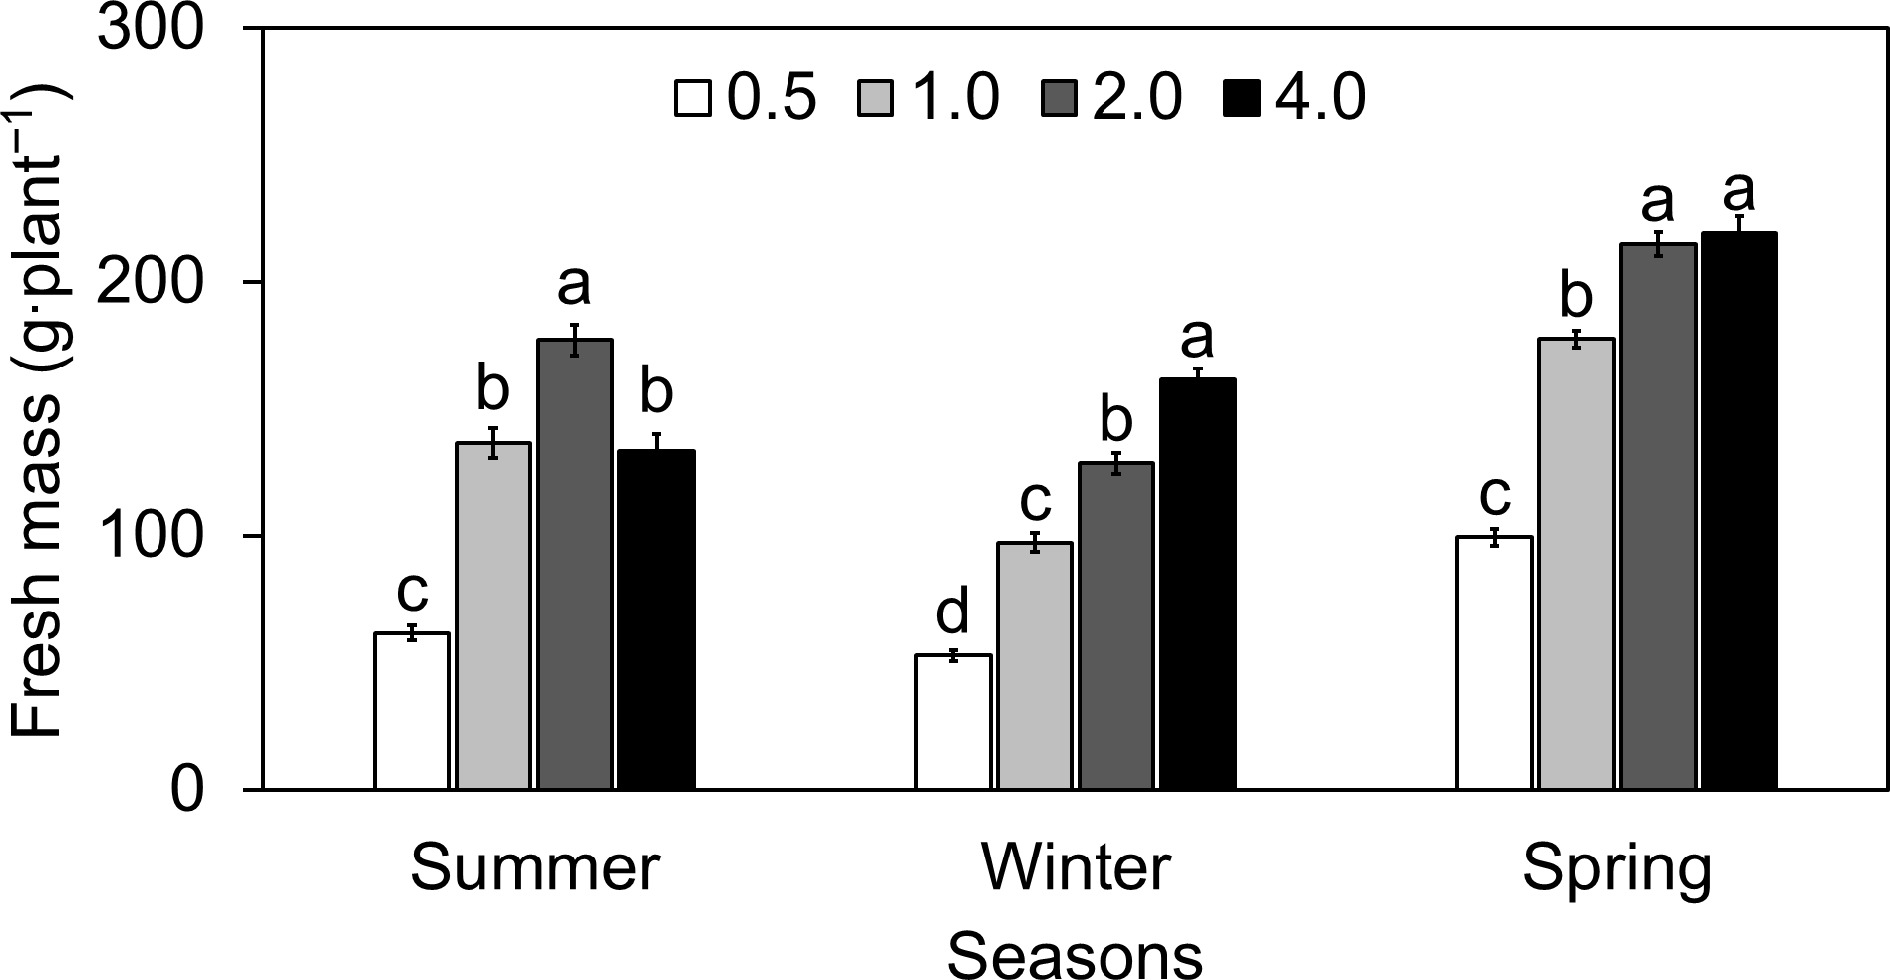
Figure 1.
Effect of different electrical conductivity (EC) treatments (0.5 mS·cm−1, 1.0 mS mS·cm−1, 2.0 mS·cm−1, and 4.0 mS·cm−1) on lettuce fresh mass (FM) at different growth seasons of 2022−2023 (Summer 2022, Winter 2022, and Spring 2023). Data represents ± SE (n = 12). Different letters indicate significant differences at p < 0.05.
During the summer, the DM accumulation peaked at 2 EC 2.0, with an average of 6.7 g per plant (Fig. 2). Notably, an increase to EC 4.0 resulted in a slight decrease in DM to 5.9 g per plant. DM at EC 0.5 and EC 1.0 showed a decline of approximately 31.8% and 8.0% respectively when compared to the DM at EC 2.0. An increase in EC 4.0 resulted in a DM decrease of about 10.5% compared to EC 2.0, indicating a decline in growth at higher EC levels. The winter presented a different trend, with DM significantly increasing with the rise in EC levels. The lowest recorded DM at EC 0.5 was 2.5g, which progressively increased to 4.5 g at EC 4.0. On the other hand, the lettuce exhibited a continual increase in DM with increasing EC levels. The lowest DM was observed at EC 0.5 with 6.6 g, and the highest at EC 4.0 with 10.745 g (Fig. 2).
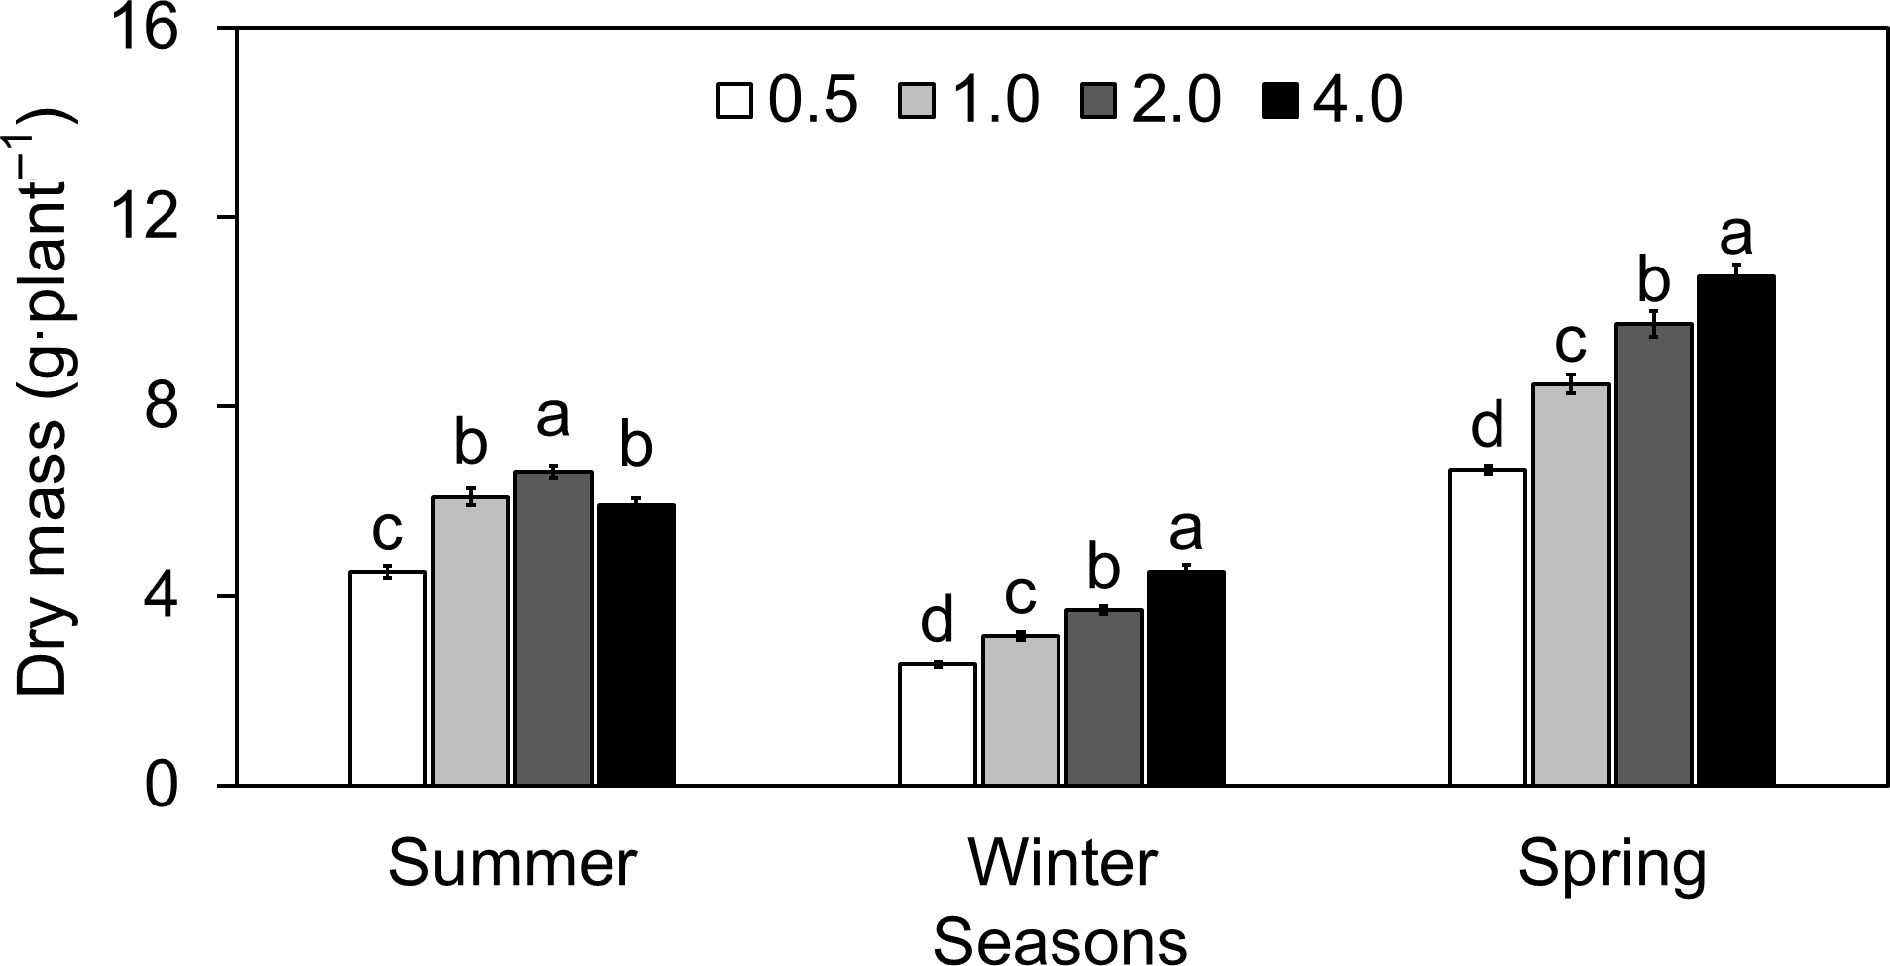
Figure 2.
Effect of different electrical conductivity (EC) treatments (0.5 mS·cm−1, 1.0 mS·cm−1, 2.0 mS·cm−1, and 4.0 mS·cm−1) on lettuce dry mass (DM) at different growth seasons of 2022−2023 (Summer 2022, Winter 2022, and Spring 2023). Data represents ± SE (n = 12). Different letters indicate significant differences at p < 0.05.
Stomatal conductance, transpiration, and Tleaf
-
The results showed the lettuce's sensitivity to the ionic environment of the nutrient solution, as seen by the fluctuation of gs with different EC levels (Fig. 3). In the summer, gs at EC 0.5 was more than double (around 134% greater) than at EC 2.0. Similarly, EC 1.0 and 4.0 had 36% and 4% lower gs than EC 2.0, respectively. A similar pattern was observed during the spring season. However, winter displayed a distinct trend in which gs at EC 0.5, 1.0, and 4.0 fell by 11%, 10%, and 15%, respectively, compared to EC 2.0. Throughout the summer, E in lettuce was tested at different EC values (Fig. 4). The E at EC 0.5 was approximately 3.96, indicating a faster rate of water loss than at EC 2.0. This represents an increase of around 78.2% above the E at EC 2.0. Moving to EC 1.0, the E reduced dramatically to around 2.82, a 20.1% decrease from EC 2.0. Furthermore, at EC 4.0, the E ascended somewhat to around 2.32, but it remained approximately 4.4% lower than at EC 2.0. Overall, the E decreased significantly as electrical conductivity increased, with reductions of 43.7% and 17.2% at EC 0.5 and EC 1.0, respectively, when compared to the conventional EC 2.0. A comparable circumstance was observed with the E in lettuce produced in April. In the winter, greater EC levels resulted in steady increases in E. Unlike in summer and spring, where greater EC levels lowered transpiration, higher EC levels (2.0 and 4.0) corresponded to higher E in winter (Fig. 4). During the summer, Tleaf increased as EC levels increased (Fig. 5). The temperatures at EC 0.5 and EC 1.0 were 9.9% and 2.2% lower than the EC 2.0, respectively. On the other hand, Tleaf was 3.3% higher at EC 4.0 than at EC 2.0. The study found that EC levels in a hydroponic system have a considerable impact on lettuce physiological responses, with different seasonal fluctuations affecting these parameters.
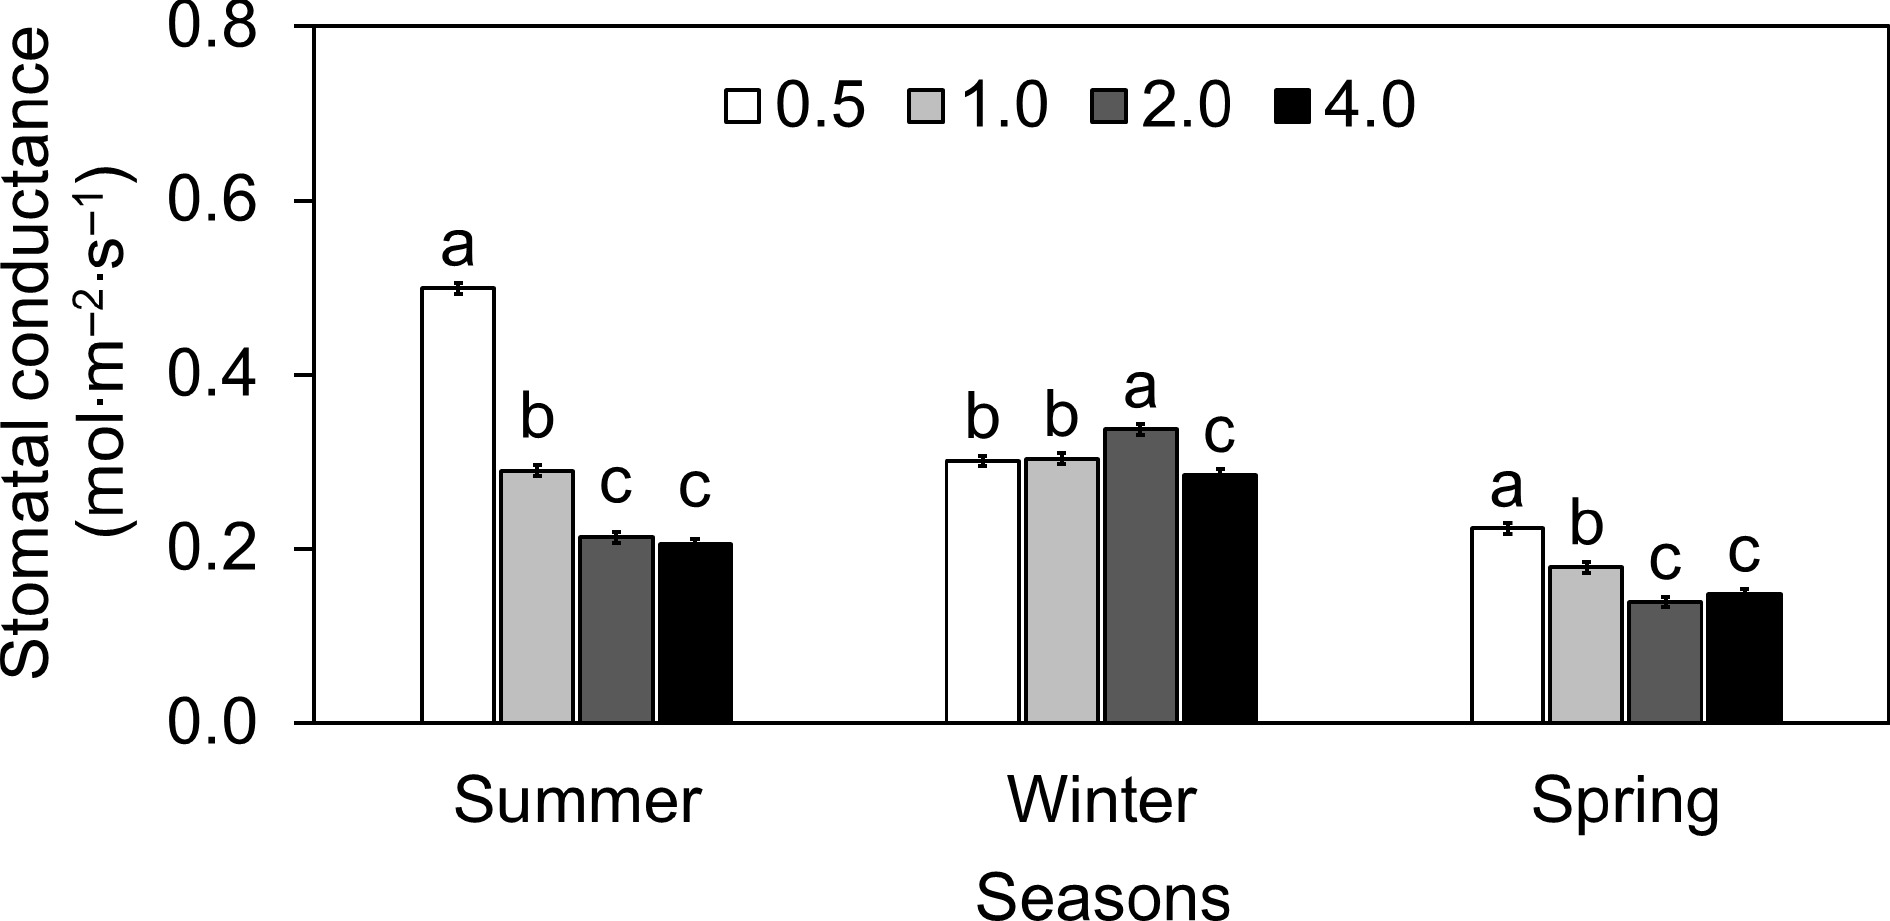
Figure 3.
Effect of different electrical conductivity (EC) treatments (0.5 mS·cm−1, 1.0 mS·cm−1, 2.0 mS·cm−1, and 4.0 mS·cm−1) on lettuce stomatal conductance (gs) at different growth seasons of 2022−2023 (Summer 2022, Winter 2022, and Spring 2023). Data represents ± SE (n = 12). Different letters indicate significant differences at p < 0.05.
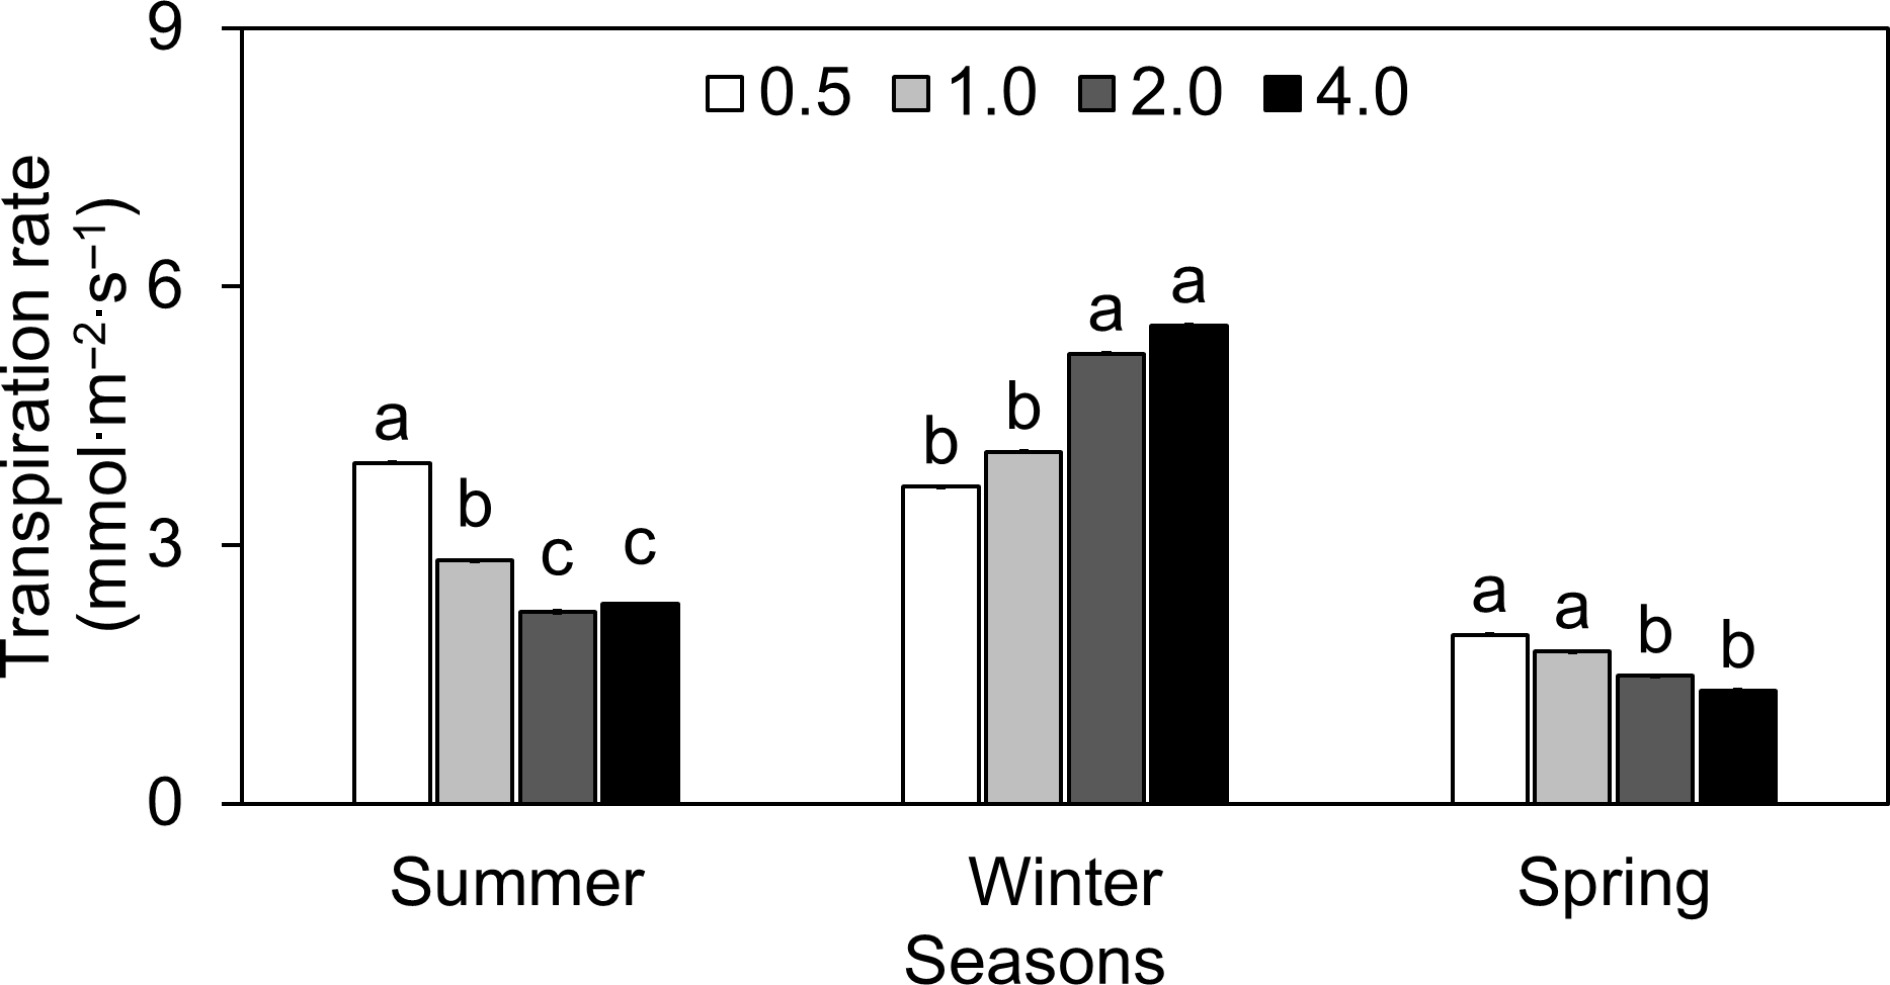
Figure 4.
Effect of different electrical conductivity (EC) treatments (0.5 mS·cm−1, 1.0 mS·cm−1, 2.0 mS·cm−1, and 4.0 mS·cm−1) on lettuce transpiration rate (E) at different growth seasons of 2022−2023 (Summer 2022, Winter 2022, and Spring 2023). Data represents ± SE (n = 12). Different letters indicate significant differences at p < 0.05.
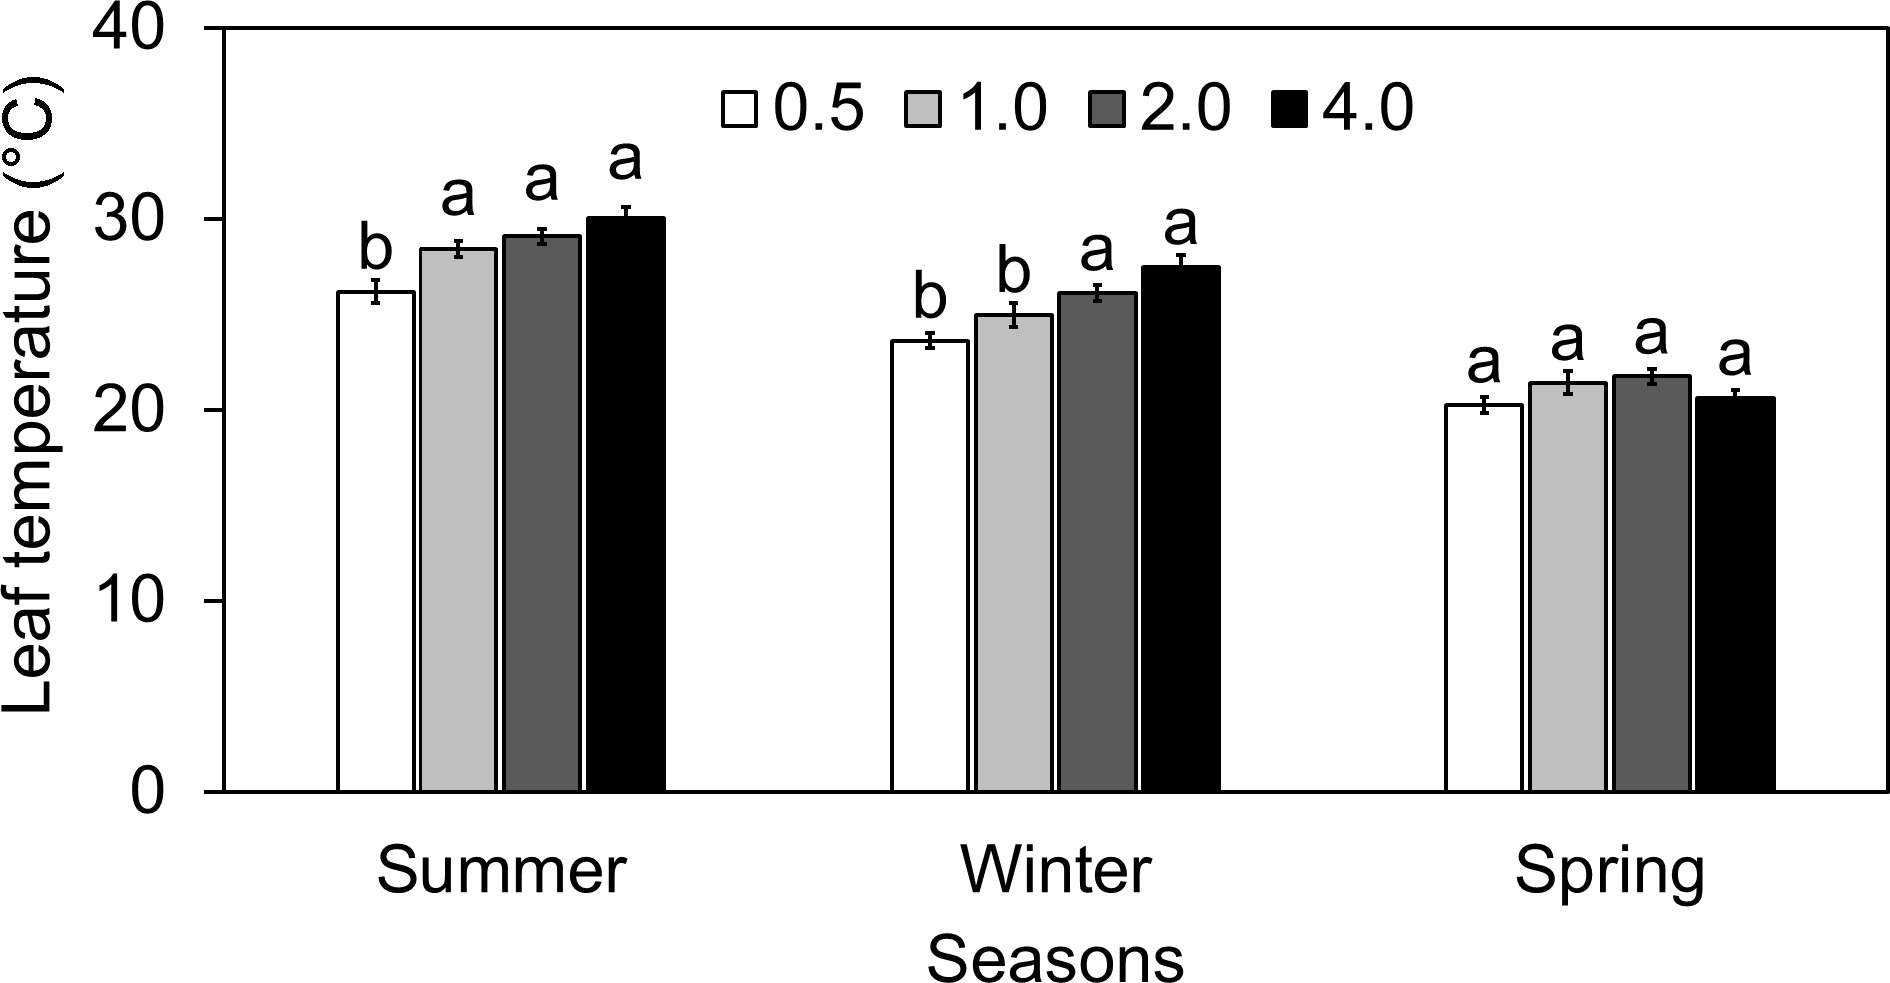
Figure 5.
Effect of different electrical conductivity (EC) treatments (0.5 mS·cm−1, 1.0 mS·cm−1, 2.0 mS·cm−1, and 4.0 mS·cm−1) on lettuce leaf temperature (Tleaf) at different growth seasons of 2022−2023 (Summer 2022, Winter 2022, and Spring 2023). Data represents ± SE (n = 12). Different letters indicate significant differences at p < 0.05.
Chlorophyll fluorescence
-
Across the studied chlorophyll fluorescence parameters, lettuce's response to different EC levels revealed a complex association influenced by seasonal variations (Table 2). During the summer, steady-state fluorescence (Fs) at EC 0.5 decreased by 36.63% compared to the ideal EC 2.0, but EC 4.0 increased by 2.07%. The maximum fluorescence in the light-adapted state (Fm') followed a similar trend, with a reduction of 32.14% at EC 0.5 and 19.61% at EC 4.0. Photosystem II (PhiPS2) quantum yield decreased by 7.94% and 19.05% at EC 0.5 and 4.0, respectively, demonstrating decreasing photosynthetic efficiency outside of the ideal EC ranges. The electron transport rate (ETR) was also affected, with EC 0.5 demonstrating a reduction of 37.41% and EC 4.0 indicating a decrease of 12.78%. In winter, Fs values were less affected by EC variations, with a 13.84 percent decline at EC 0.5 and a 7.81% increase at EC 4.0. Fm' values varied slightly throughout EC levels, with EC 4.0 indicating a minor reduction of 2.08%. PhiPS2 exhibited an unusual pattern, increasing 9.09% at EC 0.5 and decreasing by 5.45% at EC 4.0. ETR exhibited a more pronounced response to EC levels, reducing by 9.70% at EC 0.5 and increasing by 20.95% at EC 4.0, indicating that increased EC may be beneficial to the electron transport chain during the colder months. In the winter, Fs values were less impacted by EC variations, with a 13.84% decline at EC 0.5 and a 7.81% increase at EC 4.0. Fm' values varied slightly throughout EC levels, with EC 4.0 indicating a small drop of 2.08%. PhiPS2 exhibited an unusual pattern, increasing 9.09% at EC 0.5 and reducing by 5.45% at EC 4.0. ETR showed a more pronounced response to EC levels, reducing by 9.70% at EC 0.5 and increasing by 20.95 % at EC 4.0, indicating that increased EC may be useful to the electron transport chain during the colder months.
Table 2. The chlorophyll fluorescence response of lettuce under different electrical conductivity (EC) treatments (0.5 mS·cm−1, 1.0 mS·cm−1, 2.0 mS·cm−1, and 4.0 mS·cm−1) at different growth seasons of 2022−2023 (Summer 2022, Winter 2022, and Spring 2023).
Season (S) Treatment (T) T*S 0.5 1.0 2.0 4.0 Fs Summer ** *** 82.27 ± 6.43e 132.48 ± 13.18b 130.6 ± 11.65b 133.35 ± 13.88b Winter * 148.6 ± 7.01b 160.85 ± 8.6a 161.43 ± 9.12a 174.39 ± 17.43a Spring ** 101.55 ± 3.14d 112.17 ± 1.48c 102.96 ± 4.36d 114.37 ± 2.18c Fm' Summer * ** 249.13 ± 35.03d 353.17 ± 19.64c 367.57 ± 11.27c 295.42 ± 27.26d Winter * 375.98 ± 13.59bc 403.11 ± 39.16a 370.49 ± 17.93c 362.78 ± 23.01bc Spring ** 405.95 ± 8.56ab 426.41 ± 8.54a 431.55 ± 7.55a 405.23 ± 8.01ab PhiPS2 Summer * * 0.58 ± 0.05b 0.6 ± 0.04b 0.63 ± 0.03b 0.51 ± 0.04d Winter * 0.6 ± 0.01b 0.57 ± 0.03bc 0.55 ± 0.02c 0.52 ± 0.02d Spring NS 0.74 ± 0.01a 0.73 ± 0.01a 0.76 ± 0.01a 0.71 ± 0.01a ETR Summer * ** 89.92 ± 15.53a 130.49 ± 19.13b 143.75 ± 24.21b 125.33 ± 24.51bc Winter ** 126.81 ± 6.14c 139.02 ± 8.99b 140.45 ± 6.71b 169.95 ± 10.22a Spring ** 48.14 ± 1.66e 59.03 ± 2.32d 22.55 ± 2.41f 53.72 ± 5.86d The values represent Mean ± SE (n = 12). NS, *, **, *** indicate non-significant or significant at p < 0.05, 0.01, 0.001, respectively. Different superscript letters indicate significant treatment effects of different EC treatments throughout the different seasons using Tukey HSD at p < 0.05. Fs = Steady state fluorescence; Fm'= light-adapted maximal fluorescence; PhiPS2 = quantum yield of photosystem II calculated using fluorescence; and ETR (μmol·s−1) = electron transport rate. Based on the bubble plot, EC 4.0 was the least effective for gs and Tleaf during the summer and most advantageous for electron transfer rate (ETR) with scores of 6 and 12, respectively (Fig. 6). In winter, the highest scores in FM and DM were observed at an EC of 0.5. In the spring, EC 2.0 was the highest across multiple traits, including FM and DM. The EC 4.0 reduced Tleaf, whereas the lowest EC 0.5 was less preferable for gs and E (Fig. 6).
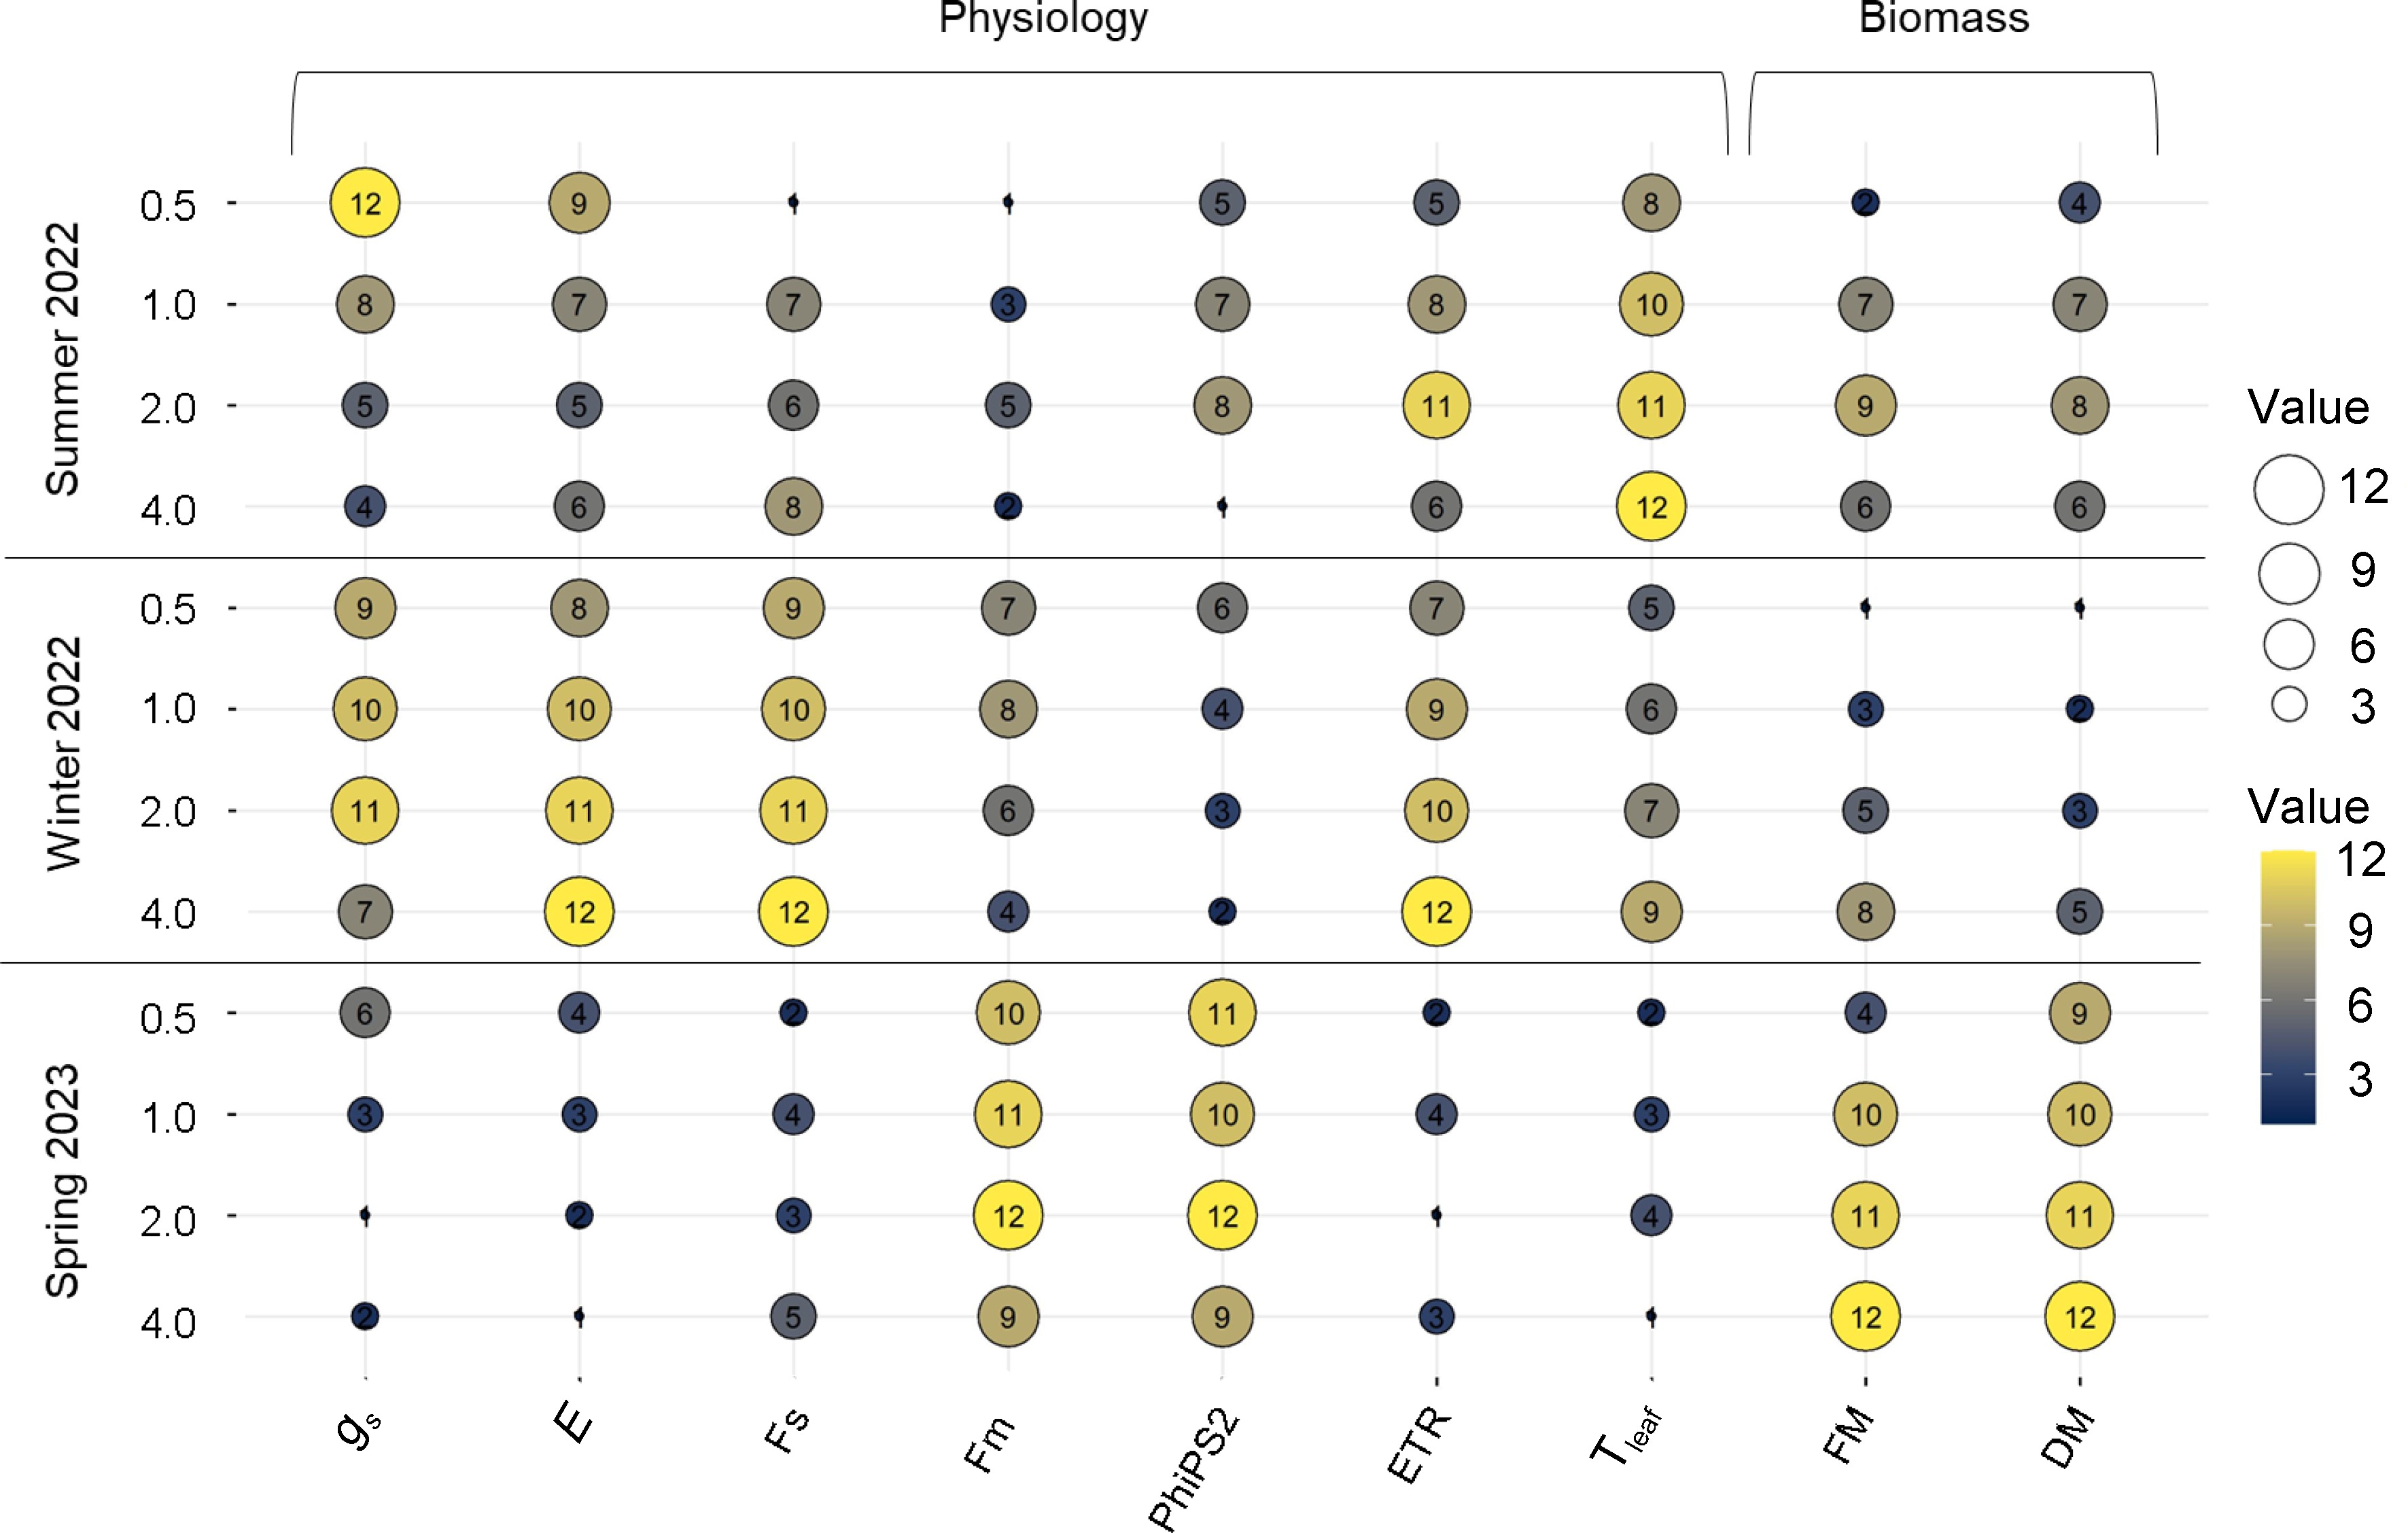
Figure 6.
Bubble plot showing the ranking based on the average values for physiology (gs, E, Fs. Fm', PhiPS2, ETR, and Tleaf) and biomass (fresh and dry mass) of lettuce subjected to different electrical conductivity (EC) treatments (0.5 mS·cm−1, 1.0 mS·cm−1, 2.0 mS·cm−1, and 4.0 mS·cm−1) at different growth seasons of 2022−2023 (Summer 2022, Winter 2022, and Spring 2023). The traits with a largest bubble size (yellow color) indicates the higher values of that traits and smallest bubble size 1 (dark blue color) indicates the lowest values of that traits for a particular EC at a specific growing season.
-
Electrical conductivity (EC) is a critical factor in hydroponic agriculture, impacting nutrient availability and osmotic pressure, which in turn influences plant growth and development. In hydroponic systems, managing EC is vital to ensure that plants receive the optimal concentration of nutrients for healthy growth[21]. The main aim of the study was to better understand how lettuce, particularly the 'Cegolaine Bibb' type, adapts to changes in EC grown in a hydroponic NFT system during the summer, winter, and spring. With an emphasis on the physiological and morphological aspects, the current study sought to understand the relationship between EC and crucial parameters like gs, E, Tleaf, and plant biomass. The study also aimed to offer a thorough understanding of lettuce's adaptive mechanisms under varying EC conditions by investigating these responses at times.
The study investigated lettuce's physiological and morphological responses to changing EC levels throughout the summer, winter, and spring. It specifically investigated characteristics such as stomatal conductance (gs), transpiration (E), leaf temperature (Tleaf), and plant biomass, which are crucial for understanding plant adaptations to environmental changes[22,23]. The study found that increased EC levels generally correlated with higher fresh mass (FM) and dry mass (DM), suggesting improved nutrient uptake efficiency[24]. However, the impact of EC on growth varied with seasonal changes. During winter, lettuce showed increased FM at higher EC levels, possibly due to better nutrient uptake, while lower EC levels were associated with decreased FM, likely due to reduced osmotic stress[11,12]. Interestingly, the study revealed that lower EC levels (0.8−1.2 mS·cm−1), indicative of lower salt concentrations, benefited lettuce growth by reducing osmotic stress. However, very low EC levels (below 0.8 mS·cm−1) suggested insufficient nutrition, leading to poor biomass, aligning with findings from Ding et al.[12]. This pattern indicates that spring conditions allow for better tolerance to higher EC levels, possibly due to a combination of favorable temperatures and light intensities that support robust growth even at higher salinity levels.
In contrast, the current research showed higher gs for ECs below 1.0, despite their lower biomass for summer and spring-grown lettuce. This physiological state indicated a more open stomatal aperture for gas exchange, possibly with higher E or more considerable water loss[22,25]. However, when EC treatment increased (1.0 mS·cm−1, 2.0 mS·cm−1, and 4.0 mS·cm−1), gs reduced significantly, indicating a potential plant regulatory response to increasing salt concentrations in the growing medium[12]. This reduction in gs could potentially be an adaptation strategy to conserve water and reduce the likely impacts of increased salinity without losing biomass in summer and spring[22,26]. On the contrary, there appears to be a variable response in gs to varied electrical conductivity EC treatment during winter. The pattern varies from earlier interpretations in that higher EC treatment (2.0 mS·cm−1) indicated greater gs than lower EC levels (0.5 mS·cm−1 and 1.0 mS·cm−1). These variations in gs in response to variable EC during different seasons can be attributed to a combination of factors. For instance, during winter, lower light levels and cooler temperatures can lead to increased gs followed by increased E at higher EC to maximize the limited photosynthesis[27]. Therefore, even at greater EC levels, plants might not need to cover their stomata as firmly as they would in the summer or spring. More water vapor can escape through the wider open stomata, which may increase E[28]. Conversely, the higher light intensity and temperatures during summer and spring may result in reduced gs and E at high EC to minimize water loss and prevent osmotic stress[29]. Fluorescence indicators such as Fs and Fm', as well as the calculated PhiPS2 and ETR, act as indicators of the photosynthesis rate of plants. In the present study, these parameters have provided insights into how EC levels influence the photosynthetic apparatus and electron transport chain of lettuce, which in turn affects growth rates and biomass accumulation (Table 1 & Fig. 1).
During the summer, lettuce Tleaf fluctuated across different EC treatments compared to EC 2.0, exhibiting distinct patterns. The Tleaf was reduced by about 10% at EC 0.5 compared to the normal EC 2.0. This decrease in the Tleaf could be correlated with the previously noted higher Es at this EC level. Increased transpiration can lead to increased evaporative cooling on the leaf surface, thereby reducing Tleaf[11,29,30]. Conversely, at EC 1.0 and EC 4.0, there were marginal increases in Tleaf, rising by approximately 2.3% and 3.4%, respectively, compared to EC 2.0. These modest elevations in temperature imply that moderate to higher salinity levels correspond to slightly warmer Tleafs during the summer[31]. The spring season revealed the least variance in Fs values, showing a consistent capability for light absorption across EC levels. Fm' values remained relatively high, barely declining by 6.08% at EC 4.0. The greatest PhiPS2 values were found at EC 2.0, indicating that this level of photosynthetic efficiency is optimal. However, ETR increased significantly by 111.26% at EC 0.5 and 137.76% at EC 4.0, indicating an improved rate of photosynthetic electron transport or required additional examination to validate the seasonal response. Overall, while variations were observed across EC levels, the changes in Tleafs remained relatively subtle, suggesting a moderate influence of EC on Tleaf regulation in lettuce during summer. In brief, the seasonal variation and differential impact of temperature in plant responses may be the major factors impacting the differences in the physiological activity.
-
Overall, the present findings suggest that optimizing EC levels in hydroponic lettuce growing is crucial and season-specific. Higher EC treatment was related to lower gs and Fs in lettuce during the summer and spring, indicating adaptive responses to salt stress. Conversely, lettuce during the winter demonstrated contrasting responses, with greater EC levels exhibiting increased gs and E. During the summer, Tleafs were reasonably steady despite EC changes, showing that EC had a minor influence on temperature control. Furthermore, a consistent trend emerges wherein higher EC levels correspond to increased fresh mass in certain seasons, highlighting the potential for enhanced lettuce growth with increasing electrical conductivity levels. Besides, during the summer, high EC levels improve Tleaf tolerance, whereas moderate EC promotes growth, as evidenced by fresh and dry mass measurements. Winter's lower EC promotes biomass accumulation, but high EC boosts the electron transport rate, which is essential for photosynthesis. In the spring, a moderate EC level is optimal for development, combining physiological demands with environmental influences. These results offer hydroponic growers practical recommendations that ensure better resource use efficiency and contribute to more sustainable and productive hydroponic practices. Growers can increase lettuce output by optimizing fertilizer supply and modifying EC levels based on seasonal conditions throughout the year. For example, maintaining higher EC levels during the summer can boost growth, while moderating EC levels during winter can prevent osmotic stress and promote steady biomass accumulation.
-
The authors confirm contribution to the paper as follows: data curation, writing – review & editing: Adhikari B, Olorunwa OJ; formal analysis: Adhikari B, Barickman TC; investigation, methodology, writing – original draft: Adhikari B; conceptualization, funding acquisition, resources, supervision, writing – review & editing: Wilson J, Barickman TC; software, visualization: Barickman TC. All authors reviewed the results and approved the final version of the manuscript.
-
The datasets generated during and/or analyzed during the current study are available from the corresponding author on reasonable request.
This research was supported by a USDA-MS Specialty Crop Block Grant and by the USDA364 NIFA Hatch Project under accession number 149210. We thank Thomas E. Horgan for his support during experimental setup and data collection.
-
The authors declare that they have no conflict of interest. T. Casey Barickman is the Editorial Board member of Technology in Horticulture who was blinded from reviewing or making decisions on the manuscript. The article was subject to the journal's standard procedures, with peer-review handled independently of this Editorial Board member and the research groups.
- Copyright: © 2024 by the author(s). Published by Maximum Academic Press, Fayetteville, GA. This article is an open access article distributed under Creative Commons Attribution License (CC BY 4.0), visit https://creativecommons.org/licenses/by/4.0/.
-
About this article
Cite this article
Adhikari B, Olorunwa OJ, Wilson JC, Barickman TC. 2024. Seasonal dynamics of lettuce growth on different electrical conductivity under a nutrient film technique hydroponic system. Technology in Horticulture 4: e018 doi: 10.48130/tihort-0024-0015 

Seasonal dynamics of lettuce growth on different electrical conductivity under a nutrient film technique hydroponic system
- Received: 21 February 2024
- Revised: 19 July 2024
- Accepted: 29 July 2024
- Published online: 16 August 2024
Abstract: Lettuce, a staple in worldwide agriculture, has gained widespread acclaim for its adaptability and growing efficiency in hydroponic systems, demonstrating rapid growth cycles and economic significance. Electrical conductivity impacts the growth and physiology of lettuce cultivated under hydroponics. Maintaining the appropriate EC level during the lettuce growth cycle is critical for optimizing hydroponics practices. The greenhouse experiment examined the response of the 'Cegolaine Bibb' lettuce variety in a nutrient film technique hydroponic system throughout three seasons (summer, winter, and spring). The findings revealed significant physiological responses to varying EC levels. Stomatal conductance (gs) consistently decreased with rising EC in lettuce grown in summer and spring, indicating plant adaptive mechanisms to varying EC levels. Contrarily, lettuce during winter showed an unexpected increase in gs with greater EC, implying a unique seasonal adaptation. Steady-state fluorescence followed a similar pattern, declining with increasing EC in summer and spring but improving in winter. Furthermore, leaf temperature fluctuations across EC levels remained moderate throughout the summer, indicating minimal influences on lettuce temperature regulation. Morphological features, particularly fresh mass (FM), demonstrated a consistent pattern of increased production with higher EC levels in winter and spring. In contrast, lower EC levels were related to decreased FM for all seasons. Overall, the study emphasizes the dynamic interrelationships of EC levels and seasonal fluctuations influencing lettuce physiology and morphology. These findings highlight the importance of considering these aspects when optimizing hydroponic environments for increased lettuce growth and yield across seasons.
-
Key words:
- Physiology /
- Morphology /
- Cegolaine Bibb /
- Stomatal conductance /
- Leaf temperature